Next Article in Journal
Dynamic Behavior of Dilute Bentonite Suspensions under Different Chemical Conditions Studied via Magnetic Resonance Imaging Velocimetry
Next Article in Special Issue
Addendum: Taylor, S.E., et al. Metal Ion Interactions with Crude Oil Components: Specificity of Ca2+ Binding to Naphthenic Acid at an Oil/Water Interface. Colloids Interfaces 2018, 2, 40.
Previous Article in Journal
Molecular Dynamics Simulation of Protein Biosurfactants
Previous Article in Special Issue
Static and Dynamic Performance of Wet Foam and Polymer-Enhanced Foam in the Presence of Heavy Oil
 
 
Addendum published on 6 November 2018, see Colloids Interfaces 2018, 2(4), 54.
Article

Metal Ion Interactions with Crude Oil Components: Specificity of Ca2+ Binding to Naphthenic Acid at an Oil/Water Interface

Centre for Petroleum and Surface Chemistry, Department of Chemistry, University of Surrey, Guildford, Surrey GU2 5XH, UK
*
Author to whom correspondence should be addressed.
Colloids Interfaces 2018, 2(3), 40; https://doi.org/10.3390/colloids2030040
Submission received: 17 August 2018 / Revised: 13 September 2018 / Accepted: 14 September 2018 / Published: 18 September 2018
(This article belongs to the Special Issue Colloids and Interfaces in Oil Recovery)

Abstract

:
On the basis of dynamic interfacial tension measurements, Ca2+ has been shown specifically to interact with naphthenic acid (NA) at the n-heptane/water interface, consistent with NA adsorption followed by interfacial complexation and formation of a more ordered interfacial film. Optimum concentrations of Ca2+ and NA have been found to yield lower, time-dependent interfacial tensions, not evident for Mg2+ and Sr2+ or for several alkali metal ions studied. The results reflect the specific hydration and coordination chemistry of Ca2+ seen in biology. Owing to the ubiquitous presence of Ca2+ in oilfield waters, this finding has potential relevance to the surface chemistry underlying crude oil recovery. For example, “locking” acidic components at water/oil interfaces may be important for crude oil emulsion stability, or in bonding bulk oil to mineral surfaces through an aqueous phase, potentially relevant for carbonate reservoirs. The relevance of the present results to low salinity waterflooding as an enhanced crude oil recovery technique is also discussed.

Graphical Abstract

1. Introduction

Carboxylic acids are fundamental to the chemistry of all crude oils [1]. These are oil-soluble compounds with the general formula CnH2n+zO2 containing acyclic (z = 0) and alicyclic (z > 0) hydrocarbyl groups; in crude oils, they are collectively referred to as ‘naphthenic acid’ (NA), since the earliest examples identified contained saturated cyclopentyl and cyclohexyl groups [2,3].
As is the case for other polar species present in petroleum, organic acids are often implicated in various upstream and downstream operational problems. Thus, during crude oil production, the surface activity of NA can lead to alterations in reservoir wettability [4,5] and increased stability of water-in-oil (w/o) emulsions [6]. Additionally, under high pH conditions, ionized acid groups stabilize oil-in-water (o/w) emulsions [7] when dissociation of oil-soluble acids produces anionic surface-active species which strongly affect properties, such as interfacial tension and interfacial rheology [8].
During crude oil refining, the acidity of NA (pKa ~ 5 [9]) is responsible for corrosion in distillation units under the high temperature process conditions. The total acidity of the crude oil depends on its source, and oil-specific measures are often required to reduce potential damage when processing the highest acidity crudes (typically total acid number [TAN] values in excess of approximately 0.8 mg KOH/g) [10]. Naphthenic acids also exhibit specific interactions with calcium in certain oilfields, where Ca2+ coordination leads to precipitation and deposition of naphthenate-rich scale [11]. In this case, the naphthenates are tetrameric species, the original C80-tetra-acid member being identified as C80H142O8, molecular weight 1230 g/mol [12]. Following this discovery, other similar members were identified as being responsible for naphthenate deposits in diverse locations [13,14]. Regarding the formation of these species, two points are noteworthy. First, if the tetra-acids are uncharged, it is likely that interactions must occur at an aqueous/oil interface. Second, from the composition of the deposits, there should be a specific affinity between the organic acid and aqueous Ca2+ ions, given the mixed cation composition of oilfield waters. This is also confirmed using a range of techniques and a synthetic tetra-acid, for which the strongest affinity was found for Ca2+ [15,16].
There is evidence in the literature to show that acidic species contribute to the structure and properties of crude oil–water interfaces [17]. Dissociation of carboxylic acids, for example, explains the pH-dependent behavior of crude oil/water interfaces [18,19] leading to increased o/w emulsion stability at high pH. It is also evident that crude oil/water interfacial properties can be significantly influenced by the presence of divalent metal ions. Thus, Alvarado et al. [20] reported the increased stabilization of water-in-crude oil emulsions in the presence of Ca2+ ions compared with Na+ ions of the same ionic strength, suggesting that stronger interactions occur with Ca2+, although the authors suggested that further investigation is necessary [21].
Carboxylic acid groups at crude oil interfaces have also been implicated in improved recovery mechanisms during low salinity waterflooding (involving the so-called “low salinity effect”, LSE). One popular suggested LSE mechanism starts with the premise that oil is naturally bound to specific reservoir mineral surfaces via divalent metal ion bridging involving oil-based carboxylate groups [22,23,24,25,26,27,28,29,30]. It is considered that reducing the water salinity disrupts the bridges through ion exchange, resulting in reduced oil adhesion, thereby improving oil displacement and recovery.
Other studies into the LSE have suggested that interfacial properties should be sensitive to complexation across oil/water interfaces [31,32]. Indeed, the specificity of interfacial complexation between metal ions and oil-soluble components is important elsewhere in liquid–liquid extraction processes [33]. Early work [34,35,36] identified that interfacial reactions involving metal ions and spread carboxylic acid monolayers at the air-water interface are relatively slow, with half-lives of several minutes. More recently, de Ruiter et al. studied the evolution of the interfacial tension upon placing aqueous solutions of metal ions in contact with a decane solution of stearic acid (HSt) [31]. When the solution pH > pKa, the acidity constant of stearic acid, distinct stages in the formation of metal stearate layers were noted, and interpreted as [31]: (i) deprotonation of adsorbed stearic acid (HSt), forming MSt2 complexes at the interface; (ii) nucleation of the MSt2 complexes, allowing further acid adsorption and complexation; (iii) partitioning of the three-dimensional MSt2 structures into the oil phase.
The present study is concerned with the influence of alkali and alkaline earth metal ions (as the respective chloride salts) on oil/water interfaces containing a commercial (technical-grade) sample of NA. Previous work by Brandal et al. investigated the effects of divalent metal ions (Mg2+, Ca2+, Sr2+ and Ba2+) on the interfacial tension behavior of different carboxylic acids under pH conditions where the acids were completely ionized [32]. However, we were keen to explore interactions between aqueous metal ions and the oil-soluble NA, initially in its unionized form as would be present in a native crude oil.

2. Experimental

2.1. Materials

Organic solvents (ethanol and n-heptane, both >98% purity) and the reagents naphthenic acid (technical grade), calcium chloride dihydrate (CaCl2·2H2O), strontium chloride hexahydrate (SrCl2·6H2O), magnesium chloride hexahydrate (MgCl2·6H2O), sodium chloride (NaCl), potassium chloride (KCl), lithium chloride (LiCl), cesium chloride (CsCl), potassium hydroxide (KOH), calcium acetate (Ca(OAc)2·xH2O) were purchased from Sigma-Aldrich Co. Ltd. (Gillingham, Dorset, UK) and apart from n-heptane were used without further purification. The latter was passed through an alumina column to remove any surface-active impurities before use.
According to the supplier, the commercial naphthenic acid is a technical mixture of alkylated cyclopentane carboxylic acids, with a total acid number (TAN) value of 230.5 mg KOH/g, which equates to an average molecular mass of 56/0.2305 = 243 g/mol with the reasonable assumption that the mixture only contains monoprotic acids. However, consistent with our own analysis, Hindle et al. reported that this product contains a high proportion of saturated fatty acids, with relatively low levels of true naphthenic components [37]. Notwithstanding the relatively low content of authentic naphthenic structures, its composition does provide a representative range of carbon chain lengths to investigate interactions which mainly involve the carboxylic acid function of crude oils.
Deionized water (resistivity = 18.2 MΩ·cm) was from a Millipore Direct-Q system, with a pH of ~5.6 at room temperature (21 °C).

2.2. Methods

2.2.1. Synthesis of Calcium Naphthenate

Calcium naphthenate was synthesized based on a method used by Pereira et al. to prepare calcium salts of long-chain carboxylates [38]. Thus, KOH (0.752 g, 13.0 mmol) was dissolved in ethanol (20 mL) and heated gently on a hot-plate until boiling. NA (3.270 g, ~3.3 mmol based on the above TAN value) was then added and boiling maintained. Separately, Ca(OAc)2·xH2O (1.062 g, ~6.5 mmol) was dissolved in the minimum quantity of water with sonication, after which this solution was carefully added dropwise to the boiling ethanolic KOH/NA. The resultant mixture was then allowed to cool and evaporate, whereupon an amber-colored gel separated, together with residual water (~2 mL). The water was decanted, and the gel product was washed with an approximately equal volume of deionized water, heated to 80 °C, and then allowed to cool. Again, the residual water was decanted. This washing process was repeated one further time. The drained product was then stirred with petroleum ether (40–60 °C boiling range) until dissolved (~40 mL required). This solution was filtered (Whatman #1 filter paper), which also served to remove residual water from the resultant clear amber filtrate. Solvent evaporation yielded viscous product (3.079 g, 87%). The stoichiometry of the product was determined by thermogravimetric analysis (TA Instruments TGA Q500 thermogravimetric analyzer, Elstree, Hertfordshire, UK). The sample was heated from ambient temperature to 900 °C at 10 °C/min in air to yield a residue (calcium oxide) corresponding to 7.14% Ca. Using the average NA molecular mass of 243 calculated above, the product has a composition consistent with the expected 1:2 Ca:NA stoichiometry. Figure 1 shows a comparison of the infrared spectra (Bruker Alpha spectrometer with Diamond ATR (Bruker UK Ltd., Coventry, UK), each sample applied in neat form) for the original naphthenic acid and its calcium salt, from which the shift of the carbonyl band from 1700 to 1543 cm−1 is characteristic of neutralized carboxylic acids [39,40]. The small band at 1709 cm−1 in the calcium naphthenate spectrum indicates a trace amount of unreacted naphthenic acid remains in the product. Loss of bands at 1265 and 943 cm−1 are also consistent with calcium salt formation [40].

2.2.2. Dynamic Interfacial Tension Measurements

The dynamic tension of water/n-heptane interfaces was determined using an in-house dynamic drop volume (DDV) method. The general basis of this approach has been detailed by van Hunsel and Joos [41] and is similar to the method used by Deshiikan et al. [42]. Briefly, aqueous drops are formed at the tip of a capillary using different (known) flow rates, f, and the corresponding drop formation times, td, measured. By knowing f and td allows corresponding drop volumes to be determined under dynamic conditions. From a comparison with the Ward-Tordai equation, the adsorption time is ~3/7td [43]. Strictly, drop volume (or weight) methods are used to determine equilibrium surface or interfacial tension for drops formed infinitely slowly, because at finite rates of drop formation hydrodynamic effects cause excess liquid to be incorporated into the detaching drop [41]. However, under dynamic conditions, the drop volume, V(td), is related to the drop formation time by the empirical relationship attributed to McGee (see ref. [41]):
V ( t d ) = V 0 + S t d 0.75
in which V0 is the drop volume at an infinitely slow formation time and S is the so-called McGee slope [41]. The latter is determined by measuring drop volumes at different flow rates for a series of pure liquids, under conditions of constant interfacial tension. Surface or interfacial tensions are then obtained using the established static pendant drop volume relationship:
γ = V 0 Δ ρ g 2 π r F
in which r is the external tip radius, Δρ the density difference between the two phases, and F is a correction factor accounting for drop shape which was determined and tabulated as a function of r/V01/3 by Harkins and Brown [44] and extended by Wilkinson [45]. The more recent polynomial developed by Lee et al. [46] shown in Equation (3), which correlates F with r/V01/3 within the range 0 ≥ r/V01/3 ≥ 1.2, was used in the present analysis.
F = 1 − 0.9121(r/V01/3) − 2.109(r/V01/3)2 + 13.38(r/V01/3)3 − 27.29(r/V01/3)4 + 27.53(r/V01/3)5
13.58(r/V01/3)6 + 2.593(r/V01/3)7
By using pure low viscosity liquids of constant surface tension over the range of drop formation times, hydrodynamic contributions to drop formation are effectively eliminated, which allows the relationship between the McGee slope and V0 to be defined. For our system, we found that the McGee slope is described well by
S = 0.22 V 0
such that for a given drop time, Equation (2) becomes:
γ ( t d ) = V ( t d ) Δ ρ g 2 π r F ( 1 + 0.22 t d 0.75 )
In the present method, water or aqueous salt solution drops were formed below the surface of the n-heptane phase from the tip of a stainless steel syringe needle, the end of which was cleaned and roughened with a fine grade sand paper before each measurement to ensure effective contact of the aqueous phase is made with the outer diameter (3.413 mm). Drop volumes were in the range ~30–120 mm3. The pH of the unadjusted aqueous phases was in the range 5.4–5.7 consistent with Robertson et al. [47]. Drops are then produced at up to ten known rates using a pre-calibrated syringe pump (B. Braun, Melsungen, Germany) at 21 ± 1 °C, and the drop times calculated by averaging the time taken for several drops to be produced. Drop counting was performed visually with an estimated mechanical (stopwatch) response time of ±0.02 s for a single drop; this limits the realistic rate of formation typically to ~1 drop per second.
The procedure also requires the density difference between the liquid phases to be known under the same temperature conditions, and these were determined by pycnometry from the mass of a known volume of the respective liquids. Thus, by measuring td at different flow rates allows the determination of γ(td) as a function of drop time using Equation (5). The combination of interfacial tension, drop volume, needle diameter and density difference translates for most of the measurements into values of the newly proposed Worthington number (Wo = ΔρgVd/2π) in the range ~0.7–0.9, for which a value of unity would be the ideal situation [48]. Additionally, replicate measurements using pure liquids with time-invariant interfacial tension, indicate a standard error of <3% of the quoted values, which is often better than ± 1 mN/m.

3. Results and Discussion

In advance of discussing the results of this study, it is pertinent to consider the ionization behavior of carboxylic acids at oil/water interfaces. Thus, on electrostatic grounds it would be expected that ionization equilibria will be affected by the presence of an interface, which would then be reflected in the relevant dissociation constants. To illustrate this, if the acid dissociation constant of a carboxylic acid in bulk (aqueous) solution is pKa(∞), then the electrostatic image potential Ψ experienced by the acid group at a distance x from the interface is given by [49]:
Ψ ( x ) = C e 2 D w x  
where C = 1/4πε0, e is the electronic charge (1.602 × 10⁻¹⁹ C), ε0 is the permittivity of a vacuum (8.854 × 10⁻¹² F/m), and Dw is the dielectric constant of water (~80).
By further considering the acid-base equilibrium as a function of distance from the interface, Dill and Bromberg [49] showed that the apparent pKa at a distance x from the interface is related to the bulk value by
p K a ( x ) = p K a ( ) 0.4343 e Ψ ( x ) k B T = p K a ( ) + 0.4343 C e 2 2 x D w k B T
in which kB is Boltzmann’s constant (1.381 × 10⁻²³ J/K) and T is the absolute temperature. This simple model suggests that adsorbed acid groups within, say, 0.2–0.5 nm of an oil/water interface, would experience an increase in pKa of 0.3–0.8 units, purely on electrostatic grounds, without introducing specific ionic refinements.
However, by using more sophisticated computational approaches, Andersson et al. found that the pKa of isolated acid molecules at an oil/water interface increased by an average of ~1 unit compared with the aqueous bulk solution value [50]. This reflects the greater affinity of the neutral molecule for the interface. The consequences of molecular confinement, at an interface, for example, were also probed using the same computational methods. In this situation, the possibility of deprotonated carboxylate groups stabilizing neighboring undissociated (neutral) carboxylic acid molecules arises through hydrogen bonding. Thus, the same workers also showed how the pKa shift produced in the first molecule, as described above, is almost exactly compensated by the stabilizing effect induced on the second molecule [50].
Several experimental studies have identified increased pKa values for acid groups present at surfaces and interfaces, including self-assembled monolayers [51], fatty acid micelles [52,53] and, more recently, at the air/water interface for fatty acid monolayers [54], the latter study also identifying the effect of chain length on the magnitude of the pKa change. In the context of the present paper, this will mean that adsorbed NA molecules will remain largely undissociated as the effective (interfacial) pKa is higher than the pH of the aqueous solutions.

3.1. NA Adsorption at the n-Heptane/Water Interface

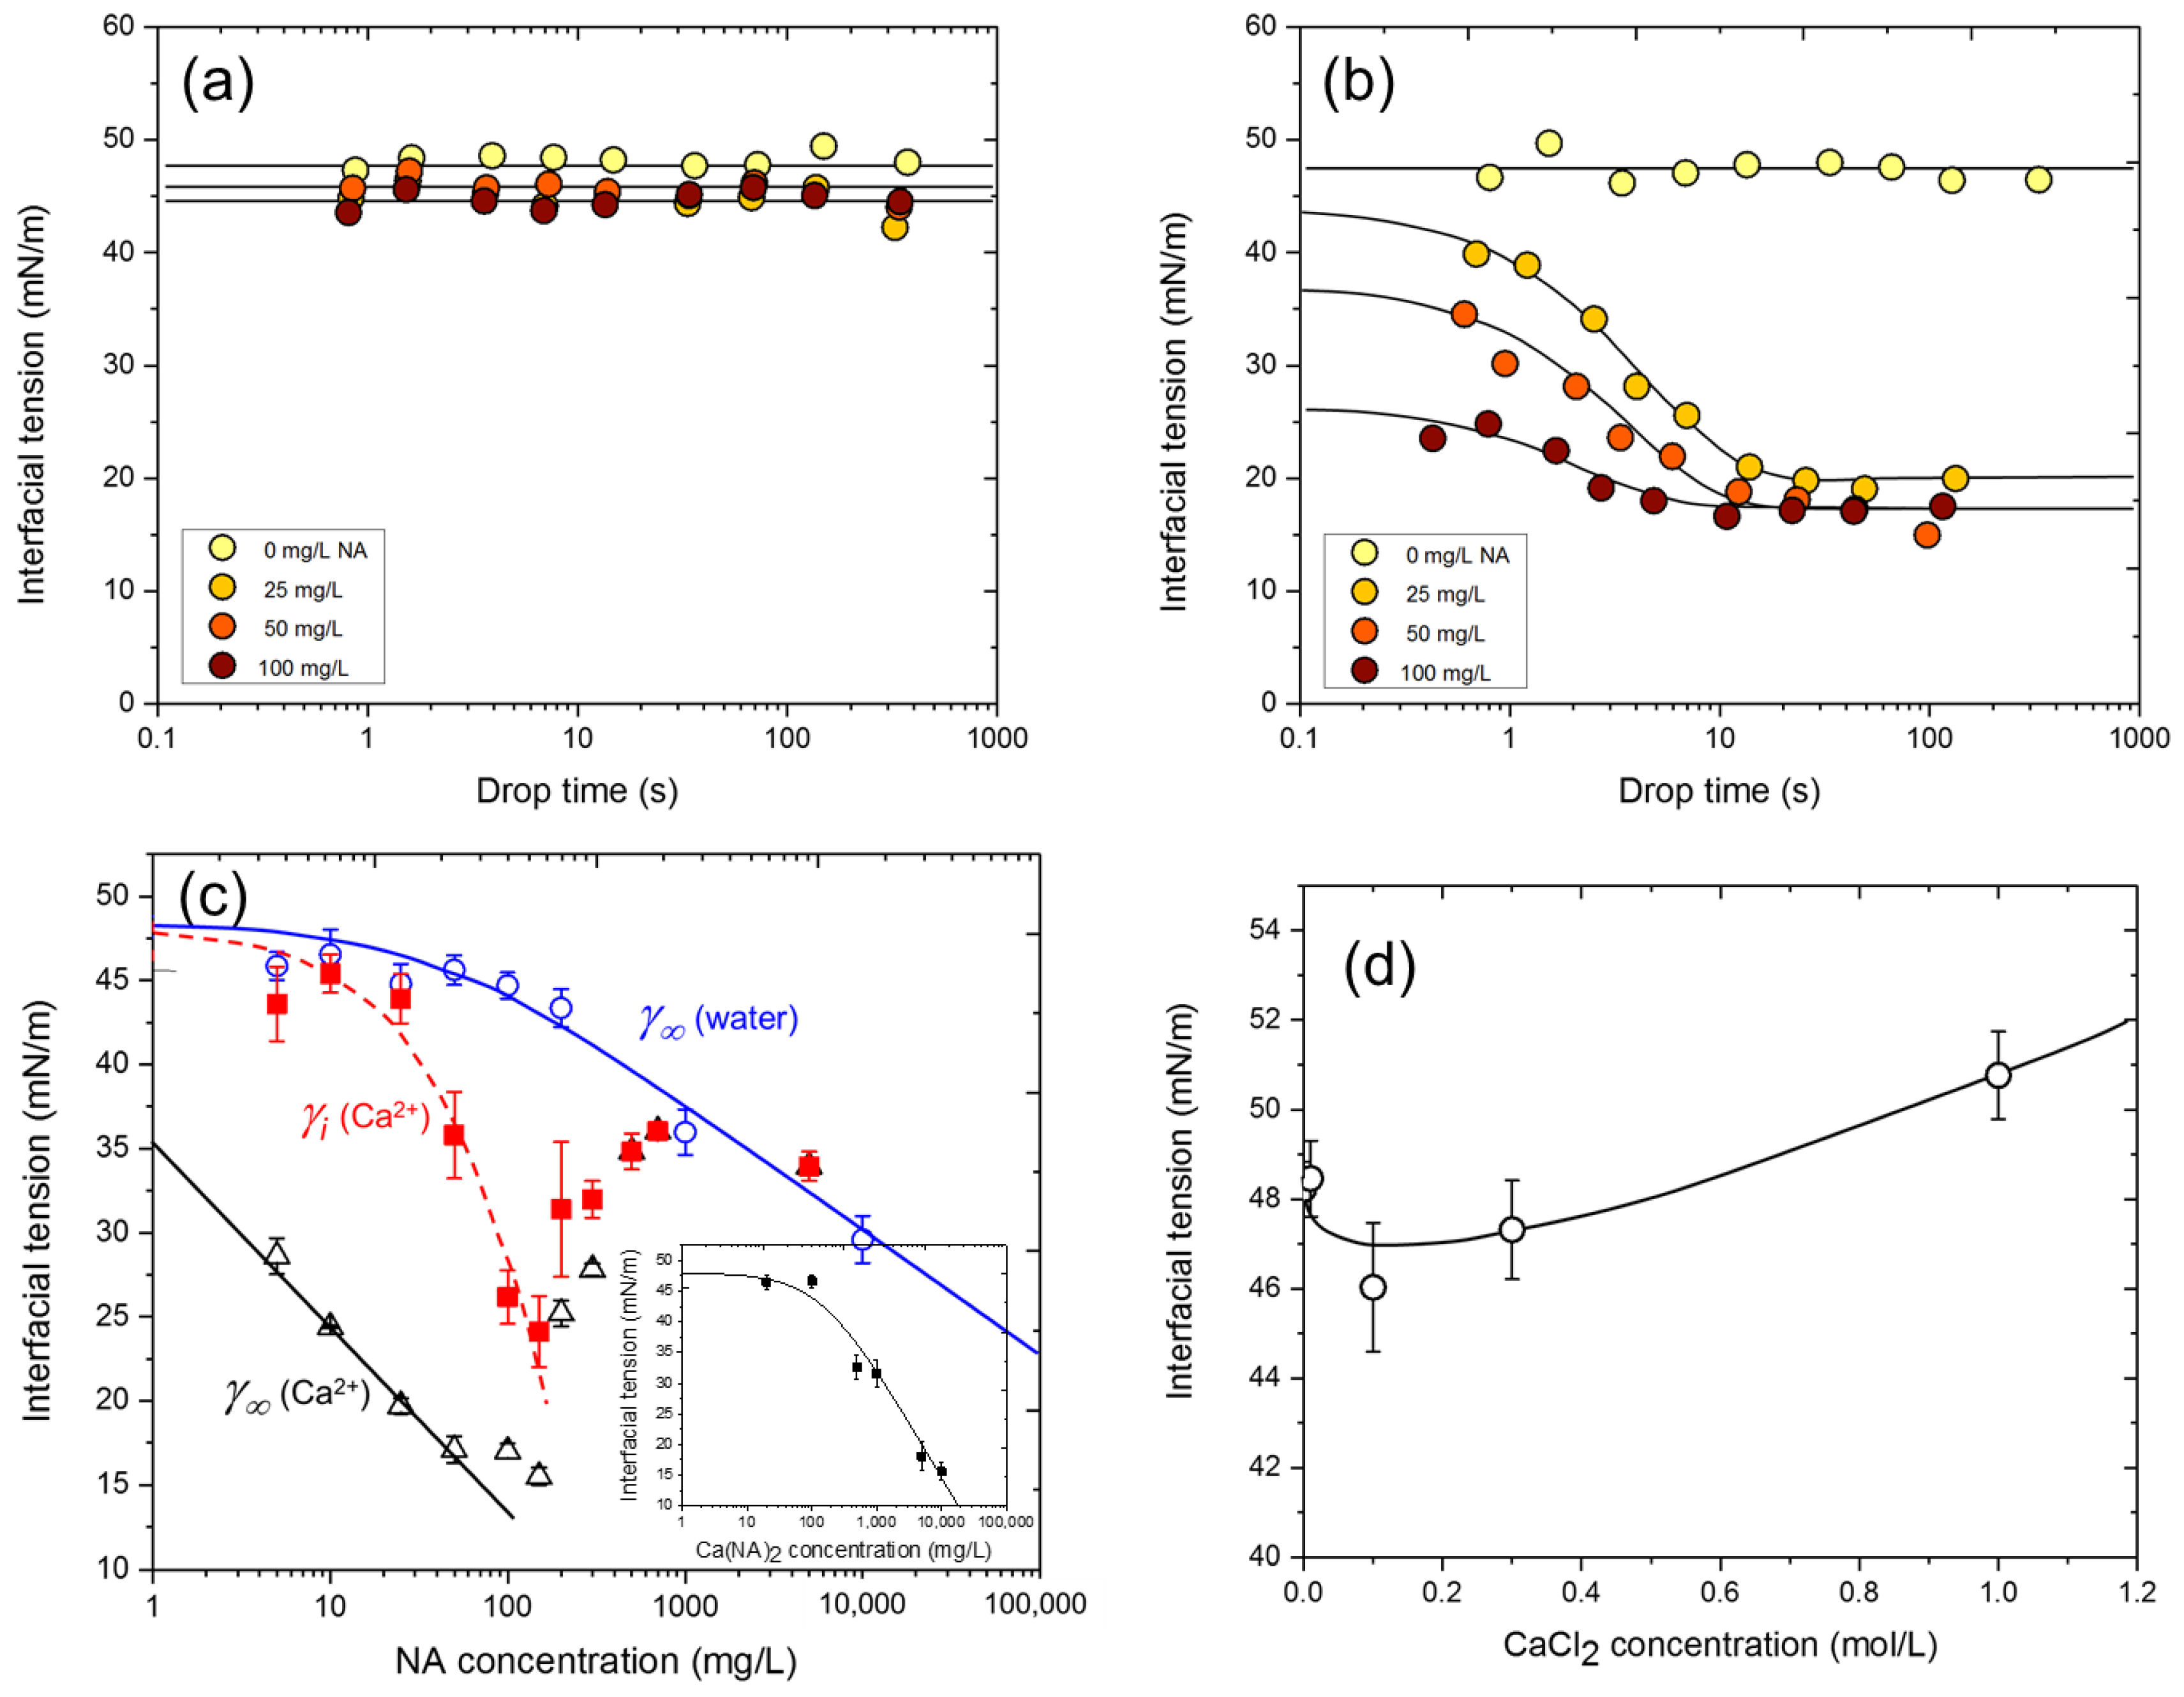
Dynamic drop volume measurements between n-heptane containing NA and deionized water produce constant interfacial tensions over drop formation times in the approximate range ~0.3–500 s as shown in Figure 2a. The time-invariant values seen for different bulk NA concentrations (CNA) are due to the changes in the composition of the n-heptane phase, reducing slightly from the value for the n-heptane/water interface. The results also indicate that adsorption is rapid compared with the experimental timescale, being complete in <0.3 s. Using a microfluidic technique, adsorption at the hydrocarbon/water interface has recently been shown [55] to occur on the millisecond timescale, more rapidly than previously thought.
Compared with the time-invariant interfacial tension behavior seen at the deionized water interface, the presence of 0.3 mol/L Ca2+ is accompanied by the appearance of time-dependent behavior, as shown in Figure 2b for equivalent naphthenic acid concentrations.
These latter profiles suggest that the approach to equilibrium of a growing drop in the presence of Ca2+ occurs in (at least) two stages. The first stage involves a rapid γ decrease, as described above, as the interface re-equilibrates from γ0 ~ 48 mN/m to an “instantaneous” value (within the timescale of the present technique), γi, which, for 5 mg/L ≤ CNA ≤ 200 mg/L and 0.3 mol/L Ca2+, is lower than the corresponding values obtained for the deionized water interface.
However, it is also evident in Figure 2b that within approximately the same CNA range given above, the interfacial tension behavior exhibits a slower second process which finally results in an equilibrium value, γ, i.e., γ0γi, followed by γiγ. The interfacial tension curves for the slower process, as shown in Figure 2b, are satisfactorily represented by first-order kinetic curves constructed according to Equation (8), each of which being characterized by a first-order rate constant, k.
γ = γ + ( γ i γ ) exp ( k t )  
Since γ0 for each Ca2+ solution in the presence of NA is inaccessible using the present technique, we felt that it is reasonable to assume that it will be the same as the time-invariant value for the corresponding n-heptane/0.3 mol/L Ca2+ interface in the absence of NA.
Thus, in Figure 2c are shown plots of γi and γ for a Ca2+ concentration, CCa of 0.3 mol/L as a function of CNA, together with the corresponding γ behavior at the deionized water interface, the latter being in good agreement with data published by Havre et al. [9] for a similar commercial NA sample. It is immediately apparent that the interfacial tension decreases in the presence of 0.3 mol/L Ca2+ in the aqueous phase for ~5 mg/L ≤ CNA ≤ 200 mg/L, and increases once again above this concentration, towards the deionized water isotherm.
In Figure 2c (inset), we also show interfacial tension data for the synthesized calcium salt, Ca(NA)2. In this case, only very small time-dependent effects were observed, the error bars reflecting the spread of results over the timescale of the measurements. However, it is evident that the calcium salt follows the same general behavior as NA, inasmuch as the interfacial tension is largely unaffected up to ~100 mg/L, but thereafter the data diverge.
Within the NA concentration range considered, we find that the interfacial tension-log profiles in Figure 2c are satisfactorily represented by the Szyszkowski equation [56]:
γ = γ 0 R T Γ m ln ( C NA a + 1 )  
where CNA is the bulk NA concentration in the organic phase, Γm is the interfacial concentration of NA at monolayer adsorption (mol/m2) and a is a molecule-dependent constant (expressed as mol/L) related to the Gibbs energy of adsorption (ΔG0) at infinite dilution by [57]:
a = 55.3 exp ( Δ G 0 R T )  
From Table 1 it is apparent that the “instantaneous” interfacial concentration of NA in the presence of Ca2+ is some ten times greater than in its equilibrium concentration. This translates into a much smaller apparent molecular area. The latter dimension is unreasonable, however, and most probably relates to a disordered interfacial accumulation of NA molecules in the initial stages, which would be consistent with the initial rapid response of the interfacial tension. The situation then transforms into a more structured interfacial film characterized by a more realistic molecular area, which is almost identical to the value at the deionized water interface. Moreover, the Gibbs energy of adsorption of NA is ~20 kJ/mol more favorable (i.e., lower) in the presence of Ca2+ ions, which presents an intriguing insight into the role played by Ca2+ ions in facilitating NA adsorption. Interestingly, this value is very close to the Gibbs energy for Ca2+ binding to hydrated carboxylate side chains of the protein β-lactoglobulin (−18 ± 1 kJ/mol) [58]. Whilst the interfacial packing of NA molecules appears to remain the same, the adsorption process itself is significantly more favorable, which suggests some degree of interaction occurs between NA and Ca2+ ions across the interface.
Finally, as a relevant aside, in Figure 2d are shown the effects of CCa on the n-heptane/water interfacial tension in the absence of NA. It is well-known that high electrolyte concentrations generally show an increase in surface and interfacial tension as a consequence of “negative adsorption”. However, relatively low electrolyte concentrations cause a small decrease in tension, a phenomenon known as the Jones-Ray effect, after the first researchers to report it, in 1937 [59]. While the original work focused on electrolyte effects on surface tension, some recent studies have considered the behavior at hydrocarbon/water interfaces [60], including the crude oil/water interface [61], because of their relevance to some of the applications mentioned earlier in the present paper.
In each of these earlier studies, interfacial tension minima have been seen at low CCa, which is also evident in the present results. Thus, Figure 2d shows that the interfacial tension reduction for <0.1 mol/L Ca2+ is ~1.4 mN/m, similar to values obtained elsewhere [60]. Suggested reasons for this effect have been debated, and have included cation [60], anion [62,63,64] or impurity [65] adsorption, or electrostatic effects influencing water structure at the interface [66,67]. The curve fitted through the experimental data in Figure 2d is of the form γ = γ00.5 + , where A and B are empirical constants (0.158 (mN/m)0.5 and 0.217, respectively) and γ0 is the interfacial tension of the n-heptane/water interface (48.4 mN/m).

3.2. NA Adsorption at the n-Heptane/Water Interface in the Presence of Metal Ions

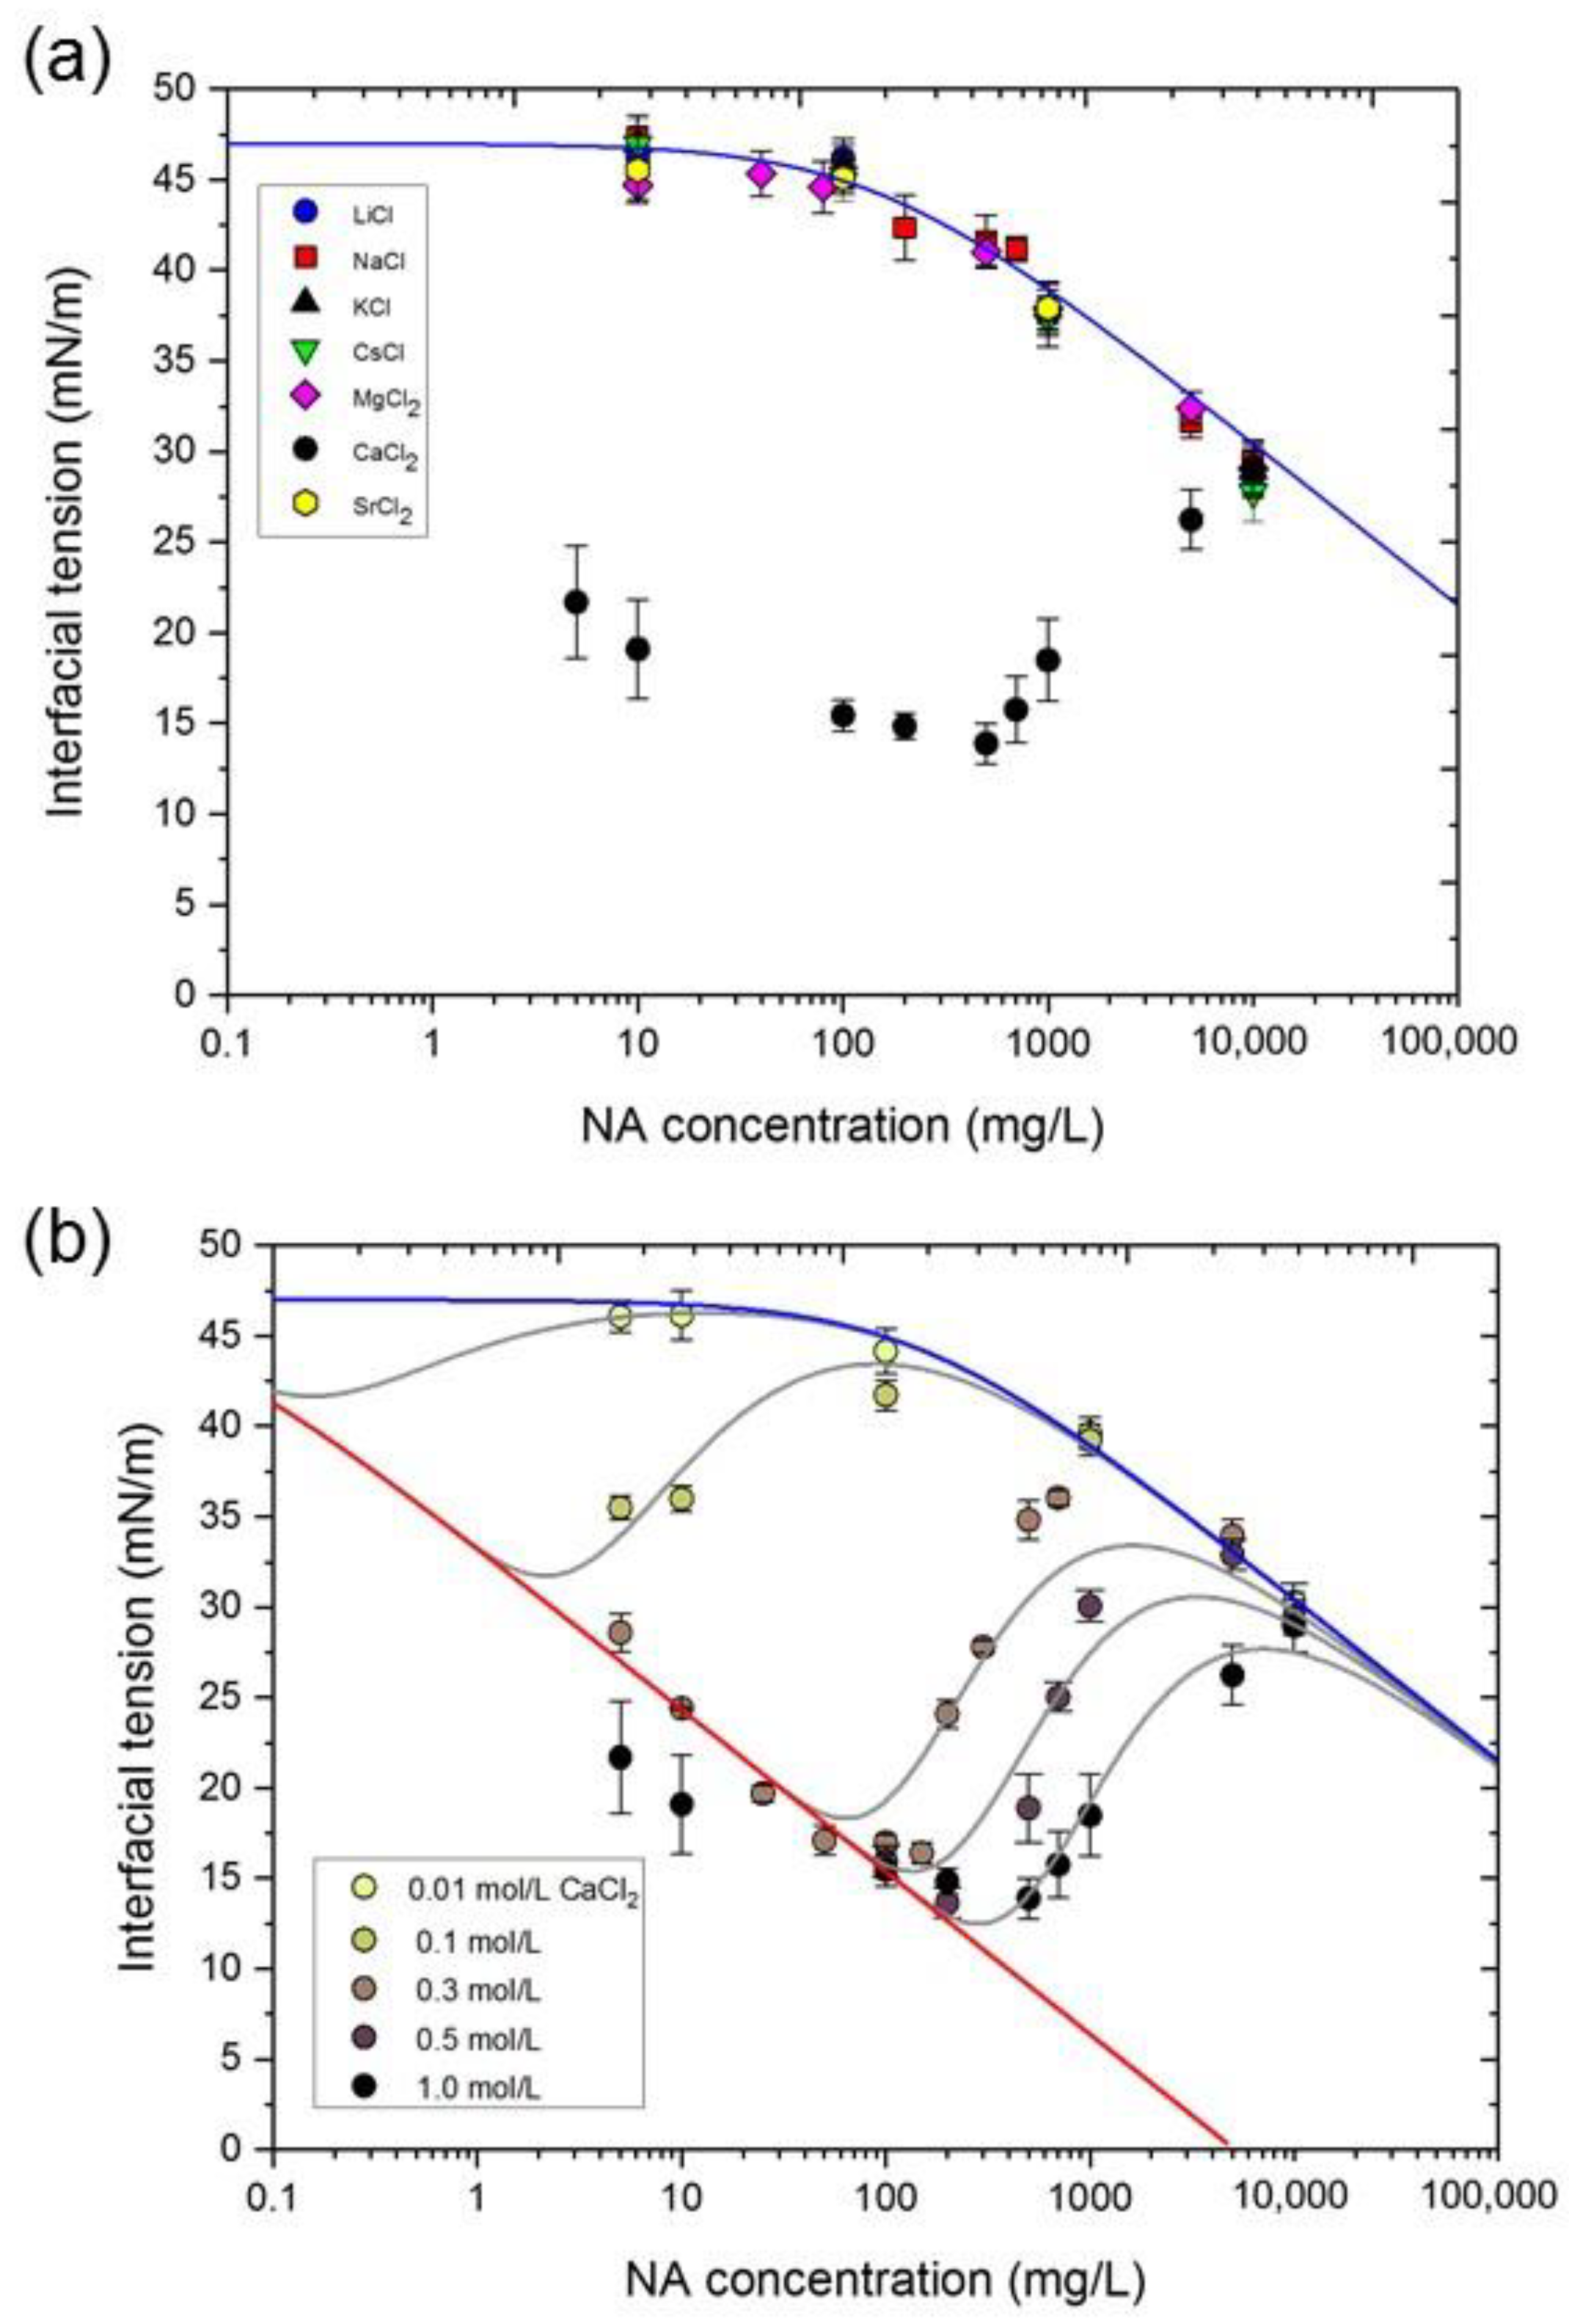
With the exception of Ca2+, none of the other metal ions studied has been found to exhibit time-dependent interfacial tensions using the present experimental method. Thus, in Figure 3a, NA adsorption at the n-heptane/metal chloride solution (1.0 mol/L) interface is indistinguishable from the deionized water curve shown in Figure 2c. These data include the two other divalent metal ions studied, Mg2+ and Sr2+, which do not show the same interfacial tension behavior as a function of CNA as seen for Ca2+, i.e., interfacial tension minima that are dependent on CCa as highlighted in Figure 3b. As observed above, for NA concentrations beyond the minimum interfacial tension, the behavior returns to the curve defined by the other metal ion solutions and deionized water. This suggests a reduced influence of Ca2+ ions in lowering the Gibbs energy of adsorption of NA molecules (Table 1) as the interface becomes more saturated with NA. Crucially, however, it also suggests that the presence of specific calcium naphthenate species with higher surface activity may not be directly responsible for the increased interfacial activity of NA, but rather the Ca2+ ions promote NA adsorption, through specific interactions as will be discussed subsequently.

3.3. Dependence of Interfacial Tension on CNA and CCa

The theoretical curves drawn through the data in Figure 3b were derived on the assumption that the interface can be described as a combination of two limiting situations, one based on pure water and the other containing a certain interfacial excess of Ca2+ (possibly representing a “saturated” interfacial film). The former condition is simply represented by deionized water data in Figure 2c, whilst the latter has to be obtained from the limiting interfacial tension data determined in the presence of different Ca2+ concentrations shown in Figure 3b (red line). As discussed above, both limiting conditions have been shown to be adequately described by the Szyszkowski equation (see Figure 2c). In the subsequent analysis, therefore, we have assumed that the overall adsorption conditions will be a combination of these two limiting cases, the extent to which each contributes being dependent on the (bulk) concentration ratio between NA and Ca2+. Thus, the interfacial tensions produced by NA adsorption at a water interface and at a saturated Ca2+-containing interface are given by Equations (9) and (11), respectively; it is unnecessary to define the bulk Ca2+ concentration responsible for the latter condition at this stage of the analysis. In Equation (11), Гm’ and a’ are the respective surface concentration and molecular constant of NA in the presence of the saturation concentration of Ca2+.
γ = γ 0 R T Γ m ln ( C NA a + 1 )  
In the case of aqueous phases containing Ca2+ ions, and n-heptane phases containing NA, we assume that the extent of interaction at the water/n-heptane interface is a function of the concentration ratio CCa/CNA, such that the contributions arising from pure water and aqueous Ca2+ solution interfaces are [ 1 exp ( ϕ C Ca / C NA ] and exp ( ϕ C Ca / C NA ) , respectively, where the factor φ takes into account differences between concentration units as well as the relative effectiveness of Ca2+ and NA interactions at the interface. Thus, the general interfacial tension expression for different Ca2+ and NA concentrations is given by combining Equations (9) and (11), to give
γ = γ 0 R T ( Γ m ( 1 exp ( ϕ C Ca C NA ) ) ln ( C NA a + 1 ) + Γ m exp ( ϕ C Ca C NA ) ln ( C NA b + 1 ) )  
Initial attempts at fitting the data shown in Figure 3b to Equation (12) indicated that, perhaps unsurprisingly, Гm ~ Гm, allowing the simplified Equation (13) to be used to generate the fitted curves shown in Figure 3b. For the purpose of this demonstration, the following values were used for all Ca2+ concentrations: γ0 (47.0 mN/m); Гm (1.60 × 10⁻⁶ mol/m2), a (0.03 mol/L) and b (145 mol/L), leaving the interaction term φ (mg/mol) as the only adjustable parameter.
γ = γ 0 R T Γ m ( 1 exp ( ϕ C Ca C NA ) ) ln ( C NA a + 1 ) + exp ( ϕ C Ca C NA ) ln ( C NA b + 1 )  
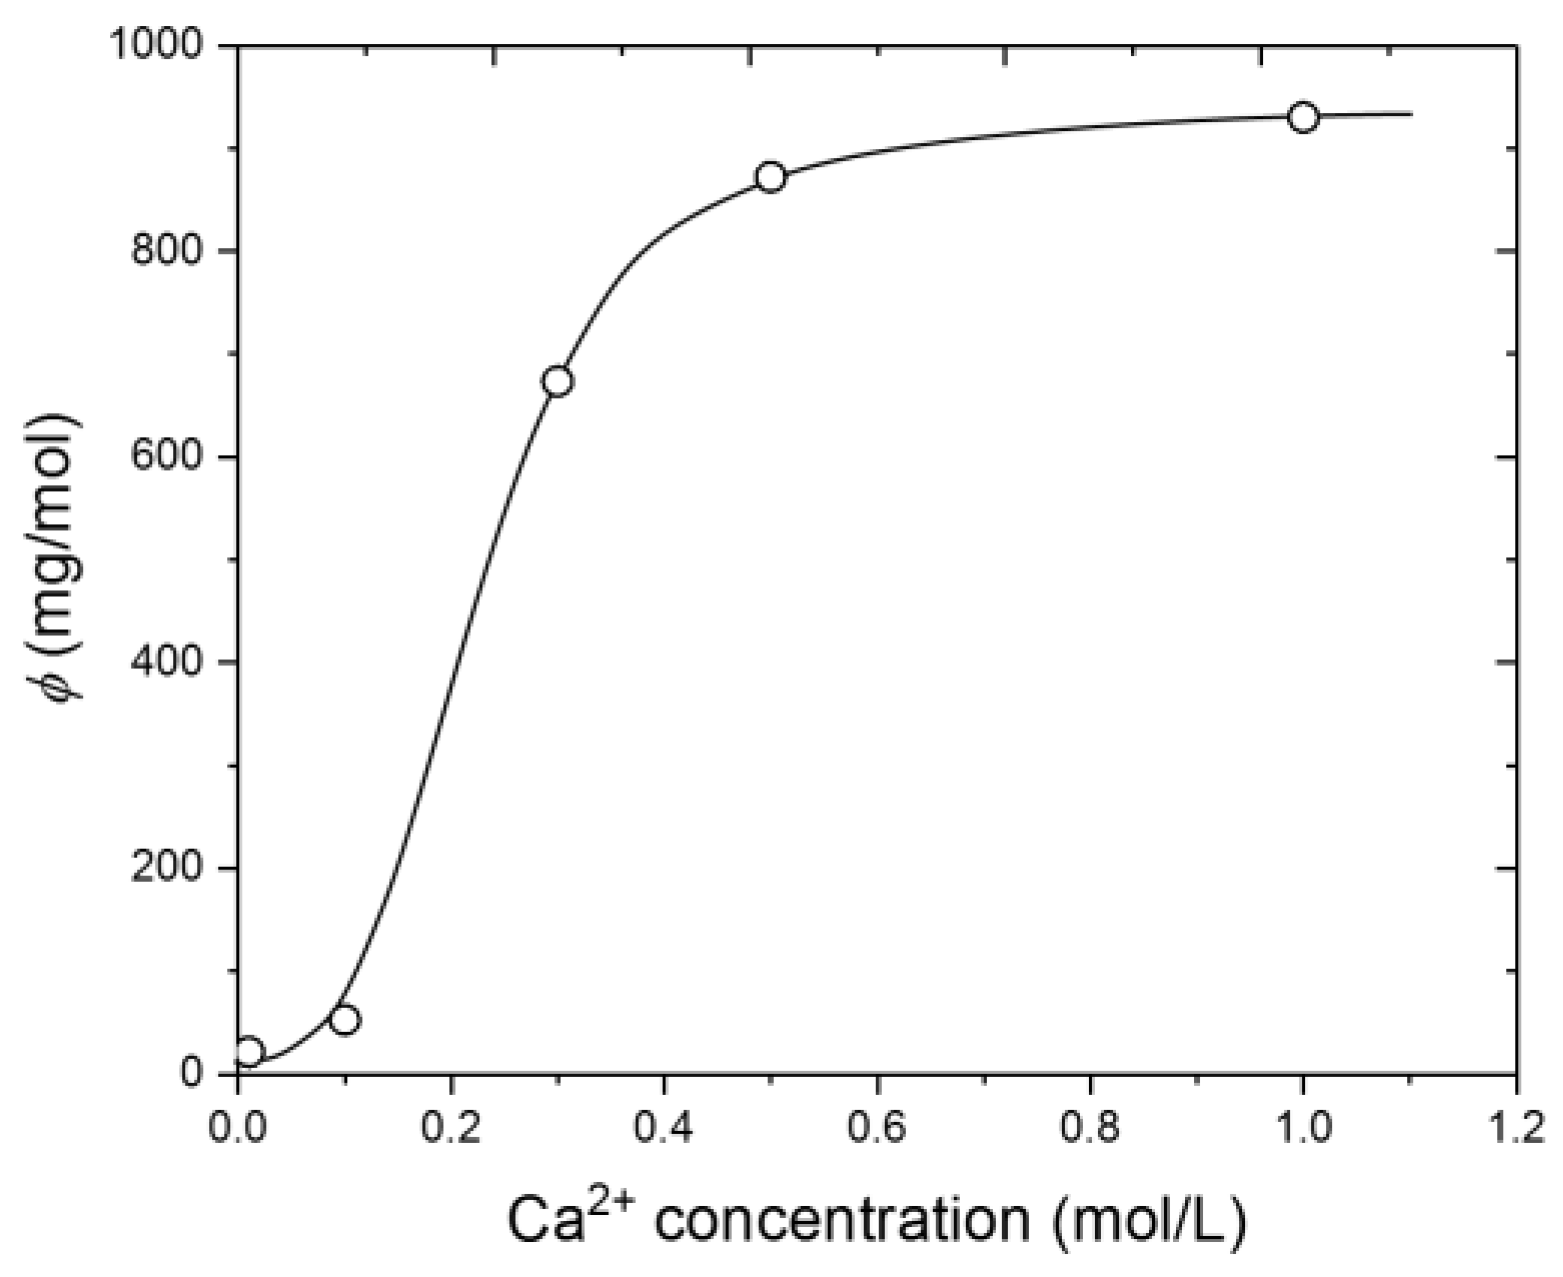
It is evident from Figure 3b that this simplistic analysis produces reasonable fits to the experimental data and produces a sigmoidal variation of φ with the bulk Ca2+ concentration as shown in Figure 4. The behavior seen in Figure 3b reflects the increasing concentration of Ca2+-NA interactions in the interface as the bulk Ca2+ concentration is raised. The appearance of a plateau region in Figure 4 at CNA ~ 0.4 mol/L suggests that this bulk concentration corresponds to the interfacial “saturation” condition for Ca2+ ions, as alluded to earlier, and for which the maximum influence on NA adsorption is seen.

3.4. NA-Ca2+ Interfacial Tension Kinetics

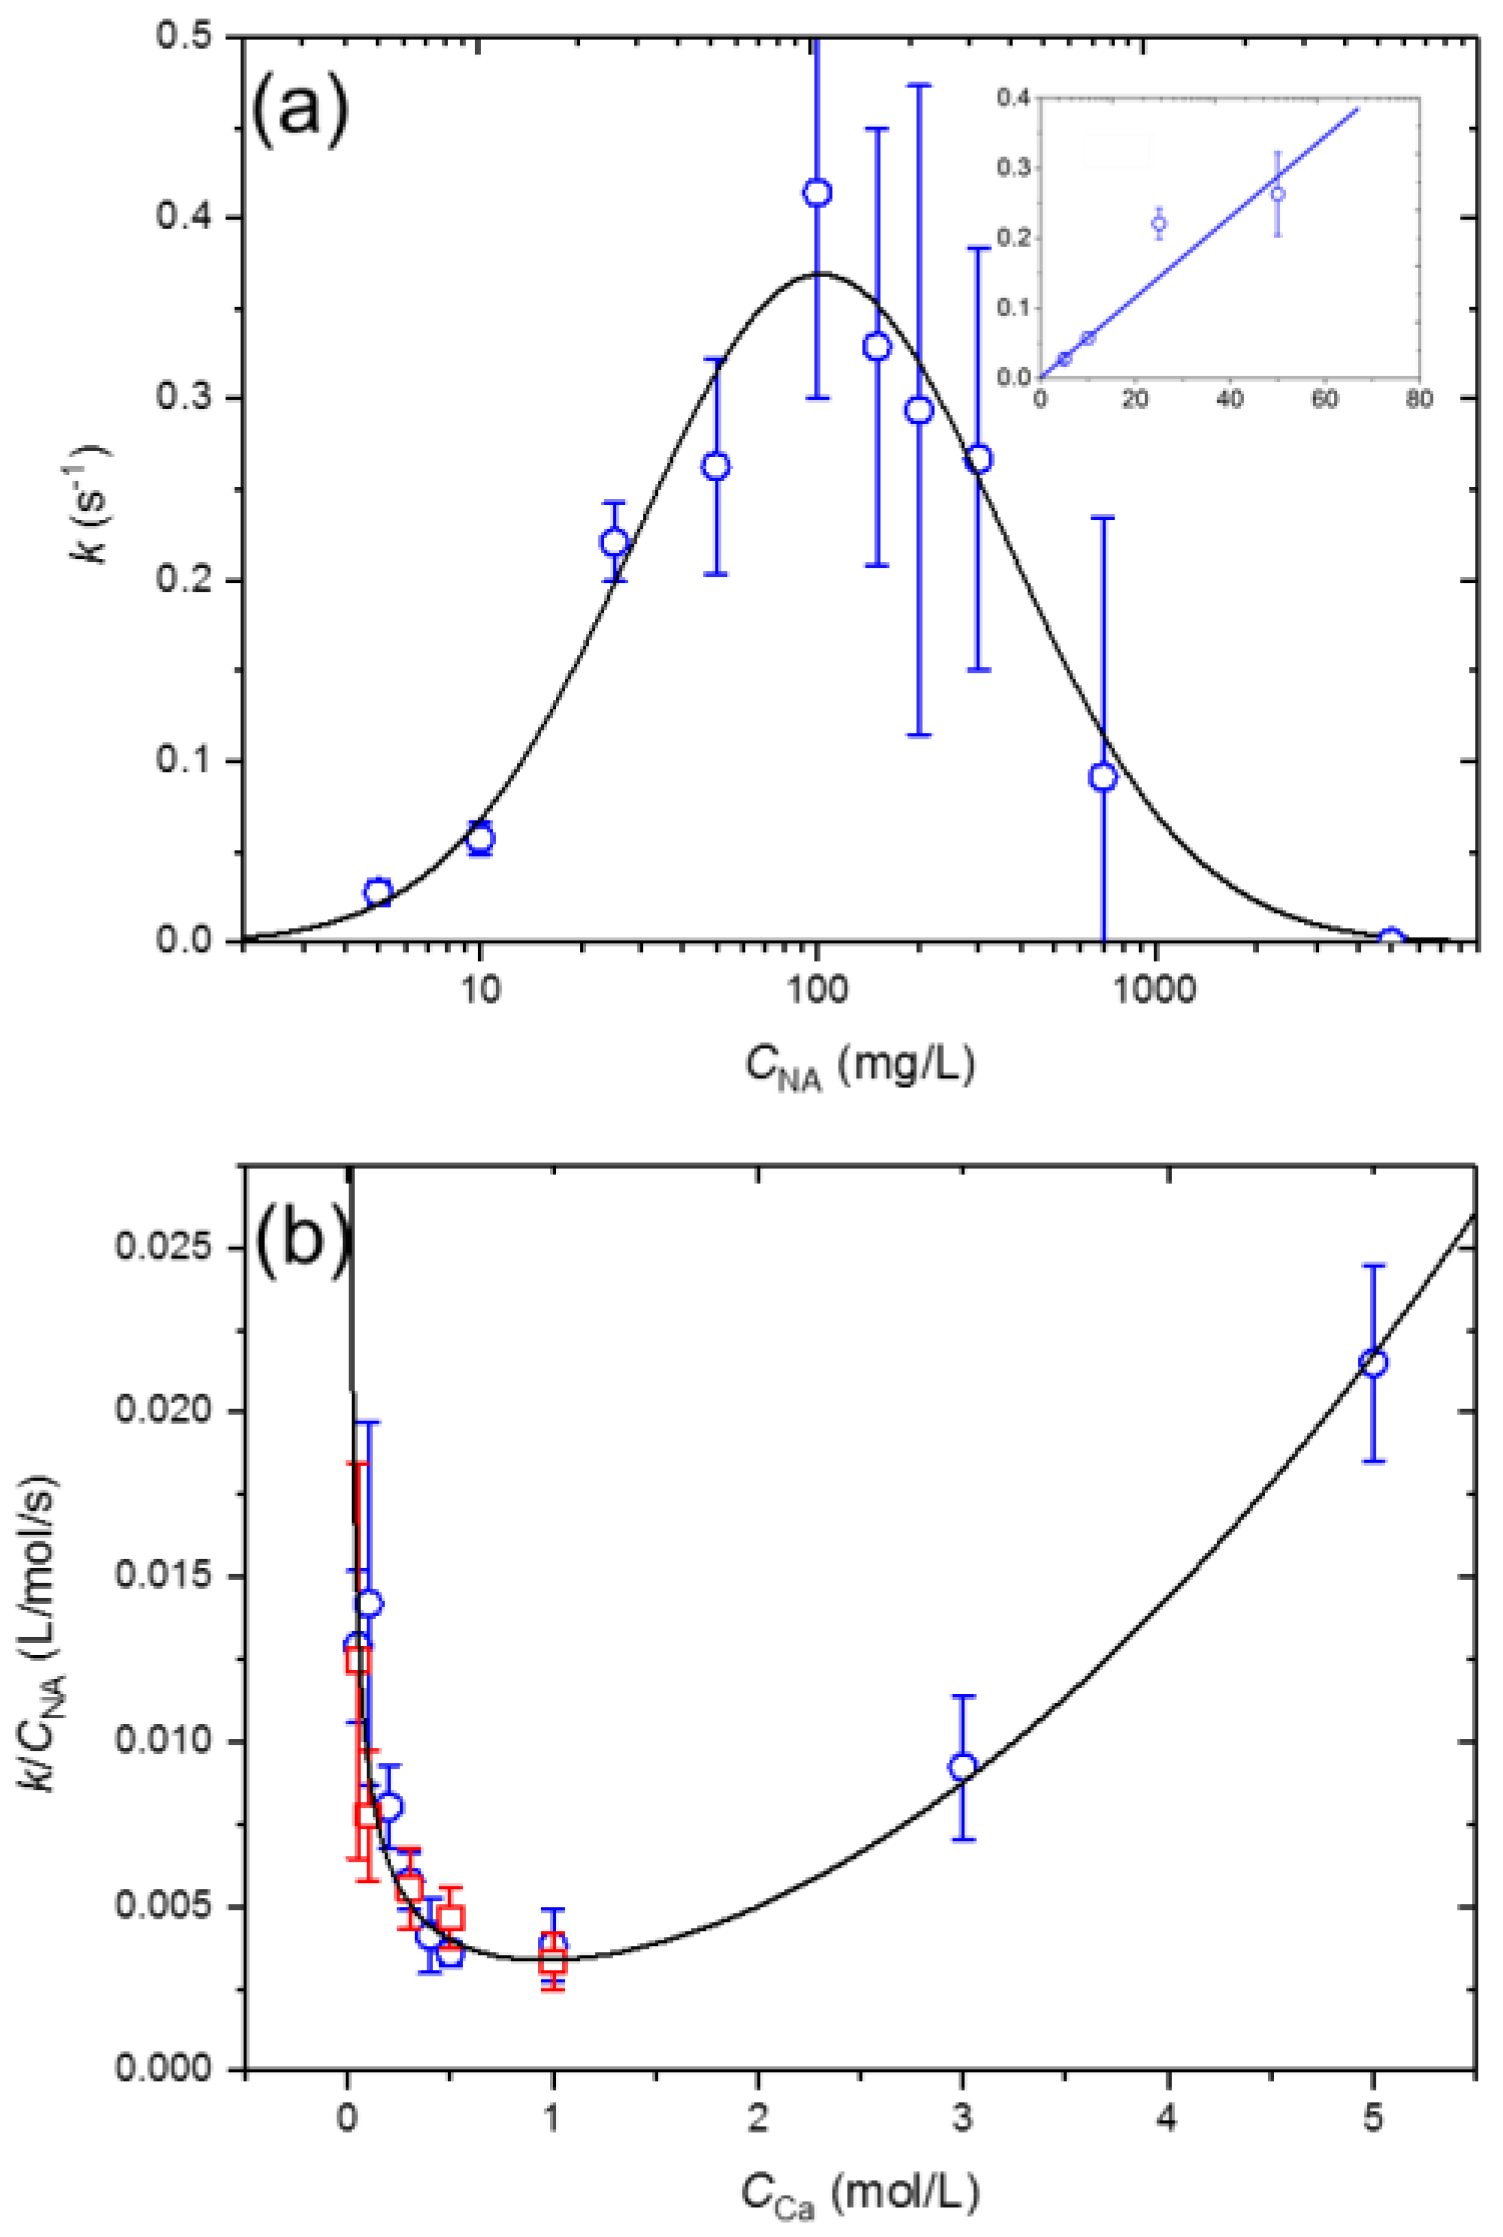
The additional decrease in interfacial tension of NA at the n-heptane/water interface in the presence of Ca2+ ions shown in Figure 2b occurs at rates that are measurable using the present technique. Kinetic data associated with these changes are given in Figure 5 in the form of two plots. The first shows the effects of CNA on the first-order rate constant k at constant CCa (0.3 mol/L; Figure 5a), and the second shows the variation in the second-order rate constant (=k/CNA; for CNA = 5 and 10 mg/L; Figure 5b) as a function of CCa.
Figure 5a illustrates the NA concentration range over which dynamic interfacial tension effects are observed for a Ca2+ concentration of 0.3 mol/L. This indicates that there is a CNA “window”, spanning almost three orders of magnitude, in which time-dependent interfacial processes are occurring. Moreover, for CNA < 50 mg/L at this particular Ca2+ concentration, k is proportional to the NA concentration, the slope of the plot shown in the inset to Figure 5a representing the second-order rate constant for the process. As CNA increases, however, not only is a maximum rate constant apparent at ~100 mg/L, but the uncertainties in the data are also seen to increase, as a result of the changes in the interfacial tension becoming smaller in this region. A comparison with the data in Figure 3b shows that the maximum k corresponds to the minimum interfacial tension of ~15 mN/m.
Also for the low CNA region, the behavior of the second-order rate constant is shown as a function of CCa in Figure 5b. Here, it is seen that a minimum rate region is apparent at CCa ~ 0.5–1.0 mol/L, consistent with the onset of the plateau region in Figure 4.
We speculate that the cause of the slower reduction of interfacial tension shown in Figure 2b is due to complex formation involving Ca2+ and NA, and reorientation at the interface. This is evident only in the case of Ca2+, but not for any of the other studied cations. With reference to the adsorption parameters in Table 1, it appears probable that the hydrophobic side of the interfacial region rapidly becomes saturated with randomly-distributed NA molecules upon contacting water containing Ca2+ ions. The increased local NA concentration then reconfigures into a more ordered adsorbed layer with the same adsorbed area/molecule as for NA at the n-heptane/deionized water interface. With respect to the adsorption data for pre-formed Ca(NA)2 in Table 1, this finding suggests that complete complexation between NA and Ca2+ is unlikely to have taken place. The question then remains as to the role of Ca2+ ions in the adsorption process. To try to answer this, consideration needs to be given to the behavior of metal ions in aqueous solution, and especially with regard to interactions with carboxylates.

3.5. Interfacial Behavior of Ions and Metal Ion–Carboxylate Bonding

In order to provide a plausible explanation for the observed behavior described above, three particular factors need to be considered: (i) the behavior of hydrated cations at interfaces; (ii) exchange of ligated water in the inner coordination sphere; and (iii) specific interactions between cations and carboxylate groups.
It has long been known that aqueous ions influence interfacial behavior [68]. Typically, aqueous salts are considered to “negatively adsorb” at air/water or oil/water interfaces, producing an increase in the respective surface or interfacial tensions in accord with the Gibbs adsorption theory, and to an extent that is specific to each ion [69]. Ion theories have been developed over the years, with increasingly sophisticated models proposed to predict their behavior at interfaces [70,71].
Herein, we have considered several different monovalent and divalent cations and found that, of these, only Ca2+ affects the n-heptane/water interfacial tension in the presence of NA. All cations have a tendency to be hydrated, owing to their ionic charge [72], and as a consequence will be excluded from the interfacial region [73,74]. Therefore, we have to examine why Ca2+ behaves differently from the rest of the studied cations.
Ikeda et al. compared Ca2+ and Mg2+ ions in solution using constrained molecular dynamics, and found that the hydrated structure of Ca2+ is highly variable compared with that of Mg2+ [75]. Using density functional theory, Pavlov et al. identified that Ca2+ has a lower water binding energy compared with Mg2+ (as well as Be2+ and Zn2+), notwithstanding the different water structures around the respective ions [76]. This implies that Ca2+ will show potentially greater lability of its inner-shell coordinated water molecules, which is of importance for adsorption as well as coordination to ligands.
Specific ion effects were originally classified based on the different abilities of salts to precipitate proteins from aqueous solution, a phenomenon which is accredited to Hofmeister in 1888 [77,78]. The “Hofmeister effect”, as it came to be known, now refers more generally to the relative effects of either cations or anions on colloidal, surface or biological processes. The commonly-held view that has been developed, discussed and reviewed by many authors over the years is that ion hydration is fundamental to the Hofmeister effect [73,74,79]; this includes the behavior of ions at liquid interfaces [70]. The size of the ion and its nuclear charge control its hydration properties in aqueous solution and serve to define kosmotropic (strongly hydrated) and chaotropic (weakly hydrated) ions. Thus, kosmotropes are likely to possess high charge densities and their consequent strong hydration contributes to repulsion from an interface [73,74]. Adsorption of these ions would be accompanied by liberation of the strongly-bound hydration water, requiring large positive enthalpic contributions to the Gibbs energy which would not necessarily be outweighed by the corresponding entropy changes, i.e., ΔHadsTΔSads > 0. On the other hand, water molecules bound to chaotropic ions are more easily lost on approaching an interface [73,74], making adsorption more favorable, i.e., ΔHadsTΔSads < 0.
Considering the second factor mentioned above, that of the lability of the coordinated inner-shell water molecules, consistent with the theoretical investigations [75,76], it was found that water exchange rates from the innermost hydration shells are almost four orders of magnitude faster for Ca2+ than for Mg2+ ions [80]. This trend reflects the relative sizes of the anhydrous cations, and the greater charge density of Mg2+. Using the same arguments, this would suggest that Sr2+ should behave in a similar fashion to Ca2+, but we have not found this to be the case. We therefore turn to the third factor mentioned above, that of specific effects involving the coordination chemistry of Ca2+ and the carboxylate group.
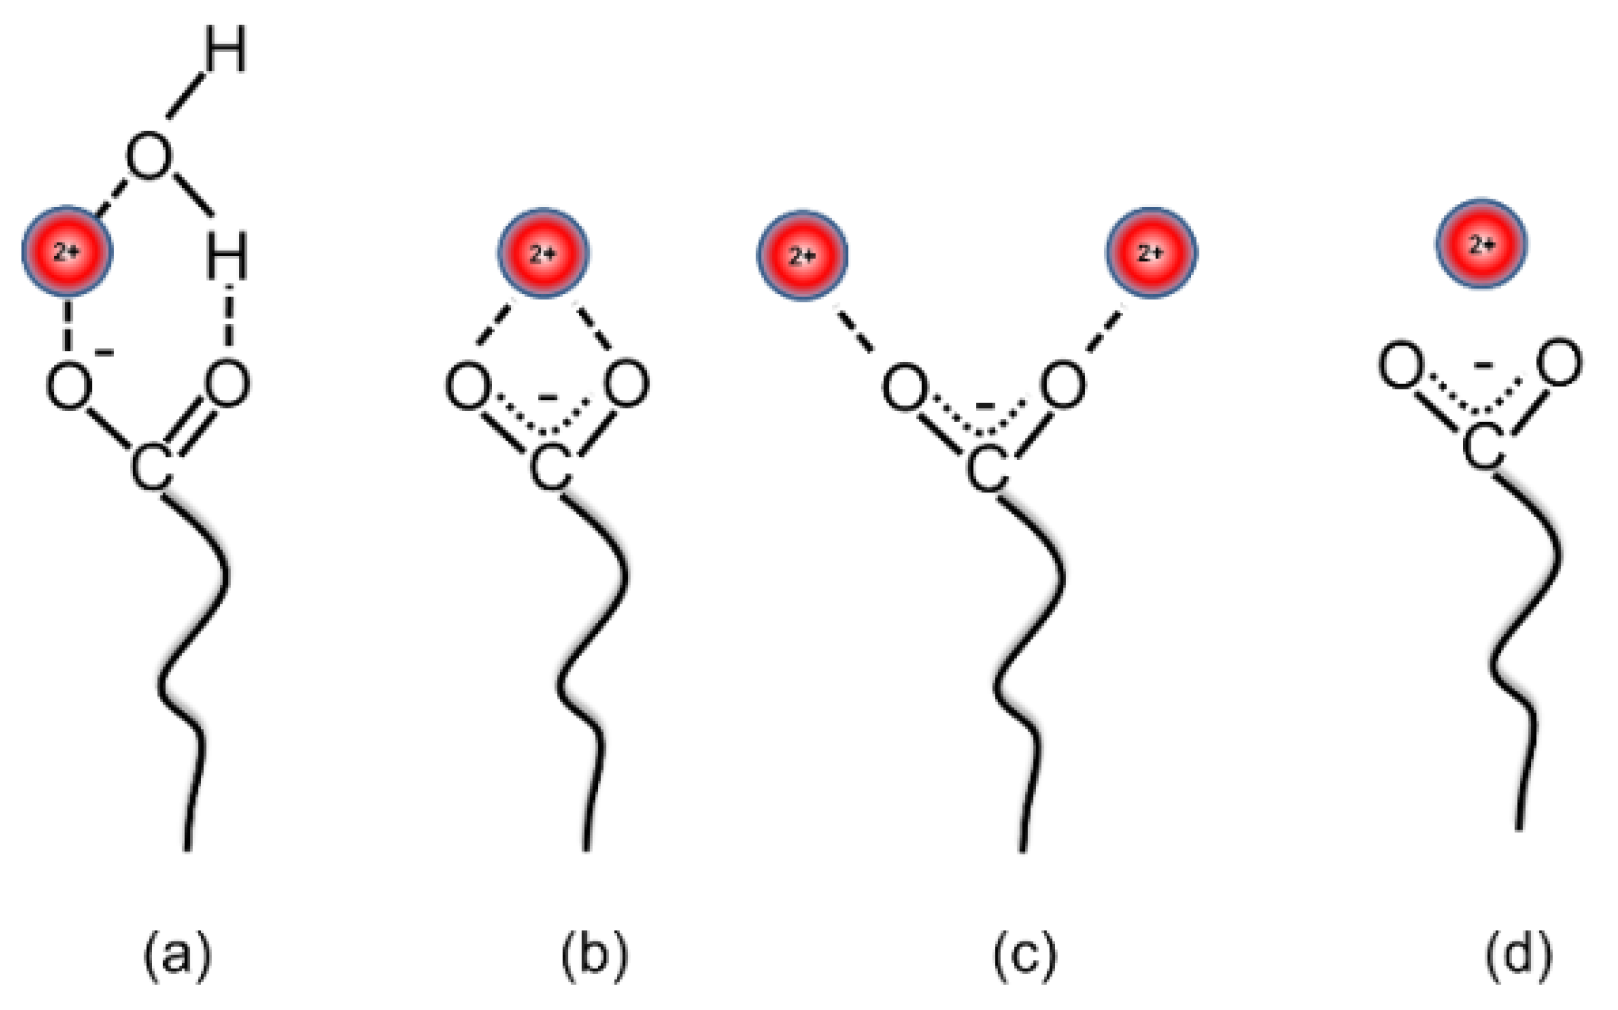
In a recent example, Kherb et al. studied the strength of association of monovalent and divalent cations with carboxylate sites on a polypeptide biopolymer, and identified the divalent ion sequence Zn2+ > Ca2+ > Ba2+ > Sr2+ > Mg2+, whilst monovalent cations showed weaker binding [81]. The inference made from this was that the most hydrated cations bind more strongly to carboxylate [81]. The structures of metal carboxylate complexes have been extensively studied over the years and have allowed the detailed examination of X-ray crystallographic data by Einspahr and Bugg [82] and Carrell et al. [83], which, together with other investigations [47,84,85,86] has culminated in the principal binding modes shown in Figure 6 being identified. Thus, specifically for Ca2+, monodentate coordination with one carboxylate O atom and hydrogen bonded water, bidentate coordination, with both carboxylate O atoms, or bridging (see Figure 6a–c) are notable [82]. On the other hand, a major difference in bonding mode with carboxylic acids in the case of magnesium is the formation of uncoordinated ionic species of the form shown in Figure 6d [87]. The crystal structure of the magnesium complex of p-anisic acid (4-methoxybenzoic acid) contains a layer structure of alternating [Mg(H2O)6]2+ cations and p-anisate anions with the lattice water functioning as a link between the layers. On the other hand, the monohydrated Ca(II) salt is a two-dimensional coordination polymer [87].
The comparative behavior between Ca2+ and Mg2+ interactions at carboxylate monolayers has also been studied by Tang et al. using vibrational sum frequency generation spectroscopy [88,89]. Thus, binding of these ions to palmitic acid monolayers indicated different concentration-dependent metal ion binding modes [88], concluding that as the Ca2+ concentration increases (to 0.3 mol/L), complexation favors the 2:1 bridging configuration shown in Figure 6c, whereas Mg2+ adopts the ionic complex in Figure 6d consistent with solution and crystallographic results. Moreover, the stronger Ca2+ binding was shown to have a much greater impact on the underlying hydrogen bonding below the carboxylic acid monolayer [89], which is arguably consistent with the differences seen between Ca2+ and Mg2+ ions in the present study at the oil/water interface.
We have also looked to biological systems to provide an understanding of the differences between divalent ion coordination modes, especially with respect to carboxylate ligands found in a wide range of protein environments [90,91,92,93,94]. Williams provides a clear indication that the most significant factors responsible for ion binding in biological systems are, inter alia, ion charge, ion size, ligand donor atom, and preferred coordination geometry [95]. Thus, in connection with biological systems, binding of ions such as those considered in the present study is restricted to oxygen donor ligands, and specificity of Ca2+ binding (e.g., relative to Mg2+) is due to its size and less-restricted steric preferences compared with other ions. Ca2+ shows a greater tendency for bidentate binding to carboxylate, compared with Mg2+ [91], and a lower affinity for water [92,94].
Ca2+ binding to carboxylate is also considered to be advantageous based on Collins’ “matching water affinity” approach, according to which specific pairing interactions between ions, resulting in the formation of ion pairs, is most favorable for ions of comparable hydration energy [96]. The latter is quantified [97] by the apparent dynamic hydration number (ADHN) which, for Ca2+ and carboxylate are 2.1 and 2.0, respectively, which therefore match up surprisingly well (cf. 5.7 for Mg2+). Kiriukhin and Collins consider that interaction between these two species will result in dissipation of the hydration shell, thereby benefitting coordination [97], which we suggest may also feature in specific Ca2+-naphthenic acid interactions across an interface. Such interactions would be likely to require water to be displaced from the first coordination shell.
In summary, there is compelling evidence for specific Ca2+ interactions with carboxylic acids from biology. Therefore, a combination of evidence from biological and coordination chemistry appears to offer an interpretation of the present surface chemical findings, which may be of relevance in other practical and technological areas, such as our current interest in crude oil surface chemistry.

3.6. Implications for Crude Oil Surface Chemistry

Over the past two decades in particular, the importance of injection water composition on crude oil reservoir chemistry has been established through various laboratory coreflood investigations and field evaluations. Studies have shown that low salinity conditions contribute to improvements in oil recovery, but although various mechanisms have been proposed, a full understanding of the low salinity effect is still lacking. However, a common factor throughout some proposed mechanisms is the role of the ionic composition of the injection and formation waters [98] and especially their effects on reservoir wettability and the corresponding affinity of the oil for the rock surface [99]. Based on our present findings the specific role of Ca2+ is considered to be significant. From the data given in Figure 3b, for example, it is evident that the minimum interfacial tension of the present NA system is dependent on the Ca2+ concentration, as shown in Figure 7a. This representation of the data assumes that there is an excess of NA in the oil phase and that the bulk Ca2+ concentration governs the interfacial tension.
With reference to Figure 7b, showing a schematic of oil coating a solid (rock) surface, two equilibrium conditions can be envisaged during oil recovery. The first is the original condition within the reservoir, in which the crude oil and rock are in equilibrium with the formation brine, and the second is during waterflooding conditions where sea water, softened water or low salinity water will change the aqueous phase composition [100].
Young’s equation is derived from the balance of forces acting on the contact line of a drop on a surface (Figure 7b), i.e.,
γ WS = γ OS + γ WO cos θ
where the γ terms are the respective Gibbs energies of the water/solid (WS), oil/solid (OS) and oil/water (OW) interfaces and θ is the contact angle made by oil on the solid surface. We can therefore consider two hypothetical situations by way of illustrating the potential role of Ca2+ ions in oil recovery, based on an initial oil/rock system in equilibrium with formation water, and a final waterflooded system with reduced salinity, and a concomitant lower Ca2+ concentration.
We assume that Equation (14) can be applied to each situation, such that the change in Ca2+ concentration causes a resultant change in the water/oil interfacial tension, γWO. For this elementary analysis, we also assume that γWS and γOS remain relatively unaffected by the change in Ca2+ concentration. However, although we recognize that, in practice it is likely that wetting films comprising, for example, hydrophobic species [101] or hydration layers [102], can modify water/solid and oil/solid interfaces and their respective interfacial energies, predicting the effects on the contact angle, for example, is not easy. Therefore, we consider, as an example, the simple analysis involving the initial and final conditions as introduced above, for which it is apparent that
γ OW i cos θ i = γ OW f cos θ f  
where i and f refer to initial and final states, respectively. As shown in Table 2, formation waters are generally more saline than sea water, the ionic composition being source-dependent but also dependent on the geologic period [103]. Thus, it is possible that during geologic time the oil/rock system will have been “conditioned” with a relatively highly saline brine containing a high Ca2+ concentration, say ~20,000 mg/L as an illustrative value (Table 2). Therefore, with reference to Figure 7a, dilution of the formation brine to ~5000 mg/L Ca2+ would approximately double the interfacial tension, such that
cos θ f = ( γ OW i / γ OW f ) cos θ i 0.5 cos θ i  
Thus, Equation (16) enables the plot shown in Figure 7c to be constructed, illustrating how the contact angle between the oil and rock surface is affected by the Ca2+ concentration change in the example given, from 20,000 mg/L to 5000 mg/L during waterflooding. Here, it is evident that the lowest initial contact angles, indicating high oil affinity with the surface, are influenced most by the change in interfacial tension. In this region, contact angles increase by as much as 50°, potentially improving oil recovery. Such a scenario is depicted in the inset images in Figure 7c, added for illustrative purposes only, but is consistent with the results of the study by Shehata and Nasr-El-Din regarding the dominant role of formation water salinity and composition in improving oil recovery during low salinity waterflooding [98].
Thus, the findings presented herein may provide further insight into potential mechanisms for the low salinity effect. In addition, it is apparent that the ability to predict the effect of water chemistry on oil recovery reservoir requires not only knowledge of the interfacial chemistry of inorganic ions, but also the range of surface-active species present in the crude oil; here, we have only examined the effects of naphthenic acids. For real crude oils, however, the increased complexity and competition resulting from the presence of other interfacially active species, such as asphaltenes and resin components, would be expected to produce a different interfacial behavior [104]. This has been borne out in studies on crude oil fractions to be reported elsewhere.

4. Conclusions

It seems to be a recurring theme that Ca2+ plays significant roles in the aqueous colloid and interfacial chemistry of crude oil and, in this respect, is more important than other metal ions. As discussed in the present paper, the characteristics of this ion make it favorable to undergo specific interactions with carboxylic components found in crude oil, to some extent mimicking its unique position in biology [95]. Of the metal ions studied herein, both monovalent and divalent, only Ca2+ has been shown to exhibit interfacial coordination with carboxylate groups of a commercial naphthenic acid sample.
The present findings have indicated that, on their own, naphthenic acids (NAs) are only weakly active at the n-heptane/water interface at concentrations below ~200 mg/L as determined using the dynamic drop volume technique. However, this behavior is modified in the specific presence of Ca2+, whereas Mg2+ and Sr2+, as well as several alkali metal cations, exhibit no comparable effect. We have found that, for a given aqueous Ca2+ concentration, there exists an “optimum” NA concentration in the n-heptane phase at which a minimum interfacial tension is attained. As shown in Figure 7, the lowest interfacial tension is ~10–15 mN/m, to be compared with a value of ~45 mN/m for the other cations and deionized water. The interaction is not stoichiometric with respect to the respective bulk concentrations, in that the minimum interfacial tension occurs at a bulk Ca2+:NA molar concentration ratio of ~1000:1. The interfacial stoichiometry is unclear at present, but probably relates to the bidentate preference of Ca2+, but further interfacial studies will be necessary in order to provide more definitive evidence.
In fact, there may be no single factor responsible for the results presented in this study. Rather, for Ca2+, the combination of its ionic hydration structure and its thermodynamic and kinetic properties as well as its coordination preferences, particularly relating to carboxylate, may contribute to its behavior at the oil/water interface. Conclusions from studies undertaken some 80 years ago by Alexander et al. also highlighted the specific relevance of Ca2+ ions (compared with Na+, K+ and Mg2+) to the chemistry of biological films, such as cephalin (kephalin) at the benzene/water interface [105].

Author Contributions

S.E.T. conceptualized and supervised the research and conducted some of the experiments. H.T.C. conducted the majority of the experiments and prepared an initial interpretation of the results. S.E.T. wrote the manuscript.

Funding

This research received no external funding.

Acknowledgments

BP America is acknowledged for initially establishing the Centre for Petroleum and Surface Chemistry at the University of Surrey. S.E.T. is grateful to the Chemistry Department at the University of Surrey for making continued research possible.

Conflicts of Interest

The authors declare no conflicts of interest.

References

  1. Speight, J.G. High Acid Crudes; Gulf Professional Publishing: Waltham, MA, USA, 2014; Chapter 1. [Google Scholar]
  2. Burrell, G.A. Composition of petroleum and its products. Ind. Eng. Chem. 1928, 20, 602–608. [Google Scholar] [CrossRef]
  3. Rudzinski, W.E.; Oehlers, L.; Zhang, Y.; Najera, B. Tandem mass spectrometric characterization of commercial naphthenic acids and a Maya crude oil. Energy Fuels 2002, 16, 1178–1185. [Google Scholar] [CrossRef]
  4. Anderson, W.G. Wettability literature survey—Part 1: Rock/oil/brine Interactions and the effects of core handling on wettability. J. Pet. Technol. 1986, 38, 1125–1144. [Google Scholar] [CrossRef]
  5. Anderson, W.G. Wettability literature survey—Part 2: Wettability measurement. J. Pet. Technol. 1986, 38, 1246–1262. [Google Scholar] [CrossRef]
  6. Muller, H.; Pauchard, V.O.; Hajji, A.A. Role of naphthenic acids in emulsion tightness for a low total acid number (TAN)-high asphaltenes oil: Characterization of the interfacial chemistry. Energy Fuels 2009, 23, 1280–1288. [Google Scholar] [CrossRef]
  7. Acevedo, S.; Gutierrez, X.; Rivas, H. Bitumen-in-water emulsions stabilized with natural surfactants. J. Colloid Interface Sci. 2001, 242, 230–238. [Google Scholar] [CrossRef]
  8. Arla, D.; Flesisnki, L.; Bouriat, P.; Dicharry, C. Influence of alkaline pH on the rheology of water/acidic crude oil interface. Energy Fuels 2011, 25, 1118–1126. [Google Scholar] [CrossRef]
  9. Havre, T.E.; Sjöblom, J.; Vindstad, J.E. Oil/water-partitioning and interfacial behavior of naphthenic acids. J. Dispers. Sci. Technol. 2003, 24, 789–801. [Google Scholar] [CrossRef]
  10. Gallup, D.L.; Curiale, J.A.; Smith, P.C. Characterization of sodium emulsion soaps formed from production fluids of Kutei Basin, Indonesia. Energy Fuels 2007, 21, 1741–1759. [Google Scholar] [CrossRef]
  11. Kelland, M.A. Production Chemicals for the Oil and Gas Industry; CRC Press, Taylor and Francis: Boca Raton, FL, USA, 2009; Chapter 7. [Google Scholar]
  12. Baugh, T.D.; Grande, K.V.; Mediaas, H.; Vindstad, J.E.; Wolf, N.O. The discovery of high molecular weight naphthenic acids (ARN acid) responsible for calcium naphthenate deposits. In Proceedings of the SPE International Symposium on Oilfield Scale, Aberdeen, UK, 11–12 May 2005. [Google Scholar]
  13. Juyal, P.; Mapolelo, M.M.; Yen, A.; Rodgers, R.P.; Allenson, S.J. Identification of calcium naphthenate deposition in South American oil fields. Energy Fuels 2015, 29, 2342–2350. [Google Scholar] [CrossRef]
  14. Brandal, Ø.; Hanneseth, A.-M.D.; Hemmingsen, P.V.; Sjöblom, J.; Kim, S.; Rodgers, R.P.; Marshall, A.G. Isolation and characterization of naphthenic acids from a metal naphthenate deposit: Molecular properties at oil-water and air-water interfaces. J. Dispers. Sci. Technol. 2006, 27, 295–305. [Google Scholar] [CrossRef]
  15. Sundman, O.; Simon, S.; Nordgard, E.L.; Sjöblom, J. Study of the aqueous chemical interactions between a synthetic tetra-acid and divalent cations as a model for the formation of metal naphthenate deposits. Energy Fuels 2010, 24, 6054–6060. [Google Scholar] [CrossRef]
  16. Ge, L.; Vernon, M.; Simon, S.; Maham, Y.; Sjöblom, J.; Xu, Z. Interactions of divalent cations with tetrameric acid aggregates in aqueous solutions. Colloids Surf. A Physicochem. Eng. Asp. 2012, 396, 238–245. [Google Scholar] [CrossRef]
  17. Andersen, S.I.; Chandra, M.S.; Chen, J.; Zeng, B.Y.; Zou, F.; Mapolelo, M.; Abdallah, W.; Buiting, J.J. Detection and impact of carboxylic acids at the crude oil–water interface. Energy Fuels 2016, 30, 4475–4485. [Google Scholar] [CrossRef]
  18. Hutin, A.; Argillier, J.-F.; Langevin, D. Influence of pH on oil-water interfacial tension and mass transfer for asphaltenes model oils. Comparison with crude oil behavior. Oil Gas Sci. Technol. 2016, 71, 58–66. [Google Scholar] [CrossRef]
  19. Arla, D.; Sinquin, A.; Palermo, T.; Hurtevent, C.; Graciaa, A.; Dicharry, C. Influence of pH and water content on the type and stability of acidic crude oil emulsions. Energy Fuels 2007, 21, 1337–1342. [Google Scholar] [CrossRef]
  20. Alvarado, V.; Wang, X.; Moradi, M. Role of acid components and asphaltenes in Wyoming water-in-crude oil emulsions. Energy Fuels 2011, 25, 4606–4613. [Google Scholar] [CrossRef]
  21. Wang, X.; Alvarado, V. Effects of aqueous-phase salinity on water-in-crude oil emulsion stability. J. Dispers. Sci. Technol. 2012, 33, 165–170. [Google Scholar] [CrossRef]
  22. Kumar, N.; Wang, L.; Siretanu, I.; Duits, M.; Mugele, F. Salt dependent stability of stearic acid Langmuir–Blodgett films exposed to aqueous electrolytes. Langmuir 2013, 29, 5150–5159. [Google Scholar] [CrossRef] [PubMed]
  23. Sheng, J.J. Critical review of low-salinity waterflooding. J. Pet. Sci. Eng. 2014, 120, 216–224. [Google Scholar] [CrossRef]
  24. Haagh, M.E.J.; Siretanu, I.; Duits, M.H.G.; Mugele, F. Salinity-dependent contact angle alteration in oil/brine/silicate systems: The critical role of divalent cations. Langmuir 2017, 33, 3349–3357. [Google Scholar] [CrossRef] [PubMed]
  25. Gandomkar, A.; Rahimpour, M.R. The impact of monovalent and divalent ions on wettability alteration in oil/low salinity brine/limestone systems. J. Mol. Liq. 2017, 248, 1003–1013. [Google Scholar] [CrossRef]
  26. Pooryousefy, E.; Xie, Q.; Chen, Y.; Sari, A.; Saeedi, A. Drivers of low salinity effect in sandstone reservoirs. J. Mol. Liq. 2018, 250, 396–403. [Google Scholar] [CrossRef]
  27. Ding, H.; Rahman, S. Experimental and theoretical study of wettability alteration during low salinity water flooding-a state of the art review. Colloids Surf. A Physicochem. Eng. Asp. 2017, 520, 622–639. [Google Scholar] [CrossRef]
  28. Pouryousefy, E.; Xie, Q.; Saeedi, A. Effect of multi-component ions exchange on low salinity EOR: Coupled geochemical simulation study. Petroleum 2016, 2, 215–234. [Google Scholar] [CrossRef]
  29. Brady, P.V.; Krumhansl, J.L. A surface complexation model of oil–brine–sandstone interfaces at 100 °C: Low salinity waterflooding. J. Pet. Sci. Eng. 2012, 81, 171–176. [Google Scholar] [CrossRef]
  30. Derkani, M.H.; Fletcher, A.J.; Abdallah, W.; Sauerer, B.; Anderson, J.; Zhang, Z.J. Low salinity waterflooding in carbonate reservoirs: Review of interfacial mechanisms. Colloids Interfaces 2018, 2, 20. [Google Scholar] [CrossRef]
  31. De Ruiter, R.; Tjerkstra, R.W.; Duits, M.H.G.; Mugele, F. Influence of cationic composition and pH on the formation of metal stearates at oil/water interfaces. Langmuir 2011, 27, 8738–8747. [Google Scholar] [CrossRef] [PubMed]
  32. Brandal, Ø.; Hanneseth, A.-M.D.; Sjöblom, J. Interactions between synthetic and indigenous naphthenic acids and divalent cations across oil-water interfaces: Effects of addition of oil-soluble non-ionic surfactants. Colloid Polym. Sci. 2005, 284, 124–133. [Google Scholar] [CrossRef]
  33. Wojciechowski, K.; Buffle, J.; Miller, R. The synergistic adsorption of fatty acid and azacrown ether at the toluene–water interface. Colloids Surf. A Physicochem. Eng. Asp. 2005, 261, 49–55. [Google Scholar] [CrossRef]
  34. Enever, R.V.; Pilpel, N. Reaction between stearic acid and calcium ions at the air/water interface using surface viscometry. Trans. Faraday Soc. 1967, 63, 781–792. [Google Scholar] [CrossRef]
  35. Enever, R.V.; Pilpel, N. Reaction between stearic acid and calcium ions at the air/water interface using surface viscometry. Part 2. Mixed films of octadecanol and stearic acid. Trans. Faraday Soc. 1967, 63, 1559–1566. [Google Scholar] [CrossRef]
  36. Pilpel, N.; Enever, R.V. Reaction between stearic acid and calcium ions at the air/water interface using surface viscometry. Part 3. Mechanism. Trans. Faraday Soc. 1968, 64, 231–237. [Google Scholar] [CrossRef]
  37. Hindle, R.; Noestheden, M.; Peru, K.; Headley, J. Quantitative analysis of naphthenic acids in water by liquid chromatography–accurate mass time-of-flight mass spectrometry. J. Chromatogr. A 2013, 1286, 166–174. [Google Scholar] [CrossRef] [PubMed]
  38. Pereira, R.F.P.; Valente, A.J.M.; Fernandes, M.; Burrows, H.D. What drives the precipitation of long-chain calcium carboxylates (soaps) in aqueous solution. Phys. Chem. Chem. Phys. 2012, 14, 7517–7527. [Google Scholar] [CrossRef] [PubMed]
  39. Chakravarthy, R.; Naik, G.N.; Savalia, A.; Sridharan, U.; Saravanan, C.; Das, A.K.; Gudasi, K.B. Determination of naphthenic acid number in petroleum crude oils and their fractions by mid-Fourier transform infrared spectroscopy. Energy Fuels 2016, 30, 8579–8586. [Google Scholar] [CrossRef]
  40. Moreira, A.P.D.; Souza, B.S.; Teixeira, A.M.R.F. Monitoring of calcium stearate formation by thermogravimetry. J. Therm. Anal. Calorim. 2009, 97, 647–652. [Google Scholar] [CrossRef]
  41. Van Hunsel, J.; Joos, P. Study of the dynamic interfacial tension at the oil/water interface. Colloid Polym. Sci. 1989, 267, 1026–1035. [Google Scholar] [CrossRef]
  42. Deshiikan, S.R.; Bush, D.; Eschenazi, E.; Papadopoulos, K.D. SDS, Brij 58 and CTAB at the dodecane-water interface. Colloids Surf. A Physicochem. Eng. Asp. 1998, 136, 133–150. [Google Scholar] [CrossRef]
  43. Joos, P.; Rillaerts, E. Theory on the determination of the dynamic surface tension with the drop volume and maximum bubble pressure methods. J. Colloid Interface Sci. 1981, 79, 96–100. [Google Scholar] [CrossRef]
  44. Harkins, W.D.; Brown, F.E. The determination of surface tension (free surface energy), and the weight of falling drops: The surface tension of water and benzene by the capillary height method. J. Am. Chem. Soc. 1919, 41, 499–524. [Google Scholar] [CrossRef]
  45. Wilkinson, M. Extended use of, and comments on, the drop-weight (drop-volume) technique for the determination of surface and interfacial tensions. J. Colloid Interface Sci. 1972, 40, 14–26. [Google Scholar] [CrossRef]
  46. Lee, B.-B.; Ravindra, P.; Chan, E.-S. New drop weight analysis for surface tension determination of liquids. Colloids Surf. A Physicochem. Eng. Asp. 2009, 332, 112–120. [Google Scholar] [CrossRef]
  47. Robertson, E.J.; Beaman, D.K.; Richmond, G.L. Designated drivers: The differing roles of divalent metal ions in surfactant adsorption at the oil–water interface. Langmuir 2013, 29, 15511–15520. [Google Scholar] [CrossRef] [PubMed]
  48. Berry, J.D.; Neeson, M.J.; Dagastine, R.R.; Chan, D.Y.C.; Tabor, R.F. Measurement of surface and interfacial tension using pendant drop tensiometry. J. Colloid Interface Sci. 2015, 454, 226–237. [Google Scholar] [CrossRef] [PubMed]
  49. Dill, K.A.; Bromberg, S. Molecular Driving Forces: Statistical Mechanics in Chemistry and Biology; Garland Science, Taylor and Francis: New York, NY, USA, 2003; Chapters 21 and 22. [Google Scholar]
  50. Andersson, M.P.; Olsson, M.H.M.; Stipp, S.L.S. Predicting the pKa and stability of organic acids and bases at an oil–water interface. Langmuir 2014, 30, 6437–6445. [Google Scholar] [CrossRef] [PubMed]
  51. Gershevitz, O.; Sukenik, C.N. In situ FTIR-ATR analysis and titration of carboxylic acid-terminated SAMs. J. Am. Chem. Soc. 2004, 126, 482–483. [Google Scholar] [CrossRef] [PubMed]
  52. Kanicky, J.R.; Shah, D.O. Effect of degree, type, and position of unsaturation on the pKa of long-chain fatty acids. J. Colloid Interface Sci. 2002, 256, 201–207. [Google Scholar] [CrossRef] [PubMed]
  53. Kanicky, J.R.; Shah, D.O. Effect of premicellar aggregation on the pKa of fatty acid soap solutions. Langmuir 2003, 19, 2034–2038. [Google Scholar] [CrossRef]
  54. Wellen, B.A.; Lach, E.A.; Allen, H.C. Surface pKa of octanoic, nonanoic, and decanoic fatty acids at the air–water interface: Applications to atmospheric aerosol chemistry. Phys. Chem. Chem. Phys. 2017, 19, 26551–26558. [Google Scholar] [CrossRef] [PubMed]
  55. Brosseau, Q.; Vrignon, J.; Baret, J.-C. Microfluidic dynamic interfacial tensiometry (μDIT). Soft Matter 2014, 10, 3066–3076. [Google Scholar] [CrossRef] [PubMed]
  56. Von Szyszkowski, B. Experimental studies on the capillary characteristics of watery solutions of fatty acids. Z. Phys. Chem. 1908, 64, 385–414. [Google Scholar]
  57. Rosen, M.J. Surfactants and Interfacial Phenomena, 3rd ed.; John Wiley & Sons: New York, NY, USA, 2004; p. 45. [Google Scholar]
  58. Braunschweig, B.; Schulze-Zachau, F.; Nagel, E.; Engelhardt, K.; Stoyanov, S.; Gochev, G.; Khristov, K.; Mileva, E.; Exerowa, D.; Miller, R.; et al. Specific effects of Ca2+ ions and molecular structure of β-lactoglobulin interfacial layers that drive macroscopic foam stability. Soft Matter 2016, 12, 5995–6004. [Google Scholar] [CrossRef] [PubMed]
  59. Jones, G.; Ray, W.A. The surface tension of solutions of electrolytes as a function of the concentration. I. A differential method for measuring relative surface tension. J. Am. Chem. Soc. 1937, 59, 187–198. [Google Scholar] [CrossRef]
  60. Kakati, A.; Sangwai, J.S. Effect of monovalent and divalent salts on the interfacial tension of pure hydrocarbon-brine systems relevant for low salinity water flooding. J. Pet. Sci. Eng. 2017, 157, 1106–1114. [Google Scholar] [CrossRef]
  61. Moeini, F.; Hemmati-Sarapardeh, A.; Ghazanfari, M.-H.; Masihi, M.; Ayatollahi, S. Toward mechanistic understanding of heavy crude oil/brine interfacial tension: The roles of salinity, temperature and pressure. Fluid Phase Equilib. 2014, 375, 191–200. [Google Scholar] [CrossRef]
  62. Petersen, P.B.; Johnson, J.C.; Knutsen, K.P.; Saykally, R.J. Direct experimental validation of the Jones–Ray effect. Chem. Phys. Lett. 2004, 397, 46–50. [Google Scholar] [CrossRef]
  63. Saien, J.; Mishi, M. Equilibrium interfacial tension and the influence of extreme dilutions of uni-univalent salts: An expression of the “Jones–Ray effect”. J. Chem. Thermodyn. 2012, 54, 254–260. [Google Scholar] [CrossRef]
  64. Nguyen, K.T.; Nguyen, A.V.; Evans, G.M. Interactions between halide anions and interfacial water molecules in relation to the Jones–Ray effect. Phys. Chem. Chem. Phys. 2014, 16, 24661–24665. [Google Scholar] [CrossRef] [PubMed]
  65. Uematsu, Y.; Bonthuis, D.J.; Netz, R.R. Charged surface-active impurities at nanomolar concentration induce Jones–Ray effect. J. Phys. Chem. Lett. 2018, 9, 189–193. [Google Scholar] [CrossRef] [PubMed]
  66. Langmuir, I. Repulsive forces between charged surfaces in water, and the cause of the Jones-Ray effect. Science 1938, 88, 430–432. [Google Scholar] [CrossRef] [PubMed]
  67. Okur, H.I.; Chen, Y.; Wilkins, D.M.; Roke, S. The Jones-Ray effect reinterpreted: Surface tension minima of low ionic strength electrolyte solutions are caused by electric field induced water-water correlations. Chem. Phys. Lett. 2017, 684, 433–442. [Google Scholar] [CrossRef]
  68. Heydweillwer, A. On the physical properties of solutions and their interactions. II. Surface tension and electrical conductivity of aqueous salts. Ann. Phys. 1910, 33, 145–185. [Google Scholar]
  69. Aveyard, R.; Saleem, S.M. Interfacial tensions at alkane-aqueous electrolyte interfaces. JCS Faraday Trans. 1 1976, 72, 1609–1617. [Google Scholar] [CrossRef]
  70. Wen, B.; Sun, C.; Bai, B.; Gatapova, E.Y.; Kabov, O.A. Ionic hydration-induced evolution of decane–water interfacial tension. Phys. Chem. Chem. Phys. 2017, 19, 14606–14614. [Google Scholar] [CrossRef] [PubMed] [Green Version]
  71. Bastos-González, D.; Pérez-Fuentes, L.; Drummond, C.; Faraudo, J. Ions at interfaces: The central role of hydration and hydrophobicity. Curr. Opin. Colloid Interface Sci. 2016, 23, 19–28. [Google Scholar] [CrossRef]
  72. Persson, I. Hydrated metal ions in aqueous solution: How regular are their structures? Pure Appl. Chem. 2010, 82, 1901–1917. [Google Scholar] [CrossRef]
  73. Dos Santos, A.P.; Levin, Y. Ions at the water–oil Interface: Interfacial tension of electrolyte solutions. Langmuir 2012, 28, 1304–1308. [Google Scholar] [CrossRef] [PubMed]
  74. Dos Santos, A.P.; Levin, Y. Surface and interfacial tensions of Hofmeister electrolytes. Faraday Discuss. 2013, 160, 75–87. [Google Scholar] [CrossRef] [Green Version]
  75. Ikeda, T.; Boero, M.; Terakura, K. Hydration properties of magnesium and calcium ions from constrained first principles molecular dynamics. J. Chem. Phys. 2007, 127, 074503. [Google Scholar] [CrossRef] [PubMed]
  76. Pavlov, M.; Siegbahn, P.E.M.; Sandström, M. Hydration of beryllium, magnesium, calcium, and zinc ions using density functional theory. J. Phys. Chem A 1998, 102, 219–228. [Google Scholar] [CrossRef]
  77. Hofmeister, F. Zur Lehre von der Wirkung der Salze. Arch. Exp. Pathol. Pharmakol. 1888, 24, 247–260. [Google Scholar] [CrossRef]
  78. Kunz, W.; Henle, J.; Ninham, B.W. ‘Zur Lehre von der Wirkung der Salze’ (about the science of the effect of salts): Franz Hofmeister’s historical papers. Curr. Opin. Colloid Interface Sci. 2004, 9, 19–37. [Google Scholar] [CrossRef]
  79. Collins, K.D.; Washabaugh, M.W. The Hofmeister effect and the behaviour of water at interfaces. Q. Rev. Biophys. 1985, 18, 323–422. [Google Scholar] [CrossRef] [PubMed]
  80. Lee, Y.; Thirumalai, D.; Hyeon, C. Ultrasensitivity of water exchange kinetics to the size of metal ion. J. Am. Chem. Soc. 2017, 139, 12334–12337. [Google Scholar] [CrossRef] [PubMed]
  81. Kherb, J.; Flores, S.C.; Cremer, P.S. Role of carboxylate side chains in the cation Hofmeister series. J. Phys. Chem. B 2012, 116, 7389–7397. [Google Scholar] [CrossRef] [PubMed]
  82. Einspahr, H.; Bugg, C.E. The geometry of calcium-carboxylate interactions in crystalline complexes. Acta Cryst. 1981, B37, 1044–1052. [Google Scholar] [CrossRef]
  83. Carrell, C.J.; Carrell, H.L.; Erlebacher, J.; Glusker, J.P. Structural aspects of metal ion-carboxylate interactions. J. Am. Chem. Soc. 1988, 110, 8651–8656. [Google Scholar] [CrossRef]
  84. Beaman, D.K.; Robertson, E.J.; Richmond, G.L. Metal ions: Driving the orderly assembly of polyelectrolytes at a hydrophobic surface. Langmuir 2012, 28, 14245–14253. [Google Scholar] [CrossRef] [PubMed]
  85. Papageorgiou, S.K.; Kouvelos, E.P.; Favvas, E.P.; Sapalidis, A.A.; Romanos, G.E.; Katsaros, F.K. Metal–carboxylate interactions in metal–alginate complexes studied with FTIR spectroscopy. Carbohydr. Res. 2010, 345, 469–473. [Google Scholar] [CrossRef] [PubMed]
  86. Lu, Y.; Miller, J.D. Carboxyl stretching vibrations of spontaneously adsorbed and LB-transferred calcium carboxylates as determined by FTIR internal reflection spectroscopy. J. Colloid Interface Sci. 2002, 256, 41–52. [Google Scholar] [CrossRef]
  87. Dhavskar, K.T.; Bhargao, P.H.; Srinivasan, B.R. Synthesis, crystal structure and properties of magnesium and calcium salts of p-anisic acid. J. Chem. Sci. 2016, 128, 421–428. [Google Scholar] [CrossRef]
  88. Tang, C.Y.; Huang, Z.; Allen, H.C. Binding of Mg2+ and Ca2+ to palmitic acid and deprotonation of the COOH headgroup studied by vibrational sum frequency generation spectroscopy. J. Phys. Chem. B 2010, 114, 17068–17076. [Google Scholar] [CrossRef] [PubMed]
  89. Tang, C.Y.; Huang, Z.; Allen, H.C. Interfacial water structure and effects of Mg2+ and Ca2+ binding to the COOH headgroup of a palmitic acid monolayer studied by sum frequency spectroscopy. J. Phys. Chem. B 2011, 115, 34–40. [Google Scholar] [CrossRef] [PubMed]
  90. Vogel, H.J.; Brokx, R.D.; Ouyang, H. Calcium-binding proteins. In Methods in Molecular Biology, Volume 172: Calcium-Binding Protein Protocols: Reviews and Case Studies; Vogel, H.J., Ed.; Humana Press Inc.: Totowa, NJ, USA, 2002; Volume 1, Chapter 1. [Google Scholar]
  91. Katz, A.K.; Glusker, J.P.; Beebe, S.A.; Bock, C.W. Calcium ion coordination: A comparison with that of beryllium, magnesium, and zinc. J. Am. Chem. Soc. 1996, 118, 5752–5763. [Google Scholar] [CrossRef]
  92. Dudev, T.; Lim, C. Monodentate versus bidentate carboxylate binding in magnesium and calcium proteins: What are the basic principles? J. Phys. Chem. B 2004, 108, 4546–4557. [Google Scholar] [CrossRef]
  93. Nara, M.; Morii, H.; Tanokura, M. Coordination to divalent cations by calcium-binding proteins studied by FTIR spectroscopy. Biochim. Biophys. Acta 2013, 1828, 2319–2327. [Google Scholar] [CrossRef] [PubMed]
  94. Dudev, T.; Cowan, J.A.; Lim, C. Competitive binding in magnesium coordination chemistry: Water versus ligands of biological interest. J. Am. Chem. Soc. 1999, 121, 7665–7673. [Google Scholar] [CrossRef]
  95. Williams, R.J.P. Calcium. In Methods in Molecular Biology, Volume 172: Calcium-Binding Protein Protocols: Reviews and Case Studies; Vogel, H.J., Ed.; Humana Press Inc.: Totowa, NJ, USA, 2002; Volume 1, Chapter 2. [Google Scholar]
  96. Collins, K.D. Ion hydration: Implications for cellular function, polyelectrolytes, and protein crystallization. Biophys. Chem. 2006, 119, 271–281. [Google Scholar] [CrossRef] [PubMed]
  97. Kiriukhin, M.Y.; Collins, K.D. Dynamic hydration numbers for biologically important ions. Biophys. Chem. 2002, 99, 155–168. [Google Scholar] [CrossRef]
  98. Shehata, A.M.; Nasr-El-Din, H.A. Laboratory investigations to determine effect of connate-water composition on Low-salinity waterflooding in sandstone reservoirs. SPE Reserv. Eval. Eng. 2017, 20, 59–76. [Google Scholar] [CrossRef]
  99. Lashkarbolooki, M.; Ayatollahi, S.; Riazi, M. The impacts of aqueous ions on interfacial tension and wettability of an asphaltenic–acidic crude oil reservoir during Smart Water injection. J. Chem. Eng. Data 2014, 59, 3624–3634. [Google Scholar] [CrossRef]
  100. Suleimanov, B.A.; Latifov, Y.A.; Veliyev, E.F.; Frampton, H. Comparative analysis of the EOR mechanisms by using low salinity and low hardness alkaline water. J. Pet. Sci. Eng. 2018, 162, 35–43. [Google Scholar] [CrossRef]
  101. Gonzalez, V.; Taylor, S.E. Physical and chemical aspects of “precursor films” spreading on water from natural bitumen. J. Pet. Sci. Eng. 2018, 170, 291–303. [Google Scholar] [CrossRef]
  102. Basu, S.; Sharma, M.M. Measurement of critical disjoining pressure for dewetting of solid surfaces. J. Colloid Interface Sci. 1996, 181, 443–455. [Google Scholar] [CrossRef]
  103. Collins, A.G. Geochemistry of Oilfield Waters; Developments in Petroleum Science; Elsevier: New York, NY, USA, 1976; Volume 1, Chapter 7. [Google Scholar]
  104. Sauerer, B.; Stukan, M.; Buiting, J.; Abdallah, W.; Andersen, S. Dynamic asphaltene-stearic acid competition at the oil–water interface. Langmuir 2018, 34, 5558–5573. [Google Scholar] [CrossRef] [PubMed]
  105. Alexander, A.E.; Teorell, T.; Åborg, G.C. A study of films at the liquid/liquid interface. Part III. A specific effect of calcium ions on kephalin monolayers. Trans. Faraday Soc. 1939, 35, 1200–1205. [Google Scholar] [CrossRef]
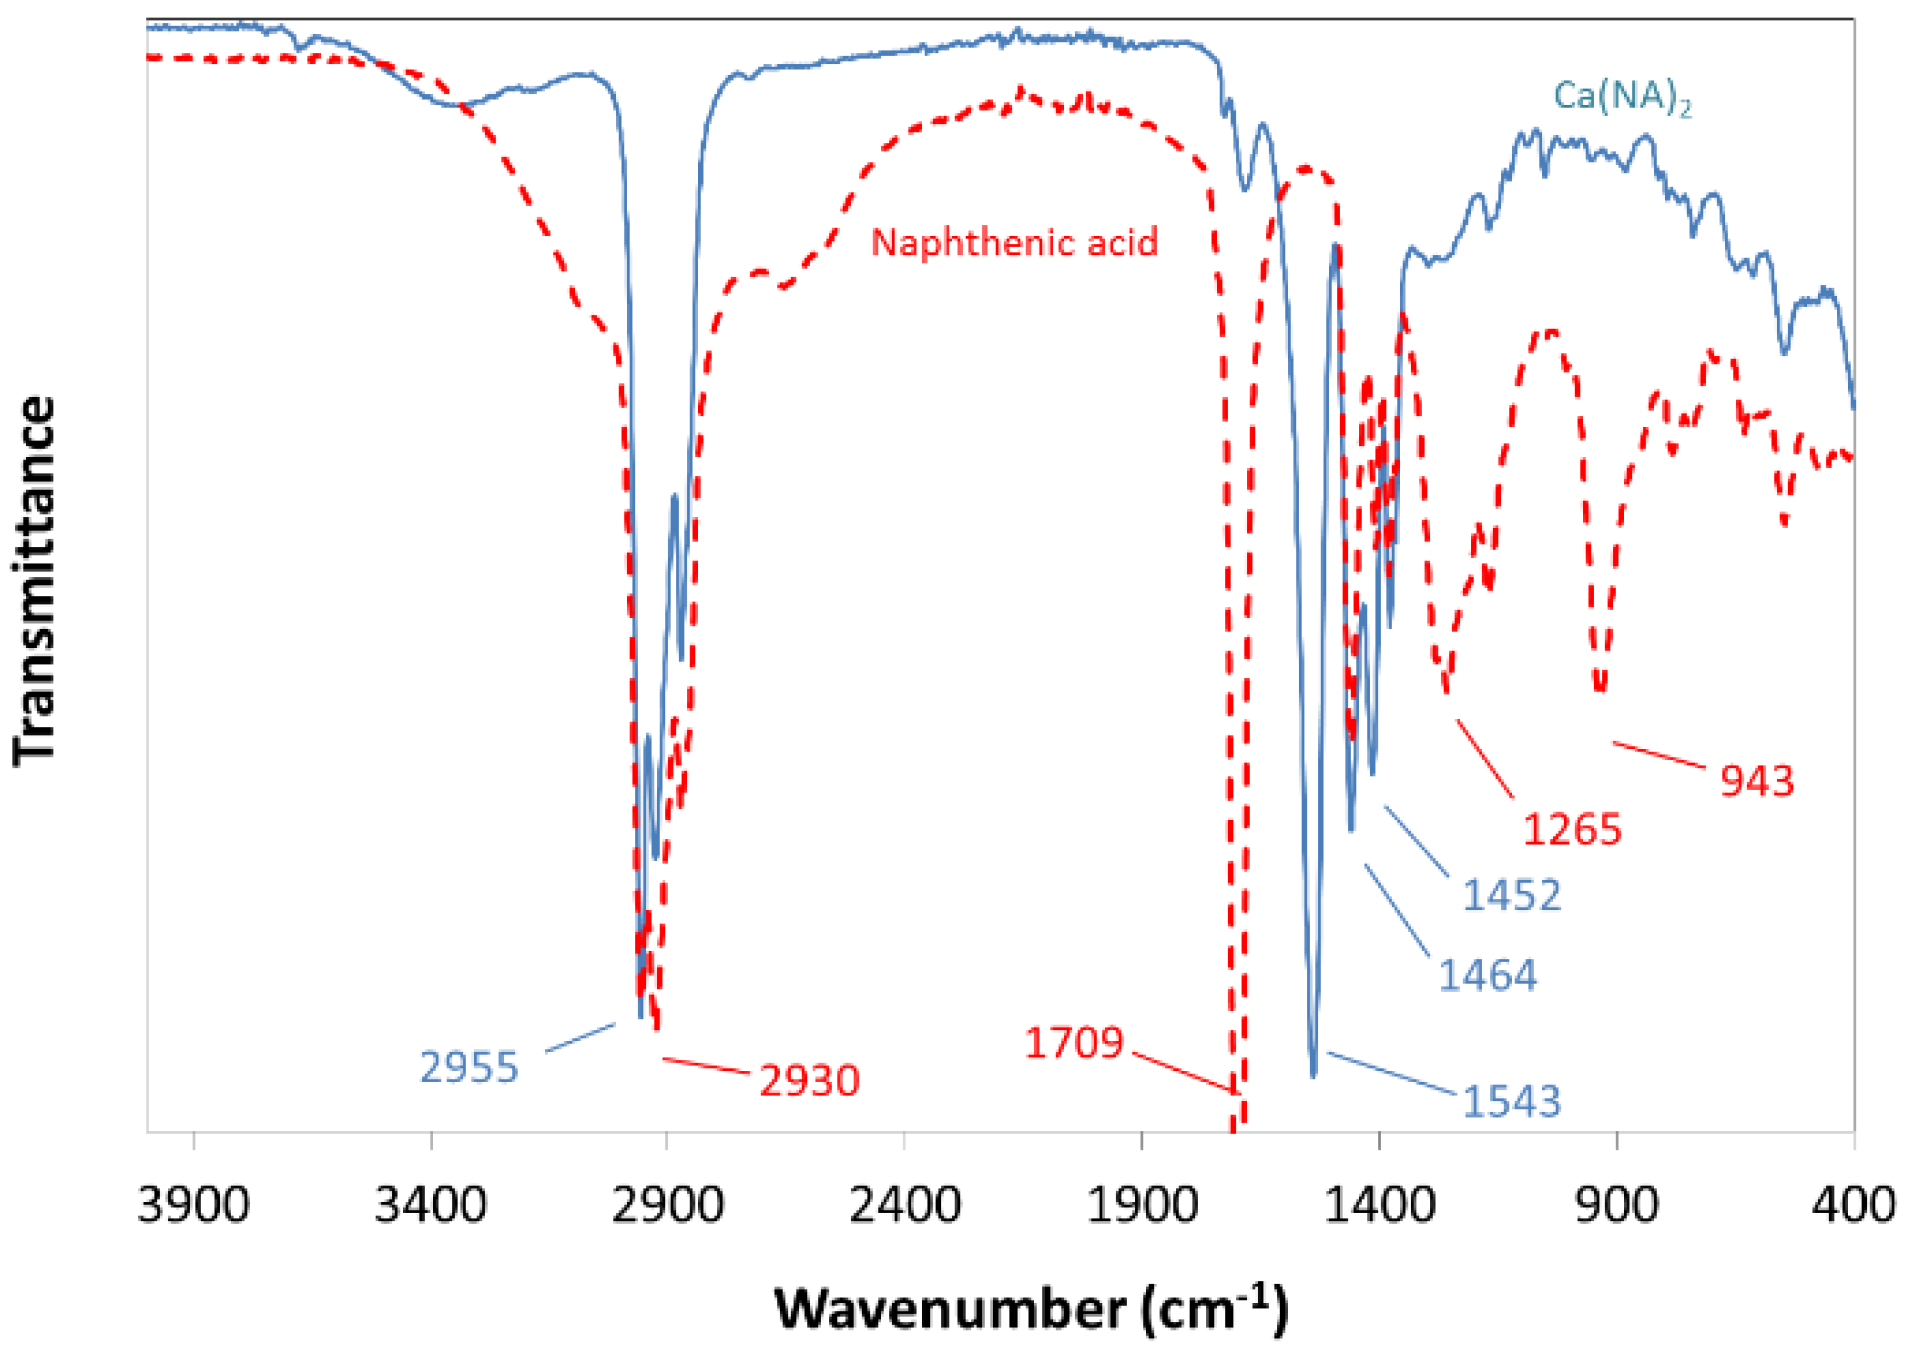
Figure 1. Attenuated Total Reflection (ATR)-infrared spectra of naphthenic acid (red, dashed) and its calcium salt (blue, continuous).
Colloids 02 00040 g001
Figure 2. (a) Examples of the dynamic interfacial tension of naphthenic acid solutions in n-heptane against deionized water. (b) Corresponding results against water containing 0.3 mol/L Ca2+. (c) Interfacial tension-log (naphthenic acid concentration) profiles for deionized water and the individual γi and γ contributions for 0.3 mol/L Ca2+ (see Equation (8)). The inset shows the corresponding plot for n-heptane solutions of Ca(NA)2 against deionized water. All curves are fits to the Szyszkowski equation (Equation (9)). (d) The effect of Ca2+ concentration on the interfacial tension of the n-heptane/water interface. The line is based on the empirical equation γ = γ00.5 + as described in the text.
Colloids 02 00040 g002
Figure 3. (a) Interfacial tension-log (naphthenic acid concentration) profiles at the n-heptane/water interface in the presence of the indicated cations (all chloride salts at 1 mol/L). (b) Corresponding profiles for different aqueous Ca2+ concentrations. The blue and red curves represent the respective limiting conditions for deionized water and a “Ca2+-saturated” interface, and the gray curves are derived from Equation (13).
Colloids 02 00040 g003
Figure 4. The effect of Ca2+ concentration on the interaction factor φ used in the construction of the fitted curves in Figure 3b.
Colloids 02 00040 g004
Figure 5. (a) The effect of NA concentration on the first-order kinetic rate constant for equilibration of the n-heptane/water interfacial tension in the presence of 0.3 mol/L Ca2+ ions. The inset shows the second-order plot for low NA concentrations. (b) The effect of Ca2+ concentration on the second-order rate constant in the low NA concentration range (red and blue symbols are for CNA = 5 and 10 mg/L, respectively).
Colloids 02 00040 g005
Figure 6. Bonding modes identified for divalent ion interactions with carboxylates [47,84,85,86]. 1:1 coordination is shown in binding modes (a) and (b), with bridging exhibited in (c). (d) shows ionic bonding.
Colloids 02 00040 g006
Figure 7. (a) The effect of Ca2+ ion concentration (expressed here in mg/L) on the minimum interfacial tension of the n-heptane/water interface when NA is in excess. (b) Schematic of an oil drop adhering to a rock surface in water showing the three-phase contact point defining the contact angle. (c) Demonstrating the effect of a decrease in Ca2+ concentration from 20,000 mg/L to 5000 mg/L on the final contact angle for different initial contact angles, and a simulated visual result on a sand surface to illustrate.
Colloids 02 00040 g007
Table 1. Summary of the adsorption parameters for NA in the presence and absence of Ca2+ ions based on the Szyszkowski equation.
Interface SpeciesΓm (mol/m2)Molecular Area (nm2)ΔG0 (kJ/mol)
NA1.58 × 10−61.05−27.9
NA + Ca2+ (i)1.66 × 10−50.10−27.5
NA + Ca2+ (∞)1.60 × 10−61.04−48.7
Ca(NA)23.34 × 10−60.50−29.1
Table 2. Na+ and Ca2+ compositions of formation waters from different geologic periods. For comparison, sea water contains ~10,500 mg/L Na+ and ~400 mg/L Ca2+. Data compiled from Collins [103].
Geologic PeriodAverage (Maximum) Metal Ion Concentration (mg/L)
Na+Ca2+
Oligocene/Paleogene39,000 (103,000)2530 (38,800)
Cretaceous31,000 (88,600)7000 (37,400)
Jurassic57,300 (120,000)25,800 (56,300)
Permian47,000 (109,000)8600 (22,800)
Carboniferous (Pennsylvanian)43,000 (101,000)9100 (205,000)
Carboniferous (Mississippian)41,500 (115,800)8900 (37,800)
Devonian48,000 (101,000)18,000 (129,000)