Article

Machine Learning Prediction Models of Beneficial and Toxicological Effects of Zinc Oxide Nanoparticles in Rat Feed

Research Institute of Digital Intelligent Technologies, Orenburg State University, Pobedy Pr. 13, Orenburg 460018, Russia
*
Author to whom correspondence should be addressed.
Mach. Learn. Knowl. Extr. 2025, 7(3), 91; https://doi.org/10.3390/make7030091 (registering DOI)
Submission received: 19 June 2025 / Revised: 5 August 2025 / Accepted: 23 August 2025 / Published: 29 August 2025

Abstract

Nanoparticles have found widespread application across diverse fields, including agriculture and animal husbandry. However, a persistent challenge in laboratory-based studies involving nanoparticle exposure is the limited availability of experimental data, which constrains the robustness and generalizability of findings. This study presents a comprehensive analysis of the impact of zinc oxide nanoparticles (ZnO NPs) in feed on elemental homeostasis in male Wistar rats. Using correlation-based network analysis, a correlation graph weight value of 15.44 and a newly proposed weighted importance score of 1.319 were calculated, indicating that a dose of 3.1 mg/kg represents an optimal balance between efficacy and physiological stability. To address the issue of limited sample size, synthetic data generation was performed using generative adversarial networks, enabling data augmentation while preserving the statistical characteristics of the original dataset. Machine learning models based on fully connected neural networks and kernel ridge regression, enhanced with a custom loss function, were developed and evaluated. These models demonstrated strong predictive performance across a ZnO NP concentration range of 1–150 mg/kg, accurately capturing the dependencies of essential element, protein, and enzyme levels in blood on nanoparticle dosage. Notably, the presence of toxic elements and some other elements at ultra-low concentrations exhibited non-random patterns, suggesting potential systemic responses or early indicators of nanoparticle-induced perturbations and probable inability of synthetic data to capture the true dynamics. The integration of machine learning with synthetic data expansion provides a promising approach for analyzing complex biological responses in data-scarce experimental settings, contributing to the safer and more effective application of nanoparticles in animal nutrition.

1. Introduction

Nanoparticles, defined as materials with dimensions measured in nanometers (typically between 1 and 100 nanometers), have revolutionized various fields, transforming the way scientists approach research and industrial applications. The unique properties of nanoparticles, such as their high surface area, reactivity, and ability to interact with biological systems, have made them increasingly valuable tools in multiple disciplines. In agriculture, nanoparticles have the potential to significantly impact animal husbandry, particularly in the areas of animal health and nutrition [1]. For example, nanoparticles can be used as feed additives to enhance the nutritional value of animal feed, promote animal health, and improve feed efficiency. Furthermore, nanoparticles can be employed in veterinary medicine [2] to develop targeted treatments for animal diseases, reducing the need for antibiotics and other harsh chemicals.
Remarkable progress was achieved in developing and implementing nanoparticle-based solutions to address challenges in livestock production systems [3]. With increased adoption of nanoparticles in animal husbandry, recent research has prioritized a comprehensive evaluation of their environmental impact. Kolesnikov et al. [4] conducted extensive microcosm experiments, assessing the effects of metal-based nanoparticles on soil microbial communities when introduced through animal waste. The study revealed that zinc oxide (ZnO) nanoparticles at concentrations exceeding 100 mg/kg significantly altered soil enzyme activities and microbial diversity in Cambisol soils. Despite their numerous benefits, the toxicity of nanoparticles, in practice, remains a significant concern [5]. As nanoparticles are increasingly used in various applications, it is essential to assess their potential risks and develop strategies for safe handling, use, and disposal. This requires a deeper understanding of the factors that influence nanoparticle toxicity, such as their size, shape, surface chemistry, and reactivity. Moreover, the development of standardized protocols for the assessment of nanoparticle toxicity is crucial for ensuring the safe use of these materials in agriculture and other fields. Machine learning (ML) algorithms can enhance and improve the simulation and modeling process for nanotoxicology [6]. By leveraging the power of ML, researchers can develop more accurate and reliable models to assess the harmful effects of nanoparticles.
This article explores the beneficial and toxicological effects of zinc oxide nanoparticles in the feed of laboratory animals and the use of machine learning models to address the small data challenge and to predict potential toxic doses. The rest of this article is organized as follows. Section 2 provides the literature review on the use of nanoparticles in animal husbandry and the problem of the limited availability of experimental data. Section 3 provides the materials and methods used to analyze experimental data, generate new data, and set up custom regression models for a prediction problem. Section 4 provides a comparison of implemented machine learning models for predicting the levels of elements, proteins, and ferments in blood, depending on the ZnO nanoparticle dose. Section 5 summarizes the discussion.

2. Literature Review

Nanoparticles in animal husbandry can exhibit varying levels of toxicity, which are crucial to assess. Saeed et al. [7] discussed the toxicity of different metal/metal oxide nanoparticles used as feed additives, emphasizing the need for careful evaluation of their safety in livestock. Naumenko et al. [8] noted that metal nanoparticles exhibit toxic parameters that limit their use in animal husbandry. The toxicokinetics vary, necessitating careful dosages to meet safety criteria while maximizing benefits like enhanced productivity and antioxidant properties in poultry farming. Rahman et al. [9] studied toxicological aspects of zinc oxide nanoparticles in animals. Zinc oxide nanoparticles (ZnO-NPs) can exhibit toxicity in animal husbandry, leading to adverse side effects. While they offer benefits such as improved absorption and antimicrobial properties, their use requires careful regulation to mitigate potential harmful consequences. Bąkowski et al. [10] reviewed the effects of silver and zinc nanoparticles in animal nutrition. The authors concluded that nanoparticles in animal husbandry can induce toxicity, causing pathological changes in tissues such as the pancreas, kidney, and liver. They may also lead to inflammatory responses, cell death, and potential nervous system malfunctions, necessitating caution in their use. Tsekhmistrenko et al. [11] studied the usage of nanoparticles of metals and non-metals in animal husbandry. The authors concluded that nanoparticles can exhibit toxicity in poultry farming, influenced by their form and source. Their interactions may affect bioavailability, metabolism, and excretion rates, necessitating further research to understand their safety and efficacy in livestock production. Hardy et al. [12] studied the application of nanoscience and nanotechnologies in the food and feed chain. The authors noted that nanoparticles may pose toxicity risks in animal husbandry, affecting reproduction, development, and immune responses. Toxicokinetics, local gastrointestinal effects, and specific testing for immunotoxicity and neurotoxicity are crucial for assessing their safety in feed applications. Elalfy et al. [13] studied the usefulness and adverse effects of nanoparticles in animal husbandry. Nanoparticles exhibit toxic effects, impacting the liver, lungs, skin, eyes, and reproductive health. Their toxicity arises from increased concentrations in non-target tissues, leading to genotoxicity, oxidative stress, and hemotoxic effects, adversely affecting healthy tissues. Lutkovskaya et al. [14] studied the impact of ultrafine trace elements in ruminant diets on productivity and health. The paper highlights that while ultrafine particles can enhance animal health and productivity, their accumulation may lead to cell death or pathological changes. The authors noted that further research is essential to assess the safety and potential toxicity of nanoparticles in animal husbandry. Vanivska et al. [15] studied the toxicity effects of nanoparticles on animal and human organisms. The review highlighted that nanoparticles can induce oxidative stress, inflammatory responses, and cell damage in animal organisms, with effects varying by nanoparticle size, shape, and composition. Shivaswamy et al. [16] studied the in vivo and in vitro toxicity of nanomaterials in animal systems. The authors noted that nanoparticle toxicity in animal husbandry is a growing concern due to the increasing environmental presence of nanomaterials. Assessing their short-term and long-term effects on animals is crucial, as existing toxicity assessment methods are inadequate for these smaller-sized materials. Sharma et al. [17] discussed nanotoxicity mechanisms, plausible mitigation strategies, and the effects on biological systems, including organs like the liver, brain, kidneys, and lungs. Pradhan et al. [18] noted that nanotoxicity affects animal behavior and development, with various factors like size and shape influencing toxicity levels. The authors concluded that reactive oxygen species are primary toxic agents. Parashar et al. [19] discussed nanoparticle toxicity, highlighting their adverse effects on various organisms, including cytotoxicity, embryotoxicity, and DNA damage in in vivo models like rats and rabbits, which could have implications for animal husbandry and livestock health. Bisla et al. [20] reviewed toxicological studies on metallic nanoparticles, highlighting their harmful effects on male germ cells in humans and animals, emphasizing the need to evaluate their impact on spermatozoa in animal husbandry due to increasing industrial applications. Dianová et al. [21] reviewed the toxicity of metal nanoparticles (Ag, ZnO, TiO2) in animal studies, highlighting their adverse effects on male and female reproductive health, including decreased sperm motility, ovarian accumulation, and conditions like polycystic ovary syndrome and inflammation.
Nanoparticles have the potential to revolutionize animal husbandry by improving productivity, enhancing health, and serving as effective feed additives. However, their use is not without risks, as they can exhibit toxicity that may harm animal health and the environment. To fully realize the benefits of nanoparticles, it is essential to carefully evaluate their safety and efficacy through comprehensive research and regulatory frameworks. Table 1 aggregates the results obtained in the studies on the benefits and toxicity of nanoparticles in animal husbandry.
Sial et al. [22] reviewed the impact of ZnO nanoparticles on organ systems in rats. The authors concluded that ZnO nanoparticles induce toxicity in rats through various exposure routes, primarily affecting the liver, kidneys, and lungs. Sharif et al. [23] reviewed the toxic effects of metallic nanoparticles on the rat spleen. The authors noted that silver, copper, and gold nanoparticles induce toxicity in rats by generating reactive oxygen species, leading to oxidative stress, cell membrane damage, and histopathological changes in the spleen, including vacuolation, altered architecture, and cell necrosis. Shafiq et al. [24] studied the toxicity effects of magnesium oxide nanoparticles (MgO) on the liver in male rats. The study found that MgO nanoparticles caused significant liver toxicity in male rats, evidenced by increased liver enzymes (AST, ALT, ALP) and histopathological changes, including hepatocyte atrophy, necrosis, and inflammatory cell infiltration, indicating potential health risks. Verma et al. [25] studied the effects of iron oxide nanoparticles in Wistar rats. Iron oxide nanoparticles (IONPs) caused dose-dependent toxicity in Wistar rats, affecting the lungs, liver, and kidneys. Subchronic exposure led to significant body weight reduction, hepatic damage, altered serum creatinine, and blood urea nitrogen levels, indicating notable health implications. Ali et al. [26] studied the impact of silica and silica-based nanoparticles on serological parameters and genotoxicity in Rattus norvegicus rats. The study found that crystalline silica nanoparticles (C-SiO2) caused severe histopathological alterations and significantly affected 95% of serological parameters, DNA damage, and oxidative stress parameters in rats, indicating high toxicity. Silver–silica and zinc–oxide–silica nanoparticles showed lesser effects. Yousef et al. [27] studied the toxic effects of aluminum oxide and zinc oxide nanoparticles in rats. The study revealed that aluminum oxide and zinc oxide nanoparticles induce neurotoxicity, cardiotoxicity, and lung toxicity in rats, as evidenced by increased oxidative stress, altered cytokine production, and significant changes in gene expression, particularly when nanoparticles are combined. Moshrefi et al. [28] studied the toxicological effects of zinc oxide nanoparticles on the brain and heart structures of male Wistar rats. Zinc oxide nanoparticles caused significant toxicity in male Wistar rats, leading to heart and brain lesions, increased bioaccumulation, elevated serum creatine phosphokinase levels, and behavioral impairments, particularly at doses exceeding 25 mg/kg. Rehman et al. [29] studied the toxicological effects of colloidal silver nanoparticles on rat health. The study evaluated colloidal silver nanoparticle toxicity in rats, revealing minimal effects on food intake, water consumption, and behavior. However, high-dose exposure (100 μg/kg/day) led to significant body weight reduction and potential liver enzyme alterations, necessitating further investigation. Jarrar et al. [30] studied the toxicity of metallic and metallic oxide nanoparticles in rats. The study found that metallic and metal oxide nanoparticles caused significant mitochondrial ultrastructural alterations in the hepatocytes and renal cells of rats, leading to cell injury. Key changes included cristolysis, swelling, and membrane disruption, indicating targeted toxicity of nanoparticles. Sutunkova et al. [31] studied the acute toxicity of lead oxide nanoparticles in rats. Inhalation exposure to lead oxide nanoparticles in rats resulted in increased granulocyte counts, elevated reticulocyte percentages, and a significant neutrophil response in bronchoalveolar lavage fluid, indicating both general toxic and cytotoxic effects, highlighting the need for further research on safe exposure levels.
While the studies highlight the significant toxic effects of some nanoparticles in rats, it is essential to consider that the biological responses may vary based on nanoparticle composition, size, and exposure duration, necessitating a nuanced understanding of their safety profiles in biomedical applications. Table 2 aggregates the results obtained in the studies on the toxicological effects of various nanoparticles in rats.
The problem of small data in scientific research poses significant challenges for machine learning applications, as limited datasets often lead to poor model performance and hinder reproducibility. To address this issue, ML methods have emerged as powerful tools for generating synthetic data, thereby enhancing the training datasets available for model development. DaCosta et al. [32] presented a Python v3.7 package to generate complex nanoscale atomic structures for creating large, simulated datasets for training neural networks. The authors trained a series of neural networks on various subsets of simulated databases to segment nanoparticles. Danai Varsou et al. [33] highlighted the challenge of limited data availability in nanoparticle toxicity assessments. The authors addressed this challenge by employing synthetic data generation techniques (SMOTE and ADASYN) in the form of an automated machine learning (autoML) scheme. Kumari Khadka et al. [34] focused their research on synthetic data generation using combinatorial testing and a variational autoencoder (CT-VAE). The authors concluded that machine learning models trained with synthetic data could achieve performance similar to models trained with real data. Dou et al. [35] summarized and analyzed several potential solutions to small data challenges in chemical and biological sciences. The authors noted that ML methods, including generative adversarial networks (GANs), U-Net, and graph neural networks (GNNs), can generate synthetic data, enhance model training, and improve predictive performance in small datasets. Goyal et al. [36] reviewed synthetic data generation techniques using generative AI to address the data scarcity problem. The authors noted that GANs and VAEs can generate synthetic datasets, preserving original patterns while mitigating privacy concerns.
An analysis of state-of-the-art publications underscores the increasing relevance and application of nanoparticles in the field of animal husbandry, particularly for enhancing feed efficiency and improving disease resistance. However, a critical challenge associated with the application of nanoparticles in biological systems is the assessment of their potential toxicity, especially following chronic exposure. Furthermore, experimental investigations into nanoparticle effects are often constrained by the limited dimensionality of laboratory data, stemming from high costs, ethical constraints, and logistical limitations in animal experimentation. In this context, generative machine learning models present a promising avenue for synthesizing biologically plausible datasets, thereby enabling more robust statistical inference and predictive modeling. Unlike previous studies that primarily focused on histopathological or biochemical markers of toxicity, our research focused on the comprehensive assessment of elemental homeostasis in laboratory rats exposed to varying dietary concentrations of ZnO NPs. In this paper, we propose the development of concentration-dependent predictive models using advanced regression and machine learning techniques. These models integrate experimental data to forecast changes in elemental balance, offering insights into safe usage thresholds.
Our study is novel in several aspects, as follows:
  • We developed a weighted importance score based on feature importance and element groups, and an integral indicator of efficiency and safety to assess the optimal dosage of zinc oxide nanoparticles in rat feed;
  • We implemented a fully connected feedforward artificial neural network and kernel ridge regression model with a new custom loss function;
  • We studied the possibility of generating reliable synthetic data for the problem of low-dimensional experimental data.
Our study makes several contributions to the field of nanoparticle safety in animal husbandry, as follows:
  • We studied the effect of zinc oxide nanoparticles in feed on elemental homeostasis in rats;
  • We determined the optimal dosage of zinc oxide nanoparticles in terms of beneficial and toxicological effects;
  • We built predictions of the levels of essential and toxic elements, proteins, and enzymes, depending on the concentration of zinc oxide nanoparticles in the range from 1 mg/kg to 150 mg/kg.

3. Materials and Methods

3.1. Data Preprocessing

The experimental study was conducted in the biological clinic of the Federal Scientific Center for Biological Systems and Agrotechnology of the Russian Academy of Sciences (Orenburg) on male Wistar rats.
In total, 35 laboratory animals were randomly divided into 7 separate groups—the negative control group (C) received a standard AIN-93M diet [37] and bottled drinking water; in the positive control group (C+), alimentary Zn deficiency was modeled by feeding animals with semi-synthetic zinc-deficient feed and drinking deionized water; experimental group I received zinc-deficient feed, deionized water, and intragastrically administered zinc oxide (ZnO) at a dose of 6.2 mg/kg body weight; experimental group II (100%) received zinc-deficient feed, deionized water, and intragastrically administered zinc oxide nanoparticles (ZnO NPs) at a dose of 6.2 mg/kg body weight; experimental group III (50%) received zinc-deficient feed, deionized water, and intragastrically administered NP-ZnO at a dose of 3.1 mg/kg body weight; experimental group IV (25%) received zinc-deficient feed, deionized water, and intragastrically administered NP-ZnO at a dose of 1.55 mg/kg body weight; experimental group V received zinc-deficient feed, deionized water, and intragastrically administered NP-ZnO at a dose of 150 mg/kg body weight. Zinc oxide nanoparticles had a size of 329 nm and a zeta potential of 87.8 ± 3.5 mV. The experiment was conducted for 28 days.
Blood was collected from the cardiac artery into VACUETTE vacuum tubes with a blood coagulation activator and gel for separating red blood cells (Greiner Bio-One International AG, Kremsmünster, Austria). The elemental composition of the obtained biosamples was studied for more than 20 parameters, including calcium (Ca), phosphorus (P), potassium (K), sodium (Na), magnesium (Mg), iron (Fe), zinc (Zn), copper (Cu), manganese (Mn), cobalt (Co), chromium (Cr), selenium (Se), iodine (I), nickel (Ni), arsenic (As), vanadium (V), lead (Pb), cadmium (Cd), tin (Sn), mercury (Hg), strontium (Sr), beryllium (Be), boron (B), silicon (Si), and lithium (Li). The levels of elements were determined by inductively coupled plasma mass spectrometry (ICP-MS) using a NexION 300D mass spectrometer (Perkin Elmer NexION 300D ICP Mass Spectrometer, Waltham, MA, USA). The elements have been widely studied [38,39] and can be divided into the following four groups:
  • Essential microelements: Fe, Zn, Cu, Mn, Co, Se, I, Cr;
  • Toxic microelements: Sn, Al, As, Hg, Pb, Be, Cd;
  • Macroelements: Na, Ca, P, K, Mg;
  • Partially essential elements: B, Si, V, Ni, Li.
Determination of alkaline phosphatase (ALP), carbonic anhydrase (CA4), alcohol dehydrogenase (ADH1B), alpha-2-zinc glycoprotein (ZAG), zinc-dependent superoxide dismutase (SOD-Zn), metallothionein-1 (MT-1), metallothionein-2 (MT-2), and metallothionein-3 (MT-3) in these biosubstrates was carried out by enzyme immunoassay using appropriate reagent kits (Cloud-Clone Corp., Wuhan, China).
The data received from the laboratory in XLSX format (size 35 × 147) contained information on samples, where the rows corresponded to the objects of study, and the columns reflected the levels of chemical elements in the blood, liver, kidneys, brain, and muscles, and the concentrations of zinc-dependent enzymes and proteins. The first stage of data preprocessing involved the analysis and filling of missing values; gaps were found in 25 columns associated with microelements in muscles (for the positive control group C+) and brain (for the negative control group C). To fill them, we used the average values of the corresponding features within the experimental groups, which preserved the group specificity of the data. In 14 columns (Be, Cd, Hg, Sn in different tissues), we can observe categorical values “<0.0001”, denoting results below the sensitivity threshold of the laboratory equipment. These values were replaced by a numeric constant—the lower limit of sensitivity (0.0001)—in order to avoid data loss and preserve information about the presence of the element. After that, we searched for outliers using the interquartile range (IQR). For each feature, we calculated the 25th (Q1) and 75th (Q3) percentiles, defined the outlier boundaries as Q1—1.5 × IQR (lower) and Q3 + 1.5 × IQR (upper), and replaced the values outside these boundaries with the closest acceptable ones (for example, the upper or lower boundary). This helps minimize the impact of anomalies on subsequent analysis without completely deleting the data. Then, we standardized the features using the StandardScaler method, converting all numeric variables to a single scale (mean = 0, standard deviation = 1), which is necessary for the correct operation of machine learning algorithms. The categorical feature “Experimental group” is converted to a numeric format.
For clarity, we will use the following data annotations in the paper:
  • EH_1—original data on element content;
  • EH_2—original data on proteins and enzymes content;
  • EH_Synt_1—synthetic data on element content;
  • EH_Synt_2—synthetic data on proteins and enzymes content.
To determine the optimal concentration of ZnO nanoparticles, we introduce a custom weighted importance score as follows: Let C = { c 1 , c 2 , , c n } be a set of chemical elements (columns in EH_1 data), and R = { r 1 , r 2 , , r m } be a set of rat objects (rows in EH_1 data). Let G ( c i ) be a group of elements c i , where
G ( c i ) = 1 : Essential ;   G ( c i ) = 0.5 : Partially   essential ;   G ( c i ) = 1 : Toxic .
Let I ( c i ) be an importance coefficient of element c i , calculated using the random forest feature importance method. Let W ( c i ) be a final weight for element c i , defined as follows:
W ( c i ) = I ( c i ) G ( c i ) .
Let X ( r j , c i ) be a value of element c i in row (rat object) r j . Let S ( r j ) be a weighted score for rat r j , defined as follows:
S ( r j ) = i = 1 n X ( r j , c i ) W ( c i ) .
Let E k R be the subset of rats in experimental group k. The average weighted importance score for group k is as follows:
S ¯ ( k ) = 1 E k r j E k S ( r j ) .
Let us formulate a problem of multicriteria optimization to select an optimal experimental group based on ZnO nanoparticle dosage. Let Z d denote the zinc level in the blood in group d, Balance d denote the microelement balance index in group d, and Toxicity d denote the toxicity index in group d. For each group d, we calculate the following values:
  • 1. Zinc recovery efficacy (relative to the norm), defined as follows:
    Efficacy d = Z d Z C + Z C Z C + .
  • 2. Balance of elemental composition (average deviation from the norm), defined as follows:
    Balance d = 1 L l = 1 L exp ( μ l , d μ l , C ) 2 2 ( c σ j , C ) 2 ,   Balance d ( 0 , 1 ] ,
    where L is the number of elements, μ l , d is the average level of the l-th element in group d, μ l , C and σ j , C denote the average level and standard deviation of the l-th element in the negative control group C.
  • 3. Toxicity (deviation of toxic elements) is defined as follows:
    Toxicity d = max 0 , 1 P p = 1 P μ p , d μ p , C 2 σ p , C ,
    where P is the number of toxic microelements, μ p , d is the average level of the p-th toxic element in group d, and μ p , C and σ p , C are the average level and standard deviation of the p-th toxic element in the negative control group C.
The integral indicator of efficiency and safety score is defined as follows:
IIES d = w e Efficacy d + w b Balance d w t Toxicity d ,
where the we, wb, and wt weights reflect the importance of each criterion. The assigned weights are as follows: wt = 2, wb = 1, and we = 2. This weighting scheme is justified by the prioritization of environmental safety—emphasizing toxicity minimization—and process efficiency in zinc recovery, which are considered more critical than functional performance indicators in the context of the present analysis.
The optimal dose of nanoparticles is defined as follows:
d * = arg max d { GI ,   GII ,   GIII ,   GIV ,   GV } IIES d .
The proposed approach is robust since it is resistant to outliers and does not require the assumption of normal distribution; the approach is biologically relevant, since elements with small σ make a greater contribution, and natural variability is automatically considered; it is comparable, since a single scale is used for different elements and an integral balance assessment is applied.

3.2. Synthetic Data Generation and Evaluation

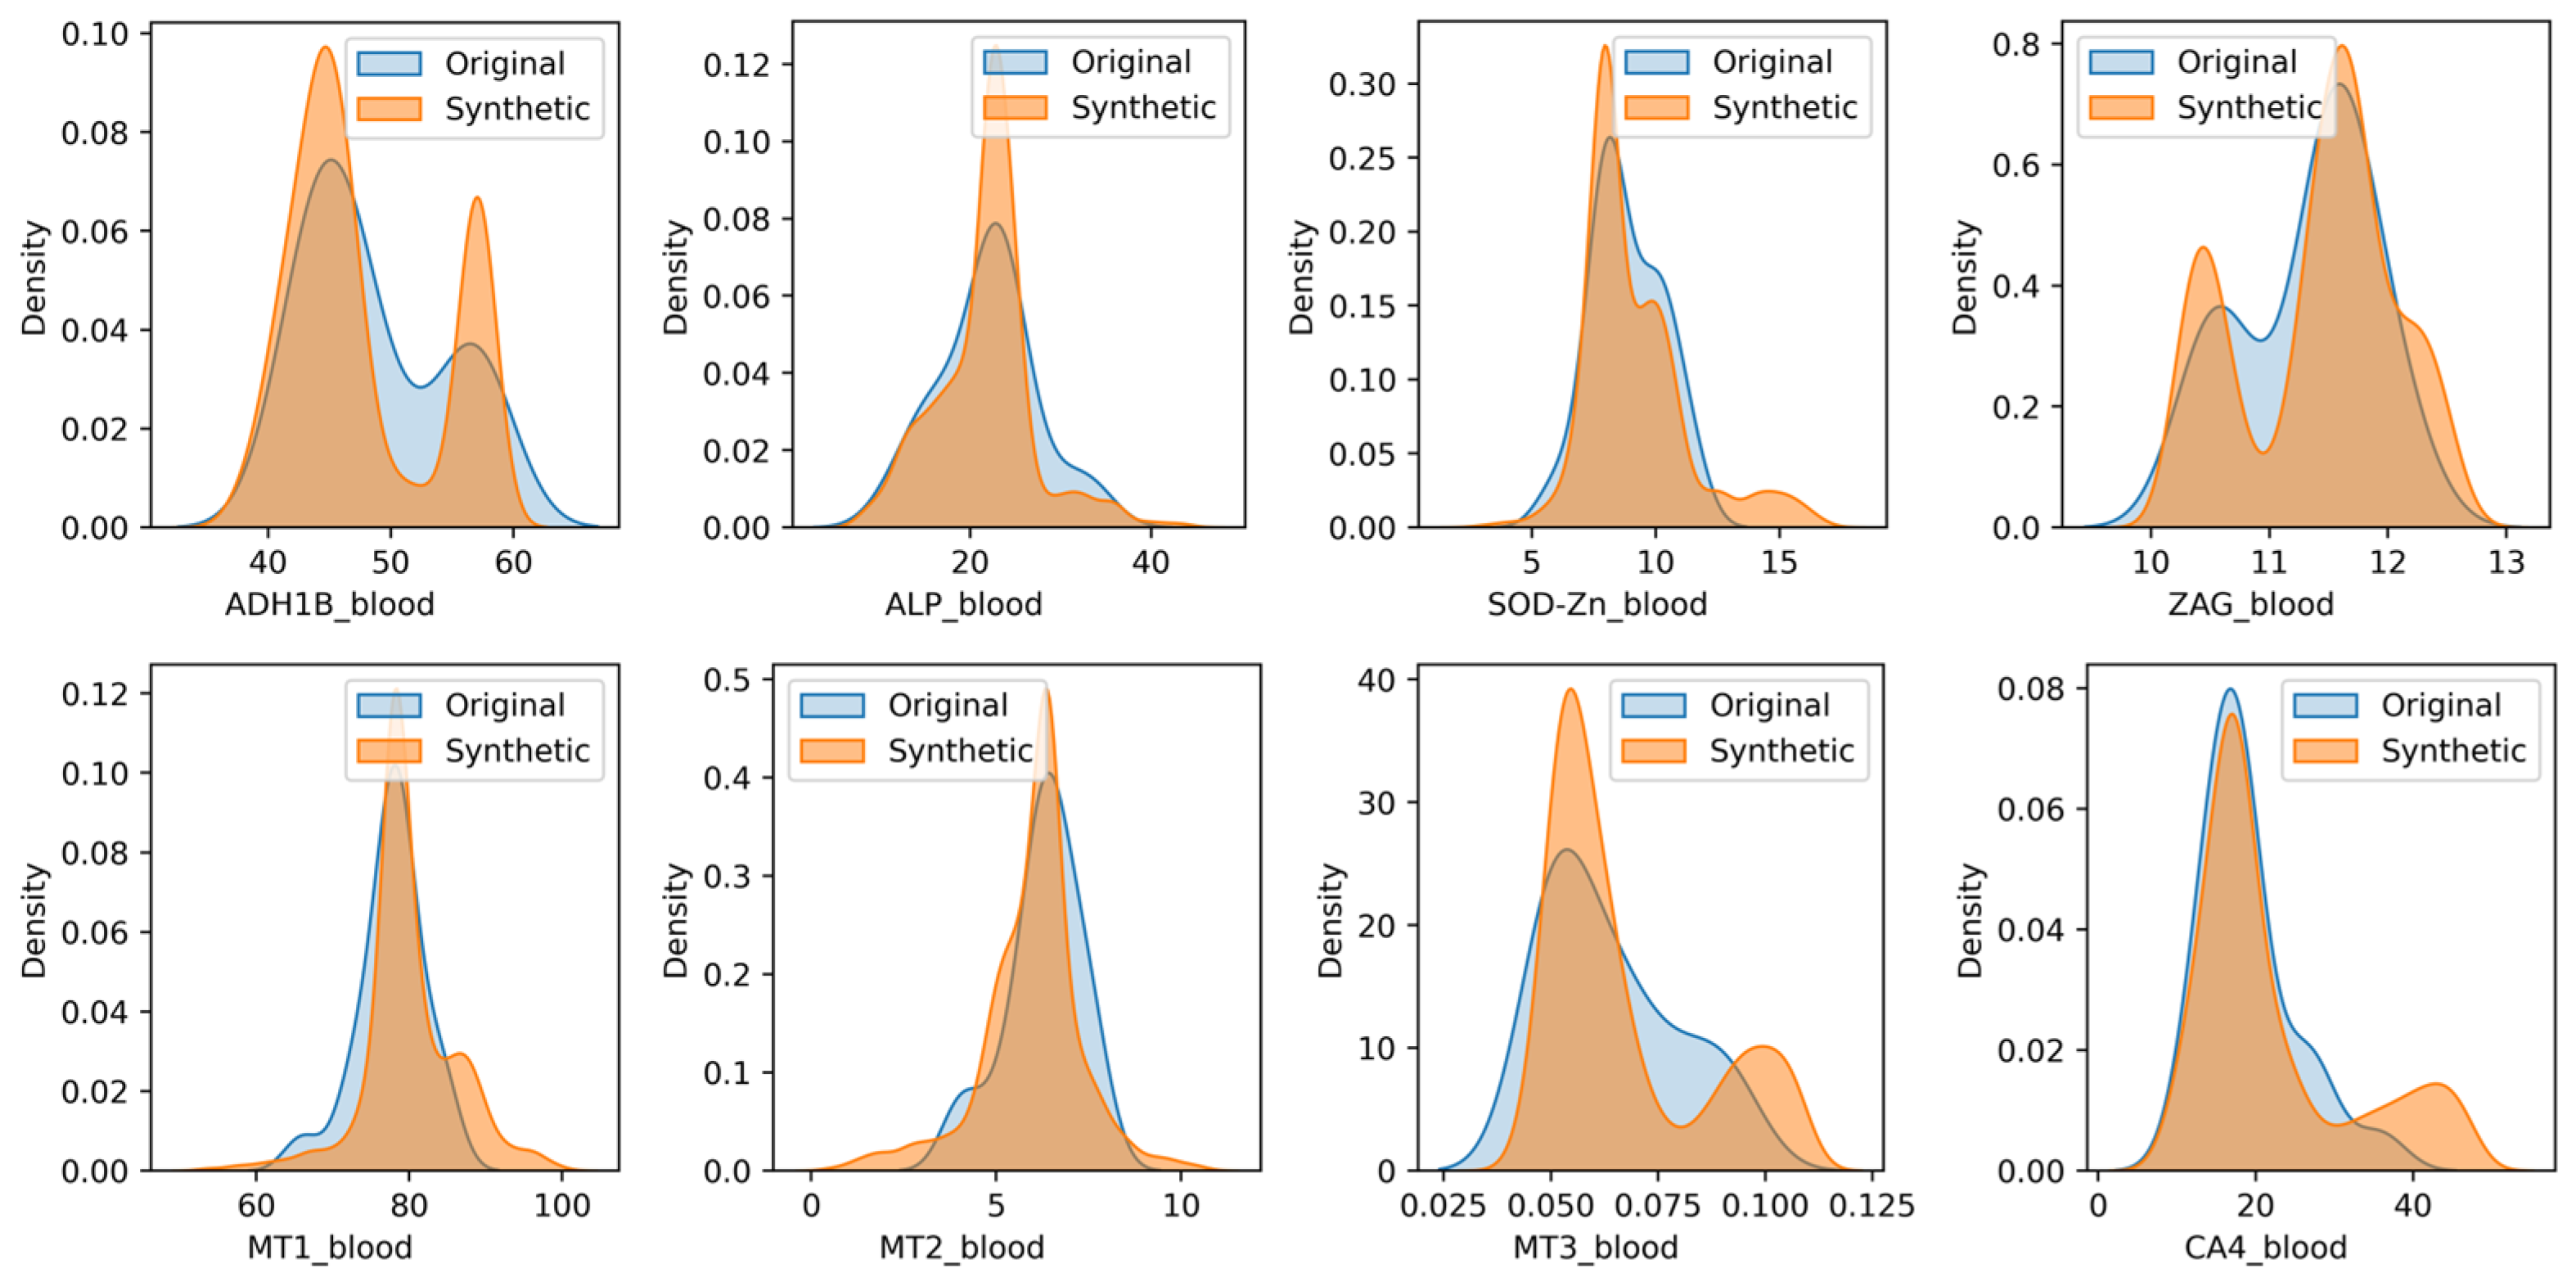
With an EH_1 dataset of only 35 records, the sample size is extremely limited, which can lead to biased and underrepresented results. This scarcity of data can result in a lack of generalizability, making it challenging to draw meaningful conclusions about the effects of different doses of zinc oxide nanoparticles. GANs can help alleviate this issue by generating new, synthetic data that can augment the existing dataset, thereby increasing its size and improving its representativeness. CTGAN [40] was used for data augmentation to generate new records for each of the four experimental groups with doses of 1.55/3.1/6.2/150 mg/kg, respectively. The use of GANs for data augmentation can be validated through various metrics, including the SDMetrics library (https://github.com/sdv-dev/SDMetrics (accessed on 15 May 2025)). Table 3 aggregates the metrics obtained by the report of the SDMetrics library on synthesized data. The shape of a column describes its overall distribution. The higher the Column Shapes score, the more similar the distributions of real and synthetic data. The trend between the two columns describes how they vary in relation to each other. The higher the Column Pair Trends score, the more the trends are alike. The Total Score reflects the average of all the scores. Figure 1 and Figure 2 show KDE plots of the distribution of observations of real and synthetic data. It can be concluded that the size of the generated data sample does not affect the quality metrics of synthetic data. More than half of the chemical elements in the synthetic data have distributions close to the real ones, and elements As, B, Be, Cd, Co, Cr, Hg, Li, Mn, Pb, Sn, and V have wider distribution patterns. All proteins and enzymes in the synthetic data have distributions close to the real ones.

3.3. Non-Linear Regression Models

The nonlinear nature of the dependence of the element content on the dose of ZnO nanoparticles is due to the fact that the biochemistry of chemical elements is determined by various competitive chemical processes and specific cellular responses. Therefore, in this study, we created a custom loss function that penalizes models that predict negative values, zero values, and values close to each other by the threshold.
Let y true R n denote true target values (ground truth), y pred R n denote predicted values from the model, and n denote the number of predictions in the batch. We define the following components:
1. The mean squared error is defined as follows:
MSE ( y true , y pred ) = 1 n i = 1 n ( y true , i y pred , i ) 2 .
2. The penalty for negative predictions is defined as follows:
NegPenalty ( y pred ) = 1 n i = 1 n max ( y pred , i , 0 ) .
3. The penalty for zero predictions is defined as follows:
ZeroPenalty ( y pred ) = 1 n i = 1 n 1 { y pred , i = 0 } , .
where 1 { } is the indicator function (1 if the condition is true, else 0).
4. The penalty for similar predictions is applied when adjacent predictions are too close to each other, based on a threshold. Let τ be the threshold value. The penalty for similar predictions is defined as follows:
SamePenalty ( y pred ) = 1 n 1 i = 1 n 1 max ( τ y pred , i + 1 y pred , i , 0 ) ,   if   n   >   1 SamePenalty ( y pred ) = 0 ,   otherwise ,
Then, the general custom loss function is defined as follows:
L ( y true , y pred ) = MSE ( y true , y pred ) + + 5.0 NegPenalty ( y pred ) + 2.5 ZeroPenalty ( y pred ) + 2.5 SamePenalty ( y pred ) .
Due to the extreme sparsity of experimentally validated concentrations (only 35 data points across a range of 1–150 mg), we used the 2:1 ratio, which reflects a hierarchical severity in terms of scientific interpretability and model utility. This aligns with principles in constrained regression and physical modeling, where violating physical constraints is prioritized over other forms of inaccuracy.
Non-linear regression algorithms can be used to predict non-linear relationships between the concentration of ZnO nanoparticles and the levels of each element in blood. Since we want to make predictions for concentration values that were not included in the original laboratory experiment, decision tree-based regression models are not appropriate for this task. Therefore, in this study, to build a single-feature regression model, we will focus on the use of artificial neural networks and the Kernel Ridge regression algorithm with varying activation functions and kernels. Both MLPRegressor and Kernel Ridge from the Scikit-learn library (https://scikit-learn.org/ (accessed on 5 June 2025)) do not support custom loss functions; therefore, we implemented custom regression models based on TensorFlow and PyTorch solutions:
1. We define a fully connected feedforward artificial neural network model. A linear stack of layers is defined using Sequential(), where each layer feeds directly into the next without any branching or skipping connections. The input shape is dynamically determined by training data. Two fully connected (dense) hidden layers, each consisting of 64 artificial neurons, are used. Each neuron applies a linear transformation followed by an activation function (‘tanh’, ‘sigmoid’, ‘softmax’, or ‘swish’). As an output layer, a single neuron with linear activation is used, producing a scalar output value. The Adam optimizer is used, which is an adaptive learning rate optimization algorithm based on estimates of the first and second moments of the gradients. The model is trained for 100 epochs. Mini-batch gradient descent is applied with a batch size of 32, balancing computational efficiency and convergence stability. Moreover, 20% of the training data is reserved for validation during training, enabling early detection of overfitting or underfitting.
2. We define a nonlinear regression model formulated specifically within the dual formulation of kernel ridge regression. The model learns a set of coefficients α associated with training samples in a reproducing kernel Hilbert space. The objective function optimized during training consists of the MSE metric, L2 regularization on dual coefficients, and a custom loss function Equation (14). The model parameters α are initialized randomly and optimized using the Adam optimizer. Training is performed over 2500 epochs using full-batch gradient descent since all samples are used at each step. Gradients are computed explicitly through automatic differentiation in PyTorch. The model uses one of the kernels (RBF, Chi-squared, or Laplacian) to capture nonlinear relationships between inputs and outputs.
We will focus our predictive studies on the levels of elements in the blood due to the fact that blood functions as a multifunctional transport system, essential for sustaining cellular metabolism, coordinating physiological responses, and maintaining systemic homeostasis in multicellular organisms.

4. Results

4.1. Data Analysis of Elemental Homeostasis of Wistar Rats

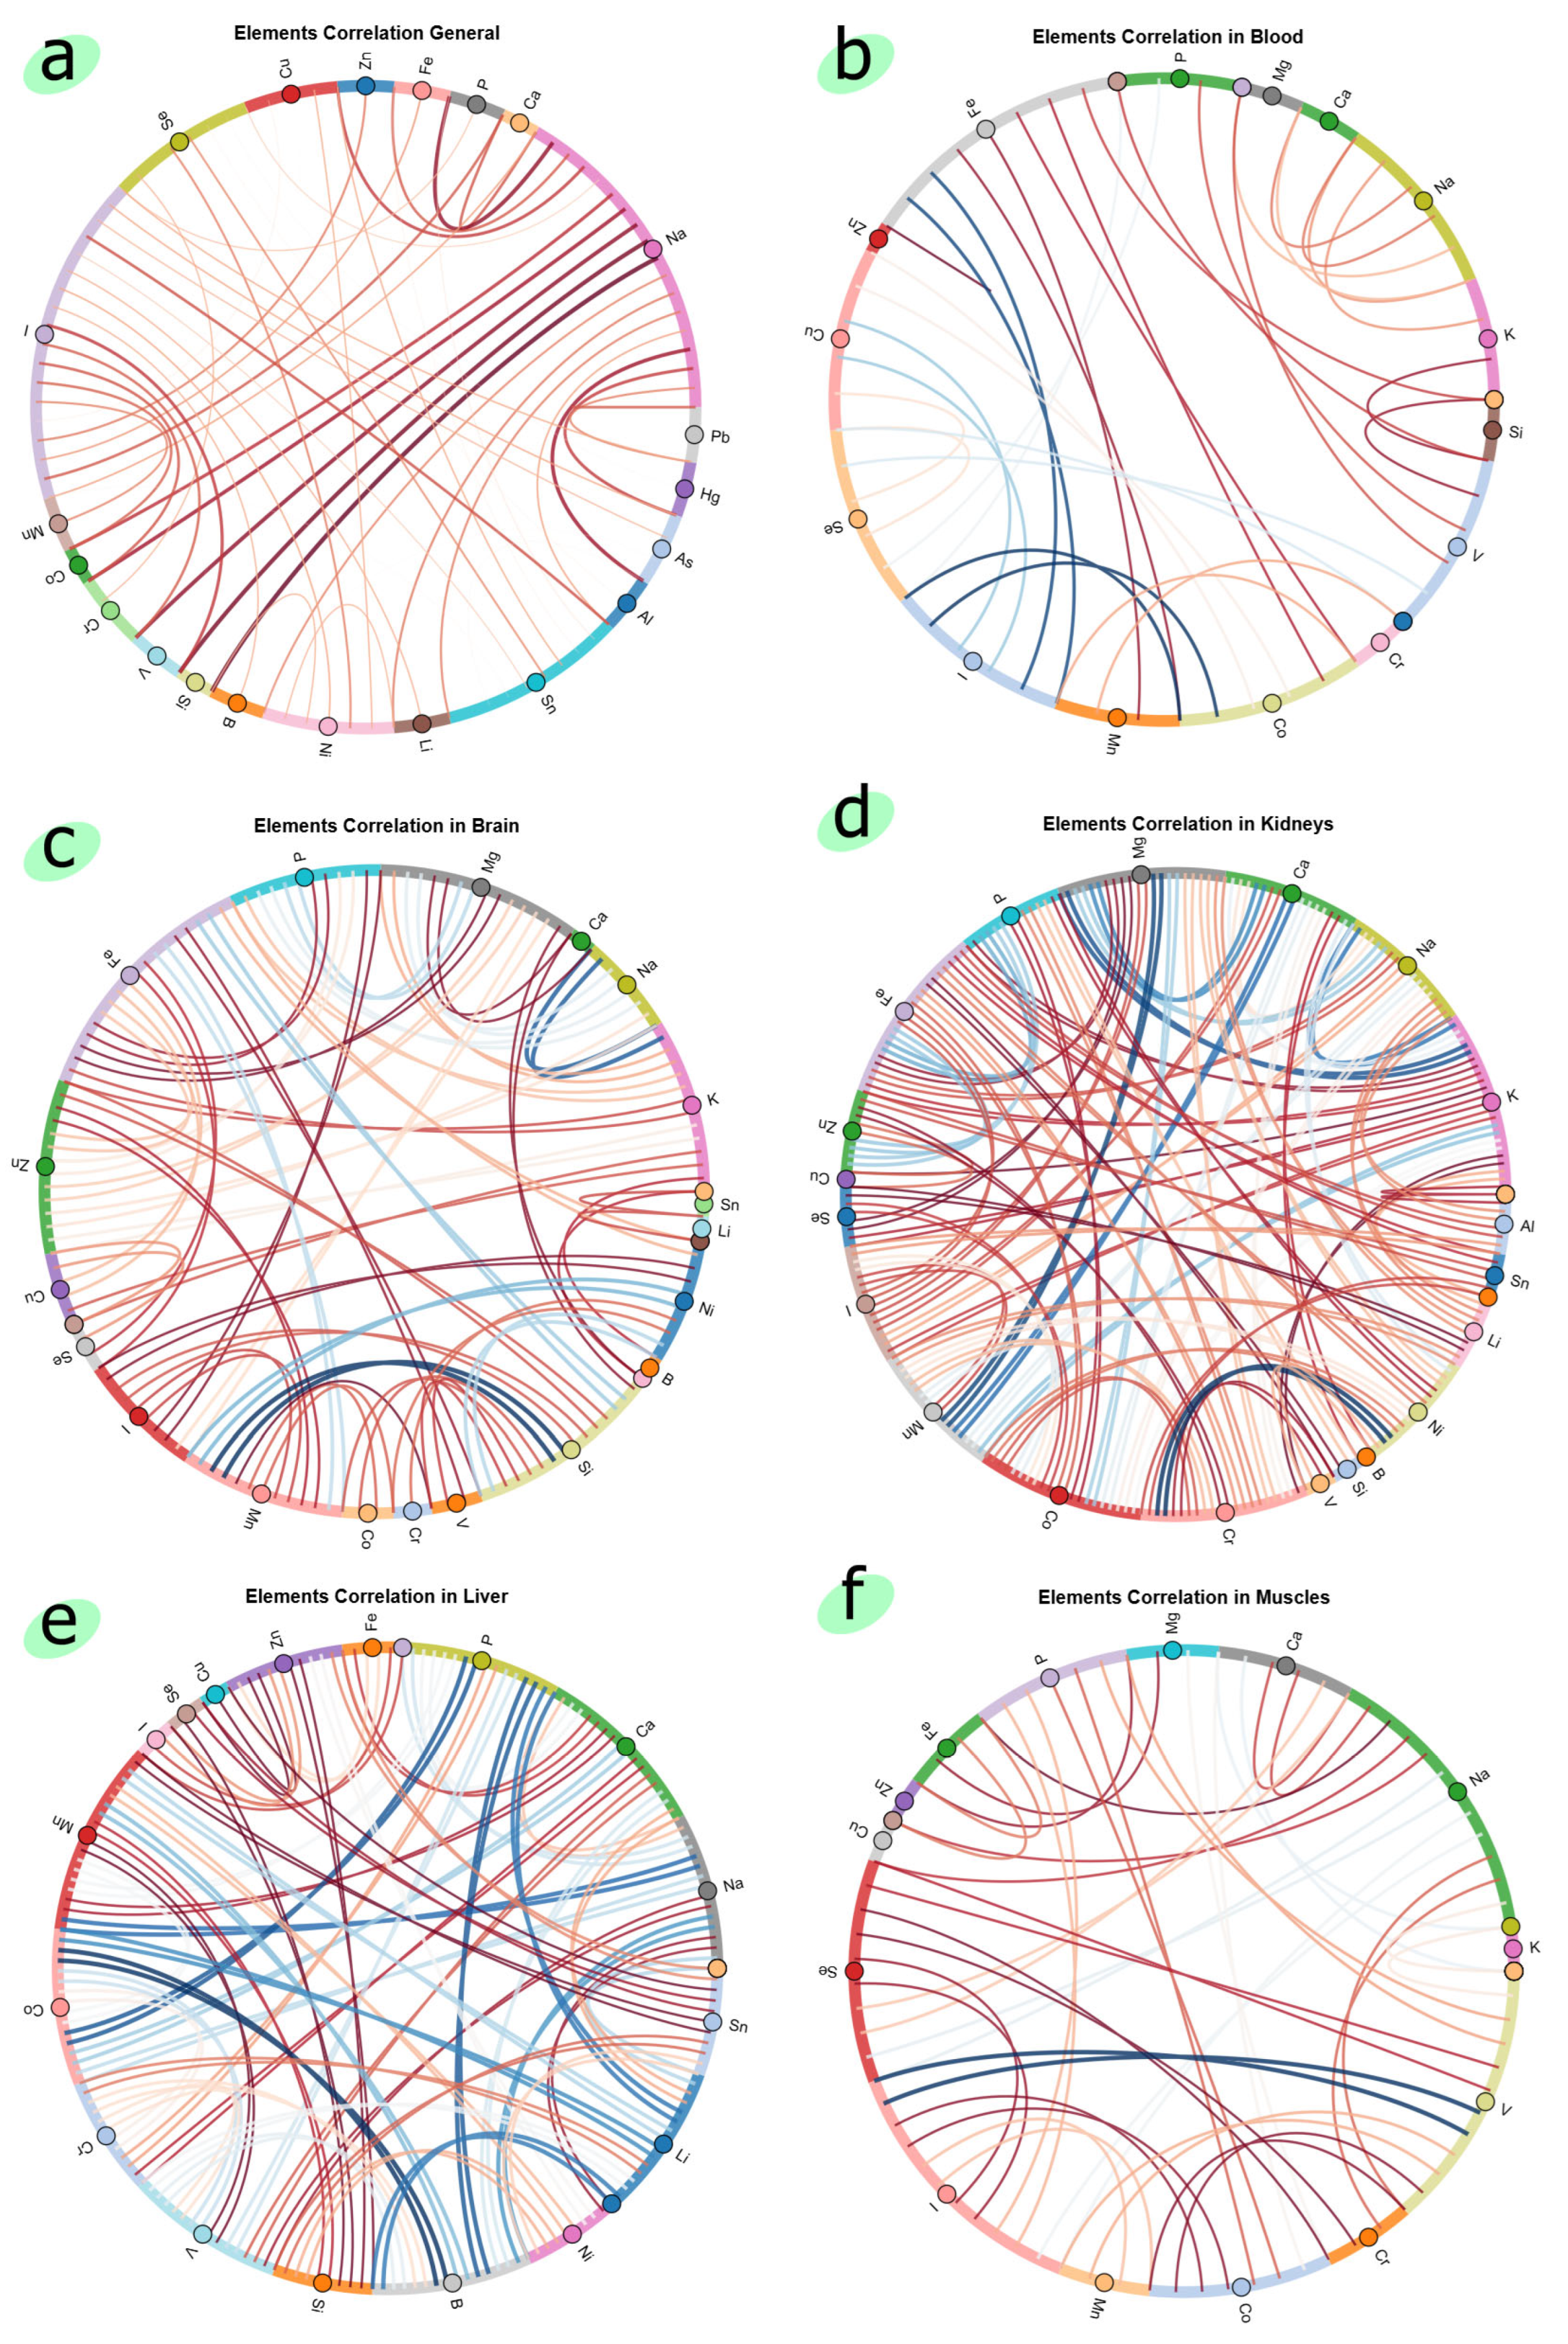
Chord diagrams from HoloViews v1.21.0 library allow us to visualize the weighted relationships between features in data. Figure 3 shows the chord diagrams of the EH_1 dataset in general and for each organ separately, with a threshold of 0.5. The size of the arc is proportional to the importance of each feature. The thickness of the connection between features is the magnitude of the correlation (the higher the correlation, the thicker the connection). As for color, blue is a positive correlation, and red is a negative one. Notably, the kidneys, liver, and brain exhibited strong inter-element correlations, indicating a high level of elemental homeostasis regulation and possible susceptibility to systemic disruption upon exposure. In contrast, the weaker correlations observed in the heart, muscles, and the overall dataset suggest either more localized or less synchronized elemental responses in these tissues. Specifically, I, Na, and Sn emerged as key interacting elements in the global dataset, while organ-specific analyses identified sets of influential elements—Na, Fe, Cu, Se, I, V in blood; Zn, Fe, Mg, Si, Mn in brain; and Na, Se, I, V in muscles. These findings imply that zinc oxide nanoparticles may influence specific elemental networks in an organ-dependent manner, potentially affecting physiological functions related to those elements, such as neurotransmission, oxygen transport, and redox balance.
To assess the strength of the correlation between chemical elements, proteins, and enzymes for different experimental groups of the Wistar rats, the integral indicator correlation graph weight (CGW) can be used [41]. The results of the calculations of the CGW are presented in Table 4. A dose of 6.2 mg/kg ZnO nanoparticles in feed, according to the CGW value with a threshold α = 0.5, reduces the strength of the correlation of elemental homeostasis for the general dataset, liver, and muscle data. A dose of 3.1 mg/kg ZnO nanoparticles in feed, according to the CGW value with a threshold α = 0.5, reduces the strength of the correlation of elemental homeostasis for the blood, brain, and kidney data. The maximum correlation between the indicators of chemical elements, proteins, and enzymes is observed for experimental group V (150 mg/kg ZnO NPs) in the blood; in the negative control group C in the brain and kidneys; and in the positive control group C+ with zinc deficiency in the liver and muscles.
The ranked results of the weighted importance score calculations (Equation (4)) are presented in Table 5. A dosage of 3.1 mg/kg ZnO nanoparticles in rat feed, according to the weighted importance score value, is the best one based on feature importance and element group factors; Equations (1) and (2).
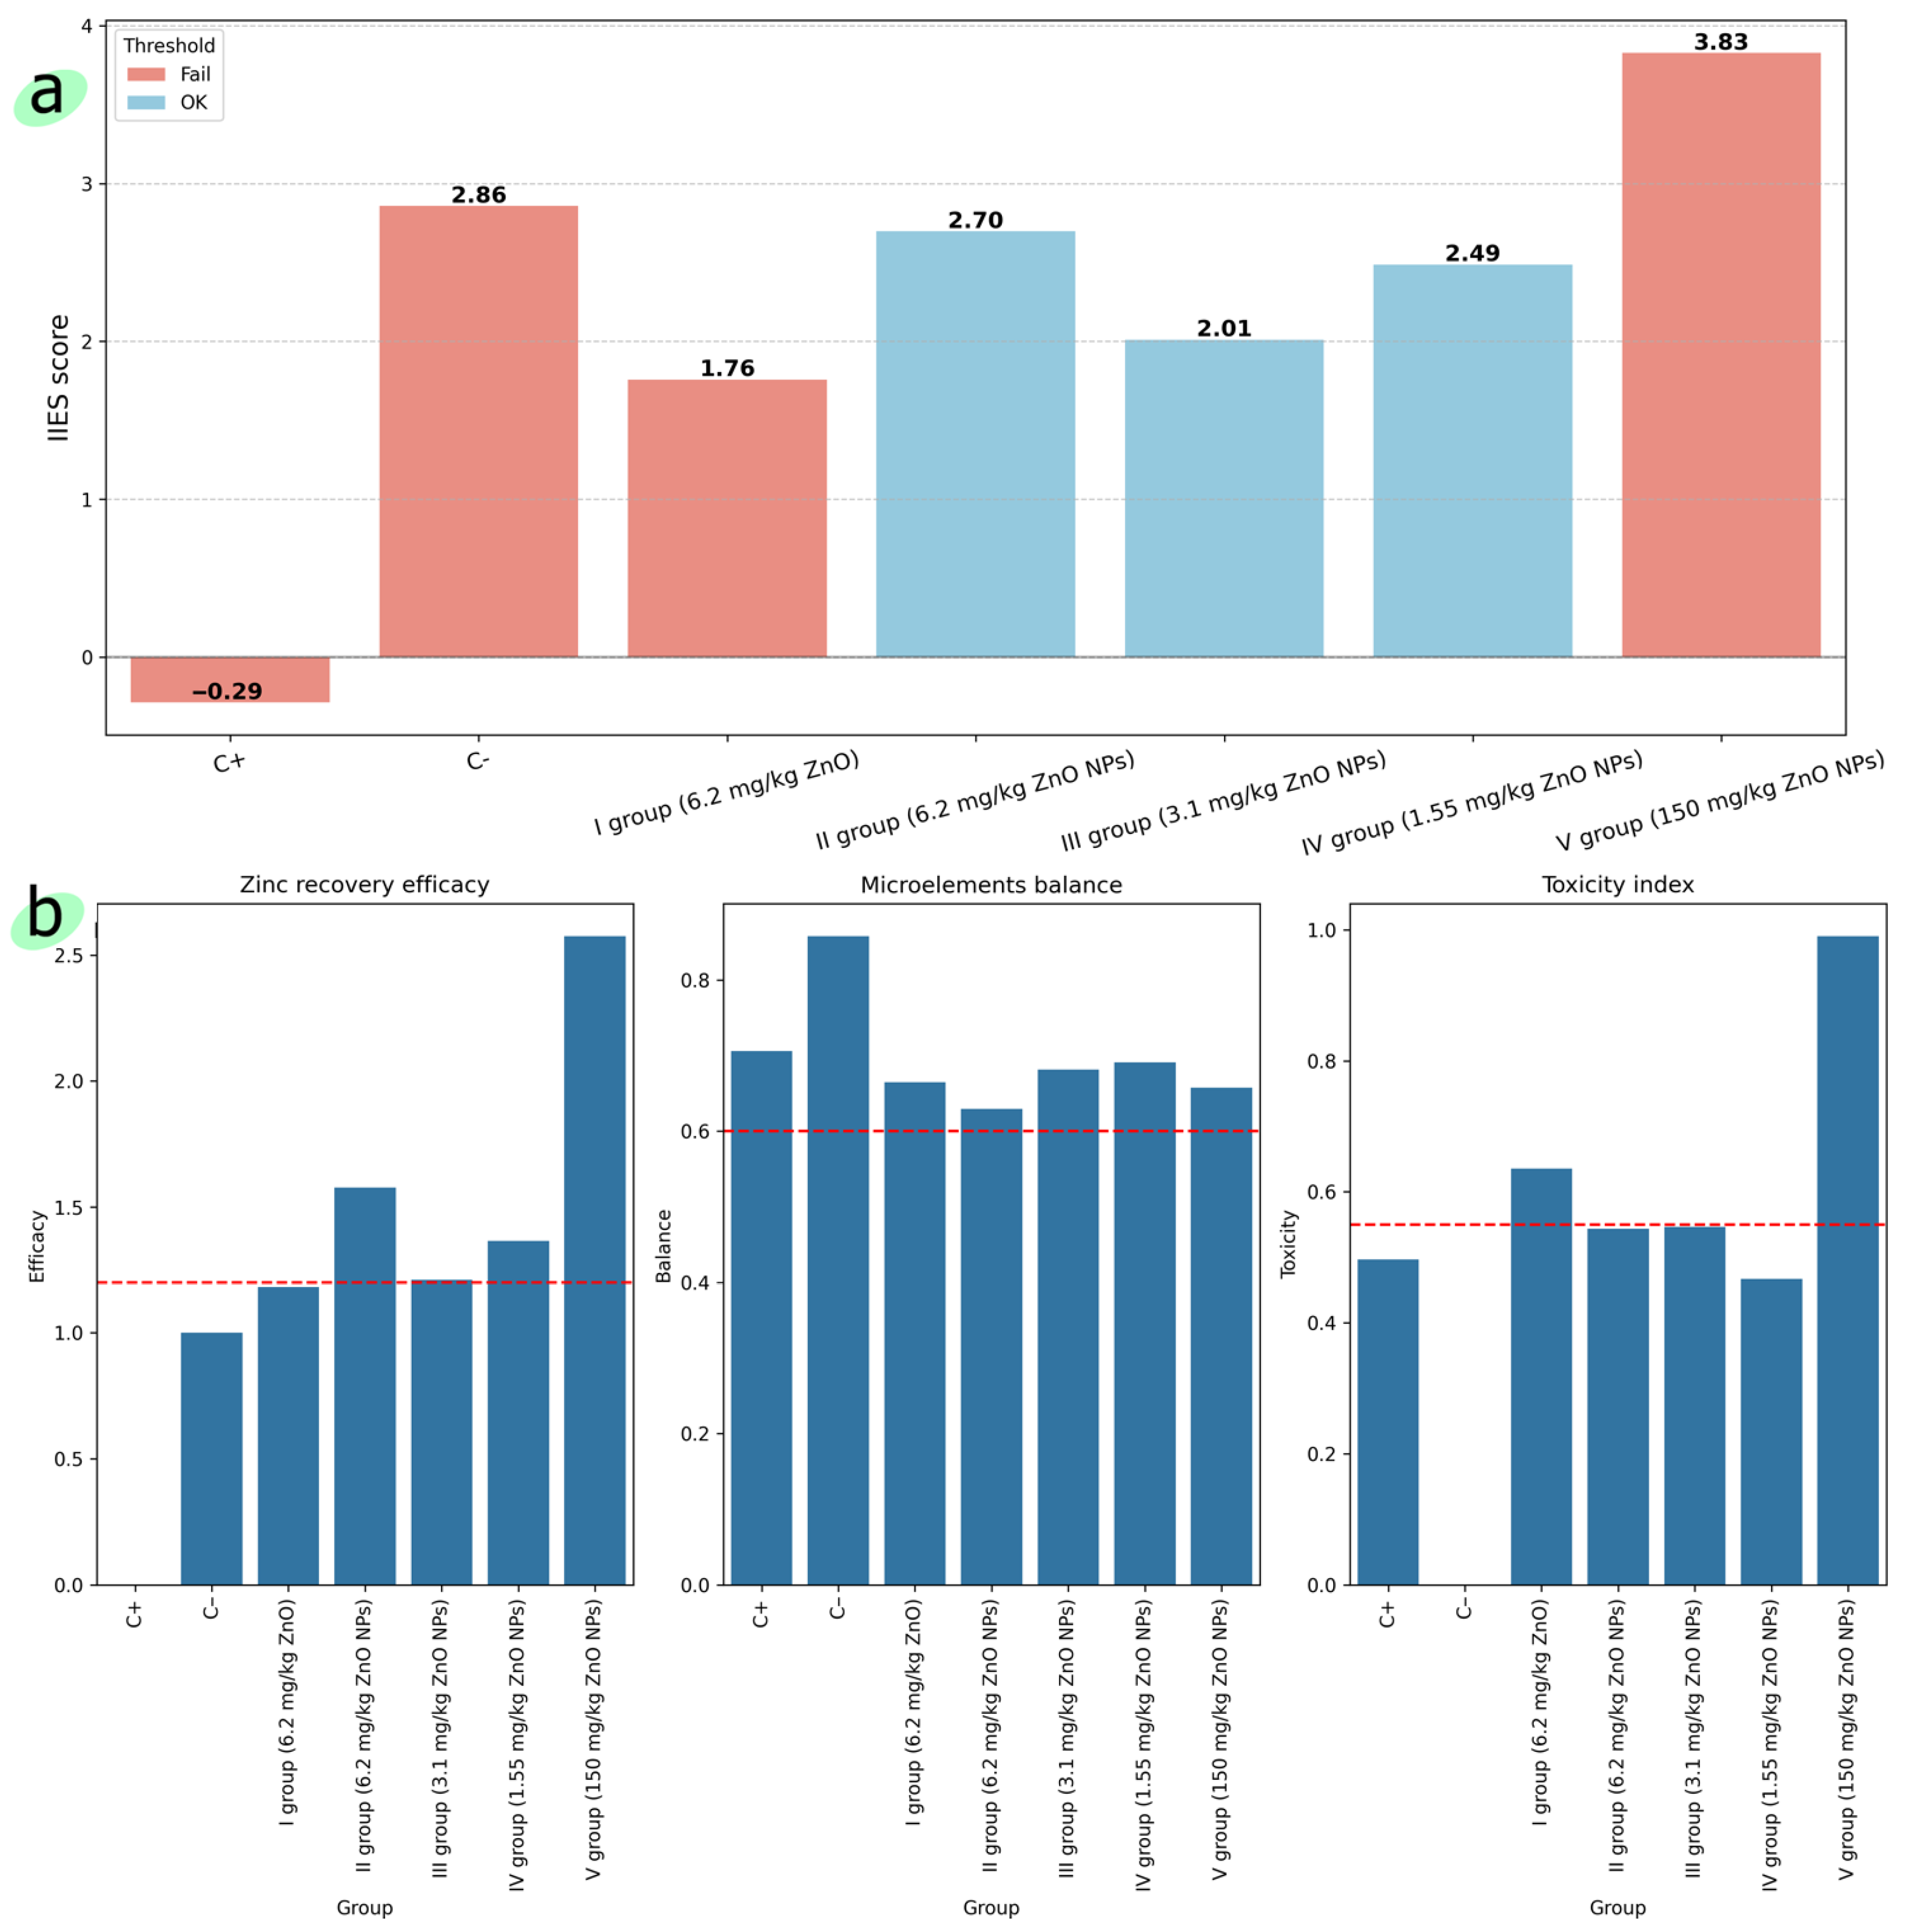
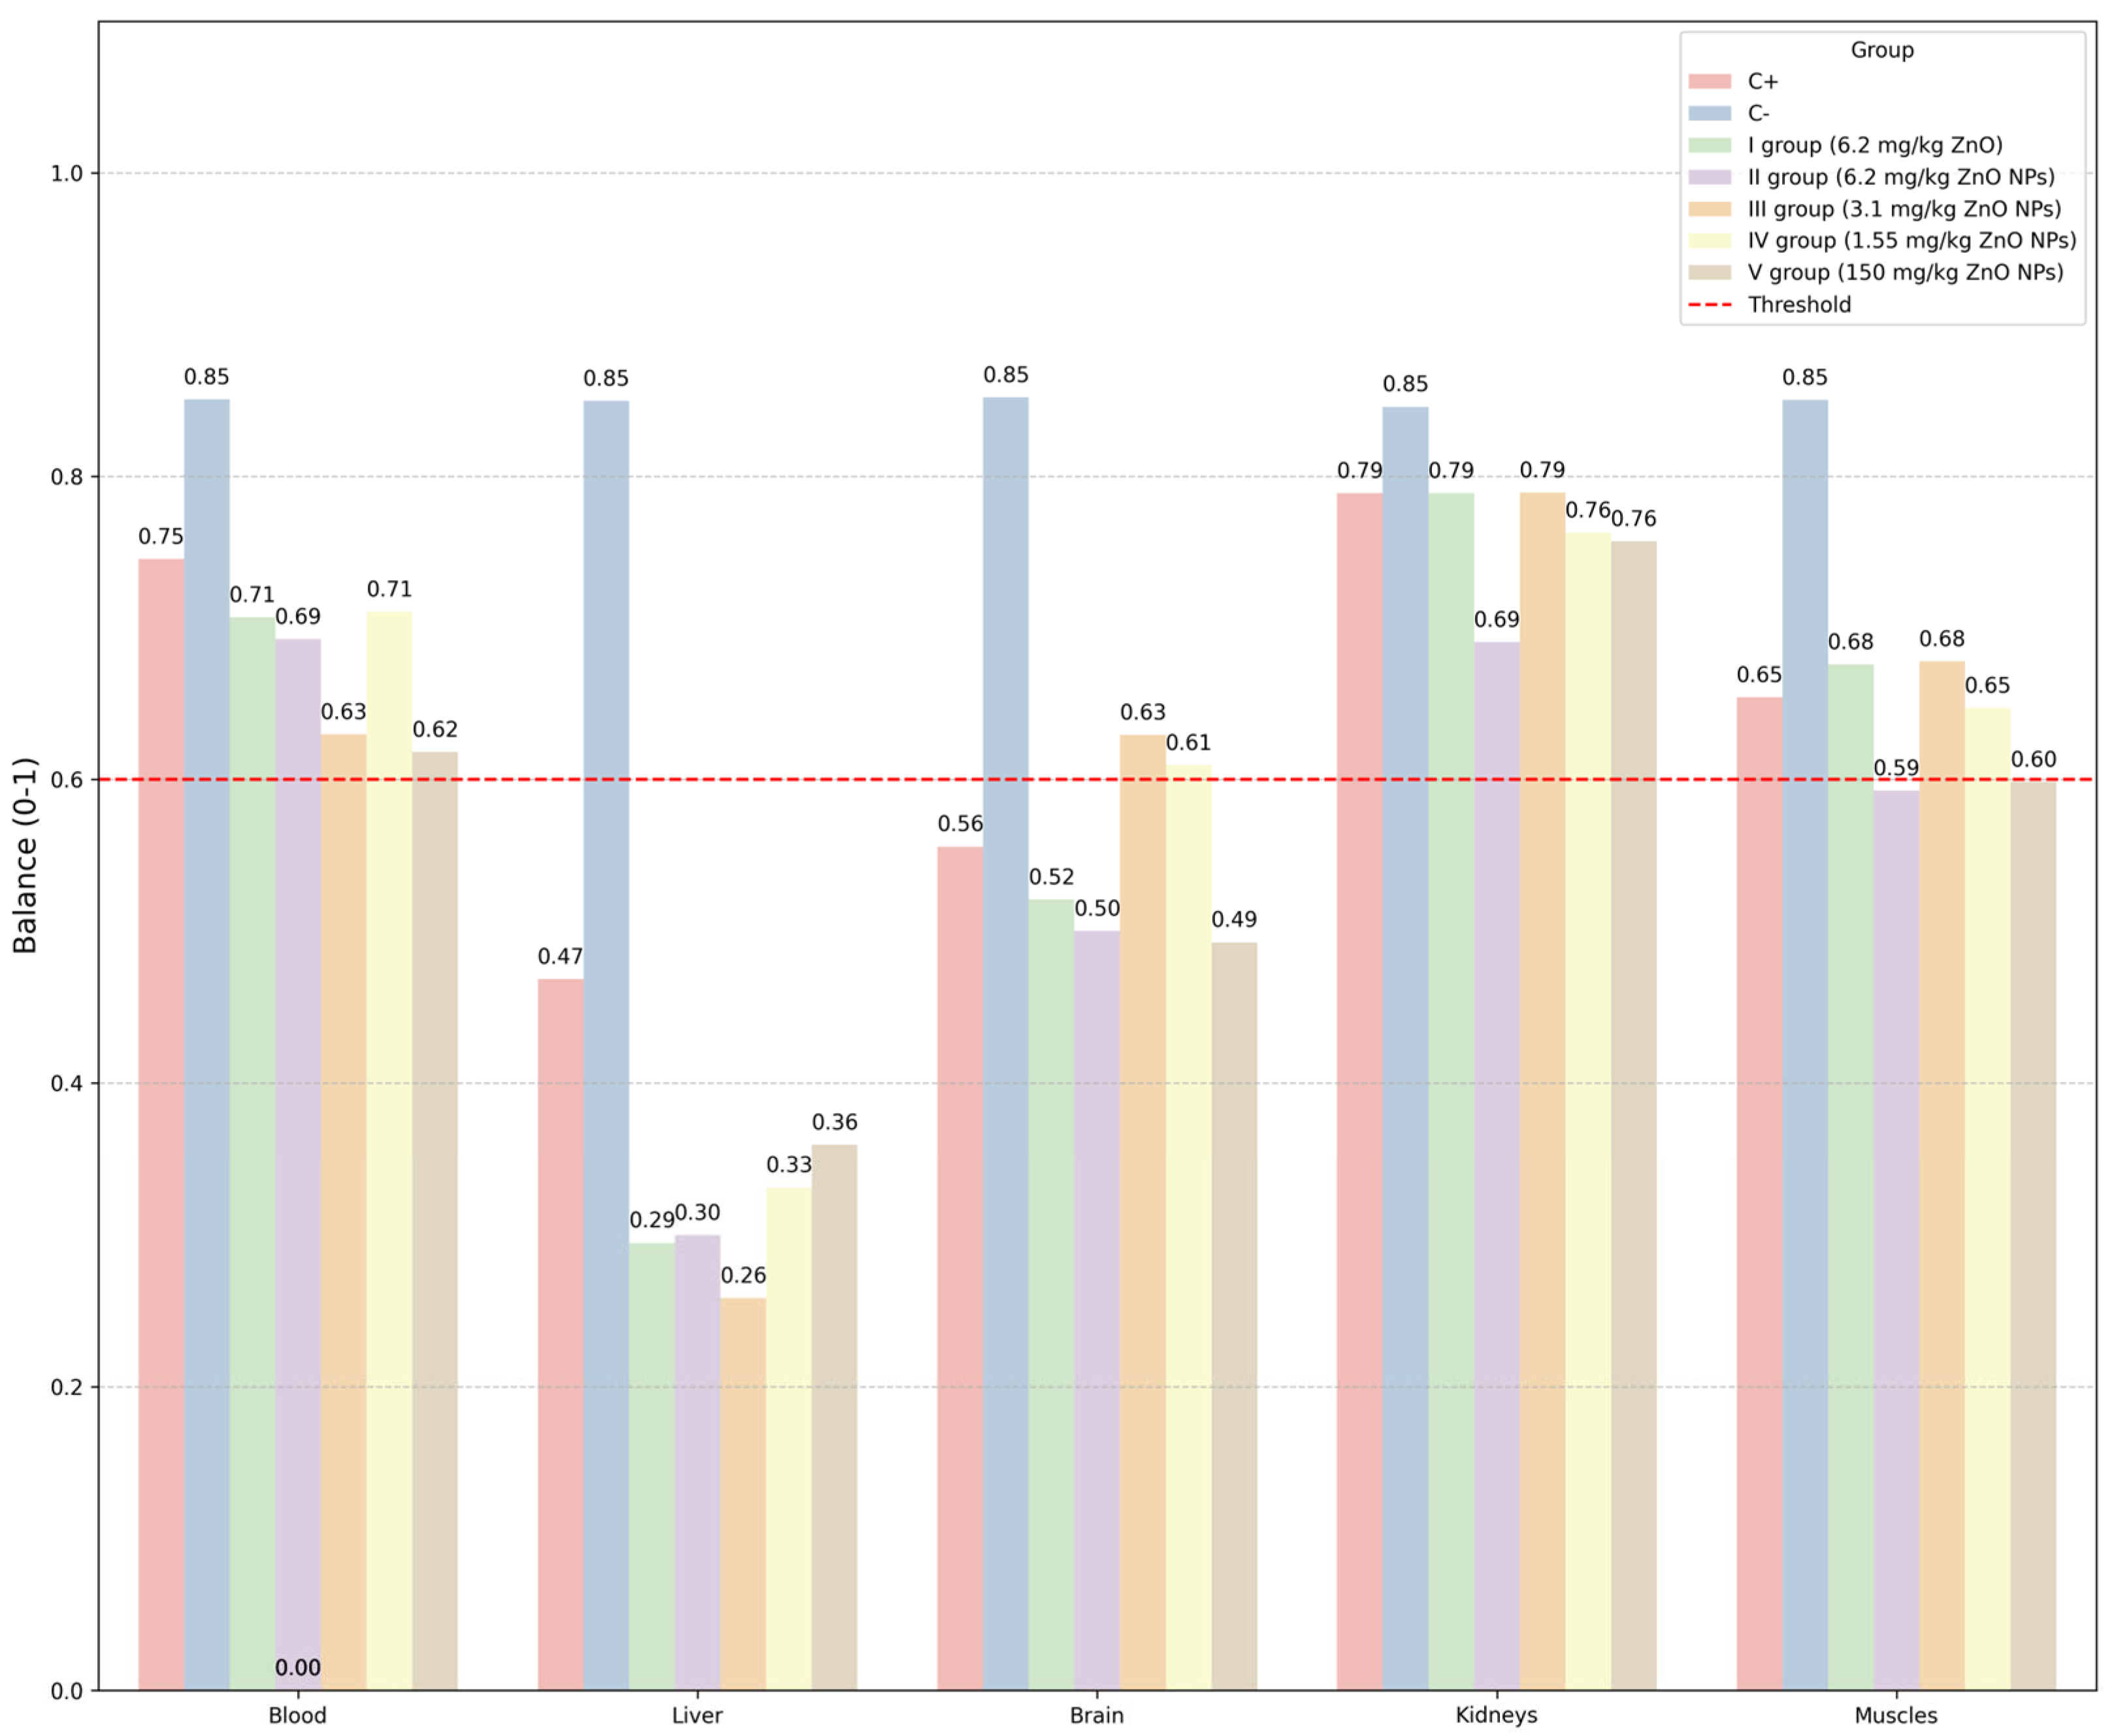
Figure 4a shows the results of calculating the IIES score (Equation (8)) for each experimental group; Figure 4b shows the results of calculating the IIES score for zinc recovery efficacy (Equation (5)), microelement balance (Equation (6)), and toxicity (Equation (7)). Figure 5 shows the results of calculating the IIES score for blood and organs separately.
In Figure 5, we observed a significant decrease in the microelement balance in the liver in all experimental groups compared to other organs. This indicates that the liver, as a central organ of metabolism and detoxification, is most sensitive to the introduction of zinc oxide nanoparticles. Violation of the balance of elements in the liver indicates the potential hepatotoxicity of nanoparticles, which requires special attention when assessing the safety of therapeutic doses.

4.2. Predictive Models of Toxic and Essential Elements in the Blood of Laboratory Animals Based on the Dosage of Zinc Oxide Nanoparticles

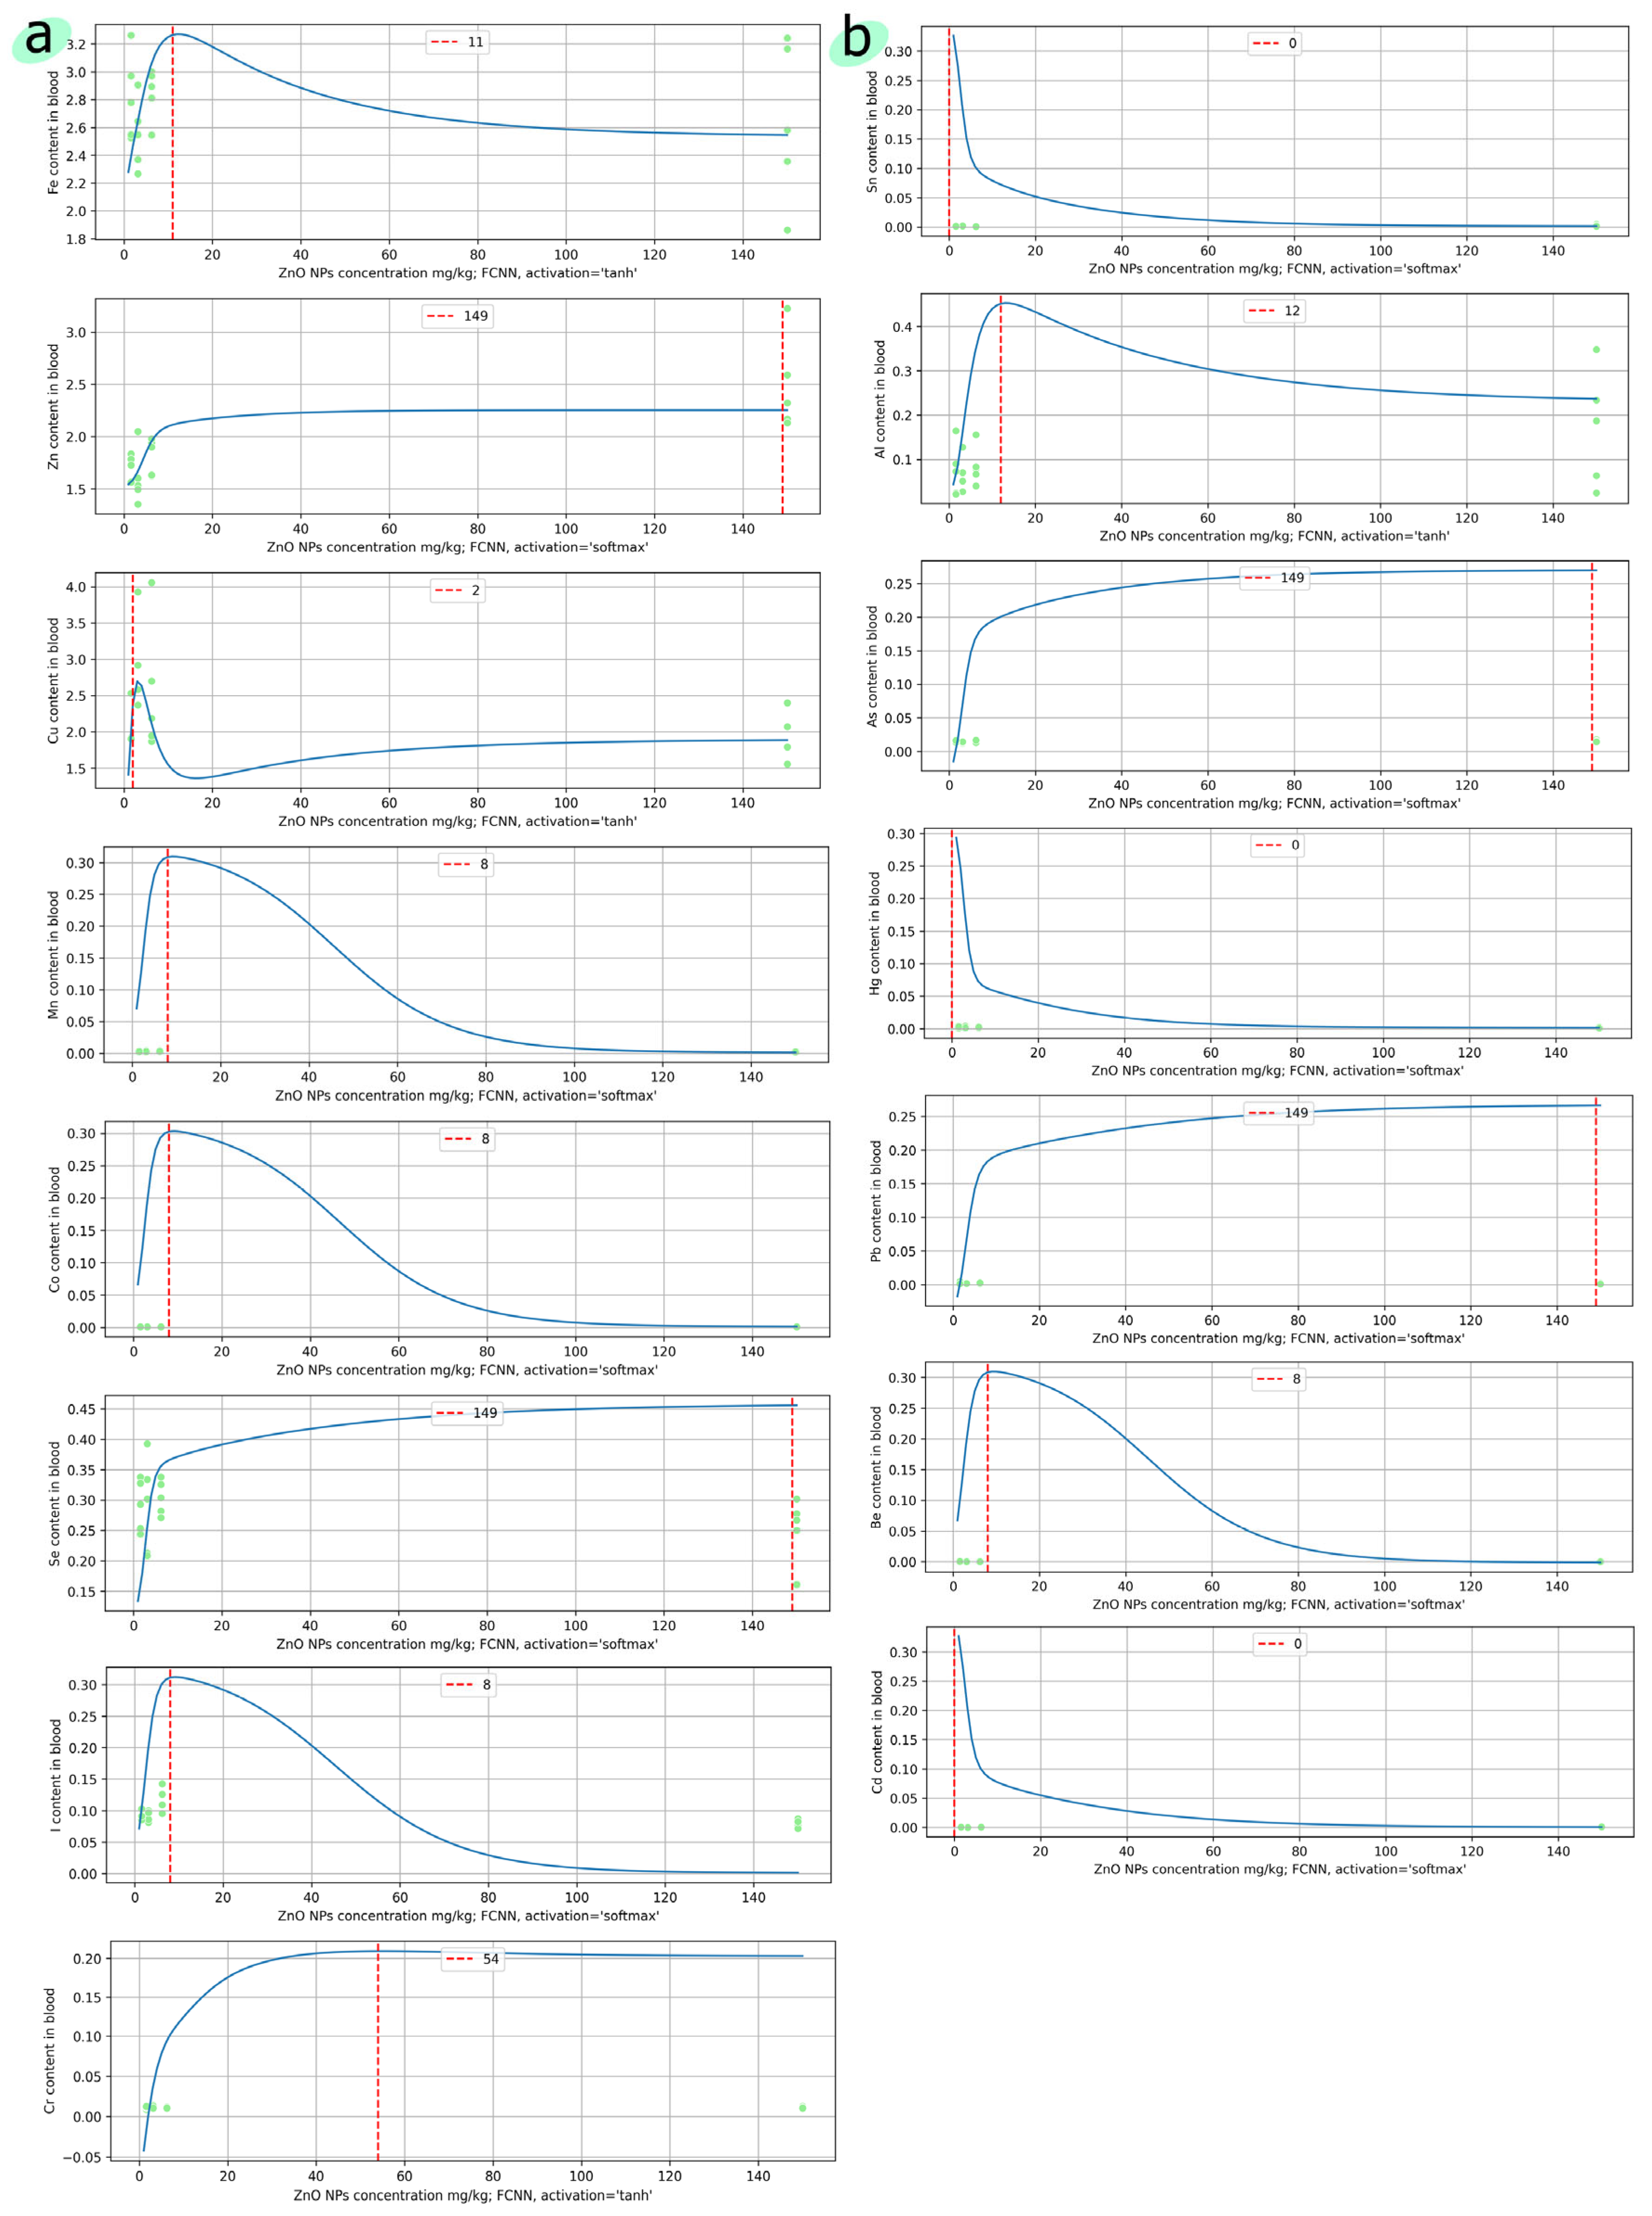
Predictive models for forecasting the levels of a group of essential elements (Fe, Zn, Cu, Mn, Co, Se, I, Cr) were constructed. We compared two regression models for forecasting, with varying activation functions and kernels, based on a custom loss function (Equation (14)), RMSE and MAE metrics values, and residual distribution analysis. The metric values are averaged over 15 model runs with different splits of data into training and test sets. Table 6 presents the results of the comparison of regression models; Figure 6a shows graphs of the best models with minimal RMSE metric values.
Predictive models for forecasting the levels of a group of toxic elements (Sn, Al, As, Hg, Pb, Be, Cd) were constructed. Table 7 presents the results of the comparison of regression models; Figure 6b shows graphs for the best models with minimal RMSE metric values.
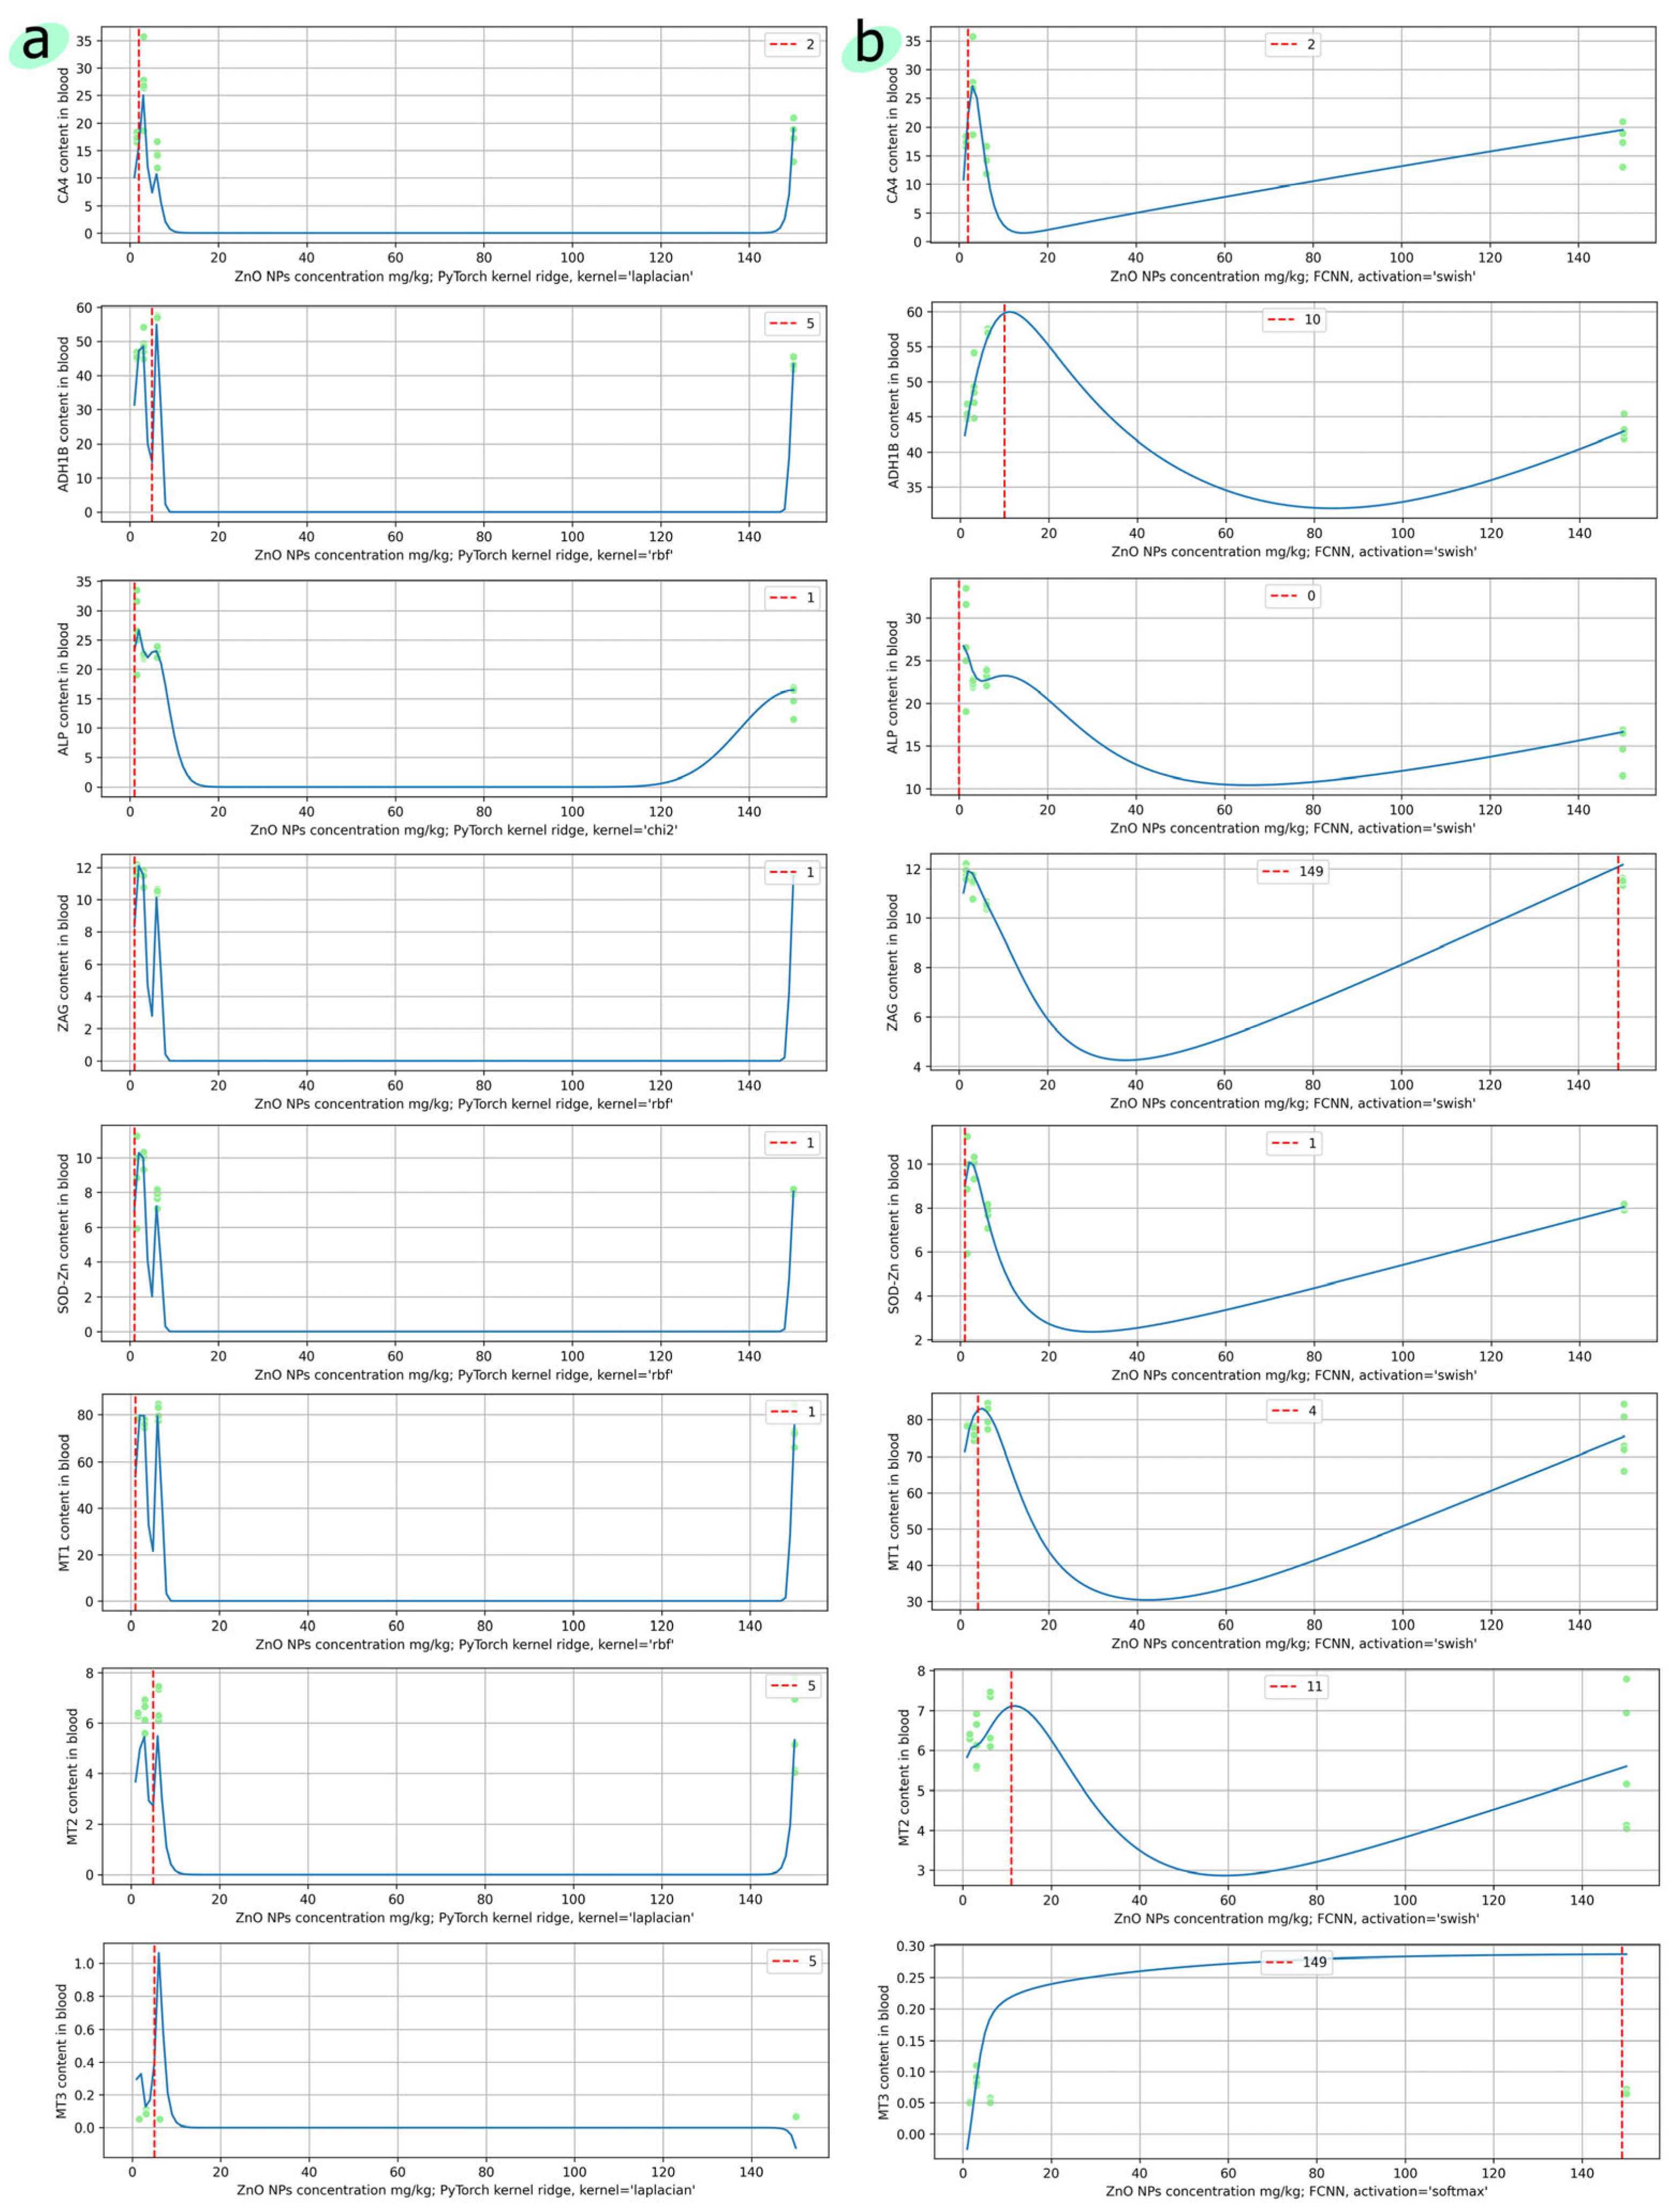
Predictive models for forecasting the levels of a group of proteins and ferments (CA4, ADH1B, ALP, ZAG, SOD-Zn, MT1, MT2, MT3) were constructed. Table 8 presents the results of the comparison of regression models; Figure 7a shows graphs for the best Kernel Ridge models with minimal RMSE metric values, and Figure 7b shows graphs for the best FCNN models with minimal RMSE metric values.

5. Discussion

Essential elements are tightly regulated in biological systems. Their concentrations are expected to remain within narrow physiological ranges. Best prediction results (see Figure 6a) were obtained for softmax and tanh activation functions. These results suggest that the changes in essential element concentrations in response to ZnO NPs exposure are predictable and follow a relatively stable functional relationship, likely due to regulatory mechanisms in the body. Toxic elements typically do not have active physiological roles and may accumulate under certain conditions, especially when barrier functions are overwhelmed. The low concentrations and possibly sporadic or non-linear increases make prediction difficult. FCNN with the softmax activation function shows the best results for the RMSE metric (see Figure 6b), but the forecasts turn out to be template-like for most elements (the forecast either tends to zero or to the maximum threshold value of the element). Such poor performance suggests that toxic element dynamics are not well-captured by probabilistic normalization across classes or outputs. For the Al element with sufficiently high concentration values, the model shows better predictive results compared to elements whose concentration is close to zero.
Enzyme activity reflects metabolic and physiological responses to stress or toxicity. ZnO NPs can induce oxidative stress, inflammation, or cellular damage, altering enzyme release into the bloodstream. Best prediction results are obtained for Kerner Ridge regression models and FCNN with swish activation function. Kernel Ridge regression performs well, suggesting that enzyme responses may be modeled effectively using smooth, regularized nonlinear mappings. It should be noted that Kernel Ridge regression (see Figure 7a) poorly predicts the levels of elements in the blood outside the initial experimental dosages (1.55/3.1/6.2/150 mg/kg) of nanoparticles. The swish activation function may better capture the complex, dose-dependent nonlinear enzyme kinetics induced by ZnO NPs compared to other functions (see Figure 7b). Based on the weighted importance score and the IIES score values, a ZnO nanoparticle dose of 3.1 mg/kg represents an optimal balance between efficacy and physiological stability. The optimal doses of ZnO nanoparticles in rat feed achieved in other studies [27,28] are consistent with the results obtained in this study.
The distribution of certain elements in the synthetic dataset deviates from that in the original dataset, attributable to the sensitivity threshold of the laboratory instrumentation. Comparative analysis of two predictive modeling approaches—FCNN and Kernel Ridge regression—reveals that accurate forecasting is particularly challenging for elements predominantly belonging to the toxic group (whose values are very close to zero), likely due to measurement limitations and, as a consequence, the inability of synthetic data to capture the true dynamics. However, using the proposed methodology, robust predictive models were successfully developed for most other elements whose concentrations were measured with higher precision.
Differential sensitivity of blood components to ZnO NP exposure implies that each category (essential elements, toxic elements, ferments, and enzymes) responds through distinct biological pathways. These findings support the use of hybrid modeling strategies, where different subsets of biomarkers are predicted using tailored algorithms based on their dynamic range and biological context.

6. Conclusions

This study had several limitations that should be acknowledged. This study was conducted on male Wistar rats. Elemental homeostasis was studied after adding zinc oxide nanoparticles to rat feed. Generation of new synthetic data was conducted for each of the four experimental groups with doses of 1.55/3.1/6.2/150 mg/kg, respectively. We are aware of the potential limitations of GAN-based synthetic data generation in preserving biological plausibility, particularly when trained on small datasets.
To mitigate this risk and enhance the biological credibility of the generated data:
  • We rigorously evaluated the similarity between the original and synthetic datasets using the SDMetrics tool and KDE plots;
  • During training, we incorporated domain-informed constraints to prevent the generation of physiologically implausible values with a custom loss function;
  • The utility of the augmented dataset was assessed through the performance of two predictive models (FCNN and Kernel Ridge).
Therefore, we position the synthetic data as a tool for statistical augmentation under the assumption of distributional stability, not as a substitute for mechanistic modeling.
This study demonstrates that the effects of ZnO nanoparticles on rat blood composition are complex and group-specific. Predictive accuracy depends not only on data quality and quantity, but also on aligning the model’s architecture with the biological and physicochemical characteristics of the target variables. Future work should consider multi-model ensembles, adaptive activation functions, and interpretability tools to further elucidate the mechanisms of nanoparticle–biological interactions. In conclusion, nanoparticles have the potential to transform various fields, from animal husbandry to agriculture, and their use has significant implications for animal nutrition and animal health. However, it is essential to address the concerns surrounding nanoparticle toxicity and develop strategies for safe handling and use.

Author Contributions

Software, I.K.; Investigation, I.K.; Visualization, I.K.; Writing—review and editing, L.L.; Writing—original draft, L.L.; Visualization, L.L.; Supervision, I.B.; Conceptualization, I.B.; Project administration, I.B.; Formal analysis, A.S.; Methodology, A.S.; Writing—review and editing, A.S.; Investigation, S.K.; Data Curation, S.K.; Writing—review and editing, S.K. All authors have read and agreed to the published version of the manuscript.

Funding

This work is supported by the Russian Ministry of Science and Higher Education, Russia (075-15-2024-550).

Institutional Review Board Statement

Not applicable.

Informed Consent Statement

Not applicable.

Data Availability Statement

The full datasets EH_Synt_1 and EH_Synt_2 are publicly available at https://drive.google.com/drive/folders/1jqaAYKiSC7klFqU8OM_B6U6SxHzEe4N6?usp=drive_link (accessed on 9 June 2025).

Acknowledgments

The authors thank their colleagues at the biological clinic of the Federal Scientific Center for Biological Systems and Agrotechnology for the data provided and research support.

Conflicts of Interest

The authors declare no conflicts of interest.

Abbreviations

The following abbreviations are used in this manuscript:
ADASYNAdaptive Synthetic
ALPAlkaline Phosphatase
ALTAlanine Transaminase
ANNArtificial Neural Network
ASTAspartate Aminotransferase
CGWCorrelation Graph Weight
CTGANConditional Tabular Generative Adversarial Network
EHElemental Homeostasis
FCNNFully Connected Neural Network
IIESIntegral Indicator of Efficiency and Safety
IQRInterquartile Range
KDEKernel Density Estimate
LDHLactate Dehydrogenase
MAEMean Absolute Error
MLMachine Learning
MLPMulti-layer Perceptron
MSEMean Squared Error
NPsNanoparticle(s)
RBFRadial Basis Function
RMSERoot Mean Squared Error
SMOTESynthetic Minority Oversampling Technique

References

  1. Huang, S.; Wang, L.; Liu, L.; Hou, Y.; Li, L. Nanotechnology in agriculture, livestock, and aquaculture in China. A review. Agron. Sustain. Dev. 2015, 35, 369–400. [Google Scholar] [CrossRef]
  2. Bai, D.P.; Lin, X.Y.; Huang, Y.F.; Zhang, X.F. Theranostics aspects of various nanoparticles in veterinary medicine. Int. J. Mol. Sci. 2018, 19, 3299. [Google Scholar] [CrossRef]
  3. Gelaye, Y. Application of nanotechnology in animal nutrition: Bibliographic review. Cogent Food Agric. 2024, 10, 2290308. [Google Scholar] [CrossRef]
  4. Kolesnikov, S.; Timoshenko, A.; Minnikova, T.; Tsepina, N.; Kazeev, K.; Akimenko, Y.; Zhadobin, A.; Shuvaeva, V.; Rajput, V.D.; Mandzhieva, S.; et al. Impact of Metal-Based Nanoparticles on Cambisol Microbial Functionality, Enzyme Activity, and Plant Growth. Plants 2021, 10, 2080. [Google Scholar] [CrossRef]
  5. Paramo, L.A.; Feregrino-Pérez, A.A.; Guevara, R.; Mendoza, S.; Esquivel, K. Nanoparticles in agroindustry: Applications, toxicity, challenges, and trends. Nanomaterials 2020, 10, 1654. [Google Scholar] [CrossRef]
  6. Singh, A.V.; Ansari, M.H.D.; Rosenkranz, D.; Maharjan, R.S.; Kriegel, F.L.; Gandhi, K.; Kanase, A.; Singh, R.; Laux, P.; Luch, A. Artificial intelligence and machine learning in computational nanotoxicology: Unlocking and empowering nanomedicine. Adv. Healthc. Mater. 2020, 9, 1901862. [Google Scholar] [CrossRef] [PubMed]
  7. Saeed, S.; Afzal, G.; Kiran, S.; Ahmad, H.I.; Haider, M.Z.; Naz, S. Role of Nanoparticles in Veterinary Medicine and as Feed Additive in Livestock. In Recent Advances in Biotechnology; Bentham Science Publishers: Sharjah, United Arab Emirates, 2023; pp. 229–242. [Google Scholar] [CrossRef]
  8. Naumenko, S.; Koshevoy, V.; Matsenko, O.; Miroshnikova, O.; Zhukova, I.; Bespalova, I. Antioxidant properties and toxic risks of using metal nanoparticles on health and productivity in poultry. J. World’s Poult. Res. 2023, 13, 292–306. [Google Scholar] [CrossRef]
  9. Rahman, H.S.; Othman, H.H.; Abdullah, R.; Edin, H.Y.A.S.; AL-Haj, N.A. Beneficial and toxicological aspects of zinc oxide nanoparticles in animals. Vet. Med. Sci. 2022, 8, 1769–1779. [Google Scholar] [CrossRef]
  10. Bąkowski, M.; Kiczorowska, B.; Samolińska, W.; Klebaniuk, R.; Lipiec, A. Silver and zinc nanoparticles in animal nutrition—A review. Ann. Anim. Sci. 2018, 18, 879–898. [Google Scholar] [CrossRef]
  11. Tsekhmistrenko, O.; Bityutskyy, V.; Tsekhmistrenko, S.; Melnychenko, O.; Tymoshok, N.; Spivak, M. Use of nanoparticles of metals and nonmetals in poultry farming. Technol. Prod. Process. Livest. Prod. 2019, 2, 113–130. [Google Scholar] [CrossRef]
  12. Hardy, A.; Benford, D.; Halldorsson, T.; Jeger, M.J.; Knutsen, H.K.; More, S.; Naegeli, H.; Noteborn, H.; Ockleford, C.; EFSA Scientific Committee; et al. Guidance on risk assessment of the application of nanoscience and nanotechnologies in the food and feed chain: Part 1, human and animal health. EFSA J. 2018, 16, 05327. [Google Scholar] [CrossRef] [PubMed]
  13. Elalfy, M.M.; El-hadidy, M.G.; Abouelmagd, M.M. Update of usefulness and adverse effects of nanoparticles on animals and human health. J. Vet. Med. Health 2018, 2, 106. [Google Scholar]
  14. Lutkovskaya, Y.; Sizova, E.; Kamirova, A. Ultrafine forms of trace elements in the diet of ruminants: Impact on productivity and health. Agrar. Sci. J. 2024, 5, 96–104. [Google Scholar] [CrossRef]
  15. Vanivska, K.; Dianová, L.; Halo, M., Jr.; Štefunková, N.; Lenický, M.; Slanina, T.; Tirpák, F.; Ivanič, P.; Stawarz, R.; Massányi, P. Toxicity of nanoparticles on animal and human organism: Cell response. J. Microbiol. Biotechnol. Food Sci. 2024, 14, e10844. [Google Scholar] [CrossRef]
  16. Shivaswamy, M.S.; Yashkamal, K.; Shivakumar, M.S. In vivo and in vitro toxicity of nanomaterials in animal systems. In Nanotoxicology for Agricultural and Environmental Applications; Academic Press: Cambridge, MA, USA, 2024; pp. 159–169. [Google Scholar] [CrossRef]
  17. Sharma, N.; Kurmi, B.D.; Singh, D.; Mehan, S.; Khanna, K.; Karwasra, R.; Kumar, S.; Chaudhary, A.; Jakhmola, V.; Sharma, A.; et al. Nanoparticles toxicity: An overview of its mechanism and plausible mitigation strategies. J. Drug Target. 2024, 32, 457–469. [Google Scholar] [CrossRef]
  18. Pradhan, K.; Mishra, L.; Mishra, M. Nanotoxicology and Its Remediation. In Smart Nanomaterials for Infectious Diseases; Book Sales Department, Royal Society of Chemistry, Thomas Graham House: Cambridge, UK, 2024. [Google Scholar] [CrossRef]
  19. Parashar, S.; Raj, S.; Srivastava, P.; Singh, A.K. Comparative toxicity assessment of selected nanoparticles using different experimental model organisms. J. Pharmacol. Toxicol. Methods 2024, 130, 107563. [Google Scholar] [CrossRef]
  20. Bisla, A.; Honparkhe, M.; Srivastava, N. A review on applications and toxicities of metallic nanoparticles in mammalian semen biology. Andrologia 2022, 54, e14589. [Google Scholar] [CrossRef]
  21. Dianová, L.; Tirpák, F.; Halo, M.; Slanina, T.; Massányi, M.; Stawarz, R.; Formicki, G.; Madeddu, R.; Massányi, P. Effects of selected metal nanoparticles (Ag, ZnO, TiO2) on the structure and function of reproductive organs. Toxics 2022, 10, 459. [Google Scholar] [CrossRef]
  22. Sial, B.E.; Ali, S.A.; Aslam, N.; Maqsood, R.; Iqbal, S.; Mehmood, Y.; Mustafa, G. ZnO nanoparticles impact on organ systems in rats: A comprehensive exploration of diverse exposure pathways. J. Zool. Syst. 2023, 2023, 37–51. [Google Scholar] [CrossRef]
  23. Sharif, S.; Fatima, R.; Naz, S. Toxic Effects of Metallic Nanoparticles on Rat’s Spleen; a Review. Pol. J. Environ. Stud. 2023, 32, 991–997. [Google Scholar] [CrossRef] [PubMed]
  24. Shafiq, A.A.; Luaib, N.M.; Mahdi, R.H.; Alsaimary, I.E. Oral Toxicity of Magnesium Oxide Nanoparticles, MgO NPs on Liver in Male Rats. Iraqi J. Sci. 2024, 65, 6323–6335. [Google Scholar] [CrossRef]
  25. Verma, G.S.; Nirmal, N.K.; Gunpal, D.; Gupta, H.; Yadav, M.; Kumar, N.; John, P.J. Intraperitoneal exposure of iron oxide nanoparticles causes dose-dependent toxicity in Wistar rats. Toxicol. Ind. Health 2021, 37, 763–775. [Google Scholar] [CrossRef]
  26. Ali, A.; Saeed, S.; Hussain, R.; Saif, M.S.; Waqas, M.; Asghar, I.; Xue, X.; Hasan, M. Exploring the impact of silica and silica-based nanoparticles on serological parameters, histopathology, organ toxicity, and genotoxicity in Rattus norvegicus. Appl. Surf. Sci. Adv. 2024, 19, 100551. [Google Scholar] [CrossRef]
  27. Yousef, M.I.; Roychoudhury, S.; Jafaar, K.S.; Slama, P.; Kesari, K.K.; Kamel, M.A.E. N Aluminum oxide and zinc oxide induced nanotoxicity in rat brain, heart, and lung. Physiol. Res. 2022, 71, 677. [Google Scholar] [CrossRef]
  28. Moshrefi, A.H.; Hosseini, S.M.; Parvizi, M.R. Toxicological effect of exposure to different doses of zinc oxide nanoparticles on brain and heart structures of male Wistar rats. Bulg. J. Vet. Med. 2023, 26, 510–523. [Google Scholar] [CrossRef]
  29. Rehman, R.; Khanam, S.; Khan, Y.; Hayat, F. Toxicological Effects of Colloidal Silver Nanoparticles on Rat Health: Assessing Physiological, Hematological, Biochemical, and Behavioral Parameters. Innov. Res. Appl. Biol. Chem. Sci. 2024, 2, 101–107. [Google Scholar] [CrossRef]
  30. Jarrar, B.; Almansour, M.; Al-Doaiss, A.; Lee, S.Y.; Melhem, W.; Jarrar, Q.; Sewelam, A. Metallic and metallic oxide nanoparticles toxicity primarily targets the mitochondria of hepatocytes and renal cells. Toxicol. Ind. Health 2024, 40, 667–678. [Google Scholar] [CrossRef] [PubMed]
  31. Sutunkova, M.; Klinova, S.; Ryabova, Y.; Tazhigulova, A.; Shabardina, L.; Bateneva, V.; Shelomentsev, I.; Privalova, L. Acute Toxicity Induced by Inhalation Exposure to Lead Oxide Nanoparticles in Rats. Public Health Life Environ. PHLE 2023, 31, 24–30. (In Russian) [Google Scholar] [CrossRef]
  32. Rangel DaCosta, L.; Sytwu, K.; Groschner, C.K.; Scott, M.C. A robust synthetic data generation framework for machine learning in high-resolution transmission electron microscopy (HRTEM). Npj Comput. Mater. 2024, 10, 165. [Google Scholar] [CrossRef]
  33. Varsou, D.D.; Kolokathis, P.D.; Antoniou, M.; Sidiropoulos, N.K.; Tsoumanis, A.; Papadiamantis, A.G.; Melagraki, G.; Lynch, I.; Afantitis, A. In silico assessment of nanoparticle toxicity powered by the Enalos Cloud Platform: Integrating automated machine learning and synthetic data for enhanced nanosafety evaluation. Comput. Struct. Biotechnol. J. 2024, 25, 47–60. [Google Scholar] [CrossRef]
  34. Khadka, K.; Chandrasekaran, J.; Lei, Y.; Kacker, R.N.; Kuhn, D.R. Synthetic data generation using combinatorial testing and variational autoencoder. In Proceedings of the 2023 IEEE International Conference on Software Testing, Verification and Validation Workshops (ICSTW), Dublin, Ireland, 16–20 April 2023; IEEE: New York, NY, USA; pp. 228–236. [Google Scholar] [CrossRef]
  35. Dou, B.; Zhu, Z.; Merkurjev, E.; Ke, L.; Chen, L.; Jiang, J.; Zhu, Y.; Liu, J.; Zhang, B.; Wei, G.-W. Machine learning methods for small data challenges in molecular science. Chem. Rev. 2023, 123, 8736–8780. [Google Scholar] [CrossRef] [PubMed]
  36. Goyal, M.; Mahmoud, Q.H. A systematic review of synthetic data generation techniques using generative AI. Electronics 2024, 13, 3509. [Google Scholar] [CrossRef]
  37. Reeves, P.G.; Nielsen, F.H.; Fahey, G.C., Jr. AIN-93 purified diets for laboratory rodents: Final report of the American institute of nutrition ad hoc writing committee on the reformulation of the AIN-76A rodent diet. J. Nutr. 1993, 123, 1939–1951. [Google Scholar] [CrossRef] [PubMed]
  38. Skalny, A.V. Bioelementology as an interdisciplinary integrative approach in life sciences: Terminology, classification, perspectives. J. Trace Elem. Med. Biol. 2011, 25, S3–S10. [Google Scholar] [CrossRef]
  39. Da Silva, J.F.; Williams, R.J.P. The Biological Chemistry of the Elements: The Inorganic Chemistry of Life; Oxford University Press: Oxford, UK, 2001. [Google Scholar] [CrossRef]
  40. Xu, L.; Skoularidou, M.; Cuesta-Infante, A.; Veeramachaneni, K. Modeling Tabular Data Using Conditional GAN. Adv. Neural Inf. Process. Syst. 2019, 32, 1–11. [Google Scholar]
  41. Smirnova, E. Mathematical Modeling of Adaptation to Extreme Conditions, the Effect of Group Stress and Correlation Adaptometry [Dissertation Abstract]. Krasnoyarsk; 2000. Available online: http://elibrary.ru/item.asp?id=15980174 (accessed on 9 June 2025).
Figure 1. The KDE plots of real and synthetic data of chemical elements in blood.
Make 07 00091 g001
Figure 2. The KDE plots of real and synthetic data of proteins and enzymes in blood.
Make 07 00091 g002
Figure 3. Chord diagrams of (a) general EH_1 dataset, (b) blood data, (c) brain data, (d) kidney data, (e) liver data, (f) muscle data.
Make 07 00091 g003
Figure 4. (a) The IIES score for each experimental group; (b) the IIES score for zinc recovery efficacy, microelement balance, and toxicity. The red dotted line corresponds to each value threshold.
Make 07 00091 g004
Figure 5. The IIES scores for blood and organs, shown separately. The red dotted line corresponds to Balance value threshold.
Make 07 00091 g005
Figure 6. Prediction of the levels of (a) essential elements and (b) toxic elements in the blood, depending on the concentration of ZnO nanoparticles. The x-axis shows the concentration of nanoparticles in the range from 1 to 150 mg/kg. The red dotted line corresponds to the highest predicted concentration. The green dots show the original experimental data.
Make 07 00091 g006
Figure 7. (a) Kernel Ridge-based and (b) FCNN-based prediction of the levels of proteins and ferments in the blood, depending on the concentration of ZnO nanoparticles. The x-axis shows the concentration of nanoparticles in the range from 1 to 150 mg/kg. The red dotted line corresponds to the highest predicted concentration. The green dots show the original experimental data.
Make 07 00091 g007
Table 1. Comparative analysis of nanoparticles in animal husbandry.
Nanoparticle TypeEffects on Animal HusbandryRef.
Zinc oxide (ZnO)Improved growth, antioxidant properties, and enhanced immune function; potential liver and kidney damage[8,9]
Silver (Ag), zinc (Zn)Antimicrobial activity, improved productivity; potential neurotoxicity and reproductive toxicity[10]
Zinc (Zn), silver (Ag), selenium (Se), cerium (Ce), iron (Fe)Improved hemoglobin levels, enhanced productivity, potential oxidative stress, and tissue damage[11]
Selenium (Se)Enhanced antioxidant system, improved immune function; potential oxidative stress and inflammation[14]
Silver (Ag), zinc oxide (ZnO), titanium dioxide (TiO2)Improved productivity, antimicrobial activity, potential oxidative stress, and inflammation[21]
Table 2. Comparative analysis of nanoparticle toxicity in rats.
Nanoparticle TypeRats TypeMain OutcomesRef.
Magnesium oxide nanoparticles (MgO)Sprague–Dawley albino rats (Rattus norvegicus)250 and 1000 mg/kg doses; a highly significant increase in AST, ALT, ALP, and total bilirubin[24]
Iron oxide (IO)Wistar rats20, 40, and 80 mg/kg doses; significant changes in lungs, liver, and kidney; LDH increased significantly[25]
Crystalline silica (C-SiO2) NPs, silver-silica (Ag-SiO2), zinc-oxide silica (ZnO-SiO2)Rattus norvegicus500 µg/kg doses; significantly altered 95% of serological, DNA damage, histopathological, and oxidative stress parameters[26]
Aluminum oxide (Al2O3), zinc oxide (ZnO)Male Wistar rats70 mg/kg of Al2O3 and 100 mg/kg of ZnO NPs doses; increase in cytokines, p53, oxidative stress, creatine kinase, norepinephrine, acetylcholine, and lipid profile; significant decrease in the levels of antioxidant enzymes, total antioxidant capacity, and the activity of acetylcholine esterase in the brain, heart, and lung[27]
Zinc oxide (ZnO)Male Wistar rats4, 8, 25, 50, 100, and 200 mg/kg doses; histopathologic lesions in the heart structures of 200 mg/kg; doses higher than 25 mg/kg are not recommended in terms of toxicity.[28]
Colloidal silver nanoparticles (AgNPs)Male Wistar rats10 μg/kg/day and 100 μg/kg/day doses; a notable reduction in body weight and exhibited potential elevation in liver enzymes for the 100 μg/kg/day dose[29]
Zinc oxide (ZnO)Male Wistar rats3.1 mg/kg dose is optimal in terms of balanced elemental homeostasis; good predictive results for essential elements, proteins, and enzymes in the range from 1 mg/kg to 150 mg/kgOur research
Table 3. Evaluation of augmented data.
Number of RecordsTotal ScoreColumn Shapes ScoreColumn Pair Trends Score
EH_Synt_1 data
1000.80690.72170.8922
2000.80590.72130.8904
3000.81320.73020.8961
5000.81200.72880.8953
EH_Synt_2 data
1000.82700.77290.8811
2000.82850.77240.8845
3000.82540.77150.8793
5000.82690.77300.8807
Table 4. Correlation graph weight calculations.
Experimental GroupCGWCGW, α = 0.5
Both EH_1 and EH_2 datasets
1C+457.35293.23
2C470.82315.21
3I group (6.2 mg/kg ZnO)461.12300.87
4II group (6.2 mg/kg ZnO NPs)440.52279.65
5III group (3.1 mg/kg ZnO NPs)474.28302.99
6IV group (1.55 mg/kg ZnO NPs)455.50294.54
7V group (150 mg/kg ZnO NPs)466.35299.43
Blood data
1C+23.9315.82
2C25.1817.52
3I group (6.2 mg/kg ZnO)24.1815.56
4II group (6.2 mg/kg ZnO NPs)25.0416.74
5III group (3.1 mg/kg ZnO NPs)23.4015.44
6IV group (1.55 mg/kg ZnO NPs)25.4417.26
7V group (150 mg/kg ZnO NPs)27.2719.70
Brain data
1C+48.7734.56
2C52.1241.30
3I group (6.2 mg/kg ZnO)45.4133.43
4II group (6.2 mg/kg ZnO NPs)47.6934.02
5III group (3.1 mg/kg ZnO NPs)44.5030.73
6IV group (1.55 mg/kg ZnO NPs)47.7536.21
7V group (150 mg/kg ZnO NPs)51.5437.71
Kidney data
1C+14.7910.47
2C19.6217.20
3I group (6.2 mg/kg ZnO)13.909.83
4II group (6.2 mg/kg ZnO NPs)15.9111.48
5III group (3.1 mg/kg ZnO NPs)12.698.56
6IV group (1.55 mg/kg ZnO NPs)16.4312.64
7V group (150 mg/kg ZnO NPs)15.5311.40
Liver data
1C+24.2919.18
2C23.7617.65
3I group (6.2 mg/kg ZnO)25.2518.48
4II group (6.2 mg/kg ZnO NPs)21.3314.16
5III group (3.1 mg/kg ZnO NPs)21.1915.25
6IV group (1.55 mg/kg ZnO NPs)24.5518.74
7V group (150 mg/kg ZnO NPs)21.5414.95
Muscle data
1C+26.7020.00
2C13.788.70
3I group (6.2 mg/kg ZnO)14.3810.93
4II group (6.2 mg/kg ZnO NPs)13.418.21
5III group (3.1 mg/kg ZnO NPs)15.3710.77
6IV group (1.55 mg/kg ZnO NPs)13.438.58
7V group (150 mg/kg ZnO NPs)15.2110.78
Table 5. Weighted importance score comparison.
Experimental GroupWeighted Importance Score
1III group (3.1 mg/kg ZnO NPs)1.319
2C1.224
3II group (6.2 mg/kg ZnO NPs)1.095
4I group (6.2 mg/kg ZnO)1.063
5V group (150 mg/kg ZnO NPs)1.061
6IV group (1.55 mg/kg ZnO NPs)1.011
7C+0.58
Table 6. Comparison of regression models and their parameters for predicting the levels of essential elements in the EH_Synt_1 dataset.
ElementModelParametersRMSEMAEResiduals
Distribution
Predicted Max Content
1FeKernel Ridgekernel = ‘rbf’0.27870.3995Asymmetrical2.9512
kernel = ‘chi2’0.31950.4205Asymmetrical2.7698
kernel = ‘laplacian’0.35150.4443Asymmetrical2.6436
FCNNactivation = ‘tanh’0.26190.3905Asymmetrical3.2968
activation = ‘sigmoid’0.31020.4442Asymmetrical2.9483
activation = ‘softmax’0.28410.4203Asymmetrical2.7619
activation = ‘swish’0.34980.4237Asymmetrical3.5429
2ZnKernel Ridgekernel = ‘rbf’0.26210.3988Asymmetrical2.0894
kernel = ‘chi2’0.22460.3739Multimodal2.4197
kernel = ‘laplacian’0.25910.4104Asymmetrical2.5861
FCNNactivation = ‘tanh’0.10290.2556Asymmetrical2.3542
activation = ‘sigmoid’0.16440.3198Asymmetrical2.0265
activation = ‘softmax’0.10160.2531Asymmetrical2.2347
activation = ‘swish’0.17970.3071Asymmetrical2.1959
3CuKernel Ridgekernel = ‘rbf’0.64910.6345Asymmetrical3.0081
kernel = ‘chi2’0.60630.6091Asymmetrical2.7348
kernel= ‘laplacian’0.60790.6043Asymmetrical2.7927
FCNNactivation = ‘tanh’0.51970.5419Asymmetrical2.7821
activation = ‘sigmoid’0.59590.5853Asymmetrical2.2453
activation = ‘softmax’0.62740.5906Asymmetrical2.3305
activation = ’swish’0.60280.5955Asymmetrical2.5059
4MnKernel Ridgekernel = ‘rbf’0.34090.4838Multimodal1.2808
kernel = ‘chi2’0.26950.4232Multimodal0.6692
kernel = ‘laplacian’0.32070.4336Multimodal0.5349
FCNNactivation = ‘tanh’0.03090.1412Multimodal0.2166
activation = ‘sigmoid’0.03230.1461Multimodal0.2598
activation = ‘softmax’0.03010.1368Multimodal0.3187
activation = ’swish’0.04130.1470Multimodal0.2062
5CoKernel Ridgekernel = ‘rbf’0.39300.4909Multimodal0.3964
kernel = ‘chi2’0.21610.3426Multimodal0.6996
kernel = ‘laplacian’0.30820.4400Multimodal0.8097
FCNNactivation = ‘tanh’0.03360.1484Multimodal0.2830
activation = ‘sigmoid’0.03630.1584Multimodal0.3190
activation = ‘softmax’0.03050.1298Multimodal0.3104
activation = ’swish’0.11260.2129Multimodal0.5359
6SeKernel Ridgekernel = ‘rbf’0.18160.3158Multimodal1.6265
kernel = ‘chi2’0.31380.4278Multimodal2.0551
kernel = ‘laplacian’0.36600.4779Multimodal1.1546
FCNNactivation = ‘tanh’0.02240.1242Asymmetrical0.5166
activation = ‘sigmoid’0.02430.1283Asymmetrical0.4496
activation = ‘softmax’0.01930.1164Asymmetrical0.4557
activation = ’swish’0.06360.1474Asymmetrical0.5595
7IKernel Ridgekernel = ‘rbf’0.37190.4487Multimodal1.1298
kernel = ‘chi2’0.30360.4342Multimodal0.7566
kernel = ‘laplacian’0.27730.4258Multimodal1.2144
FCNNactivation = ‘tanh’0.02100.1134Multimodal0.3210
activation = ‘sigmoid’0.02090.11511Multimodal0.4038
activation = ‘softmax’0.01610.1030Multimodal0.3103
activation = ’swish’0.05820.1437Multimodal0.3563
8CrKernel Ridgekernel = ‘rbf’0.42440.5110Multimodal0.3600
kernel = ‘chi2’0.18000.3301Multimodal1.0060
kernel = ‘laplacian’0.28130.4280Multimodal0.8072
FCNNactivation = ‘tanh’0.02910.1362Multimodal0.2161
activation = ‘sigmoid’0.03400.1504Multimodal0.3866
activation = ‘softmax’0.02970.1378Multimodal0.2245
activation = ’swish’0.06480.1715Multimodal0.4179
Table 7. Comparison of regression models and their parameters for predicting the levels of toxic elements in the EH_Synt_1 dataset.
ElementModelParametersRMSEMAEResiduals
Distribution
Predicted Max content
1SnKernel Ridgekernel = ‘rbf’0.32730.4493Multimodal0.6358
kernel = ‘chi2’0.32280.4881Multimodal0.5155
kernel = ‘laplacian’0.25660.4080Multimodal0.8477
FCNNactivation = ‘tanh’0.03250.1469Multimodal0.2775
activation = ‘sigmoid’0.03150.1438Multimodal0.2979
activation = ‘softmax’0.02990.1368Multimodal0.3272
activation = ‘swish’0.07610.1931Multimodal0.5563
2AlKernel Ridgekernel = ‘rbf’0.24350.4112Multimodal0.8085
kernel = ‘chi2’0.42540.4732Asymmetrical0.3071
kernel = ‘laplacian’0.35580.4688Multimodal0.3434
FCNNactivation = ‘tanh’0.02480.1264Asymmetrical0.3146
activation = ‘sigmoid’0.03080.1452Asymmetrical0.3201
activation = ‘softmax’0.03250.1494Asymmetrical0.3039
activation = ‘swish’0.16290.2027Multimodal0.6211
3AsKernel Ridgekernel = ‘rbf’0.37670.4672Multimodal1.8047
kernel = ‘chi2’0.33680.4689Multimodal0.5911
kernel = ‘laplacian’0.28870.4435Multimodal0.7845
FCNNactivation = ‘tanh’0.02880.1367Multimodal0.2441
activation = ‘sigmoid’0.03490.1538Multimodal0.2718
activation = ‘softmax’0.02720.1314Multimodal0.2665
activation = ’swish’0.10430.1979Multimodal0.5054
4HgKernel Ridgekernel = ‘rbf’0.31550.4647Multimodal0.6869
kernel = ‘chi2’0.37280.4747Multimodal1.0555
kernel = ‘laplacian’0.30180.4151Multimodal0.4964
FCNNactivation = ‘tanh’0.03420.1497Multimodal0.3177
activation = ‘sigmoid’0.03530.1552Multimodal0.3263
activation = ‘softmax’0.02920.1337Multimodal0.3183
activation = ’swish’0.06790.1671Multimodal0.1973
5PbKernel Ridgekernel = ‘rbf’0.26800.4015Multimodal1.3640
kernel = ‘chi2’0.27040.4107Multimodal0.6657
kernel = ‘laplacian’0.32060.4354Multimodal0.9522
FCNNactivation = ‘tanh’0.03220.1455Multimodal0.3568
activation = ‘sigmoid’0.03300.1484Multimodal0.3164
activation = ‘softmax’0.02940.1350Multimodal0.3146
activation = ’swish’0.16380.2251Multimodal0.3828
6BeKernel Ridgekernel = ‘rbf’0.31860.4307Multimodal0.8344
kernel = ‘chi2’0.45140.5470Multimodal0.9656
kernel = ‘laplacian’0.30620.4377Multimodal0.1190
FCNNactivation = ‘tanh’0.03820.1597Multimodal0.2436
activation = ‘sigmoid’0.03280.1487Multimodal0.3366
activation = ‘softmax’0.03130.1340Multimodal0.2603
activation = ’swish’0.17040.2423Multimodal0.3919
7CdKernel Ridgekernel = ‘rbf’0.29550.4306Multimodal0.4646
kernel = ‘chi2’0.29320.4290Multimodal0.8920
kernel = ‘laplacian’0.39880.4934Multimodal0.8130
FCNNactivation = ‘tanh’0.03220.1434Multimodal0.4029
activation = ‘sigmoid’0.03350.1493Multimodal0.2838
activation = ‘softmax’0.02680.1269Multimodal0.3301
activation = ’swish’0.17340.2314Multimodal0.4846
Table 8. Comparison of regression models and their parameters for predicting the levels of proteins and ferments in the EH_Synt_2 dataset.
ElementModelParametersRMSEMAEResiduals
Distribution
Predicted Max Content
1CA4Kernel Ridgekernel = ‘rbf’14.62072.5678Multimodal26.9611
kernel = ‘chi2’15.64882.6430Asymmetrical26.0791
kernel = ‘laplacian’13.86502.4912Multimodal24.5711
FCNNactivation = ‘tanh’40.63574.6784Asymmetrical19.3162
activation = ‘sigmoid’40.85864.7742Asymmetrical19.1345
activation = ‘softmax’263.202014.917Asymmetrical4.0573
activation = ‘swish’15.00172.5964Asymmetrical26.8949
2ADH1BKernel Ridgekernel = ‘rbf’3.55691.2353Multimodal54.9218
kernel = ‘chi2’4.14771.3417Multimodal57.6527
kernel = ‘laplacian’3.87031.2907Multimodal47.6248
FCNNactivation = ‘tanh’30.75184.7432Multimodal48.5105
activation = ‘sigmoid’37.83074.5278Multimodal45.5706
activation = ‘softmax’2001.9344.3947Multimodal4.1230
activation = ‘swish’6.05341.8218Asymmetrical59.6373
3ALPKernel Ridgekernel = ‘rbf’9.99651.9220Multimodal26.6896
kernel = ‘chi2’9.48671.8509Multimodal26.8992
kernel = ‘laplacian’10.35921.9001Multimodal21.3801
FCNNactivation = ‘tanh’22.87333.2491Asymmetrical22.3343
activation = ‘sigmoid’22.20923.1820Multimodal22.7722
activation = ‘softmax’357.259318.2905Asymmetrical3.9571
activation = ’swish’10.19032.1047Asymmetrical26.9728
4ZAGKernel Ridgekernel = ‘rbf’0.07720.1955Multimodal12.0935
kernel = ‘chi2’0.09170.2112Multimodal12.2758
kernel = ‘laplacian’0.08240.1989Multimodal11.5086
FCNNactivation = ‘tanh’0.29830.4494Multimodal11.6732
activation = ‘sigmoid’0.39570.5246Multimodal11.4666
activation = ‘softmax’55.91667.4532Multimodal3.9647
activation = ’swish’0.23900.3785Multimodal12.1311
5SOD-ZnKernel Ridgekernel = ‘rbf’1.42880.6696Multimodal10.2444
kernel= ‘chi2’1.52020.6944Multimodal10.5237
kernel = ‘laplacian’1.44310.6727Multimodal9.1893
FCNNactivation = ‘tanh’1.50720.7509Asymmetrical10.1673
activation = ‘sigmoid’1.68790.8332Asymmetrical10.0199
activation = ‘softmax’28.49875.0826Asymmetrical3.7381
activation = ’swish’1.47180.6924Asymmetrical10.1762
6MT1Kernel Ridgekernel = ‘rbf’18.62262.6608Asymmetrical79.6881
kernel = ‘chi2’20.95682.8212Asymmetrical83.6053
kernel = ‘laplacian’20.35032.8068Asymmetrical75.3316
FCNNactivation = ‘tanh’67.11407.3396Multimodal72.1062
activation = ‘sigmoid’395.944119.1312Asymmetrical64.6869
activation = ‘softmax’5555.8574.3725Asymmetrical4.0292
activation = ’swish’25.19683.9657Asymmetrical83.0218
7MT2Kernel Ridgekernel = ‘rbf’0.93640.6131Asymmetrical6.3687
kernel = ‘chi2’0.93250.6285Asymmetrical7.1156
kernel = ‘laplacian’0.80810.5622Asymmetrical5.5452
FCNNactivation = ‘tanh’1.06110.7543Asymmetrical6.7182
activation = ‘sigmoid’1.03250.7113Asymmetrical6.4843
activation = ‘softmax’6.91132.4723Asymmetrical3.6365
activation = ‘swish’1.03150.7060Asymmetrical7.2760
8MT3Kernel Ridgekernel = ‘rbf’0.35270.4698Multimodal1.0865
kernel = ‘chi2’0.31990.4196Multimodal0.9241
kernel = ‘laplacian’0.22910.3630Multimodal0.9298
FCNNactivation = ‘tanh’0.02110.1125Multimodal0.4658
activation = ‘sigmoid’0.02420.1233Multimodal0.3263
activation = ‘softmax’0.01820.1104Multimodal0.2827
activation = ‘swish’0.08950.1798Multimodal0.4480
Disclaimer/Publisher’s Note: The statements, opinions and data contained in all publications are solely those of the individual author(s) and contributor(s) and not of MDPI and/or the editor(s). MDPI and/or the editor(s) disclaim responsibility for any injury to people or property resulting from any ideas, methods, instructions or products referred to in the content.