Article

CRISP-NET: Integration of the CRISP-DM Model with Network Analysis

by
Héctor Alejandro Acuña-Cid
1,2,
Eduardo Ahumada-Tello
2,3,*,
Óscar Omar Ovalle-Osuna
2,
Richard Evans
4,
Julia Elena Hernández-Ríos
1 and
Miriam Alondra Zambrano-Soto
1
1
Unidad Profesional Interdisciplinaria de Ingeniería Campus Zacatecas (UPIIZ), Instituto Politécnico Nacional, Zacatecas 98160, Mexico
2
Posgrado en Gestión de la Ingeniería, Facultad de Ciencias de la Ingeniería, Administrativas y Sociales, Universidad Autónoma de Baja California, Tecate 21400, Mexico
3
Facultad de Contaduría y Administración, Universidad Autónoma de Baja California, Tijuana 22424, Mexico
4
Faculty of Computer Science, Dalhousie University, Halifax, NS B3H 4R2, Canada
*
Author to whom correspondence should be addressed.
Mach. Learn. Knowl. Extr. 2025, 7(3), 101; https://doi.org/10.3390/make7030101
Submission received: 10 August 2025 / Revised: 1 September 2025 / Accepted: 12 September 2025 / Published: 16 September 2025

Abstract

To carry out data analysis, it is necessary to implement a model that guides the process in an orderly and sequential manner, with the aim of maintaining control over software development and its documentation. One of the most widely used tools in the field of data analysis is the Cross-Industry Standard Process for Data Mining (CRISP-DM), which serves as a reference framework for data mining, allowing the identification of patterns and, based on them, supporting informed decision-making. Another tool used for pattern identification and the study of relationships within systems is network analysis (NA), which makes it possible to explore how different components are interconnected. The integration of these tools can be justified and developed under the principles of Situational Method Engineering (SME), which allows for the adaptation and customization of existing methods according to the specific needs of a problem or context. Through SME, it is possible to determine which components of CRISP-DM need to be adjusted to efficiently incorporate NA, ensuring that this integration aligns with the project’s objectives in a structured and effective manner. The proposed methodological process was applied in a real working group, which allowed its functionality to be validated, each phase to be documented, and concrete outputs to be generated, demonstrating its usefulness for the development of analytical projects.

1. Introduction

The Cross-Industry Standard Process for Data Mining (CRISP-DM) model is a proven and widely adopted framework that guides data analysts through the various phases of the data mining process, from understanding the problem to implementing solutions [1]. It has become one of the most widely used methodologies in data mining, surpassing other approaches such as SEMMA [2].
Recent studies have confirmed its utility in different domains, such as predicting student retention in higher education [3] and anticipating dropout risks using data from virtual learning platforms [4]. These applications demonstrate the enduring relevance of CRISP-DM, while also highlighting its limitations, particularly its sequential nature, which constrains its ability to analyze more complex relational structures.
Network analysis, on the other hand, is a multidisciplinary technique that originates at the intersection of sociology and mathematics. It focuses on exploring and studying the relationships between entities within interconnected systems and has been applied in diverse areas such as communication, knowledge transfer, economic flows, and organizational processes [5,6].
More recent research has expanded these perspectives, applying network analysis to capture structural and dynamic patterns in complex systems. For example, Paradowski et al. [7] used dynamic social network analysis to examine interaction patterns in second-language learning, while Saqr et al. [8] introduced Transition Network Analysis (TNA), a novel approach for modeling relational and temporal processes in learning and organizational contexts. These advances emphasize the capacity of network analysis to complement traditional data mining frameworks by incorporating both structural and dynamic perspectives.
From this perspective, it is common to find cases where methodological processes are integrated or adapted to meet specific needs, such as the identification of patterns in complex data. This approach relates to Situational Method Engineering (SME), a concept from software engineering which, according to Henderson-Sellers et al. [9], involves adapting existing methods to fit the particular conditions of each context. This process encompasses the design, construction, and customization of methods, techniques, and tools.
In this context, this article presents a methodological proposal that combines the CRISP-DM model with network analysis techniques, guided by SME. The integration articulates the sequential structure of CRISP-DM with the relational approach of network analysis through the stages defined by SME.

2. Theoretical Background

2.1. CRISP-DM

As previously mentioned, the Cross-Industry Standard Process for Data Mining (CRISP-DM) is a guide for data analysis and data mining. It consists of six phases, each of which helps the analyst maintain a structured approach to the analysis by outlining the actions required to complete each phase. This model can be treated as an iterative process, but it also allows flexibility to return to any previous phase if corrections or adjustments are needed. According to IBM [1], the six phases are listed in Table 1.
In Figure 1, the process presented by IBM can be observed; in it, each of the six phases of CRISP-DM can be followed.
The use of CRISP-DM in the field of data science has developed a trend toward its implementation, which, according to a search on the IEEE Xplore website, resulted in only 251 articles using the CRISP-DM methodology between 2003 and 2024 as shown in Figure 2. As of the date of this analysis, these are the identified results IEEE Xplore [10].
Similarly, an additional search was conducted in Scopus, a widely used database for consulting research material. It yielded more results, with 1119 documents related to the CRISP-DM model found as of the date of this analysis [11]. It is worth noting that the same trend observed in IEEE Xplore is also present here, clearly indicating that the use of this tool is consistent. As shown in Figure 3, this aligns with the trend of using this model for data science, allowing it to be adapted with other techniques to improve its application.
In this context, the implementation of CRISP-DM has been consolidated as a valuable tool for the development of multiple data science projects in different areas of knowledge. One example is the work of Flores-Villamil et al. [12], who implemented it to identify the safety and health risks faced by schools and their populations due to their proximity to hazardous elements, whether natural or infrastructural. The study was conducted with data from Mexico and focused on geospatial analysis and unsupervised machine learning techniques, specifically the K-Modes clustering algorithm, to identify and classify hazardous elements near schools.
Another study is that of Dursun and Sabyrzhan [13], who used CRISP-DM in the development of smart buildings in universities, aiming to optimize the use of resources such as heating and lighting in classrooms and laboratories. Their approach integrated autonomous control systems capable of significantly reducing energy consumption and operational costs. The study showed that the quality of the data used directly influenced the results of the machine learning model, and that the patterns identified through CRISP-DM facilitated more efficient planning. However, the level of savings varied depending on external conditions and the occupancy of each space.
Similarly, Torres et al. [14] worked on the efficient management of inventories in small- and medium-sized enterprises (SMEs) in the retail sector, a key aspect that influences their operation, costs, and competitiveness. They applied the CRISP-DM model in the development of a demand forecasting model based on historical sales records. The process included preprocessing tasks, cross-validation, and the evaluation of various machine learning algorithms, including Random Forest, LSTM (Long Short-Term Memory), XGBoost (Extreme Gradient Boosting), and Decision Tree, using metrics such as MAE (Mean Absolute Error), MSE (Mean Squared Error), and R2 (Coefficient of Determination). They concluded that the implementation of CRISP-DM allowed for structuring the workflow, facilitating pattern identification, and improving inventory management accuracy.
For their part, Gill et al. [15] used the model to integrate ontology design with expert knowledge and data mining in the development of a model applied to the corrective maintenance of Cyber–Physical Systems (CPSs). Through this approach, they created a specific ontology that facilitates anomaly detection through a temporal automaton. They used ontological design patterns, such as UML State Machine and ISO 17359 standard, which allowed them to expand the structure of the ontology and improve its application in digital services focused on maintenance management.
In the work of Vásquez et al. [16], CRISP-DM was applied to predict technical support demand in a banking company, based on a dataset generated between 2020 and 2023. During the process, temporal patterns were identified, records were cleaned, and several algorithms were trained, with Random Forest standing out for its accuracy. The model allowed for anticipating demand and allocating resources more efficiently, with potential applications in sectors such as finance, advertising, and healthcare.
Finally, in the work of Acuña-Cid et al. [17], the CRISP-DM methodology was implemented to develop a predictive analysis of hypertension risk in Mexican adults using nutritional and caloric indicators. The process included the collection, cleaning, and selection of variables related to macronutrient intake, which allowed for the structuring of a quality dataset. Various machine learning models were evaluated, with Random Forest standing out for its accuracy and XGBoost for its efficiency with large data volumes, while Naive Bayes showed the lowest performance. The SMOTE (Synthetic Minority Over-sampling Technique) method was also applied to address class imbalance, which improved the model’s results, and the importance of proteins, carbohydrates, and lipids in risk prediction was highlighted, especially in young adults, providing a useful basis for future public health interventions.
Despite its widespread adoption, Saltz et al. [18] point out that CRISP-DM presents several limitations that may affect its implementation in modern data science environments. One of its main weaknesses is its rigid and sequential approach, which can lead to slow and non-adaptive processes if rapid iterations are not incorporated. Another critical aspect is the lack of integration with modern technologies, such as cloud architectures and version control tools, which reduces its efficiency in current analytical scenarios. The absence of clear communication strategies with stakeholders is also identified, which can lead to a disconnect between technical teams and decision-makers. Furthermore, CRISP-DM is not a project management framework, which limits its application in multidisciplinary teams without a complementary methodology to facilitate work coordination. Therefore, it becomes necessary to modify or integrate the model with tools that address its limitations and adapt it to current contexts.

2.2. Network Analysis

To conceptualize the term “network analysis”, we can refer to Quiroz Zamora and Arias Novelo [19], who state that it is a branch of discrete mathematics that allows for the identification and analysis of relationships and interactions with different types of nodes. These nodes can represent any element that forms part of the network, such as people, groups, and devices, or when viewed from a health perspective, symptoms, age, weight, and height; the important thing is that they have something in common in order to be considered a network. Two isolated nodes cannot be considered a network.
Once the general logic of network analysis is understood, it is possible to identify its main components. These include not only structural elements such as nodes, links, directionality, and network structures [19] but also more specific aspects that enrich the analysis, such as the weighting of links [20] and the attributes associated with nodes [21] and with links [22]. The definitions and functions of each of these elements are presented in Table 2.
Understanding the elements of network analysis is key to comprehending how different components within a system are related, as this technique allows for the representation of complex phenomena and has been adapted in various processes to facilitate their analysis. Similar to CRISP-DM, a search was conducted on the IEEE Xplore website to identify how many projects have used network analysis as a foundation, and this topic showed a significantly higher presence, with approximately 1684 results between 2020 and 2025 alone [23]. Although this technique is widely used in different fields, only the IEEE database was used due to its specialized focus on engineering, data science, and artificial intelligence.
To identify the thematic areas in which network analysis is applied, clustering was performed with Python (version 3.11.1) using the keywords from the articles. This technique allowed for grouping the most relevant topics into five clusters, defined using the elbow method, which consists of plotting the Within-Cluster Sum of Squares (WCSS) against the number of clusters and selecting the point where the decrease in WCSS becomes less pronounced, forming the so-called “elbow curve” [24]. In practical terms, this allowed for segmenting the keyword space into five groups with similar characteristics.
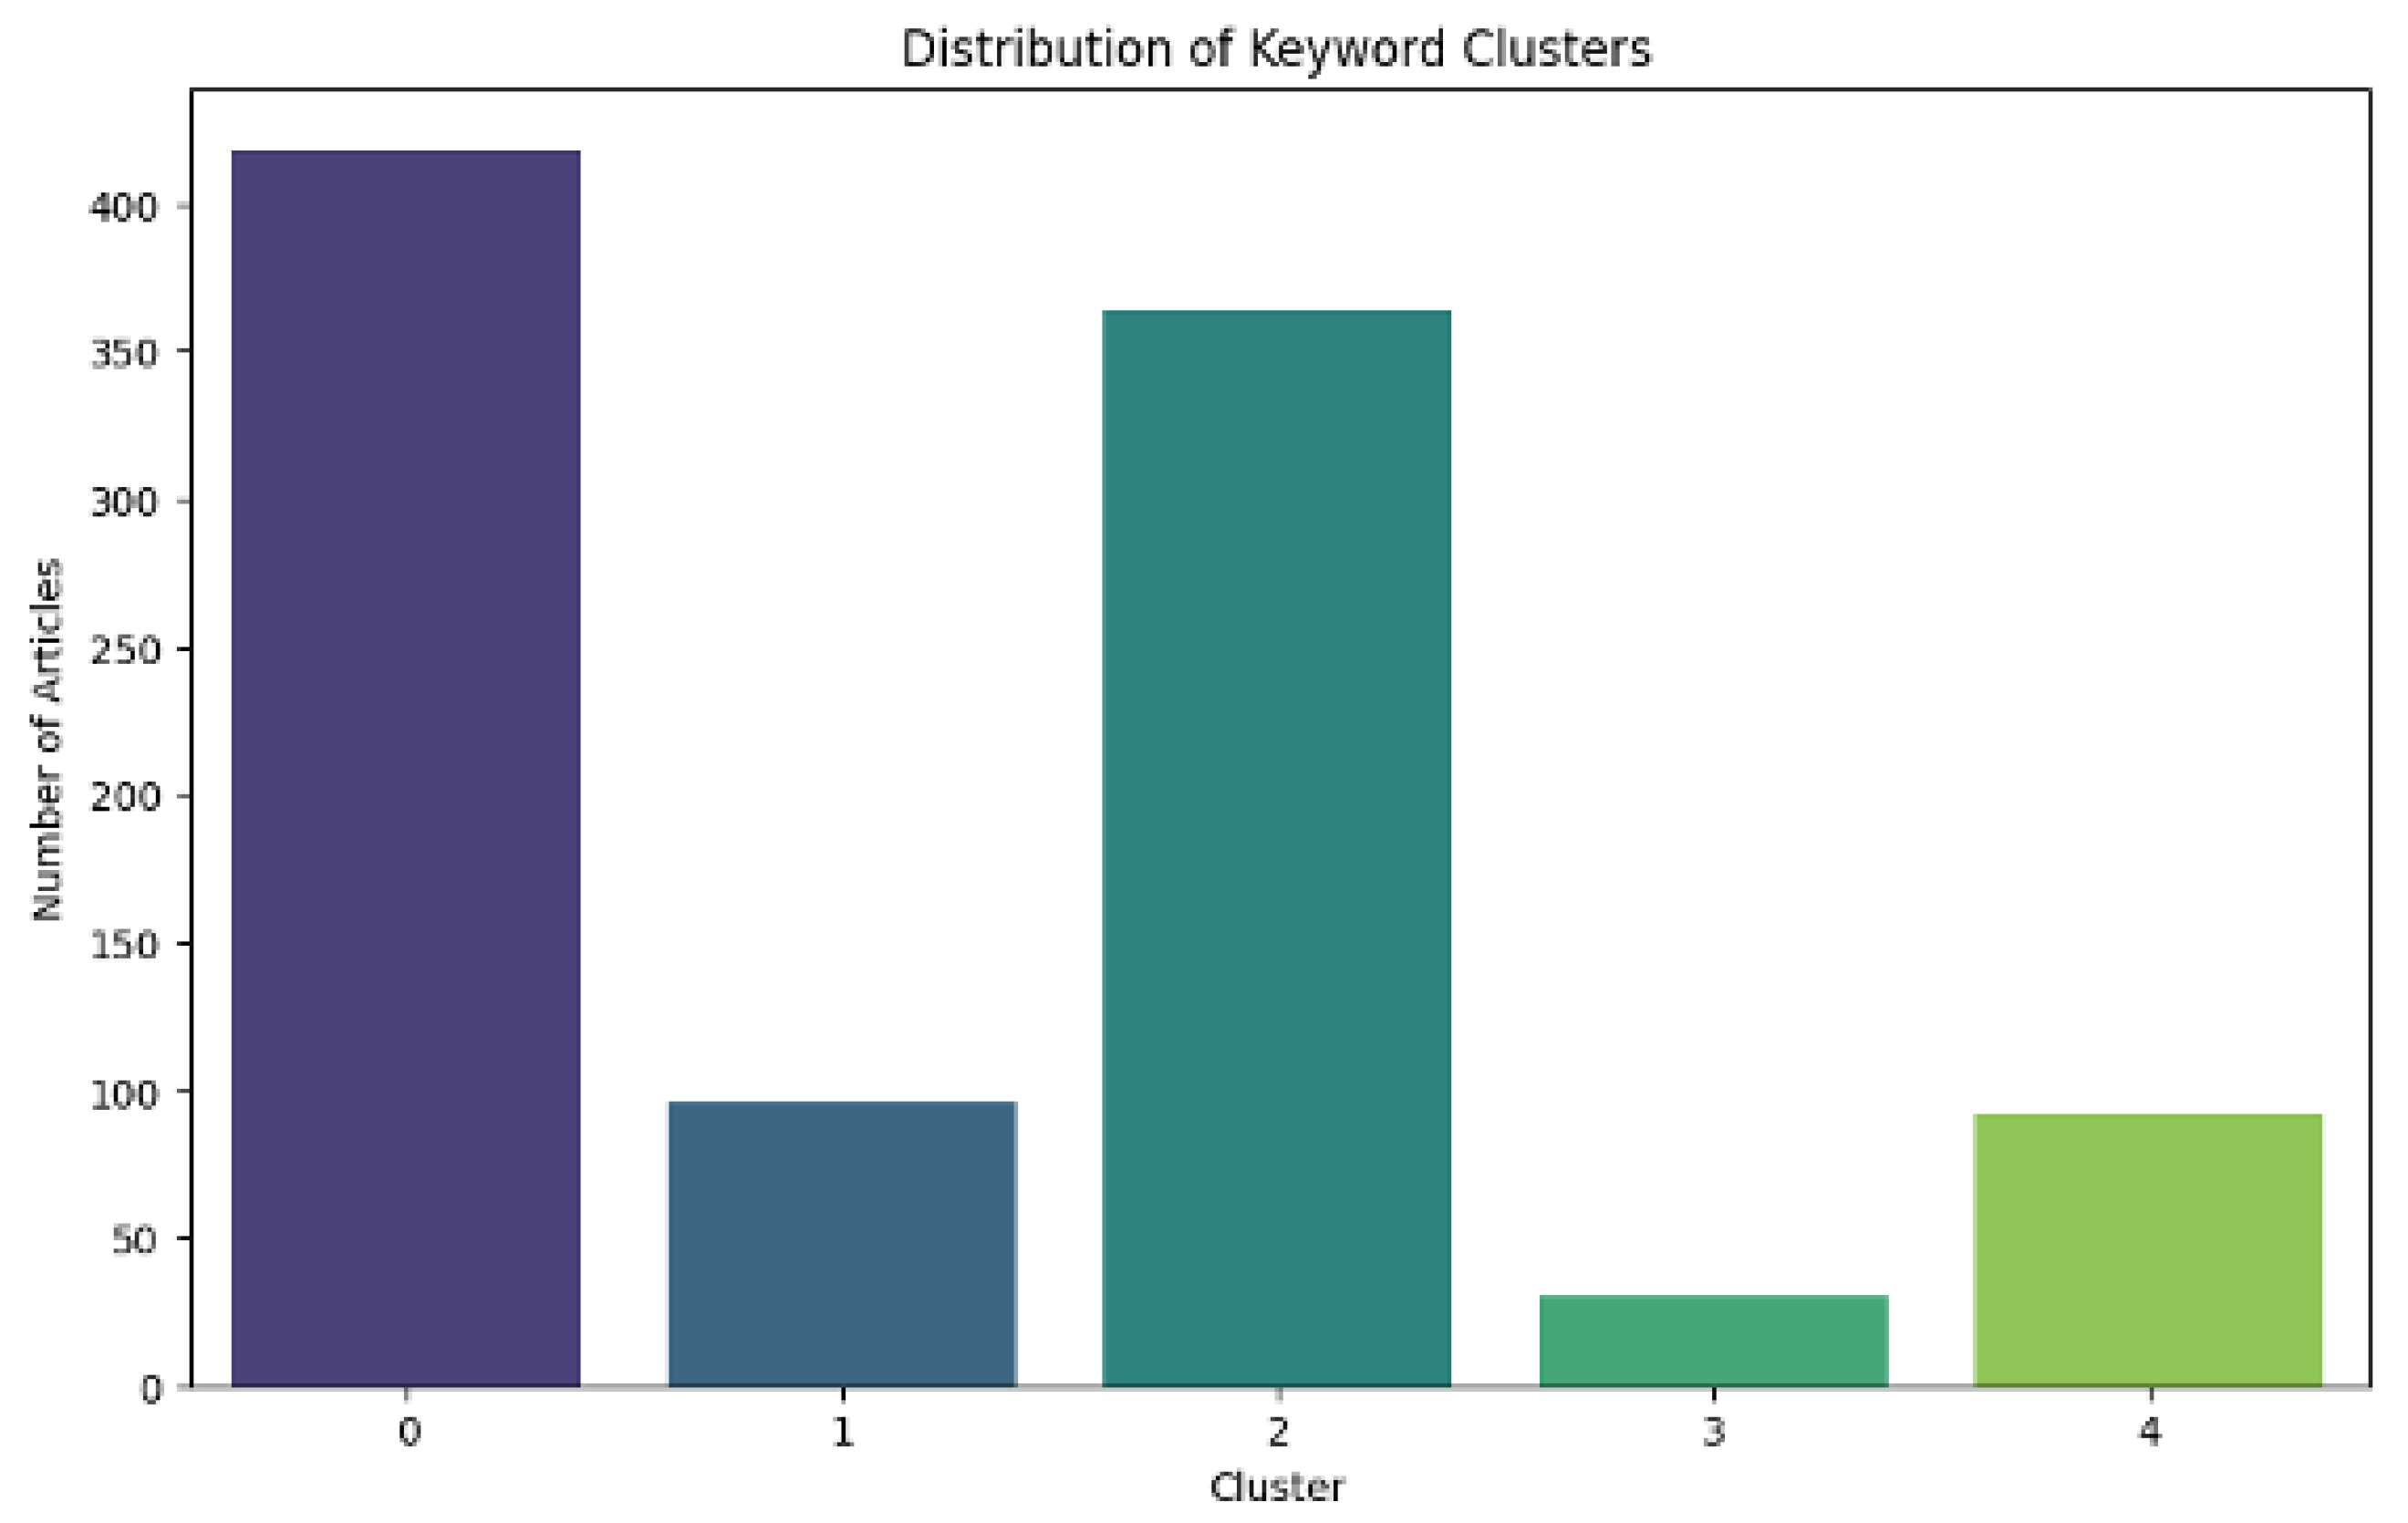
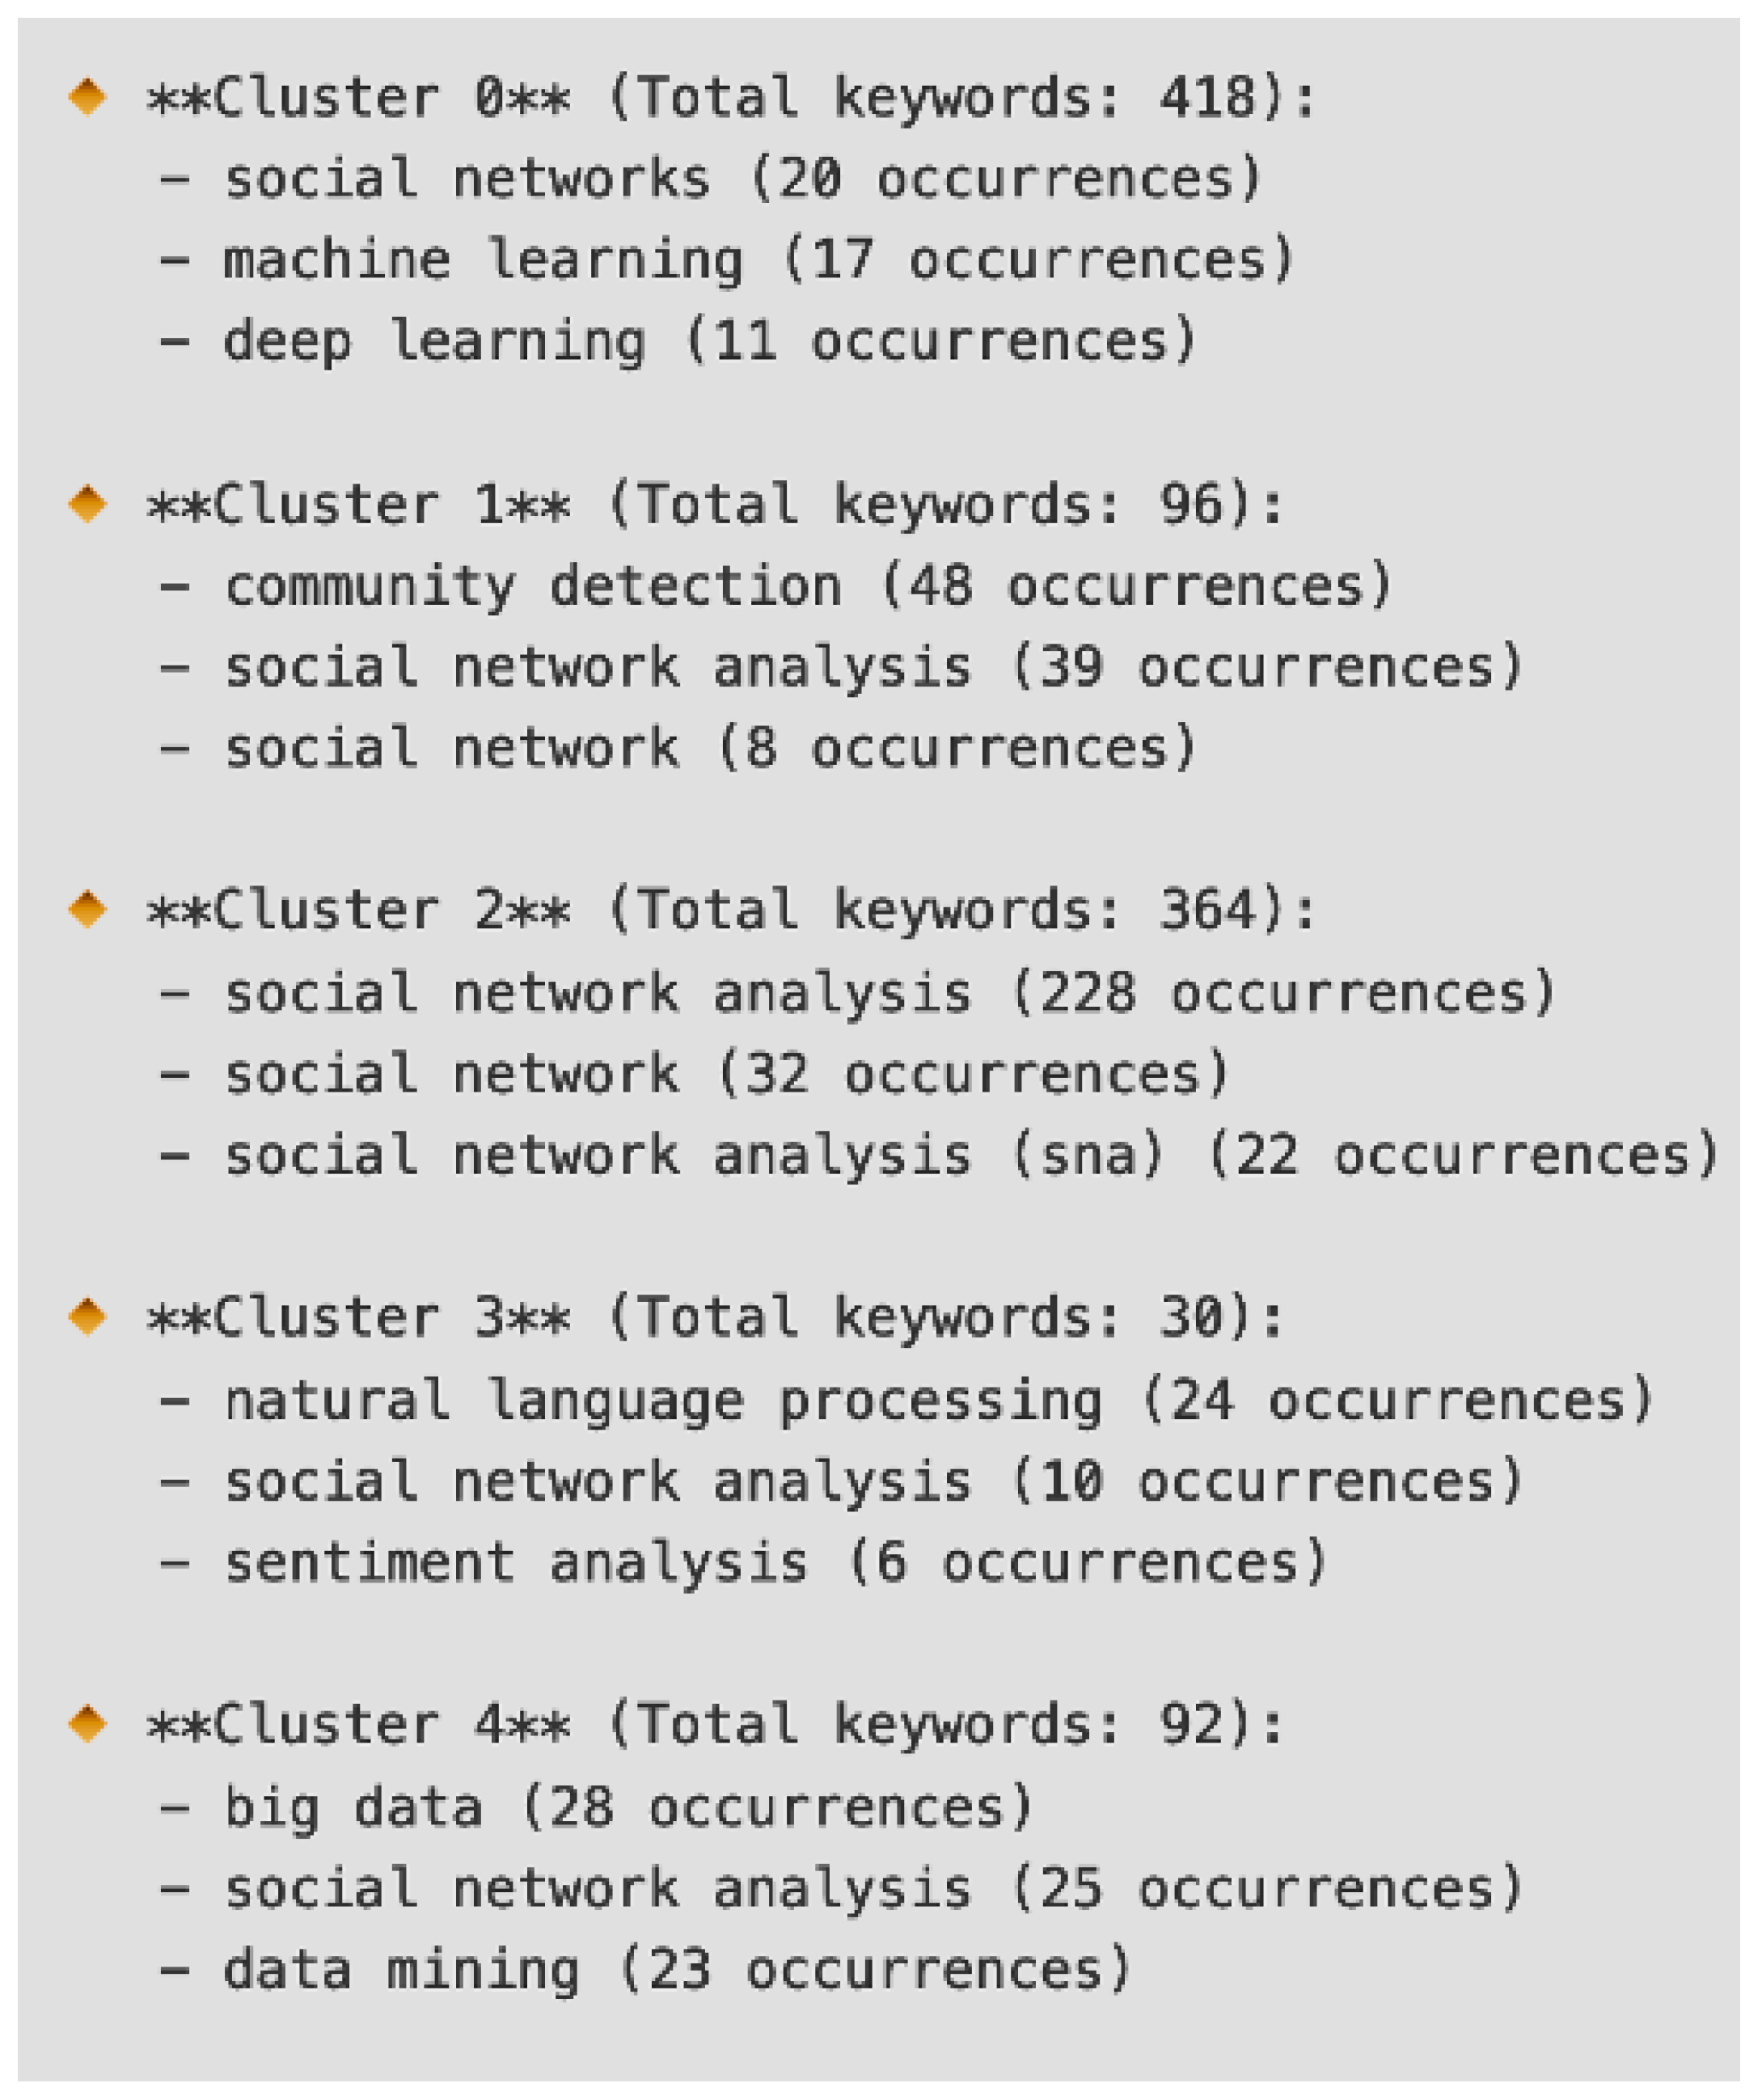
From the previous process, some results emerged with relevant particularities. One of them is the appearance of similar keywords in different clusters, which is related to the interdisciplinary nature of terms such as machine learning, social network analysis, and sentiment analysis, as they are used across various research areas. For this reason, it is common for the same term to appear in more than one group, without this representing an error in the clustering as shown in Figure 4, which displays the distribution of articles by cluster.
This grouping was generated using TF-IDF (Term Frequency-Inverse Document Frequency) vectorization, a technique commonly used in information retrieval and text mining to evaluate the importance of a word within a document in relation to a broader collection [25]. Although TF-IDF allows for grouping similar terms, it does not prevent certain keywords, due to their general relevance, from appearing in multiple documents or clusters.
Based on this clustering, five clusters were identified that reflect specific thematic areas. Cluster 0 encompassed general topics such as machine learning and social network analysis; Cluster 1 specialized in community detection and complex networks; Cluster 2 focused on practical applications such as sentiment analysis and text mining; Cluster 3 concentrated on natural language processing (NLP) and textual analysis; and Cluster 4 centered on big data and data processing. These results highlight the diversity and interdisciplinary focus of network analysis, which ranges from theoretical studies (Clusters 1 and 3) to practical applications (Clusters 2 and 4). Figure 5 shows the three most frequent keywords in each group.
Identifying the thematic areas in which network analysis has been applied provides a general overview of its main uses and approaches. This thematic classification facilitates the organization of available knowledge and serves as a basis for locating representative works, allowing for a deeper understanding of its concrete applications and the methodologies used in different contexts.
One of the articles found on the IEEE Xplore platform is the work by Kamalzadeh and Haghighat [26], who used network analysis to identify influential users within the hashtag network of the Zar Makaron brand. Through metrics such as centrality and PageRank, they were able to detect key nodes (hubs) that facilitated the dissemination of information and optimized digital marketing strategies. The results matched the users previously identified by the company and showed how the online activity of these profiles aligned with real-world events, reinforcing the usefulness of network analysis as a tool for decision-making and behavior prediction in digital environments.
Another relevant study is that of Jiang et al. [27], who applied network analysis to examine the structure of financial agglomeration in the Beijing–Tianjin–Hebei region. Using centrality metrics, they identified Beijing and Tianjin as the main influential nodes, as well as subgroups of interconnected cities within the network. The model used considered the spatial connections between cities as points and lines, allowing for a graphical representation of financial relationships. The authors concluded that strengthening these connections and promoting collaborative development are key to reducing regional imbalances.
In the study by Qian and Li [28] titled “Research Status and Trends of Panoramic Video in Education: Based on Social Network Analysis and Co-word Analysis Method”, network analysis and co-word analysis were applied to explore trends in the use of panoramic video in the educational field. Through keyword social maps, they identified core concepts such as virtual reality and 360-degree video, as well as their thematic connections. Centrality analysis allowed for the prediction of future research trends, such as the development of educational applications based on virtual reality, the optimization of learner experience, and the study of immersion and presence in learning environments. Advances in technologies related to panoramic video are also anticipated, reinforcing the usefulness of network analysis for understanding current and emerging approaches in the educational field.
Finally, an example of the implementation of network analysis can be found in the study by Medina Nogueira et al. [29], where a procedure is proposed in the university context for auditing knowledge management. This methodology is organized into three phases, each composed of specific stages that guide the process from domain delimitation to the quantitative analysis of the network. Table 3 summarizes this procedure, highlighting the key actions to structure, represent, and analyze the interactions among the involved actors.
Despite the growing application of network analysis in various fields, there is still a lack of standardization in methodological processes, which can limit its effective implementation. This is mentioned in the work of Valente et al. [30], where they emphasize that the absence of a clear methodological framework can make it difficult for studies to be replicated with the same results and for their findings to be compared across different investigations.
Similarly, Jerneck and Olsson [31] point out that in the field of innovation and futures studies, which focus on anticipating and analyzing possible scenarios to support decision-making, many studies recognize the value of network analysis but use it metaphorically, without taking advantage of the methodological possibilities that this technique offers.
On the other hand, Valente et al. [30] point out that in the context of implementing initiatives such as public policies, social programs, community strategies, or actions aimed at improving public health, a limited understanding of network structures can represent a significant barrier to their success. Network analysis provides valuable tools for understanding, monitoring, and influencing their development, especially when such actions need to be adapted to different environments.
To overcome these limitations, it is essential to have a methodological process that guides the application of network analysis in a structured and coherent way. Although there are various proposals, many of them are designed for very specific contexts, which makes it difficult to adopt them in other scenarios. Therefore, it is important to move toward a more general methodology that can be adapted to different settings, types of data, and analytical objectives, allowing for a broader and more consistent implementation of network analysis.

2.3. Situational Method Engineering

Situational Method Engineering (SME) is a discipline focused on the construction and adaptation of specific methods for particular projects, taking into account the unique characteristics of each situation. Its main objective is to provide a flexible approach that allows for the selection, adaptation, and assembly of methodological components to create customized solutions that fit the specific needs of a given project or context [32].
According to Harmsen [33], SME seeks to achieve controlled flexibility by building methods that fully consider the applicable circumstances of a given situation, referred to as situational methods. This approach enables organizations to develop methods that closely align with their specific needs and contexts, rather than adopting generic approaches that may not be suitable for all situations.
In practice, SME involves the identification and selection of fragments from existing methods, their adaptation to the specific characteristics of the project, and their integration into a cohesive and effective method. This approach has proven to be especially useful in the development of information systems and software engineering, where conditions and requirements can vary significantly between projects [33,34,35]. In this sense, and recalling that SME is based on a structured approach to building situational methods, it is possible to identify a series of common stages in its application as shown in Table 4.
Based on these stages, various studies have applied SME in different contexts to design methodologies tailored to specific situations. These documented experiences address challenges such as the integration of existing models, the adaptation of processes to particular environments, and the generation of flexible and reusable methodological solutions. Although the reported benefits are broad, such as customization and modularity, recurring challenges are also noted, including the technical complexity of implementation and limited empirical validation in certain cases.
Table 5 presents a comparative summary of recent studies that have used SME, highlighting the purpose of its application, the integrated methods or models, and the methodological products generated, as well as the advantages and limitations identified in each proposal.
When analyzing the information presented in Table 5, it becomes evident that the application of SME has been primarily oriented toward the construction of methodologies adapted to specific contexts, such as service-oriented software development, process improvement, digital readiness assessment, or knowledge management. Some studies, such as that of Fahmideh et al. [35], stand out for focusing on the creation of reusable fragments within existing frameworks, while others, like that of Franch et al. [35], explore requirements elicitation from digital data in agile environments. As for the methodological products, these range from flexible models based on maps, as in the case of Tsai et al. [32], to simplified methods such as MiniScrum, tailored to small teams or individual projects.
While most studies acknowledge advantages such as customization, reusability, and flexibility, they also report recurring limitations related to technical complexity, lack of empirical validation, or restricted applicability to certain domains. This review shows that SME not only allows for the adaptation of existing methodologies but also supports the integration of complementary approaches that address different phases of analysis. This is particularly useful in scenarios where there is a need to articulate structured models like CRISP-DM with relational techniques such as network analysis, combining the logical sequence of the former with the exploratory and visual capabilities of the latter.

3. Methodology

One of the main challenges of this work was to integrate two approaches with different structures. On the one hand, CRISP-DM provides a sequential logic that guides data analysis in an orderly manner. On the other hand, network analysis focuses on relationships between entities, using metrics and graphical representations to identify structural patterns. Both models pursue complementary objectives, but there is no standard methodology that directly articulates their components.
To address this limitation, Situational Method Engineering, already described in Section 2.3, was adopted as the guiding framework. SME offers a systematic way to build methods tailored to specific contexts, which in this case enabled the incorporation of network analysis activities such as adjacency matrices, node and edge attributes, centrality metrics, and sociograms into the CRISP-DM workflow. The integration is organized into five stages: context analysis, component selection, adaptation, assembly, and evaluation. Each stage generates concrete activities and outputs that document the method and support its later review, while Figure 6 synthesizes the framework and provides a visual overview of the process.
As a complement to the methodological diagram, Table 6 presents the activities designed for each stage of the process along with the defined outputs, offering a detailed view of the methodological structure.
The application of the method considers certain conditions, such as having data that represent relationships in a structured way and possessing knowledge in both data mining and network analysis, as these elements enable the proper implementation of the methodological proposal and the effective use of its components.

4. Results

The results presented below correspond to the methodological integration process developed through the five stages defined by Situational Method Engineering. Each phase leads to a specific output that forms part of the proposed design.
The results correspond to the methodological integration developed through SME. Each subsection describes the outputs of one stage, including methodological sheets, diagrams, and tables. Together, these results document the construction of CRISP-NET.

4.1. Context Analysis

In this phase, the methodological characteristics of the CRISP-DM model and network analysis were reviewed in order to identify their compatibility. For this task, management artifacts such as a comparative table and a list of criteria were used to analyze their structure, objectives, and data types. The analysis was conducted by the methodological designer and resulted in a compatibility matrix that served as input to justify the possibility of integration under a situational logic. Table 7 shows the methodological design sheet for the first phase.
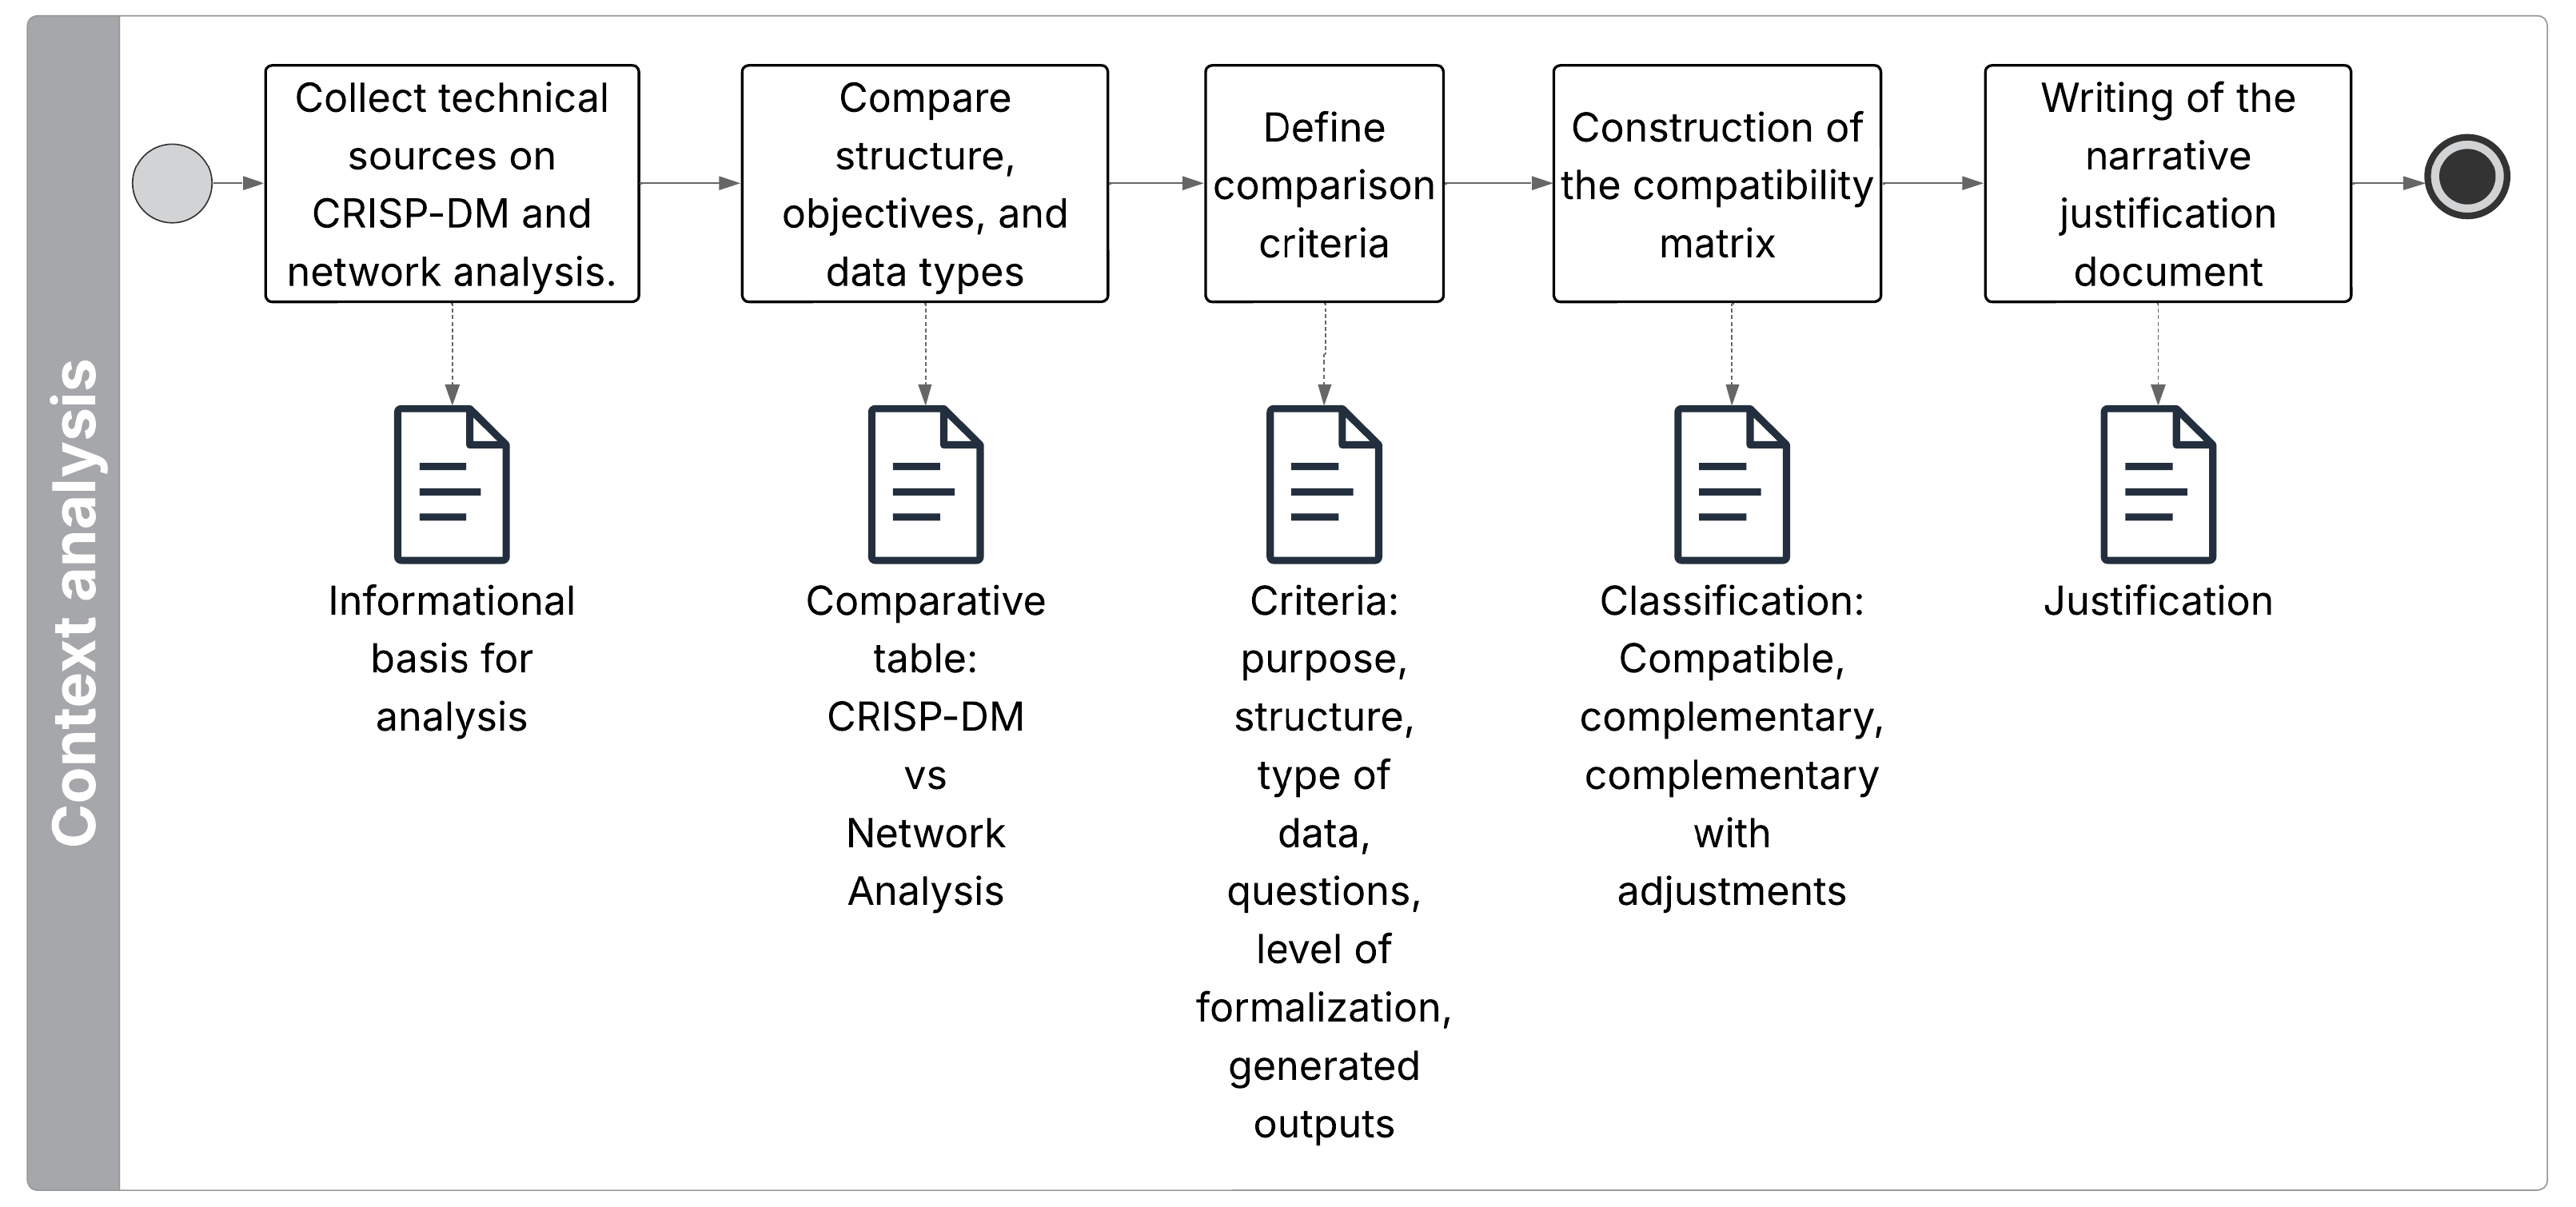
With the aim of explaining in a structured manner how the context analysis phase was carried out, the process represented in Figure 7 was designed. This diagram summarizes the activities performed and the logical order in which they were developed, allowing the progression from the document review to the methodological justification to be visualized.
The first activity consisted of collecting technical sources from both approaches in order to establish a contextual foundation that would allow for an understanding of their principles, scope, and possibilities for integration.
Based on this foundation, a comparative table was developed with the key elements of both models, which made it possible to identify similarities and differences regarding their structure, objectives, and types of data used. In the third stage, and based on this result, six comparison criteria were defined: purpose, structure, type of data, questions that can be addressed, level of formalization, and generated outputs. These aspects were selected to identify relevant similarities and differences between the two models. This way of adapting the methodology is based on the work of Guba and Lincoln [44], who argue that methodological decisions should respond to the context and purpose of the analysis.
Based on the defined criteria, a compatibility matrix was built to analyze the relationship between CRISP-DM and network analysis. This tool not only describes characteristics but also assesses the degree of possible integration between both models. For this purpose, a classification was used based on the categories “compatible”, “complementary”, and “complementary with adjustments”, taking as a reference the logical framework analysis approach proposed by Comisión Económica para América Latina y el Caribe (CEPAL) [45]. The matrix helped identify points of convergence and areas requiring adaptation, which was useful to support the design of the integrated method.
Table 8 shows that CRISP-DM structures the workflow for data analysis, while network analysis expands interpretive possibilities by incorporating relationships between elements. Their integration does not rely on structural similarity but on the articulation of their components at key points of the process. In this sense, working with different types of data is not a limitation but an opportunity to design transformations that enable complementarity between sequential analysis and relational perspectives.
The matrix shows that CRISP-DM and network analysis can be integrated in a complementary way within the same methodological process, as both contribute elements that reinforce each other. While CRISP-DM structures the workflow for data analysis, the network approach expands interpretive possibilities by incorporating relationships between elements.
This integration does not rely on structural similarities but rather on the possibility of articulating their components at key moments in the process. For example, the preparation, modeling, and evaluation phases of CRISP-DM can be enriched with techniques specific to network analysis, such as graph construction or the use of centrality metrics.
Working with different types of data does not represent a limitation but an opportunity to design transformations that facilitate their integration. Likewise, the questions each model helps address are enhanced when internal patterns are combined with relational structures. This complementarity is also reflected in the outputs generated, which can be part of a single analysis aimed at supporting decision-making.

4.2. Selection of Methodological Components

After defining the models to be integrated, their key elements were reviewed in order to identify network analysis activities that could be functionally related to the phases of the CRISP-DM model. This stage did not involve modifying components or validating their compatibility, but rather recognizing methodological points of connection that could serve as a basis for a preliminary linkage. The result was a correspondence table that organized these relationships according to their analytical usefulness. The corresponding methodological design sheet is presented below in Table 9.
To carry out the selection of methodological components, the six phases of the CRISP-DM model were reviewed along with their main tasks. Subsequently, techniques and activities specific to network analysis that could add value in each phase were identified. This procedure is summarized in Figure 8, which illustrates the process followed to identify functional correspondences between both approaches.
This cross-review focused on identifying functional correspondences, that is, points in the process where network analysis tasks could be incorporated without altering the logic of the workflow established by CRISP-DM. The association between both approaches was made based on the methodological usefulness of the activities, considering the type of data, analysis objectives, and the stage at which they provide relevant information.
Table 10 presents the resulting correspondence between the phases of the CRISP-DM model and the specific network analysis activities selected for integration.
Table 10 not only organizes the activities of both approaches but also shows the methodological logic that supports their integration. The correspondences highlight how network analysis can extend CRISP-DM by incorporating a relational perspective at critical points of the process.
For example, in the Business Understanding phase, it was considered relevant to identify whether the phenomenon under study involves relationships between entities, which justifies the early incorporation of the relational approach. In the Data Preparation stage, building the adjacency matrix and defining attributes allows the transformation of information into a structure compatible with network analysis. During the Modeling and Evaluation phases, the use of centrality metrics and sociograms adds a structural dimension that helps validate patterns. Finally, the integration was defined based on the criterion of functional complementarity, ensuring that each technique was incorporated without disrupting the logic of the base model.

4.3. Component Adaptation

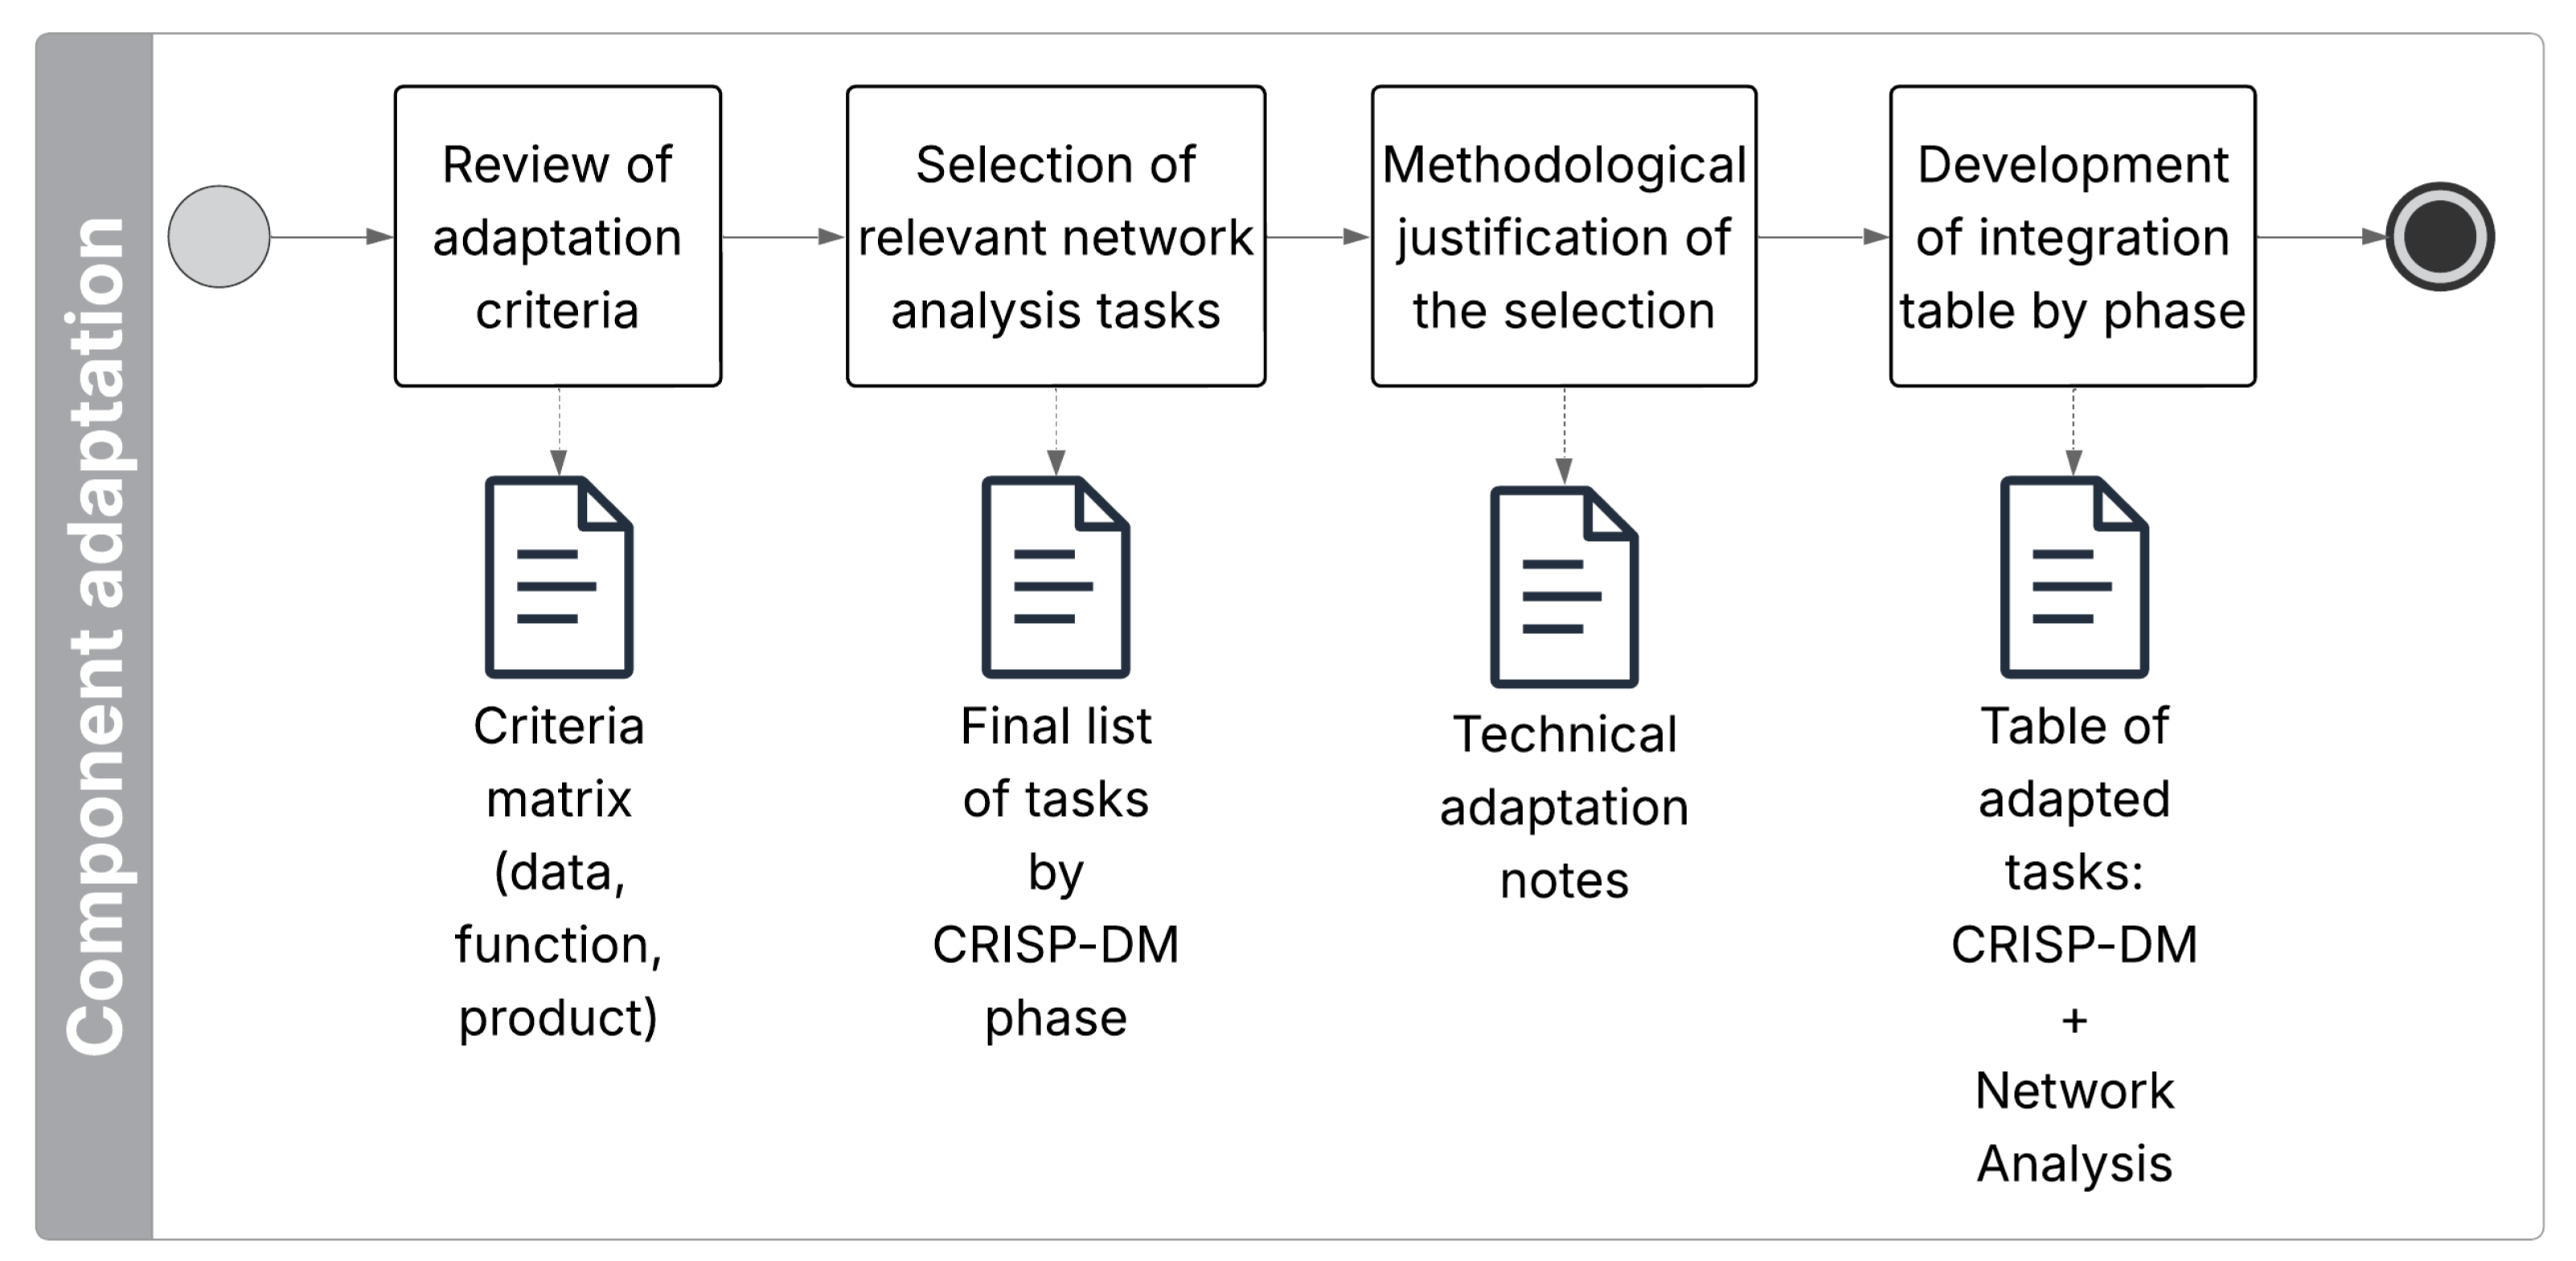
Once the possible correspondences between the CRISP-DM phases and the network analysis activities were identified, the most relevant elements for integration were selected. This phase aimed to define which components of the network analysis approach added methodological value in each stage of the process and under what conditions they could be incorporated. To achieve this, factors such as the type of data required, the analytical function of each technique, and their compatibility with the tasks of the base model were considered. The following Table 11 presents the methodological design sheet corresponding to this stage.
In this phase, the network analysis tasks that could be incorporated into the CRISP-DM model were defined, based on the analysis previously carried out in the “Context Analysis” and “Selection of Methodological Components” phases. As represented in Figure 9, this process considered the methodological criteria identified in the compatibility review between both models, as well as the functional identification of specific activities established in the correspondence table (Table 8). The selected elements were organized according to their usefulness by phase of the model as summarized in Table 10.
The final decision on the activities to be incorporated was made considering three criteria derived from the conceptual framework of Situational Method Engineering [33,34,36]: the type of data required by each task, the analytical function it contributes to the process, and the output it generates in each phase of CRISP-DM. These criteria were applied in such a way that the selected tasks were compatible with the logical sequence of CRISP-DM and complemented its workflow, pertinent to datasets with relational attributes to allow the definition of nodes, links, and adjacency matrices, and analytically valuable by including metrics such as centrality, which provide a structural perspective that enriches statistical results. Finally, feasibility was considered to ensure that the activities could be implemented with reproducible techniques and accessible tools, thus facilitating the scalability of the method. The result of this application is summarized in Table 12.
Table 12 illustrates how the adaptation of network analysis tasks was guided by explicit methodological criteria. By linking each task to a specific CRISP-DM phase according to its data requirements, analytical function, and expected outputs, the integration avoids superficial overlaps and ensures that each component contributes measurable value. In this way, each phase of CRISP-DM was enriched with network analysis tasks that add a structural dimension to the process, facilitating the transition between data formats and strengthening the interpretation of results. These adaptations extend the model to incorporate relational perspectives while maintaining its logical workflow, thereby reinforcing the robustness and applicability of the proposed method.
This phase therefore transformed the initial correspondences into a technically viable integration, providing the concrete components that would later be assembled into the final methodological workflow.

4.4. Method Assembly

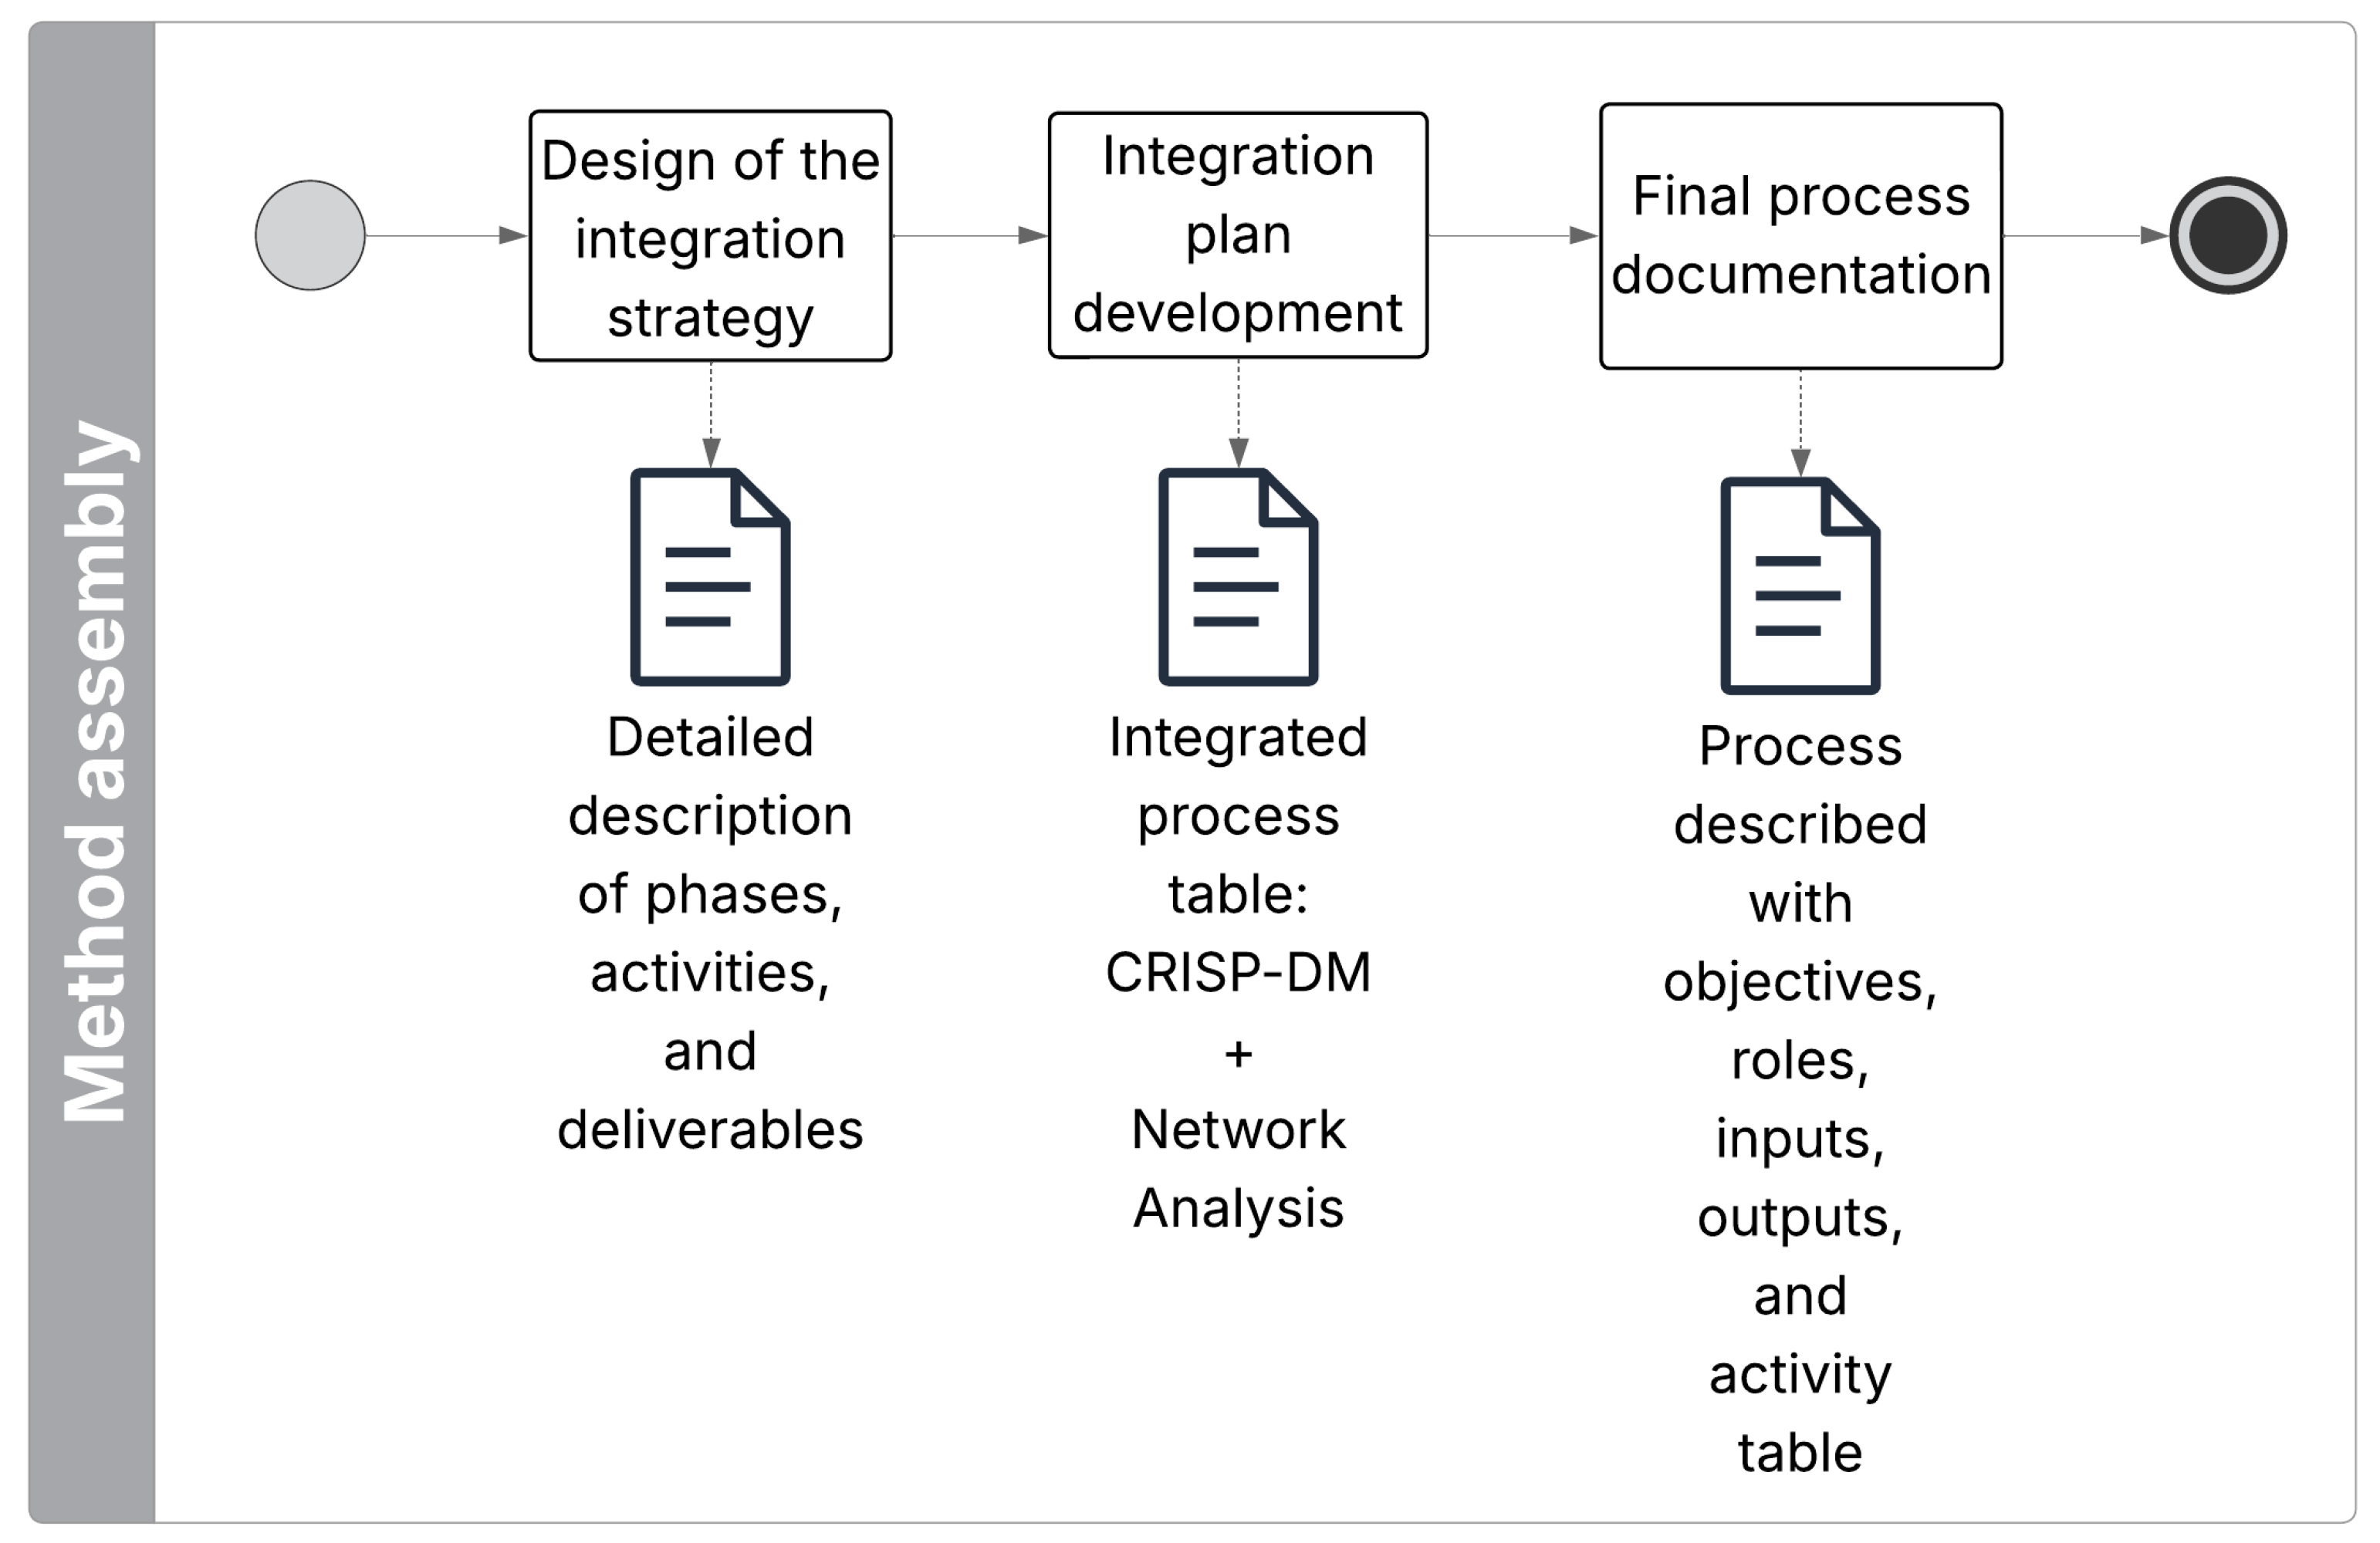
In this phase, the method assembly was carried out by operationally integrating the previously adapted network analysis activities into the CRISP-DM model. This assembly involved clearly assigning each adapted task to its corresponding phase within the CRISP-DM process, establishing a continuous methodological flow that enables the coherent incorporation of network analysis. The following table (Table 13) presents the methodological design sheet that briefly describes how this phase was organized.
Once the methodological elements and their technical justification were defined in the previous phases, the integration strategy was designed. This strategy clearly describes the stages of the base model, detailing its original activities along with the newly integrated network analysis activities, as well as the expected outputs for each stage. Subsequently, a detailed integration plan was developed in the form of a table, specifying the final stages of the integrated process, the specific activities to be carried out, and the outputs generated in each stage. Finally, the complete integrated process was described, explicitly indicating the objective of each phase, the roles involved, the inputs and outputs, and a final summary table with all integrated activities and products. Figure 10 shows the execution of this phase, organized into three main activities and their corresponding generated outputs.
Figure 10 illustrates the operational sequencing of activities, showing how coherence across phases was considered in the assembly of the method. By explicitly linking the integrated tasks with their expected outputs, the diagram demonstrates how the incorporation of network analysis complements CRISP-DM without altering its logical flow. This visualization also provides evidence of the traceability of decisions since each output can be directly associated with a specific activity, reinforcing the methodological consistency of the proposal.

4.4.1. Integration Strategy Design

Table 14 presents the integration of the CRISP-DM model stages with network analysis activities. The structure of the model was preserved, as its sequence is logically consistent. Although this being a new proposal allowed for the renaming or adaptation of stages to better fit the new activities, it was decided to keep them unchanged, as they sufficiently met the requirements.
In the Business Understanding stage of the CRISP-DM model, the activity titled Relationships between entities was integrated with the goal of defining from the outset whether there are relationships between nodes and links—in other words, whether the problem under study involves multiple variables and interconnected phenomena, which indicates a non-linear nature. It is important to note that this stage also includes the original activities of the model such as establishing the study objectives, understanding the requirements and assumptions, and identifying potential risks or limitations. Similarly, this phase aims to define the measurement criteria, meaning what is intended to be analyzed, and based on that, generate a project plan as well as identifying potential tools or techniques to be used in later stages.
In the Data Understanding stage, it is essential to understand and identify the connections and nodes present in the information. This means analyzing the relationships between variables and selecting those with the strongest correlations. This stage is one of the most critical in the process, as key decisions for the subsequent analysis are made here. For this reason, the activity of identifying relationships is carried out at the end once the data have been obtained, their attributes and properties reviewed, potential issues detected, and solutions proposed. All of this is supported by the use of descriptive statistics, which serves as a foundational tool for this initial approach to analysis.
In the Data Preparation stage, once the data context has been understood, including its source, attributes, connections, and nodes necessary for applying network analysis, the process continues with data preparation. At this point, it is crucial to clearly define selection and exclusion criteria, as well as the necessary actions to ensure data quality. These actions include the detection and elimination of duplicate records, the treatment of missing values, the correction of inconsistent codings, and the identification of potential outliers. Depending on the type of attribute, categorical variables may be recoded, numerical values transformed, or imputation strategies applied when required. In addition, transformations are applied to unify the dataset into a single functional set and prepare it for use in the next stage. As part of the integration of network analysis, the connection matrix is incorporated during this phase, where the nodes, links, and their attributes are explicitly defined, allowing the data to be structured in a relational format that will serve as the foundation for building the network in the modeling stage.
In the Modeling stage, it is necessary to define which model or set of models will be used, considering that the data were prepared in the previous phase according to their requirements. Training activities include data splitting, testing, and evaluation of the selected models, and parameters are adjusted when required since this phase is iterative and may involve returning to earlier steps to optimize performance. As part of the network analysis, sociograms are constructed, and metrics such as degree, centrality, and betweenness are generated, which serve as quantitative indicators that complement the statistical models. Degree centrality highlights nodes with the highest number of connections, betweenness centrality identifies nodes that act as bridges between different groups of variables, and closeness centrality points to nodes with greater global influence. Together, these measures provide relational insights that go beyond traditional statistical outputs and support a more comprehensive interpretation of the analysis.
In the Model Evaluation phase, the results obtained in the previous stage are reviewed to determine whether they meet the stated objectives. It is important to clearly document the changes made during the process, as this ensures decision traceability and provides alternatives for improvement in future work. With respect to network analysis, the focus is on validating the detected structures, such as node centrality or community formation, and verifying that they are consistent with the goals of the analysis. This final review makes it possible to decide whether it is necessary to revisit earlier phases to correct pending issues or whether the process is ready to move on to implementation.
In the final stage, the Deployment phase focuses on defining the strategies and actions needed to implement the trained models, considering that adjustments or adaptations may be required. A monitoring and maintenance plan should also be established, and the lessons learned, insights gained, and process conclusions should be documented to support future applications. This is the only phase in which no specific network analysis activity is integrated since its main function is operational rather than analytical, and therefore additional relational processing is not required. However, the outputs generated in previous phases can be used as references for later adjustments.
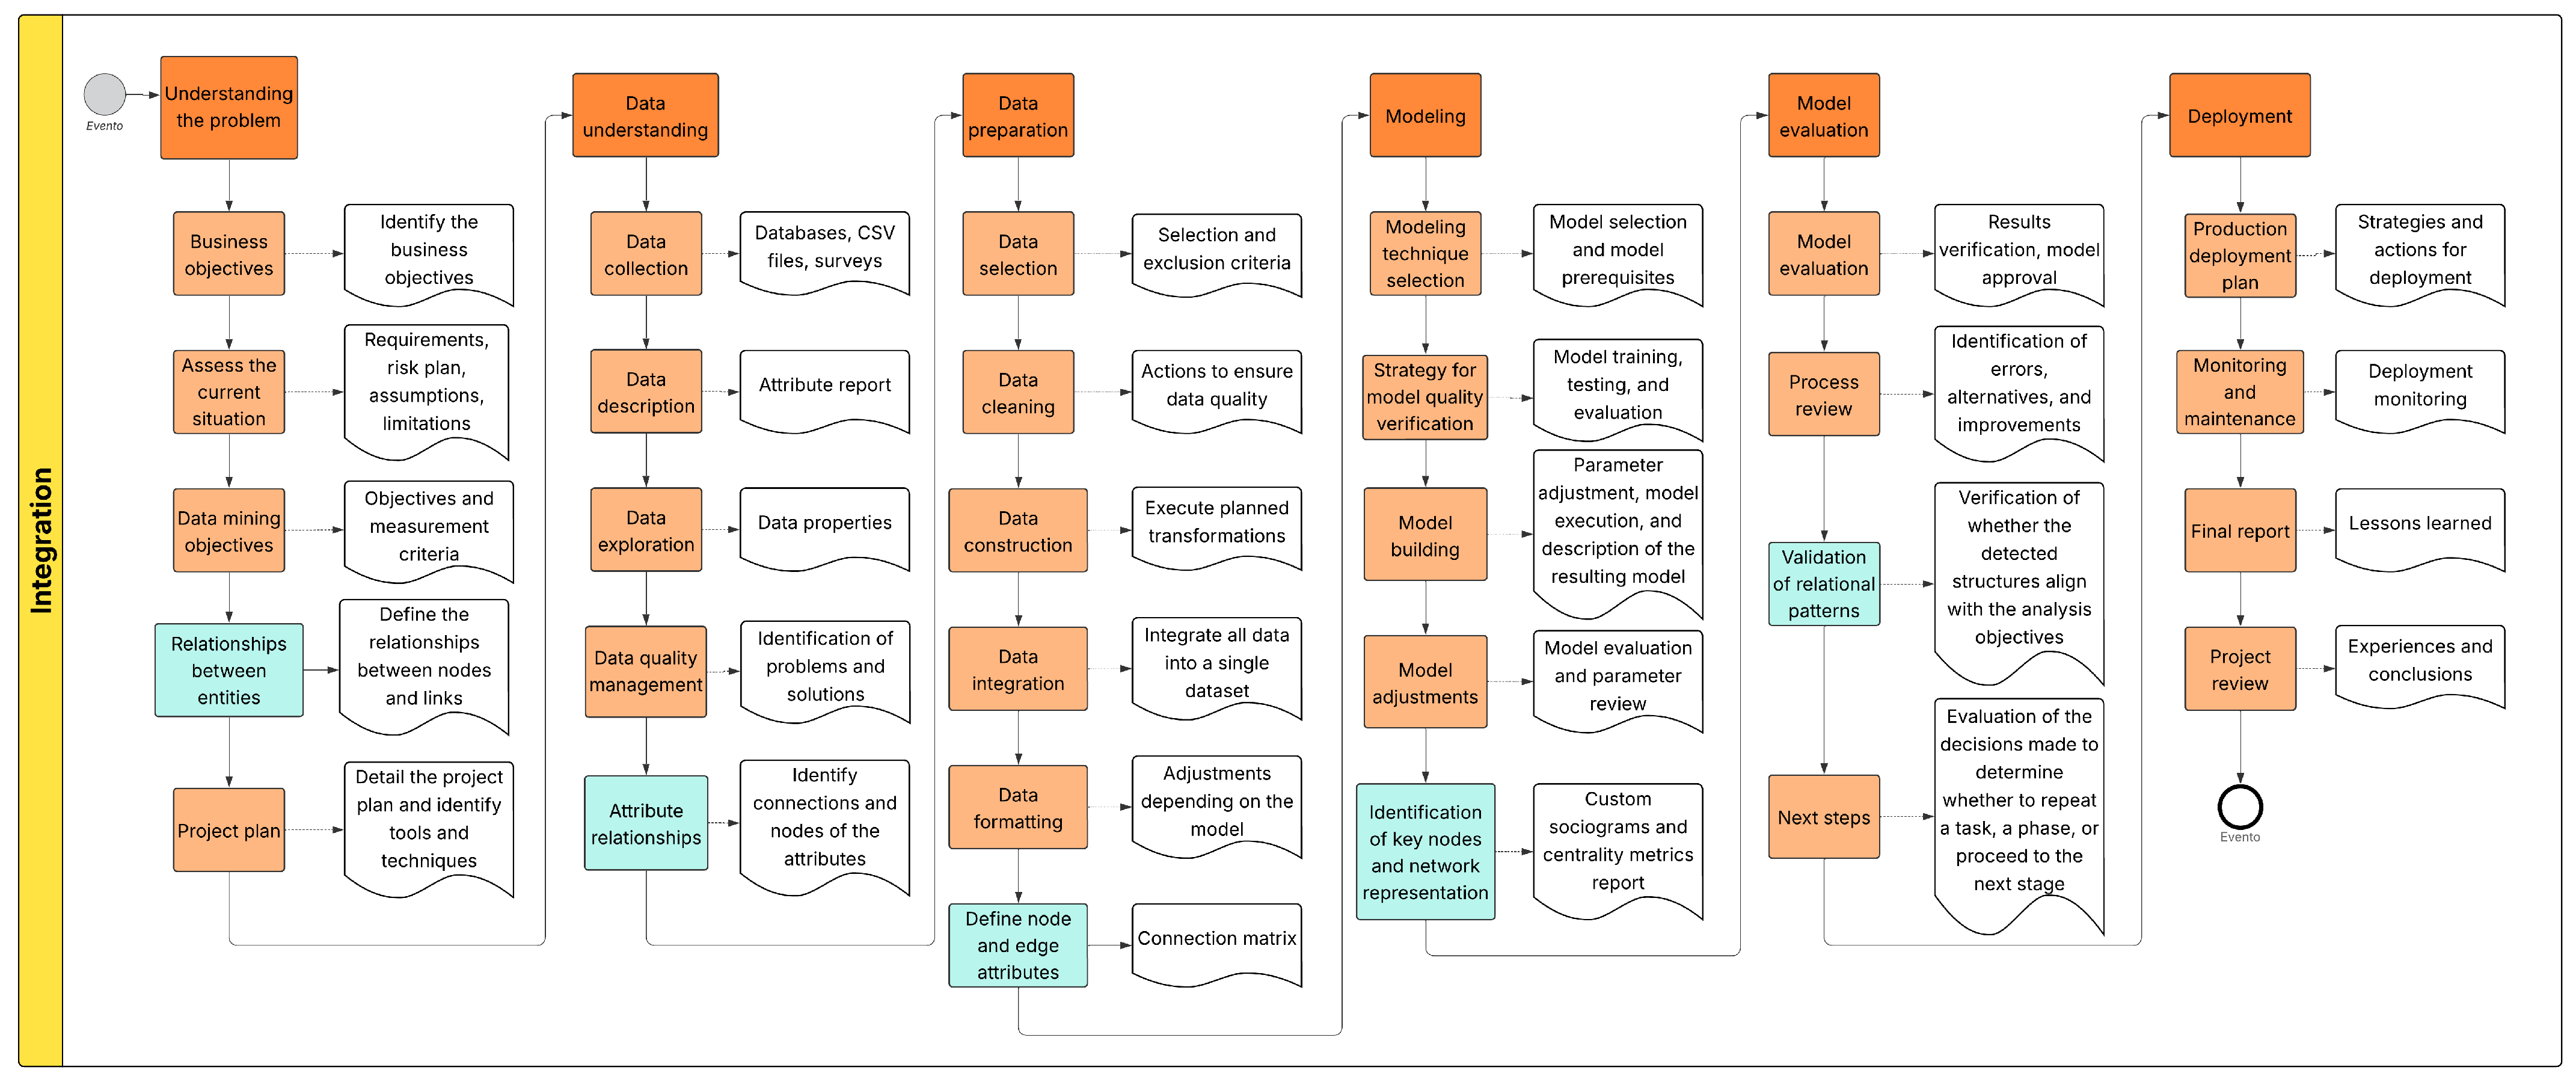
Figure 11 illustrates the result of the methodological assembly.
Figure 11 presents the integrated method as a unified workflow, where the sequential logic of CRISP-DM is preserved while its analytical capacity is expanded through network analysis. By embedding relational tasks at critical points, the integration maintains methodological coherence and enhances interpretation, reinforcing the applicability and soundness of the proposal.

4.4.2. Integration Plan Development

Table 14 presents in detail the integration of the CRISP-DM model stages with network analysis activities. Additionally, it lists the stages of the proposed process, describes the corresponding activities in each of them, and specifies the outputs that should be generated.
Table 14 details the integration plan beyond a theoretical alignment, where specifying concrete activities, stages, and outputs demonstrates that the integration plan is not limited to a theoretical alignment but specifies the concrete activities, stages, and outputs of the combined process. By organizing the tasks of CRISP-DM and network analysis side by side, the table ensures that each contribution is explicitly connected to a phase, which prevents redundancy and reinforces methodological coherence. Furthermore, the inclusion of expected outputs provides traceability and facilitates replication since it becomes clear what products must be generated at each step. This level of detail shows that the integration is systematic and operational rather than abstract.

4.4.3. Documentation Specification and Process Refinement

The outputs to be generated at each stage of the process were defined, and templates were also created to facilitate their development. Table 15 presents these outputs.
Table 15 provides a structured inventory of deliverables that ensures the integrated method can be consistently applied and evaluated. By defining concrete outputs for each phase, the table transforms abstract activities into verifiable products, which reinforces accountability and methodological transparency. These deliverables also function as checkpoints that facilitate monitoring, comparison across applications, and potential replication in other contexts. In this way, the table not only documents what should be produced but also strengthens the reliability and transferability of the proposed process.

4.5. Method Evaluation

In this final phase of the process, the main objective was to validate the integrated method in a real-world context, focusing on its practical application rather than solely on a documentary review. The key aspect at this stage was to observe how the process performs when used by real users, identifying its usefulness, clarity, and potential areas for improvement. To this end, the elements described in the methodological design sheet for this phase were considered, guiding the organization of the evaluation activities in Table 16.
Figure 12 presents the overall flow of activities considered for the evaluation of the method. The process was organized into three consecutive stages: an initial diagnosis, the practical application of the method, and a final survey aimed at gathering perceptions and suggestions. In each stage, specific outputs were generated, allowing for the assessment of both the implementation and the user experience.
Figure 12 illustrates the organization of the evaluation process, structured to include both a documentary review and a real-world validation. The three consecutive stages, diagnosis, application, and perception survey, create a cycle that not only tests whether the method can be implemented in practice but also captures the users’ experience. This structure ensures that the evaluation addresses both technical consistency and pedagogical impact, providing evidence of the method’s clarity, usefulness, and areas for improvement.

4.5.1. Knowledge Profile

To assess the level of familiarity with the CRISP-DM model and the general concept of data analysis, a diagnostic survey was administered to students in fields related to computer science. Table 17 shows the distribution of the surveyed students. The selection was made based on the academic connections of the research team with faculty from various institutions, which enabled access to undergraduate students in the city of Zacatecas, Zacatecas. The evaluation was intentionally limited to this region due to accessibility and direct collaboration.
Students from the sixth semester onward were selected as long as they had already completed at least one course related to data analysis, artificial intelligence, or data mining. A total of 101 students participated, coming from four higher education institutions: UPIIZ-IPN, UAZ, UTZAC, and ITZ.
The academic programs included were computer systems engineering, artificial intelligence engineering, and mechatronics engineering from UPIIZ-IPN; computer engineering, software engineering, industrial electronics engineering, and biomedical engineering from UAZ; computer systems engineering and informatics engineering from ITZ; and information and communication technologies engineering from UTZAC.
To administer the diagnostic, a structured instrument was designed consisting of fourteen questions divided into four sections: general information, experience in data analysis, knowledge of methodologies, and expectations and interest. The instrument was developed using the Google Forms platform, which facilitated its implementation and automated data collection. Its content was created based on the objectives of the diagnostic and validated through an internal review by the research team, in order to ensure coherence between each section and the overall goals of the evaluation. Figure 13 shows a view of the applied instrument.
The survey included closed questions with multiple-choice options and familiarity scales, which helped gather precise information about the students’ prior training, their experience with the CRISP-DM model, and their knowledge of network analysis concepts, as well as their interests and possible difficulties with the use of structured methodologies. This information made it possible to identify the level of perception students had regarding the use and understanding of the models that would later be integrated into the proposed process.
For data processing, a descriptive quantitative analysis was conducted based on frequencies and percentages, with the objective of identifying patterns in the levels of knowledge, experience, and interest related to the CRISP-DM model and network analysis among the different surveyed groups.
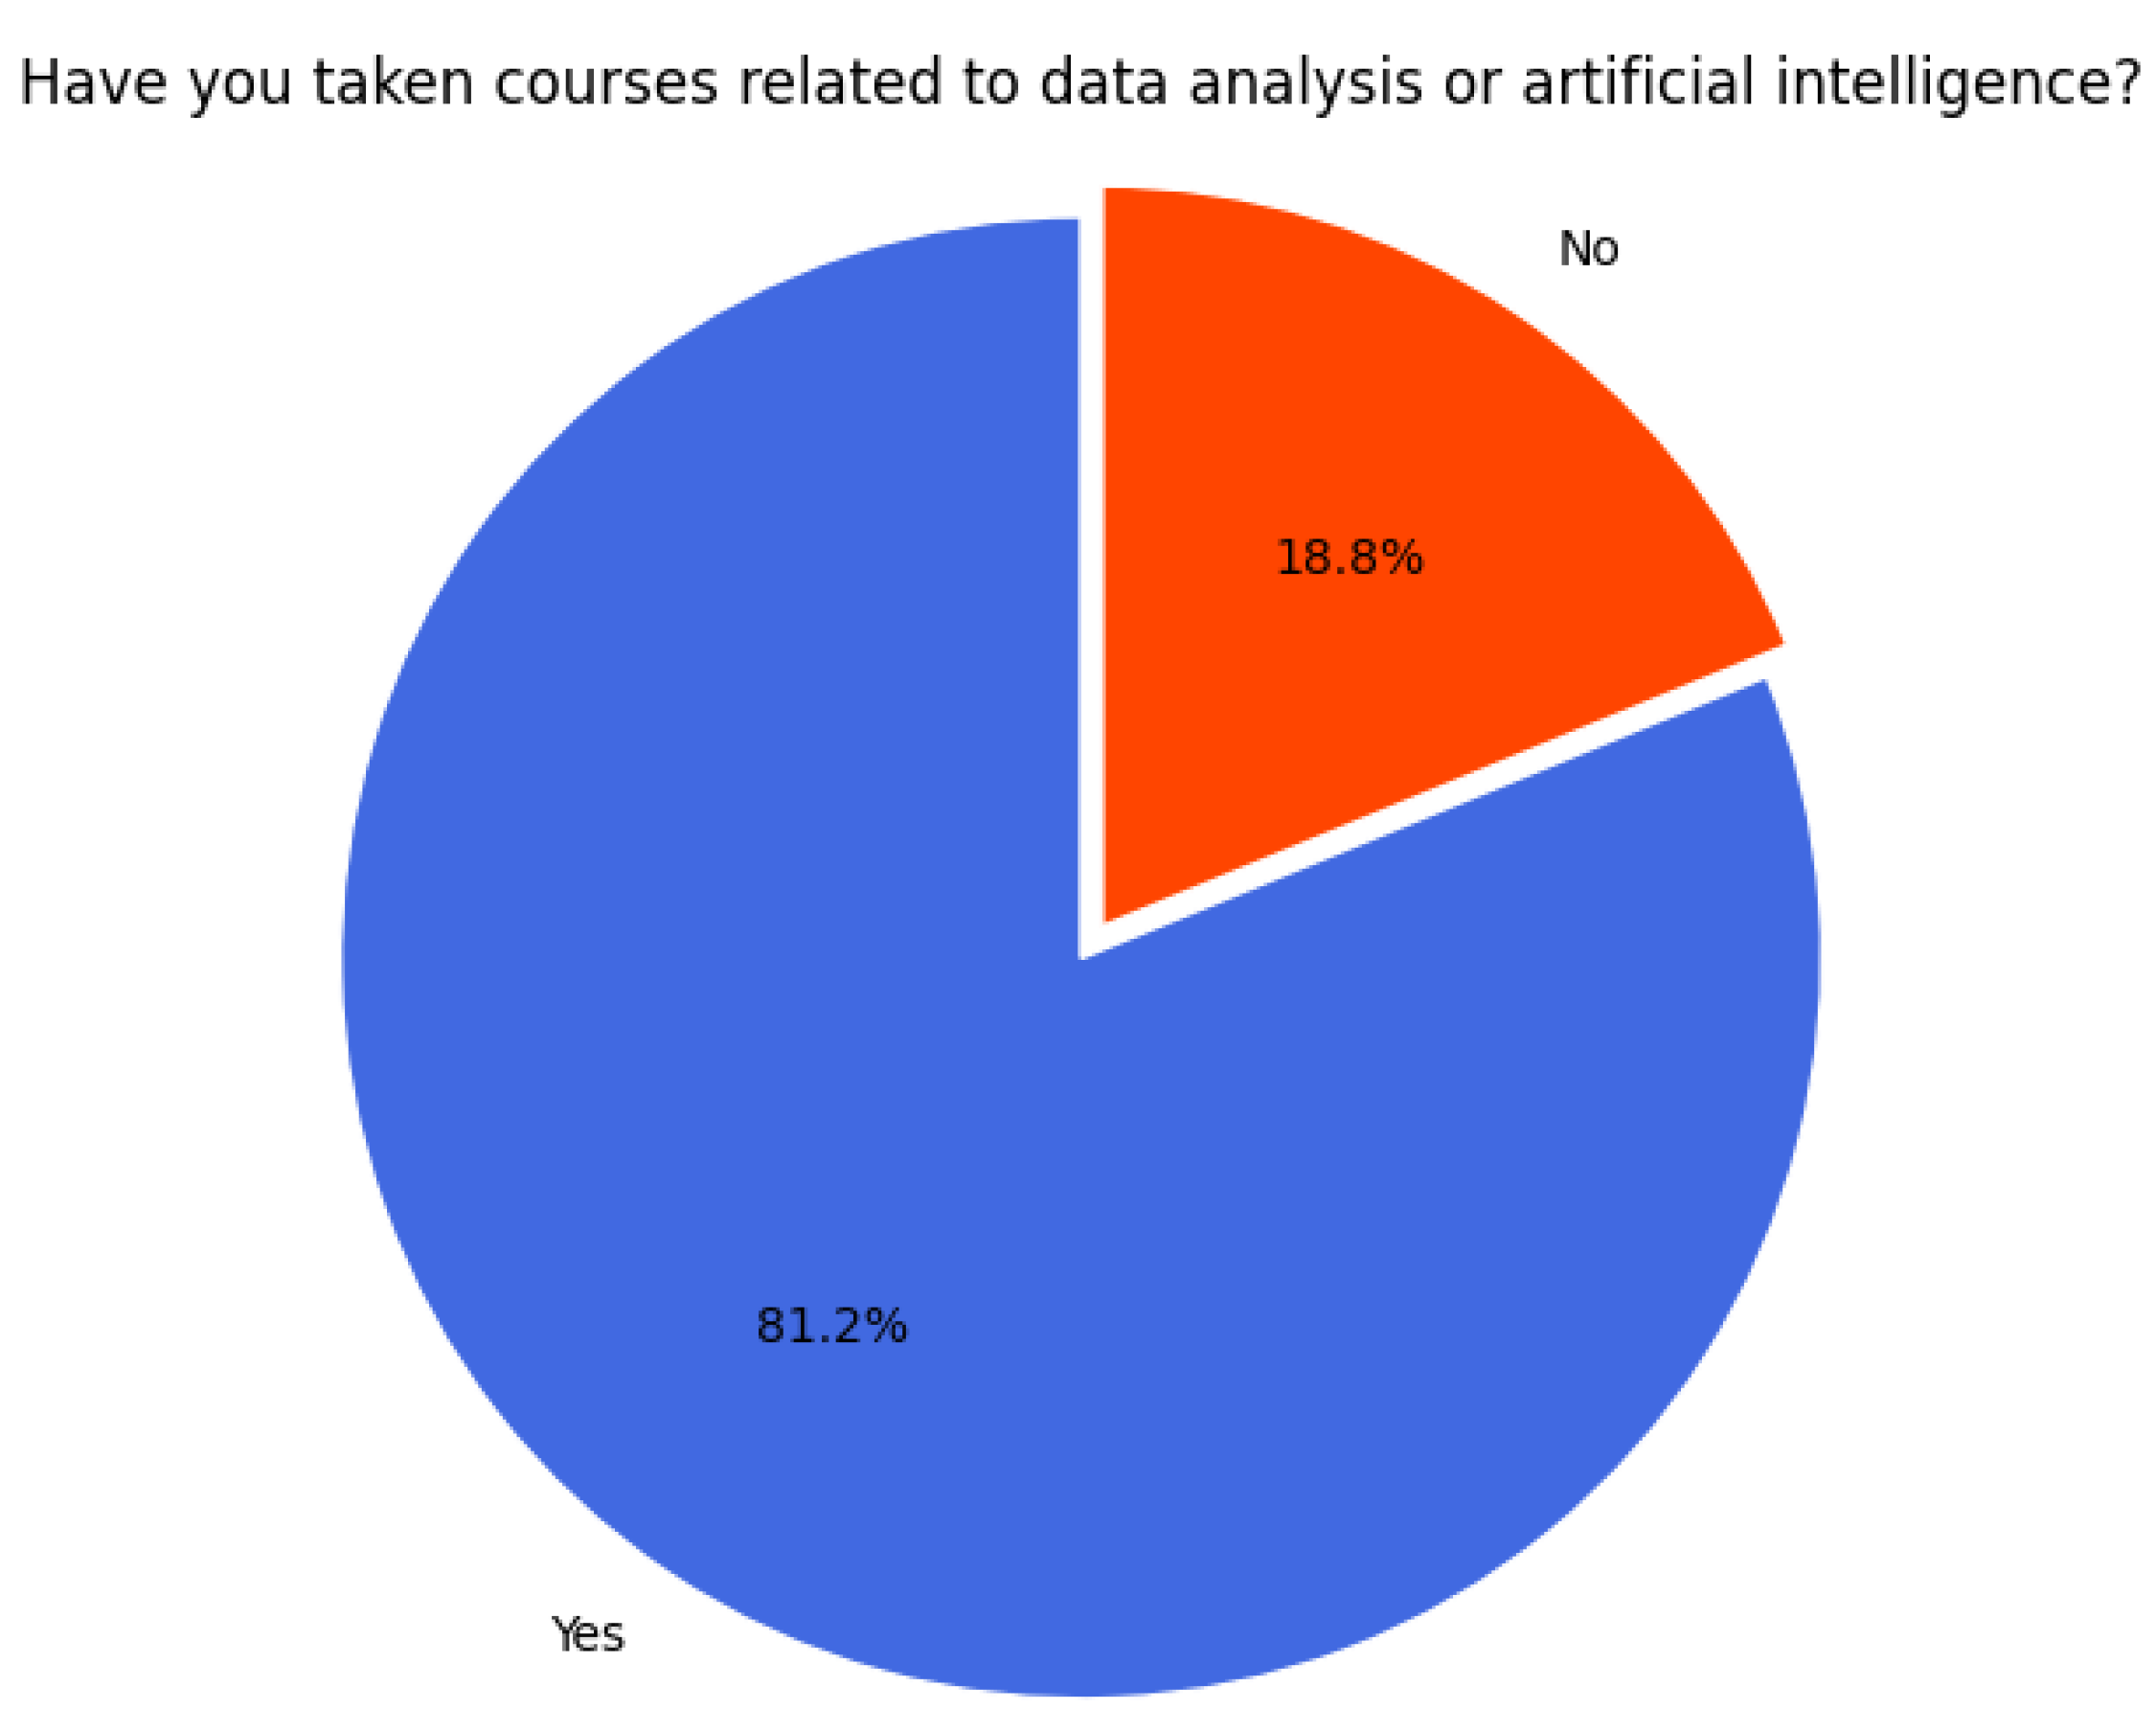
The most relevant diagnostic results are presented below. In Figure 14, it can be seen how many of the respondents have taken a course related to data analysis, showing that 81.2% of the population have done so, while 18.8% have not taken any course in this area.
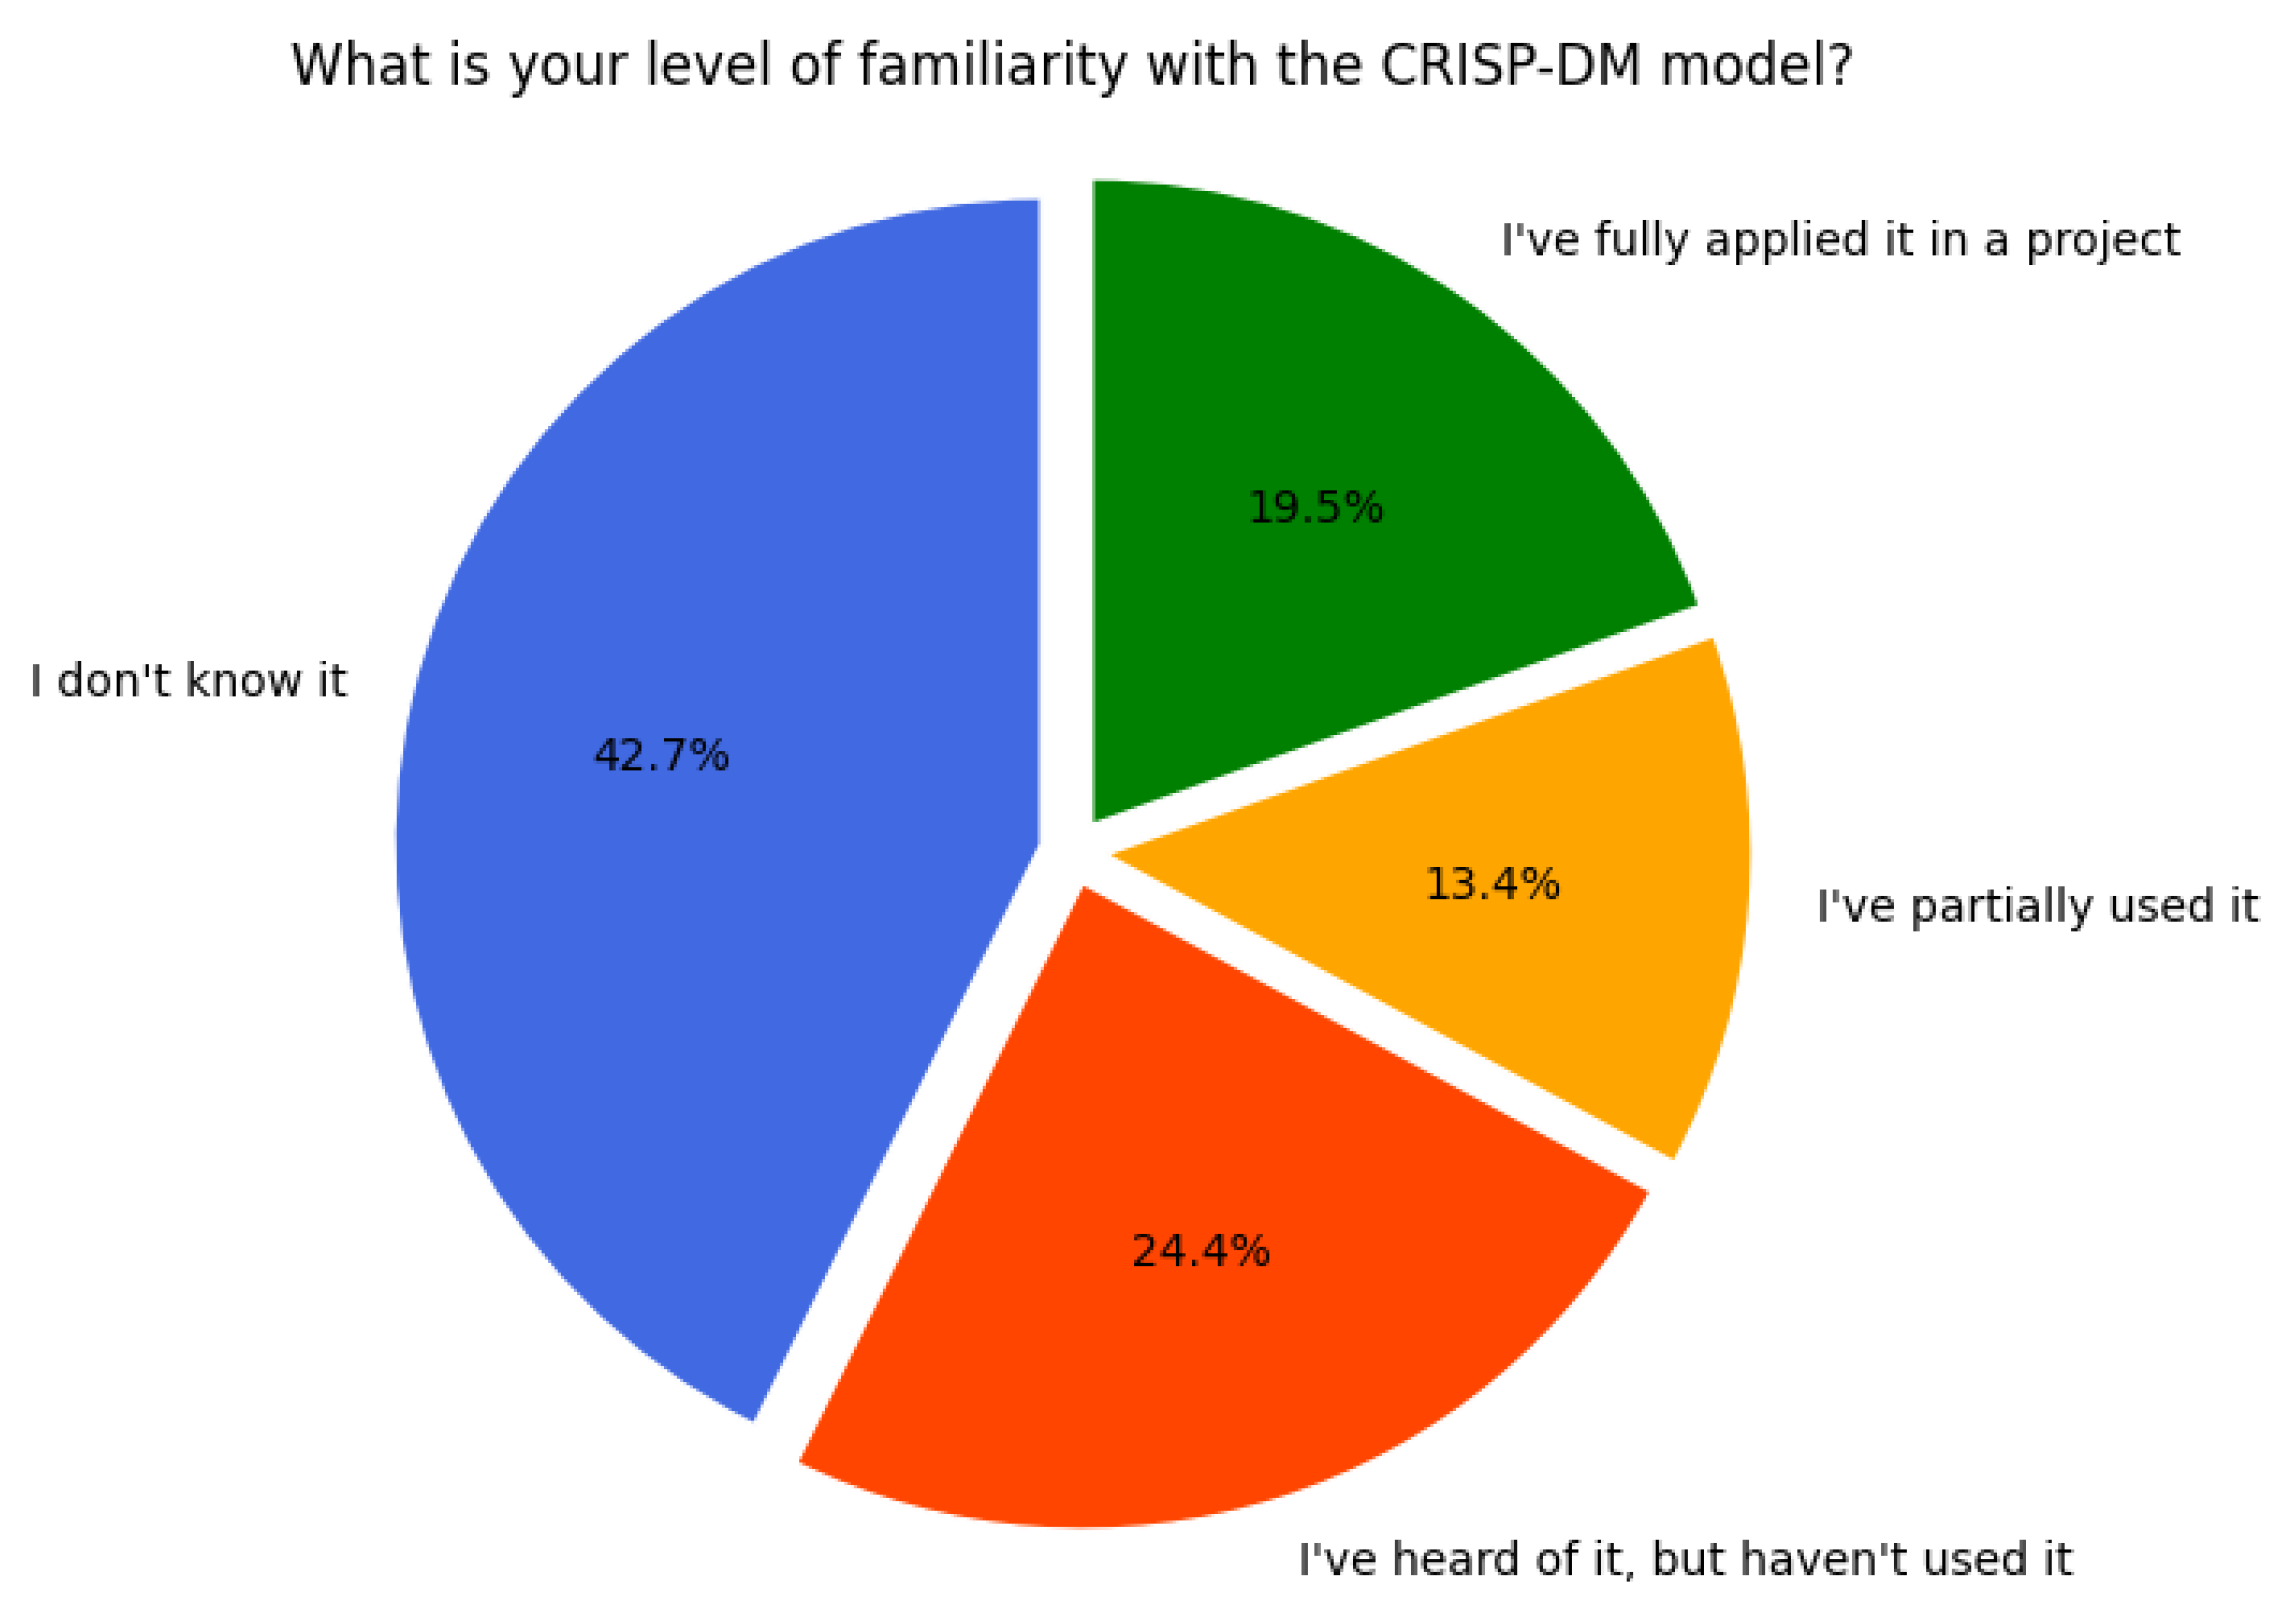
Of the total number of students who have taken or are currently taking a course related to data analysis, only 19.5% have used the CRISP-DM model to complete a full project, 13.4% have used it partially, 24.4% have heard of it but have not applied it, and 42.7% do not know it. This last group represents the majority, which presents an opportunity to introduce the student population to a new practice with this model, as shown in Figure 15.
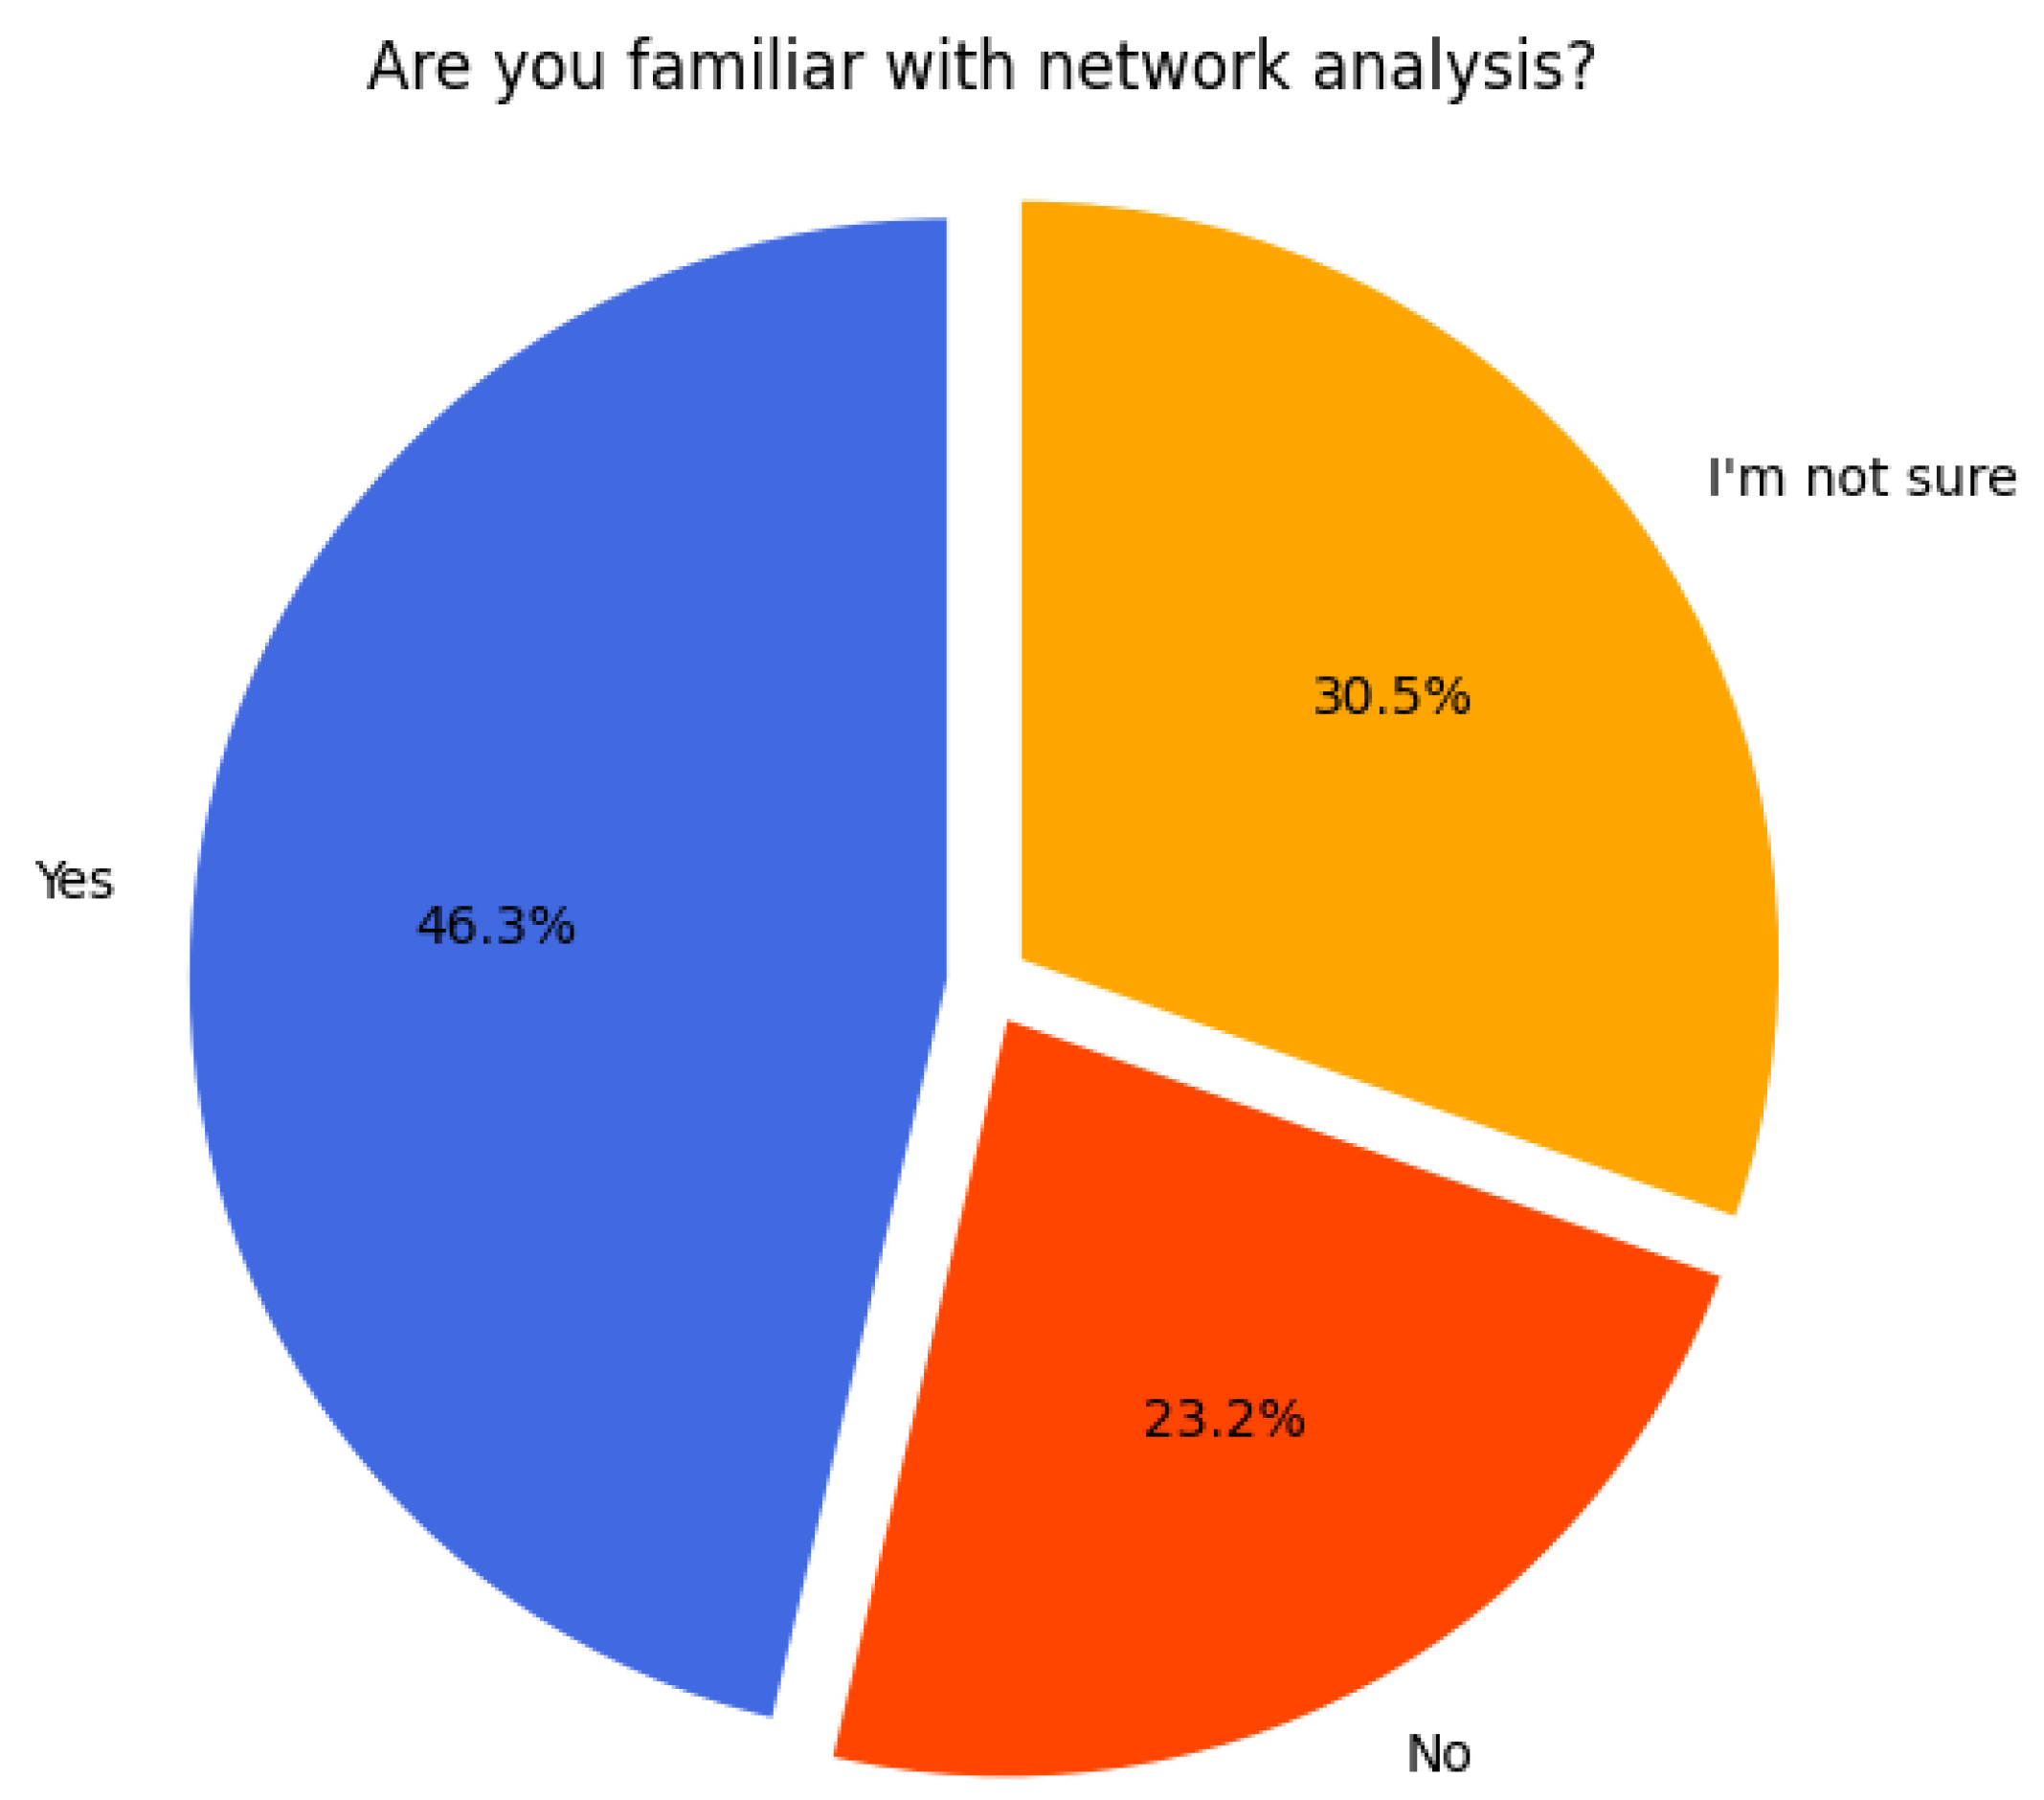
In the case of network analysis, 46.3% of the population claim to know it, 23.2% indicate they have no idea, and 30.5% say they are not sure. This outlook also represents an opportunity to introduce the integration of this approach with the CRISP-DM model, as shown in Figure 16.
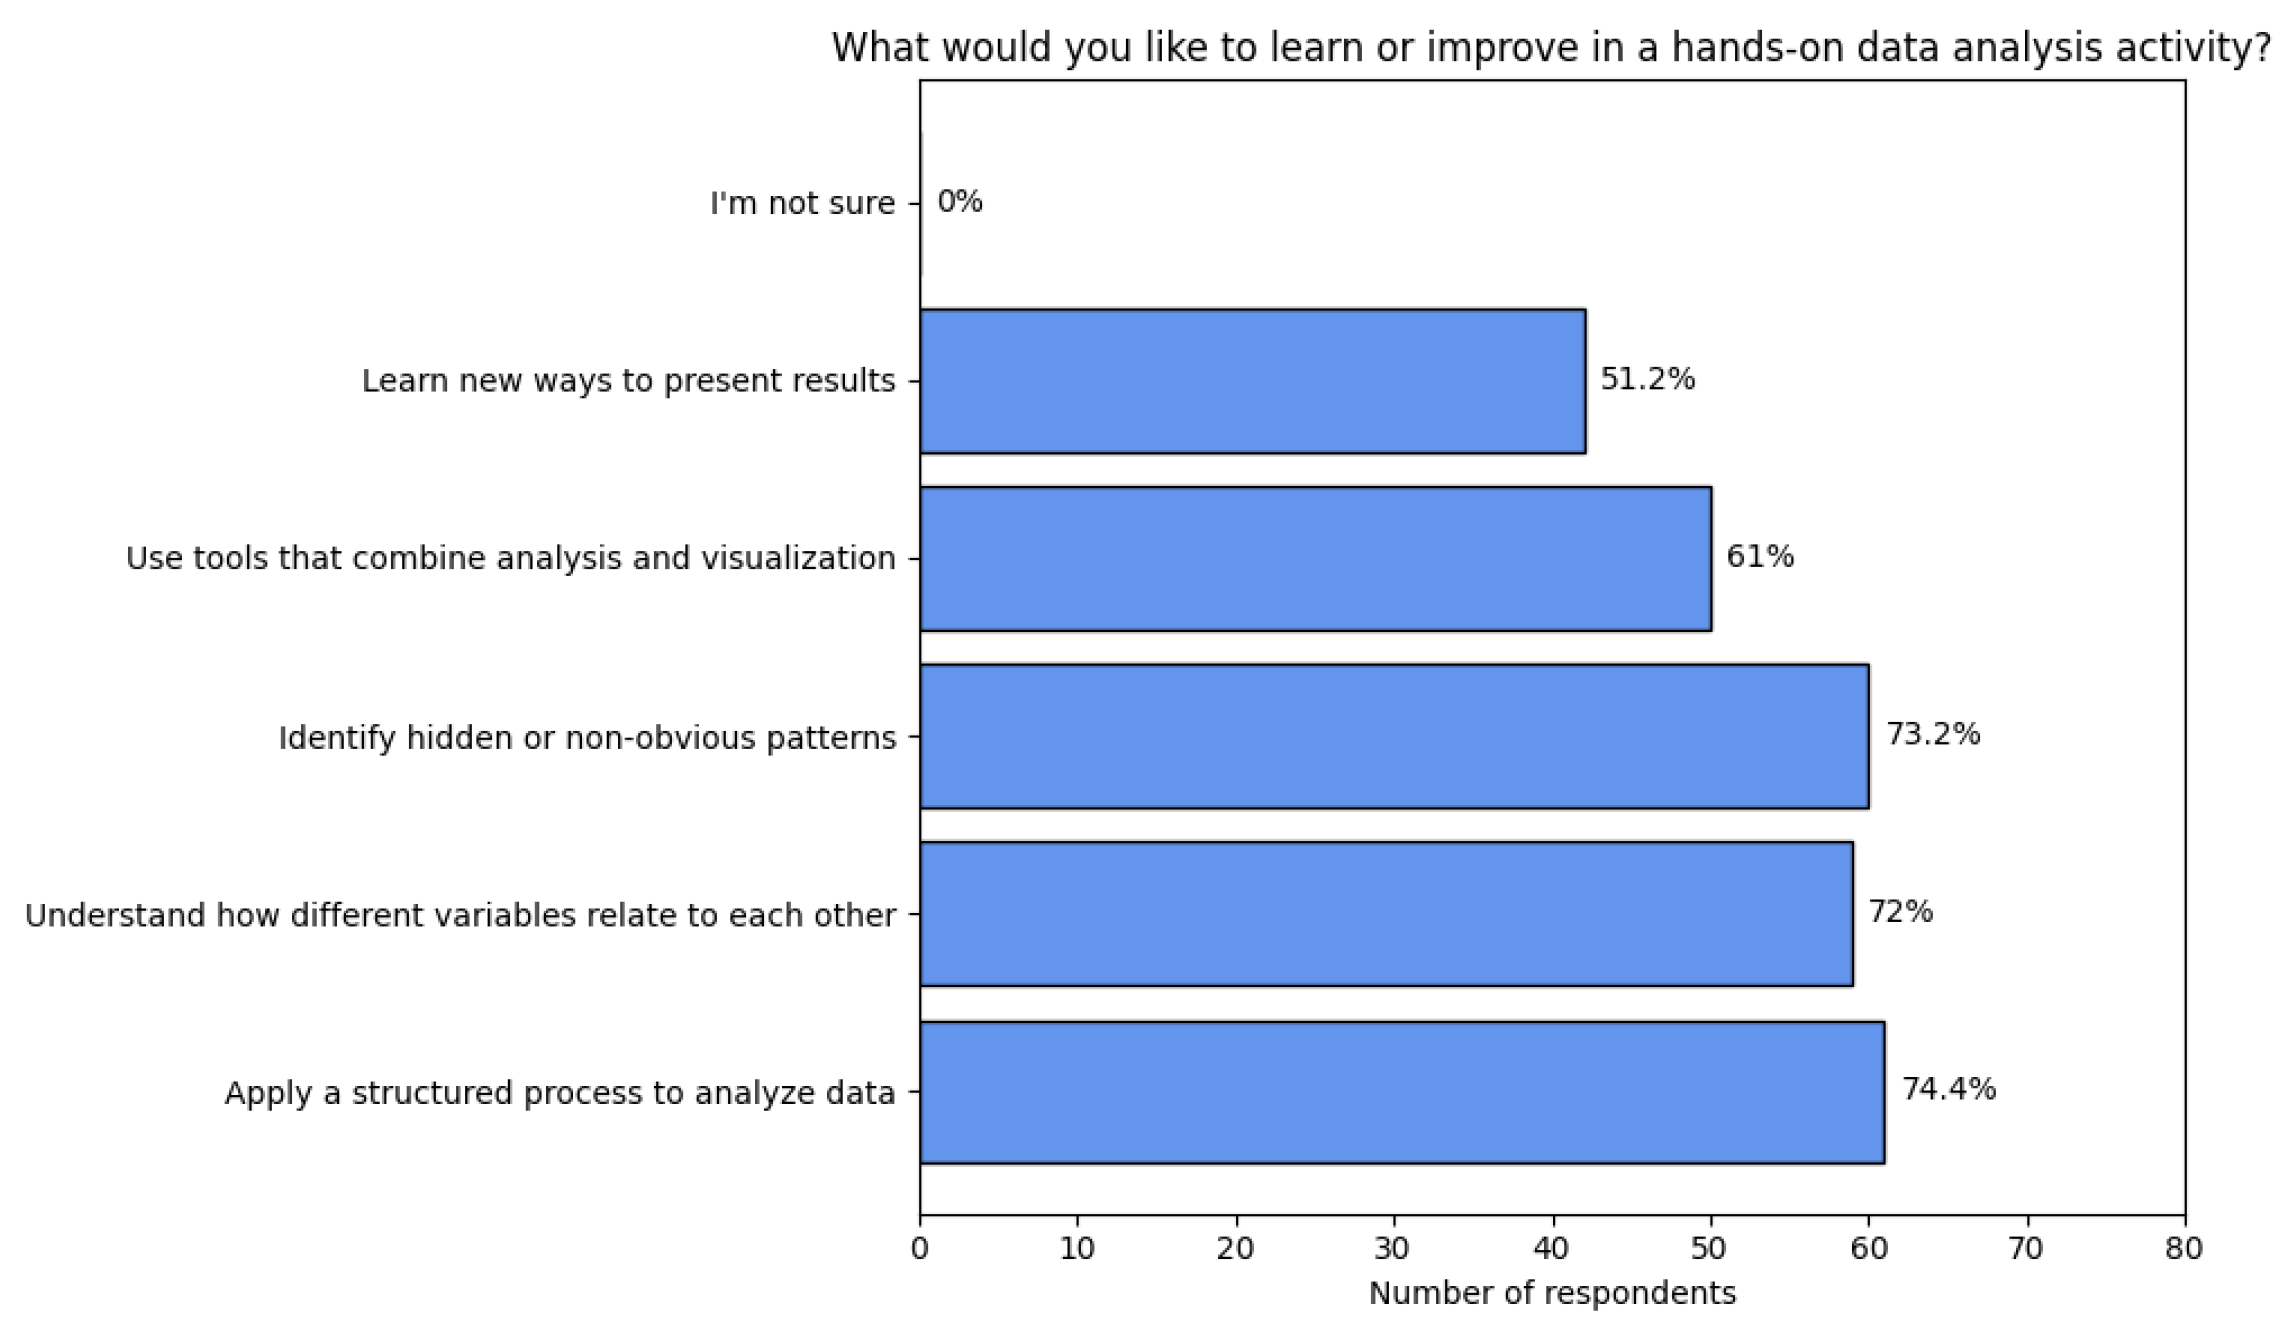
In Figure 17, the learning interests in practical data analysis activities are shown, where most students expressed high interest in applying a structured process (74.4%), identifying hidden or non-obvious patterns (73.2%), and understanding how different variables relate to each other (72%). Other preferences also stand out, such as the use of tools that combine analysis and visualization (61%) and learning new ways to present results (51.2%). These results reflect a positive attitude toward methodologies that clearly integrate technical analysis with the visual interpretation of data.
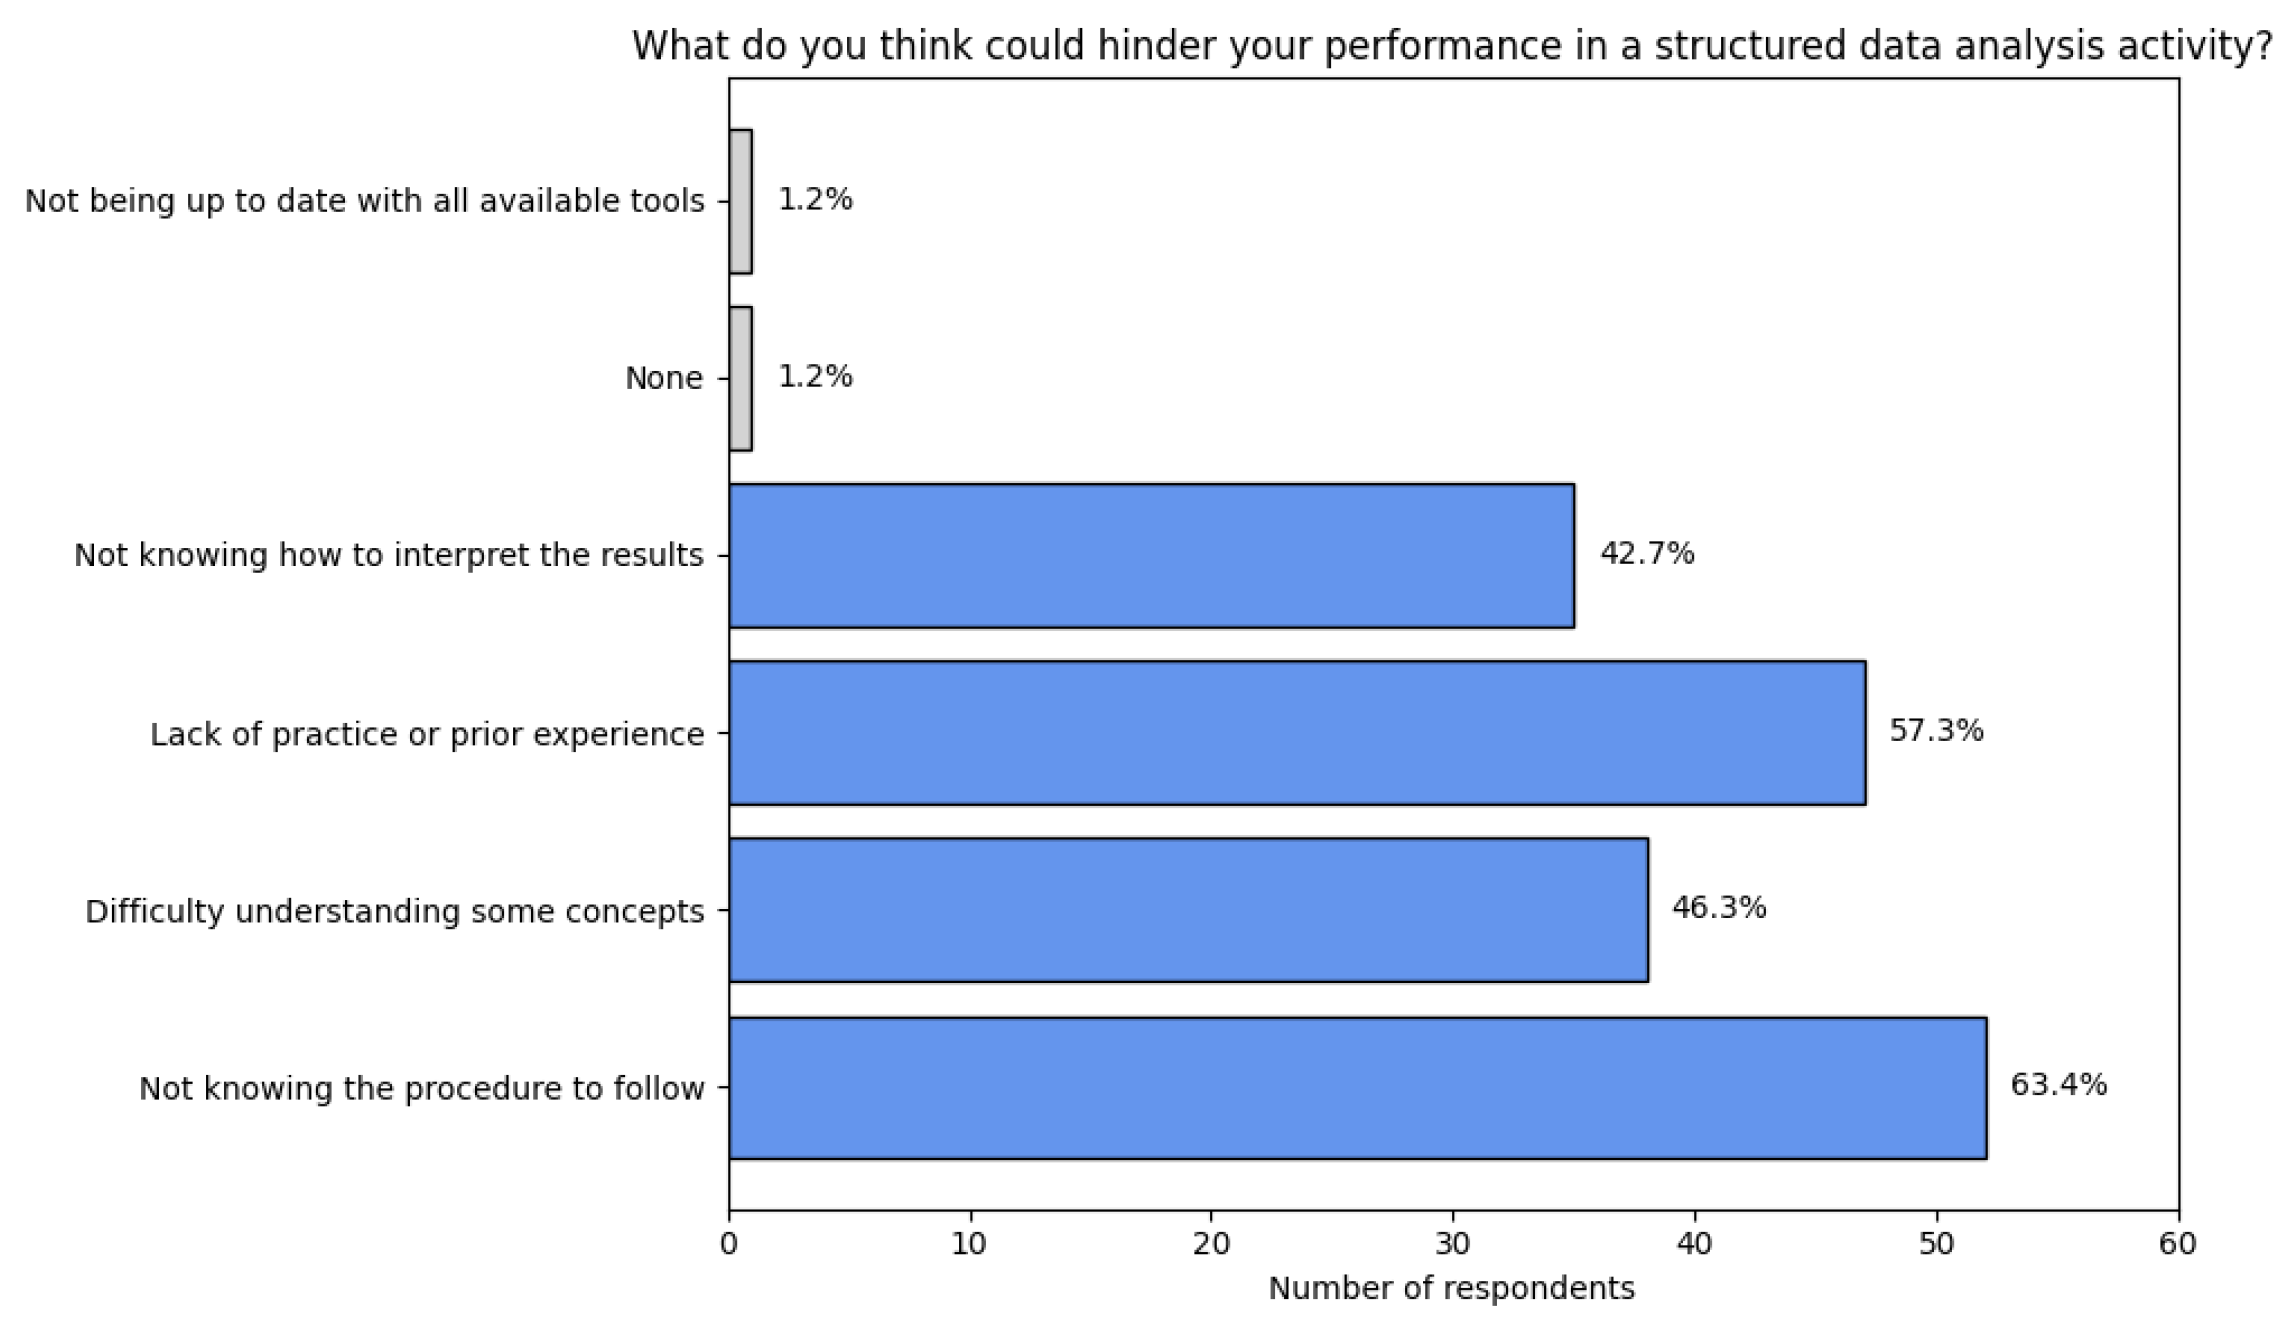
Based on Figure 18 about possible difficulties in performing structured data analysis activities, it can be seen that the main obstacle identified by the respondents was not knowing the procedure to follow well (63.4%), followed by a lack of practice or previous experience (57.3%), and difficulty in understanding some concepts (46.3%). It is also notable that 42.7% mentioned not knowing how to interpret the results obtained. These findings reflect the need for clear, structured methodologies supported by tools that strengthen both conceptual understanding and the practical application of data analysis.
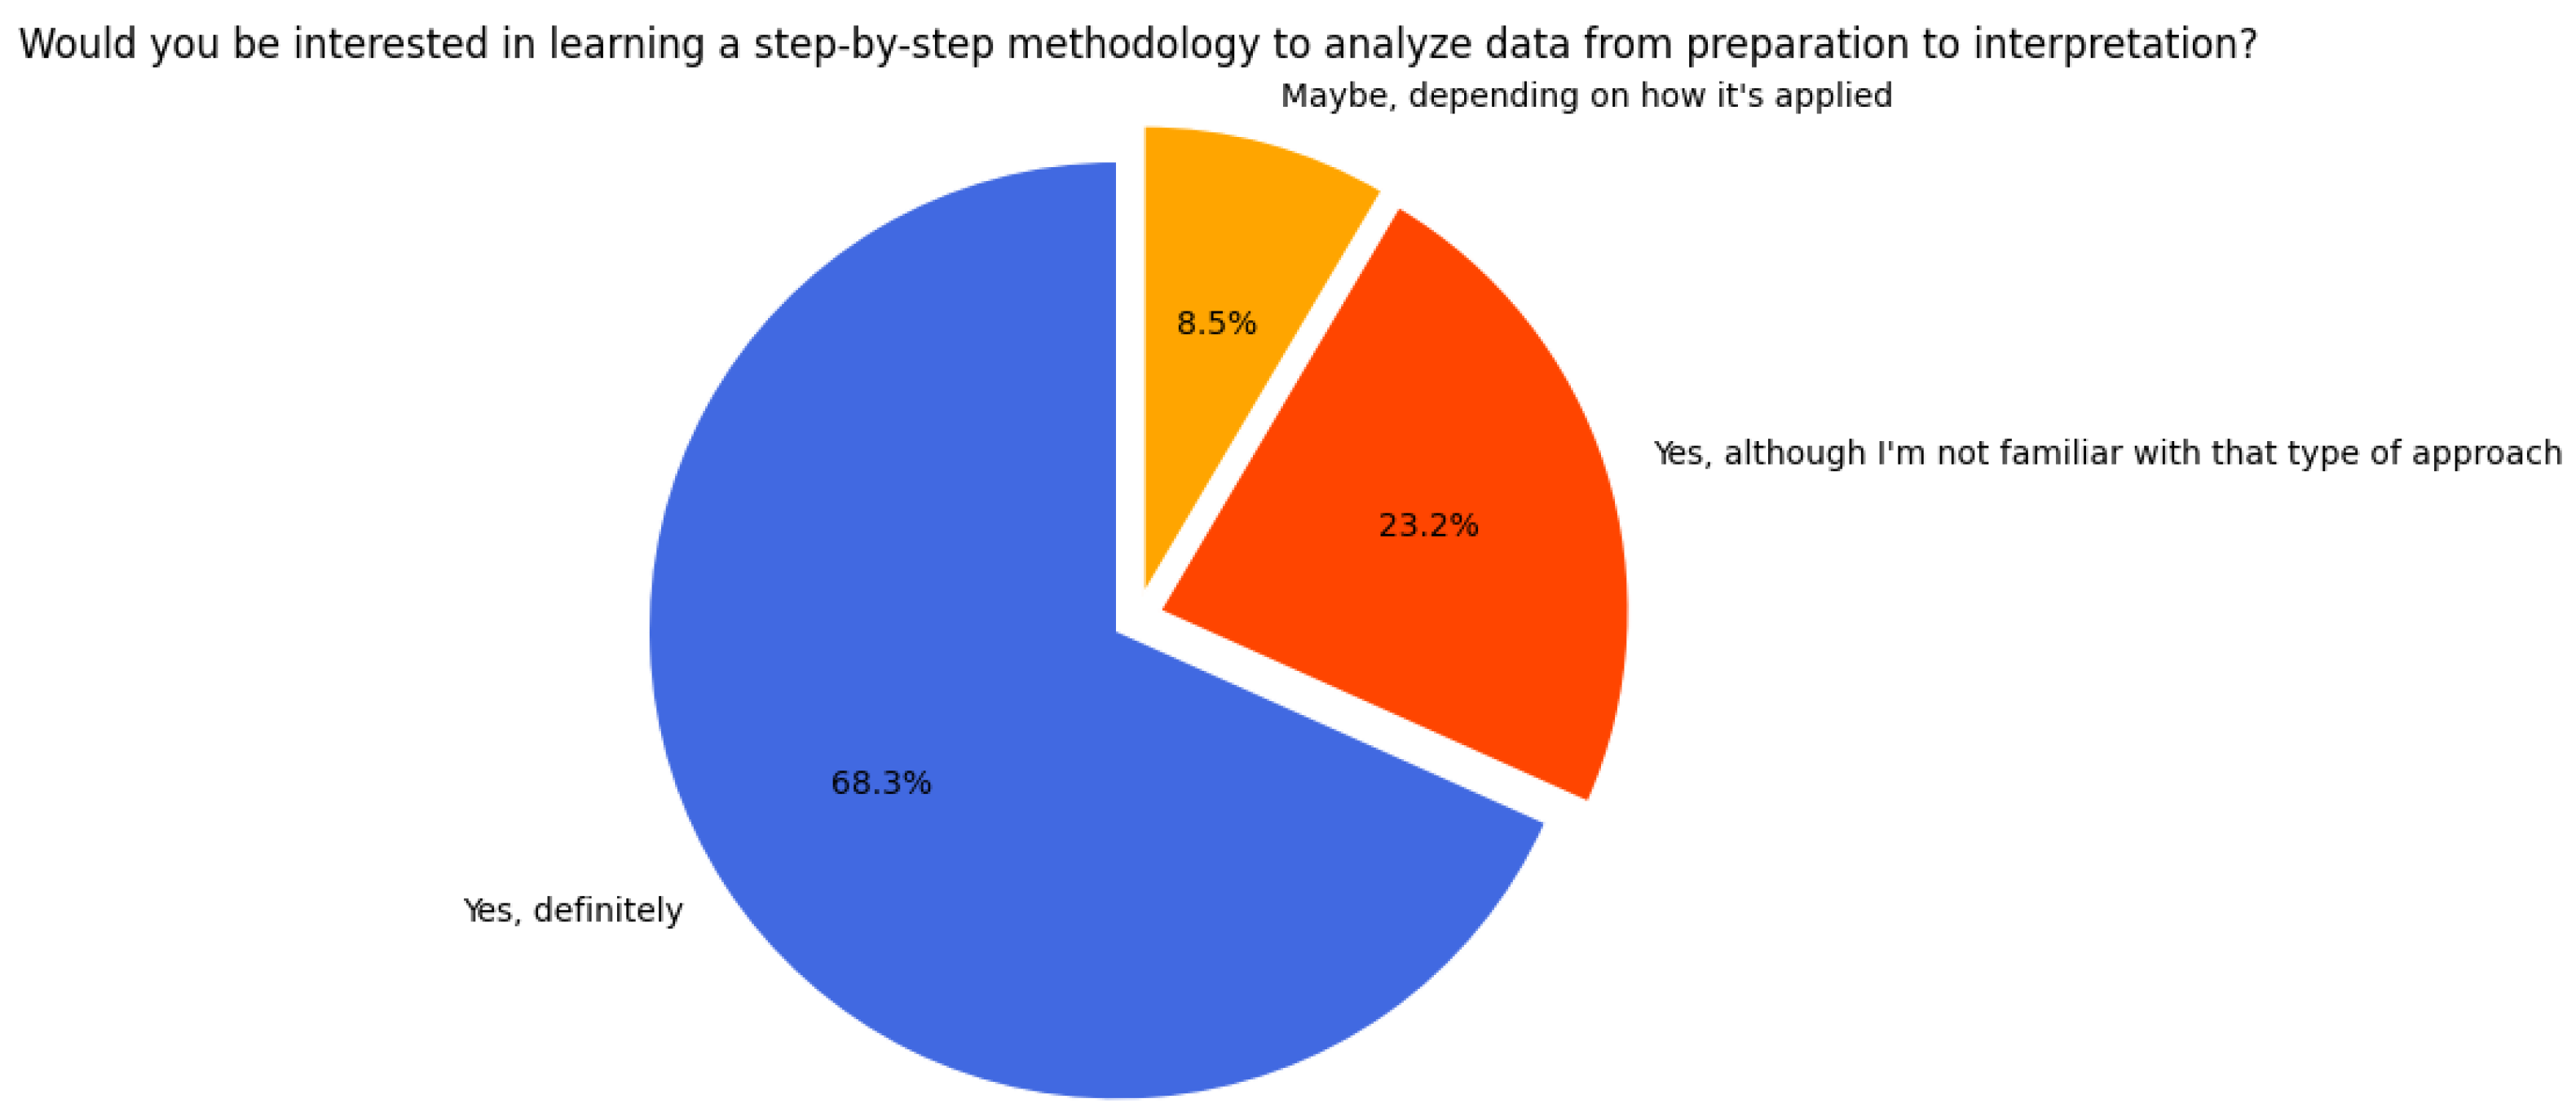
In Figure 19, it is shown that a large percentage of the participants, 68.3 percent, expressed being completely interested in learning a step-by-step methodology to analyze data from preparation to result interpretation. Additionally, 23.2 percent expressed interest although they are not familiar with this type of approach, and 8.5 percent would consider it depending on how it is applied. These results show a high willingness among students to incorporate structured methodologies into their analysis processes, which supports the relevance of developing and implementing integrated methodological proposals such as the one presented in this study.
Figure 20 shows that 67.1% of respondents said they are very interested in learning tools that allow for analyzing relationships between elements, such as networks or graphs, while 30.5% expressed some interest. Only 2.4% of the population showed little or no interest. These data reinforce the relevance of incorporating network analysis in educational settings, as there is a clear willingness among students to explore this type of approach.
The diagnostic results highlight a heterogeneous knowledge profile among the students. While most had some exposure to data analysis, familiarity with CRISP-DM and network analysis was limited, which justifies the relevance of introducing an integrated approach. The strong interest expressed in learning structured processes, identifying hidden patterns, and using network-based tools indicates that the method responds to a genuine educational and practical need. At the same time, the reported difficulties, such as lack of prior experience and uncertainty about interpreting results, underscore the importance of providing clear guidance and examples during implementation. Together, these findings indicate the pertinence of the proposed methodology as both a pedagogical instrument and a framework for applied analysis.

4.5.2. Method Application

The process was implemented with the Data Mining group from the Computer Systems Engineering program at UPIIZ-IPN, made up of 20 students. This same group had worked with the CRISP-DM model in the course Statistical Tools for Data Analytics one semester earlier, where they applied it in a project related to public health data analysis. Thanks to that previous experience, the students were already familiar with the context and the associated problem. In this new experience, they carried out an analysis using information from the Encuesta Nacional de Salud y Nutrición (ENSANUT) 2021, focused on the prediction of hypertension, using variables such as weight, height, and diagnostic condition, among others. The group was divided into five teams of four members.
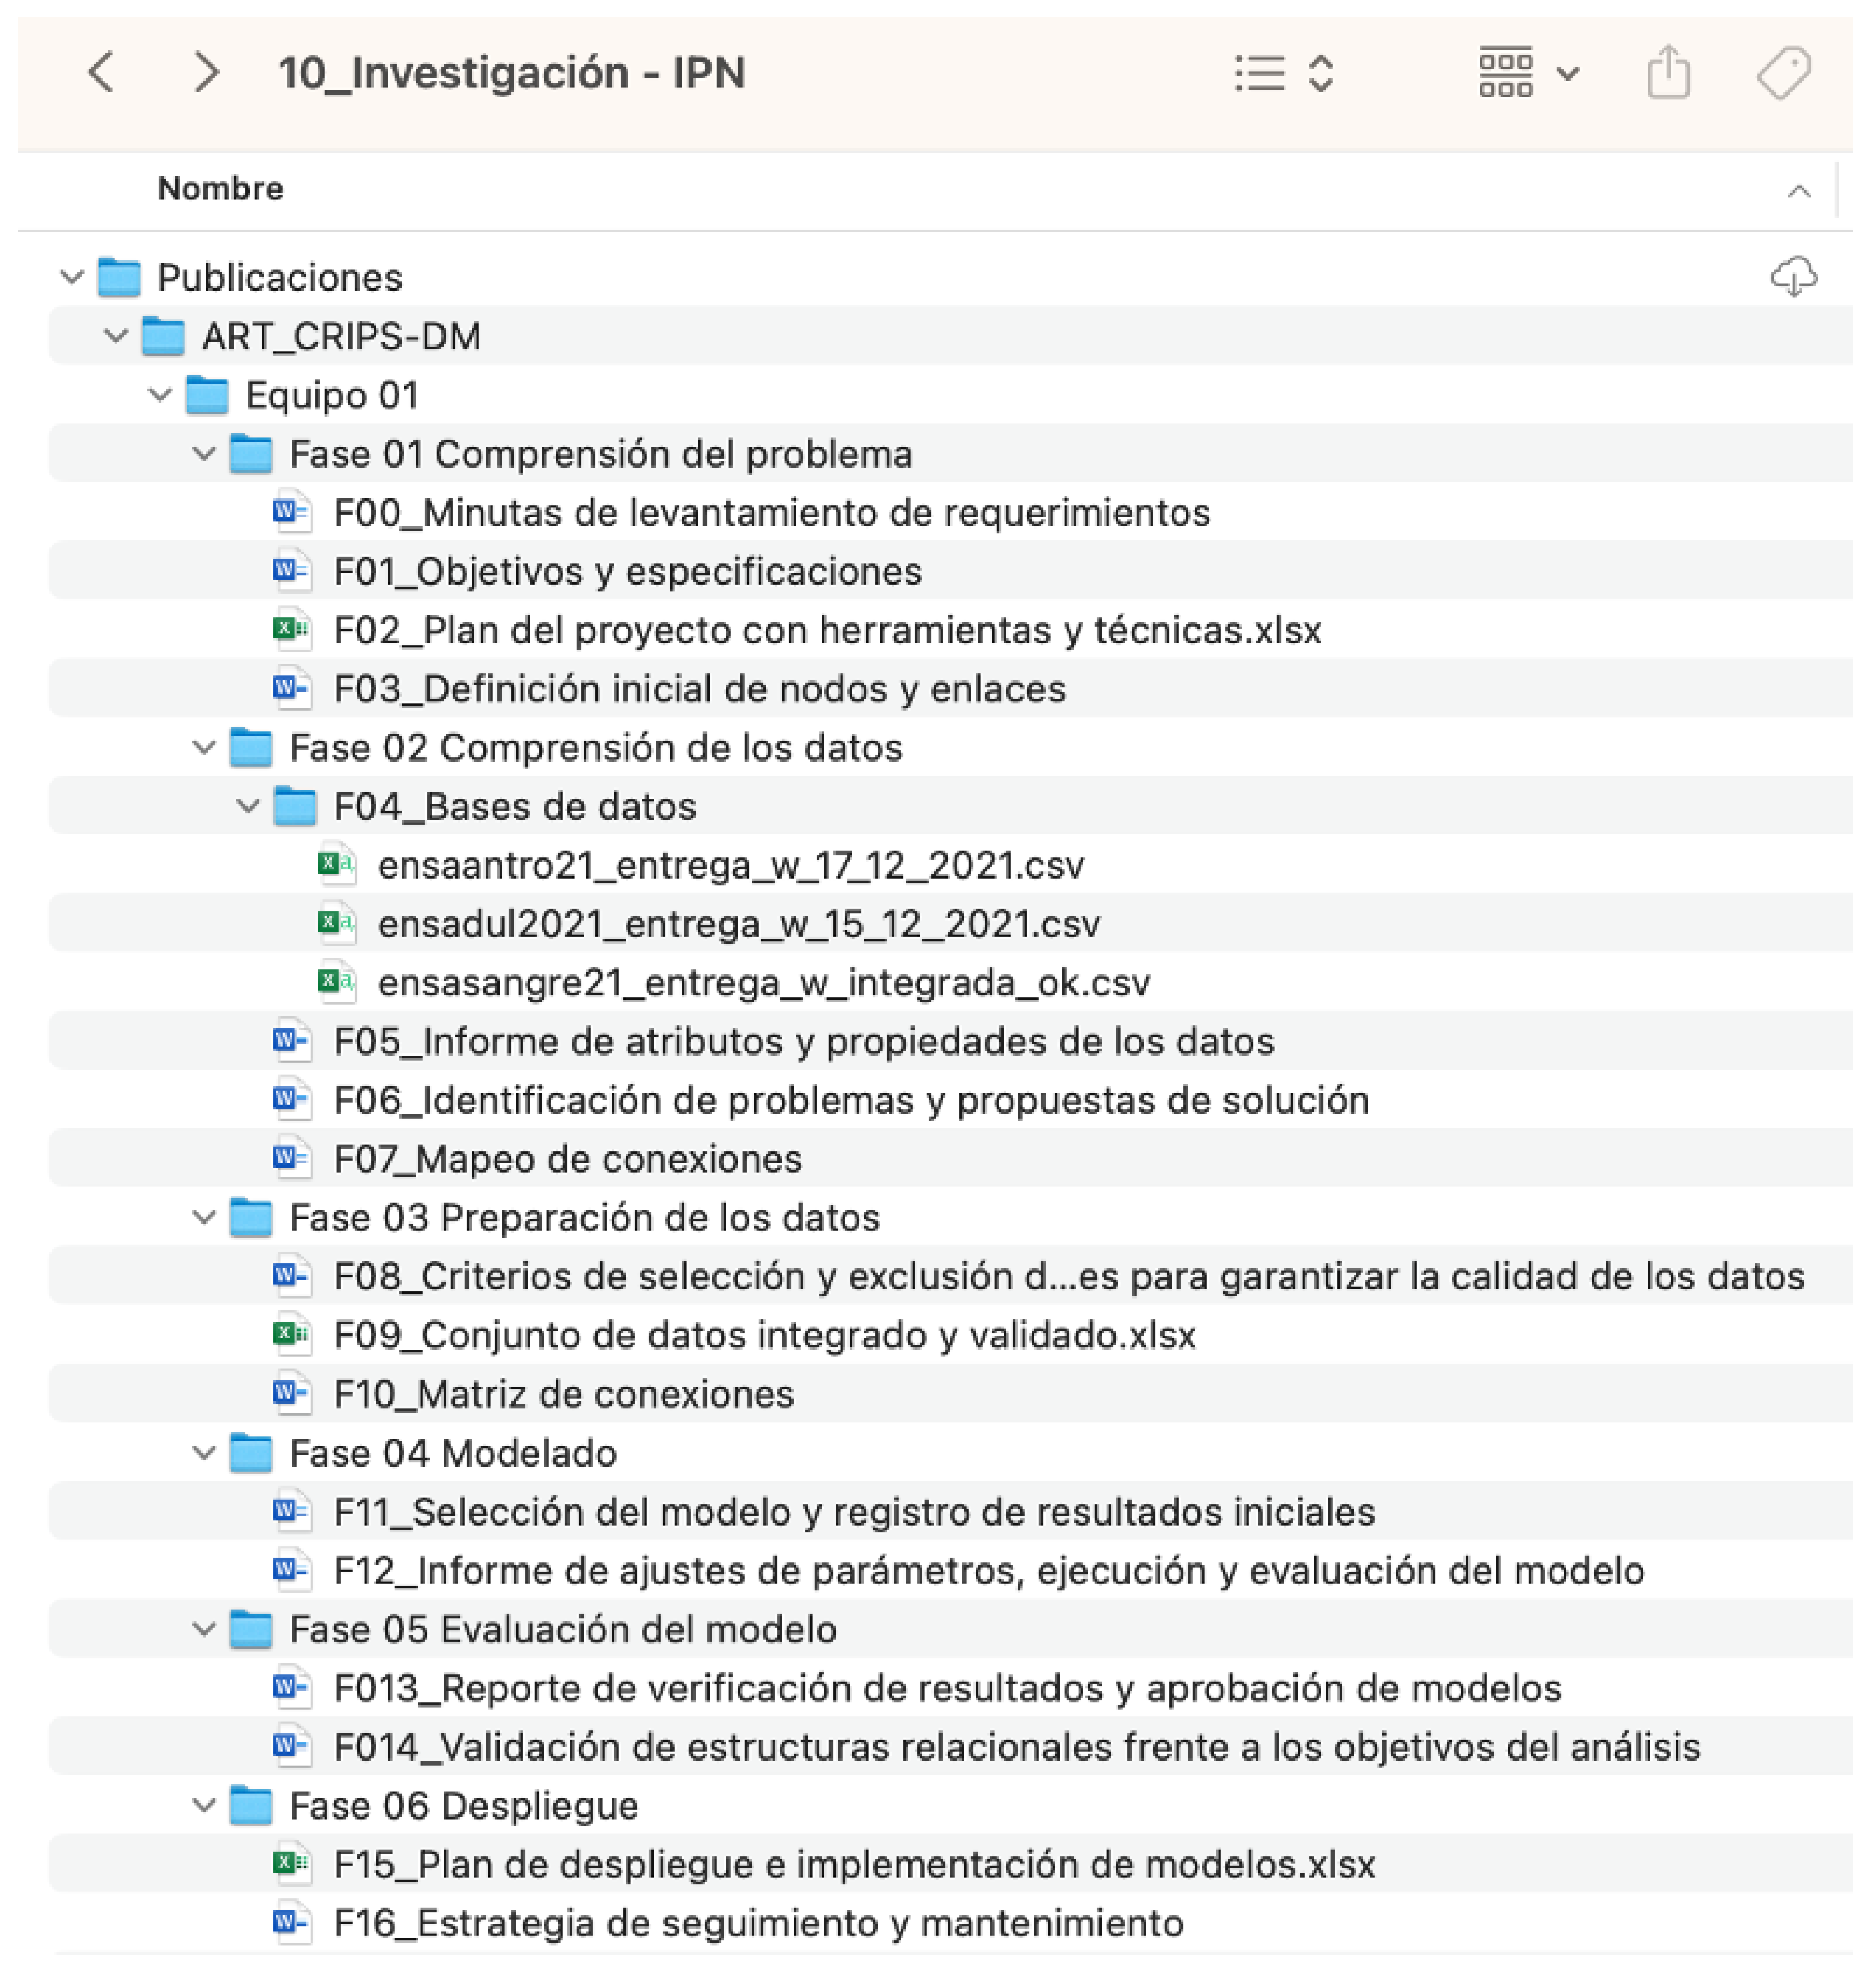
To facilitate process documentation, specific templates were designed for each phase, which were completed by the teams based on the information generated during their application. A digital repository was also created on the OneDrive platform using the institutional IPN account, in order to organize and track all deliverable products. Each uploaded file corresponds to one of the expected results in the model. Figure 21 shows an example of the repository structured by teams and phases, where the organization of the generated products can be seen, such as meeting minutes, project plans, attribute reports, connection matrices, sociograms, among others.
The implementation of the method was carried out from 18 March to 23 May 2025. However, due to non-working days in the academic calendar and regular evaluations, students had a total of 32 effective working days to complete the process.
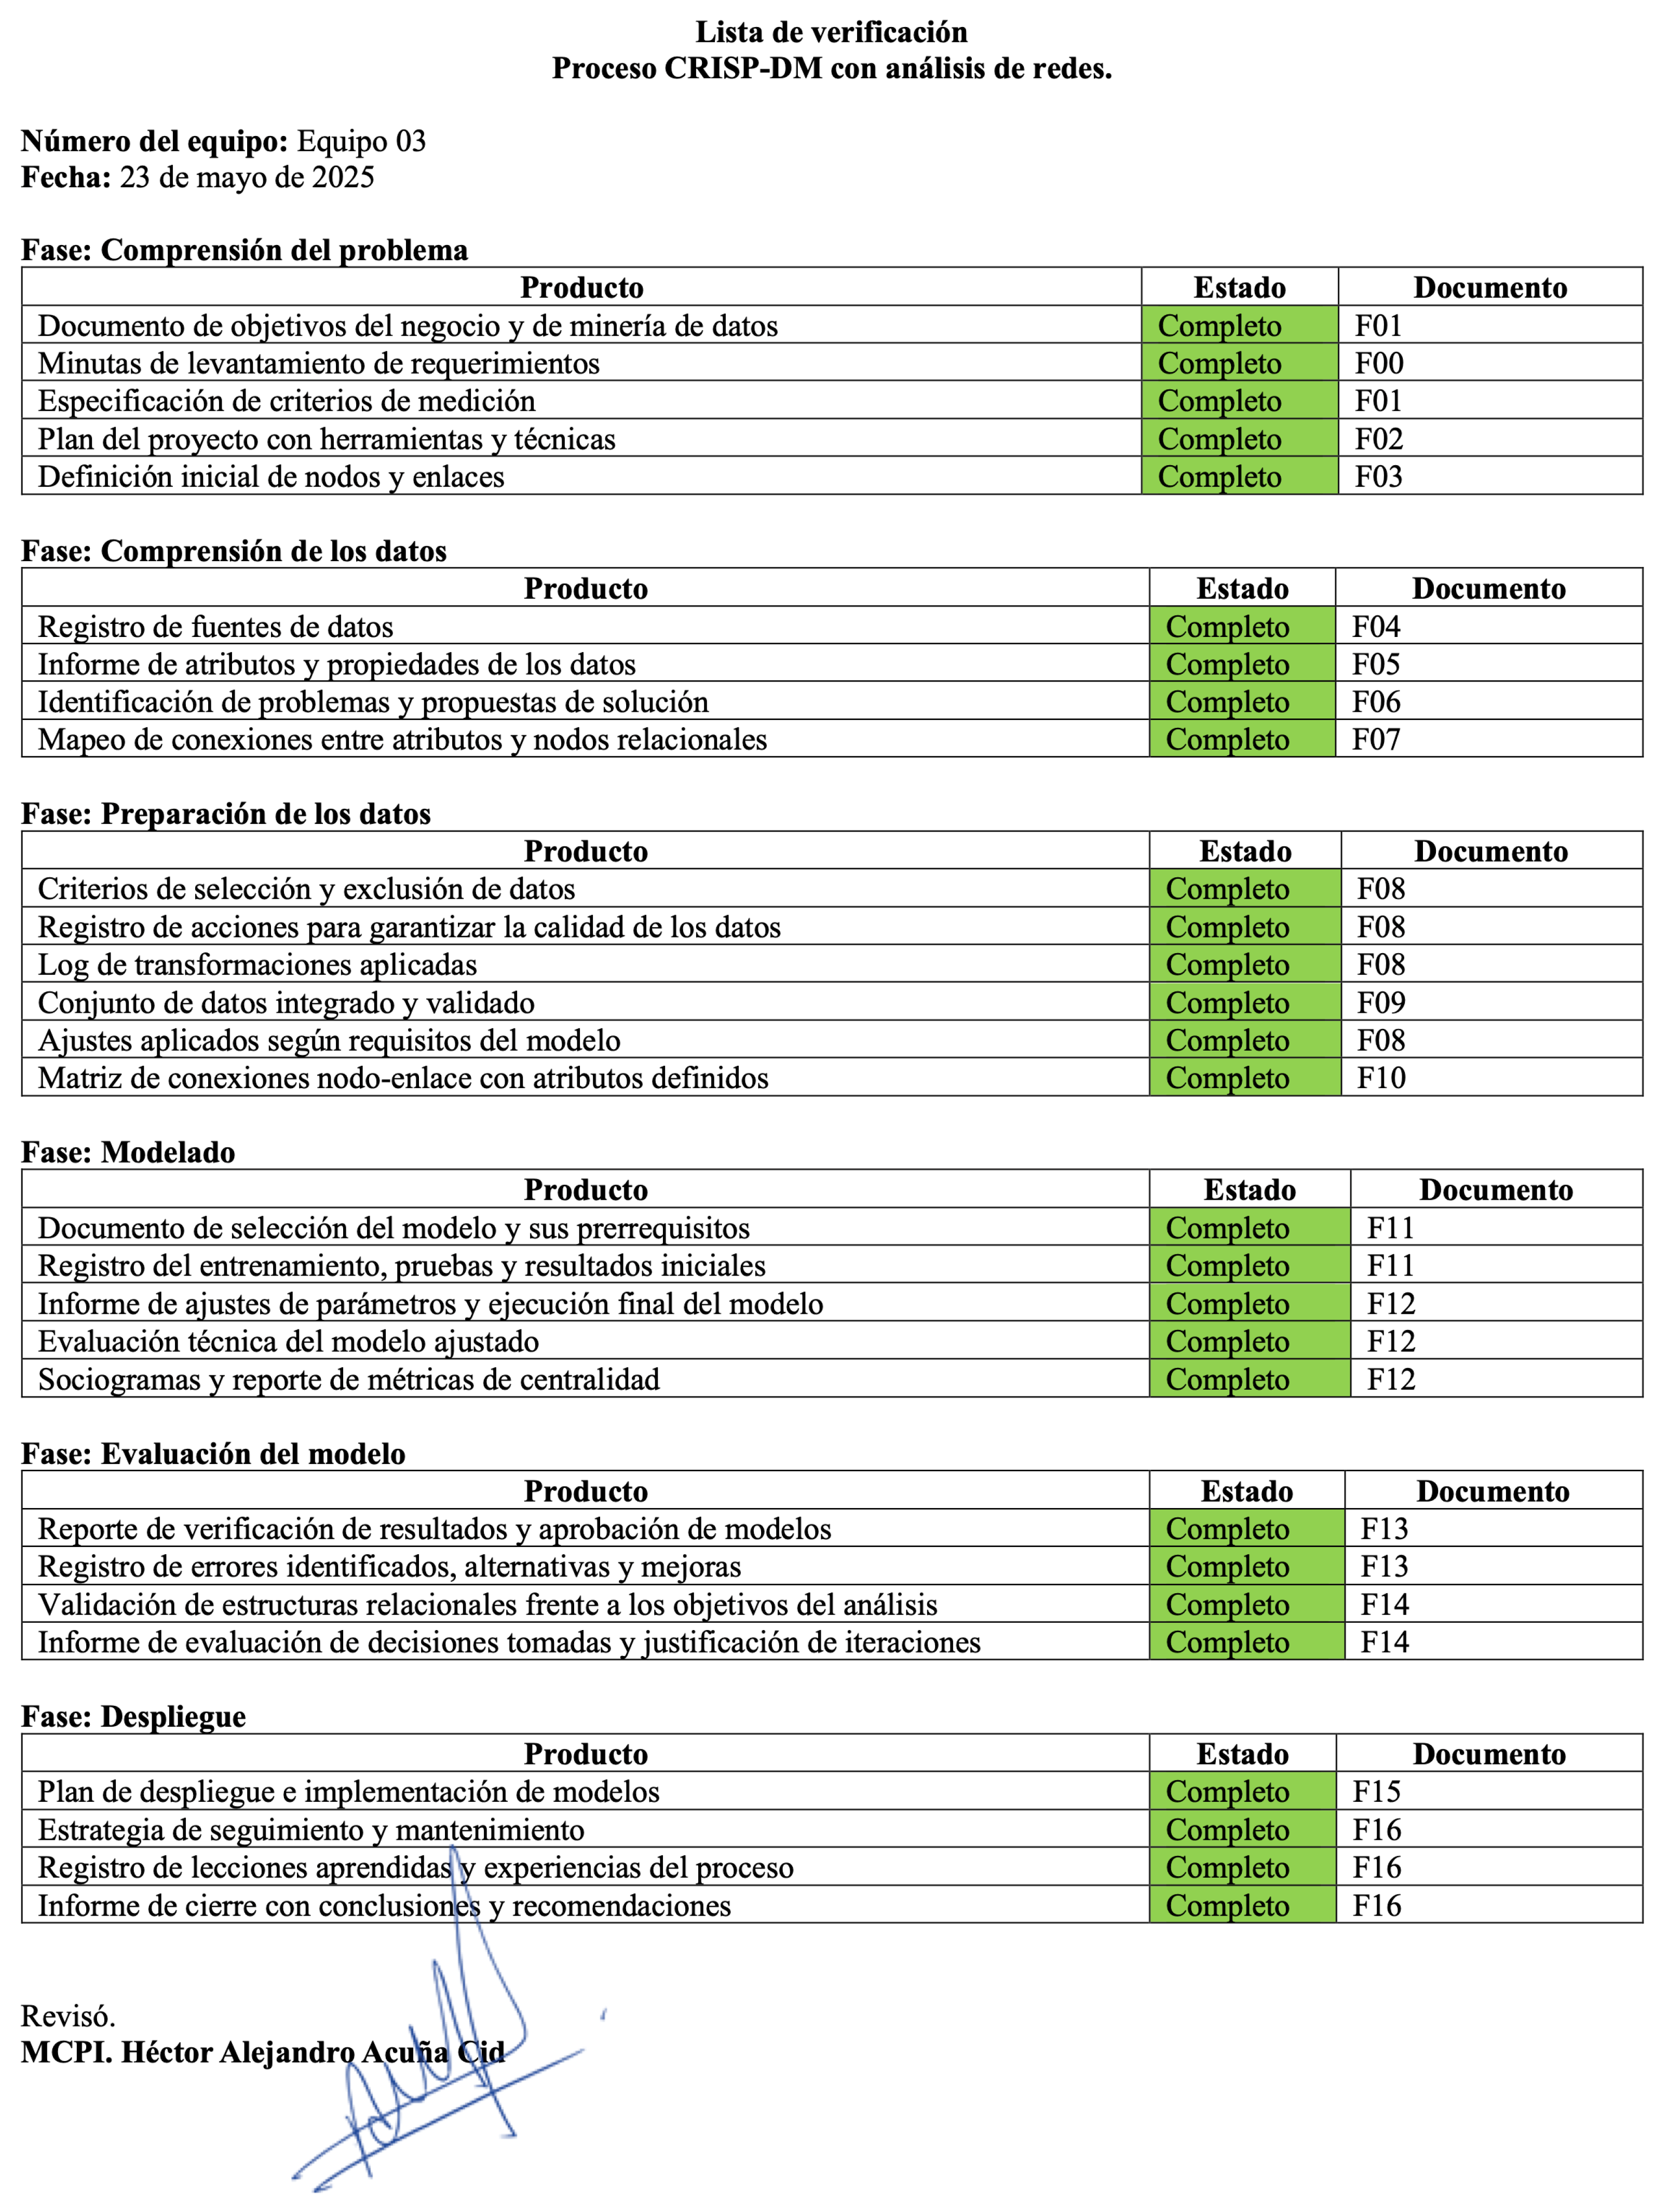
To ensure that each team properly followed the proposed process and submitted the required outputs for each phase, a checklist was designed. This instrument made it possible to systematically record whether the activities had been completed and whether the required documents were submitted. It included an evaluation of the status of each product (for example, completed or pending) and identified the submitted file using a reference code. Figure 22 shows an example of this checklist, which helped track progress and review the final compliance with the methodological process.
Case Study with ENSANUT 2021
For the case study, the analysis was conducted with the ENSANUT 2021, focusing on hypertension prediction in the adult Mexican population; after the data preparation phase, the variables finally selected for modeling were age, sex, weight, height, average systolic pressure, average diastolic pressure, diabetes diagnosis, high cholesterol diagnosis, high triglycerides diagnosis, smoking status, blood glucose, HDL cholesterol, LDL cholesterol, and triglycerides.
The process followed all phases of CRISP-DM, complemented with network analysis. In the preparation stage, nodes and links were defined and organized into a connection matrix, while in the modeling stage logistic regression and decision tree classifiers were trained. Logistic regression achieved an AUC of 0.81, and the decision tree reached an accuracy of 0.83, precision of 0.78, and recall of 0.72 after parameter adjustments, which confirmed the predictive capacity of the integrated method CRISP-DM with network analysis (CRISP-NET).
These results indicate that the integrated method is capable of producing predictive models with competitive performance while also revealing the relational structure of health risk factors. The high AUC and accuracy values confirm that the statistical models are reliable, whereas the incorporation of network analysis highlights variables such as blood pressure, obesity, and diabetes as central elements in the prediction of hypertension. This dual perspective suggests that CRISP-NET may achieve technical validity while also generating actionable insights, strengthening its value for public health applications where both prediction and understanding of relationships are essential.
Figure 22. Checklist used to track progress and verify completion of each phase in the methodological process.
Make 07 00101 g022
Critical Analysis of Results
Although the decision tree achieved higher accuracy and recall compared to logistic regression, this difference can be interpreted in light of the models’ characteristics. Decision trees adapt better to non-linear relationships and interactions between variables, which is consistent with the complexity of health data where risk factors do not act independently. Logistic regression, by contrast, assumes linear effects, which may limit its performance in multifactorial contexts such as hypertension. This finding suggests that the integrated method benefits from including models capable of capturing complex relationships that complement the structural perspective provided by network analysis.
From a relational standpoint, the identification of central nodes such as obesity, diabetes, and blood pressure has implications beyond technical validation. These nodes act as key connectors between multiple risk factors, which reinforces their role as strategic targets for prevention policies. For example, addressing obesity could simultaneously reduce the influence of associated conditions such as diabetes, thereby weakening the overall network of hypertension risk. However, the analysis also revealed limitations: the ENSANUT data are cross-sectional, which restricts causal inference, and some variables presented missing or self-reported values that may affect reliability. These aspects highlight the need for complementary longitudinal studies and more robust data collection to strengthen the explanatory power of the methodology.

4.5.3. Method Perception

Once the method application stage was completed, students’ perception was evaluated through a questionnaire designed in Google Forms. The survey was administered on 23 May 2025, after verifying the completion of the process using the checklist. The objective of this instrument was to gather students’ opinions regarding the clarity, usefulness, difficulties, and value of the integrated CRISP-DM and network analysis method.
The questionnaire consisted of ten questions divided into five sections. The first, focused on general information, allowed the identification of the participating group. The second addressed the clarity and understanding of the method, evaluating its structure and the ease with which each phase could be identified. The third focused on the usefulness of the process, considering whether it facilitated the development of the project and whether the integration of network analysis added value. The fourth explored the difficulties encountered during implementation. The fifth, oriented toward added value, asked whether students learned something new, whether they would be willing to apply the process again, and what aspects could be improved. The survey concluded with an open-ended question designed to gather participants’ suggestions, which provided a broad and contextualized view of their experience with the implemented method.
As shown in Figure 23, 70 percent of participants rated the structure of the method as “very clear” and 30 percent as “clear”. No student perceived it as “unclear” or “confusing”, which indicates that most of them properly understood the phases of the process and its organization during implementation.
Another result obtained, shown in Figure 24, indicates that 85 percent of the participants reported having fully identified each phase of the integrated process, while 15 percent stated that they did so only partially. No student reported being unable to identify the phases, which reinforces the clarity with which the method was presented and structured during its implementation.
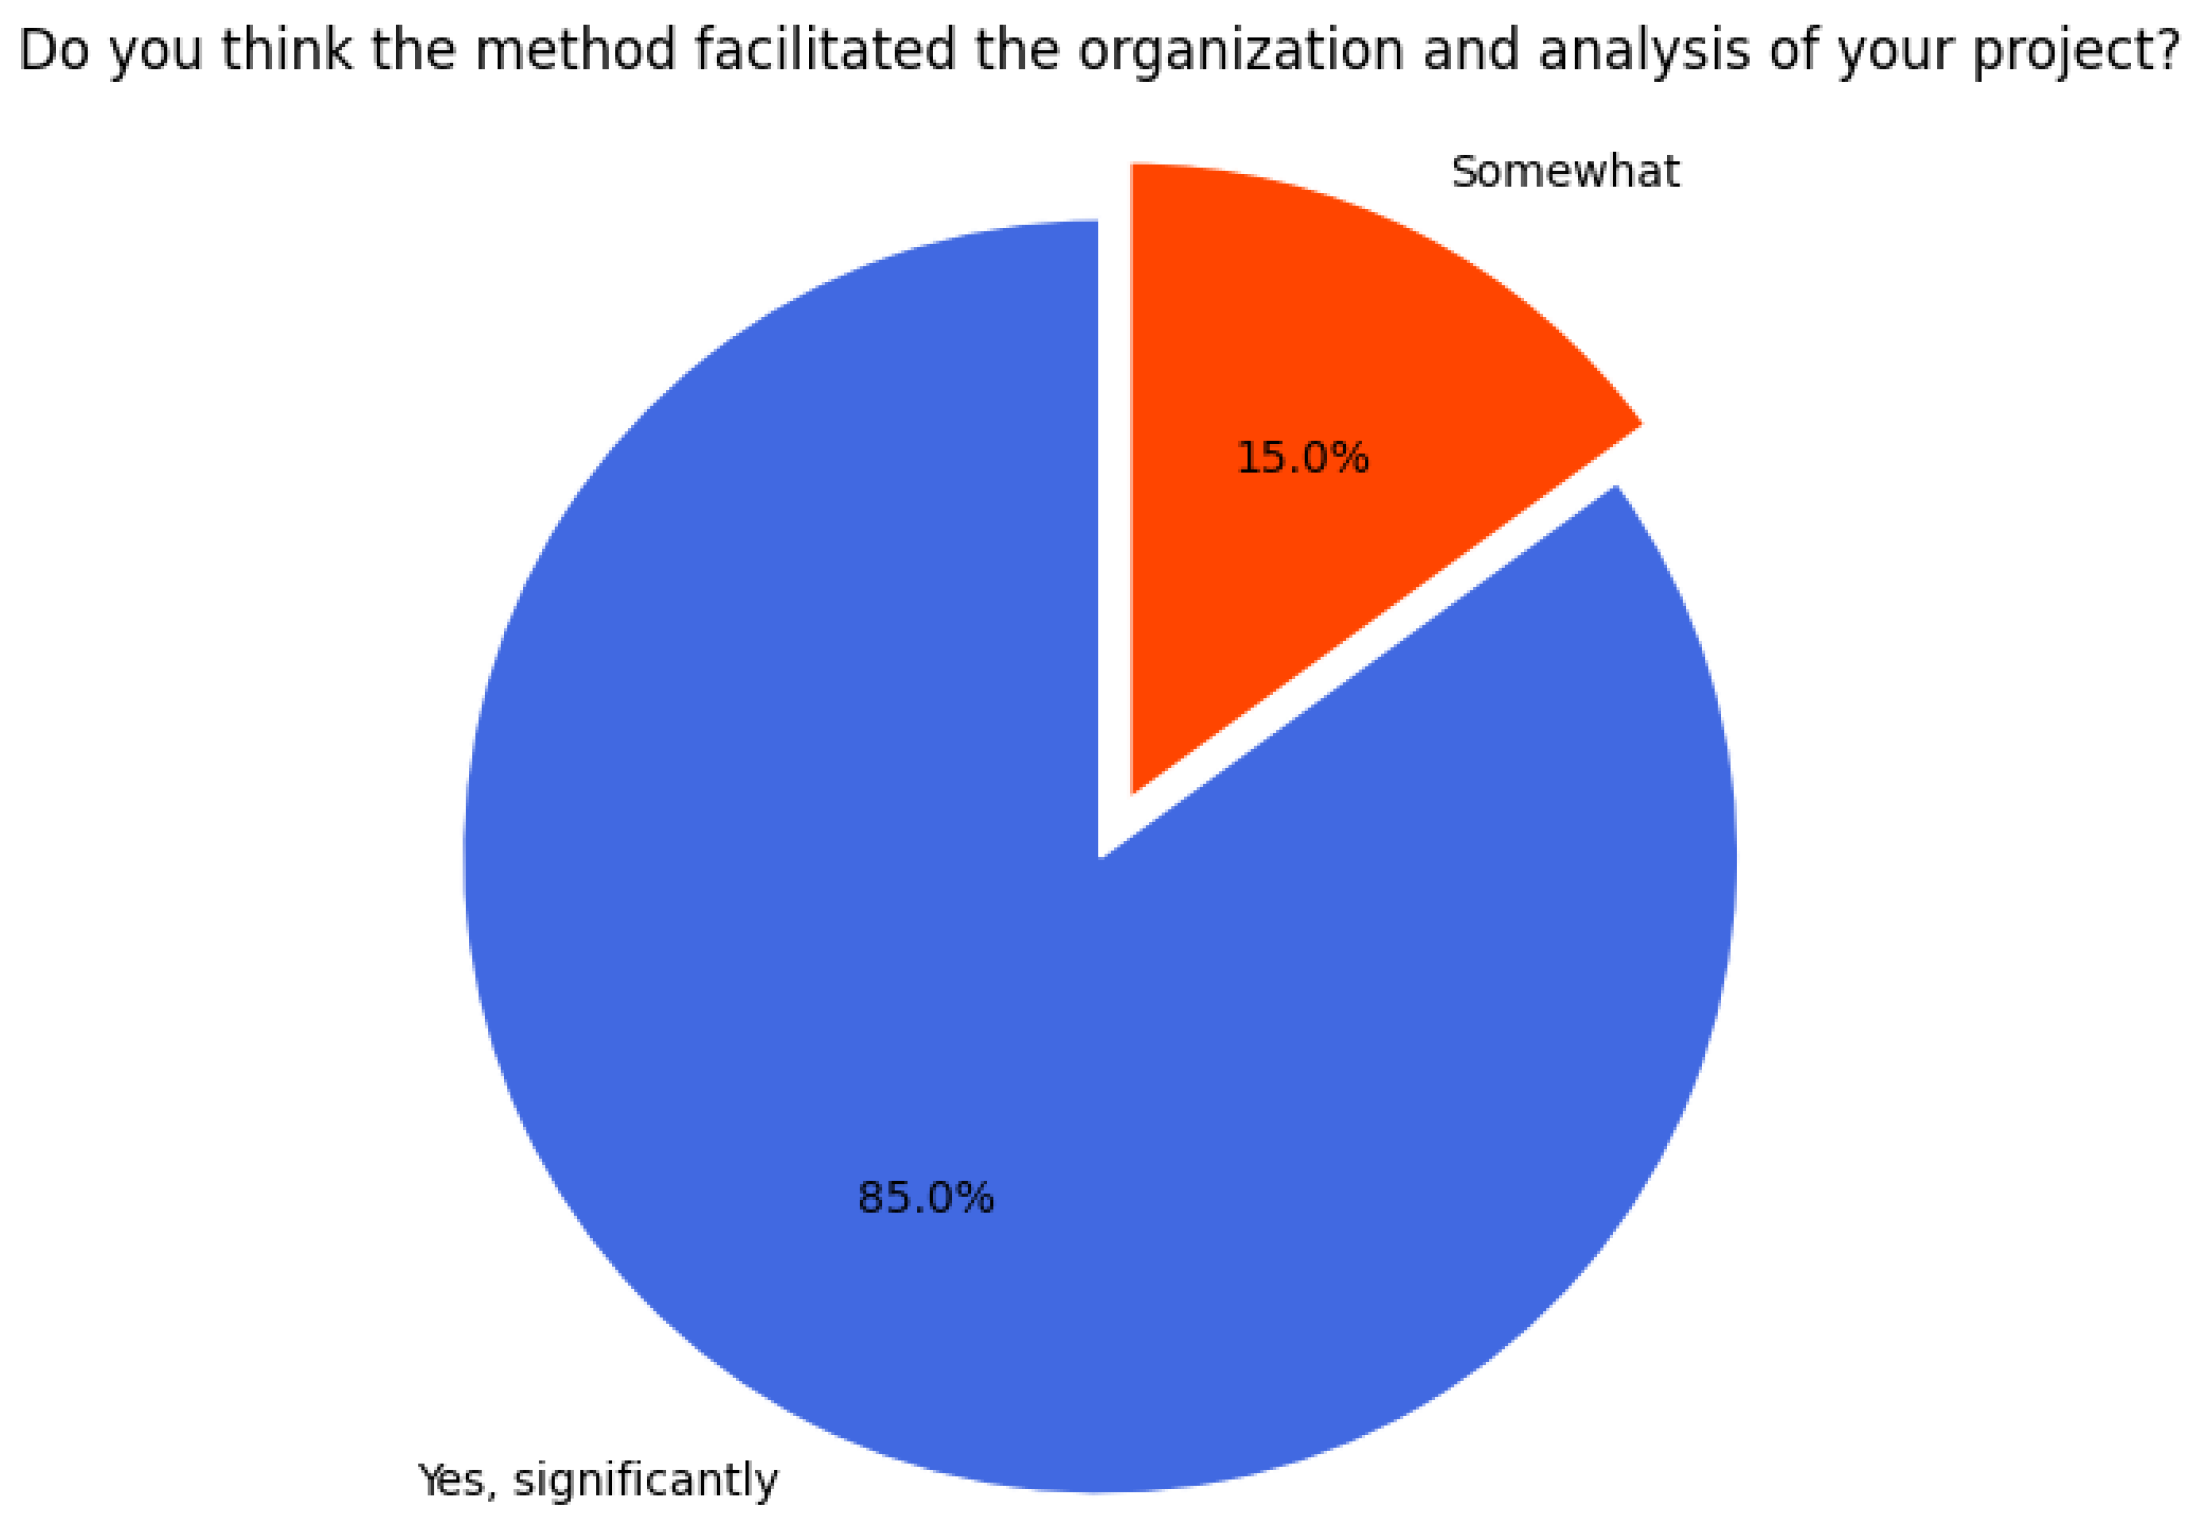
In Figure 25, it can be seen that 85 percent of the students indicated that the method greatly facilitated the organization and analysis of their project, while 15 percent stated that it helped “somewhat”. No responses were recorded for the “little” or “not at all” options, suggesting an overall positive perception regarding the practical usefulness of the process in the development of the work.
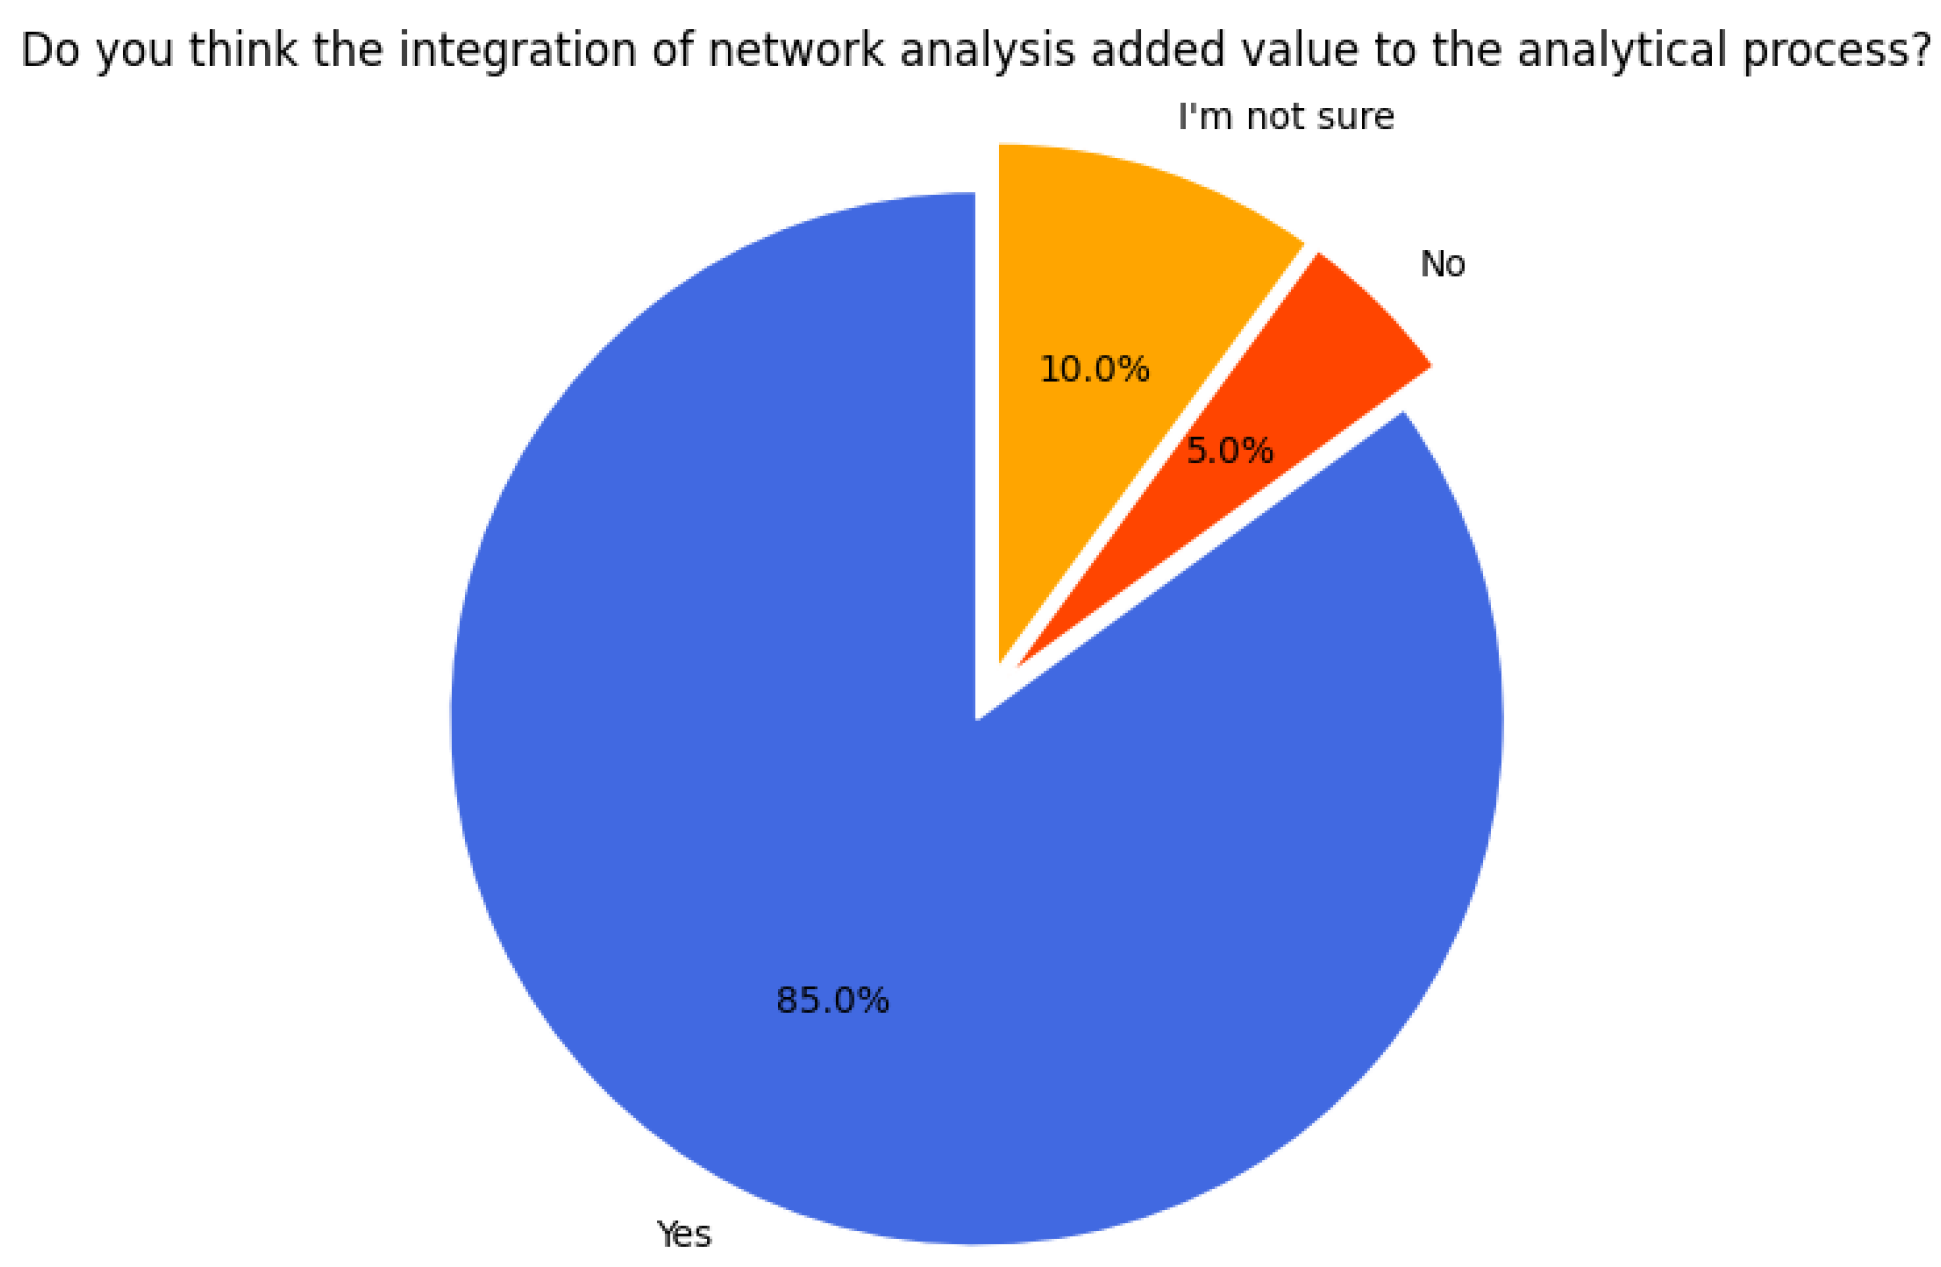
One of the evaluated aspects was the perception of the added value brought by integrating network analysis into the process. As shown in Figure 26, 85 percent of participants considered that this integration did provide value, 10 percent were unsure, and only 5 percent responded negatively. These results reflect a majority acceptance of the usefulness of combining network analysis with the CRISP-DM model.
Another relevant aspect explored was the perception of the usefulness of each phase of the integrated process. As shown in Figure 27, the modeling stage was considered the most useful by all participants (100 percent), followed by data preparation (95 percent) and model evaluation (90 percent). The data understanding phase was also positively evaluated (75 percent), along with business understanding (60 percent), while deployment was marked as useful by only 10 percent of the respondents. These results help identify which stages of the process provide the greatest value for students and where its implementation could be strengthened.
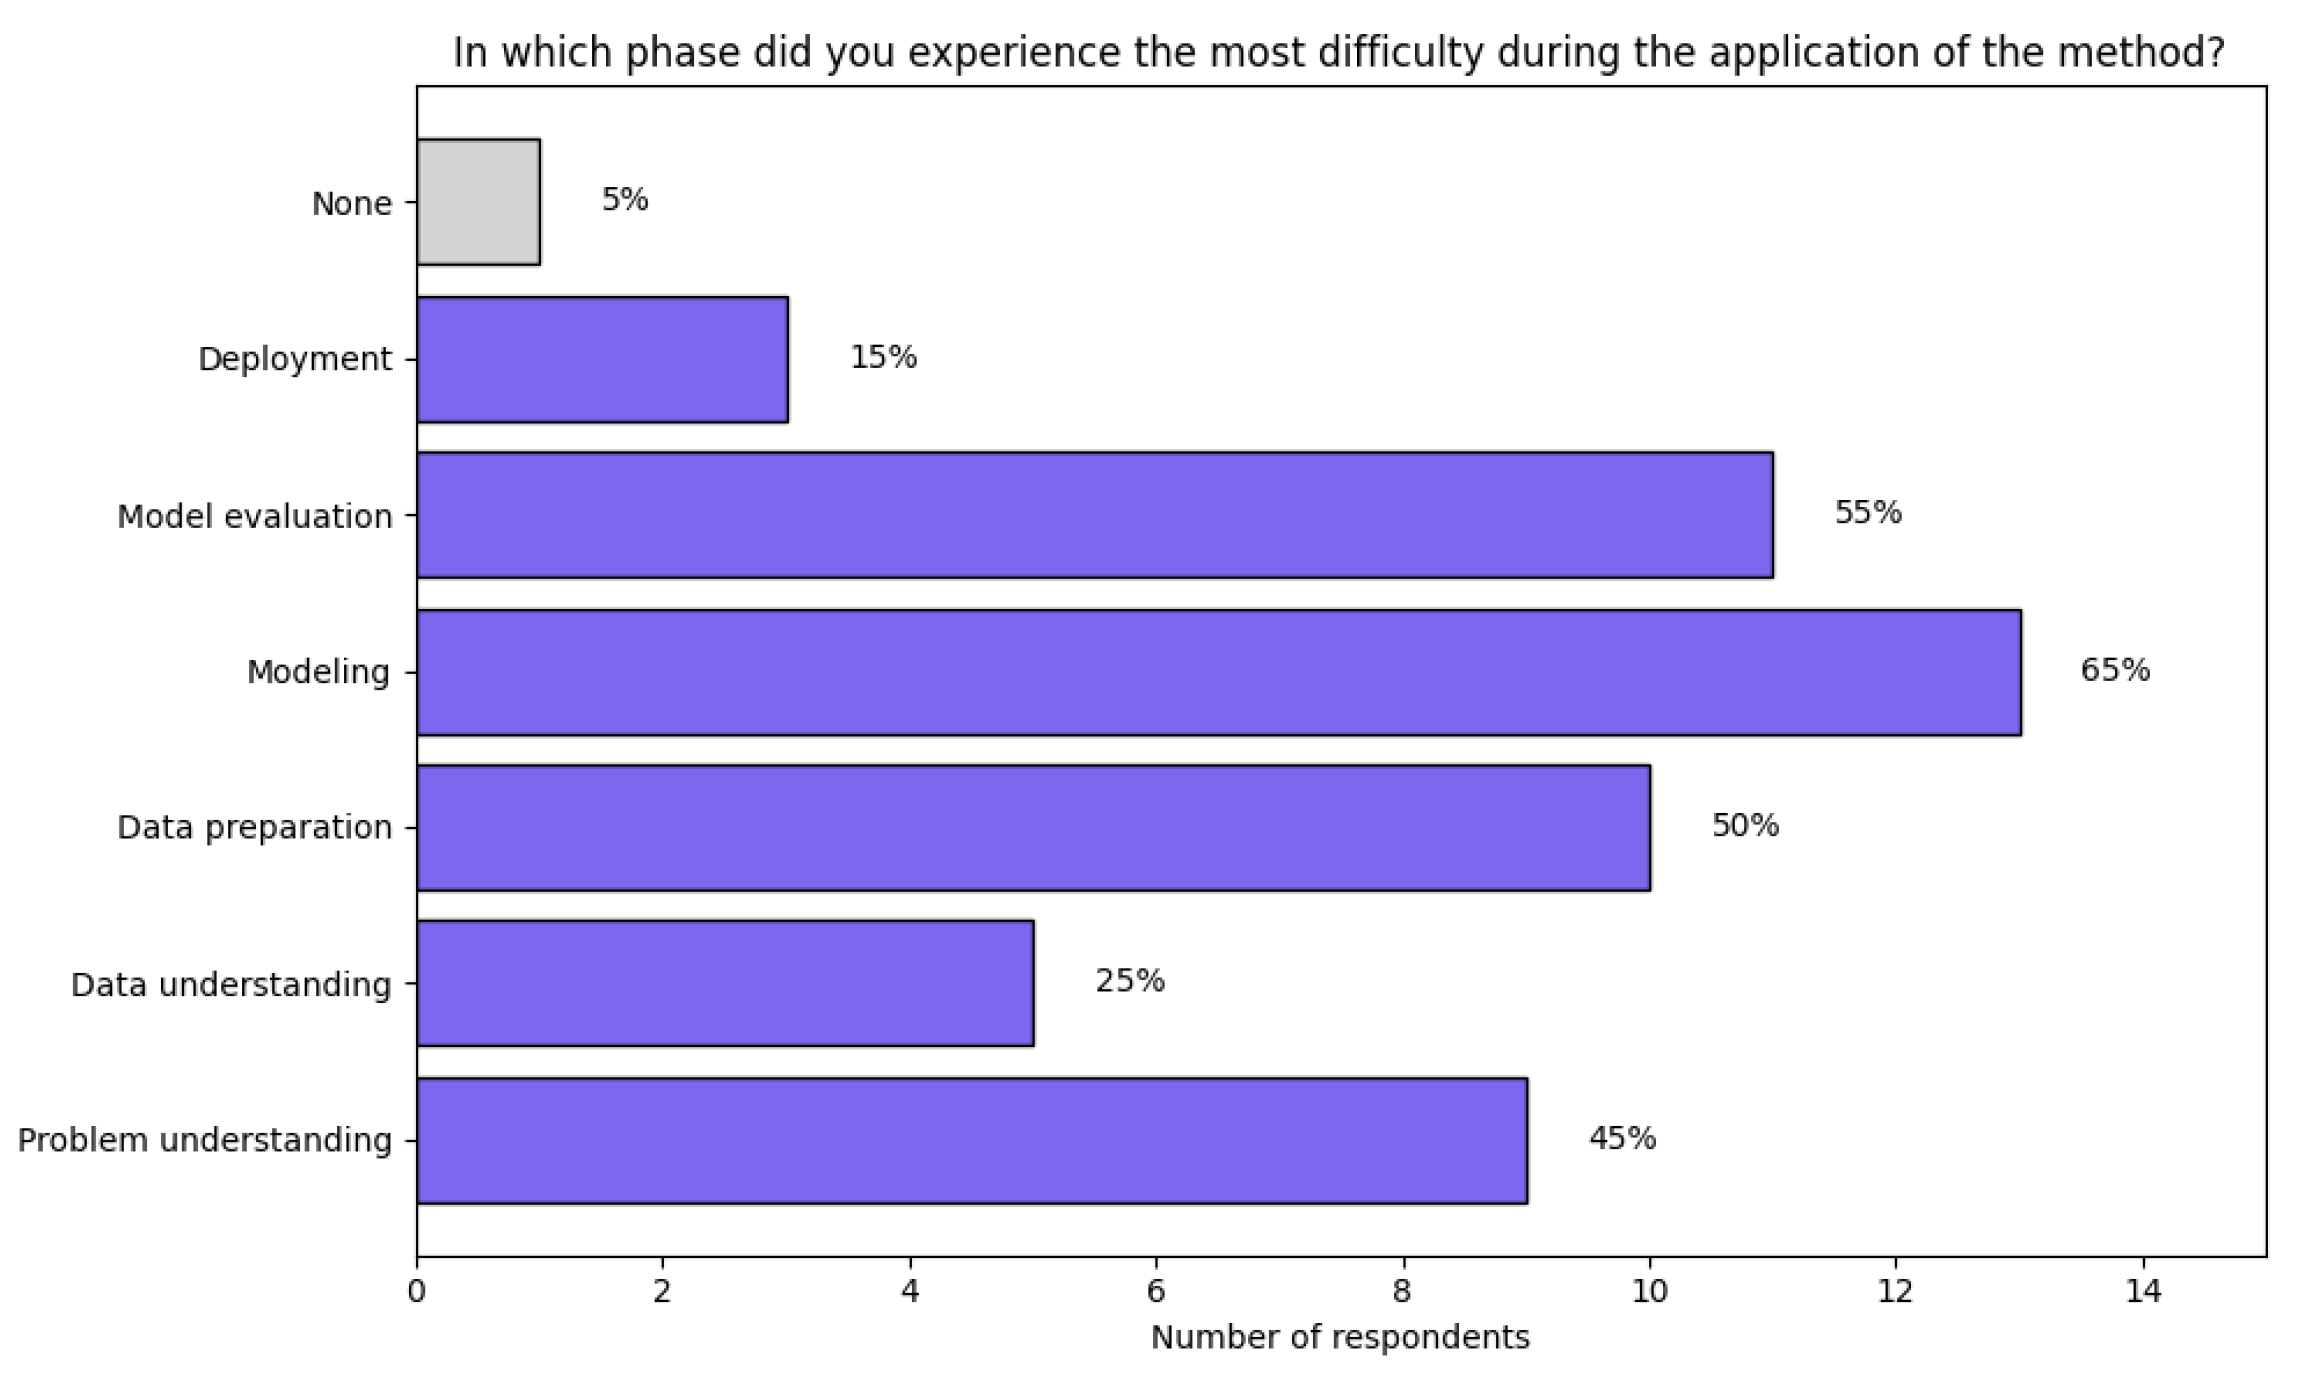
Figure 28 shows the phases of the process where participants experienced the most difficulties. Modeling was identified as the most challenging stage, with 65 percent of responses, followed by model evaluation (55 percent), data preparation (50 percent), and business understanding (45 percent). To a lesser extent, complications were reported in deployment (15 percent) and data understanding (25 percent), while only 5 percent indicated that they had no difficulties. These results help identify the critical points in the process where greater guidance or support is needed to facilitate execution.
Figure 29 shows the main difficulties faced by students during the implementation of the method. Seventy percent indicated that there was not enough time to properly complete the activities, while 65 percent pointed out the lack of examples or guides as a significant limitation. Additionally, 50 percent mentioned that the activities were unclear, and 30 percent stated that they did not fully understand the concepts. These results highlight key areas for improvement related to time planning, clarity of instructions, and conceptual guidance during the development of the process.
Ninety-five percent of the students reported having learned something new by applying the method, which validates the formative potential of the methodological proposal. Only a minority, 5 percent, indicated that they did not acquire new knowledge, suggesting that the experience, in general terms, met its educational goal (Figure 30).
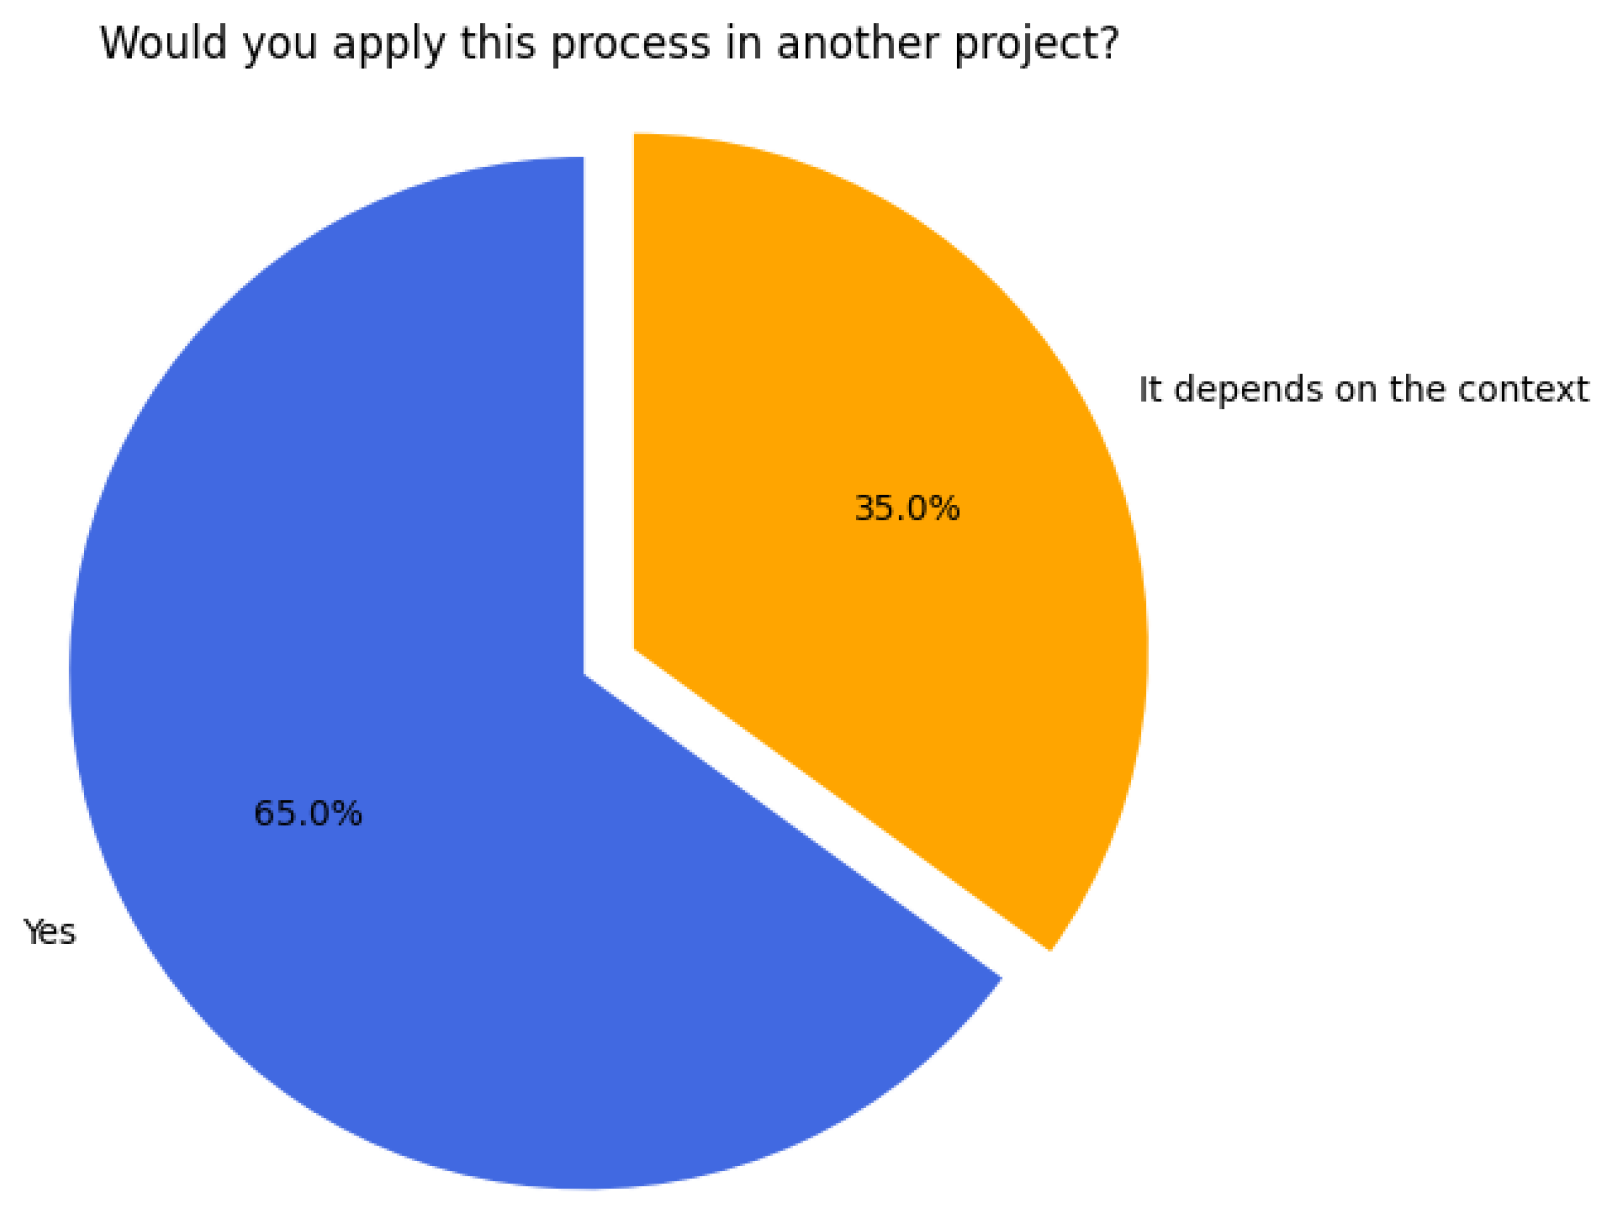
Figure 31 shows that 65 percent of the students expressed willingness to apply this process in future projects, while 35 percent said they would do so only if the context allows. None of the participants expressed a complete refusal to reuse the method, which reinforces its value as a flexible and adaptable tool for data analysis in different settings.
The responses to the open-ended question on suggestions for improving the process provided valuable input. Among the most frequent recommendations were the need for more time to complete the activities, a request to reduce the workload in some phases such as data preparation, and the importance of having clearer examples and guides for interpreting network analysis metrics. Students also suggested including a general presentation of the method at the beginning and improving organization through team work templates. Although some students mentioned having no suggestions or said that everything was fine, the feedback received helps identify specific areas for improvement in future implementations.
The perception results confirm that the integrated method is not only technically coherent but also pedagogically effective. The clarity with which students identified each phase, together with the recognition of its usefulness in organizing and analyzing projects, validates the transparency and structure of the proposal. At the same time, the reported difficulties point to areas that require refinement, such as providing more examples and allocating sufficient time for complex stages like modeling and evaluation. The high percentage of students who acknowledged learning something new and expressed willingness to apply the method again demonstrates its educational value and potential for replication. Overall, the feedback highlights that CRISP-NET fosters both comprehension and practical engagement, making it a relevant framework for training in data analysis and network-based approaches.

5. Conclusions

Properly defining a methodological process for data analysis is essential to achieve meaningful results, especially when aiming to integrate structured models such as CRISP-DM with analytical approaches like network analysis. This integration provides a clear guide of activities and outputs for each phase, broadens the understanding of relationships between variables, and enables a deeper reading of the context, facilitating the identification of complex patterns and the design of more informed solutions.
The application of this process with a working group made it possible to test each component of the method, validate the sequence of activities, and generate concrete evidence of its functionality. The active participation of the group and their input were key to formalizing this methodological integration, as they provided valuable observations regarding the clarity of the phases, the usefulness of the outputs generated, and the necessary improvements to optimize the process. The use of templates, the digital repository, and the checklist made it possible to document each step with order and accuracy, ensuring traceability and continuous monitoring.
The development of the process showed that, despite challenges related to workload, the need for more specific examples, or limited time, it is possible to successfully carry out a combined strategy that integrates structured analysis with a relational approach. The activities were progressively understood and applied, which facilitated the development of outputs aligned with the analysis objectives and supported a better interpretation of the results.
Despite the successful application of the integrated method, several limitations were identified. Time constraints reduced the possibility of completing some activities with greater depth, particularly during the modeling and evaluation phases. Students also reported the need for clearer examples to better understand the use and interpretation of network metrics. In addition, the workload during the data preparation phase was perceived as excessive, which in some cases slowed down progress and affected the balance across stages.
Future implementations of CRISP-NET could address these limitations by scaling the methodology to larger datasets from different domains, such as finance, education, or social networks, to test its generalizability. Another line of improvement is the automation of some steps, particularly in data preparation and network construction, through specialized software tools. Furthermore, incorporating dynamic network metrics would extend the analytical scope, allowing for the evaluation of temporal and evolving structures within the data.
This first exercise lays the groundwork for consolidating a methodology adaptable to different professional environments, allowing not only the organization of data analysis projects but also enhancing the exploration of relationships between variables. Based on this experience, areas for improvement were identified and will be prioritized in future implementations, such as simplifying documents, refining templates, and improving visual schemes. These adjustments will strengthen the methodological proposal and enable its efficient use in technical, operational, and strategic contexts.

Author Contributions

Conceptualization, H.A.A.-C. and E.A.-T.; methodology, H.A.A.-C., E.A.-T. and J.E.H.-R.; software, H.A.A.-C.; validation, H.A.A.-C.; formal analysis, H.A.A.-C.; investigation, H.A.A.-C., J.E.H.-R. and M.A.Z.-S.; resources, H.A.A.-C.; data curation, H.A.A.-C.; writing—original draft preparation, H.A.A.-C., E.A.-T., R.E. and Ó.O.O.-O.; writing—review and editing, H.A.A.-C., E.A.-T., R.E. and Ó.O.O.-O.; visualization, H.A.A.-C.; supervision, H.A.A.-C., E.A.-T., R.E. and Ó.O.O.-O.; project administration, H.A.A.-C. and J.E.H.-R.; funding acquisition, H.A.A.-C. All authors have read and agreed to the published version of the manuscript.

Funding

This research received no external funding.

Institutional Review Board Statement

Not applicable.

Informed Consent Statement

Not applicable.

Data Availability Statement

The data presented in this study are available upon request from the corresponding author.

Acknowledgments

The authors thank Dalhousie University for hosting the research design stage, and UPIIZ–IPN, UAZ, ITZ, and UTZAC for allowing the application of surveys. The authors have reviewed and edited the output and take full responsibility for the content of this publication.

Conflicts of Interest

The authors declare no conflicts of interest.

References

  1. IBM. Conceptos básicos de Ayuda de CRISP-DM. 2021. Available online: https://www.ibm.com/docs/es/spss-modeler/saas?topic=dm-crisp-help-overview (accessed on 16 April 2025).
  2. Espinosa-Zuñiga, J.J. Aplicación de metodología CRISP-DM para segmentación geográfica de una base de datos pública. Ing. Investig. Tecnol. 2020, 21, 1–17. [Google Scholar] [CrossRef]
  3. Malik, M.; Sharma, R.; Singh, A.; Kumar, V. Advancing educational data mining for enhanced student outcomes. Sci. Rep. 2025, 15, 11245. [Google Scholar] [CrossRef]
  4. Staneviciene, E.; Gudoniene, D.; Punys, V.; Kukstys, A. A Case Study on the Data Mining-Based Prediction of Students’ Performance for Effective and Sustainable E-Learning. Sustainability 2024, 16, 10442. [Google Scholar] [CrossRef]
  5. Kuz, A.; Falco, M.; Giandini, R. Análisis de redes sociales: Un caso práctico. Comput. Sist. 2016, 20, 89–106. [Google Scholar] [CrossRef]
  6. Cárdenas, J. El análisis de redes: Qué es, orígenes, crecimiento y futuro. Pensando Psicol. 2016, 12, 5–10. [Google Scholar] [CrossRef]
  7. Paradowski, M.B.; Czopek, K.; Jonak, L.; Turek, D. Peer interaction dynamics and L2 learning trajectories during study abroad: A longitudinal investigation using dynamic computational social network analysis. Lang. Learn. 2024, 74, 12681. [Google Scholar] [CrossRef]
  8. Saqr, M.; Viberg, O.; Nouri, J. Transition Network Analysis (TNA): A Novel Framework for Modeling Learning as a Stochastic Process in Networked Environments. arXiv 2025, arXiv:2411.15486. [Google Scholar]
  9. Henderson-Sellers, B.; Ralyté, J.; Ågerfalk, P.J.; Rossi, M. Situational Method Engineering; Springer: Berlin/Heidelberg, Germany, 2014. [Google Scholar] [CrossRef]
  10. IEEE Xplore. Resultados de Búsqueda Para “CRISP DM”. 2025. Available online: https://ieeexplore.ieee.org/search/searchresult.jsp?newsearch=true&queryText=crisp%20dm (accessed on 12 February 2025).
  11. Elsevier. Scopus: Análisis de Términos—CRISP-DM. 2025. Available online: https://www.scopus.com/term/analyzer.uri?sort=plf-f&src=s&sid=f4510fb76e9f31fe108ecbcc80defeb8&sot=a&sdt=a&sl=23&s=TITLE-ABS-KEY(CRISP-DM)&origin=resultslist&count=10&analyzeResults=Analyze+results (accessed on 16 April 2025).
  12. Flores-Villamil, C.A.; Luna-García, H.; Ramírez-Villegas, M.; Espino-Salinas, C.H.; Mauricio-González, A.; Arceo-Olague, J.G. School Clustering Through Machine Learning and Geospatial Analysis. In Geographical Information Systems. GIS-LATAM 2024; Mata-Rivera, M.F., Zagal-Flores, R., Elisabeth Ballari, D., León-Borges, J.A., Eds.; Communications in Computer and Information Science; Springer: Cham, Switzerland, 2025; Volume 2298. [Google Scholar] [CrossRef]
  13. Dursun, M.; Sabyrzhan, M. CRISP-DM Process in Smart Building Management. In Proceedings of the 2024 11th International Conference on Electrical and Electronics Engineering (ICEEE), Marmaris, Turkey, 22–24 April 2024; pp. 310–315. [Google Scholar] [CrossRef]
  14. Torres, J.; Carpio, D.; Parasi, V. Model to Predict Inventory Demand in Retail SMEs Using CRISP-DM and Machine Learning. In Proceedings of the 2024 IEEE XXXI International Conference on Electronics, Electrical Engineering and Computing (INTERCON), Lima, Peru, 6–8 November 2024; pp. 1–7. [Google Scholar] [CrossRef]
  15. Gill, M.S.; Westermann, T.; Steindl, G.; Gehlhoff, F.; Fay, A. Integrating Ontology Design with the CRISP-DM in the Context of Cyber-Physical Systems Maintenance. In Proceedings of the 2024 IEEE 29th International Conference on Emerging Technologies and Factory Automation (ETFA), Padova, Italy, 10–13 September 2024; pp. 1–8. [Google Scholar] [CrossRef]
  16. Vásquez, J.; Ojeda, P.; Wong, L. Model to Predict Incoming Tech Support Demand in a Banking Company Applying CRISP-DM and Machine Learning. In Proceedings of the 2024 14th International Conference on Cloud Computing, Data Science & Engineering (Confluence), Noida, India, 18–19 January 2024; pp. 768–774. [Google Scholar] [CrossRef]
  17. Acuña-Cid, H.A.; González, A.M.; Solis-Robles, R.; Acuña-Ruiz, A.; Reveles-Gómez, L.C. Análisis predictivo del riesgo de hipertensión en adultos mexicanos basado en indicadores nutricionales y calóricos. Rev. Ingenio 2024, 22, 24–32. [Google Scholar] [CrossRef]
  18. Saltz, J.; Shamshurin, I.; Connors, C. Predicting data science sociotechnical execution challenges by categorizing data science projects. J. Assoc. Inf. Sci. Technol. 2017, 68, 2720–2728. [Google Scholar] [CrossRef]
  19. Quiroz Zamora, J.; Arias Novelo, M.D. Nota de Investigación: Análisis de Redes del Comercio Mundial. 2019. Available online: https://www.monex.com.mx/portal/download/reportes/190808%20Nota%20de%20Investigación.pdf (accessed on 16 April 2025).
  20. Opsahl, T.; Agneessens, F.; Skvoretz, J. Node centrality in weighted networks: Generalizing degree and shortest paths. Soc. Netw. 2010, 32, 245–251. [Google Scholar] [CrossRef]
  21. Kim, M.; Leskovec, J. Modeling Social Networks with Node Attributes using the Multiplicative Attribute Graph Model. arXiv 2011, arXiv:1106.5053. [Google Scholar]
  22. Goyal, P.; Hosseinmardi, H.; Ferrara, E.; Galstyan, A. Capturing Edge Attributes via Network Embedding. arXiv 2018, arXiv:1805.03280. [Google Scholar]
  23. IEEE Xplore. Resultados de Búsqueda para “Social Network Analysis” and “Methodology”. 2025. Available online: https://ieeexplore.ieee.org/search/searchresult.jsp?action=search&newsearch=true&matchBoolean=true&queryText=(%22All%20Metadata%22:%22Social%20Network%20Analysis%22)%20AND%20(%22All%20Metadata%22:Methodology) (accessed on 12 February 2025).
  24. Satopaa, V.; Albrecht, J.; Irwin, D.; Raghavan, B. Finding a “kneedle” in a haystack: Detecting knee points in system behavior. In Proceedings of the 2011 31st International Conference on Distributed Computing Systems Workshops (ICDCSW), Minneapolis, MN, USA, 20–24 June 2011; pp. 166–171. [Google Scholar] [CrossRef]
  25. Rajaraman, A.; Ullman, J.D. Mining of Massive Datasets; Cambridge University Press: Cambridge, UK, 2011. [Google Scholar] [CrossRef]
  26. Kamalzadeh, M.; Haghighat, A.T. Applying the Approach Based on Several Social Network Analysis Metrics to Identify Influential Users of a Brand. In Proceedings of the 2021 Eighth International Conference on Social Network Analysis, Management and Security (SNAMS), Gandia, Spain, 6–9 December 2021; pp. 01–08. [Google Scholar] [CrossRef]
  27. Jiang, C.; Hu, J.; Chen, J.; Ge, X. Research on the Spatial Association Characteristics of Financial Agglomeration in Beijing-Tianjin-Hebei City Cluster Based on Social Network Analysis Method. In Proceedings of the 2022 International Conference on Computer Engineering and Artificial Intelligence (ICCEAI), Shijiazhuang, China, 22–24 July 2022; pp. 353–357. [Google Scholar] [CrossRef]
  28. Qian, L.; Li, W. Research Status and Trends of Panoramic Video in Education: Based on Social Network Analysis and Co-word Analysis Method. In Proceedings of the 2022 10th International Conference on Information and Education Technology (ICIET), Matsue, Japan, 9–11 April 2022; pp. 74–78. [Google Scholar] [CrossRef]
  29. Medina Nogueira, Y.E.; El Assafiri Ojeda, Y.; Nogueira Rivera, D.; Medina León, A.; Medina Nogueira, D. Procedimiento de análisis redes sociales: Herramienta de auditoría de gestión del conocimiento. Ing. Ind. 2020, XLI, e4102. [Google Scholar]
  30. Valente, T.W.; Palinkas, L.A.; Czaja, S.; Chu, K.H.; Brown, C.H. Social network analysis for program implementation. PLoS ONE 2015, 10, e0131712. [Google Scholar] [CrossRef] [PubMed]
  31. Jerneck, A.; Olsson, L. More than the obvious: Exploring social networks and future studies. Eur. J. Futur. Res. 2013, 1, 25. [Google Scholar] [CrossRef]
  32. Tsai, C.H.; Zdravkovic, J.; Söder, F. A method for digital business ecosystem design: Situational method engineering in an action research project. Softw. Syst. Model. 2023, 22, 573–598. [Google Scholar] [CrossRef]
  33. Harmsen, F. Situational Method Engineering. Ph.D. Thesis, University of Twente, Enschede, The Netherlands, 1997. Available online: https://research.utwente.nl/en/publications/situational-method-engineering (accessed on 16 April 2025).
  34. Brinkkemper, S.; Saeki, M.; Harmsen, F. Meta-modelling based assembly techniques for situational method engineering. Inf. Syst. 1999, 24, 209–228. [Google Scholar] [CrossRef]
  35. Fahmideh, M.; Sharifi, M.; Jamshidi, P. Enhancing the OPEN Process Framework with Service-Oriented Method Fragments. arXiv 2020, arXiv:2004.10136. [Google Scholar]
  36. Ralyté, J.; Deneckère, R.; Rolland, C. Towards a generic model for situational method engineering. In Advanced Information Systems Engineering; Springer: Berlin/Heidelberg, Germany, 2003; pp. 95–110. [Google Scholar] [CrossRef]
  37. Mirbel, I.; Ralyte, J. Situational method engineering: Combining assembly-based and roadmap-driven approaches. Requir. Eng. 2006, 11, 58–78. [Google Scholar] [CrossRef]
  38. Ogbuachi, M.C.; Podder, I.; Bub, U.; Huseynli, M. A framework for quantifiable process improvement through method fragments in situational method engineering. In Proceedings of the 3rd International Conference on Advanced Information Science and System (AISS ’21), Sanya, China, 26–28 November 2022; pp. 1–7. [Google Scholar] [CrossRef]
  39. Shapour, S.; Kamandi, A. An aspect-oriented methodology for e-readiness assessment. In Proceedings of the 2021 5th National Conference on Advances in Enterprise Architecture (NCAEA), Mashhad, Iran, 1–2 December 2021; pp. 29–34. [Google Scholar] [CrossRef]
  40. Nuar, A.N.A.; Rozan, M.Z.A.; Bahari, M. Computational Thinking Work System Method: A problem-solving method for small and medium enterprises. In Proceedings of the 2021 International Congress of Advanced Technology and Engineering (ICOTEN), Taiz, Yemen, 4–5 July 2021; pp. 1–8. [Google Scholar] [CrossRef]
  41. Franch, X.; Henriksson, A.; Ralyté, J.; Zdravkovic, J. Data-driven agile requirements elicitation through the lenses of Situational Method Engineering. In Proceedings of the 2021 IEEE 29th International Requirements Engineering Conference (RE), Notre Dame, IN, USA, 20–24 September 2021; pp. 402–407. [Google Scholar] [CrossRef]
  42. Dehghani, R.; Ramsin, R. Software Process Improvement by Managing Situational Method Engineering Knowledge. J. Univers. Comput. Sci. 2024, 30, 645–673. [Google Scholar] [CrossRef]
  43. Yustin, A.; Widyani, Y.; Rusmawati, Y. Scrum modification for small-scale web application. In Proceedings of the 2021 International Conference on Data and Software Engineering (ICoDSE), Bandung, Indonesia, 3–4 November 2021; pp. 1–6. [Google Scholar] [CrossRef]
  44. Guba, E.G.; Lincoln, Y.S. Fourth Generation Evaluation; Sage Publications: Thousand Oaks, CA, USA, 1989. [Google Scholar]
  45. Comisión Económica para América Latina y el Caribe (CEPAL). El Enfoque del Marco Lógico: 10 Casos Prácticos. 2005. Available online: https://repositorio.cepal.org/bitstream/handle/11362/5607/S057518_es.pdf (accessed on 16 April 2025).
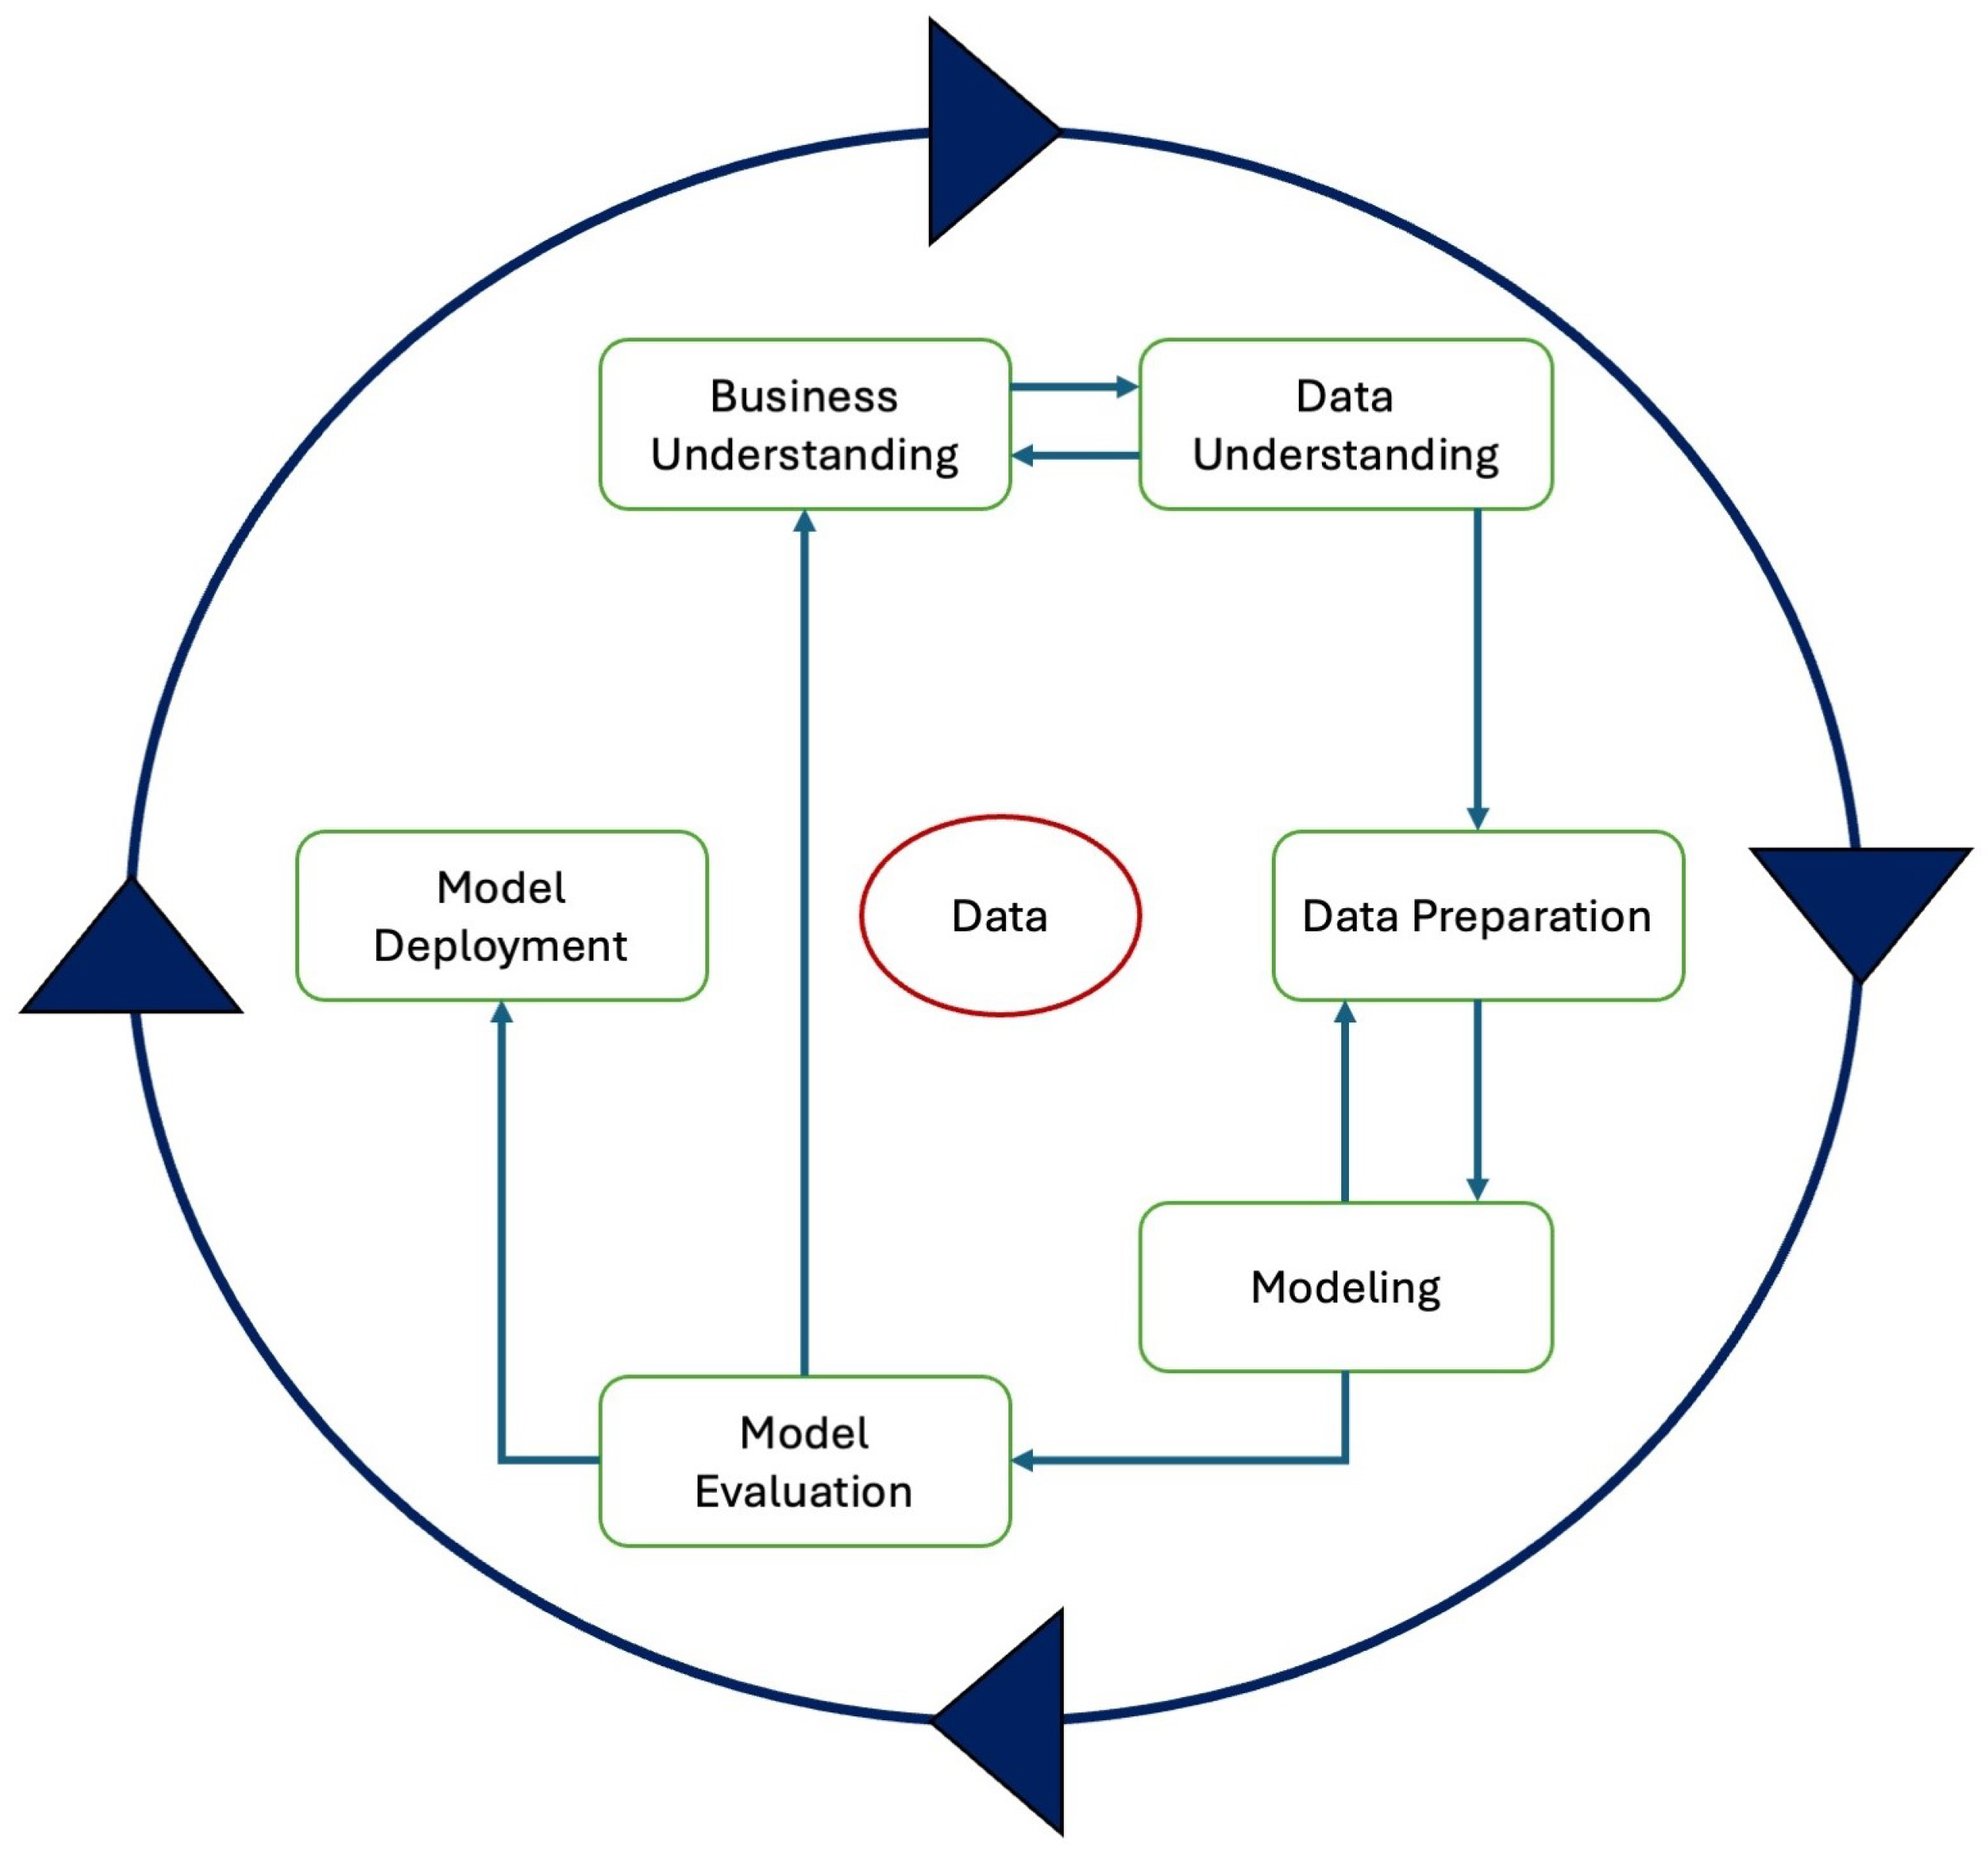
Figure 1. CRISP-DM process diagram [1].
Make 07 00101 g001
Figure 2. IEEE Xplore results [10].
Make 07 00101 g002
Figure 3. SCOPUS results [11].
Make 07 00101 g003
Figure 4. Distribution of articles by keyword cluster [23].
Make 07 00101 g004
Figure 5. Most frequent keywords per cluster.
Make 07 00101 g005
Figure 6. Methodological diagram for the integration of CRISP-DM and network analysis through SME.
Make 07 00101 g006
Figure 7. Process diagram for the context analysis phase.
Make 07 00101 g007
Figure 8. Process diagram for the selection of methodological components.
Make 07 00101 g008
Figure 9. Process diagram for the Component Adaptation phase.
Make 07 00101 g009
Figure 10. Execution of the Method Assembly phase and generated outputs.
Make 07 00101 g010
Figure 11. Methodological assembly diagram: integration of network analysis activities into the CRISP-DM model.
Make 07 00101 g011
Figure 12. Activity flow for the method evaluation phase.
Make 07 00101 g012
Figure 13. Diagnostic survey interface for the evaluation of the integrated CRISP-DM and network analysis method.
Make 07 00101 g013
Figure 14. Distribution of respondents who have taken courses related to data analysis or artificial intelligence.
Make 07 00101 g014
Figure 15. Self-reported familiarity with the CRISP-DM model.
Make 07 00101 g015
Figure 16. Familiarity with the concept of network analysis.
Make 07 00101 g016
Figure 17. Areas of interest for learning or improvement in data analysis activities.
Make 07 00101 g017
Figure 18. Perceived obstacles to performing in a structured data analysis activity.
Make 07 00101 g018
Figure 19. Interest in learning a step-by-step data analysis methodology.
Make 07 00101 g019
Figure 20. Interest in learning tools for network or graph-based analysis.
Make 07 00101 g020
Figure 21. Example of a structured repository organized by team and phase for storing process documentation and analytical outputs.
Make 07 00101 g021
Figure 23. Perceived clarity of the proposed method’s structure.
Make 07 00101 g023
Figure 24. Ease of identifying each phase of the integrated process.
Make 07 00101 g024
Figure 25. Perceived usefulness of the method for project organization and analysis.
Make 07 00101 g025
Figure 26. Perceived added value of integrating network analysis into the process.
Make 07 00101 g026
Figure 27. Most useful phases of the integrated process according to participants.
Make 07 00101 g027
Figure 28. Phases of the method where participants experienced the most difficulty.
Make 07 00101 g028
Figure 29. Main difficulties faced by participants during the method’s application.
Make 07 00101 g029
Figure 30. Participants’ perception of learning something new from the method.
Make 07 00101 g030
Figure 31. Willingness to apply the integrated process in future projects.
Make 07 00101 g031
Table 1. Phases and descriptions of the CRISP-DM model [1].
PhaseDescription
Business UnderstandingInvolves understanding the problem or business to be solved, as well as identifying the project’s requirements, assumptions, constraints, and benefits.
Data UnderstandingRelevant data is collected and explored to become familiar with its content, quality, and structure.
Data PreparationNecessary activities are carried out to prepare the data for modeling, which may include cleaning, transformation, and selection of data.
ModelingIn this stage, appropriate modeling techniques are selected and applied to the prepared data, adjusting parameters as needed.
Model EvaluationThe created model is evaluated to ensure it meets the business objectives, and results are reviewed to determine if adjustments are needed.
Model DeploymentThe model is implemented in a real environment, using the acquired knowledge to make decisions or take concrete actions.
Table 2. Elements and descriptions of a network.
ElementDescription
NodesThese are individual points within the network that represent the elements that comprise it [19].
LinksRepresent the connections between nodes within the network [19].
Network StructuresRefers to the set of nodes and links and the way they are organized within the network [19].
DirectionalitySome network links have a direction, which indicates the flow of elements; it also shows where elements originate and where they go [19].
WeightingRefers to the value assigned to each link, indicating the intensity, frequency, or strength of the relationship between nodes [20].
Nodes with AttributesThese are nodes that contain additional information, such as category, age, or role, allowing for a more detailed analysis of their function in the network [21].
Links with AttributesThese are relationships between nodes that include specific characteristics, such as type of connection, context, or duration, enriching the analysis of interactions [22].
Sub-networksThese are groups of interconnected nodes within a larger network that share particular characteristics or relationships [19].
Table 3. Procedure for network analysis in knowledge management auditing.
PhaseStageDescription
Analysis PreparationKnowledge Domain DelimitationThe area, process, or unit where the analysis will be applied is defined.
Interview DesignThe data to be collected is established: functions, tasks, relationships, and communication channels of the actors.
Procedure DesignTools, steps, and resources required to carry out the analysis are planned.
Actor IdentificationInitial IdentificationKey actors are identified through interviews and documents.
Network GrowthThe network is expanded through references provided by identified actors, until saturation is reached.
Social Network AnalysisStructural AnalysisThe adjacency matrix is built according to the intensity of relationships, and the sociogram is generated.
Quantitative AnalysisMetrics such as degree centrality, betweenness, and closeness are interpreted, along with the identification of clusters and key nodes.
Table 4. Stages of Situational Method Engineering (SME).
SME StageDescription
Context AnalysisThe specific characteristics of the environment or project in which the method will be applied are identified. This includes the type of problem to solve, objectives, constraints, available resources, and organizational context [32,33].
Selection of Method ComponentsLibraries of existing method fragments or components are consulted. These fragments may include activities, models, techniques, or guidelines that match the requirements identified in the previous stage [34,35].
Component AdaptationThe selected components are adjusted to better suit the project’s conditions. This stage may involve modifying their sequence, structure, terminology, or level of detail [33,36].
Method AssemblyThe adapted components are integrated to form a cohesive method. This method must be consistent, complete, and applicable to the specific situation, ensuring continuity and coherence between components [35,37].
Method EvaluationThe assembled method is applied and its results evaluated in a real context. Based on this feedback, components are adjusted or improvements documented for future use [9,32].
Table 5. Comparative summary of studies using Situational Method Engineering (SME).
ArticlePurpose of SME UseIntegrated Methods or ModelsMethodological ProductAdvantagesLimitations
Enhancing the OPEN Process Framework with Service-Oriented Method Fragments [35]Customization of SOSD processes through reusable method fragmentsOPEN Process Framework with service-oriented SDMsSet of reusable method fragments incorporated into OPFEnhances process customization for SOSD, supports reuse, and aligns with a recognized standardLimited empirical validation, focused on a specific domain (SOSD)
A Framework for Quantifiable Process Improvement through Method Fragments in Situational Method Engineering [38]Improve processes through quantifiable method fragments, optimized by network diagrams and linear programmingSME, BPM, CPM, LPFramework with RFDs and ARFDs, plus a process scheme (PS) for quantifiable improvementVisualization, evaluation, and prior optimization of processes, integration of metricsHigh technical complexity, requires knowledge in LP and process theory
An aspect-oriented methodology for e-readiness assessment [39]Design a customized assessment methodology according to each organization’s specific requirementsSME, e-readiness assessment modelsE-readiness assessment model adaptable to organizational aspectsAllows reuse of existing components and model adaptation to specific contextsNo empirical validation or implementation results reported
Computational Thinking Work System Method: A problem-solving method for small and medium enterprises [40]Design a method to help SMEs structure and solve problems using computational thinkingComputational Thinking (CT), Work System Method (WSM)Methodological artifact composed of six activities structured in a manualFacilitates problem self-exploration and improves operational efficiency in SMEsRequires additional confirmatory validation; focused on a specific sector
Data-Driven Agile Requirements Elicitation through the Lenses of Situational Method Engineering [41]Design an adaptable method for requirements elicitation from digital sources, complementing traditional agile approachesSME, DDRE, Agile REModular process composed of intentions, strategies, and method chunks adapted to specific contextsEnables the construction of data-driven elicitation methods tailored to the situation, combining heterogeneous sources with contextual criteriaLacks full empirical evaluation; requires technical expertise for modeling and applying the approach
Software Process Improvement by Managing Situational Method Engineering Knowledge [42]Evaluate and improve existing SME methods through knowledge management criteria and knowledge flowsSME, KM, CMMIEvaluation framework and improvement model based on KM applied to 8 methods and 4 case studiesEnhances SME methods’ capacity to capture, reuse, and share critical knowledge, alignment with continuous improvement practicesRequires high implementation effort; validated in limited contexts (Iranian companies only)
A method for digital business ecosystem design: situational method engineering in an action research project [32]Develop a modular and adaptable methodology to design DBEs from a holistic perspective based on empirical requirementsSME, DBE, Map ApproachMethod composed of 11 modular design maps for building adaptive DBEsFlexible, goal-oriented module, adaptable to dynamic scenarios, tested in a real context (Digital Vaccine)Complexity in implementation, requires technical knowledge in Map-based and SME design
Scrum Modification for Small-scale Web Application [43]Adapt Scrum to small-scale contexts using SME and Essence, creating a simplified version suited for small teamsSME, Scrum, EssenceMiniScrum, a reduced method with new activities and essential products for limited environmentsFacilitates agile development with less documentation load and roles tailored to single-person or small projectsRequires experience in contextualization with Essence; limited generalization beyond small projects
Table 6. Activities and outputs for the integration of CRISP-DM and network analysis through SME.
SME PhaseIntegration of the Models (CRISP-DM and Network Analysis)Generated OutputsMethodological Purpose of the Phase
Context AnalysisAnalyze the compatibility between the CRISP-DM model and network analysis to determine their complementarity.Context analysis and justification for the integration.Justify the feasibility of the methodological integration.
Selection of Methodological ComponentsIdentify key activities from network analysis (such as the construction of adjacency matrices and the use of centrality metrics) that can be incorporated into specific CRISP-DM phases, especially data preparation and modeling.Mapping table between CRISP-DM phases and network activities.Determine which specific components will be useful.
Component AdaptationAdjust the selected network analysis activities to the CRISP-DM workflow, defining integration criteria based on the type of data, nodes, and links involved.Task adaptation scheme and adjustment criteria.Ensure that network analysis tasks structurally fit.
Method AssemblyIntegrate the adapted activities into the overall CRISP-DM sequence, maintaining its structural logic and ensuring a smooth transition between phases.Methodological flow diagram and narrative synthesis of the proposal.Consolidate a coherent and applicable sequence.
Method EvaluationEstablish criteria to review the internal consistency of the method and define guidelines for its future evaluation in real-world contexts.Methodological reflection and future evaluation proposal.Validate the design and prepare it for real-world use.
Table 7. Methodological design sheet, context analysis.
Phase: Context Analysis
Purpose:To identify whether it is possible to integrate the CRISP-DM model with network analysis from a methodological perspective, considering their structure, workflow logic, and data types.
Actors Involved:Method designer.
Management Artifacts:Document review, comparative table between models, and a list of criteria to assess their compatibility.
Analytical Artifacts:Convergence and divergence matrix built from the above criteria and interpretative notes on points of connection.
Generated Output:Narrative document justifying the methodological integration, used as the foundation for the following phases of the process.
Table 8. Compatibility matrix between CRISP-DM and network analysis.
CriterionCRISP-DMNetwork AnalysisCompatibility AssessmentObservation
PurposeGuide data analysis and mining projects through a structured sequence of phases.Analyze relationships between entities (nodes) to identify structures, influences, or behaviors within complex systems.CompatibleBoth models pursue different analytical goals but can be applied within the same project.
StructureComposed of six sequential phases: business understanding, data understanding, data preparation, modeling, evaluation, and deployment. Can be iterative.Based on nodes, links, and network metrics such as centrality, density, and modularity; allows for directed and weighted structures.Complementary with adjustmentsThe sequential structure of CRISP-DM can be complemented by the relational logic of network analysis if a connection stage is defined.
Type of DataStructured data from organized records such as databases, spreadsheets, or time series.Relational data describing interactions between nodes: people, institutions, symptoms, etc.CompatibleCRISP-DM uses tabular data, and network analysis uses relational data; they can be integrated with a conversion phase.
Questions AddressedWhat patterns exist in the data? What models are most suitable for predicting or classifying behaviors?What connections exist between elements? Which nodes are the most influential or central? How are relationships organized?ComplementaryThe questions each model addresses are different but mutually enriching in a combined analysis.
Generated OutputsPredictive models, evaluation reports, recommendations for solution implementation, visualizations of results.Graphs, sociograms, centrality metrics, relationship clusters, structural visualizations.ComplementaryBoth models generate different but useful outputs for different stages of analysis.
Table 9. Methodological design sheet, selection of methodological components.
Phase: Selection of Methodological Components
Purpose:To determine which network analysis activities can be incorporated into the CRISP-DM model, based on their methodological usefulness and compatibility with the process phases.
Actors Involved:Method designer and process analyst.
Management Artifacts:Structured review of CRISP-DM phases and network analysis techniques.
Analytical Artifacts:Correspondence table between CRISP-DM phases and applicable network analysis tasks.
Generated Output:Technical scheme identifying key network analysis components selected for integration into specific stages of CRISP-DM.
Table 10. Correspondence between CRISP-DM phases and network analysis activities.
CRISP-DM PhasesNetwork Analysis Activities
Business Understanding:Define whether the problem involves relationships between entities (nodes and links).
Data Understanding:Explore whether the data contain relational attributes; identify nodes and possible connections.
Data Preparation:Build an adjacency matrix; define attributes of nodes and links.
Modeling:Apply centrality metrics; generate sociograms.
Model Evaluation:Interpret metrics and validate detected relational patterns.
Deployment:Use network analysis results to support decision-making or visualize key interactions.
Table 11. Methodological design sheet, component adaptation.
Phase: Component Adaptation
Purpose:Technically adjust the previously identified network analysis activities to incorporate them functionally into the phases of the CRISP-DM model.
Actors Involved:Method designer, data analyst, and network analysis specialist.
Management Artifacts:Initial correspondence table, adaptation criteria, and record of methodological decisions.
Analytical Artifacts:Explanatory diagrams of the sequential incorporation of activities, detailed technical notes on the definition and integration of nodes, links, attributes, and metrics in each CRISP-DM phase.
Generated Output:Adapted integration proposal with specific network analysis components assigned to each phase of the model.
Table 12. Adapted network analysis tasks per CRISP-DM phase and adaptation criteria.
CRISP-DM PhaseSelected Network Analysis TaskAdaptation Criteria
Business UnderstandingDefine relationships between nodes and linksIncorporated to anticipate whether the phenomenon under study includes interconnected entities, allowing a relational structure to be considered from the beginning.
Data UnderstandingIdentify connections and attribute nodesAdded to explore attributes with relational potential, facilitating the transition from tabular data to network structures later in the process.
Data PreparationDefine attributes of nodes and linksThis activity prepares the data in a format compatible with networks, converting records into relational elements that can later be represented as graphs.
ModelingIdentify key nodes and represent the networkProposed to graphically represent detected relationships and apply metrics such as centrality, which help identify relevant patterns for the model.
Model EvaluationAnalyze and interpret metrics to validate relational patternsIncorporated to verify whether the detected structures (such as central nodes or communities) align with the analysis objectives and provide actionable insights.
Table 13. Methodological design sheet, method assembly.
Phase: Method Assembly
Purpose:To operationally integrate the adapted network analysis tasks into the CRISP-DM model workflow.
Actors Involved:Method designer, data analyst, and network analysis specialist.
Management Artifacts:Integrated diagram of the methodological flow, technical integration notes.
Analytical Artifacts:Final table and diagram of integrated and sequenced activities within CRISP-DM.
Generated Output:Integrated CRISP-DM method enriched with network analysis activities.
Table 14. Integration plan: CRISP-DM and network analysis activities.
CRISP-DM StagesCRISP-DM Model ActivitiesNetwork Analysis ActivitiesIntegrated Process ActivitiesIntegrated Process StagesIntegrated Process Outputs
Problem understandingBusiness objectives
Assess the current situation
Data mining objectives
Project plan
Define whether the problem involves relationships between entities (nodes and links)Business objectives
Assess the current situation
Data mining objectives
Relationship between entity
Project plan
Problem understandingDefinition of objectives, requirements, criteria, project plan, and node relationshipsIteration
Data understandingData collection
Data description
Data exploration
Data quality management
Explore whether the data contain relational attributes; identify nodes and possible connectionsData collection
Data description
Data exploration
Attribute relationships
Data quality management
Data understandingData sources, attributes, properties, issues, and connections between nodesIteration
Data preparationData selection
Data cleaning
Data construction
Data integration
Data formatting
Adjacency matrix construction; defining node and edge attributesData selection
Data cleaning
Data construction
Data integration
Define node and edge attributes
Data formatting
Data preparationData selection, quality control, transformation, integration, model fitting, and connection matrixIteration
ModelingModeling technique selection
Strategy for model quality verification
Model building
Model adjustment
Application of centrality metrics; generation of sociogramsModeling technique selection
Strategy for model quality verification
Model building
Identification of key nodes and network representation
Model adjustments
ModelingModel selection and prerequisites, training and testing, parameter tuning, final evaluation, and sociogram analysisIteration
Modeling evaluationModeling technique selection
Process review
Next steps
Interpretation of metrics and validation of detected relational patternsModeling technique selection
Process review
Validation of relational patterns
Next steps
Modeling evaluationResults verification, error detection, relational validation, and decision evaluationIteration
DeploymentProduction deployment plan
Monitoring and maintenance
Final report
Project review
Use of network analysis results to support decision-making or visualize key interactionsProduction deployment plan
Monitoring and maintenance
Final report
Project review
DeploymentDeployment strategies, monitoring, lessons learned, and conclusionsIteration
Table 15. Deliverables of the integrated proposed process.
OutputsPhase
  • Business and data mining objectives document
  • Requirements gathering meeting minutes
  • Specification of measurement criteria
  • Project plan with tools and techniques
  • Initial definition of nodes and links (preliminary relational structure)
Understanding the problem
  • Record of data sources (databases, CSV files, surveys)
  • Report on data attributes and properties
  • Identification of issues and proposed solutions
  • Mapping of connections between attributes and relational nodes
Data understanding
  • Criteria for data selection and exclusion
  • Record of actions to ensure data quality
  • Log of applied transformations
  • Integrated and validated dataset
  • Adjustments applied according to model requirements
  • Node–link connection matrix with defined attributes
Data preparation
  • Document of model selection and its prerequisites
  • Record of training, testing, and initial results
  • Report on parameter tuning and final model execution
  • Technical evaluation of the adjusted model
  • Customized sociograms and report on centrality metrics
Modeling
  • Report on results verification and model approval
  • Record of identified errors, alternatives, and improvements
  • Validation of relational structures against analysis objectives
  • Evaluation report of decisions made and justification of iterations
Model evaluation
  • Model deployment and implementation plan
  • Monitoring and maintenance strategy
  • Record of lessons learned and process experiences
  • Final report with conclusions and recommendations
Deployment
Table 16. Methodological design sheet, method evaluation.
Phase: Method Evaluation
Purpose:To validate the integrated CRISP-DM and Network Analysis process through its practical application in a real academic context.
Actors Involved:Computer Engineering students, facilitating instructor, method designer.
Management Artifacts:Diagnostic survey, process application rubric, exit survey.
Analytical Artifacts:Comparative results between teams, perception analysis, process observations.
Generated Output:Contextual evaluation report of the method with improvement suggestions.
Table 17. Distribution of surveyed students by institution.
InstitutionSurveyed Students
UPIIZ–IPN (Unidad Profesional Interdisciplinaria de Ingeniería Campus Zacatecas)35 (34.7%)
UAZ (Universidad Autónoma de Zacatecas)39 (38.6%)
UTZAC (Universidad Tecnológica del Estado de Zacatecas)13 (12.9%)
ITZ (Instituto Tecnológico de Zacatecas)14 (13.9%)
Disclaimer/Publisher’s Note: The statements, opinions and data contained in all publications are solely those of the individual author(s) and contributor(s) and not of MDPI and/or the editor(s). MDPI and/or the editor(s) disclaim responsibility for any injury to people or property resulting from any ideas, methods, instructions or products referred to in the content.