4.1. Data Preprocessing, Extraction of New Features and Simulations
Preprocessing includes data cleaning, transformation, normalization, and the selection of new features. The dataset used in this study for algorithm training was compiled from IEC TC10 [
25], IEEE Dataport [
26], CPFL–Companhia Paulista de Força e Luz [
27], and published studies [
28,
29]. It comprised a total of 2298 samples, including 2049 normal samples, 63 thermal faults at
C, 47 thermal faults at
C, 70 partial discharges and low-intensity discharges (PDLI), and 69 high-intensity discharges (HID), across five types of combustible gases (H
2, CH
4, C
2H
2, C
2H
4, and C
2H
6). CO and CO
2 gases were excluded from this analysis because some of the data sources did not report their concentrations. The transformer data and inspection reports analyzed were provided by a Brazilian electricity company.
Real-world data may be incomplete, inconsistent, and subject to errors or outliers; therefore, data cleaning is an essential step [
30]. In this study, the impact of outliers on the performance of 1NN and OPF algorithms was minimized through dataset cleaning, specifically by removing samples that contributed to classification errors. The cleaning process was carried out using a normal probability distribution, with the 95th percentile calculated from the normal samples included in the dataset composition.
Table A2 presents the concentration values of the normal distribution in
L/L, calculated for the 66th, 95th and 97.5th percentiles, based on the analysis of 2049 normal samples. According to IEEE Standard C57.104 [
2], normal gas values are defined between the 90th and 95th percentiles. Thus, by applying the gas limit values from the 95th percentile (
Table A1) to the transformer fault data, approximately 19 samples that could have been incorrectly classified as normal were eliminated. After data cleaning, the updated dataset consisted of 1818 normal samples, 44 thermal faults with
C, 47 thermal faults with
C, 70 PDLI cases, and 69 HID cases (see
Appendix A for detailed results).
Table A3 presents the accuracy values of KNN and OPF obtained before (2298 samples) and after (2048 samples) dataset cleaning, under the following conditions: 5 gas types, 5 labels (classes), 100 simulations each, normalized data (mean and standard deviation), and 5-fold cross-validation. In [
31], the accuracy of KNN and OPF was evaluated on several artificial and real datasets unrelated to DGA, where the 1NN configuration showed slightly better performance than OPF. This finding is consistent with the results in
Table A3 for the gas dataset analyzed, where KNN with
achieved higher accuracy than OPF across different label types (see
Appendix A for detailed results).
In the data transformation stage, following the approach proposed in [
9], 10 additional features were derived from the 5 combustible gases by employing their total relative values and gas ratios commonly used in classical methods: H
2, CH
4, C
2H
2, C
2H
4, C
2H
6, C
2H
2/CH
4, C
2H
2/C
2H
4, CH
4/H
2, C
2H
4/C
2H
6, C
2H
6/CH
4, H
2/Tg, CH
4/Tg, C
2H
2/Tg, C
2H
4/Tg, and C
2H
6/Tg, where Tg = H
2 + CH
4 + C
2H
2 + C
2H
4 + C
2H
6. Feature selection for training and testing the proposed methodology was carried out by identifying the best subsets and combinations using the binary algorithms GA and CS, which resulted in improved accuracy. The accuracy of the 1NN algorithm was adopted as the fitness function in the optimization algorithms, since it demonstrated superior performance compared to OPF.
Table A4 presents the parameter adjustments applied to the GA and CS algorithms, along with the results obtained for the preprocessed dataset. The minimum and maximum limits for feature combinations ranged from 6 to 10 gases; however, the most consistent and accurate results in both cases were achieved with 8 gas combinations (see
Appendix A for detailed results).
Table A5 presents simulations using other machine learning algorithms, which apply different classification strategies to assess the risk of overfitting on the data obtained after feature selection. The evaluation was carried out under the condition of 5-fold cross-validation, and accuracy was calculated for unbalanced data using Equation (
1). As observed, most of the algorithms achieved improved accuracy with 8 selected features, thereby ruling out the possibility of overfitting in the case of 1NN (see
Appendix A for detailed results).
Table A6 presents the confusion matrices obtained from the average classification results using the raw dataset and feature selection with the 1NN algorithm, and feature selection alone with the OPF algorithm. In this analysis, accuracy was evaluated under different labeling schemes: 2 labels (normal state and fault), 3 labels (normal state, thermal fault, and electrical fault), and 5 labels as previously described. It was observed that in the preprocessed cases (95th percentile), accuracy improved compared to the raw data. The most significant impact was seen in the data for thermal faults
C and normal states—where cleaning was performed—as well as in the upper range of low-intensity electrical faults. It was also observed that the two-class labeling approach achieved the highest accuracy, followed by the three-class and five-class approaches (see
Appendix A for detailed results).
Therefore, using the validated training dataset with 8 selected DGA features, simulations were conducted on different sets of transformer gas samples collected over defined time intervals as part of the monitoring and predictive maintenance activities carried out by the electricity company.
The results were presented in three graphs: (i) gas concentration in L/L (PPM) and fault trends showing the behavior between normal and fault states; (ii) normal state, electrical fault, and thermal fault; and (iii) normal state along with five specific fault types.
4.2. Experiments Results
4.2.1. Case Study 1—345/88kV @133.33MVA
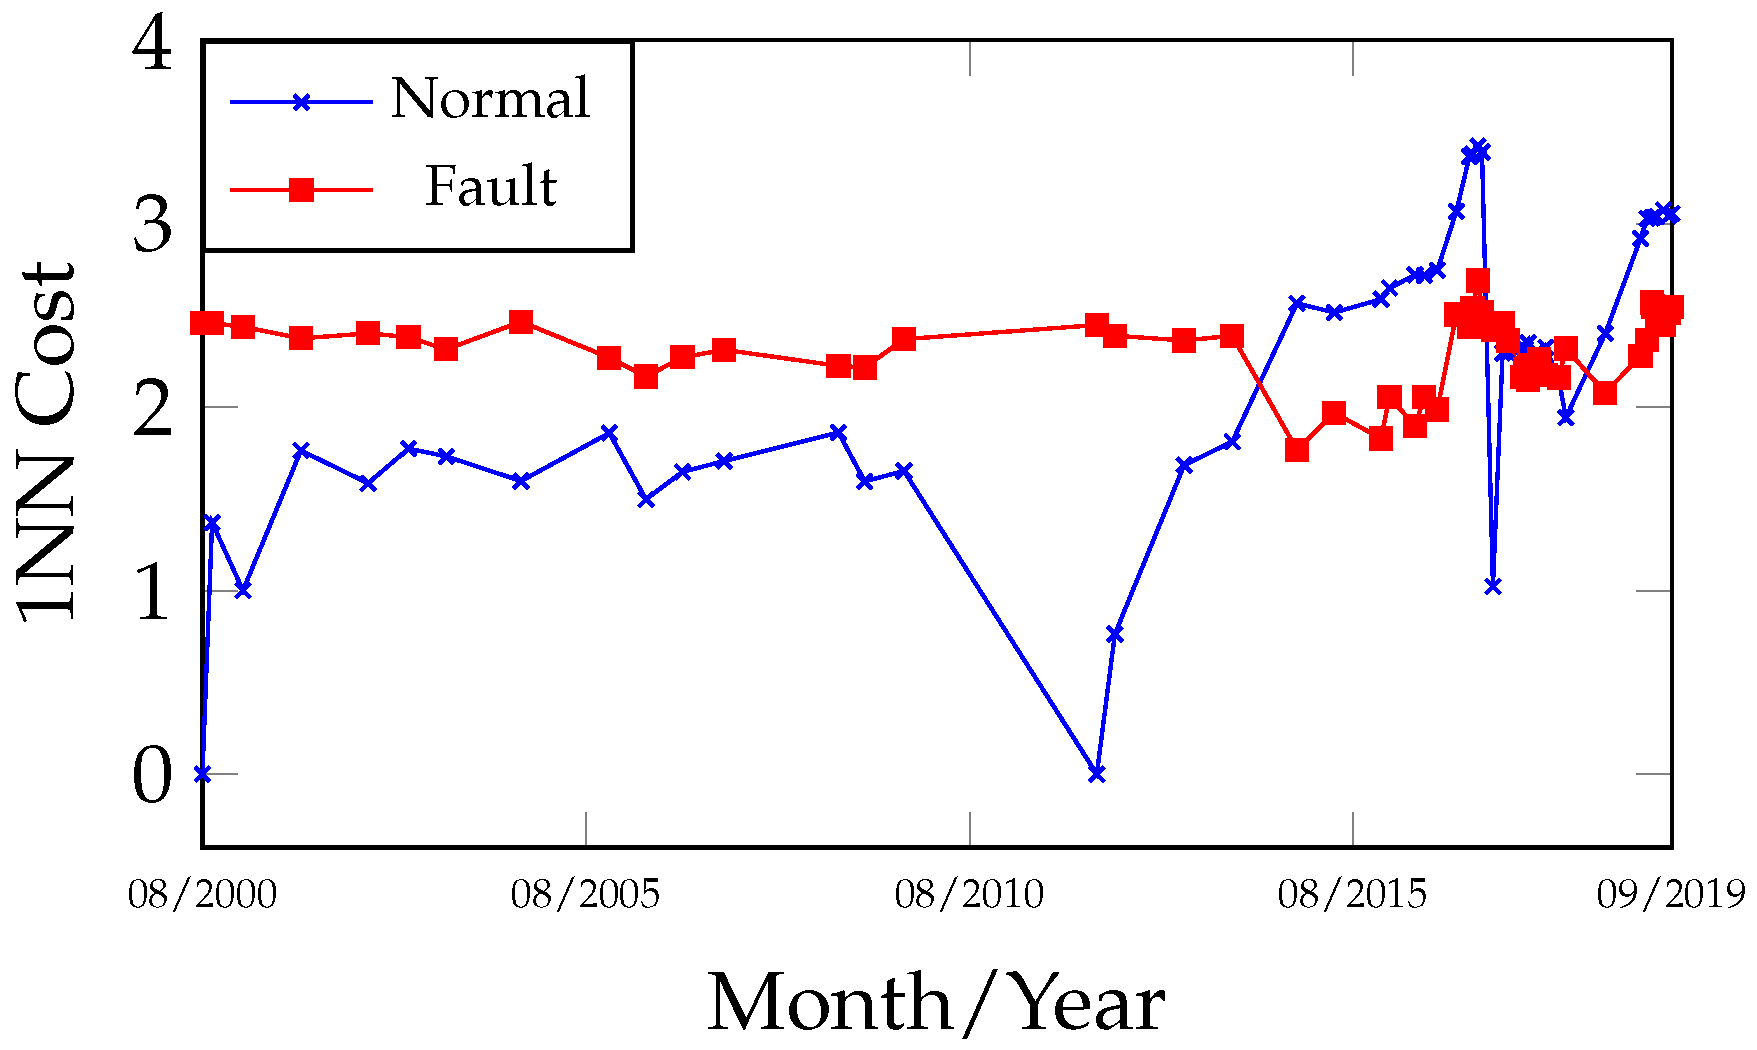
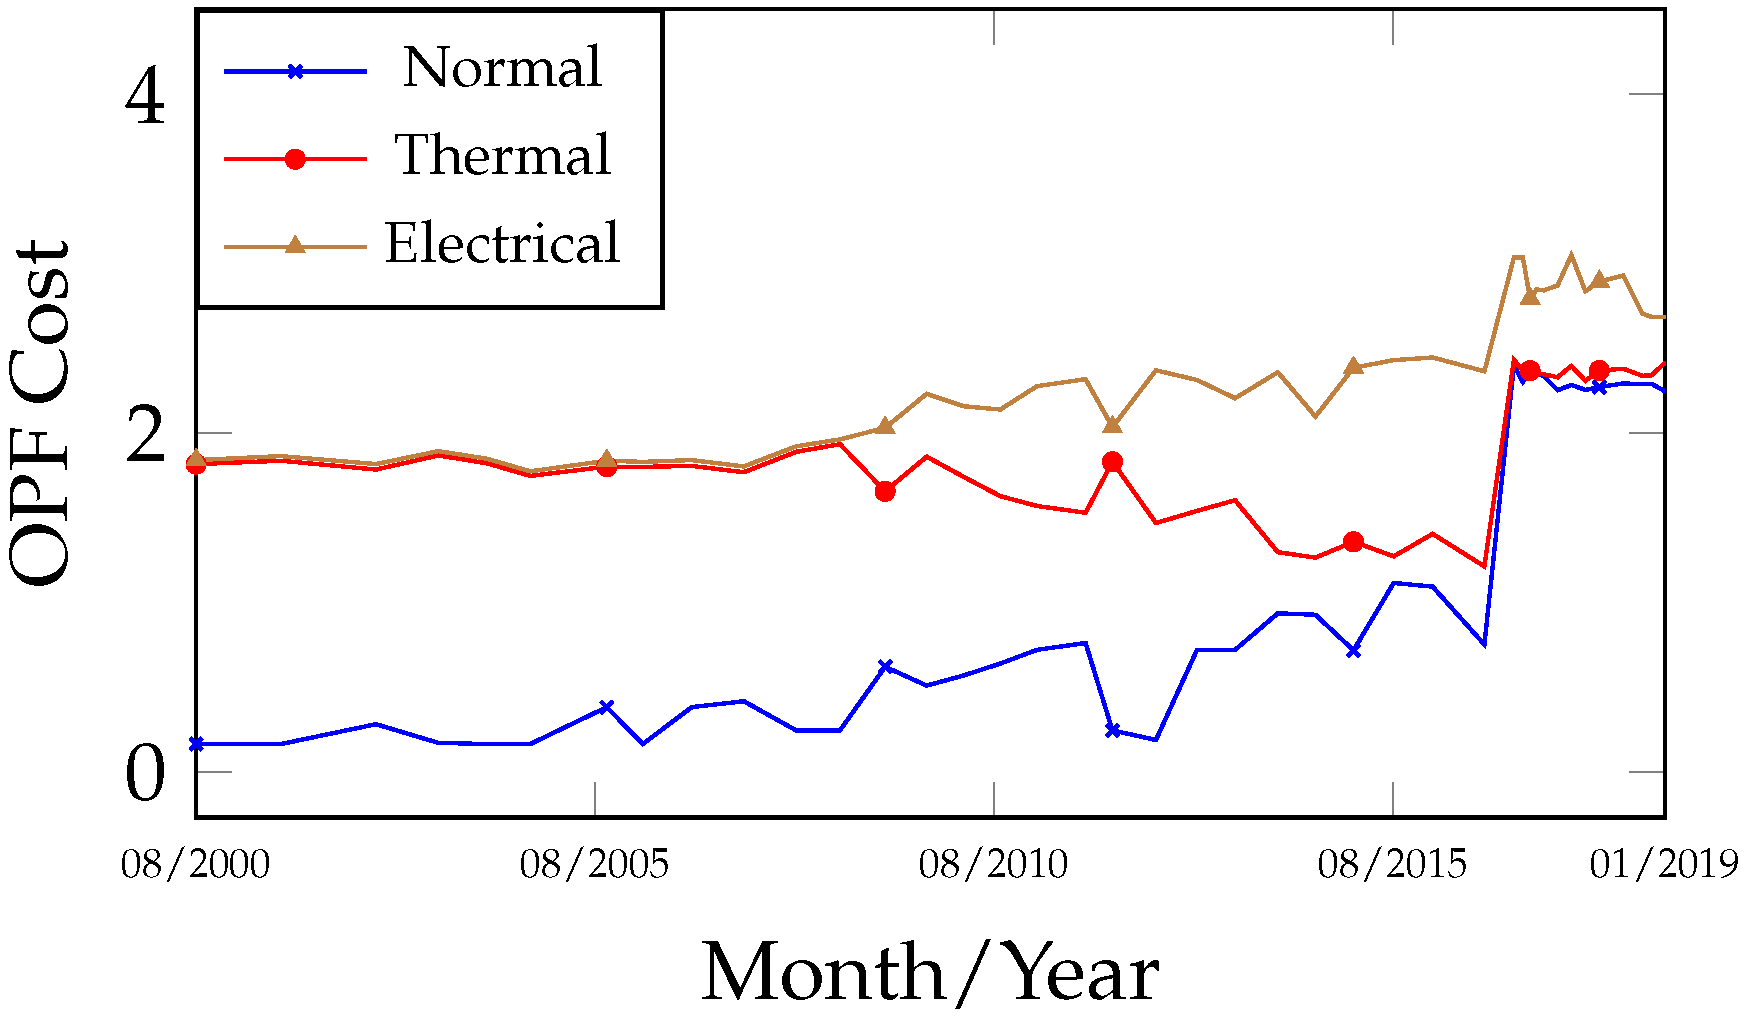
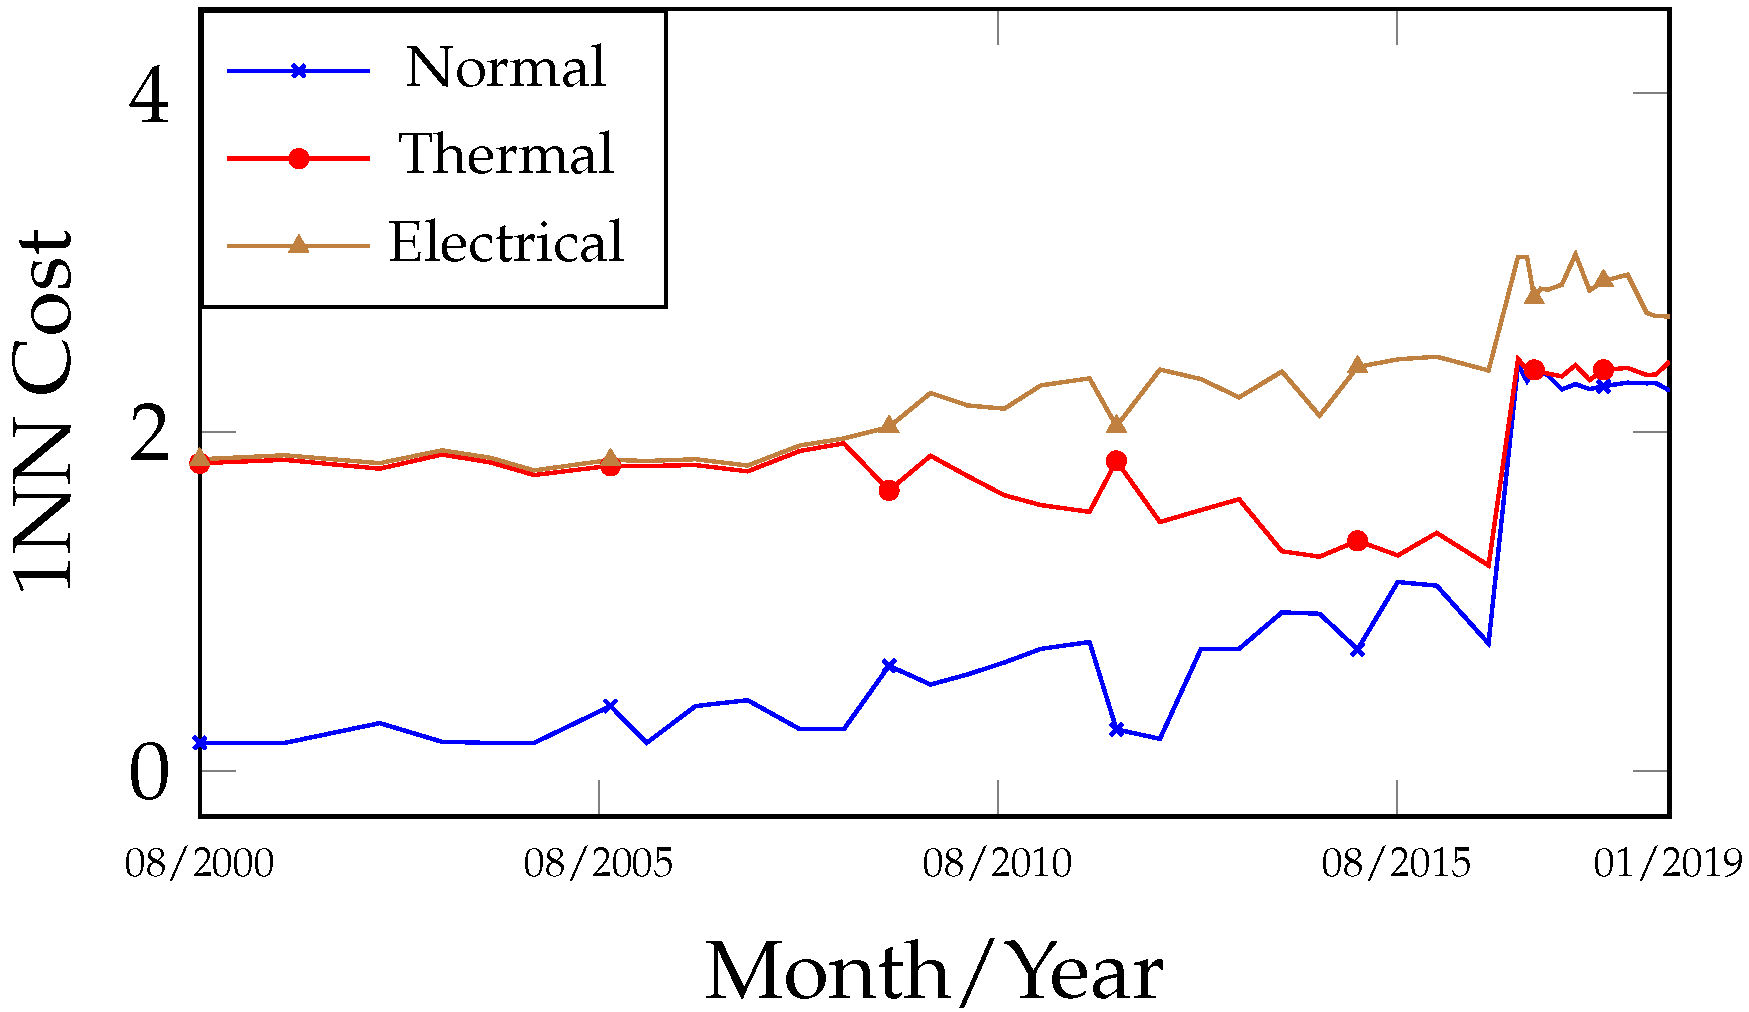
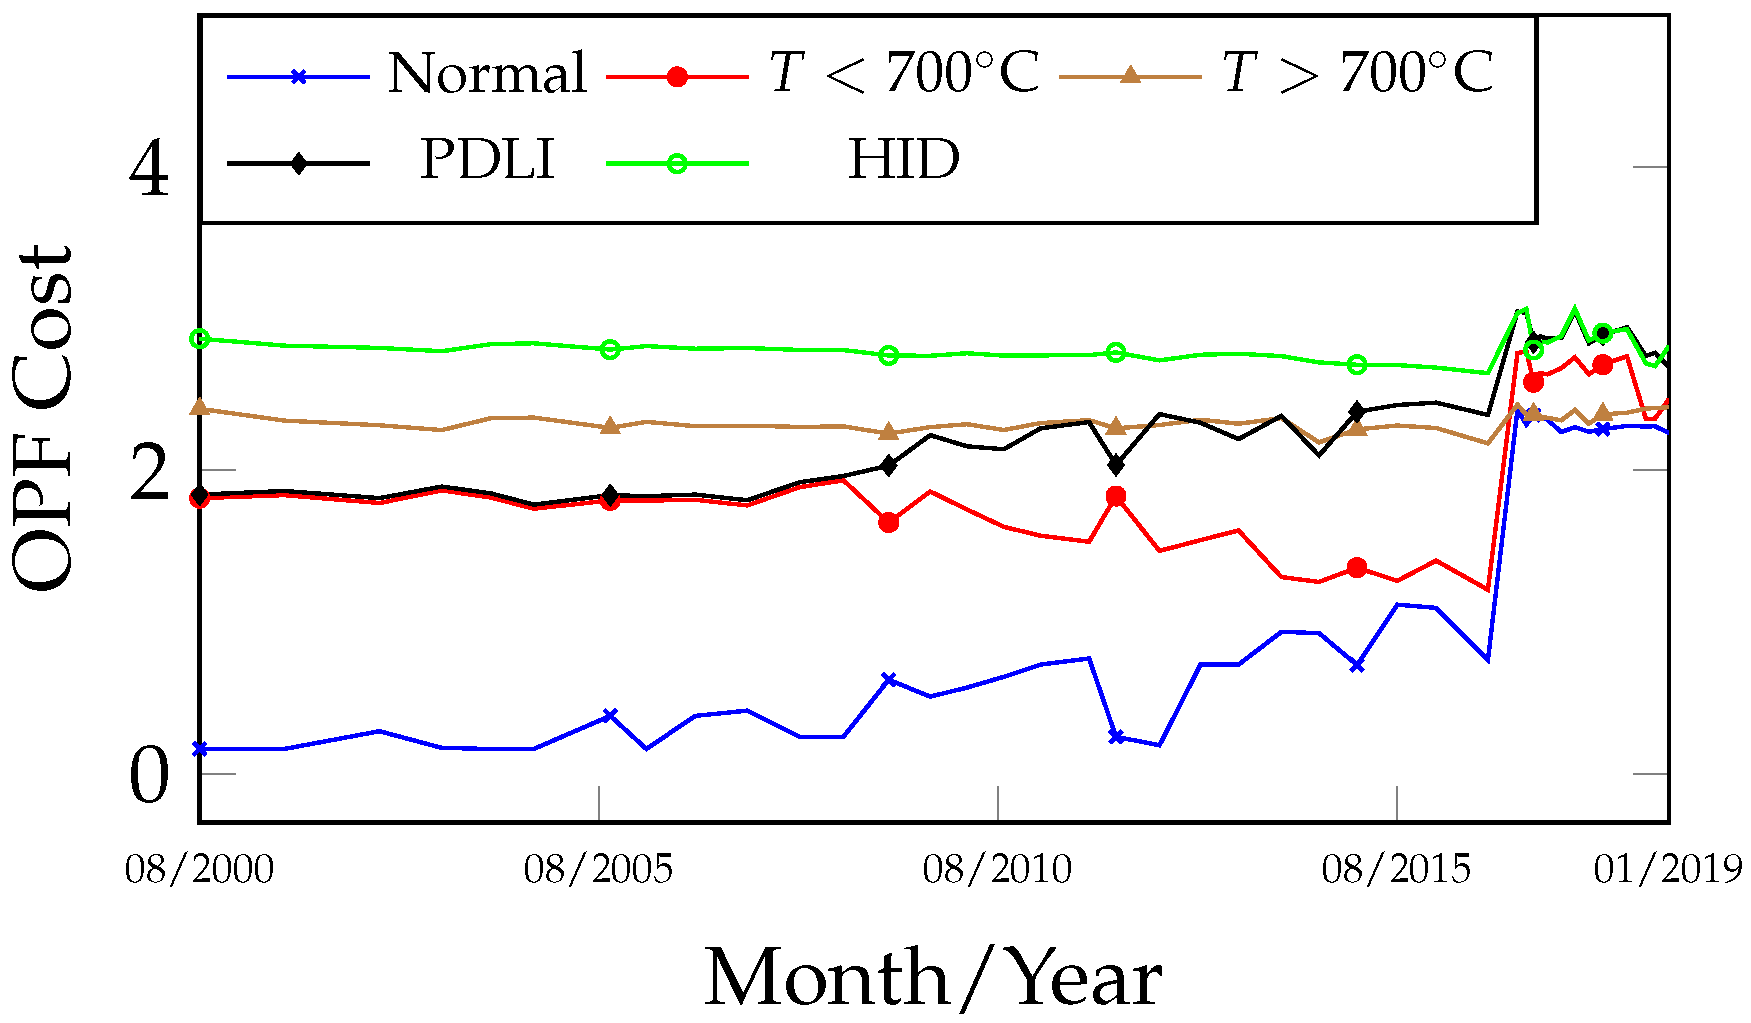
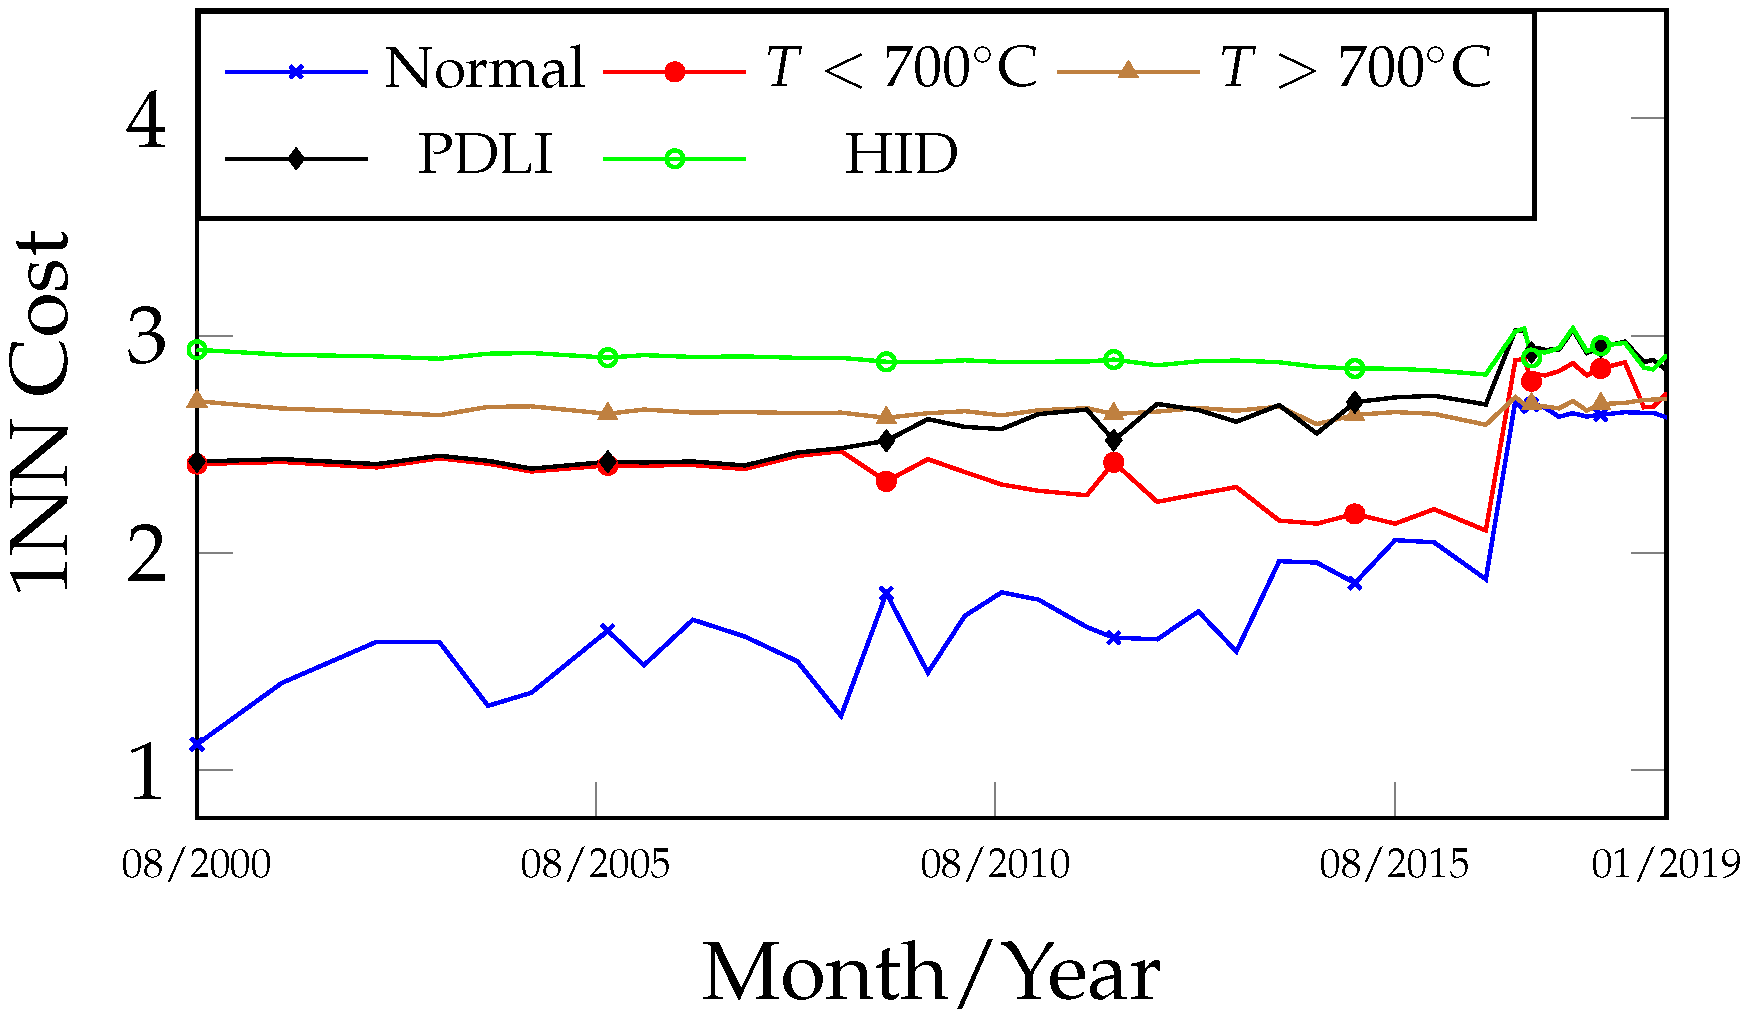
Figure 4 presents the DGA record for the equipment over the operational period from 4 August 2000 to 30 September 2019. On 1 April 2012, an oil treatment was carried out to improve its physicochemical properties and remove dissolved gases. After the equipment returned to operation, the gas evolution observed in the 15 December 2015 analysis prompted a reduction in the monitoring interval from semi-annual to quarterly, and subsequently to monthly after 8 December 2016, due to the high gas concentrations detected. An internal inspection of the equipment was performed by the electricity company only on 9 April 2017.
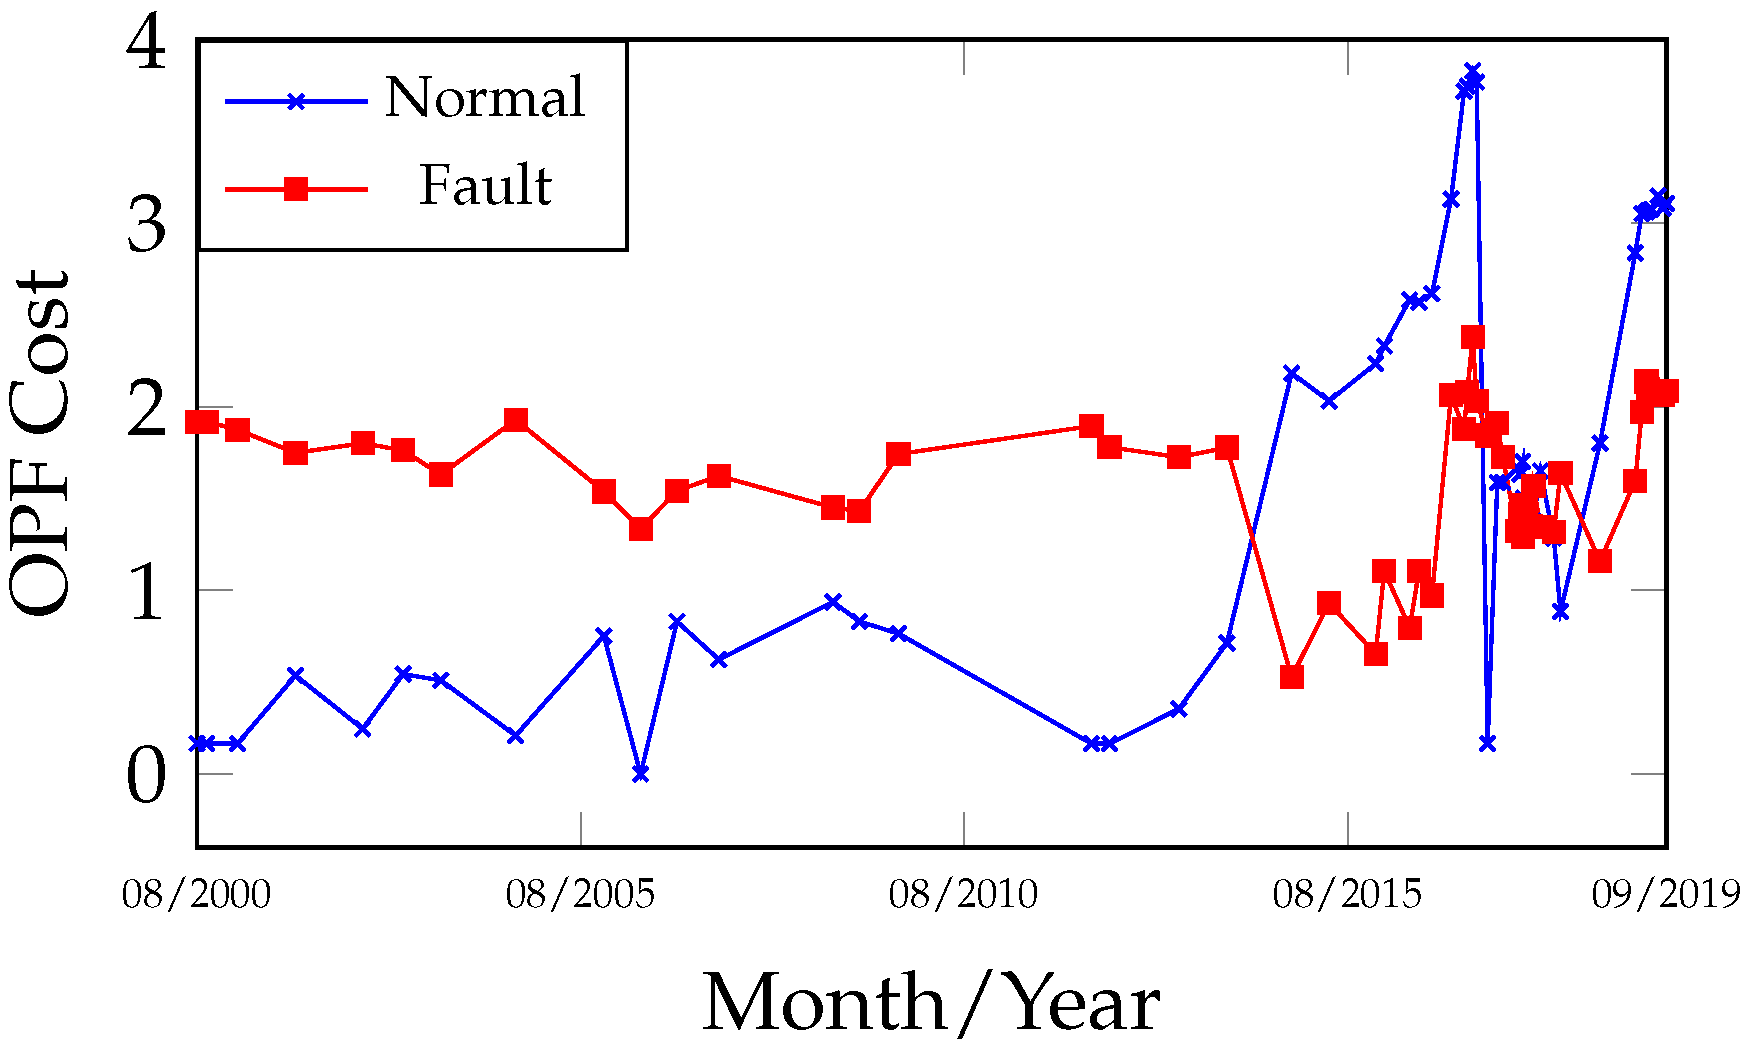
Analyzing the fault evolution curves (
Figure 5 and
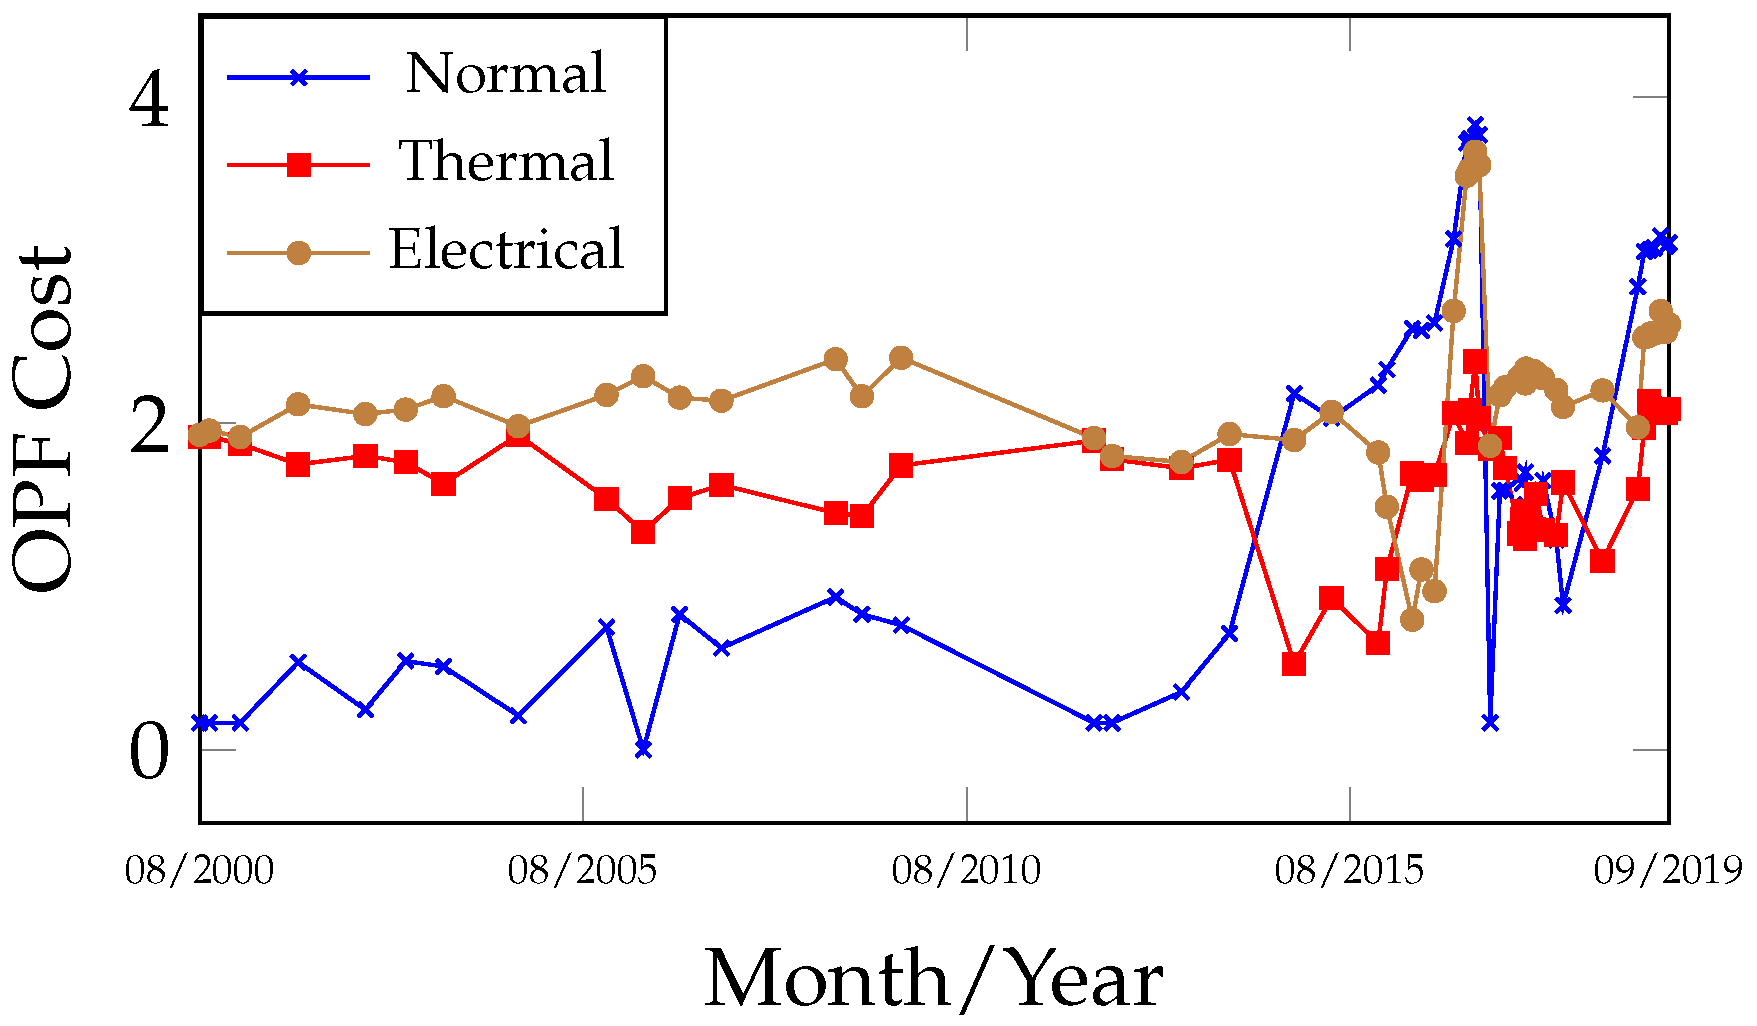
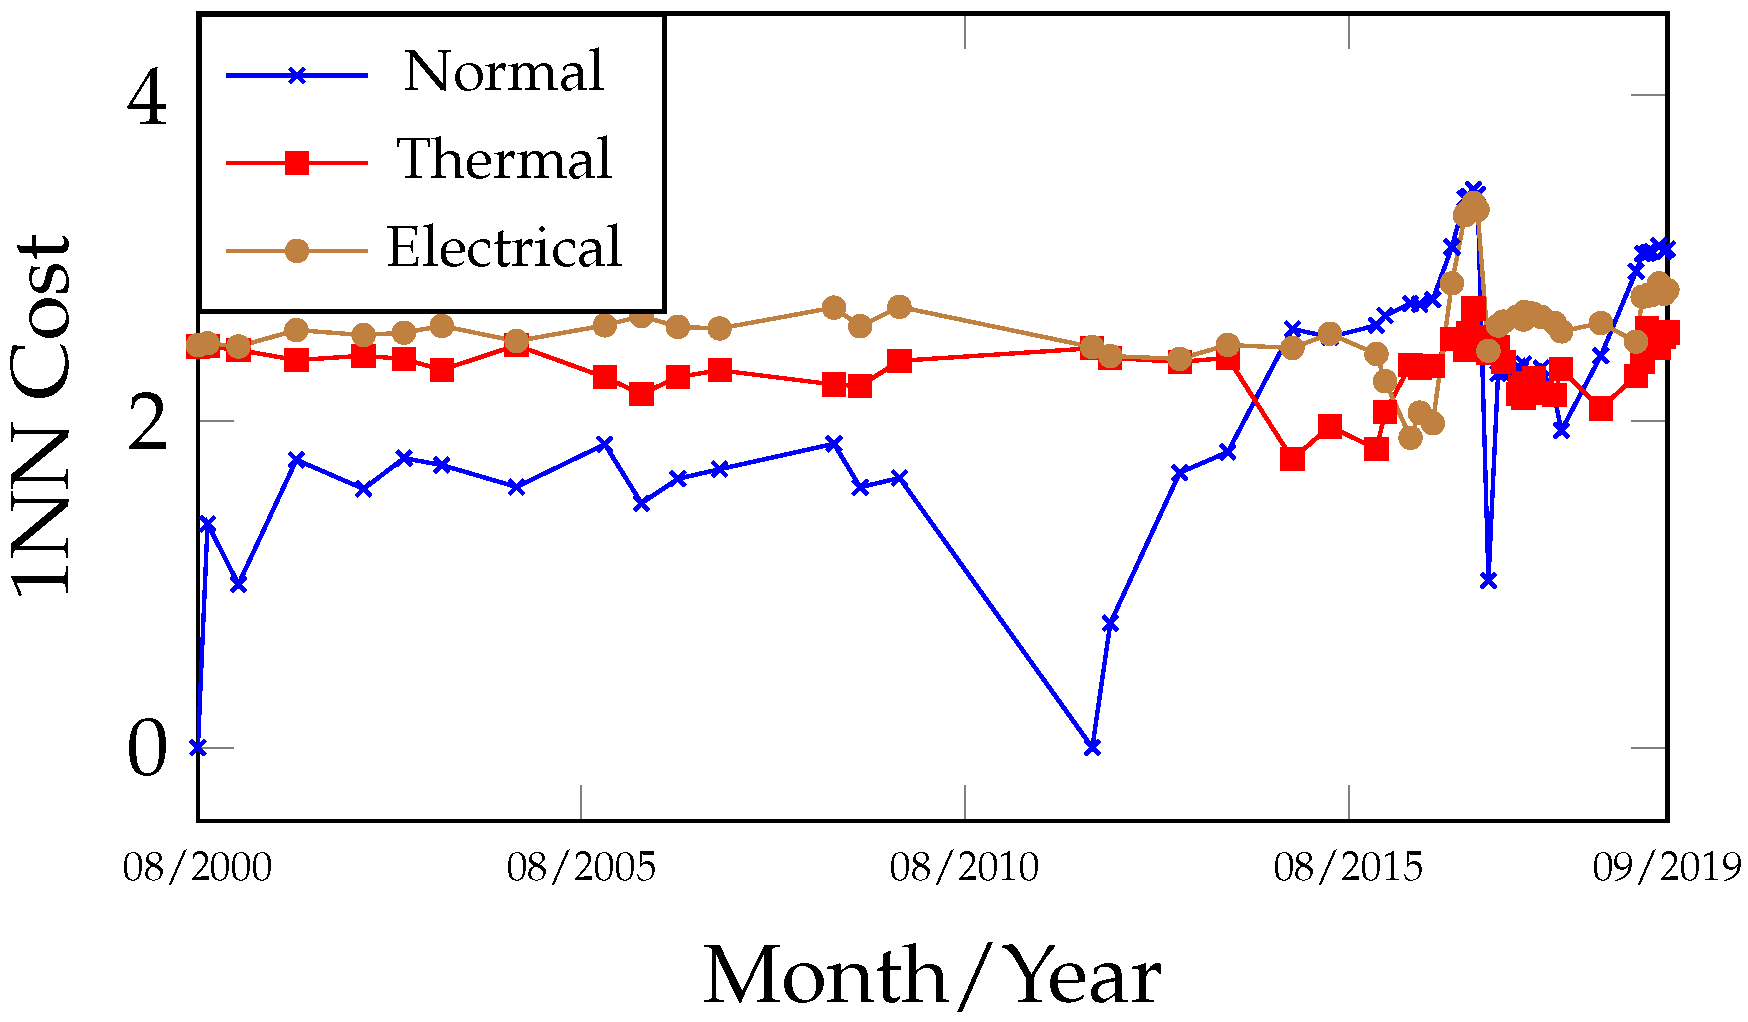
Figure 6) for the dates 4 August 2000 and 1 April 2012, the stability and low gas concentrations in the samples evaluated by 1NN and OPF were classified as normal, as they exhibited lower cost values and were distant from the fault class within the observed interval between both curves. After the oil treatment, as gas concentrations increased, an approximation was observed between the normal curve (increasing cost) and the fault curve (decreasing cost), indicating a transition from a normal to a fault state, which occurred between 6 January 2014 and 10 November 2014, prior to the transformer’s internal inspection. Complementing
Figure 5 and
Figure 6, the curves in
Figure 7 and
Figure 8 enable the identification of the fault group involved, distinguishing between thermal and electrical faults. In this case, indications of both fault groups were observed during the period. The primary gases produced during the fault signals were CH
4 and C
2H
4 (
Figure 4), which are typically associated with thermal faults when predominant, and of moderate relevance in electrical faults.
Figure 9 and
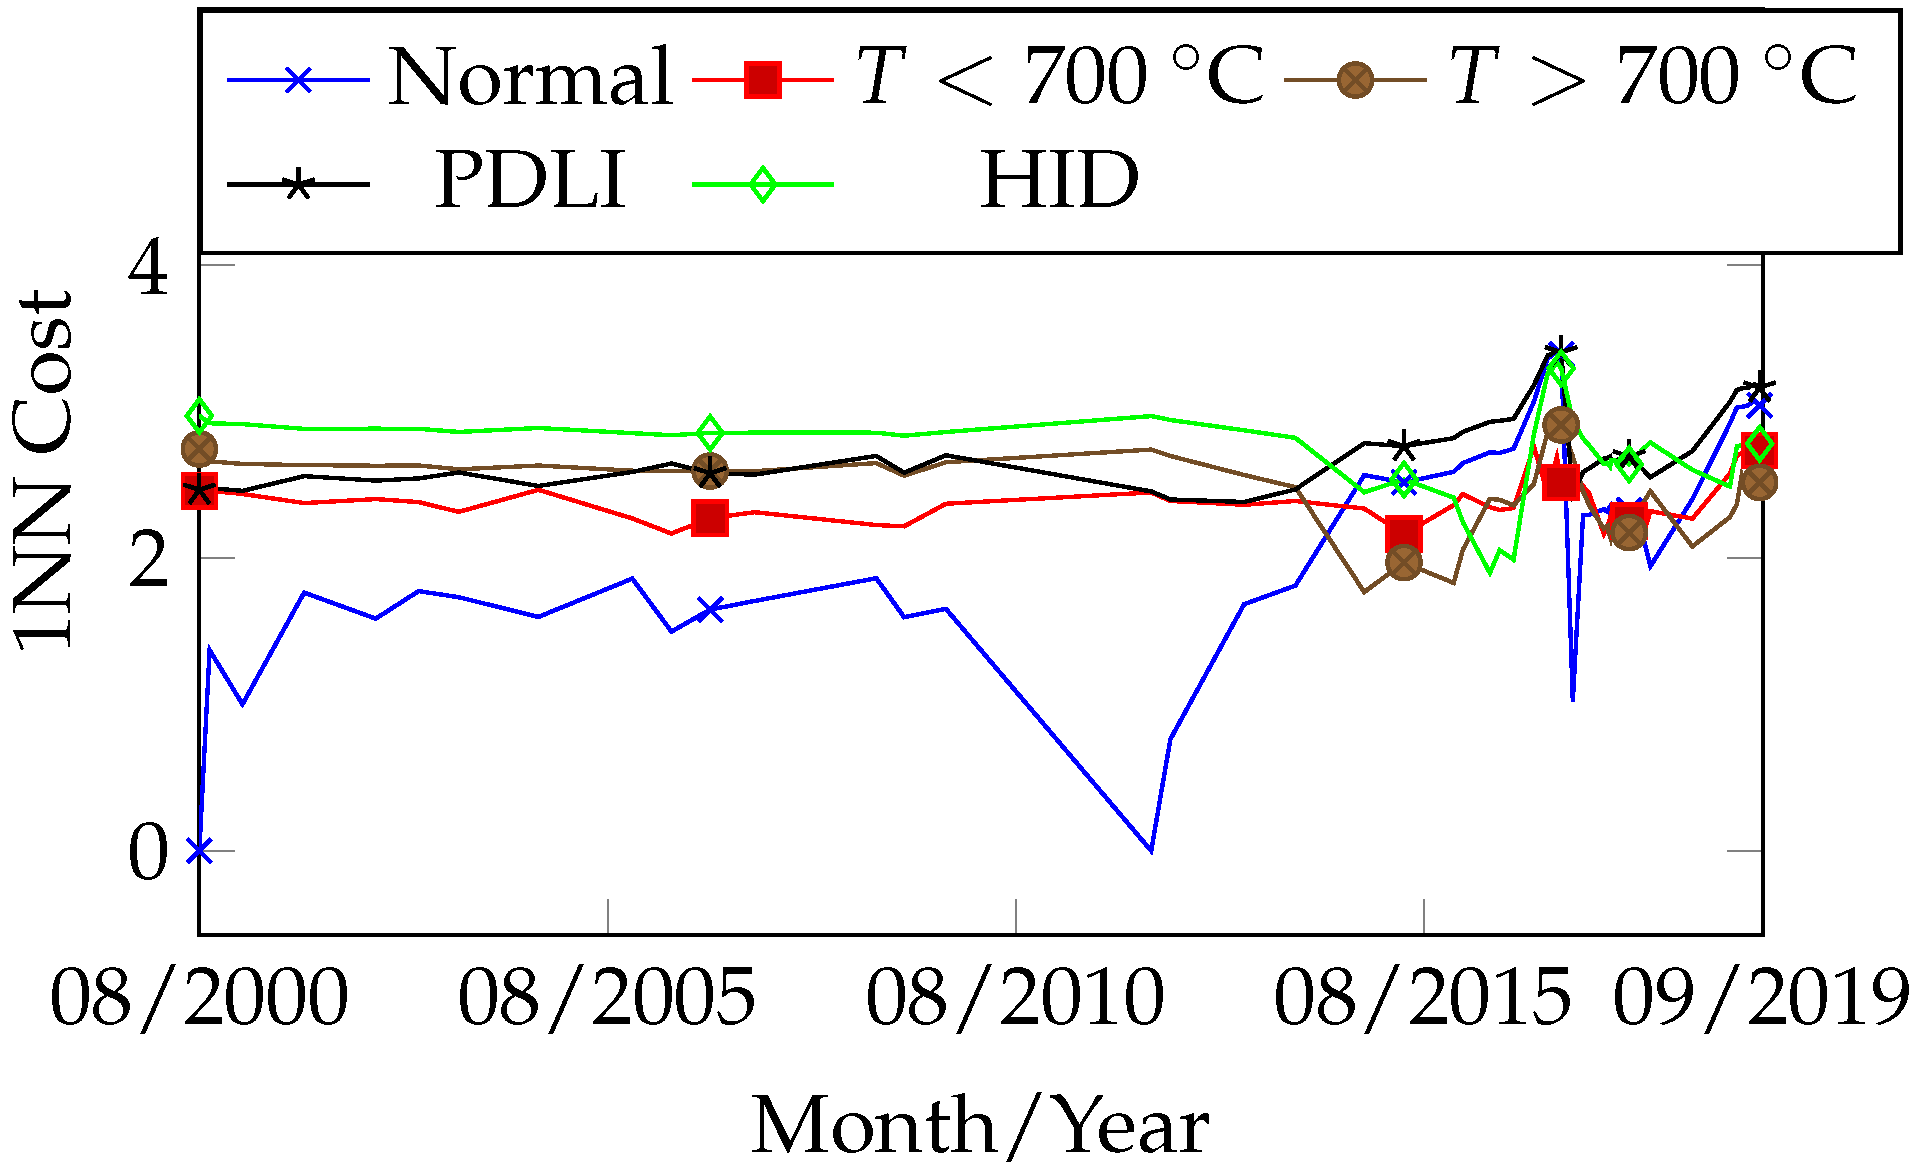
Figure 10 complement the previously discussed fault curves by specifying the fault classes, revealing signals of thermal faults (
C and
C) and high-intensity electrical discharges occurring throughout most of the transformer’s operational period. The curves from
Figure 5,
Figure 6,
Figure 7,
Figure 8,
Figure 9 and
Figure 10 are complementary, although they may also be interpreted independently. A comparison of the fault curves obtained from the 1NN and OPF algorithms reveals a high degree of similarity in both behavior and results.
During the internal inspection (opening) of the equipment on 9 April 2017, carbon particles were found on the shaft drive surface of the no-load tap changer, and the copper braided wire of the busbar TAP exhibited discoloration and partial breakage of its strands, providing clear evidence of overheating at
C. Relating the fault evidence identified in the transformer to the proposed methodology, the heating issue likely began after 6 January 2014, as indicated by
Figure 5,
Figure 6,
Figure 7,
Figure 8,
Figure 9 and
Figure 10. The signal of a high-intensity electrical fault (HID) may be interpreted as a classification error within the accuracy margin of the algorithms (
Table A6).
The classification obtained on 8 December 2016, which preceded the inspection, shifted to T < 700 °C due to changes in gas concentrations, representing a new classification error. However, from a curve analysis perspective, it is important to note that after 8 December 2016 in the fault hierarchy of
Figure 9 and
Figure 10, the secondary fault T > 700 °C appears close to the primary T < 700 °C. Similarly, during the period from 6 January 2014 to 10 November 2014 in
Figure 5,
Figure 6,
Figure 7,
Figure 8,
Figure 9 and
Figure 10, the faults closest to the primary electrical fault were thermal (secondary and tertiary faults). In summary, the curves allow the establishment of a sequence of possible faults. After the transformer resumed operation, all fault trend curves (
Figure 5,
Figure 6,
Figure 7,
Figure 8,
Figure 9 and
Figure 10) after 31 May 2017 exhibited a period of curve proximity alternating between normal and fault states. This behavior is associated with the homogenization period of residual gases within the oil-impregnated paper. Nevertheless, on 17 November 2018, a new gas evolution was detected, along with an indication of a thermal fault trend: T > 700 °C (primary) and T < 700 °C (secondary). This finding suggests the need for closer monitoring with more frequent analyses until a new internal inspection is performed.
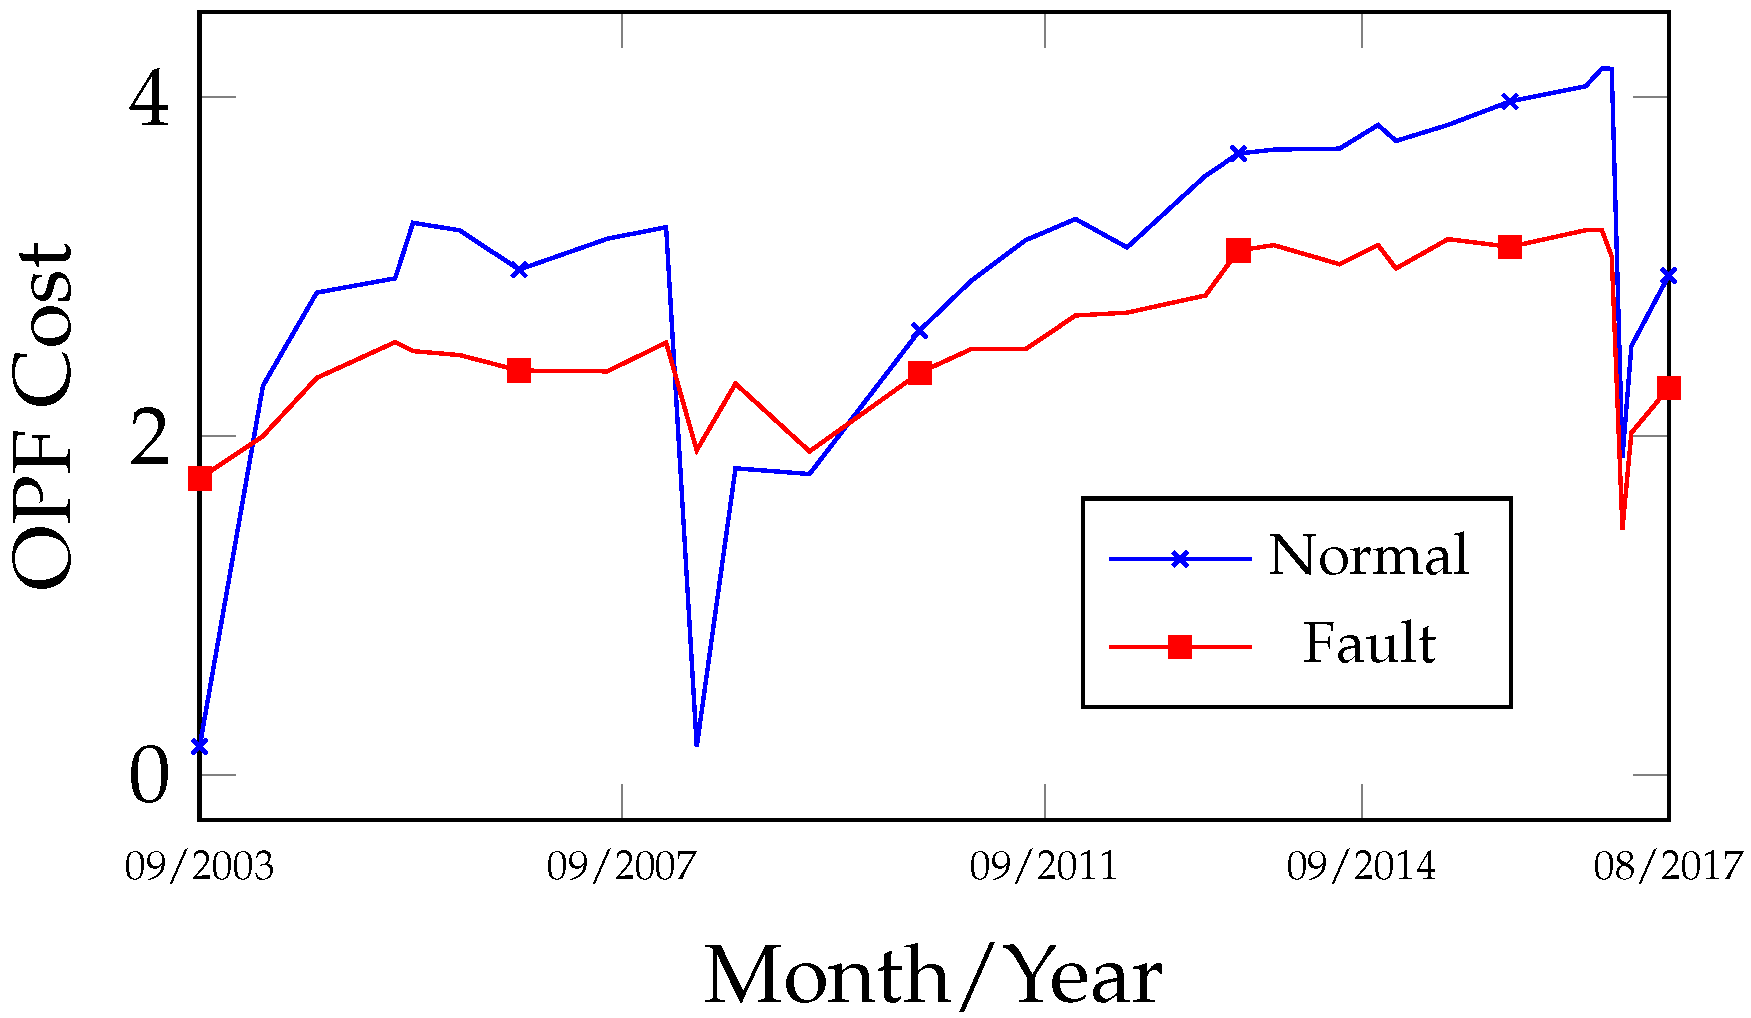
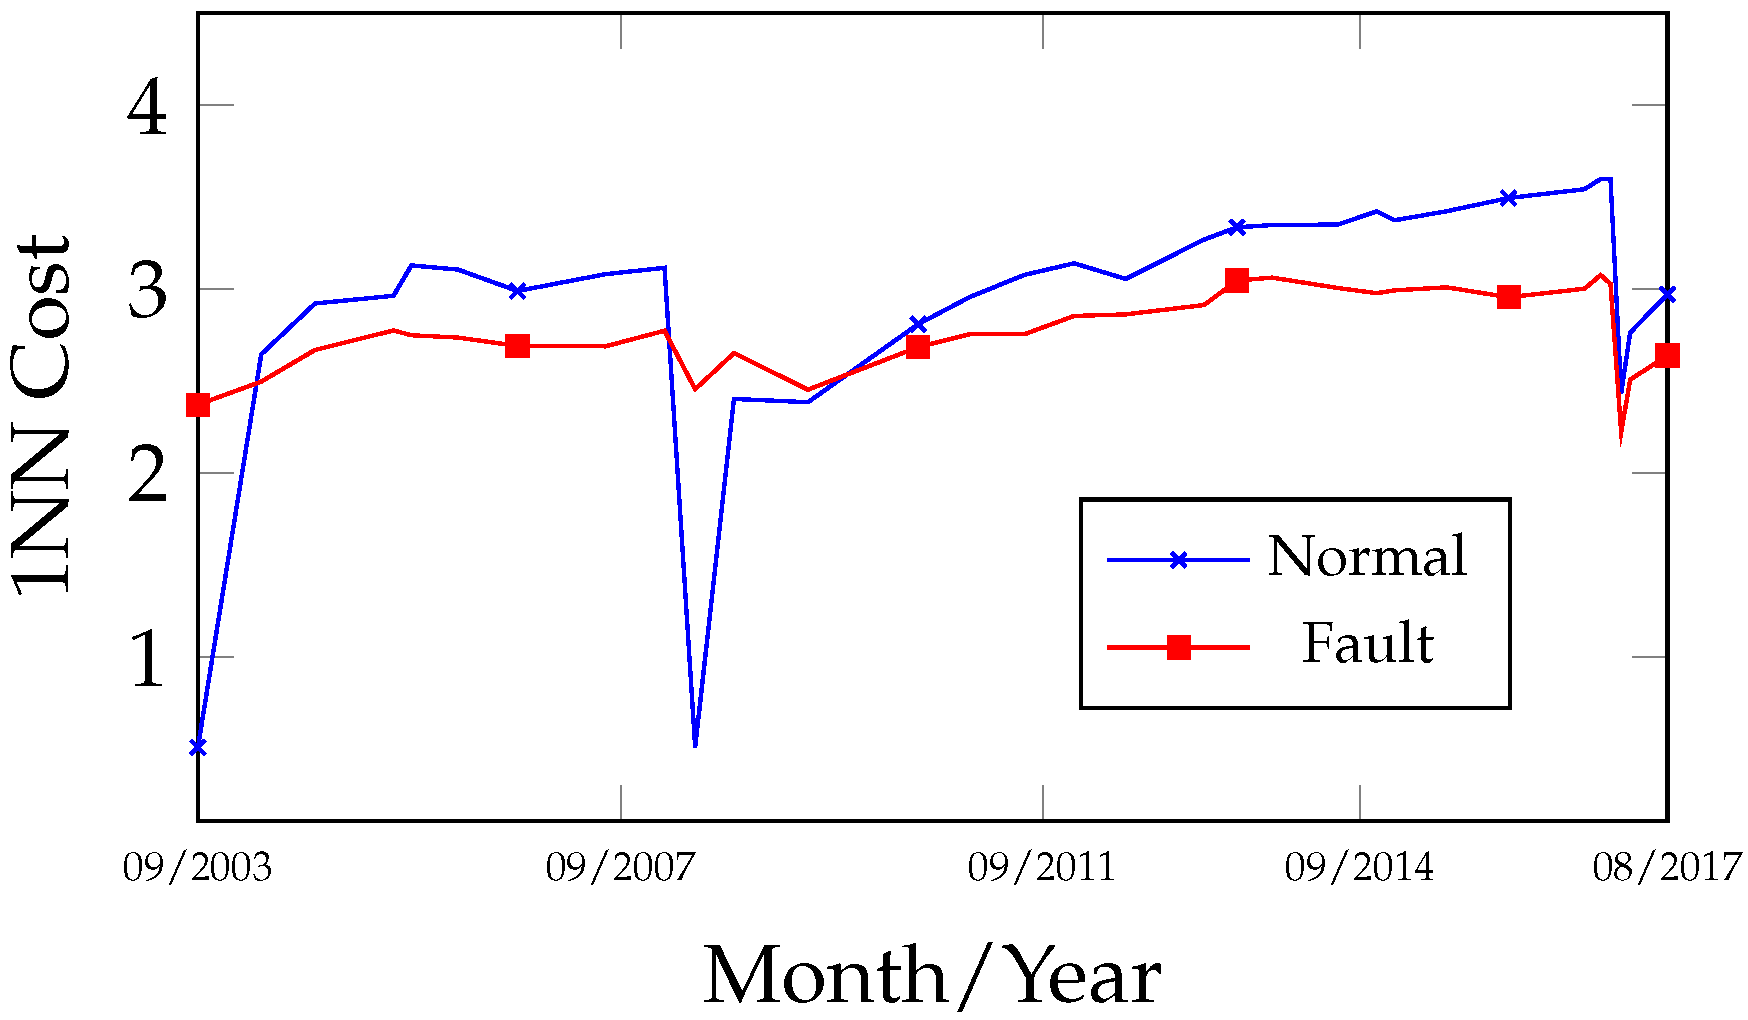
4.2.2. Case Study 2—Tranformer 230/88kV @50MVA
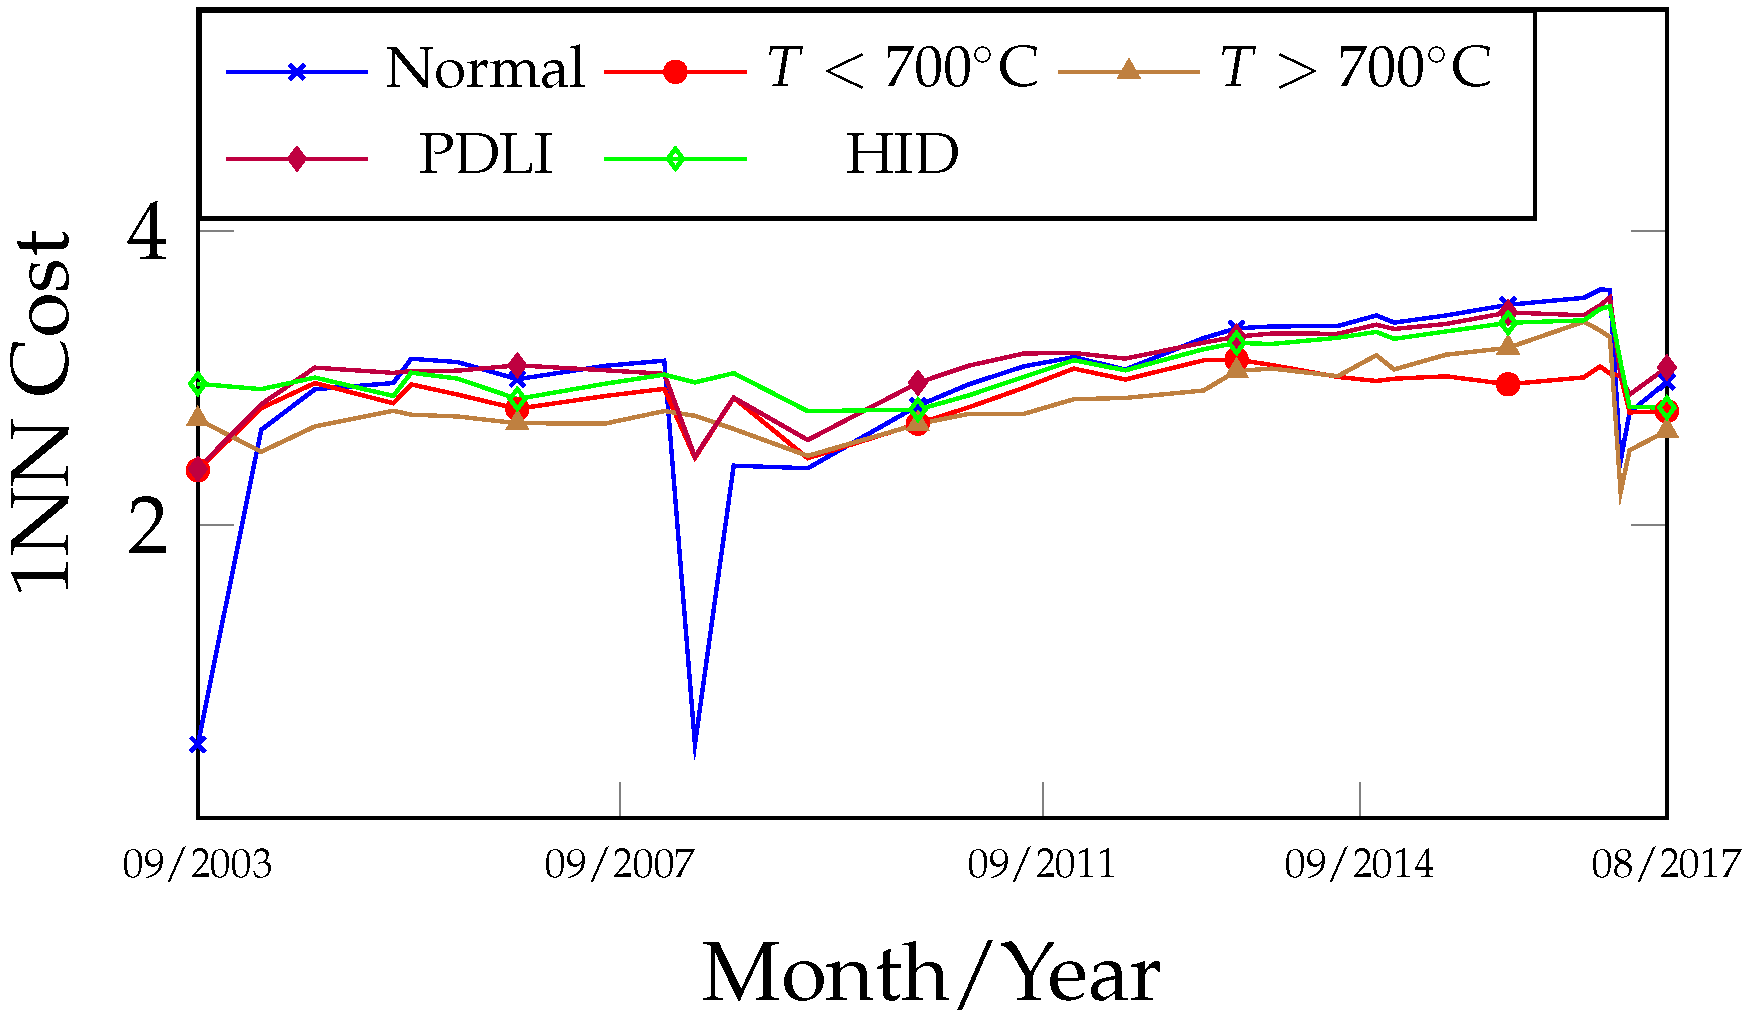
Figure 11 presents the record of gas analyses during the equipment’s operational period from 28 September 2003 to 25 August 2017. On 12 June 2008, the insulating oil was treated to improve its physicochemical properties and remove dissolved gases. Despite the gas evolution observed after the equipment returned to operation, the DGA analysis interval was maintained on a biannual basis until 23 February 2016, after which it was changed to a monthly interval until 9 February 2017, when an internal inspection was performed and maintenance was carried out by the electricity company.
Analyzing the fault trend curves in
Figure 12 and
Figure 13, it can be observed that as soon as the equipment began operation, on 4 May 2004, the curve already indicated the presence of a fault, and on 27 February 2008 the operation was interrupted for an oil treatment.
It is noteworthy that during this period no inspection activities were performed, probably due to the stabilization of gas evolution preceding the treatment, a condition often associated with the natural disappearance of the fault.
After 7 July 2009, a new increase in gas concentration was observed, with fault indications occurring between 23 July 2010 and the equipment opening after 9 February 2017.
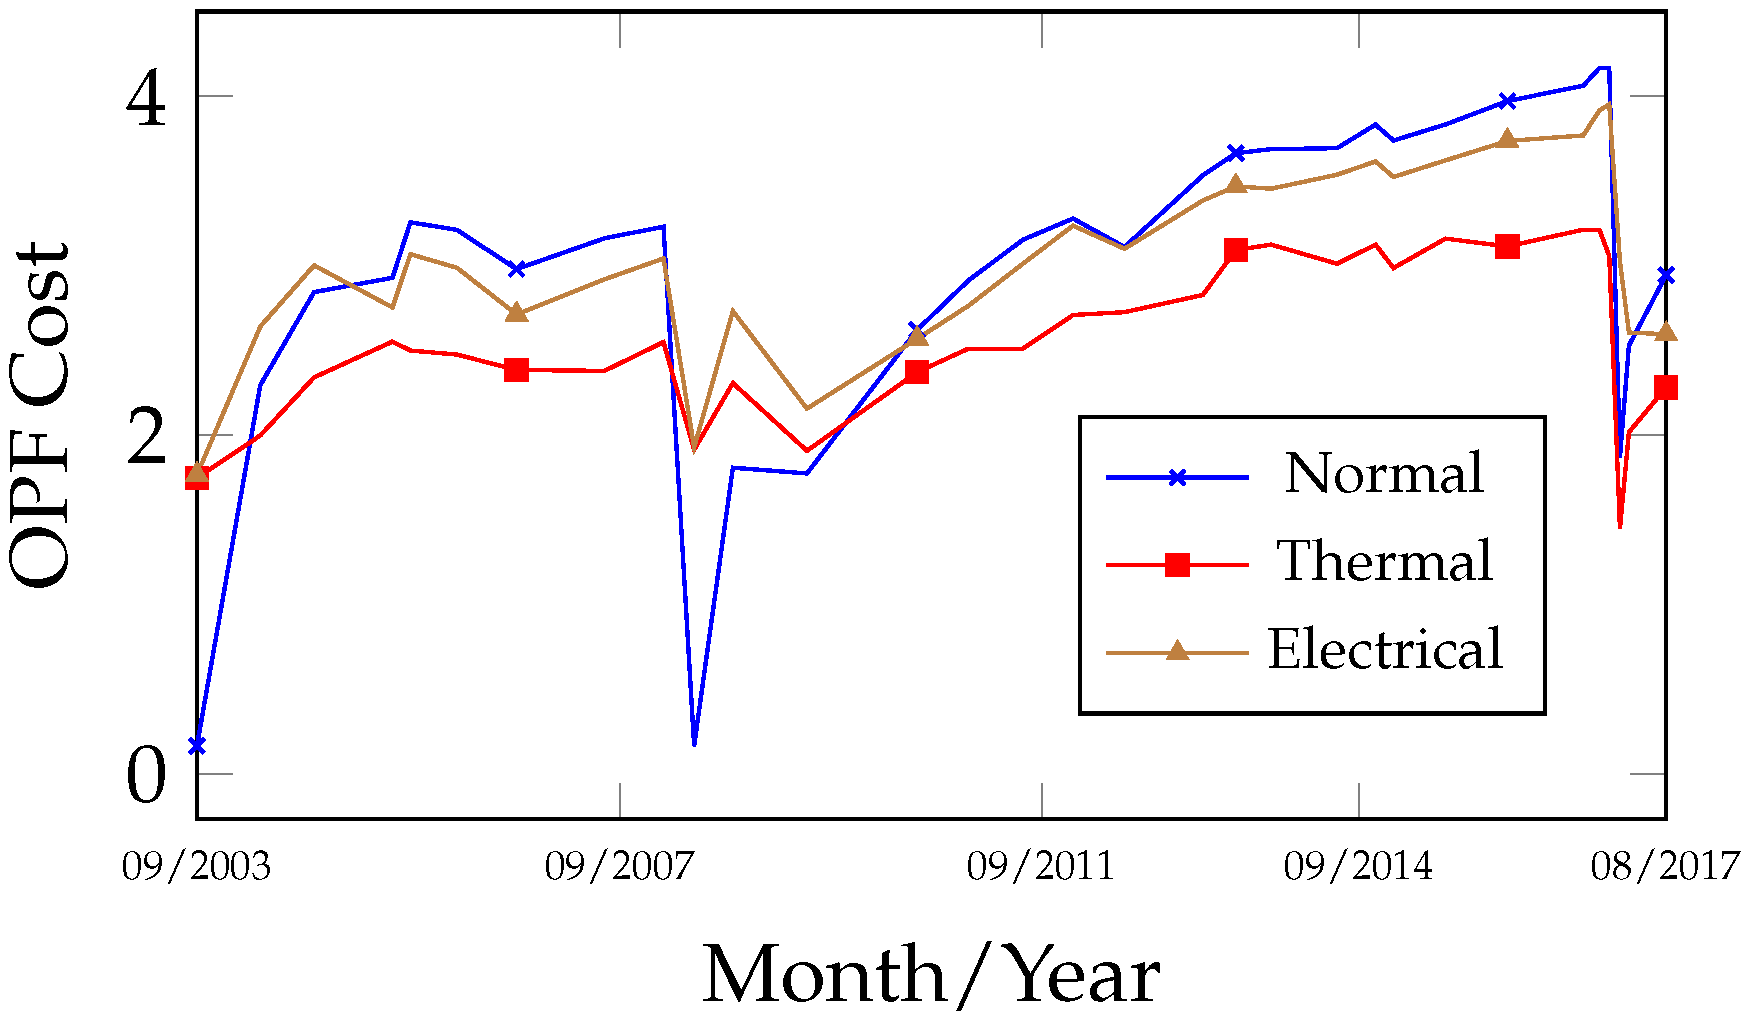
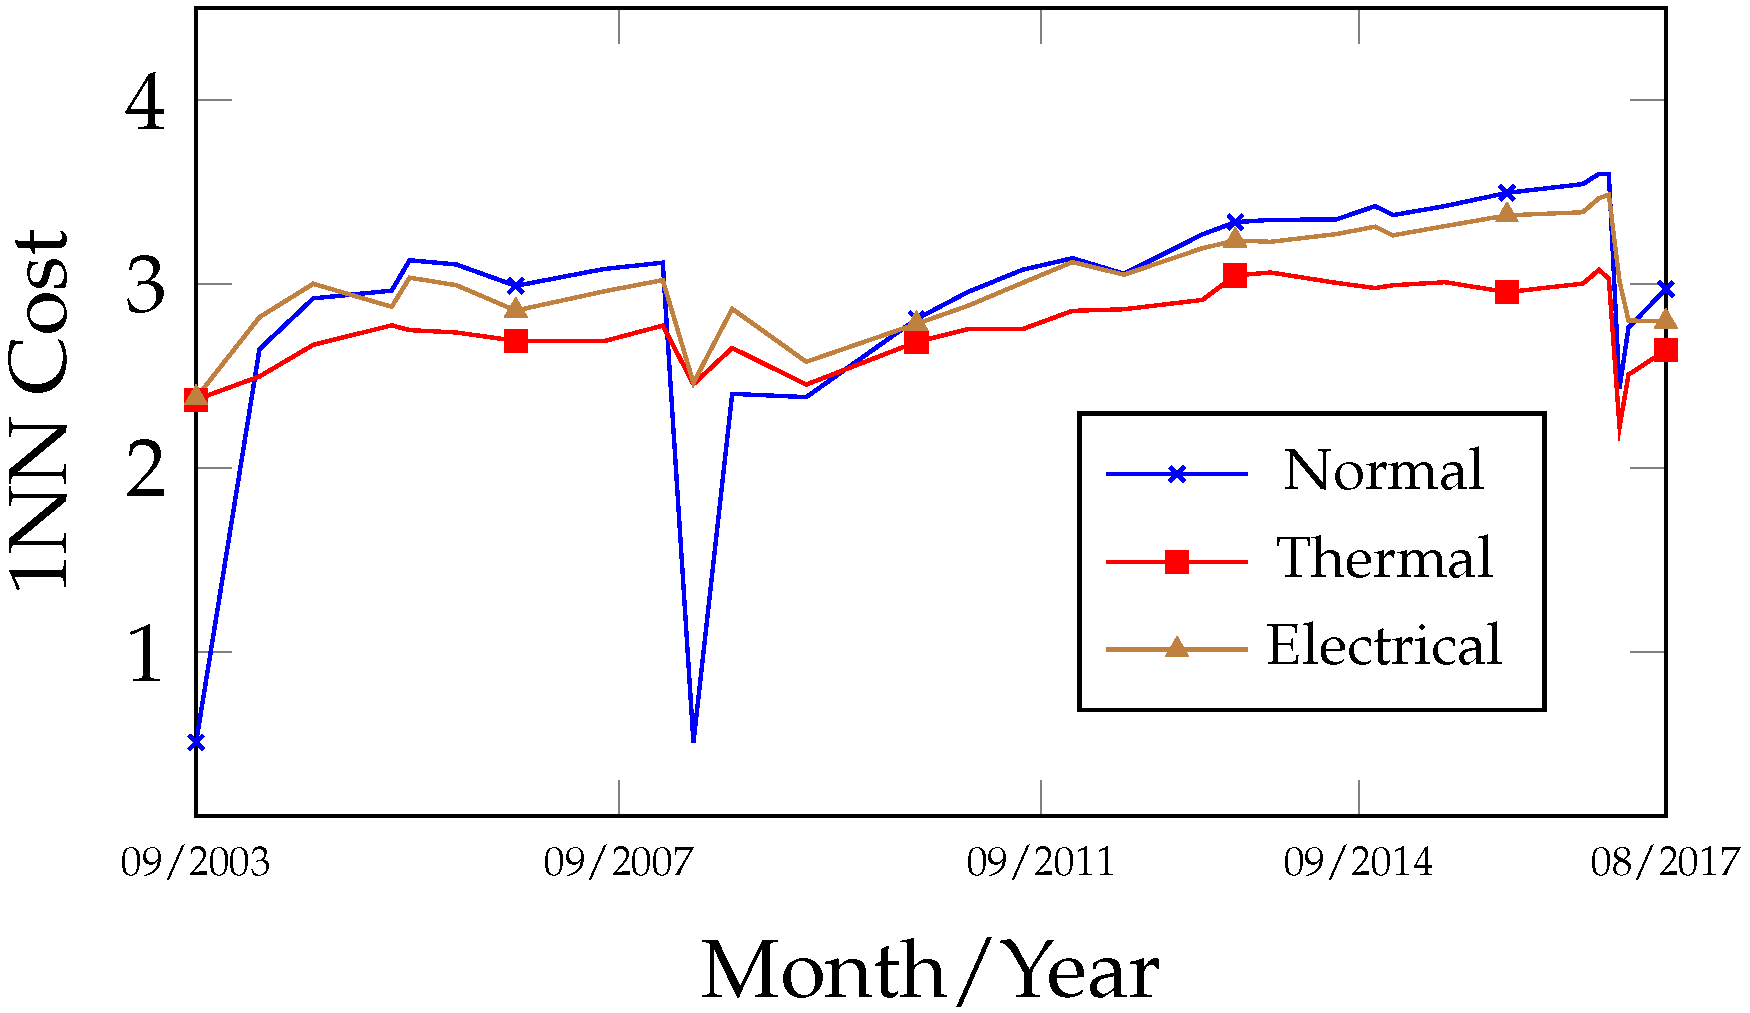
The fault evolution curves in
Figure 14 and
Figure 15 indicate that all faults occurring between 28 September 2003 and 25 August 2017 were classified as thermal (lower cost).
The relevant gases detected during this period were H2, CH4, and C2H4, along with moderate amounts of C2H6 and traces of C2H2. Depending on their concentration, these gases may be associated with thermal faults or low/high energy discharges.
In the recognition of specific fault classes, the analyses of the curves in
Figure 16 and
Figure 17 reveal that alternate thermal faults occurred at different times: between 4 May 2004 and 27 February 2008, and from 23 July 2010 to 17 July 2014, thermal faults with T > 700 °C were detected, while from 17 July 2014 to 9 February 2017, thermal faults with T < 700 °C were identified.
A high degree of similarity was also verified in the behavior and results obtained between the 1NN and OPF algorithms.
During the internal inspection conducted after 9 February 2017, several occurrences with thermal fault characteristics were identified, indicating both medium- and long-term manifestations. These findings revealed degradation of the paper insulation (carbonized and lost dielectric properties) caused by overheating (C) on the X1 and X2 low-voltage bushings, with recent fault characteristics. Additionally, signs of heating were observed in the form of discoloration on screws and partial fusion of a washer on the core clamping frame (C), the latter probably originating prior to 27 February 2008, as suggested by the degree of degradation. In this context, the results obtained demonstrate consistency; however, it is noteworthy that both thermal faults (primary and secondary) consistently occurred in close proximity throughout the entire period analyzed. In November/2015, an acoustic emission test was carried out to investigate the presence of partial internal discharges associated with gas accumulation (mainly C2H2). Although no anomalies were detected, the test supported the conclusion that the fault identified prior to November/2015 was most likely thermal in nature.
4.2.3. Case Study 3—440/138kV @100MVA
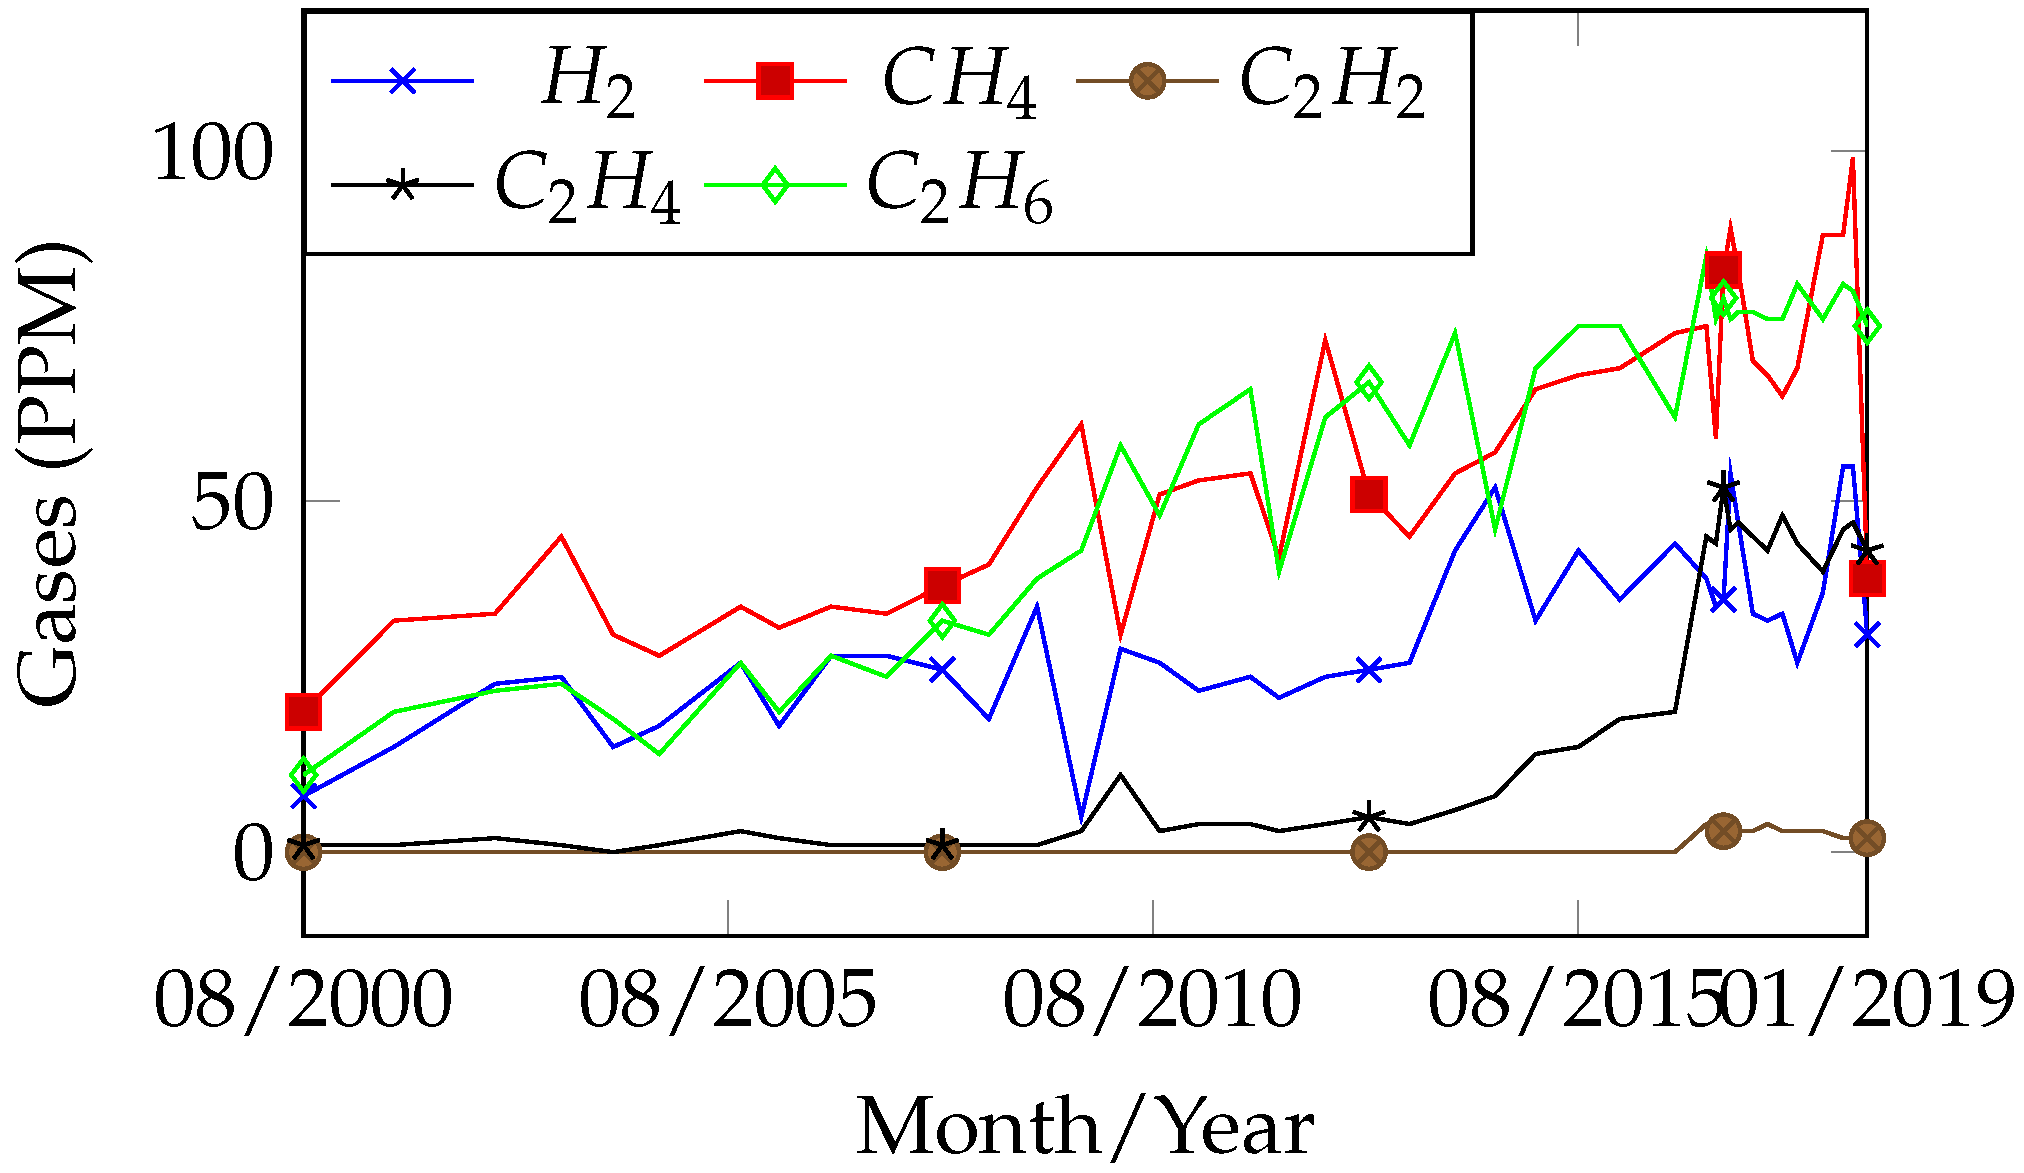
Figure 18 presents the record of gas concentration analysis throughout the operational life of the equipment, spanning from 7 August 2000 to 2 January 2019. This case refers to a transformer operating under normal conditions in the electrical system, with no anomalies recorded. In its DGA analysis, a slow increase in gas concentration can be observed; however, from 9 February 2017, there was a slight rise in CH
4 and C
2H
6 concentrations, along with the emergence of C
2H
2, which is typically associated with electrical faults when significant, or with thermal faults at
C in smaller amounts. The presence of C
2H
2 is regarded as an aggravating factor for faults, generally requiring closer monitoring of the equipment. Consequently, the interval between DGA analyses is reduced to monthly. After 26 June 2017, with the stabilization of gas evolution, the analysis frequency was changed back to quarterly.
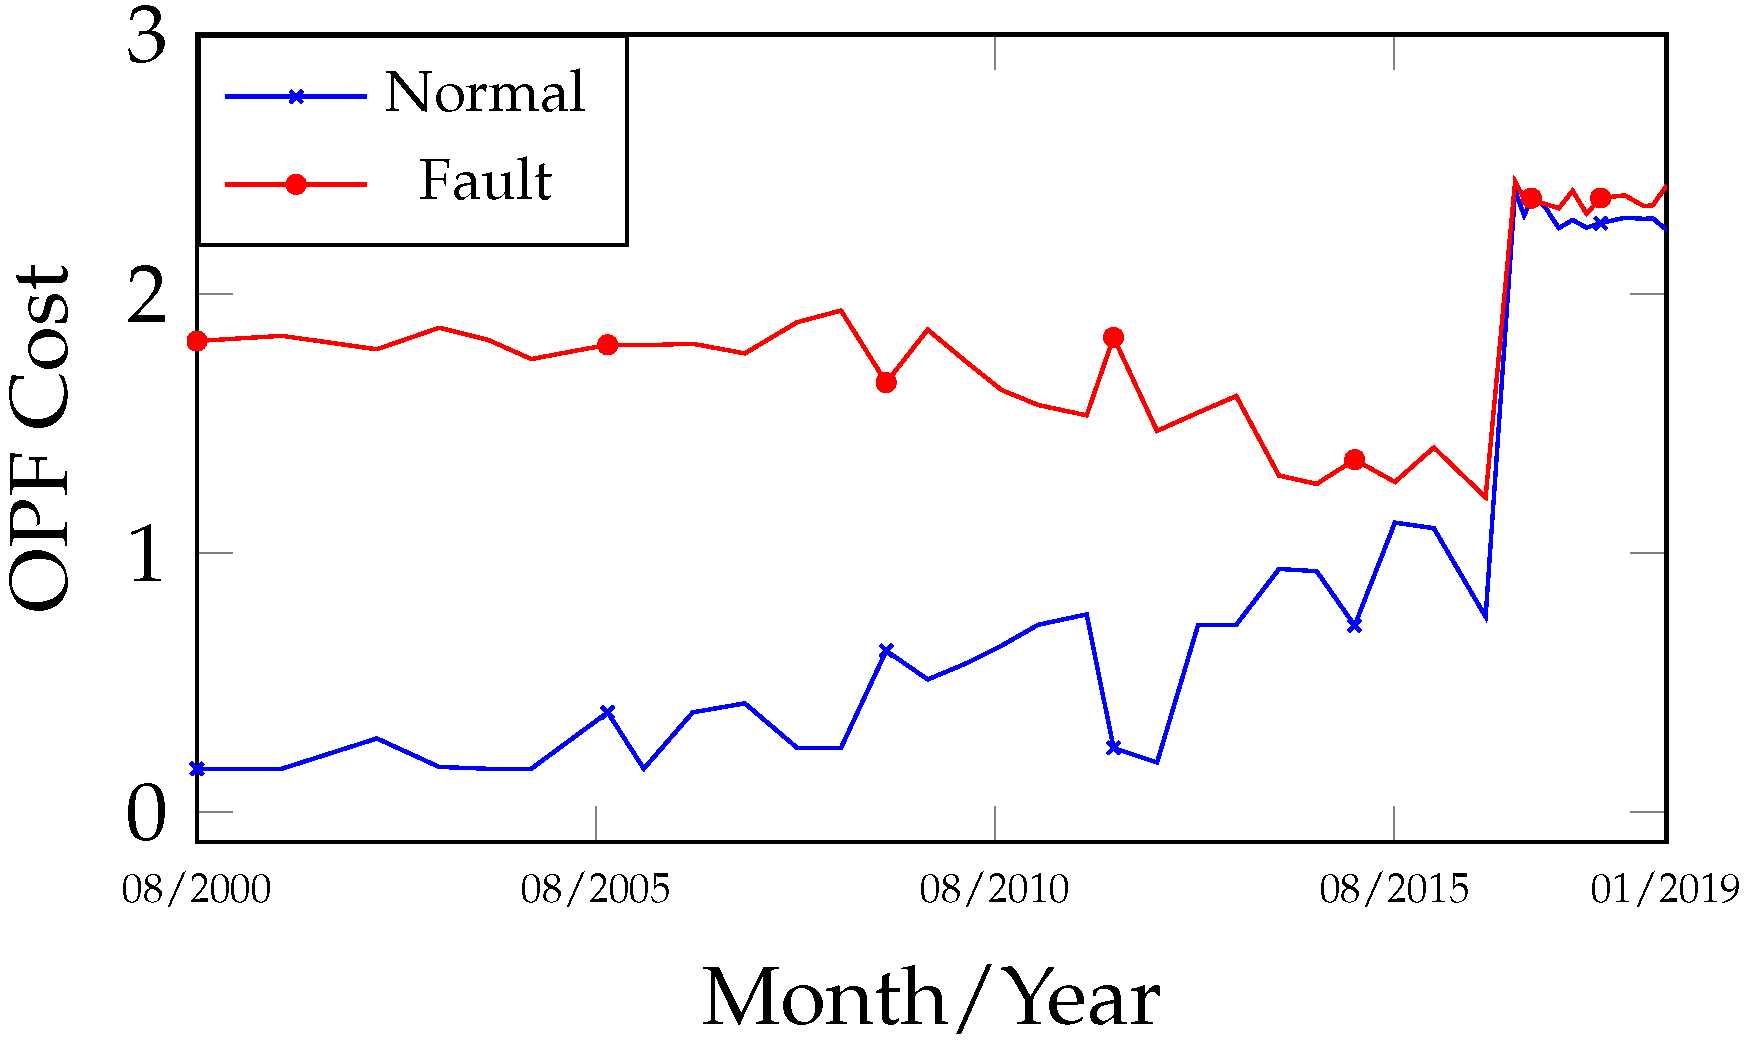
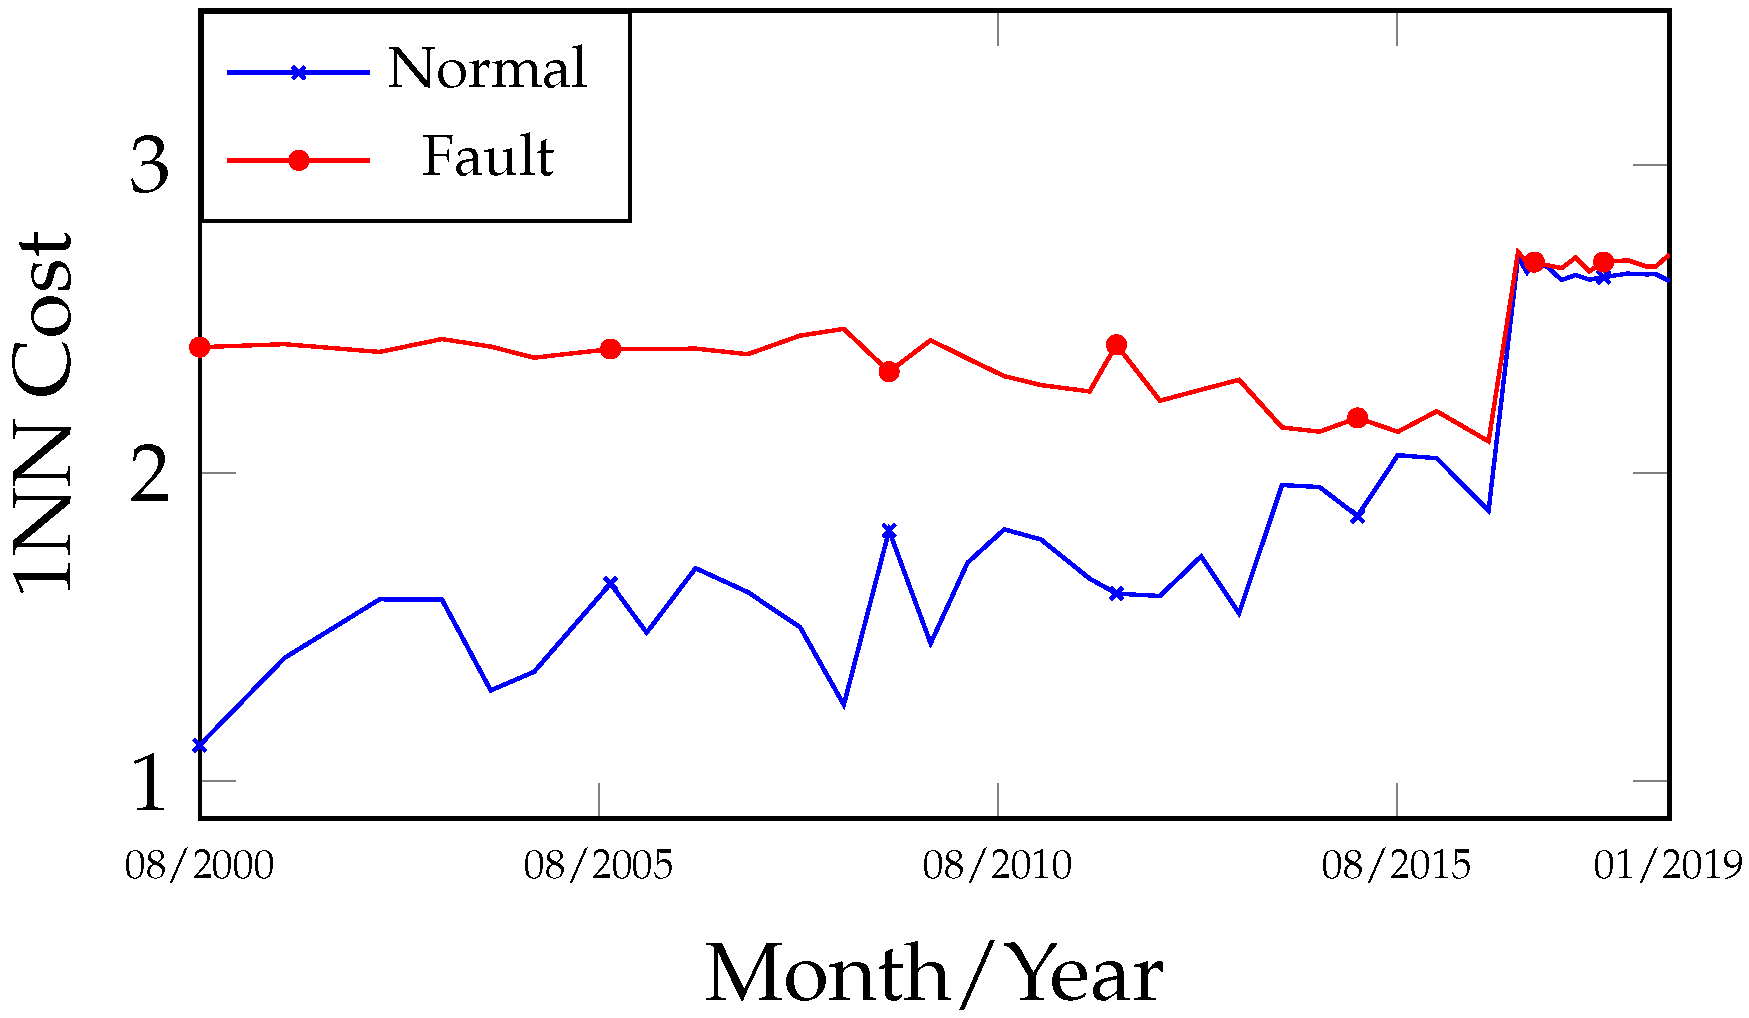
In the fault evolution curves of
Figure 19 and
Figure 20, between 7 August 2000 and 27 September 2016, it is possible to observe the convergence of the fault and normal curves as the gases evolved. On 9 February 2017, with the emergence of C
2H
2 gas in association with H
2, CH
4, and C
2H
6, a sudden convergence of the curves occurred, indicating that any variation in gas concentration could shift the state from normal to fault. Therefore, it was justifiable to adopt more rigorous monitoring. In the curves of
Figure 21 and
Figure 22, the evaluated samples are classified as normal between 7 August 2000 and 27 September 2016; however, they display a trend toward approximation with the thermal fault and distancing from the electrical fault. This behavior can be explained by the presence of CH
4 and C
2H
6, which are typical of a thermal fault at
C. It is important to note, however, that the growth of these gases may also be associated with normal operating conditions, such as equipment overload leading to stray gassing. Nevertheless, in the analyzed transformer, the presence of C
2H
2 is not typical of normal operation and should be treated with caution when detected, since it contributes to the indication of a secondary fault, which shifted to
C after 9 February 2017, as illustrated in the curves of
Figure 23 and
Figure 24. After the 1 November 2008 analysis, a decrease in gas concentration was observed, initiating a gradual separation between the normal and fault states. When comparing the results of the fault curves obtained by 1NN and OPF, the behaviors and outcomes were once again very similar.
4.2.4. Others Experiments Results
Other pieces of equipment were analyzed using the method proposed in this paper, and
Table A7 presents a summary of the predicted and actual faults identified during internal inspections (equipment opening) performed on the transformers. Analyzing the results, it can be observed that for all evaluated equipment, the diagnostic accuracy regarding fault presence—based on the analysis of the Normal vs. Fault curves—was 100.00%. For the Normal vs. Fault Thermal and Electrical condition, the accuracy reached 88.90%, while for the Normal vs. 5 Faults condition, it was 66.70%. These outcomes can be considered satisfactory, highlighting the distinguishing advantage of fault trend analysis, which reveals both primary and secondary faults. It is important to emphasize that a well-labeled dataset is a necessary prerequisite and exerts a strong influence on the final results (see
Appendix A for the table of results).
