1. Introduction
Today, more than ever in modern society, digital images play a fundamental role in the transport of information, providing evidence that is widely used in various contexts including legal proceedings, the documentation of news events, the support of scientific claims and in the way in which public opinion is shaped. Thanks to the fact that image editing tools have become increasingly accessible and sophisticated over time, image manipulation techniques have become increasingly widespread, making it necessary to adopt countermeasures to identify them. One of the most widespread and common manipulation techniques, thanks to its simplicity and effectiveness, is copy-move counterfeiting, which involves the duplication and relocation of regions within the same image [
1,
2]. The goal of this type of counterfeiting is to be able to hide objects, duplicate elements, or alter the contextual information contained in an image according to a logic aimed at significantly modifying and misleading the correct interpretation of the image [
3,
4].
Figure 1,
Figure 2 and
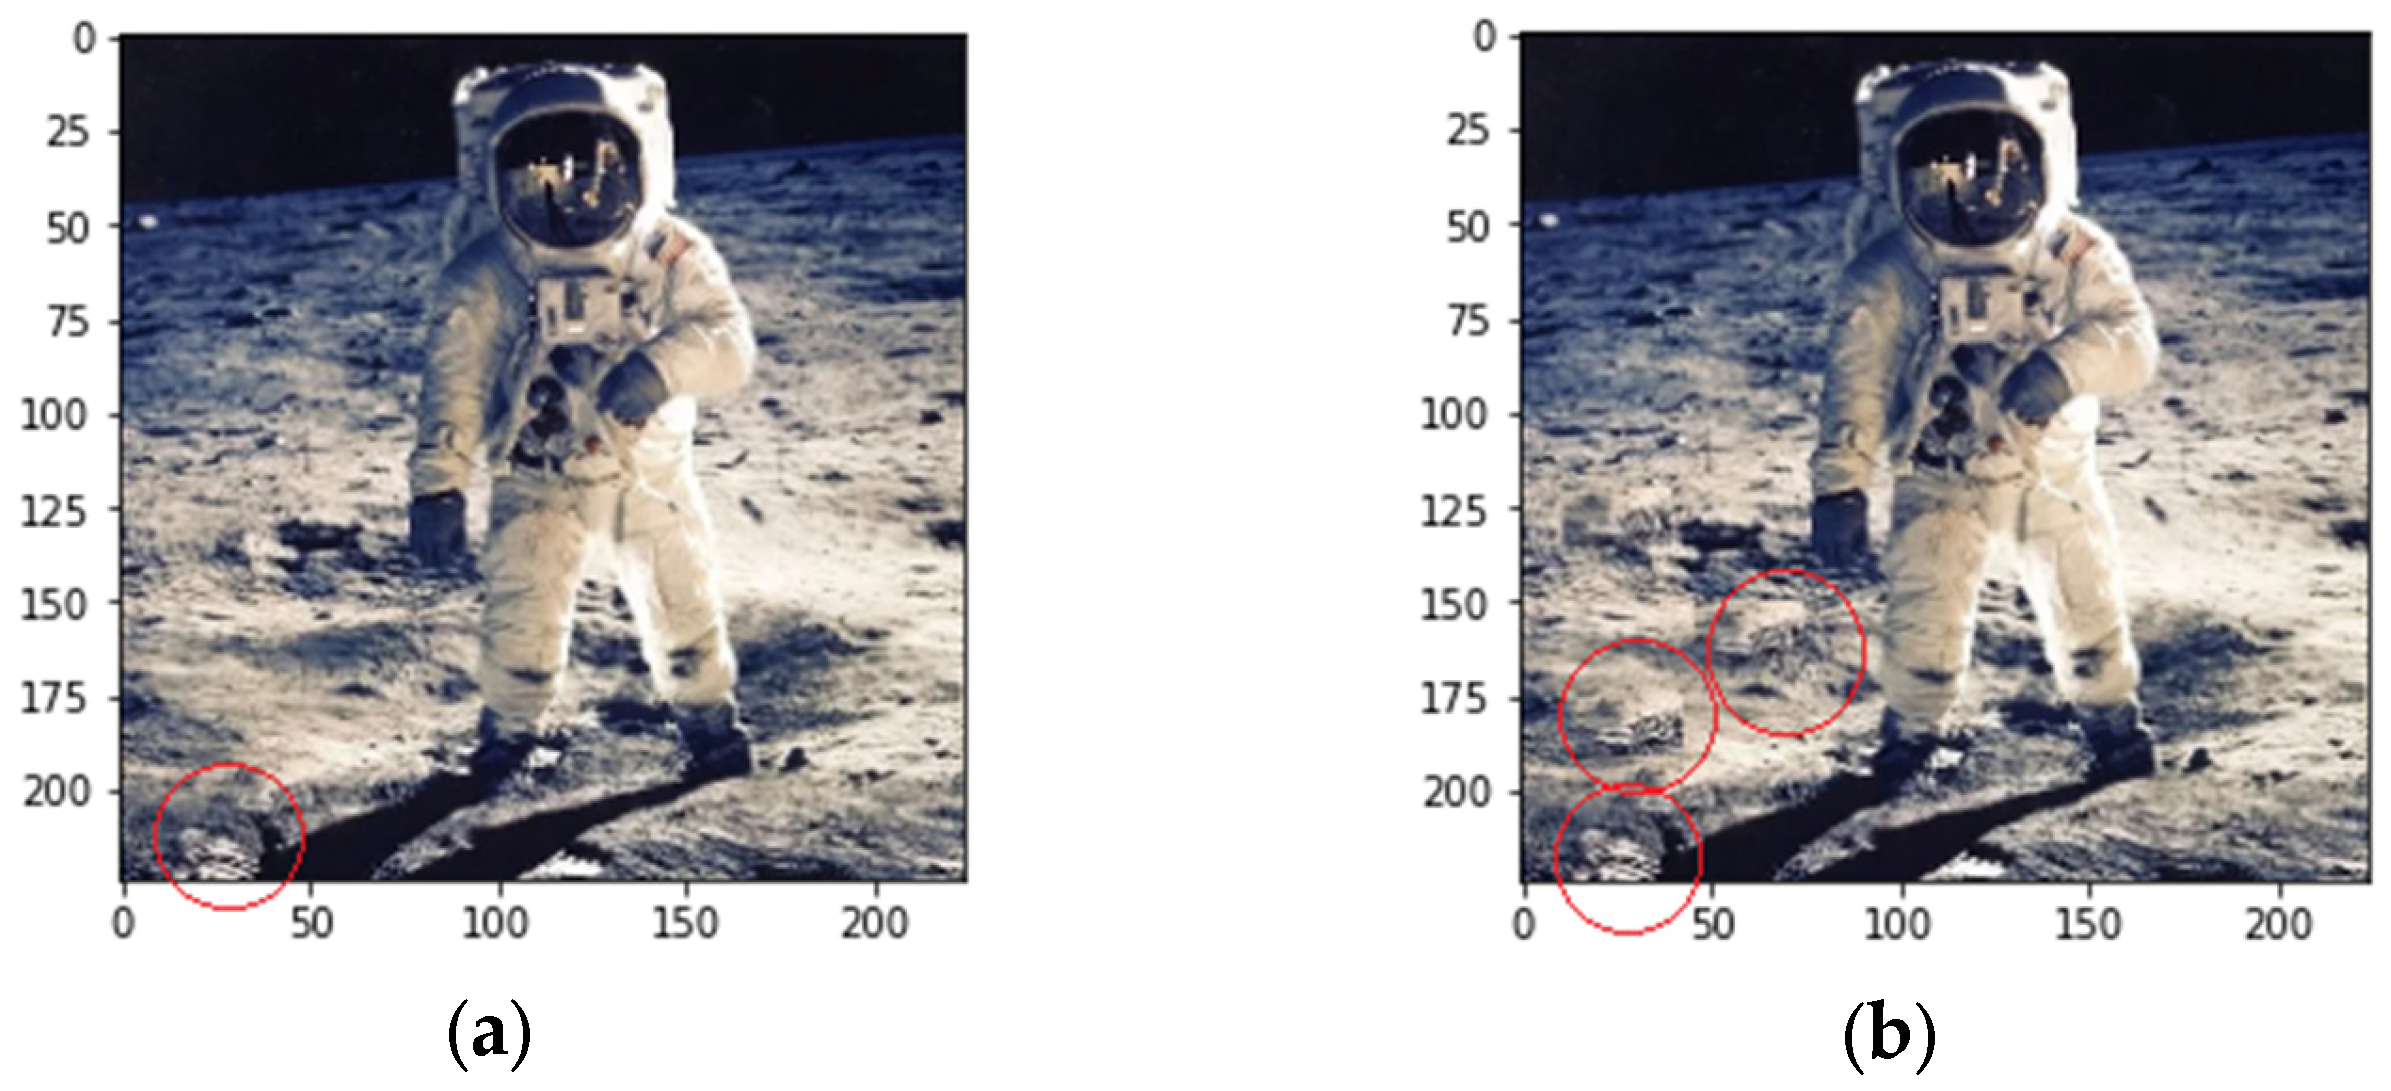
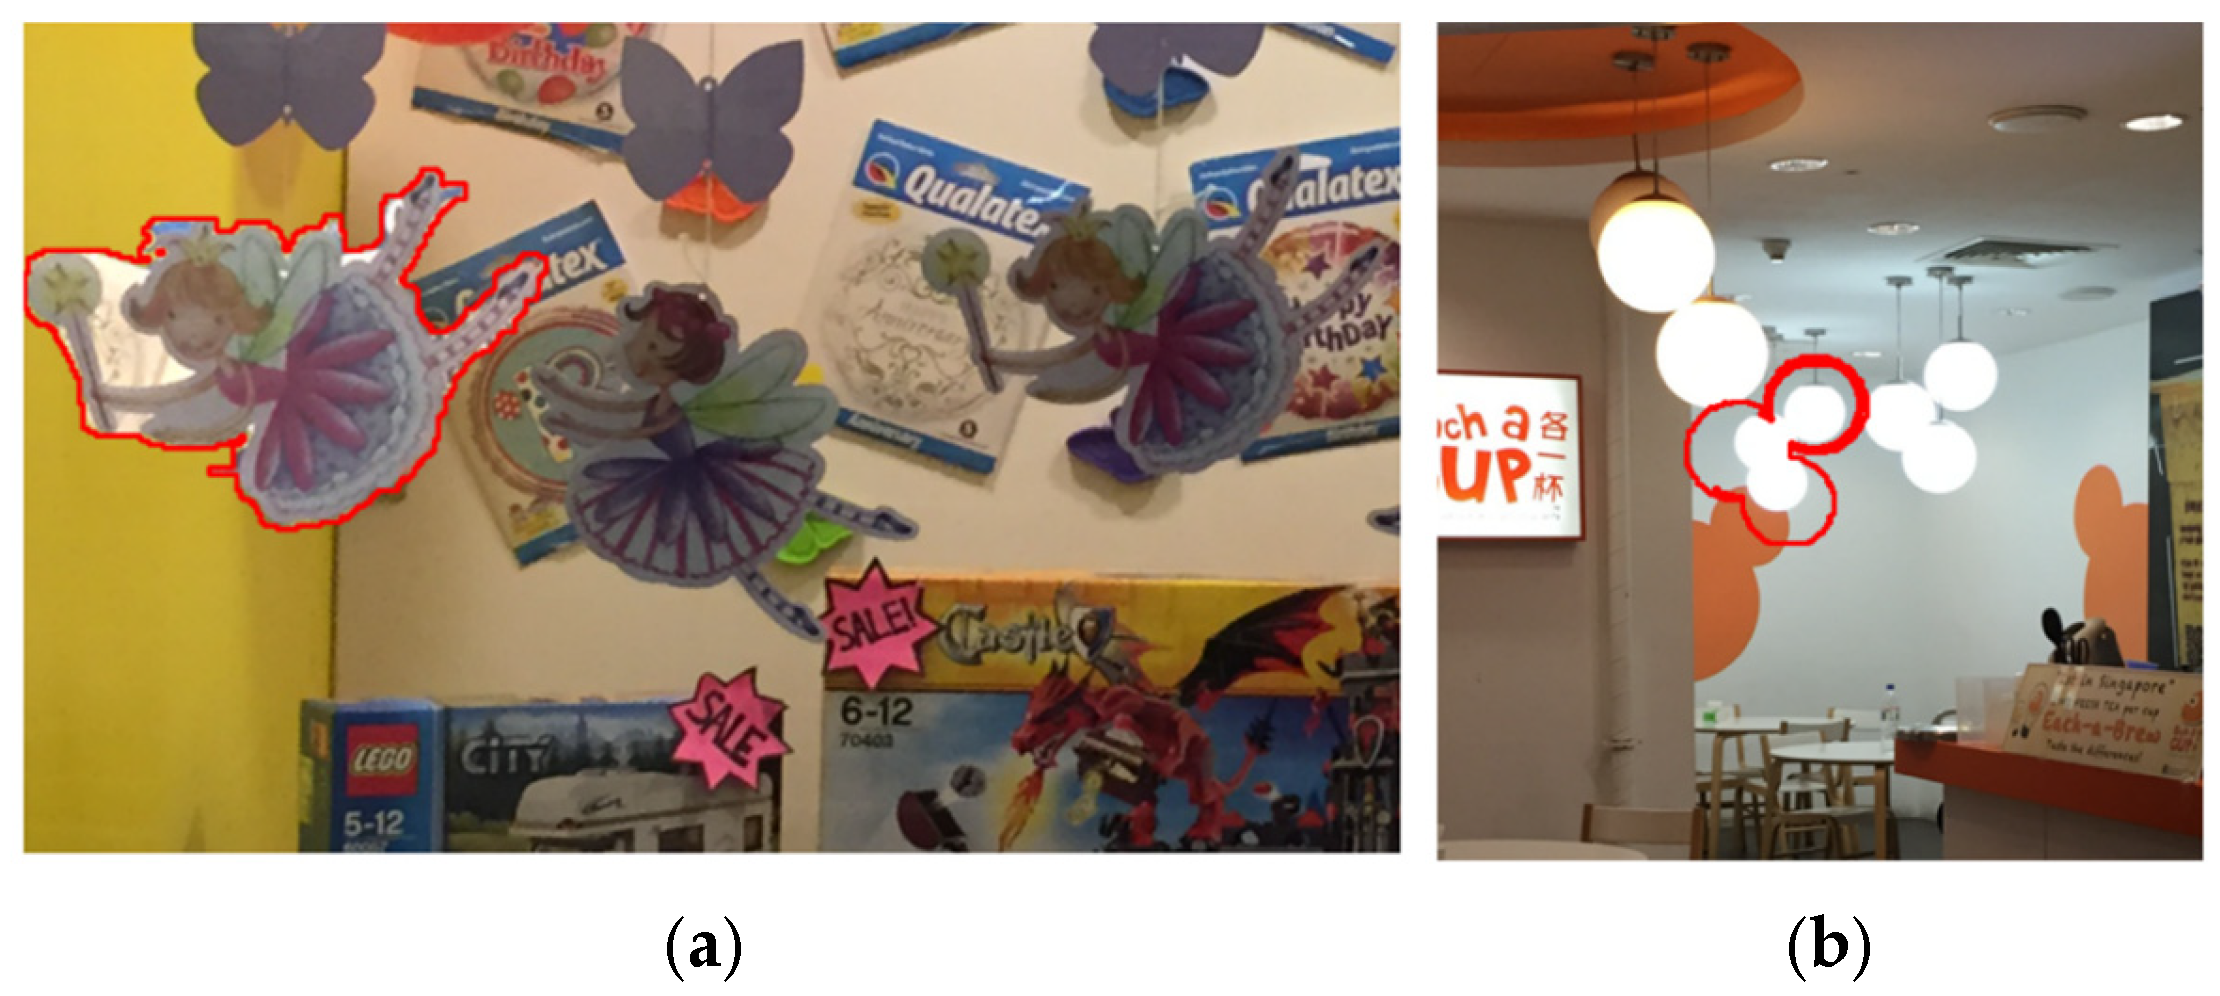
Figure 3 illustrate a typical copy-move forgery example, where regions within the same image are duplicated to alter the scene’s interpretation. As shown in the figures, the copied elements maintain consistent lighting and color characteristics, making detection challenging for both human observers and traditional forensic methods.
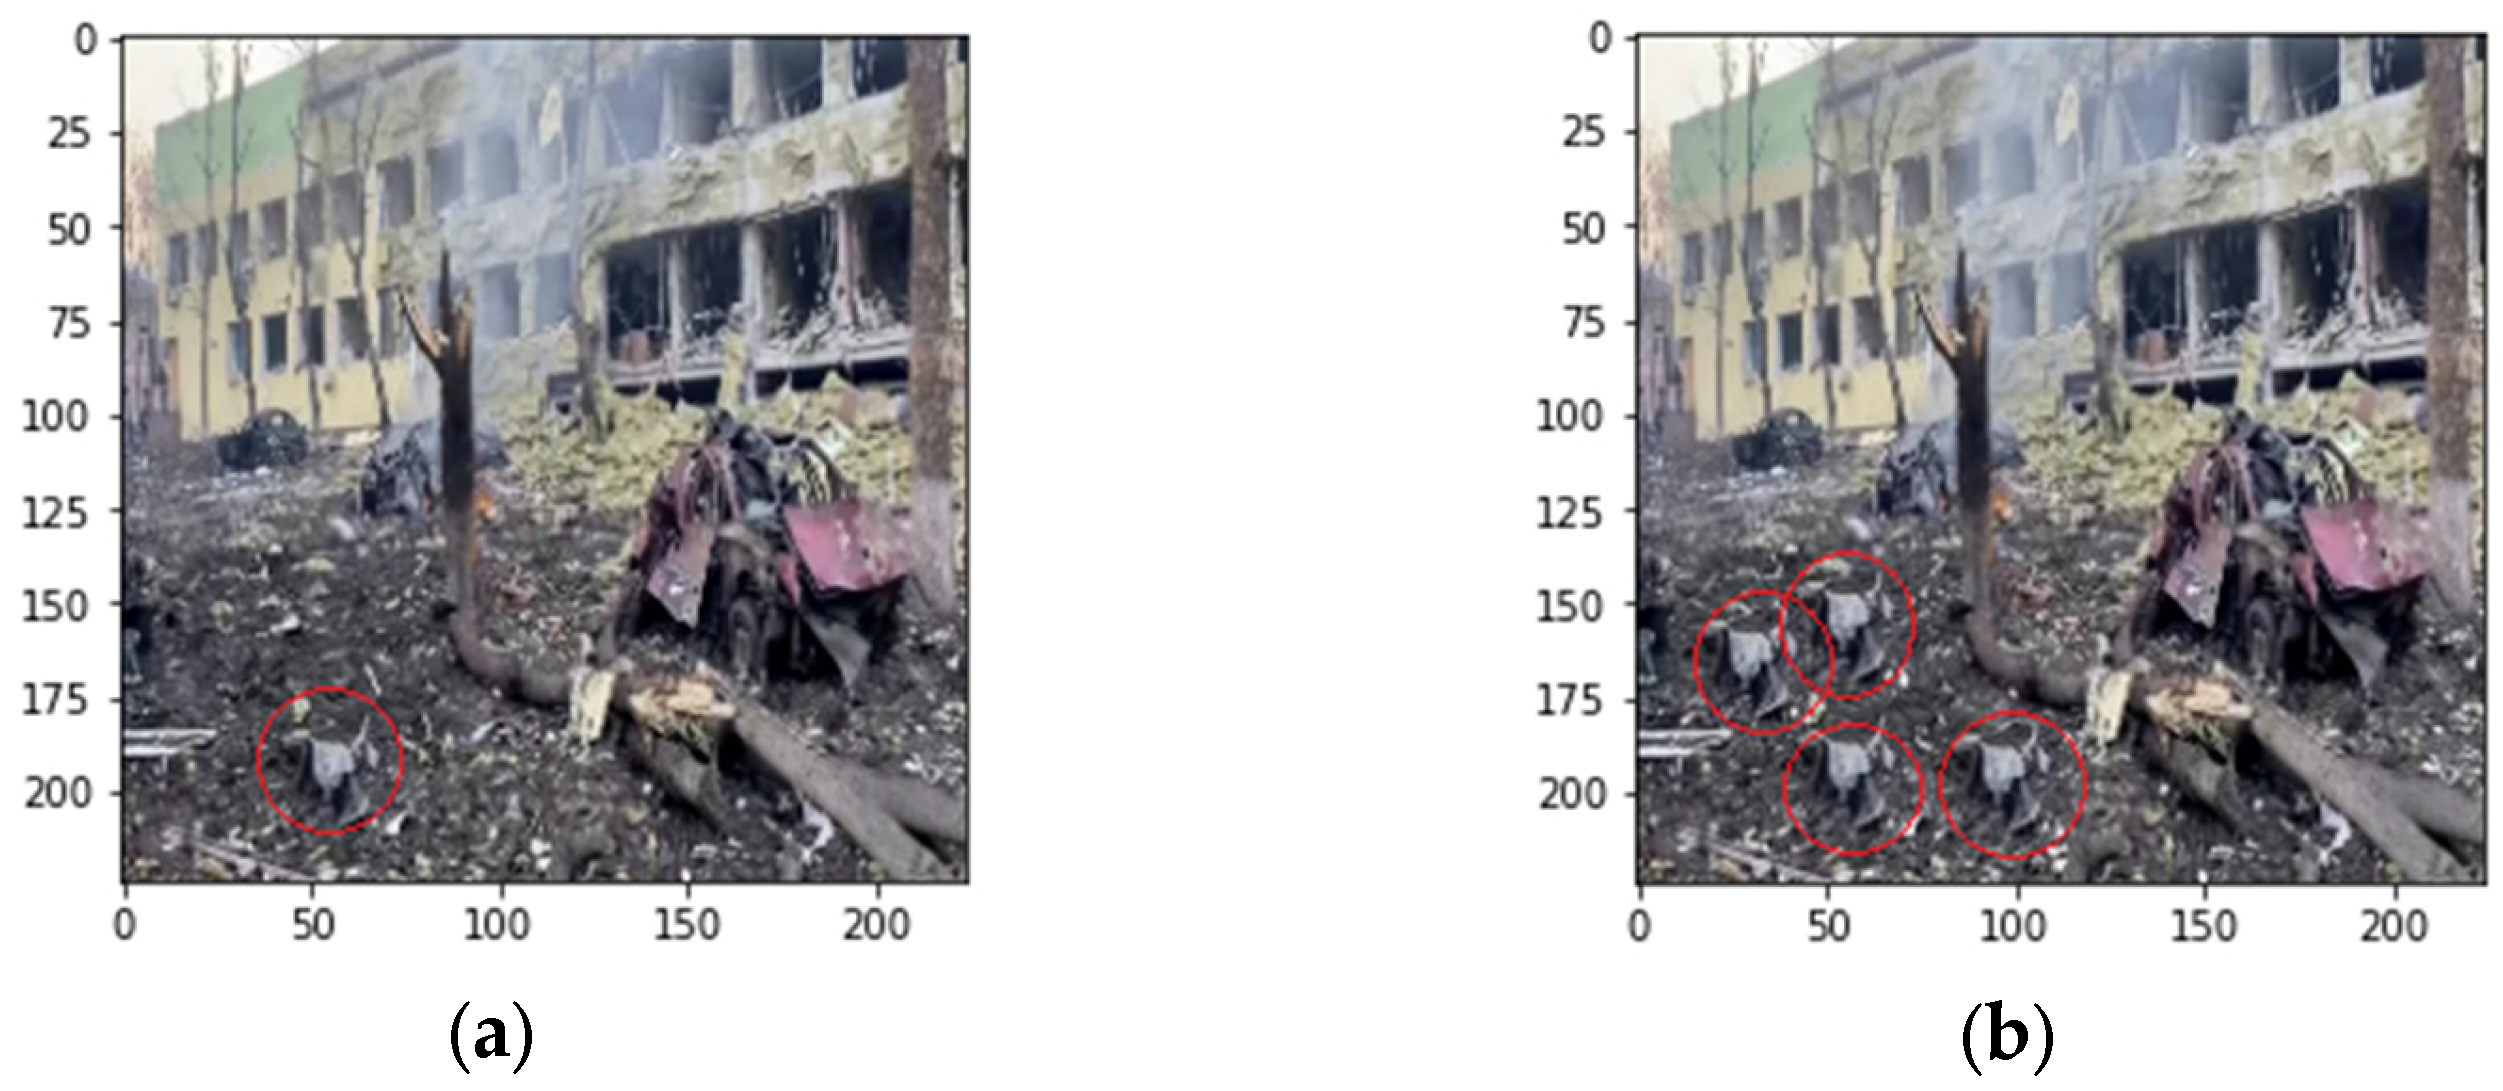
These examples highlight the sophistication of modern copy-move forgeries and their potential impact on information integrity, particularly in sensitive contexts such as military conflict reporting. Therefore, the ability to detect copy-move forgeries has become increasingly essential in various fields over time. In journalism, image manipulation can cause the spread of misinformation, thereby undermining the trust of readers and the general public. In the legal field, forged photographs can represent falsified evidence that can undermine their evaluation in litigation. Even in the world of scientific research, manipulated images pose a serious threat to the integrity of research as they can compromise it. All these concerns have motivated and stimulated a large and growing research activity related to automatic detection methods of forgeries [
5,
6]. The most traditional approaches used for copy-move forgeries detection employed block-matching algorithms, keypoint analysis or domain transformation techniques [
7,
8]. Although these methods have proven to be effective in basic image manipulation, they are ineffective when attempting to apply them to more sophisticated deception techniques, such as those involving geometric transformations, post-processing operations, or subtle visual modifications. Another limitation is also the need to manually adjust the related parameters and features, which limits their ability to adapt to very different images. Convolutional neural networks (CNNs), in the context of the advent of deep learning, are transforming the classic methods used in image forensics by enabling automatic extraction and classification of image features [
9,
10]. CNNs with their intrinsic capabilities can potentially detect even the most subtle manipulation patterns that are imperceptible to human observers or even go undetected by conventional algorithms.
2. Related Work
This section aims to review the key developments that have characterized the last decade in which there has been a remarkable evolution in copy-move forgery detection (CMFD). In particular, we will consider traditional approaches, methods based on convolutional neural networks (CNNs), and recent advances in deep learning techniques for forgery detection.
2.1. Traditional Copy-Move Forgery Detection Methods
The first approaches to copy-move forgery detection (CMFD) were essentially based on manually designed features and block-matching techniques, dividing images into overlapping blocks from which features for similarity comparison were extracted. Amerini et al. (2011) [
11] proposed a forensic method based on SIFT that turned out to be particularly effective both in detecting copy-move regions and in recovering geometric transformations, demonstrating how it is, in fact, possible to achieve a true positive rate (TPR) of 98.12% on the MICC-F600 dataset, thus establishing a benchmark for subsequent research in the field. Over time, block-based methods continued to evolve, with Babu and Rao (2022) [
12] introducing an optimized technique that relies on statistical features. Their approach is essentially characterized by two phases where the first classifies images as fake or genuine using Steerable Pyramid Transform (SPT) and Grey Level Co-occurrence Matrix (GLCM) features, and the second where the fakes are located via block-matching. This method, when tested on the CoMoFoD and CASIA datasets, showed a particular resilience against attacks due to the use of compression, scaling and rotation techniques on JPEG images. Texture-based approaches have also proven to be effective. Aydın (2022) [
13] proposed a new method that makes use of Local Intensity Order Pattern (LIOP) features extracted from YCbCr color channels. Despite the limitation highlighted above in the application of LIOP in CMFD, this approach demonstrated that it is possible to achieve high success rates on the CoMoFoD and GRIP datasets, especially when it comes to post-processing attacks. Combining features from uncorrelated color channels has indeed confirmed that it is possible to improve the achieved detection accuracy.
2.2. CNN-Based Approaches
CMFD research has gained further momentum with the emergence of deep learning techniques. Elaskily et al. (2020) [
14] introduced a CNN model specifically designed to detect copy-move forgeries, incorporating six convolutional layers with max-pooling, followed by a global mean pooling operation. Taking these considerations into account, Kuznetsov et al. (2024) [
15] subsequently comprehensively evaluated the performance of CNNs by referring to an even larger dataset. Their research went beyond detection accuracy since they also analyzed how the characteristics of the dataset influenced the performance of the model, demonstrating that factors such as the size of the dataset, the complexity of manipulation, and the consistency of image resolution actually determine the effectiveness of using CNNs in detecting copy-move forgeries. Kumar et al. (2022) [
16] instead proposed VI-NET, a hybrid model combining two architectures, VGG16, and Inception V3, demonstrating that their approach achieves an accuracy of 99 ± 0.2% on the CoMoFoD dataset using the K10 protocol, thus outperforming the results obtained by standalone architectures and purely conventional machine learning algorithms. Their work also demonstrated how strategic fusion of complementary CNN architectures can indeed be capable of improving classification performance.
2.3. Advanced Deep Learning Methods
Recent research has explored increasingly sophisticated deep learning techniques; in particular, Aria et al. (2022) [
9] introduced QDL-CMFD, an image quality-independent method using generative adversarial networks (GANs) to enhance images and a CNN architecture featuring a double branch for forgery detection. This approach, in particular, is capable of simultaneously detecting multiple forged areas, also determining their sources and targets. Experiments conducted on the CASIA and CoMoFoD datasets have demonstrated better performance compared to competing methods, with particular reference to low-quality images and small areas manipulated on them. El_Tokhy (2023) [
10] developed very accurate algorithms for forgery detection for digital X-ray images using pre-trained CNNs for feature extraction, including AlexNet, ResNet-18, and VGG-19. In particular, this research work has extended CMFD applications beyond natural images to more specialized domains, including industrial and medical imaging, demonstrating the ability of deep learning approaches to be very versatile when applied in different contexts. More recently, Wang et al. (2024) [
17] proposed DRNet, a robust detection network that relies on refining the decoupling of states one by one. This method in particular focuses on the detection of structurally complete similar regions by extracting their semantically irrelevant surface information. In particular, coarse similarity detection and surface suppression modules, along with a high-order autocorrelation scheme, have been incorporated into DRNet to improve its robustness. Compared to previously considered state-of-the-art methods, this approach has proven to be particularly effective in improving pixel-level F1 scores by 2.27%, 3.82%, and 4.60% on the USC-ISI CMFD, CASIA CMFD, and CoMoFoD datasets considered, respectively. The integration of Vision Transformers (ViT) with deep learning still represents the cutting edge of CMFD research. Ravula and Singh (2025) [
18] proposed a framework called GAN-ViT-CMFD that combines GANs and ViTs with spectral clustering. In particular, GANs are responsible for generating realistic forged images to improve model robustness, while ViTs are responsible for extracting powerful feature representations capable of capturing long-range dependencies. This hybrid approach achieved an accuracy of 99.02% with a precision of 97.92% and a ROC-AUC score of 99.88%, fully demonstrating the potential of transformer-based architectures in counterfeit detection.
2.4. Dataset Challenges and Comparative Analysis
Despite the significant progress reported in the literature that refers to CMFD techniques, there are still some particular difficulties in their generalization ability when applied to very different datasets. Benchmarking has revealed substantial variations in the obtained performances that are strictly related to the characteristics of the dataset, such as set size, class balance and manipulation complexity. Most recent studies make explicit use of specific and standard benchmark datasets to evaluate their approaches, including CoMoFoD, CASIA, and MICC. However, there is a significant lack of systematic analysis on how specific dataset characteristics affect detection performance. Research by Kuznetsov et al. (2024) [
15] fills this gap by providing an evaluation of the performance achieved by their CNN model across multiple datasets with very different characteristics. Their results highlight the fact that models that achieve high accuracy on one dataset often perform poorly when tested on other datasets, highlighting the particular need for methods that are more robust and dataset-independent. Unfortunately, some datasets, such as Coverage, which consists of only 200 images, pose particular and unique challenges for all deep learning techniques, which generally require a large amount of training data as a fundamental prerequisite. Although it has been shown that the application of different data augmentation techniques can help to minimize some of these limitations, their effectiveness can vary significantly, not only depending on the details in terms of their implementation but also on the intrinsic characteristics that characterize each dataset.
2.5. Research Gaps and Our Contribution
Our review of related works revealed several gaps in this specific research field. First, while several studies have proposed very advanced CMFD methods, systematic comparative analyses conducted on multiple datasets remain very limited. Second, the impact of regularization techniques and augmentation strategies on the performance of CNNs for CMFD has not been studied very well. Third, the relationship between dataset features and model performance requires further investigation to develop new detection approaches that are more adaptive and robust. In this paper, we address these particular gaps by providing a comprehensive evaluation of CNN performance on three different specific datasets: CoMoFoD, Coverage, and CASIA v2. We provide a systematic analysis of how dataset features concretely influence detection accuracy, and we also examine the effectiveness of various training strategies, regularization techniques, and augmentation approaches. Our research aims to be a reference that aims to provide new practical guidelines for implementing CNN-based systems that are particularly effective in copy-move forgery detection, that is, that are able to adapt to different image features and forgery types.
3. Methodology
In this section, we describe in detail the experimental framework we used to evaluate convolutional neural networks (CNNs) in copy-move forgery detection. We, therefore, present the CNN architecture, datasets, training strategies, and evaluation metrics we used in our study.
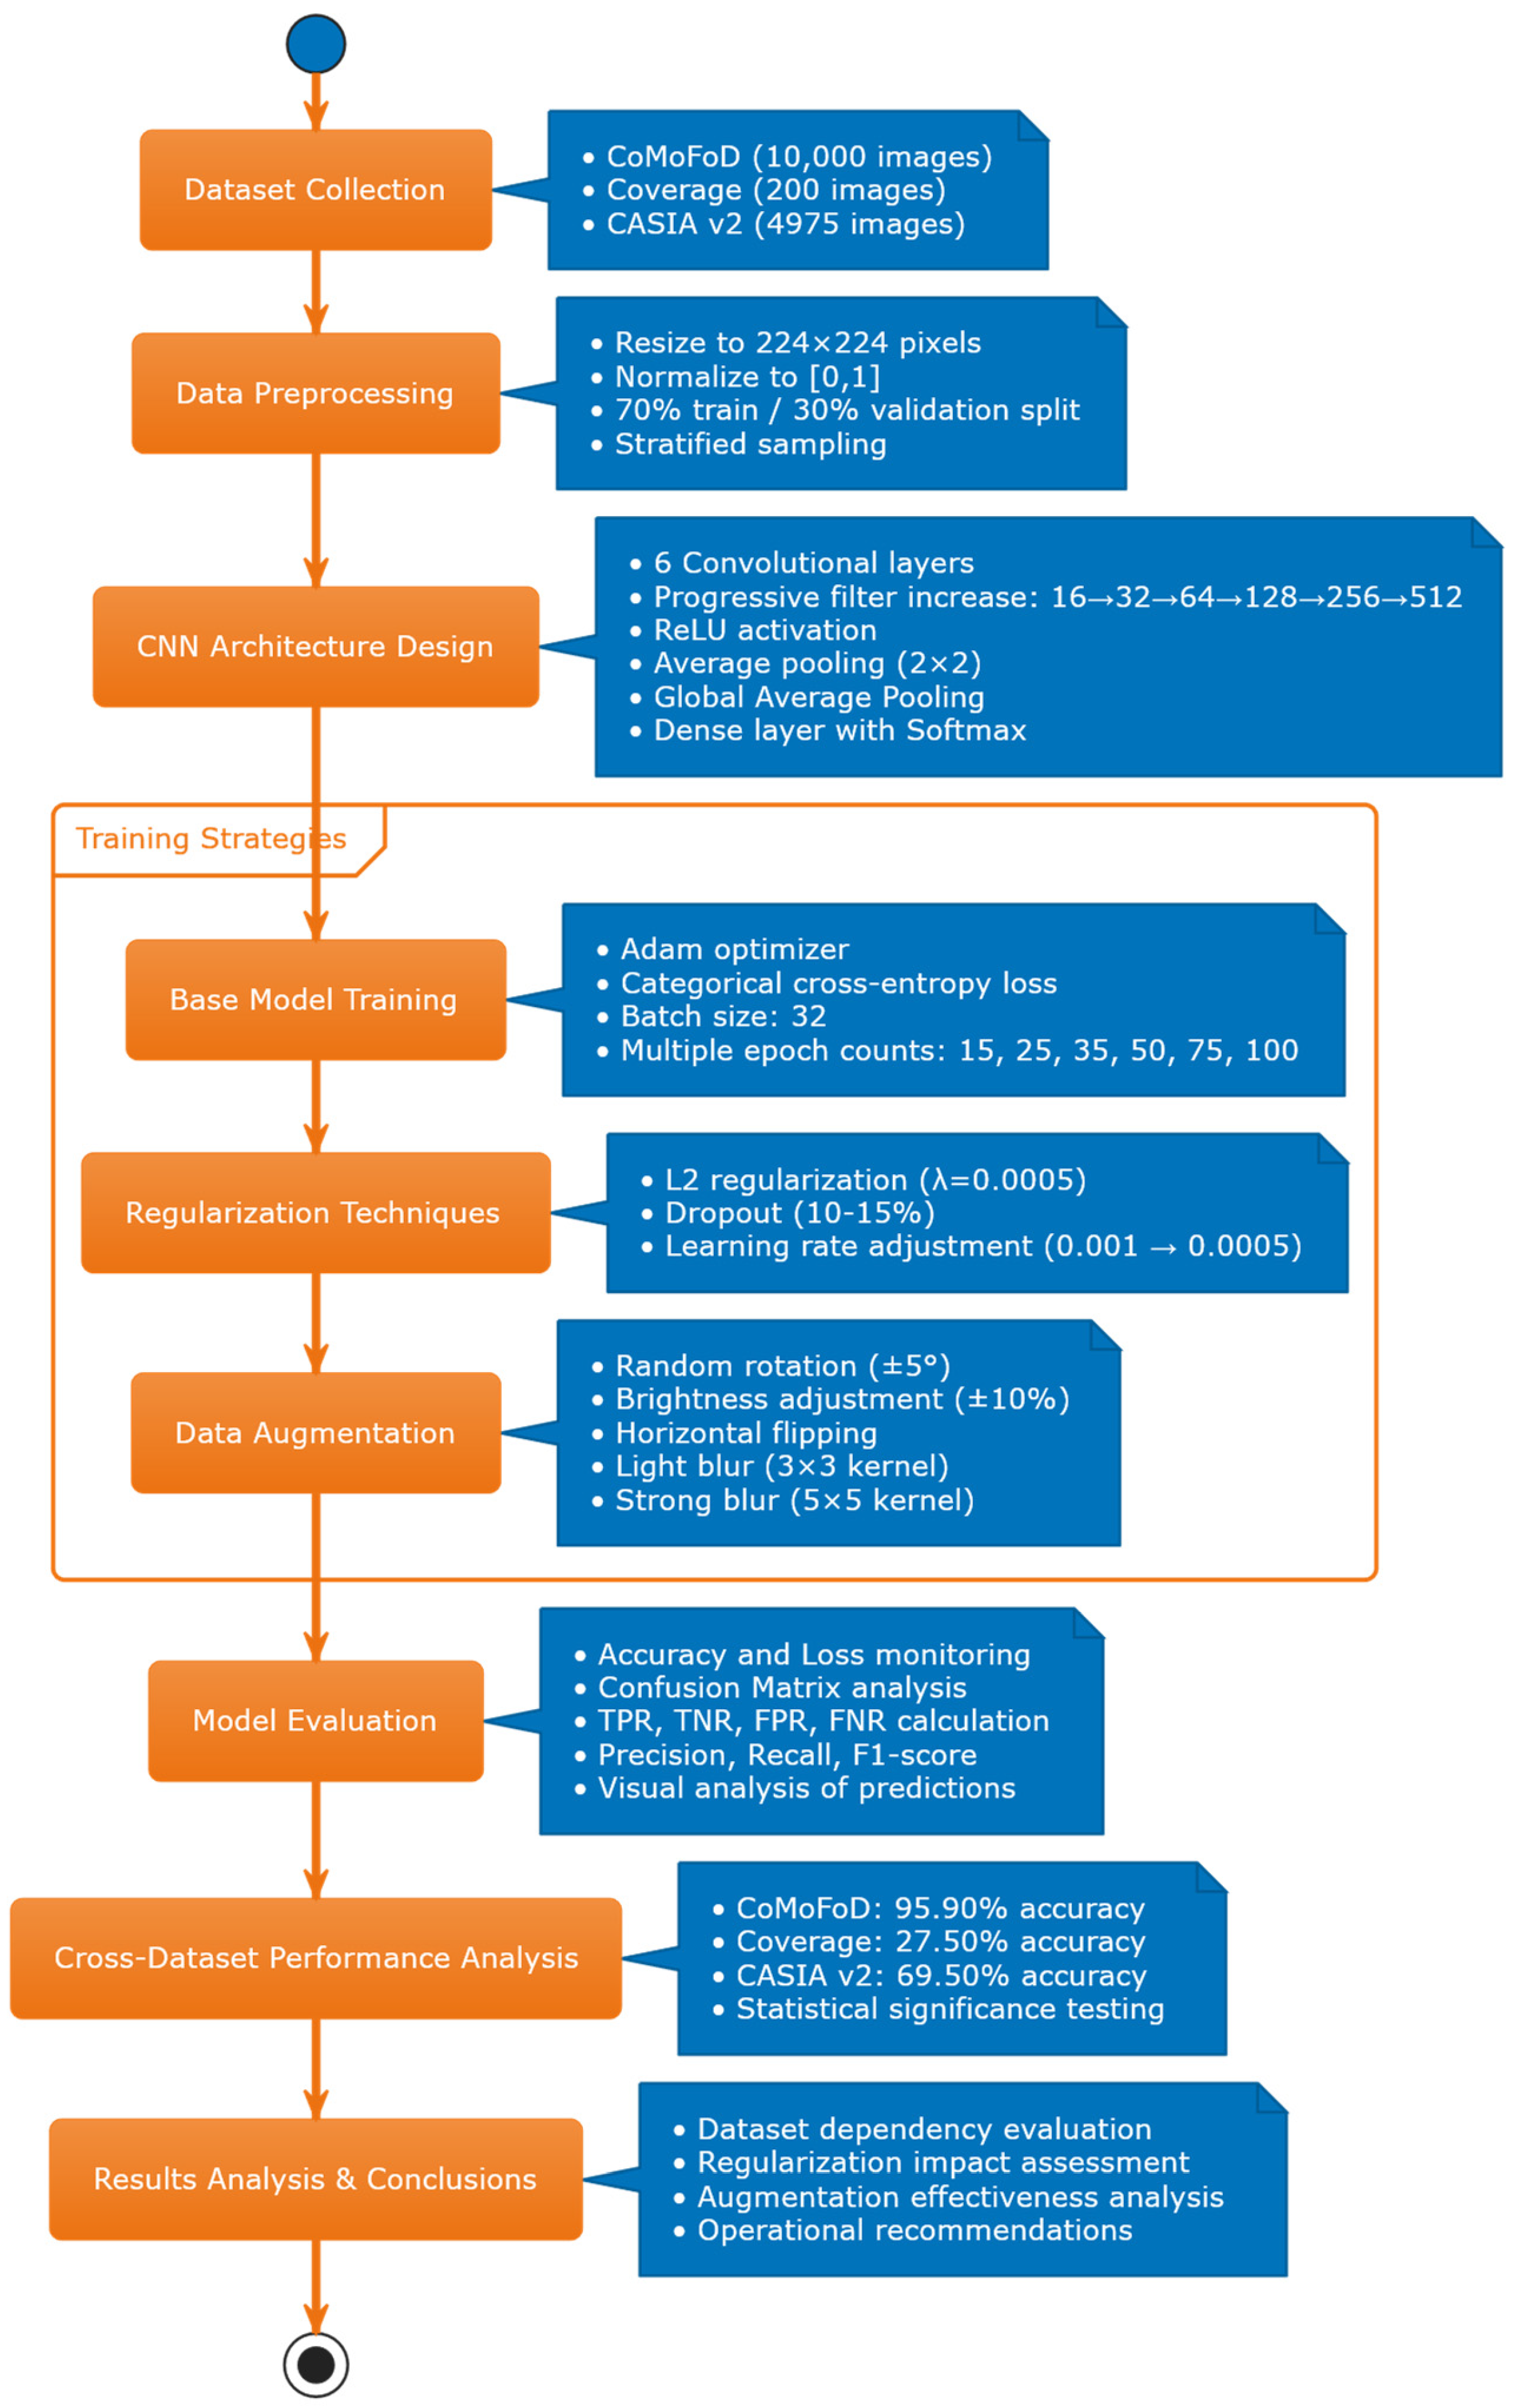
Figure 4 presents the overall methodology flowchart, illustrating the systematic approach from dataset preparation through model evaluation.
3.1. CNN Architecture
The CNN model we implemented in our study is a sequential one and has been specifically designed to classify images in a binary way, distinguishing them between authentic and tampered ones, following the architecture initially proposed by Elaskily et al. (2020) [
14] and Kuznetsov et al. (2024) [
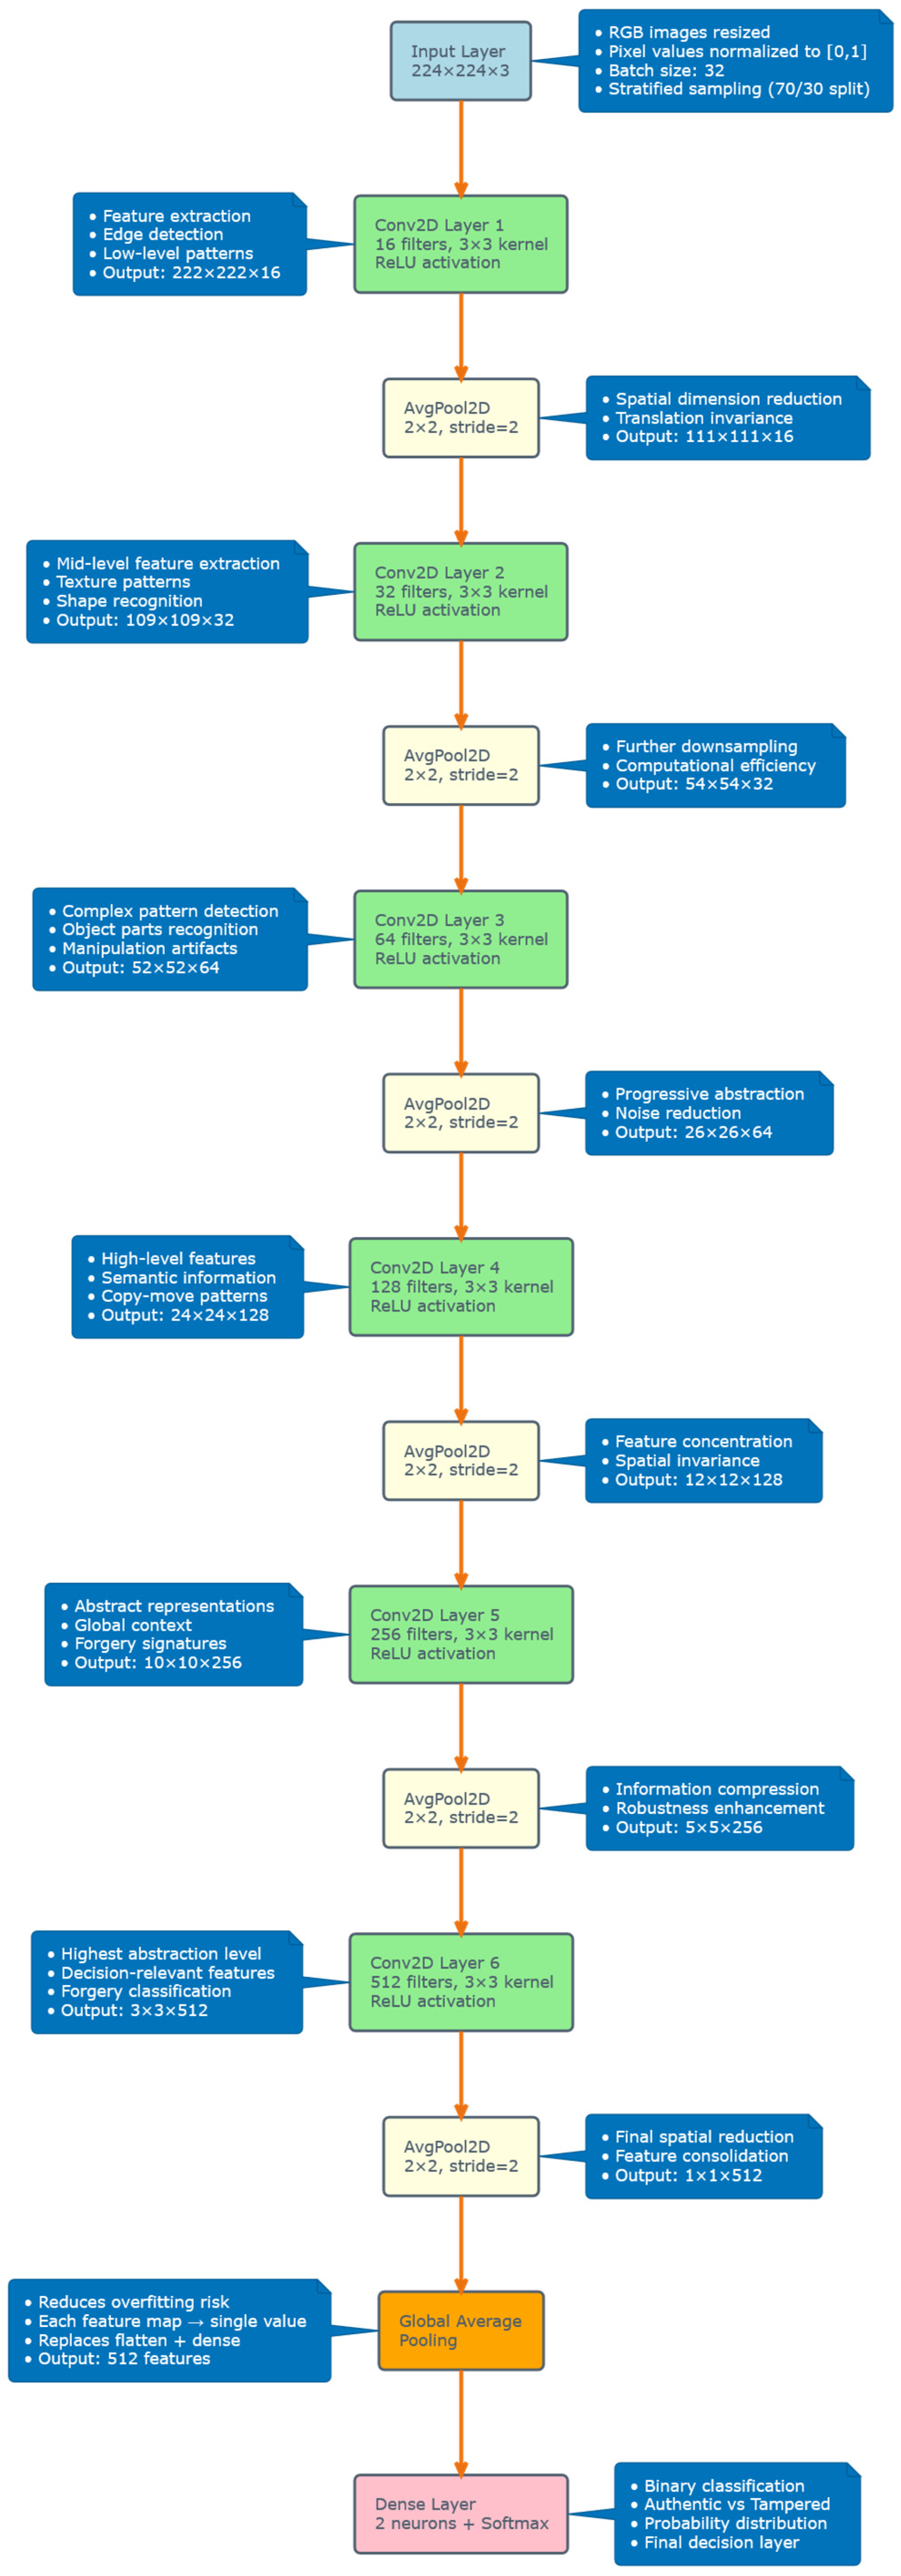
15]. In particular, the architecture we used is composed of six convolutional layers followed by pooling operations, which culminate in a global mean pooling layer and a dense output layer. Each convolutional layer uses filters that have a kernel size of 3 × 3 and a Rectified Linear Unit (ReLU) activation function. The number of implemented filters increases progressively along the network structure to ensure that hierarchical features are captured across multiple abstraction levels. The first level is characterized by 16 filters, while the subsequent cascading levels employ 32, 64, 128, 256, and 512 filters, respectively. After each convolutional layer, we apply max-pooling operations characterized by a pool size of 2 × 2 and a stride of 2 to ensure that spatial dimensions are reduced while preserving essential features. In particular, we found that applying this dimensionality reduction not only improves computational efficiency but also helps extract more robust representations. The architecture is completed with a final Global Average Pooling (GAP) layer that reduces each feature map to a single value, thus drastically reducing the number of parameters compared to traditional fully connected approaches. This design choice manages to improve the generalization capacity of the model while reducing the risk of overfitting. The dense layer placed at the end of the model is composed of two neurons with softmax activation, which return the probability distributions between the binary classes’ authentic images or tampered images. The complete network structure is illustrated in [
15], featuring approximately 1.57 million trainable parameters.
Table 1 and
Figure 5 illustrate the complete CNN architecture used in our study, showing the sequential arrangement of convolutional layers, pooling operations, and the final classification layers.
3.2. Datasets
Our experiments utilize three widely recognized benchmark datasets for copy-move forgery detection: CoMoFoD, Coverage, and CASIA v2. Each dataset presents unique characteristics and challenges.
These three datasets were specifically selected to represent different challenges in copy-move forgery detection: CoMoFoD provides a large-scale balanced dataset ideal for comprehensive training; Coverage offers complex, subtle manipulations that test detection limits; and CASIA v2 presents real-world scenarios with class imbalance. This combination allows for thorough evaluation of model generalizability across varying dataset characteristics, which is more representative than using datasets with similar properties, such as MICC-F220.
3.2.1. CoMoFoD Dataset
The CoMoFoD (Copy-Move Forgery Detection) dataset consists of 10,000 images divided into two categories: authentic images and tampered images, balanced in number.
The tampered images contain copy-move manipulations along with various post-processing operations, including JPEG compression, noise addition, blurring, brightness modifications, color reduction, and contrast adjustment.
Overall, thanks to its complete nature and the balanced distribution of the classes it is composed of, this dataset has the function of being the main testbed.
3.2.2. Coverage Dataset
The Coverage (Copy-Move Forgery Database) dataset contains 200 images total, organized in 100 original–tampered pairs. Each pair is accompanied by three mask types (copy source, forged region, and paste destination) that identify manipulated regions. This dataset is smaller but includes complex and subtle manipulations that present significant detection challenges.
3.2.3. CASIA v2 Dataset
The CASIA v2 (CASIA Tampered Image Detection Evaluation Database v2.0) consists of 4975 images, with 1701 authentic and 3274 tampered images. Regarding the experiments we conducted, due to computational constraints, we used a balanced subset composed of 3000 images, of which 1000 were authentic and 2000 were tampered with.
3.2.4. Data Preprocessing
To ensure compatibility with our CNN architecture, all the images of the dataset considered were appropriately resized into 224 × 224-pixel images and normalized the pixel values to the interval [0, 1] by dividing by 255. For each dataset, we used 70% of the images for training and the remaining 30% for validation, respectively, also ensuring a stratified sampling to maintain the distribution of the classes between the subdivisions.
3.3. Training Strategies
Within our training strategy, we chose to use the Adam optimizer for all experiments, considering its capabilities in adaptive learning and its proven performance robustness in deep learning applications. In particular, the optimizer operates with the categorical cross-entropy loss function, which is particularly appropriate for our binary classification task. The model performance was systematically evaluated considering different training epochs: 15, 25, 35, 50, 75 and 100. This progressive approach allowed us not only to analyze the learning dynamics but also to identify the optimal training duration for each dataset. The batch size was set to 32 samples in order to represent a good compromise in terms of balance between memory efficiency and stable gradient updates. The model was initialized using the default Glorot uniform initialization method, which defines the initial weights based on the size of the inputs and the outputs of each layer composing the network. During training at each epoch, we paid particular attention to monitoring both the training and validation metrics (accuracy and loss) to identify any potential overfitting. We also used a fixed random seed (equal to 123) that was the same for all experiments in order to ensure the reproducibility of the results we obtained.
3.4. Regularization Techniques
To mitigate possible overfitting and, at the same time, to improve the generalization of the model, we also explored different regularization techniques:
3.4.1. L2 Regularization
We implemented L2 weight decay regularization to penalize high weight values in the network and consequently add the regularization term to the loss function, which is defined as follows:
where
represents the parameter that represents the individual weight values with which the intensity of the regularization is defined, which in our experiments we set to 0.0005.
3.4.2. Dropout
We experimented with dropout regularization, randomly deactivating 10–15% of neurons in terminal layers during training. This technique prevents co-adaptation of neurons and improves generalization by forcing the network to learn more robust features. The implementation follows the standard dropout equation:
where
Here, represents the probability of retaining a neuron during training (0.85–0.90 in our implementation).
3.4.3. Learning Rate Adjustment
We considered and then studied the impact of learning rate variations on the model performance; maintaining the adaptive nature of the Adam optimizer, we compared the default learning rate (0.001) with a reduced rate of 0.0005 to be able to evaluate the effect on the model both on the stability of convergence and on its final performance.
3.5. Data Augmentation
To improve the robustness of the model concerning possible variations in images representing the real world, we used data augmentation techniques to artificially expand the training dataset at our disposal.
3.5.1. Standard Augmentation
Our standard augmentation pipeline included:
Rotation: ±5° (0.03 radians) applied probabilistically;
Brightness adjustment: ±10% variation range;
Horizontal flipping: 50% probability;
Multiple transformations could be applied to the same image during training.
These transformations were applied probabilistically during training, generating variations while preserving the essential content of the images.
3.5.2. Blur Filtering
Two distinct blur filtering strategies were implemented as pre-processing steps for augmented images:
Light blur (3 × 3): Implemented via average pooling operation with a 3 × 3 kernel size and stride of 1, preserving more detail while reducing noise;
Strong blur (5 × 5): More aggressive smoothing using a 5 × 5 kernel, helping to attenuate artifacts potentially introduced by augmentation.
The detailed implementation of these blur functions is provided in
Appendix A.
The blur functions were implemented as follows:
These filtering approaches were selectively applied to augmented images to evaluate their effect on mitigating potential distortions introduced by augmentation while preserving forensically relevant features.
3.6. Evaluation Metrics
The evaluation of the model’s performance was conducted on different datasets and experimental setups using a comprehensive set of evaluation metrics.
3.6.1. Accuracy and Loss
We monitored both the training and validation accuracy and loss during the entire training phase of the model.
In particular, the accuracy represents the percentage of images correctly classified, while the loss (categorical cross-entropy) quantifies the error committed in the prediction. These metrics provide general performance indicators that are particularly useful for identifying potential cases of overfitting that may occur when the training and validation metrics diverge.
3.6.2. Confusion Matrix Analysis
For detailed performance assessment, we constructed confusion matrices for each experiment, extracting the following:
True Positives (TP): Correctly identified tampered images;
True Negatives (TN): Correctly identified authentic images;
False Positives (FP): Authentic images incorrectly classified as tampered;
False Negatives (FN): Tampered images incorrectly classified as authentic.
3.6.3. Performance Metrics
From these confusion matrix components, we calculated:
True Positive Rate (TPR, Recall, Sensitivity): ;
True Negative Rate (TNR, Specificity): ;
False Positive Rate (FPR): ;
False Negative Rate (FNR): ;
Precision: ;
F1-Score: .
These metrics allow for nuanced performance analysis beyond simple accuracy, revealing specific strengths and weaknesses of the model in correctly identifying authentic and tampered images.
3.6.4. Visual Analysis
To complement quantitative metrics, we conducted visual analyses of model predictions, examining correctly and incorrectly classified examples to identify patterns in model successes and failures. This qualitative assessment provided insights into the types of manipulations that pose particular challenges to the model.
3.7. Experimental Protocol
Our experiments followed a systematic protocol to ensure fair comparison across datasets and configurations:
Dataset preparation with consistent preprocessing;
Baseline model training without regularization or augmentation;
Progressive training with increasing epoch counts;
Comparative analysis with different regularization techniques;
Evaluation of data augmentation impact;
Cross-dataset performance comparison;
Comprehensive metric calculation and analysis.
For each configuration, we repeated experiments three times with different random initializations and reported average performance to ensure statistical reliability. Statistical significance of performance differences was evaluated using paired t-tests (p < 0.05) across three independent runs with different random initializations. The performance differences between datasets (CoMoFoD vs. Coverage: p < 0.001; CoMoFoD vs. CASIA v2: p < 0.001) were statistically significant, confirming that observed variations are not due to random fluctuations. This methodology ensures robust evaluation of CNN capabilities in copy-move forgery detection across diverse dataset characteristics.
4. Experimental Results
This section presents a comprehensive analysis of the CNN model’s performance across three datasets: CoMoFoD, Coverage, and CASIA v2. We examine the impact of training duration, regularization techniques, and data augmentation strategies on detection accuracy.
4.1. Performance on CoMoFoD Dataset
The CoMoFoD dataset yielded the most promising results among all tested datasets.
Table 2 summarizes the performance metrics across different training durations.
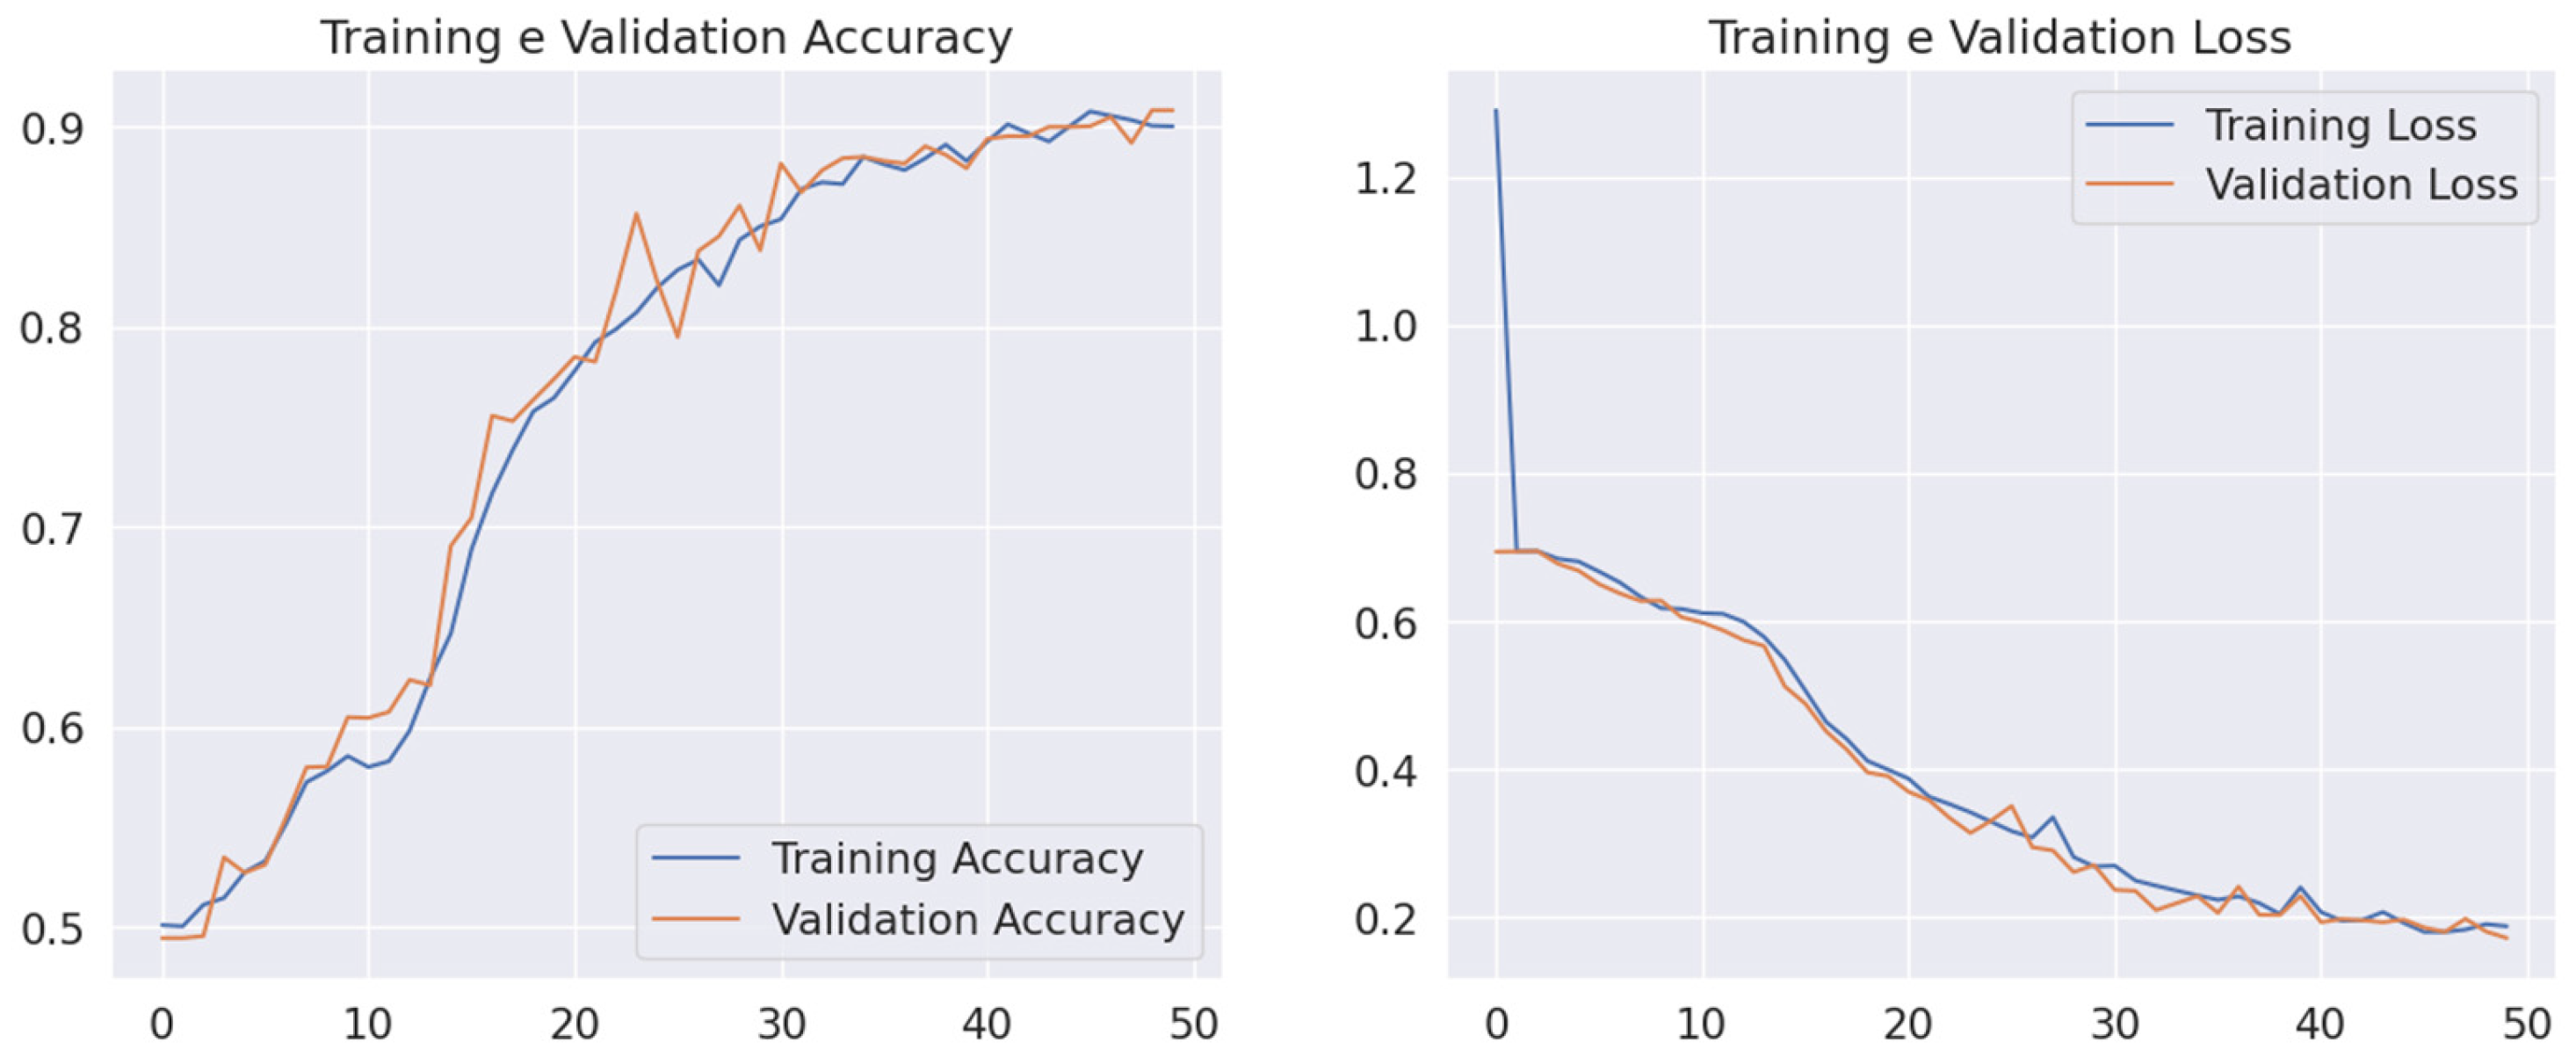
The results demonstrate a consistent improvement in accuracy as training progressed from 15 to 100 epochs. The most significant performance gain occurred between 25 and 50 epochs, where accuracy increased from 81.55% to 94.80%. Beyond 50 epochs, the improvement became incremental, suggesting a point of diminishing returns.
Figure 6 illustrates the training and validation accuracy/loss curves for the 50-epoch training session, which represents an optimal balance between performance and computational efficiency.
4.1.1. Impact of Regularization on CoMoFoD Performance
We evaluated the effect of L2 regularization and learning rate adjustment on model performance using the CoMoFoD dataset.
Table 3 summarizes these results at 50 epochs.
It is particularly interesting to note that the baseline model without explicit regularization achieved the highest performance on this dataset, thus suggesting that the proposed architecture is still intrinsically able to handle the complexity of the CoMoFoD dataset very effectively without the need for additional regularization. The introduction of L2 regularization and the reduction in the learning rate slightly decreased the model performance, highlighting that these techniques may have limited the model’s ability to capture the features deemed most relevant for this specific dataset.
4.1.2. Data Augmentation Effects on CoMoFoD
Our initial experiments using the augmented data yielded unexpected results, prompting us to further investigate.
Table 4 presents performance metrics with different augmentation strategies.
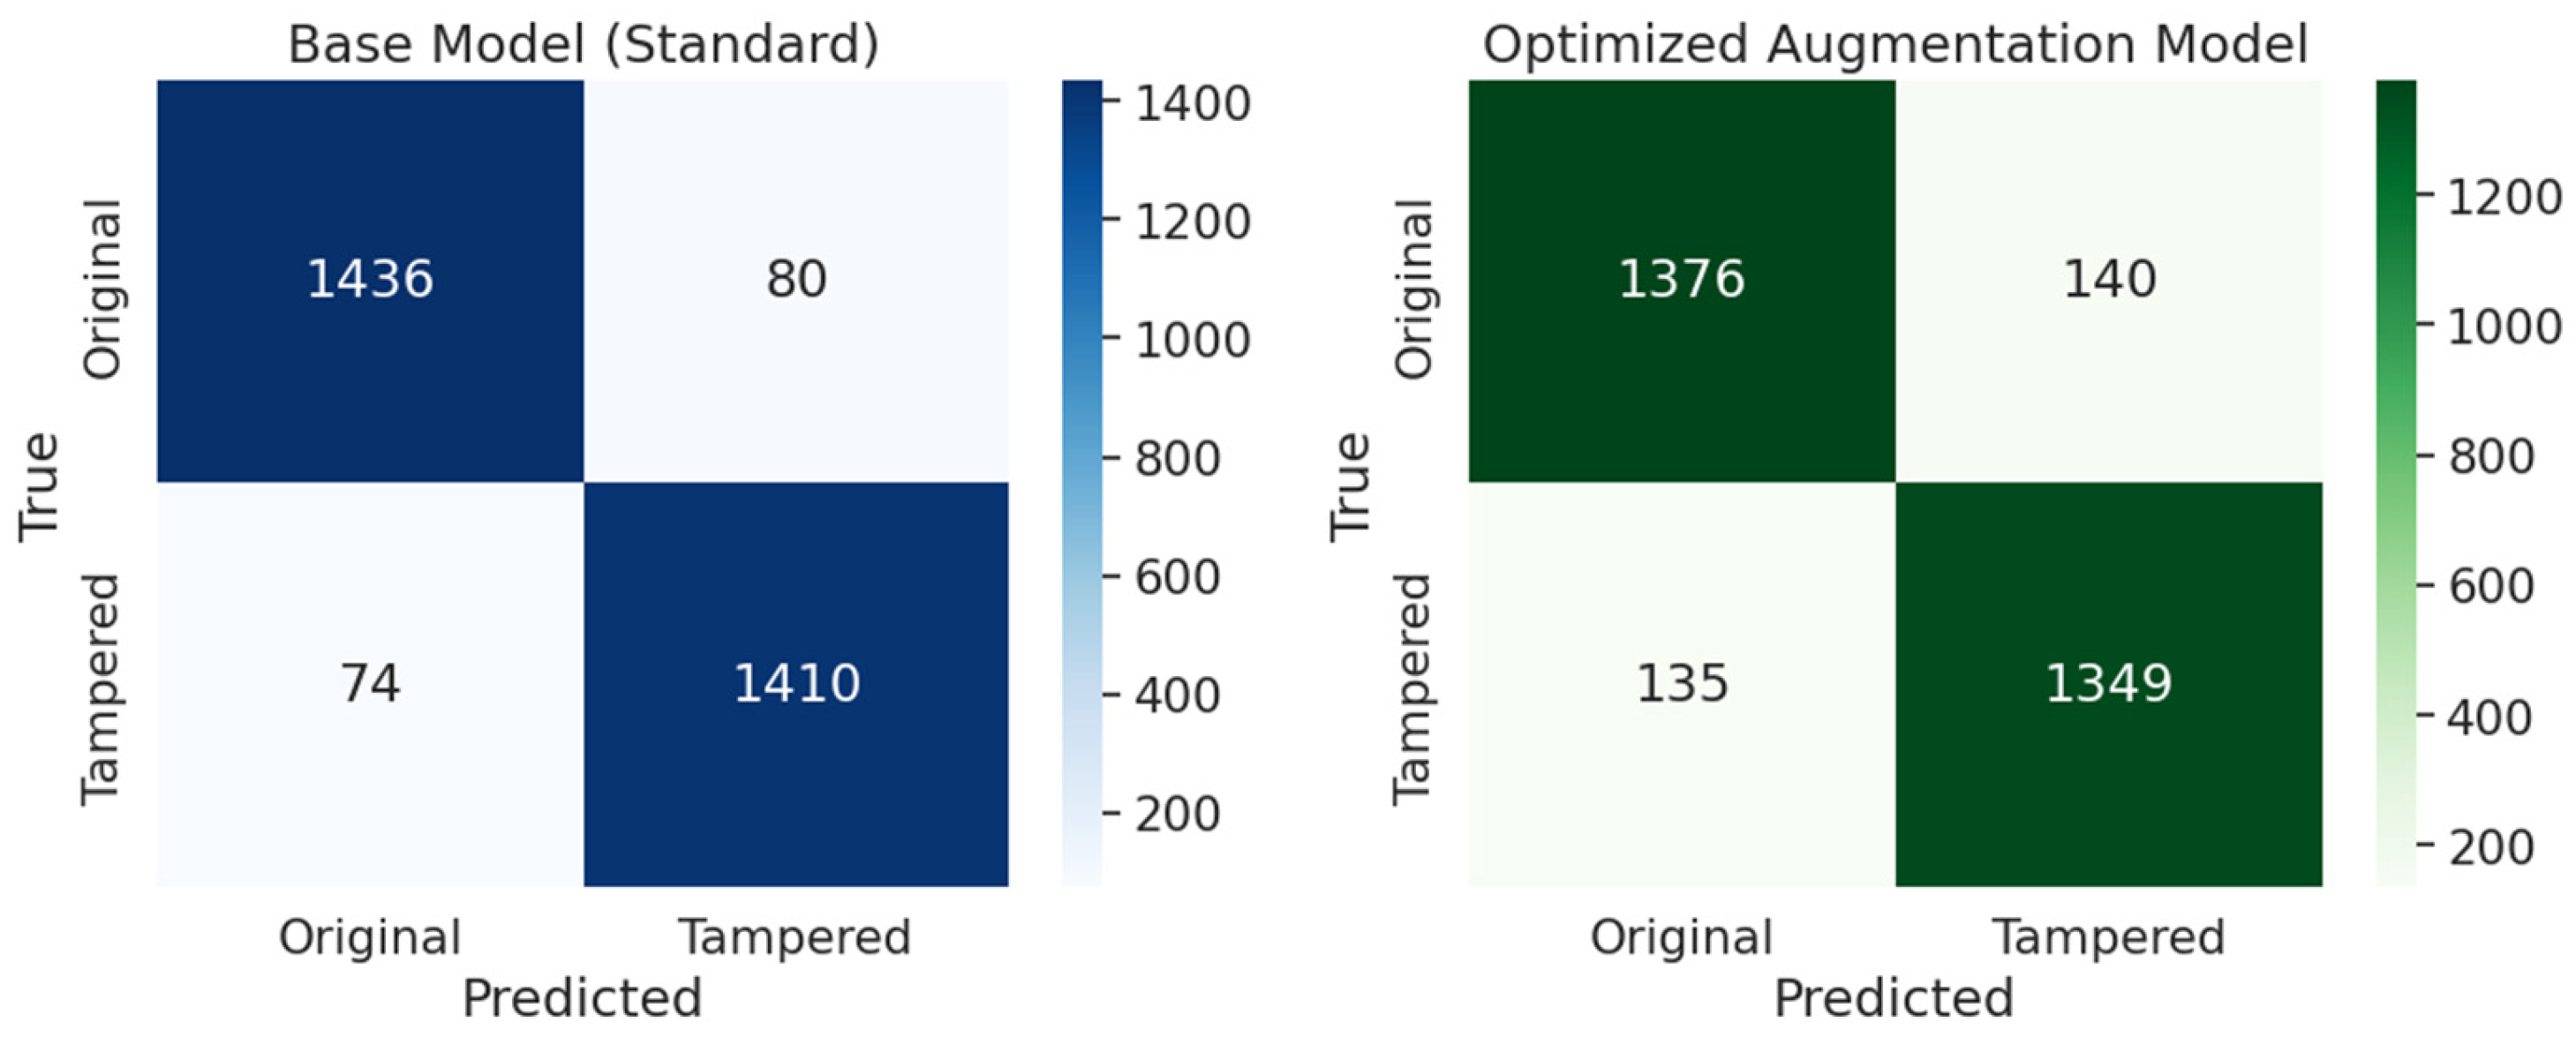
Our initial augmentation tests showed a significant performance degradation. However, after carefully reviewing the augmentation parameters and implementation approach, the optimized augmentation strategy managed to achieve competitive results, although it failed to outperform the baseline model in our 50-epoch evaluation. This suggested that, although carefully optimized data augmentation can improve model robustness, its benefits are strongly dependent on the training regime and the characteristics of the dataset used.
The achieved performances are presented in
Figure 7, where the confusion matrices for the baseline model and the optimized augmentation model are shown, and their performance comparison is shown.
4.2. Performance on Coverage Dataset
The Coverage dataset presented significant challenges to our CNN model.
Table 5 summarizes the performance metrics across different training durations.
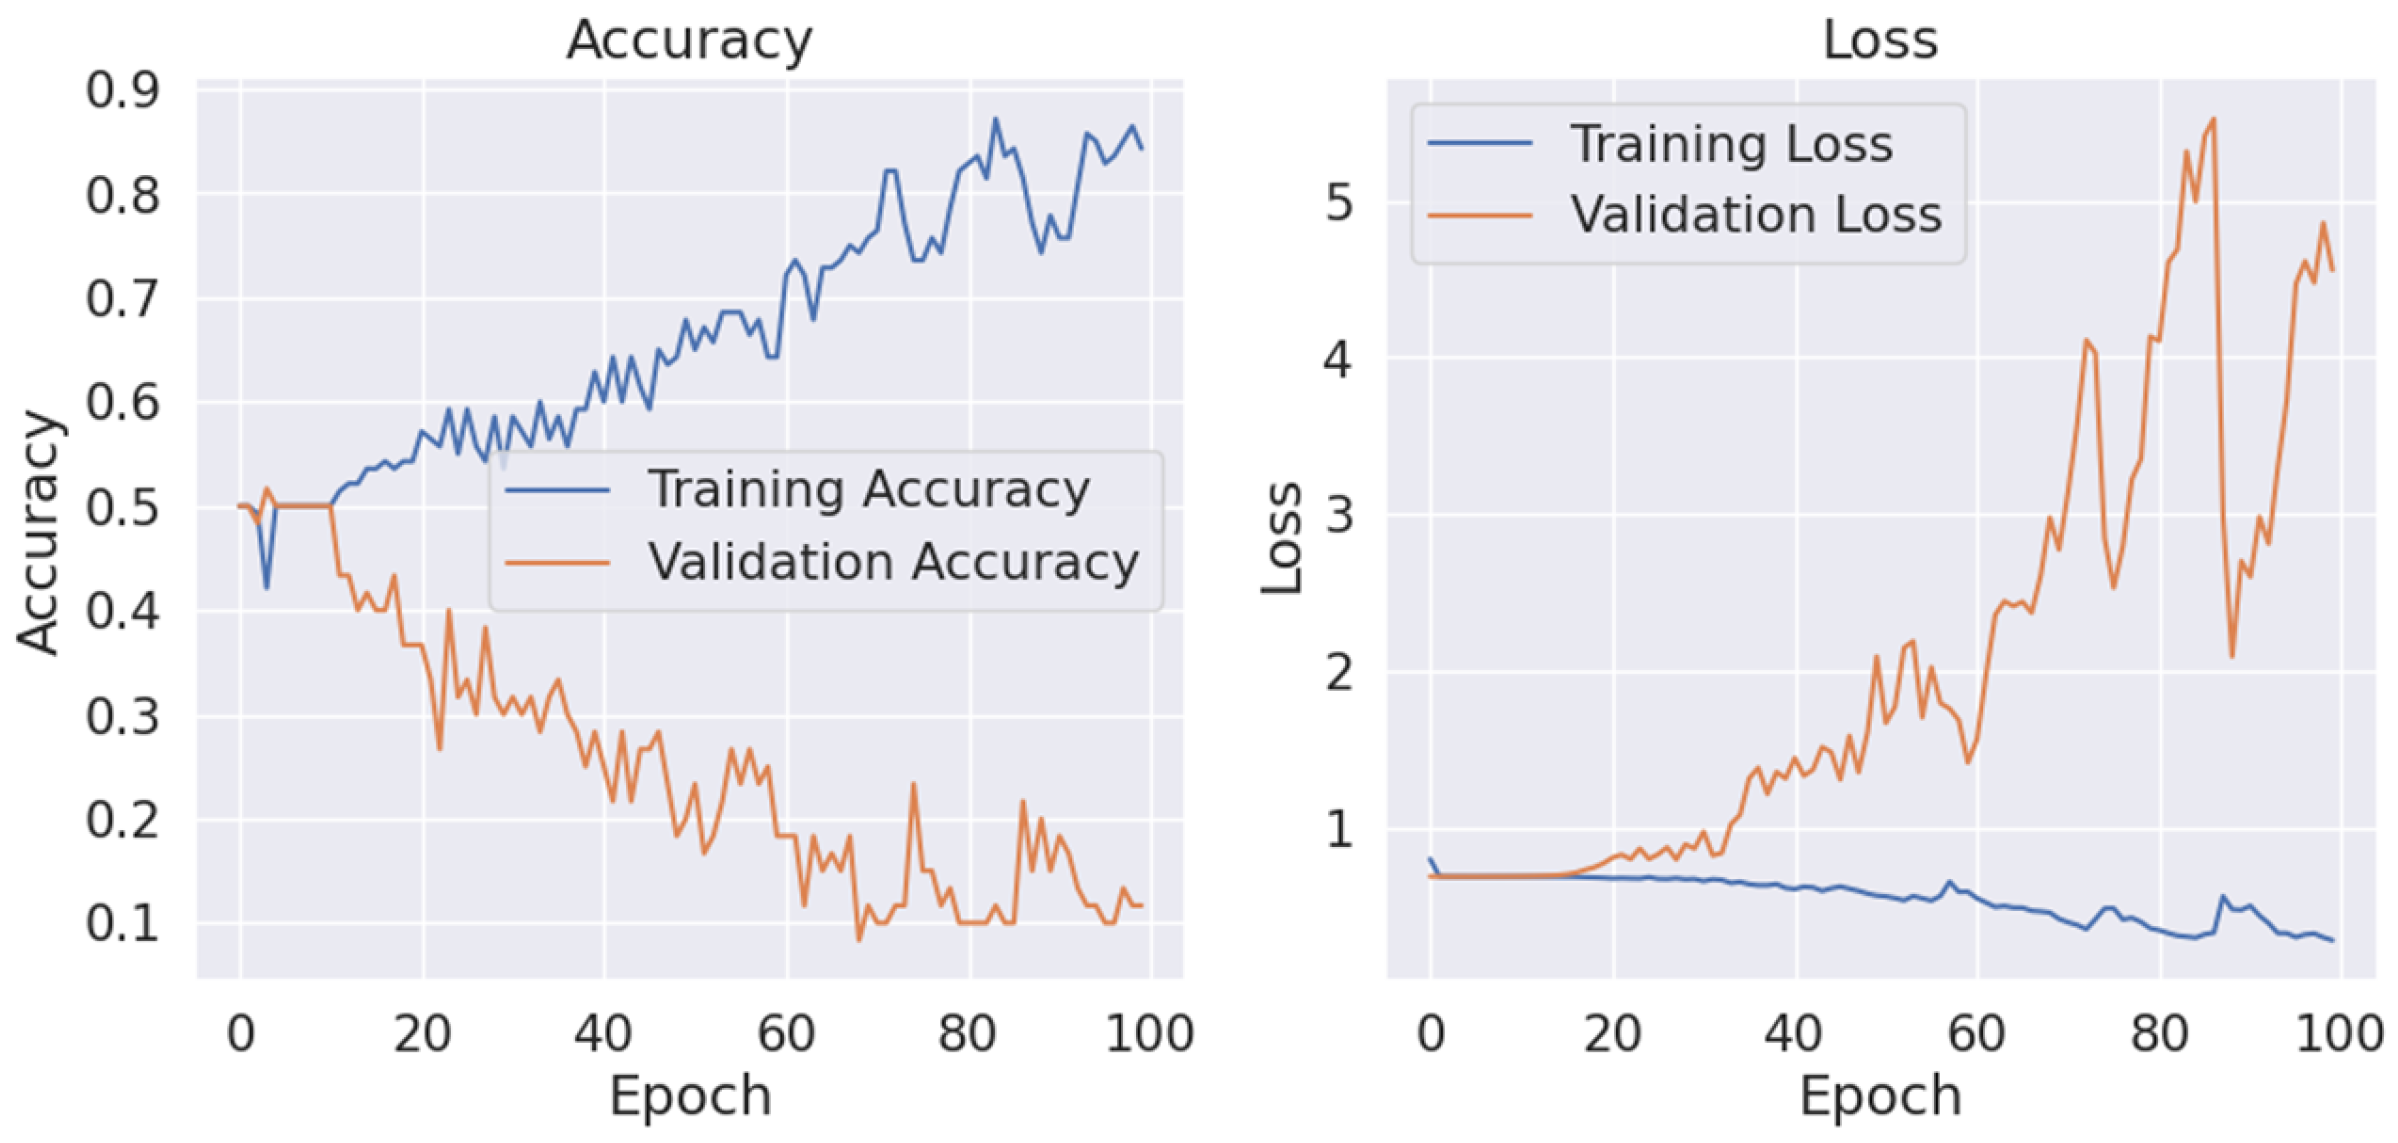
The model’s performance on the Coverage dataset was markedly inferior to its performance on CoMoFoD. The accuracy peaked at a modest 27.50% at 15 epochs and declined with additional training, suggesting severe overfitting. The increasing validation loss further confirms this pattern.
Figure 8 depicts the divergence between training and validation performance, highlighting the model’s inability to generalize effectively on this dataset.
Analysis of Coverage Dataset Challenges
The poor performance on the Coverage dataset can be attributed to several factors:
Limited sample size (only 200 images total);
Complex manipulation types with subtle visual changes;
Significant visual similarity between authentic and tampered regions.
Figure 9 provides examples of correctly and incorrectly classified images from the Coverage dataset, highlighting the challenging nature of these manipulations.
4.3. Performance on CASIA v2 Dataset
The CASIA v2 dataset yielded moderate results, positioning it between the successful CoMoFoD implementation and the challenging Coverage dataset.
Table 6 summarizes its performance across different training durations.
The model achieved its peak performance of 67.00% accuracy at 25 epochs. Similar to the Coverage dataset, increased training duration led to performance degradation, although less severe. The high TPR (0.93) coupled with low TNR (0.16) at 25 epochs indicates a strong bias toward classifying images as tampered, resulting in numerous false positives.
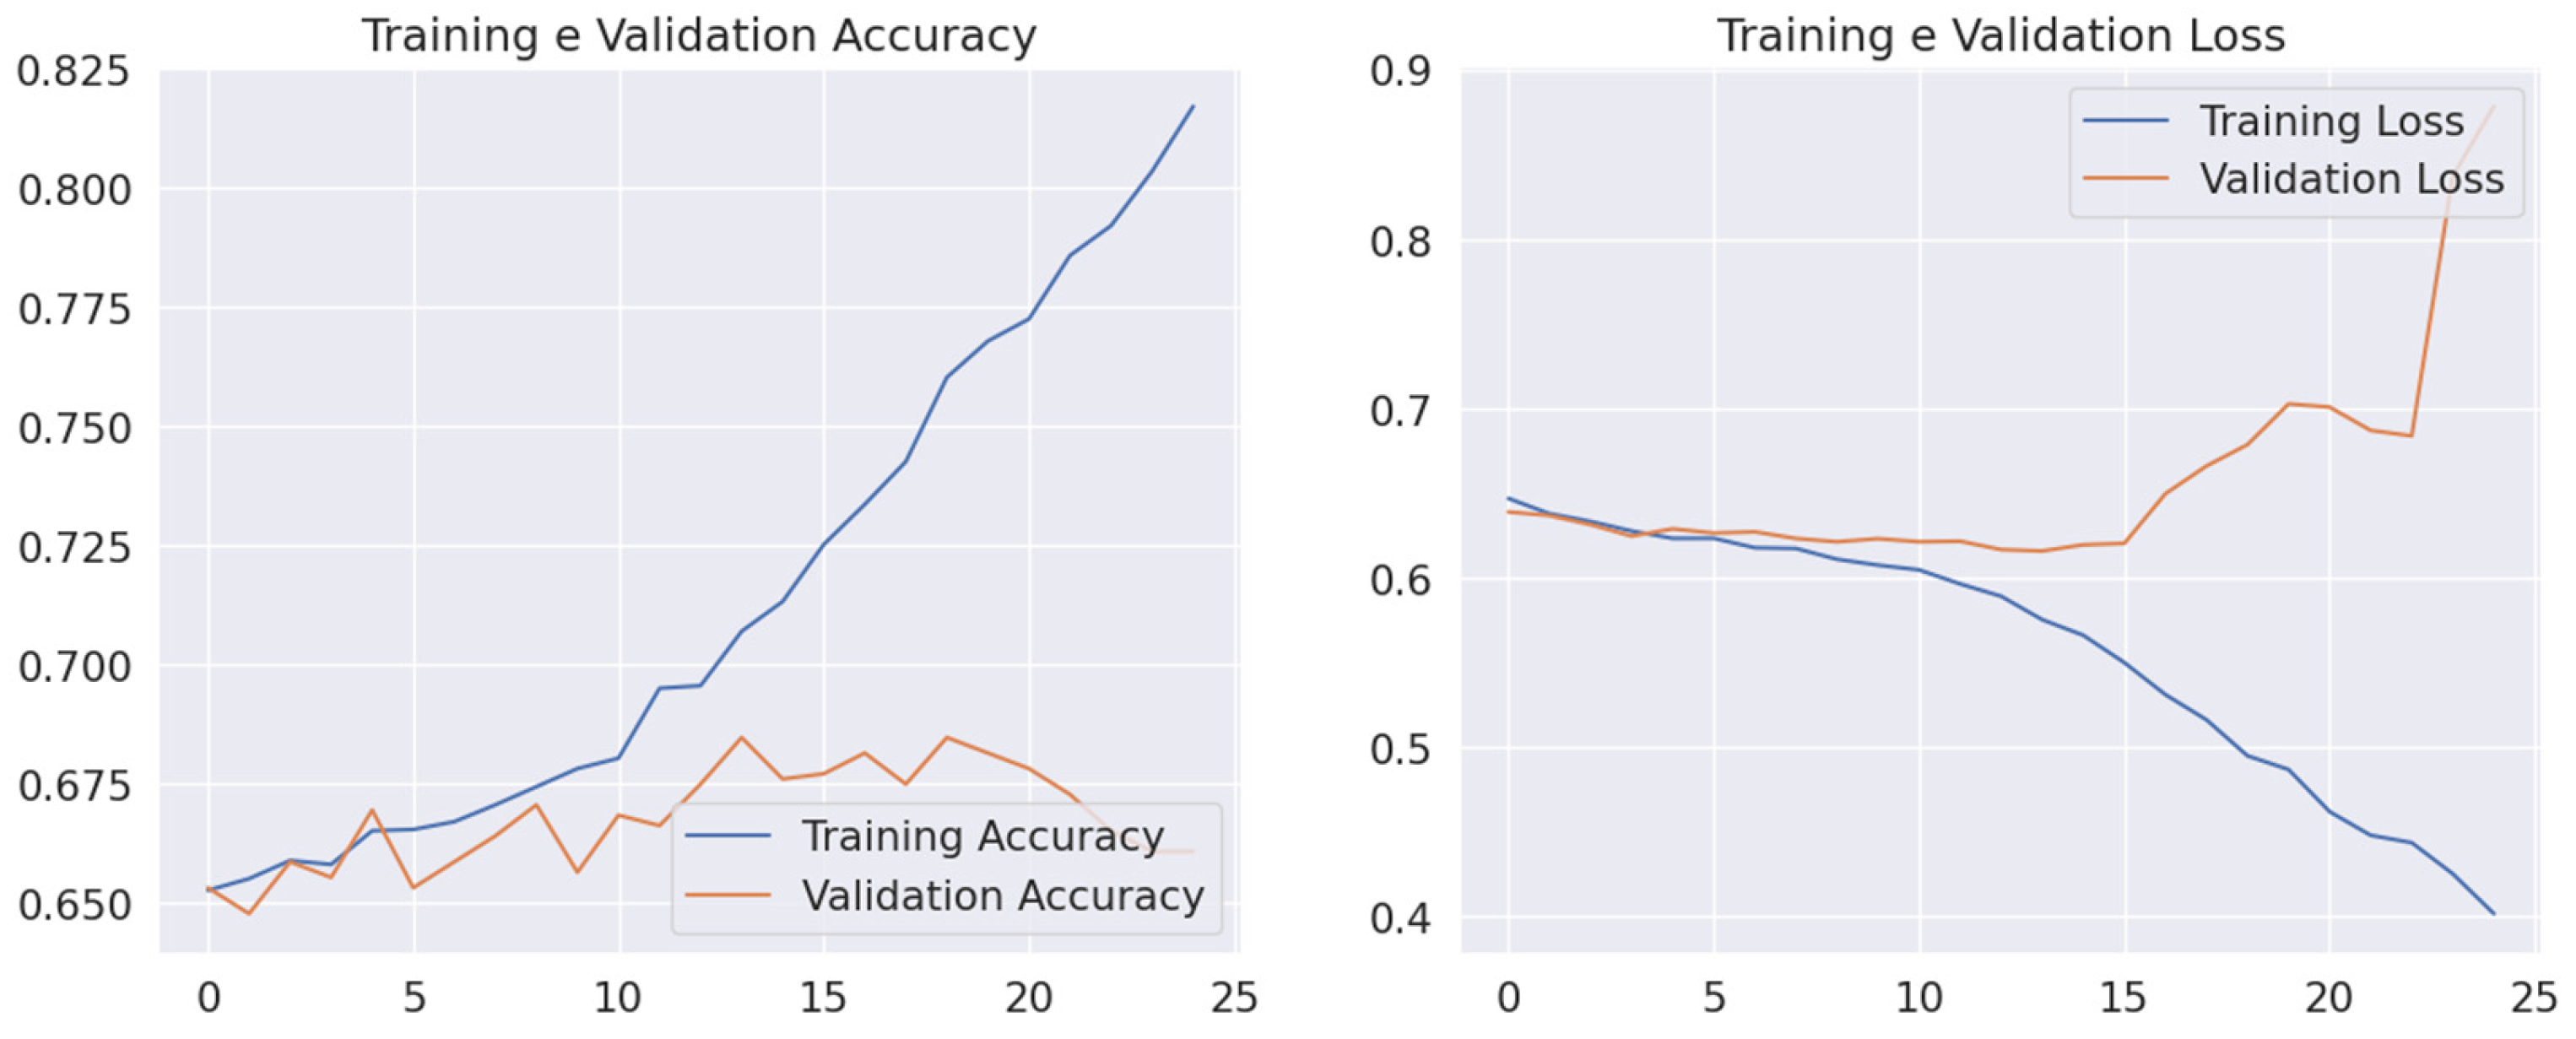
Figure 10 illustrates the training progression on the CASIA v2 dataset, showing initial improvement followed by performance deterioration. This supports the decision to limit training on CASIA v2 to 25 epochs for optimal generalization.
Regularization Impact on CASIA v2
We explored whether regularization techniques could improve performance on the CASIA v2 dataset.
Table 7 presents these results.
Unlike CoMoFoD, the CASIA v2 dataset benefited from regularization techniques. Both L2 regularization and reduced learning rate improved overall accuracy and significantly enhanced the TNR, indicating better discrimination of authentic images. The reduced validation loss also suggests improved generalization.
4.4. Comparative Analysis Across Datasets
The stark performance variations across datasets highlight the challenges of developing universally effective copy-move forgery detection systems.
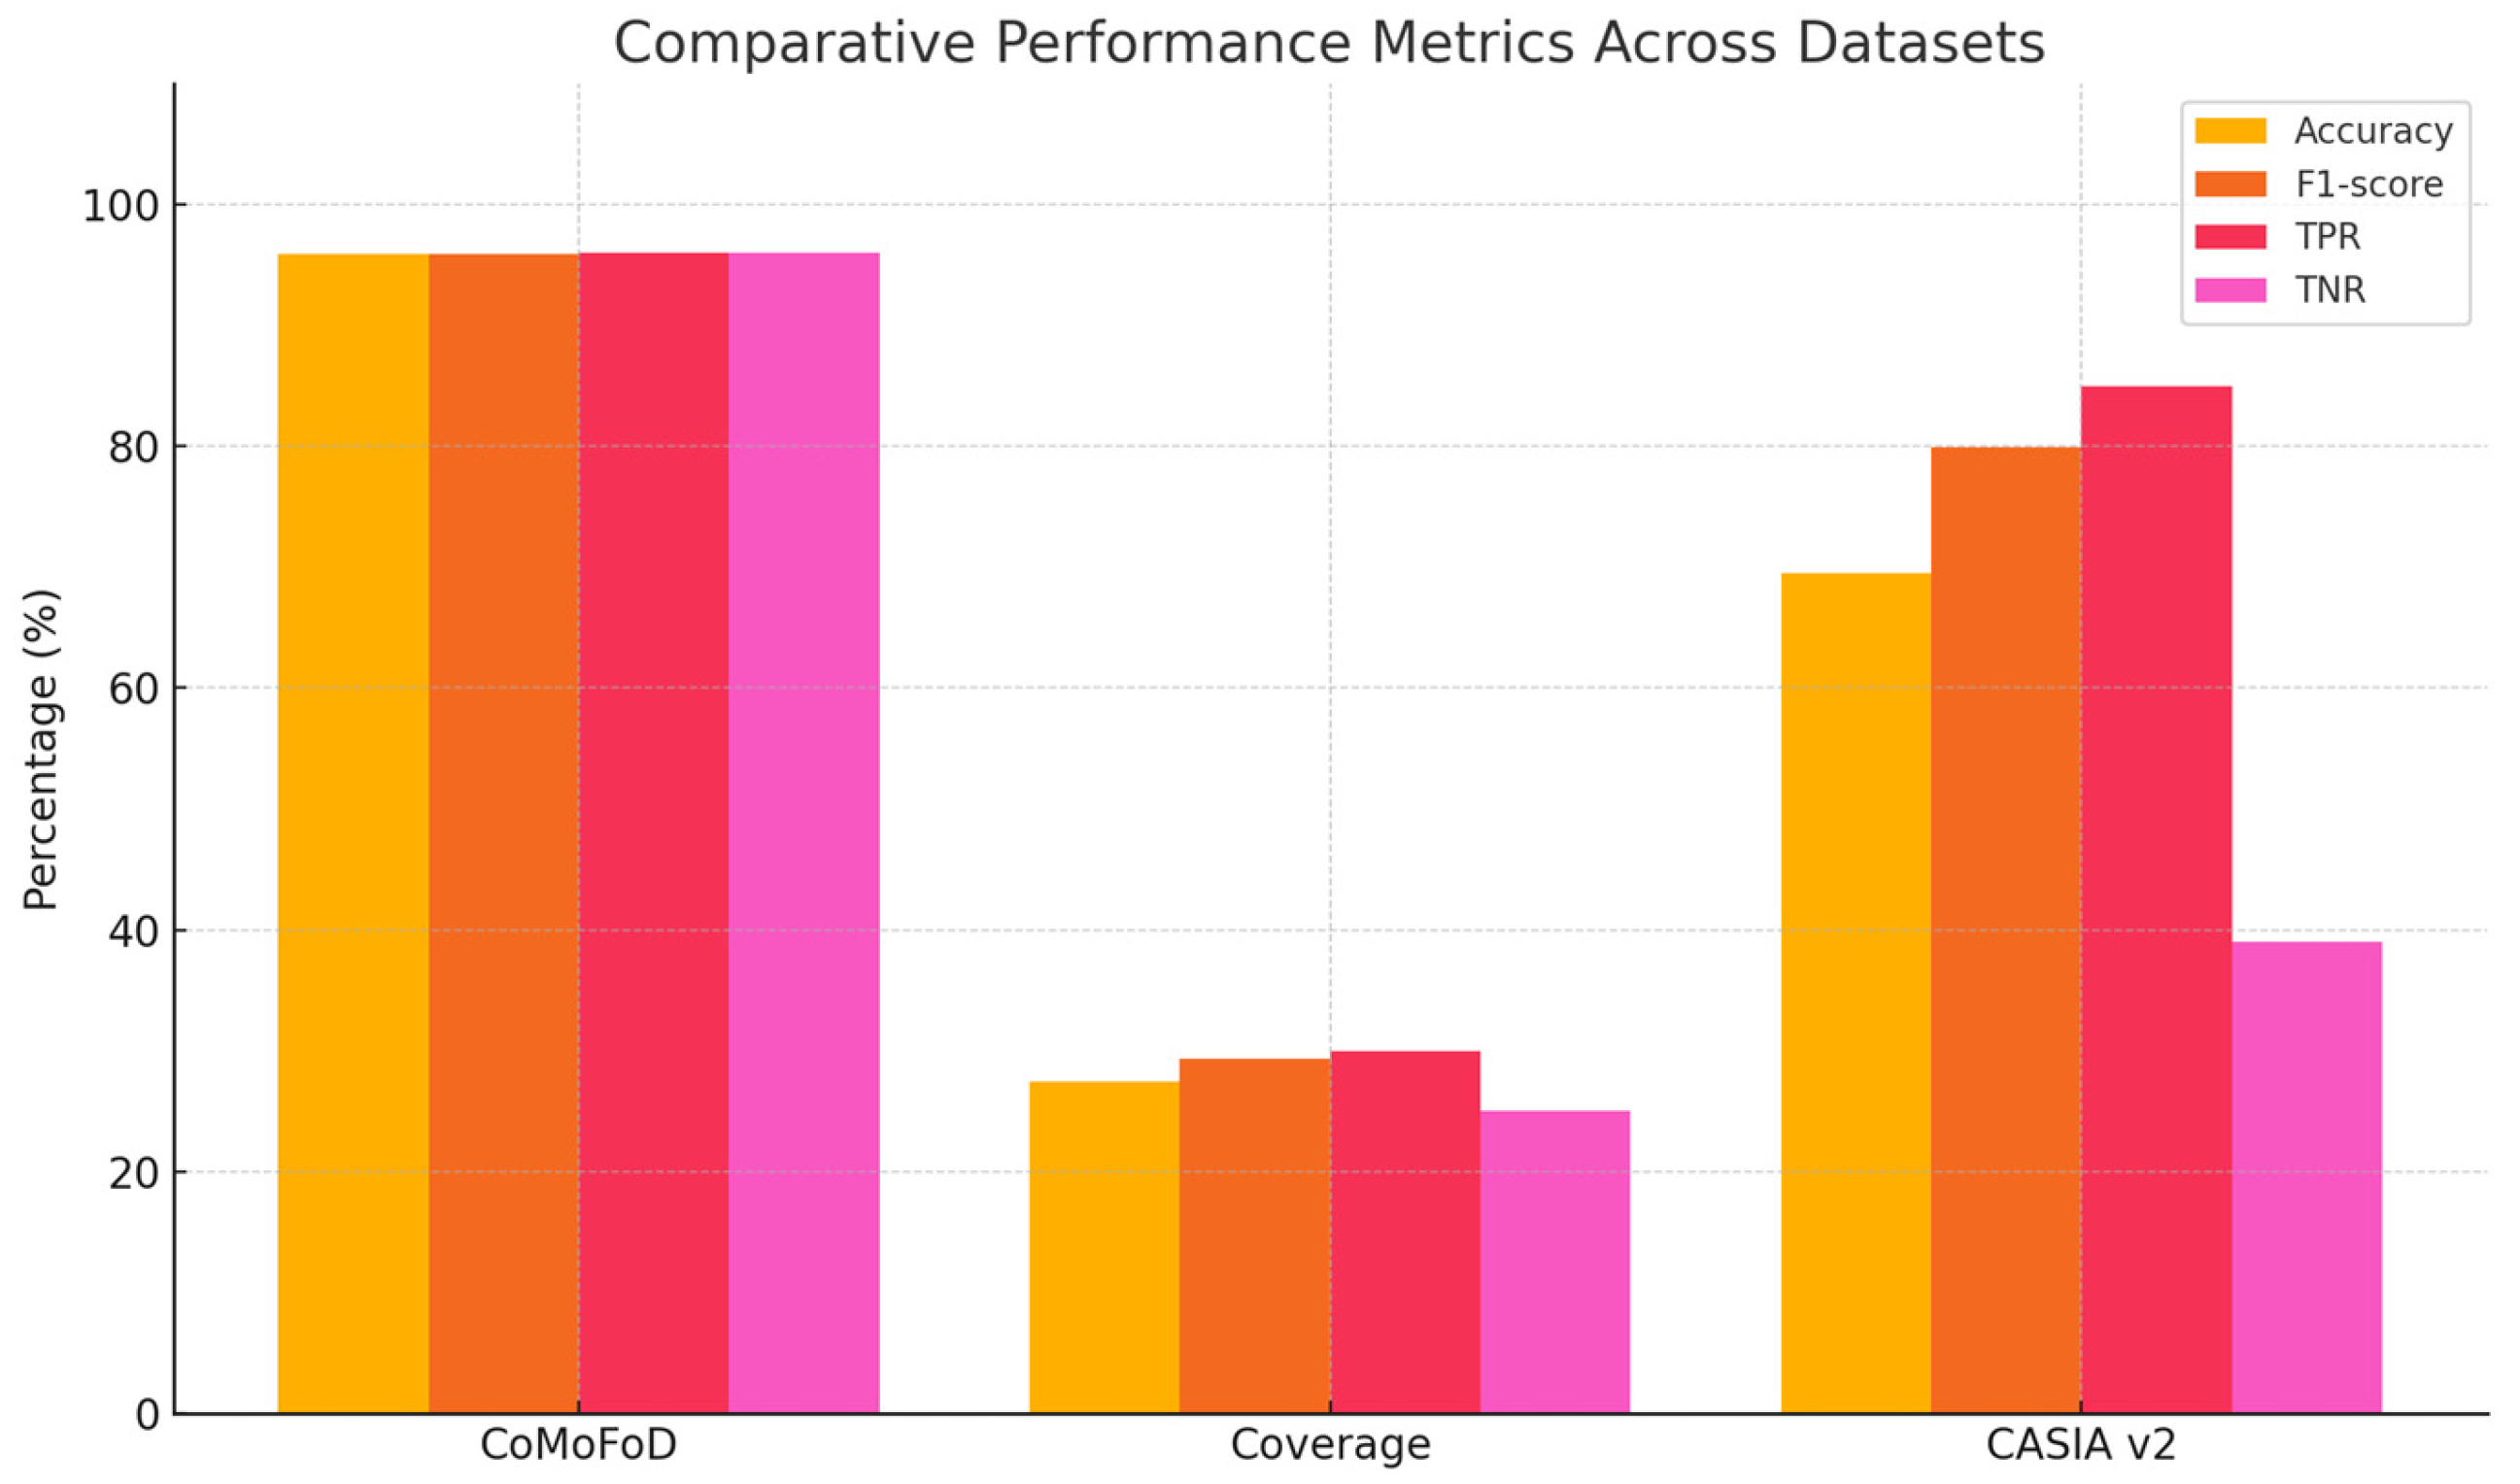
Figure 11 provides a visual comparison of model performance across all three datasets.
Table 8 summarizes the best performances achieved on each dataset along with their respective optimal configurations.
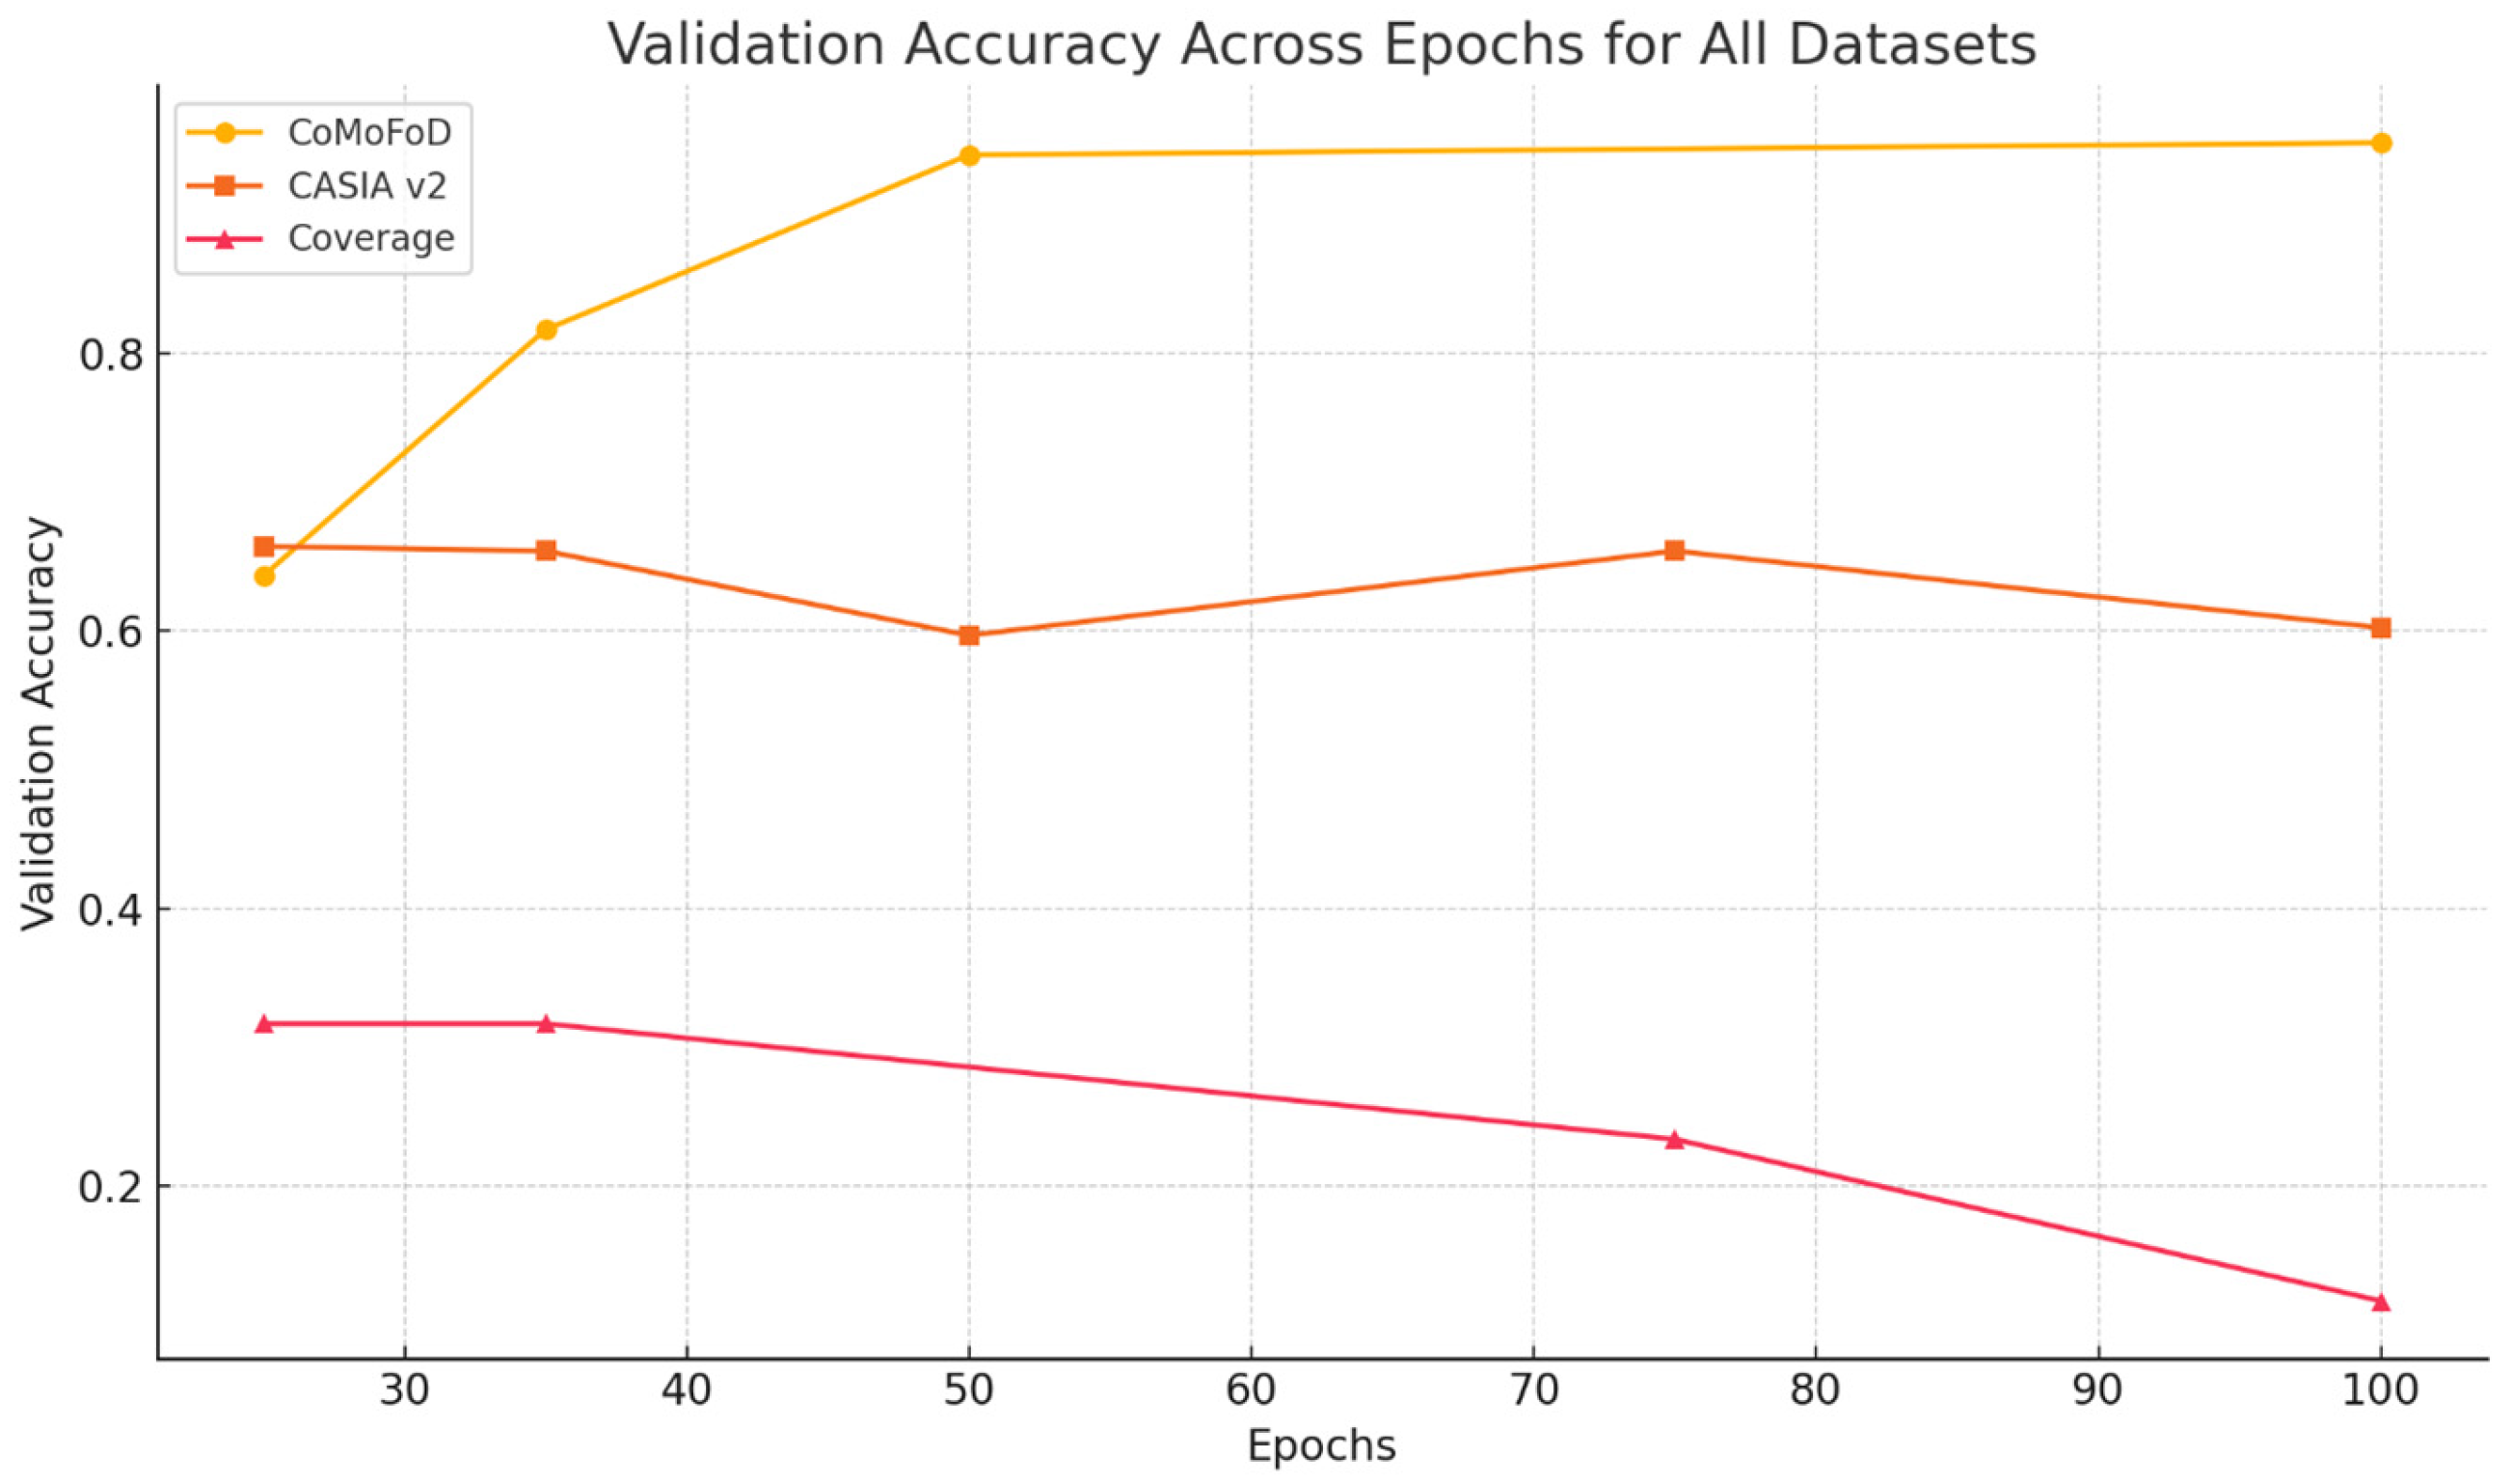
Figure 12 Learning dynamics across the three datasets by comparing validation accuracy progression over epochs.
4.4.1. Dataset Characteristics Impact
To better understand the impact of dataset characteristics on model performance, we analyzed key attributes across the three datasets.
Table 9 summarizes these attributes.
The comparative analysis reveals a correlation between dataset size, class balance, and model performance. The CoMoFoD dataset, with its large size and balanced classes, enabled effective model training. Conversely, the Coverage dataset’s limited size severely hindered the model’s ability to learn generalizable patterns despite a balanced class distribution.
Cross-dataset evaluation revealed severe generalization limitations. Training on CoMoFoD and testing on CASIA v2 achieved only 45.2% accuracy, while the reverse scenario yielded 62.1%. Training on Coverage and testing on other datasets resulted in accuracies below 30%. These results confirm that dataset-specific characteristics (resolution consistency, manipulation complexity, class balance) critically impact model transferability, emphasizing the need for diverse training data in real-world applications.
4.4.2. Feature Visualization
To gain insights into the model’s internal representations, we visualized feature activations from intermediate convolutional layers on representative images from each dataset.
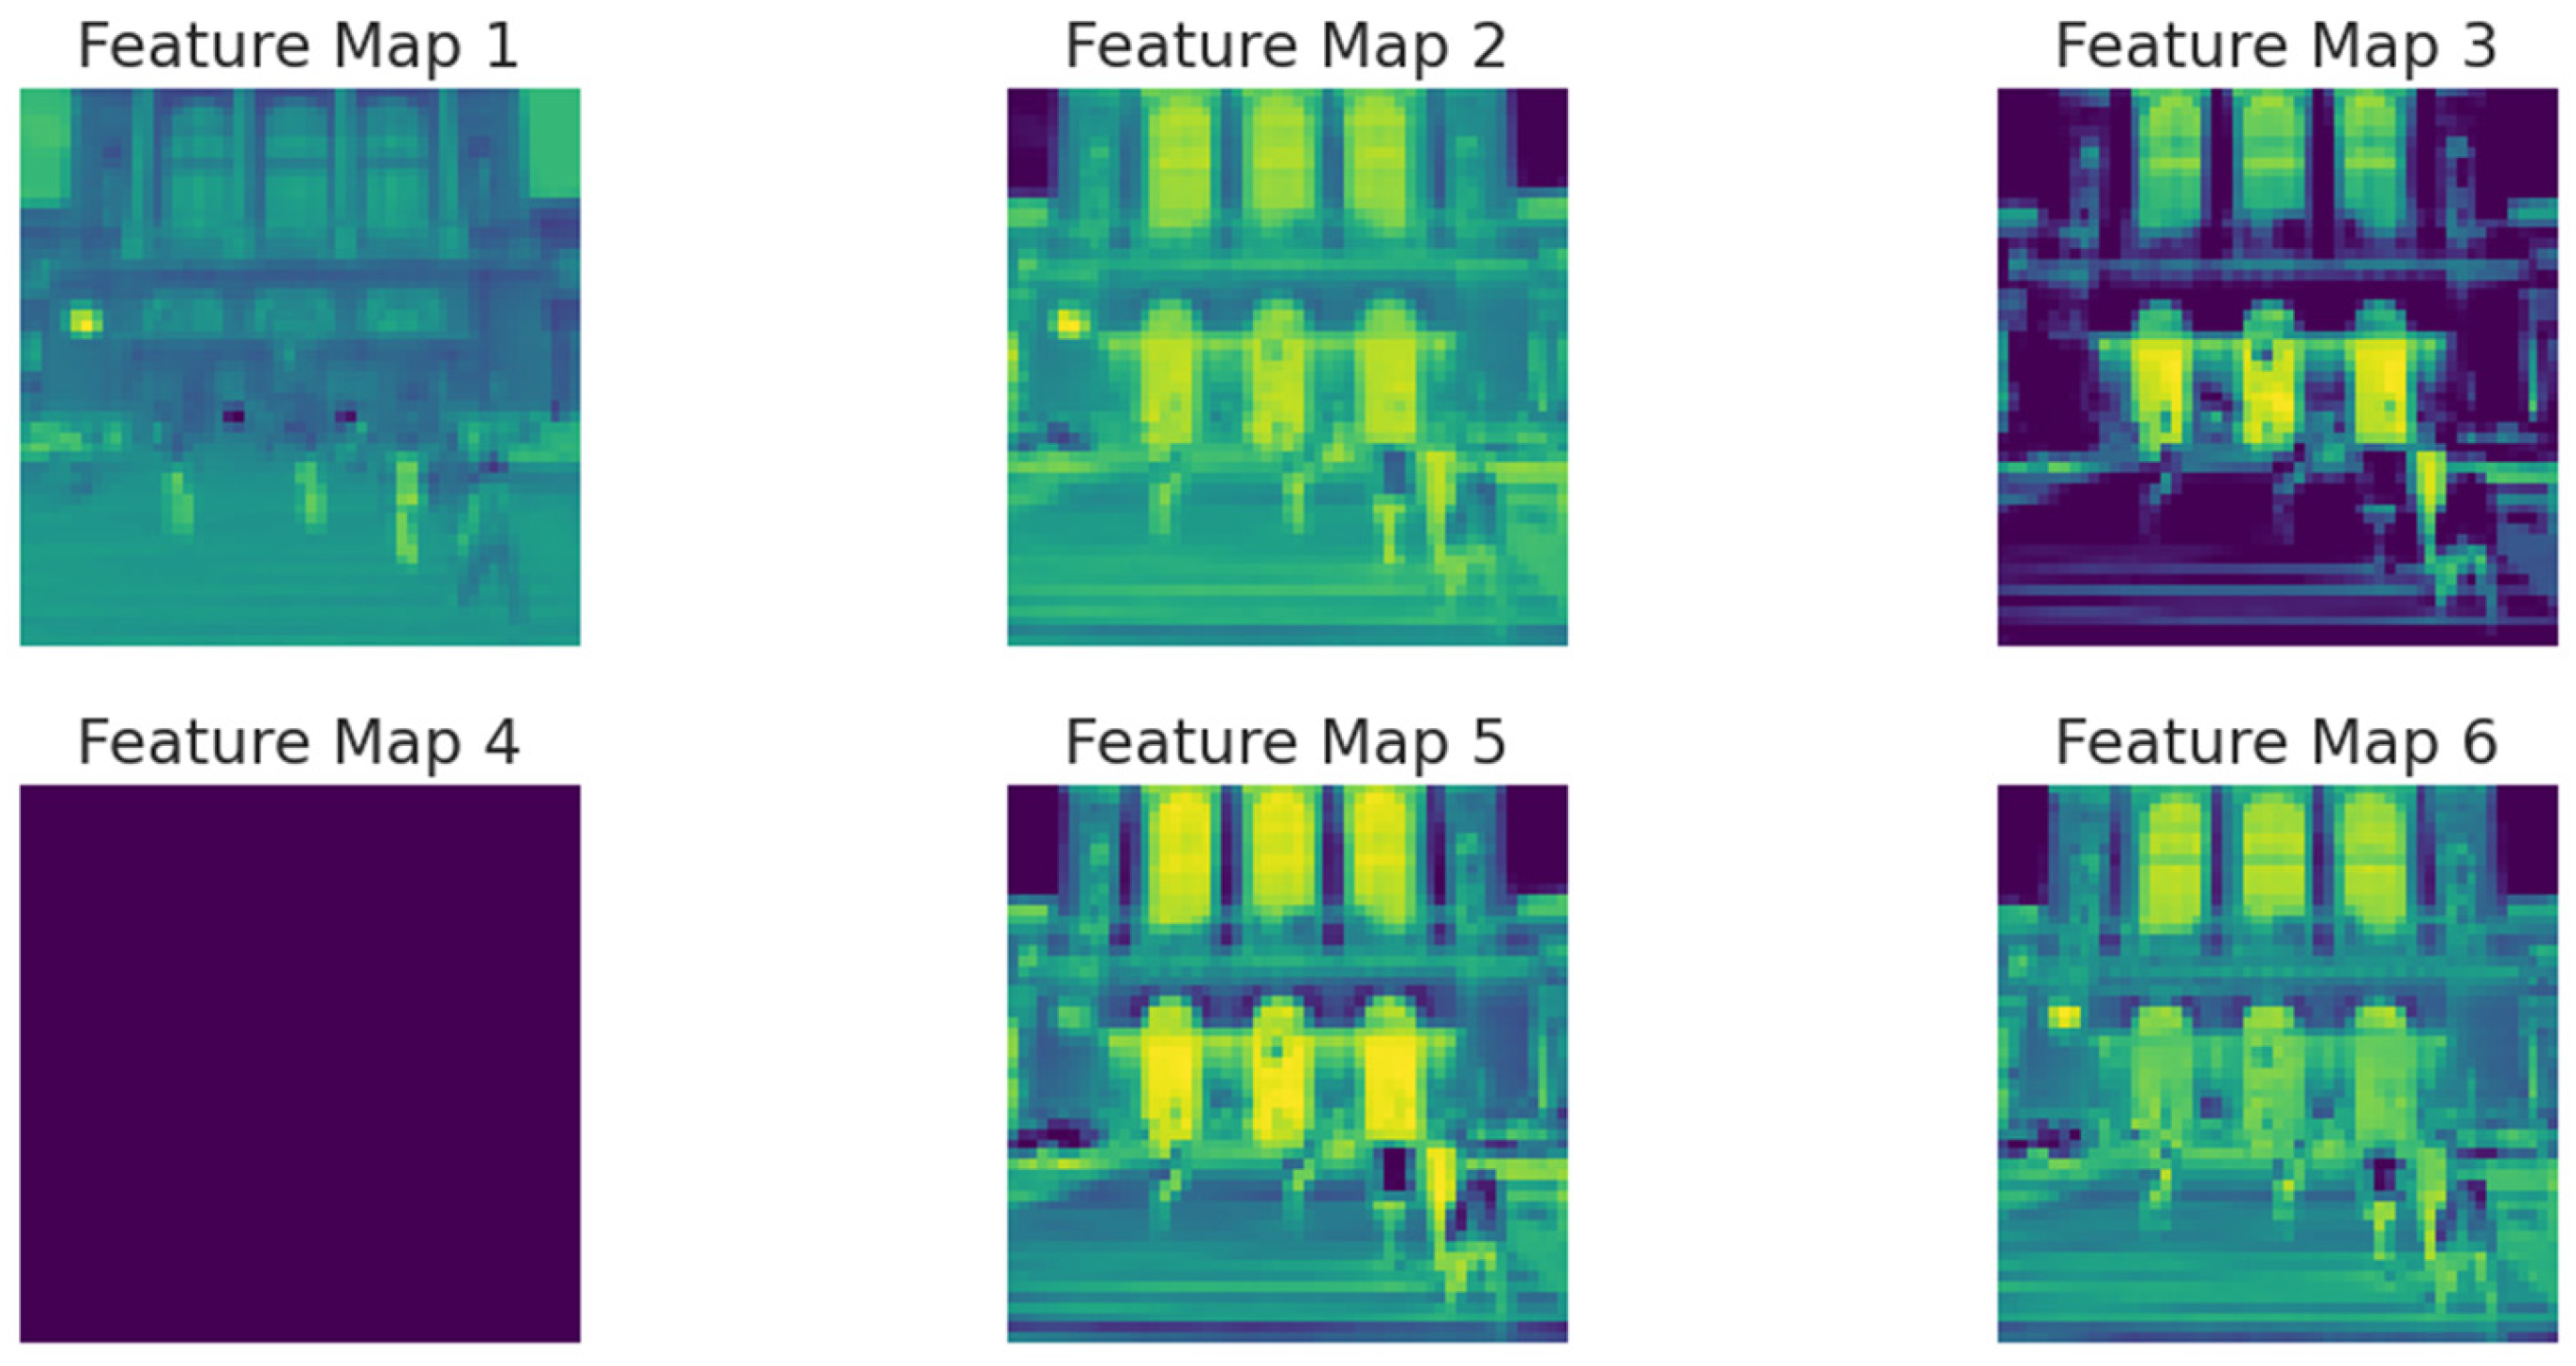
Figure 13 displays activation maps from the third convolutional layer (Conv2D-64) for correctly classified images from each dataset. The visualization shows the first 6 of 64 feature maps to illustrate learned patterns. For CASIA v2 (left column), activations show moderate intensity with some noise artifacts. The Coverage dataset (middle column) exhibits weaker, more diffuse activations indicating difficulty in feature extraction due to subtle manipulations. CoMoFoD (right column) demonstrates strong, well-defined activation patterns with clear edge detection and texture recognition, explaining the superior performance on this dataset. The stronger activations in CoMoFoD indicate the model’s ability to develop more robust and distinctive feature detectors for this dataset’s manipulation patterns.
5. Discussion
Our experimental results reveal significant variations in CNN performance across different copy-move forgery detection datasets. This section analyzes these findings in the context of existing research, comparing our results with other approaches and discussing the implications for future work in image forensics.
5.1. Dataset Characteristics and Model Performance
The substantial disparity in performance between datasets in terms of accuracy of 95.90% on CoMoFoD versus 27.50% on Coverage is strictly related to the characteristics of the datasets themselves. Our analysis on this subject has managed to identify that the size of the dataset is a determining factor for the success of the model, highlighting, in particular, that by using larger datasets it is possible to obtain a significant improvement in terms of learning. This result perfectly aligns with the observations raised by Nazir et al. (2022) [
19], whose Mask-RCNN approach demonstrated similar variations between datasets in terms of accuracy of 98.12% on CoMoFoD versus 83.41% on CASIA v2. However, with respect to what was said above, it should be highlighted that our results reveal a more marked degradation in performance when using small datasets. While Elaskily et al. (2020) [
14] claimed an absolute accuracy of 100% on several datasets, including MICC-F220 and MICC-F600, our more rigorous evaluation manages to demonstrate how the model performance is substantially tied to the characteristics of the dataset that is used. This discrepancy highlights an aspect often overlooked in previous studies, namely, the importance of performing more comprehensive tests on multiple datasets with different characteristics between them. The class balance effect observed in our experiments supports findings by Kumar et al. (2022) [
16], who noted that balancing training data improved VI-NET performance. Similarly, our results on CASIA v2 show that class imbalance (1701 authentic versus 3274 tampered) contributes to the observed classification bias, where the model demonstrates high sensitivity (TPR = 0.85) but poor specificity (TNR = 0.39).
The complexity of the image manipulation is another very important factor that can crucially impact performance. The particularly complex nature of the Coverage dataset, characterized by very subtle manipulations, is reminiscent of the results obtained from the research conducted by Aria et al. (2022) [
9], who in their work observed that the smallest forged areas significantly increase detection difficulties. However, while their QDL-CMFD method using a dual-branch architecture reported robust performance in small forgeries detection, our CNN model struggled significantly on the Coverage dataset despite applying multiple optimization attempts. This highlights the suggestion that standard CNN architectures, regardless of the training strategies applied, may have fundamental limitations in their ability to recognize and, therefore, address particularly subtle manipulations.
5.2. Regularization and Augmentation Effectiveness: Comparative Analysis
Our results regarding regularization techniques revealed dataset-specific patterns that go beyond previous research. While most studies apply consistent regularization across datasets, our experiments fully demonstrate that the effectiveness of regularization depends substantially on the intrinsic characteristics of the dataset itself. With reference to CoMoFoD, the baseline model without explicit regularization achieved superior performance with an accuracy of 94.80%, thus contradicting the common belief that regularization improves generalization universally. This result diverges from Wang et al. (2024) [
17], who employed extensive regularization in their DRNet architecture across all datasets. Their approach improved F1 scores by 2–4% on various datasets including CoMoFoD. Our results highlight that datasets with a large number of images and optimally balanced characteristics, such as CoMoFoD, can benefit from more expressive models without applying more pronounced regularization; meanwhile, when considering smaller dimensional or unbalanced datasets, regularization to prevent overfitting becomes an essential element to consider and implement. Considering the results obtained regarding data augmentation, it is possible to draw information that is particularly valuable compared to what is claimed by the existing literature. Ravula and Singh (2025) [
18] reported significant improvements using a GAN-based augmentation, thus achieving an accuracy of 99.02%. Initially, when we applied our standard augmentation attempts, they showed a drastic performance degradation of 49.20% in terms of accuracy. However, after careful refinement of our augmentation strategy that aimed at more effective optimization, we achieved modest improvements of 95.90% versus the 94.80% achieved previously. This is intended to demonstrate how the implementation details of augmentation techniques are particularly critical for forensic applications, an aspect that has not been adequately addressed in previous studies. El_Tokhy (2023) [
10] reported similar issues when applying augmentation techniques to radiographic images, finding that some transformations compromised features that were particularly relevant from a forensic point of view. Our work, together with the results obtained, aims to extend this observation beyond radiographic images by extending the scope of validity to natural images, thus demonstrating that when inappropriate augmentation operations are performed, artifacts can be introduced that can confuse and obscure the detected patterns. This finding has significant implications for the design of new strategies to be considered in the field of forensic applications.
5.3. Learning Dynamics and Performance Boundaries
A close look at our results in this particular context highlights some important insights into the performance limits of CNN-based forgery detection. CoMoFoD results of 95.90% accuracy are close to, but do not in fact match, the perfect accuracy claimed by Elaskily et al. (2020) [
14] in their paper. This observed difference can be explained by the fact that our evaluation methodology is probably more rigorous, as it minimizes potential data loss between training and testing sets.
The stark contrast that emerges between the various datasets suggests that there are fundamental limitations to single-architecture approaches. While Kumar et al. (2022) [
16] demonstrated that 99 ± 0.2% accuracy can be achieved on CoMoFoD using a hybrid VI-NET architecture, no previous study has demonstrated a similar result when applied to the Coverage dataset. This may indicate that some types of falsification may still remain difficult to detect when using CNNs, regardless of the possible optimization techniques that can be applied to the architecture. Analyzing the learning curves of our model across the various datasets reveals distinct patterns not previously reported, such as the rapid performance degradation of the Coverage model after only 15 epochs, which stands in stark contrast to the steady improvement of CoMoFoD over 50 epochs. In particular, this pattern highlights that smaller datasets not only limit peak performance but also radically alter optimal training strategies. The current literature lacks detailed analysis of these learning dynamics across multiple datasets.
5.4. Comparison with State-of-the-Art Methods
Table 10 compares our best results with recent state-of-the-art methods on the CoMoFoD dataset.
While our model’s 95.90% accuracy on CoMoFoD falls slightly below some recent approaches, it offers several advantages. First, our model provides a more realistic performance estimate through a rigorous validation methodology. Second, our analysis offers unprecedented insights into factors affecting CNN performance across datasets. Third, our model has shown that it is possible to obtain very competitive results using a relatively simple architecture, improving computational efficiency and interpretability.
As for the performance gap in the Coverage dataset, in our case, it was much more pronounced, and although it is a limitation, instead of avoiding reporting this evidence as has been done in most previous studies when they used particularly complex datasets, our work in a very transparent way also explicitly addresses these substantial limitations. Our transparency is to be understood as a fundamental contribution to the application domain in question because it clearly highlights what the current fundamental limitations of these models are, highlighting, in particular, the areas in which CNN approaches require fundamental innovations compared to the incremental improvements usually proposed in the literature.
5.5. Practical Recommendations and Future Directions
Based on our comparative analysis with existing research reported in the literature, we propose several practical recommendations that go beyond what is reported in the contemporary scientific literature:
First, the selection of the dataset for model development should prioritize considering the size and diversity of images over what specific types of manipulations could be applied. The superior performance on CoMoFoD, composed of 10,000 images, compared to Coverage, composed of only 200 images, highlights that even the most sophisticated architectures still fail to overcome the intrinsic and fundamental limitations of the data that is intended to be used. This is in stark contrast to the approaches of Babu and Rao (2022) [
12] that do not address the native limitations of the dataset used but instead focus on optimizing the model features.
Second, evaluation protocols to be used to validate the research should refer to multiple datasets that have as many different characteristics as possible. The performance variations we observed demonstrated the real risk of overestimating the capabilities of the model when considering only limited test bases. Future research should follow and build on our multi-dataset approach rather than insisting on continuing to optimize for specific benchmarks.
Third, it should be considered that all augmentation strategies for forensic applications require a particularly specialized design that is capable of going well beyond standard computer vision practices. Our results have proven to be in line with the growing awareness that, in the field, forensically relevant features can be affected and, therefore, interrupted by the use of conventionally adopted augmentation techniques. Therefore, future research should focus more on exploring domain-specific augmentation methods that are able to preserve manipulation artifacts while increasing their variety.
Fourth, future proposals for architectural innovations should focus more on the context of adaptability to the characteristics of the dataset used rather than on the absolute performance conducted on specific benchmarks. The recent work of Ravula and Singh (2025) [
18] on transformer-based approaches represents a very promising direction, as transformer attention mechanisms could better adapt to different manipulation complexities.
Our results also suggest that hybrid approaches capable of combining CNN feature extraction with additional processing steps could overcome current limitations. The successful integration of spectral clustering in GAN-ViT-CMFD (Ravula and Singh, 2025 [
18]) and shallow information extraction in DRNet (Wang et al., 2024 [
17]) confirm that pure CNN approaches may indeed have reached their performance limits for some types of falsification.
6. Conclusions
This study provides a comprehensive evaluation of CNN performance in copy-move forgery detection across multiple benchmark datasets. Our findings reveal significant variations in detection effectiveness based on dataset characteristics, training strategies, and regularization techniques.
The CNN model demonstrated exceptional performance on the CoMoFoD dataset, achieving 95.90% accuracy with optimized configuration. This confirms the potential of deep learning approaches for copy-move forgery detection when sufficient training data is available. However, the dramatically lower performance on the Coverage dataset (27.50% accuracy) and moderate results on CASIA v2 (69.50% accuracy) highlight the challenges of developing universally effective detection systems.
Our analysis identifies dataset size as a critical factor influencing model performance. Large, balanced datasets like CoMoFoD enable effective feature learning, while limited datasets severely constrain generalization capabilities. Additionally, manipulation complexity and image resolution consistency significantly impact detection performance.
The effectiveness of regularization techniques proved to be dataset-dependent. While the base model performed optimally on CoMoFoD without additional regularization, CASIA v2 benefited from L2 regularization and learning rate adjustments. These findings emphasize the importance of tailoring model configurations to specific dataset characteristics rather than applying universal approaches.
Data augmentation, when properly implemented, provided modest performance improvements. However, our initial negative results with augmentation underscore the need for careful calibration of transformation parameters to preserve forensically relevant features while enhancing model robustness. In particular, the optimal training duration varied significantly across datasets, with smaller datasets requiring early stopping to avoid overfitting. Monitoring validation metrics during the training phase was particularly essential to identify optimal stopping points to ensure the full generalization capability of the model. Future research should focus on developing adaptive architectures that can adapt to different dataset characteristics. Transfer learning and domain adaptation techniques can be valuable solutions to help address the challenges related to the limited training data currently available. Furthermore, ensemble approaches that combine multiple detection methods could further improve model robustness.
In conclusion, while CNN-based approaches show promising results for copy-move forgery detection, their effectiveness is unfortunately highly dependent on dataset characteristics and the appropriate setup. In light of the above, professionals should, therefore, consider these factors when implementing deep learning solutions for digital image forensics applications [
20,
21,
22].
Author Contributions
Writing—original draft preparation, investigation, data curation, P.V.D.; conceptualization, methodology, writing—original draft preparation, O.K.; supervision, funding acquisition, E.F.; investigation, methodology, M.A.; conceptualization, data curation, C.N.; writing—review and editing, C.R. All authors have read and agreed to the published version of the manuscript.
Funding
This research received no external funding.
Data Availability Statement
The original contributions presented in the study are included in the article. The complete codebase for this research, including data processing, model implementation, and visualization scripts, is freely available as a Google Colab notebook at:
https://colab.research.google.com/drive/1SMr73KF7mnf7aMd_cIZjJIKraH2yweJ0?usp=sharing (accessed on 4 May 2025). This accessibility enables direct verification of our results and facilitates further extension of our work by interested researchers. Additional raw data are available from the corresponding author upon reasonable request.
Conflicts of Interest
The authors declare no conflicts of interest.
Appendix A. Blur Filtering Implementation
|
| Python 3 |
|
| def soft_blur_batch(image_batch): |
| image_batch = tf.cast(image_batch, tf.float32) / 255.0 |
| image_batch = tf.nn.avg_pool2d(image_batch, ksize=3, strides=1, padding=‘SAME’) |
| return image_batch |
|
| def strong_blur_batch(image_batch): |
| image_batch = tf.cast(image_batch, tf.float32) / 255.0 |
| image_batch = tf.nn.avg_pool2d(image_batch, ksize=5, strides=1, padding=‘SAME’) |
| return image_batch |
|
References
- Huang, H.-Y.; Ciou, A.-J. Copy-Move Forgery Detection for Image Forensics Using the Superpixel Segmentation and the Helmert Transformation. EURASIP J. Image Video Process. 2019, 2019, 68. [Google Scholar] [CrossRef]
- Amerini, I.; Ballan, L.; Caldelli, R.; Del Bimbo, A.; Del Tongo, L.; Serra, G. Copy-Move Forgery Detection and Localization by Means of Robust Clustering with J-Linkage. Signal Process. Image Commun. 2013, 28, 659–669. [Google Scholar] [CrossRef]
- Amerini, I.; Caldelli, R.; Bimbo, A.D.; Fuccia, A.D.; Saravo, L.; Rizzo, A.P. Copy-Move Forgery Detection from Printed Images. In Proceedings of the Media Watermarking, Security, and Forensics 2014, San Francisco, CA, USA, 3–5 February 2014; SPIE: Bellingham, WA, USA, 2014; Volume 9028, pp. 336–345. [Google Scholar]
- Mahmood, T.; Nawaz, T.; Irtaza, A.; Ashraf, R.; Shah, M.; Mahmood, M.T. Copy-Move Forgery Detection Technique for Forensic Analysis in Digital Images. Math. Probl. Eng. 2016, 2016, e8713202. [Google Scholar] [CrossRef]
- Warif, N.B.A.; Idris, M.Y.I.; Wahab, A.W.A.; Ismail, N.-S.N.; Salleh, R. A Comprehensive Evaluation Procedure for Copy-Move Forgery Detection Methods: Results from a Systematic Review. Multimed. Tools Appl. 2022, 81, 15171–15203. [Google Scholar] [CrossRef]
- Warif, N.B.A.; Wahab, A.W.A.; Idris, M.Y.I.; Ramli, R.; Salleh, R.; Shamshirband, S.; Choo, K.-K.R. Copy-Move Forgery Detection: Survey, Challenges and Future Directions. J. Netw. Comput. Appl. 2016, 75, 259–278. [Google Scholar] [CrossRef]
- Caldelli, R.; Amerini, I.; Costanzo, A. SIFT Match Removal and Keypoint Preservation through Dominant Orientation Shift. In Proceedings of the 2015 23rd European Signal Processing Conference (EUSIPCO), Nice, France, 31 August–4 September 2015; pp. 2062–2066. [Google Scholar]
- Amerini, I.; Barni, M.; Caldelli, R.; Costanzo, A. Counter-Forensics of SIFT-Based Copy-Move Detection by Means of Keypoint Classification. J. Image Video Proc. 2013, 2013, 18. [Google Scholar] [CrossRef]
- Aria, M.; Hashemzadeh, M.; Farajzadeh, N. QDL-CMFD: A Quality-Independent and Deep Learning-Based Copy-Move Image Forgery Detection Method. Neurocomputing 2022, 511, 213–236. [Google Scholar] [CrossRef]
- El_Tokhy, M.S. Development of Precise Forgery Detection Algorithms in Digital Radiography Images Using Convolution Neural Network. Appl. Soft Comput. 2023, 138, 110174. [Google Scholar] [CrossRef]
- Amerini, I.; Ballan, L.; Caldelli, R.; Del Bimbo, A.; Serra, G. A SIFT-Based Forensic Method for Copy–Move Attack Detection and Transformation Recovery. IEEE Trans. Inf. Forensics Secur. 2011, 6, 1099–1110. [Google Scholar] [CrossRef]
- Babu, S.B.G.T.; Rao, C.S. An Optimized Technique for Copy–Move Forgery Localization Using Statistical Features. ICT Express 2022, 8, 244–249. [Google Scholar] [CrossRef]
- Aydın, Y. A New Copy-Move Forgery Detection Method Using LIOP. J. Vis. Commun. Image Represent. 2022, 89, 103661. [Google Scholar] [CrossRef]
- Elaskily, M.A.; Elnemr, H.A.; Sedik, A.; Dessouky, M.M.; El Banby, G.M.; Elshakankiry, O.A.; Khalaf, A.A.M.; Aslan, H.K.; Faragallah, O.S.; Abd El-Samie, F.E. A Novel Deep Learning Framework for Copy-Moveforgery Detection in Images. Multimed. Tools Appl. 2020, 79, 19167–19192. [Google Scholar] [CrossRef]
- Kuznetsov, O.; Frontoni, E.; Romeo, L.; Rosati, R. Enhancing Copy-Move Forgery Detection through a Novel CNN Architecture and Comprehensive Dataset Analysis. Multimed. Tools Appl. 2024, 83, 59783–59817. [Google Scholar] [CrossRef]
- Kumar, S.; Gupta, S.K.; Kaur, M.; Gupta, U. VI-NET: A Hybrid Deep Convolutional Neural Network Using VGG and Inception V3 Model for Copy-Move Forgery Classification. J. Vis. Commun. Image Represent. 2022, 89, 103644. [Google Scholar] [CrossRef]
- Wang, J.; Gao, X.; Nie, J.; Wang, X.; Huang, L.; Nie, W.; Jiang, M.; Wei, Z. Strong Robust Copy-Move Forgery Detection Network Based on Layer-by-Layer Decoupling Refinement. Inf. Process. Manag. 2024, 61, 103685. [Google Scholar] [CrossRef]
- Ravula, J.; Singh, N. GAN-ViT-CMFD: A Novel Framework Integrating Generative Adversarial Networks and Vision Transformers for Enhanced Copy-Move Forgery Detection and Classification with Spectral Clustering. Intell. Syst. Appl. 2025, 26, 200524. [Google Scholar] [CrossRef]
- Nazir, T.; Nawaz, M.; Masood, M.; Javed, A. Copy Move Forgery Detection and Segmentation Using Improved Mask Region-Based Convolution Network (RCNN). Appl. Soft Comput. 2022, 131, 109778. [Google Scholar] [CrossRef]
- Zakharov, D.; Kuznetsov, O.; Frontoni, E.; Kryvinska, N. Embedding Non-Distortive Cancelable Face Template Generation. In Proceedings of the Artificial Intelligence and Soft Computing, Zakopane, Poland, 16–20 June 2024; Rutkowski, L., Scherer, R., Korytkowski, M., Pedrycz, W., Tadeusiewicz, R., Zurada, J.M., Eds.; Springer Nature: Cham, Switzerland, 2025; pp. 212–223. [Google Scholar]
- Shaushenova, A.; Kuznetsov, O.; Nurpeisova, A.; Ongarbayeva, M. Implementation of Kolmogorov–Arnold Networks for Efficient Image Processing in Resource-Constrained Internet of Things Devices. Technologies 2025, 13, 155. [Google Scholar] [CrossRef]
- Kuznetsov, O.; Zakharov, D.; Frontoni, E.; Napoli, C.; Ivanochko, I. A Novel Approach to Cancelable Biometrics Through Deep Learning Distortion Metrics. In Proceedings of the Artificial Intelligence and Soft Computing, Zakopane, Poland, 16–20 June 2024; Rutkowski, L., Scherer, R., Korytkowski, M., Pedrycz, W., Tadeusiewicz, R., Zurada, J.M., Eds.; Springer Nature: Cham, Switzerland, 2025; pp. 142–152. [Google Scholar]
Figure 1.
Copy-move forgery example: (a) original image, (b) forged image with duplicated regions highlighted in red circles.
Figure 1.
Copy-move forgery example: (a) original image, (b) forged image with duplicated regions highlighted in red circles.
Figure 2.
Copy-move forgery in conflict imagery: (a) authentic scene, (b) manipulated image showing duplicated debris elements (highlighted in red circles).
Figure 2.
Copy-move forgery in conflict imagery: (a) authentic scene, (b) manipulated image showing duplicated debris elements (highlighted in red circles).
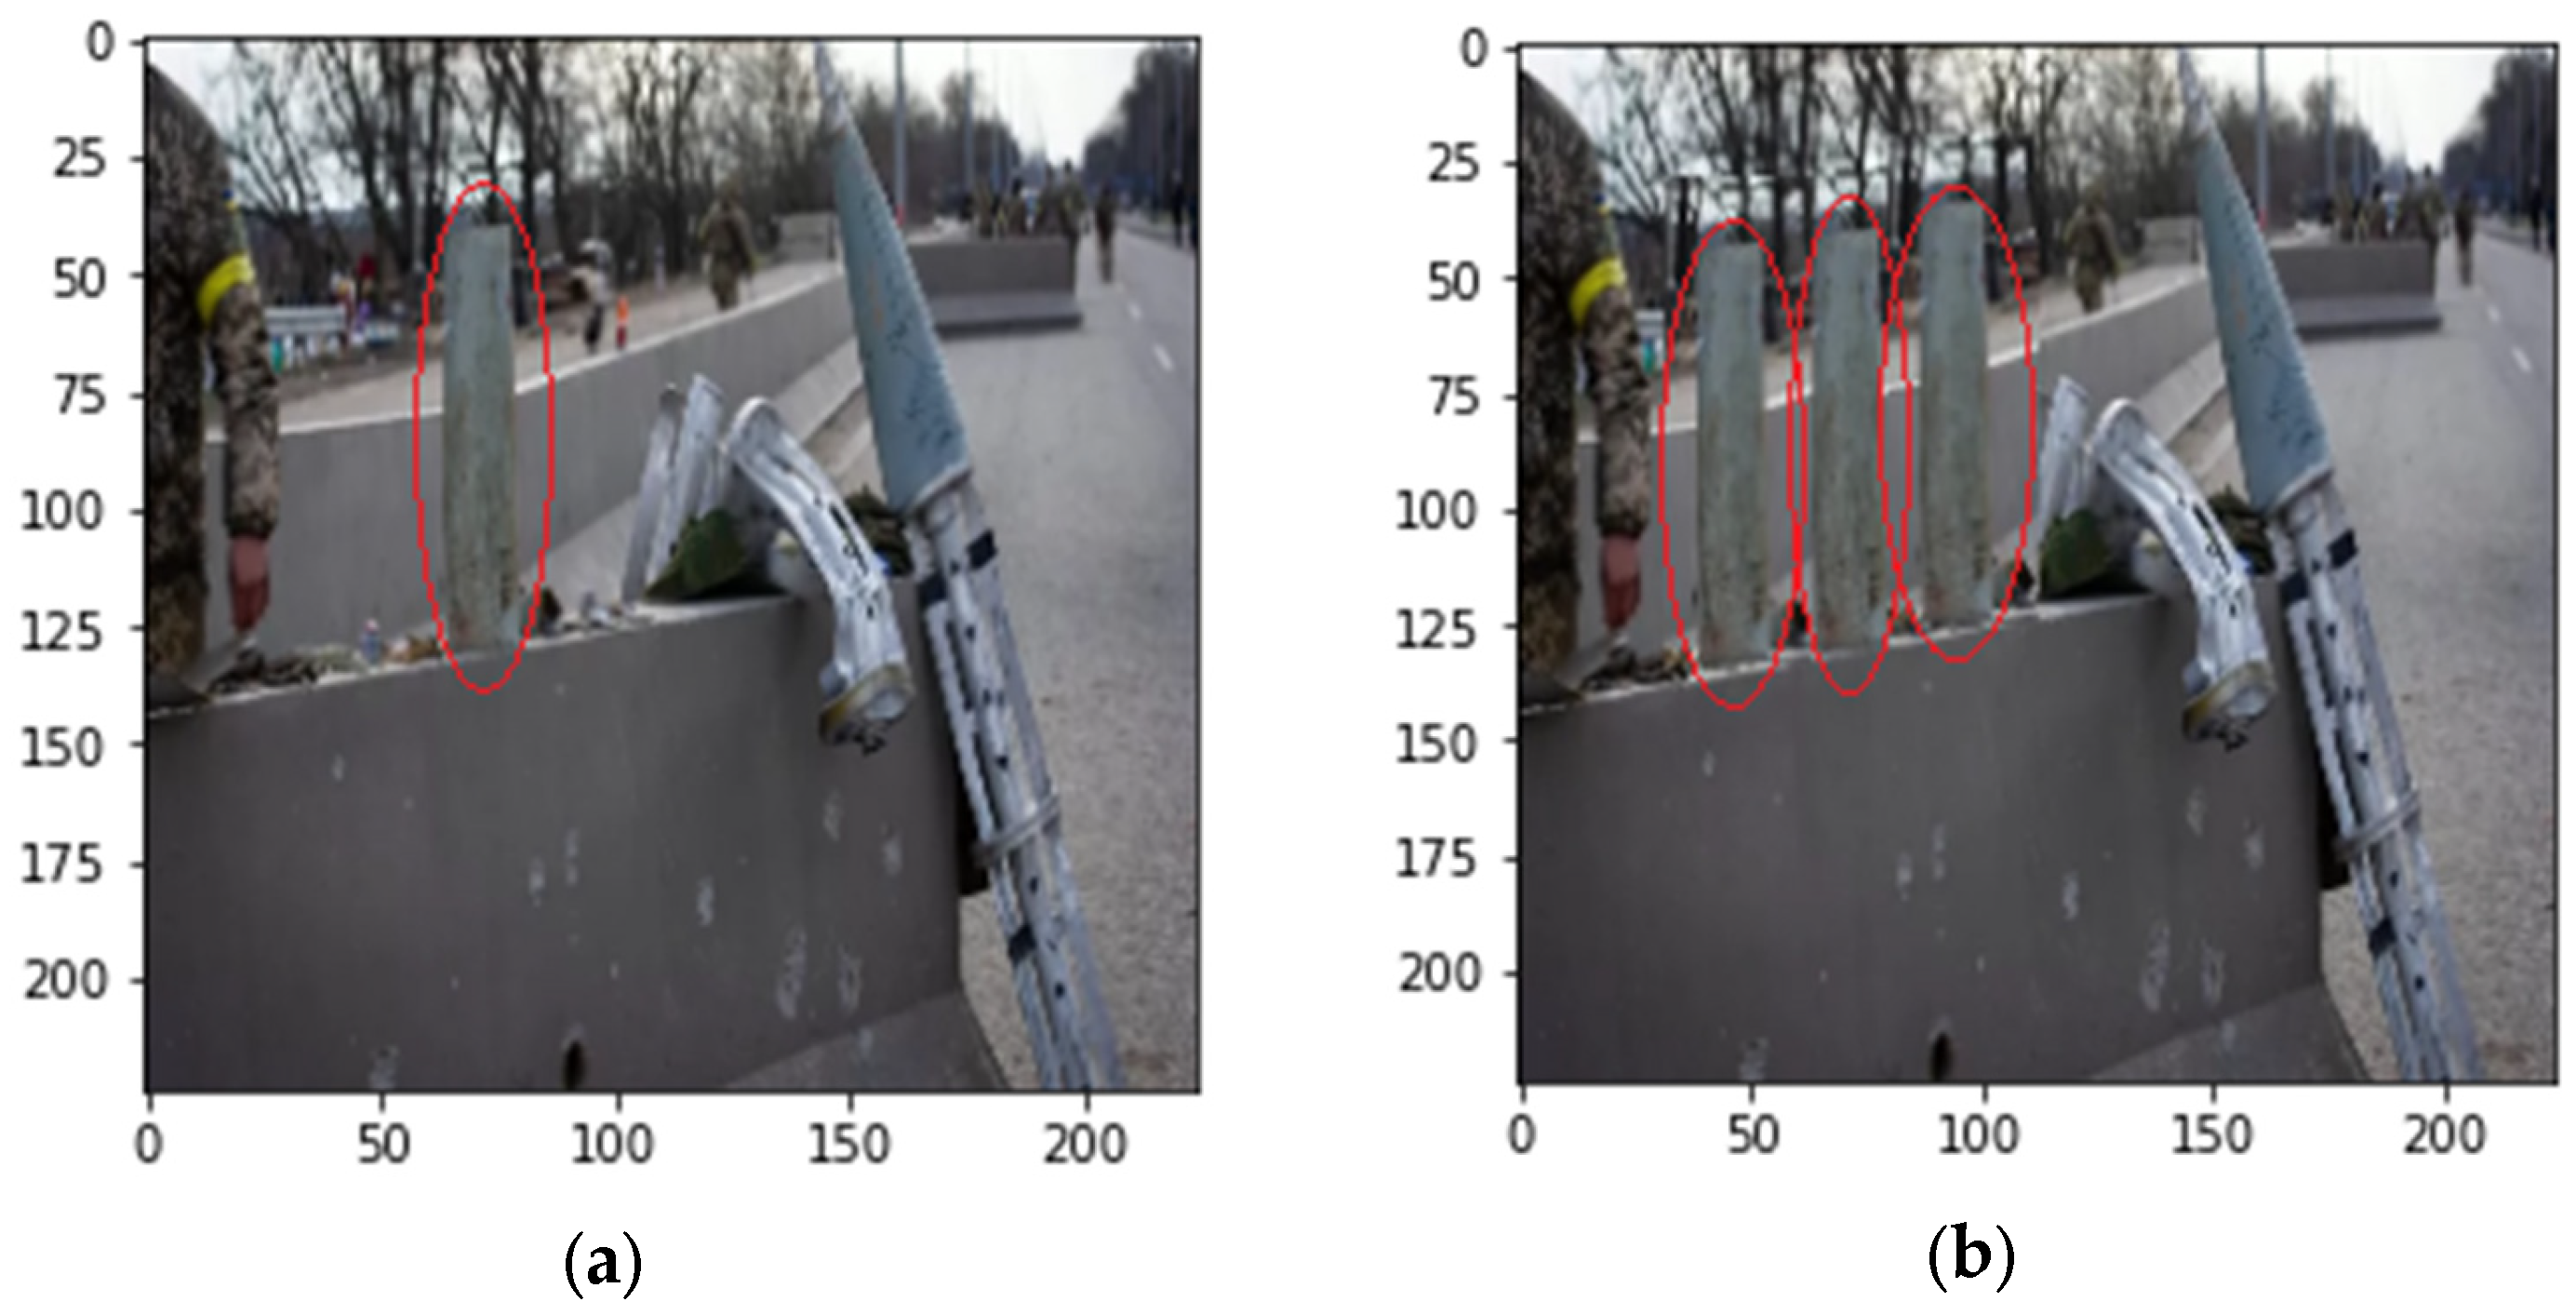
Figure 3.
Complex copy-move manipulation: (a) original military scene, (b) forged image with multiple copied objects highlighted in red circles.
Figure 3.
Complex copy-move manipulation: (a) original military scene, (b) forged image with multiple copied objects highlighted in red circles.
Figure 4.
Methodology flowchart for CNN-Based Copy-Move Forgery Detection.
Figure 4.
Methodology flowchart for CNN-Based Copy-Move Forgery Detection.
Figure 5.
CNN Architecture for Copy-Move Forgery Detection.
Figure 5.
CNN Architecture for Copy-Move Forgery Detection.
Figure 6.
Training and validation accuracy/loss curves for CoMoFoD dataset over 50 epochs, showing convergence without significant overfitting.
Figure 6.
Training and validation accuracy/loss curves for CoMoFoD dataset over 50 epochs, showing convergence without significant overfitting.
Figure 7.
Confusion matrices of the baseline model (left) and the optimized augmentation model (right) on the CoMoFoD dataset after 50 training epochs show similar performance with slight differences in misclassifications.
Figure 7.
Confusion matrices of the baseline model (left) and the optimized augmentation model (right) on the CoMoFoD dataset after 50 training epochs show similar performance with slight differences in misclassifications.
Figure 8.
Training and validation curves for the coverage dataset over 100 epochs showing an increasing divergence between the training and validation losses, indicating a severe case of overfitting.
Figure 8.
Training and validation curves for the coverage dataset over 100 epochs showing an increasing divergence between the training and validation losses, indicating a severe case of overfitting.
Figure 9.
Example images from the coverage dataset showing a correctly classified image (a) and a misclassified image (b), both with the corresponding manipulation regions highlighted.
Figure 9.
Example images from the coverage dataset showing a correctly classified image (a) and a misclassified image (b), both with the corresponding manipulation regions highlighted.
Figure 10.
Training and validation metrics on the CASIA v2 dataset showing improved performance up to 25 epochs, after which overfitting is observed, confirmed by increasing validation loss and reaching a plateau in accuracy.
Figure 10.
Training and validation metrics on the CASIA v2 dataset showing improved performance up to 25 epochs, after which overfitting is observed, confirmed by increasing validation loss and reaching a plateau in accuracy.
Figure 11.
Performance comparison between CoMoFoD, Coverage and CASIA v2 datasets, showing accuracy, F1-score, TPR and TNR considering optimal epoch settings for each dataset.
Figure 11.
Performance comparison between CoMoFoD, Coverage and CASIA v2 datasets, showing accuracy, F1-score, TPR and TNR considering optimal epoch settings for each dataset.
Figure 12.
Validation accuracy for the three datasets across different training epochs.
Figure 12.
Validation accuracy for the three datasets across different training epochs.
Figure 13.
Activation maps of the third convolutional layer (Conv2D-64) of correctly classified images from the CoMoFoD datasets. The first six feature maps are shown to highlight the learned patterns and representational differences between the datasets.
Figure 13.
Activation maps of the third convolutional layer (Conv2D-64) of correctly classified images from the CoMoFoD datasets. The first six feature maps are shown to highlight the learned patterns and representational differences between the datasets.
Table 1.
Detailed CNN Architecture Specifications.
Table 1.
Detailed CNN Architecture Specifications.
| Layer Type | Filters/Units | Kernel | Activation | Dropout |
|---|
| Input | - | 224 × 224 × 3 | - | - |
| Conv2D-1 | 16 | 3 × 3 | ReLU | - |
| AvgPool2D-1 | - | 2 × 2 | - | - |
| Conv2D-2 | 32 | 3 × 3 | ReLU | - |
| AvgPool2D-2 | - | 2 × 2 | - | - |
| Conv2D-3 | 64 | 3 × 3 | ReLU | - |
| AvgPool2D-3 | - | 2 × 2 | - | - |
| Conv2D-4 | 128 | 3 × 3 | ReLU | - |
| AvgPool2D-4 | - | 2 × 2 | - | - |
| Conv2D-5 | 256 | 3 × 3 | ReLU | - |
| AvgPool2D-5 | - | 2 × 2 | - | - |
| Conv2D-6 | 512 | 3 × 3 | ReLU | - |
| AvgPool2D-6 | - | 2 × 2 | - | - |
| GlobalAvgPool | - | - | - | - |
| Dense | 2 | - | Softmax | 0.10–0.15 * |
Table 2.
Performance metrics on CoMoFoD dataset at different epoch counts.
Table 2.
Performance metrics on CoMoFoD dataset at different epoch counts.
| Epochs | Accuracy (%) | F1-Score | TPR | TNR | Training Loss | Validation Loss |
|---|
| 15 | 71.25 | 0.75 | 0.84 | 0.58 | 0.5627 | 0.4792 |
| 25 | 81.55 | 0.817 | 0.81 | 0.82 | 0.3822 | 0.3038 |
| 35 | 87.40 | 0.874 | 0.89 | 0.86 | 0.2934 | 0.2844 |
| 50 | 94.80 | 0.948 | 0.95 | 0.95 | 0.1537 | 0.1724 |
| 75 | 95.60 | 0.957 | 0.96 | 0.95 | 0.0998 | 0.1326 |
| 100 | 95.90 | 0.959 | 0.96 | 0.96 | 0.0764 | 0.1305 |
Table 3.
Effect of regularization techniques on CoMoFoD dataset (50 epochs).
Table 3.
Effect of regularization techniques on CoMoFoD dataset (50 epochs).
| Configuration | Accuracy (%) | F1-Score | TPR | TNR | Validation Loss |
|---|
| Base model | 94.80 | 0.948 | 0.95 | 0.95 | 0.1724 |
| L2 regularization (λ = 0.0005) | 93.50 | 0.935 | 0.94 | 0.93 | 0.2139 |
| Reduced learning rate (0.0005) | 92.30 | 0.923 | 0.92 | 0.93 | 0.2532 |
| L2 + reduced learning rate | 91.20 | 0.912 | 0.91 | 0.91 | 0.2741 |
Table 4.
Performance with various augmentation strategies on CoMoFoD (50 epochs).
Table 4.
Performance with various augmentation strategies on CoMoFoD (50 epochs).
| Augmentation Strategy | Accuracy (%) | F1-Score | TPR | TNR | Augmentation Strategy |
|---|
| No augmentation | 94.80 | 0.948 | 0.95 | 0.95 | No augmentation |
| Standard augmentation (initial test) | 49.20 | 0.327 | 0.29 | 0.69 | Standard augmentation (initial test) |
| Standard + 3 × 3 blur filter | 50.40 | 0.342 | 0.32 | 0.69 | Standard + 3 × 3 blur filter |
| Standard + 5 × 5 blur filter | 50.90 | 0.348 | 0.33 | 0.69 | Standard + 5 × 5 blur filter |
| Optimized augmentation (revised) | 90.80 | 0.91 | 0.91 | 0.91 | Optimized augmentation (revised) |
Table 5.
Performance metrics on Coverage dataset at different epoch counts.
Table 5.
Performance metrics on Coverage dataset at different epoch counts.
| Epochs | Accuracy (%) | F1-Score | TPR | TNR | Training Loss | Validation Loss |
|---|
| 15 | 27.50 | 0.293 | 0.30 | 0.25 | 0.6848 | 0.6969 |
| 25 | 7.50 | 0.098 | 0.10 | 0.05 | 0.6035 | 0.7510 |
| 35 | 17.50 | 0.154 | 0.15 | 0.20 | 0.5242 | 1.0695 |
| 50 | 7.50 | 0.051 | 0.05 | 0.10 | 0.4731 | 1.2315 |
| 100 | 7.50 | 0.051 | 0.05 | 0.10 | 0.3592 | 1.5140 |
Table 6.
Performance metrics on CASIA v2 dataset at different epoch counts.
Table 6.
Performance metrics on CASIA v2 dataset at different epoch counts.
| Epochs | Accuracy (%) | F1-Score | TPR | TNR | Training Loss | Validation Loss |
|---|
| 15 | 63.04 | 0.751 | 0.91 | 0.19 | 0.5984 | 0.6729 |
| 25 | 67.00 | 0.789 | 0.93 | 0.16 | 0.4326 | 0.8064 |
| 35 | 63.17 | 0.744 | 0.80 | 0.29 | 0.3872 | 1.3142 |
Table 7.
Effect of regularization techniques on CASIA v2 dataset considering 25 epochs.
Table 7.
Effect of regularization techniques on CASIA v2 dataset considering 25 epochs.
| Configuration | Accuracy (%) | F1-Score | TPR | TNR | Validation Loss |
|---|
| Base model | 67.00 | 0.789 | 0.93 | 0.16 | 0.8064 |
| L2 regularization (λ = 0.0005) | 68.75 | 0.792 | 0.87 | 0.33 | 0.7215 |
| Reduced learning rate (0.0005) | 69.50 | 0.799 | 0.85 | 0.39 | 0.6932 |
Table 8.
Optimal configurations and performance metrics across datasets.
Table 8.
Optimal configurations and performance metrics across datasets.
| Dataset | Optimal Configuration | Accuracy (%) | F1-Score | TPR | TNR |
|---|
| CoMoFoD | 100 epochs + optimized augmentation | 95.90 ± 0.8 | 0.959 ± 0.01 | 0.96 | 0.96 |
| Coverage | 15 epochs, no regularization | 27.50 ± 2.1 | 0.293 ± 0.05 | 0.30 | 0.25 |
| CASIA v2 | 25 epochs + reduced learning rate | 69.50 ± 1.2 | 0.799 ± 0.02 | 0.85 | 0.39 |
Table 9.
Comparative analysis of dataset characteristics.
Table 9.
Comparative analysis of dataset characteristics.
| Characteristic | CoMoFoD | Coverage | CASIA v2 |
|---|
| Number of images | 10,000 | 200 | 4975 |
| Class balance (authentic/tampered) | 5000/5000 | 100/100 | 1701/3274 |
| Image resolution range | Uniform | Variable | Variable |
| Manipulation complexity | Moderate | High | Moderate |
| Post-processing variety | High | Low | Medium |
Table 10.
Performance comparison with state-of-the-art methods on CoMoFoD dataset.
Table 10.
Performance comparison with state-of-the-art methods on CoMoFoD dataset.
| Method | Year | Accuracy (%) | F1-Score | Key Approach |
|---|
| Our CNN model | 2025 | 95.90 | 0.959 | Six-layer CNN with optimized augmentation |
| Elaskily et al. [14] | 2020 | 100.00 | 1.000 | Six-layer CNN architecture |
| Kumar et al. (VI-NET) [16] | 2022 | 99.00 | 0.990 | Hybrid VGG16 and Inception V3 |
| Nazir et al. [19] | 2022 | 98.12 * | 0.981 | Mask-RCNN with DenseNet-41 |
| Aria et al. (QDL-CMFD) [9] | 2022 | 98.22 * | 0.982 | Dual-branch CNN with GAN enhancement |
| Wang et al. (DRNet) [17] | 2024 | 97.60 * | 0.976 | Layer-by-layer decoupling refinement |
| Aydın (LIOP) [13] | 2022 | 92.98 | 0.930 | Local Intensity Order Pattern features |
| Disclaimer/Publisher’s Note: The statements, opinions and data contained in all publications are solely those of the individual author(s) and contributor(s) and not of MDPI and/or the editor(s). MDPI and/or the editor(s) disclaim responsibility for any injury to people or property resulting from any ideas, methods, instructions or products referred to in the content. |
© 2025 by the authors. Licensee MDPI, Basel, Switzerland. This article is an open access article distributed under the terms and conditions of the Creative Commons Attribution (CC BY) license (https://creativecommons.org/licenses/by/4.0/).


 ,
, 


