Article

Machine Learning Classification of Fossilized Pectinodon bakkeri Teeth Images: Insights into Troodontid Theropod Dinosaur Morphology

1
School of Computing, Southern Adventist University, 4881 Taylor Cir, Collegedale, TN 37315, USA
2
Department of Biology, Southern Adventist University, 4881 Taylor Cir, Collegedale, TN 37315, USA
*
Author to whom correspondence should be addressed.
Mach. Learn. Knowl. Extr. 2025, 7(2), 45; https://doi.org/10.3390/make7020045
Submission received: 3 April 2025 / Revised: 9 May 2025 / Accepted: 19 May 2025 / Published: 21 May 2025
(This article belongs to the Special Issue Deep Learning in Image Analysis and Pattern Recognition, 2nd Edition)

Abstract

:
Although the manual classification of microfossils is possible, it can become burdensome. Machine learning offers an alternative that allows for automatic classification. Our contribution is to use machine learning to develop an automated approach for classifying images of Pectinodon bakkeri teeth. This can be expanded for use with many other species. Our approach is composed of two steps. First, PCA and K-means were applied to a numerical dataset with 459 samples collected at the Hanson Ranch Bonebed in eastern Wyoming, containing the following features: crown height, fore-aft basal length, basal width, anterior denticles, and posterior denticles per millimeter. The results obtained in this step were used to automatically organize the P. bakkeri images from two out of three clusters generated. Finally, the tooth images were used to train a convolutional neural network with two classes. The model has an accuracy of 71%, a precision of 71%, a recall of 70.5%, and an F1-score of 70.5%.

1. Introduction

Species identification of extinct creatures represented only by fossils is challenging. Often it takes decades of collecting, naming, comparing, accounting for species variability, gender, age, environment, and re-naming to solidify a species name (e.g., [1,2,3]). Duan [4] elaborates on the additional challenges of finding an expert in a particular field, examining external morphology, and comparing with the relevant literature and previously identified specimens. Other research proposes manual processes for the classification of fossils [5,6,7].
Vertebrate microfossils are even more challenging. They are defined as measuring less than 5 cm in maximum dimension and are often concentrated in localized areas called “microsites” [8]. Often, hundreds of kilograms of material must be processed to find a small number of specimens [9,10,11]. Microfossils are most commonly either hand-picked at the surface [12,13] or sifted in various grades of mesh [14]. One mm screening mesh is often the chosen minimal size [15], but smaller fish teeth [16] and other specimens, such as foraminifera [17], need even finer mesh sizes. However, these are inefficient and subjective approaches to research.
Streamlining this process utilizing fossilized aquatic invertebrates is most advanced in the petroleum industry [18]. Computational approaches for identifying fossils on cut and polished hard matrices [19] and diluting concentrated specimens in soft matrices [20,21] precede photographing specimens mounted on slides. Large numbers can be accumulated rapidly with these techniques.
Even with large numbers of specimens, there remain many challenges with incorporating computers into taxonomical delineation, including limited species descriptions, synonyms in described species, and limited expertise in taxonomy [22]. However, the landscape of possibilities is changing with advancing computer abilities and artificial intelligence (AI). In the context of AI, deep learning has been used recently for this purpose [4,19,23,24,25,26,27,28,29,30,31,32,33]. These approaches involve the visualization of specimens and computer training to sort them according to physical parameters. Other approaches, such as those described by [34,35], focus on applying classical machine-learning algorithms to numerical data.
AI has seen limited use in paleontology outside the petroleum field. However, because teeth are often one of the most prolific and long-lasting remains of animal decomposition, they make good candidates for specimen collections [29]. Identifying vertebrate microfossils enables the reconstruction of ancient local environments and the species interactions that could have occurred. Large paleontological specimens are more typically identified, but the microfossils clarify and greatly expand the full view of these environments.
Teeth are often the only remnant available for a particular species, leading to limited physical features for identification [36]. Historically, one of the most challenging species for identification has been in the Troodontidae, specifically Pectinodon bakkeri. The limited availability of teeth, no other cranial or post-cranial remains having been identified, and confusing nomenclature represent the continuing challenges of identifying this species [7,37,38,39].
The occasional recovery of a P. bakkeri tooth from the main quarries of the Hanson Ranch bonebed in eastern Wyoming from 1996 to 2016 was surprisingly augmented by two citizen scientists in 2016, who recovered over 300 complete or partial teeth in two Western Harvester anthills. The recognition of a microsite where these anthills resided in 2022 and 2023, and the introduction of sieving, resulted in approximately 200 additional teeth being recovered.
This large number of teeth is rare for troodontids, but has allowed us to manually measure their physical parameters and then utilize them for training machine learning models. Specifically, this research aims to apply machine learning for the automatic classification of images of fossilized teeth of P. bakkeri. We were interested in testing for both inter- and intra-species teeth. While the existing literature provides valuable insights into the application of deep learning techniques for the classification of microfossil images, our study differs by incorporating unsupervised learning techniques to understand the underlying characteristics of microfossils and then use this knowledge for the automatic classification of images of P. bakkeri’s teeth using a convolutional neural network (CNN). A CNN is a regularized type of feedforward artificial neural network. It learns features via filters or kernel optimization. Its hierarchical structure enables understanding complex components by breaking them down into simpler ones. Unlike other researchers using machine learning to classify the evolutionary relationships of many species (e.g., [40,41]), we suggest applying machine learning to small-batch collections, which are everyday challenges for paleontologists.
We applied Principal Component Analysis (PCA) and K-Means, two unsupervised machine learning techniques, to a tooth measurement dataset with numerical data of 459 useful samples (i.e., with complete feature data for the analysis) out of 482 samples. First, we applied PCA to understand the underlying patterns in the dataset. Then, we applied K-Means to determine the clusters in which the images would be classified.
The numerical dataset includes the following variables: crown height, fore-aft basal length, basal width, presence of anterior denticles, and posterior denticles per mm. Each numerical sample maps to an image of that sample to organize the images according to the previously generated clusters. Each cluster was considered a class to train the CNN model. The dataset and the source code used in the experiments are publicly available at https://github.com/jacobabahn/MicrofossilResearch (accessed on 18 May 2025).
This paper is structured as follows. Section 2 presents the materials and methods. Section 3 presents the results. Section 4 presents the discussion. Finally, Section 5 presents the conclusions and future work.

2. Materials and Methods

The IBM Foundational Methodology for Data Science was followed in this research project. The numerical dataset used, with 459 P. bakkeri tooth samples, has the following variables:
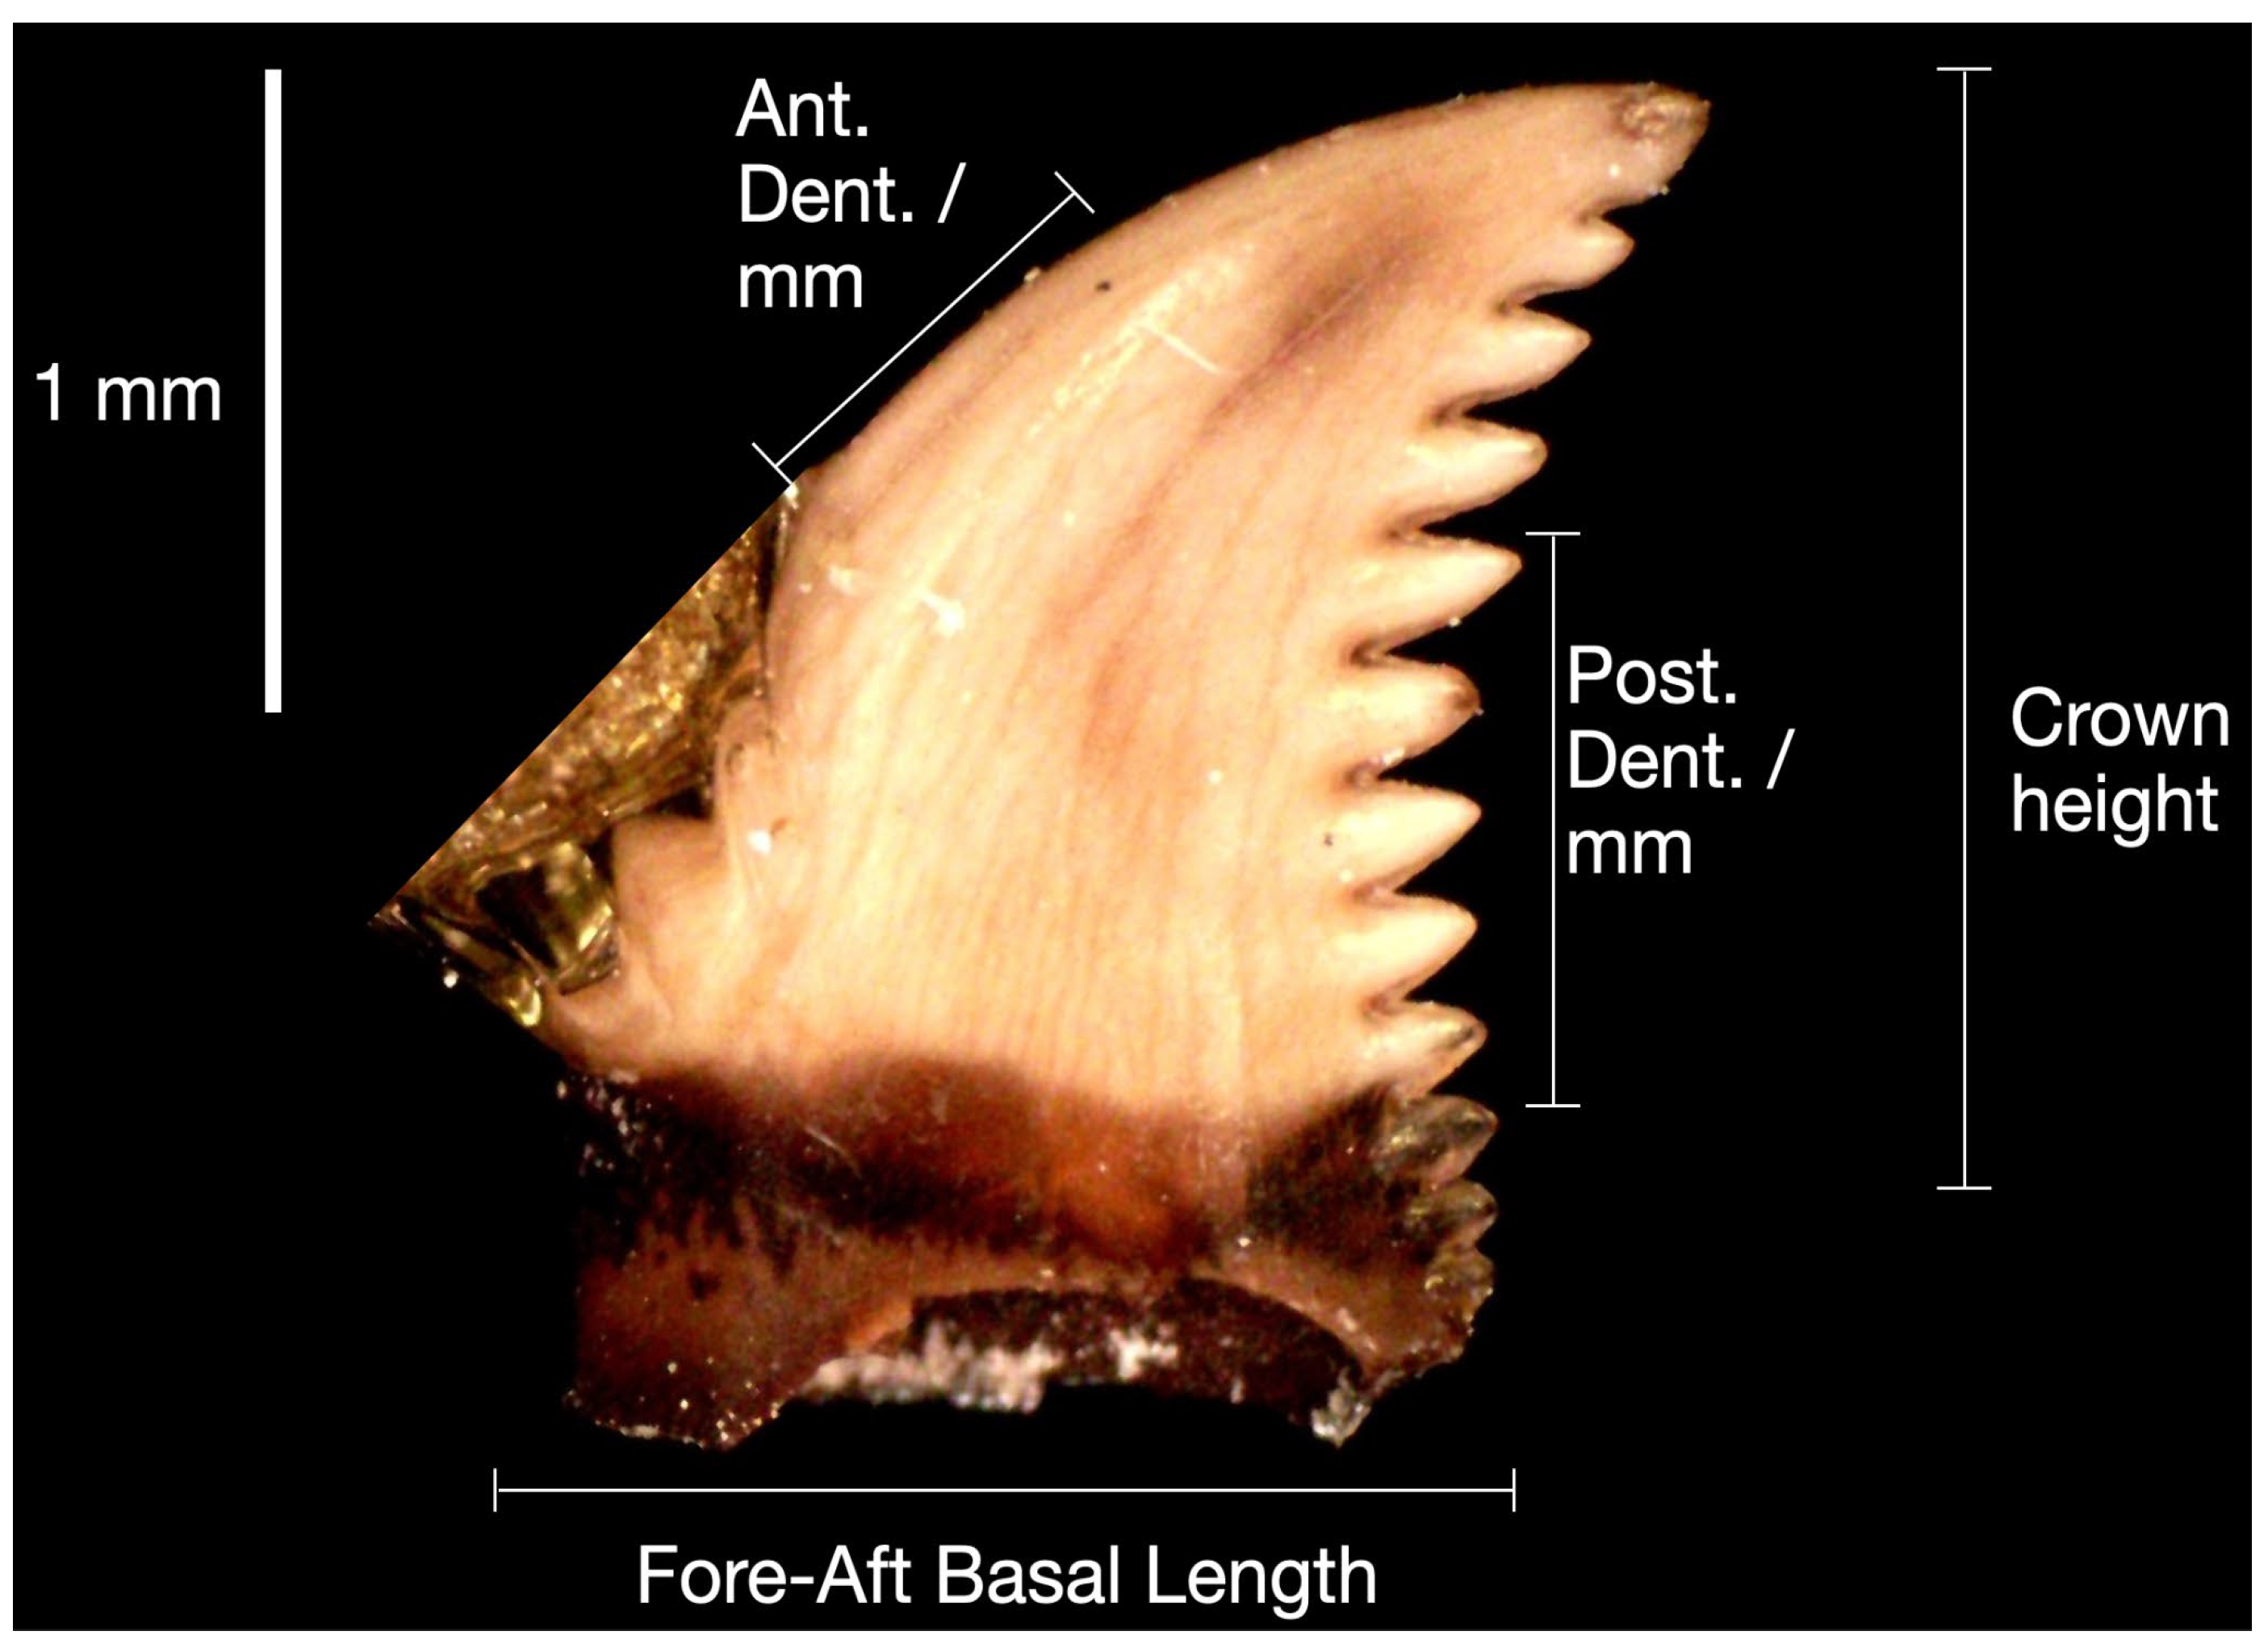
  • Crown Height: the total height of the tooth.
  • Fore-Aft Basal Length: the length of the base of the tooth, from the front to the back.
  • Basal Width: the width of the tooth’s base at its widest dimension.
  • Posterior Denticles per Millimeter: the number of small, pointed structures called denticles located on the posterior carina of a tooth, in one millimeter of tooth length.
  • Anterior Denticles: presence or absence of anterior denticles.
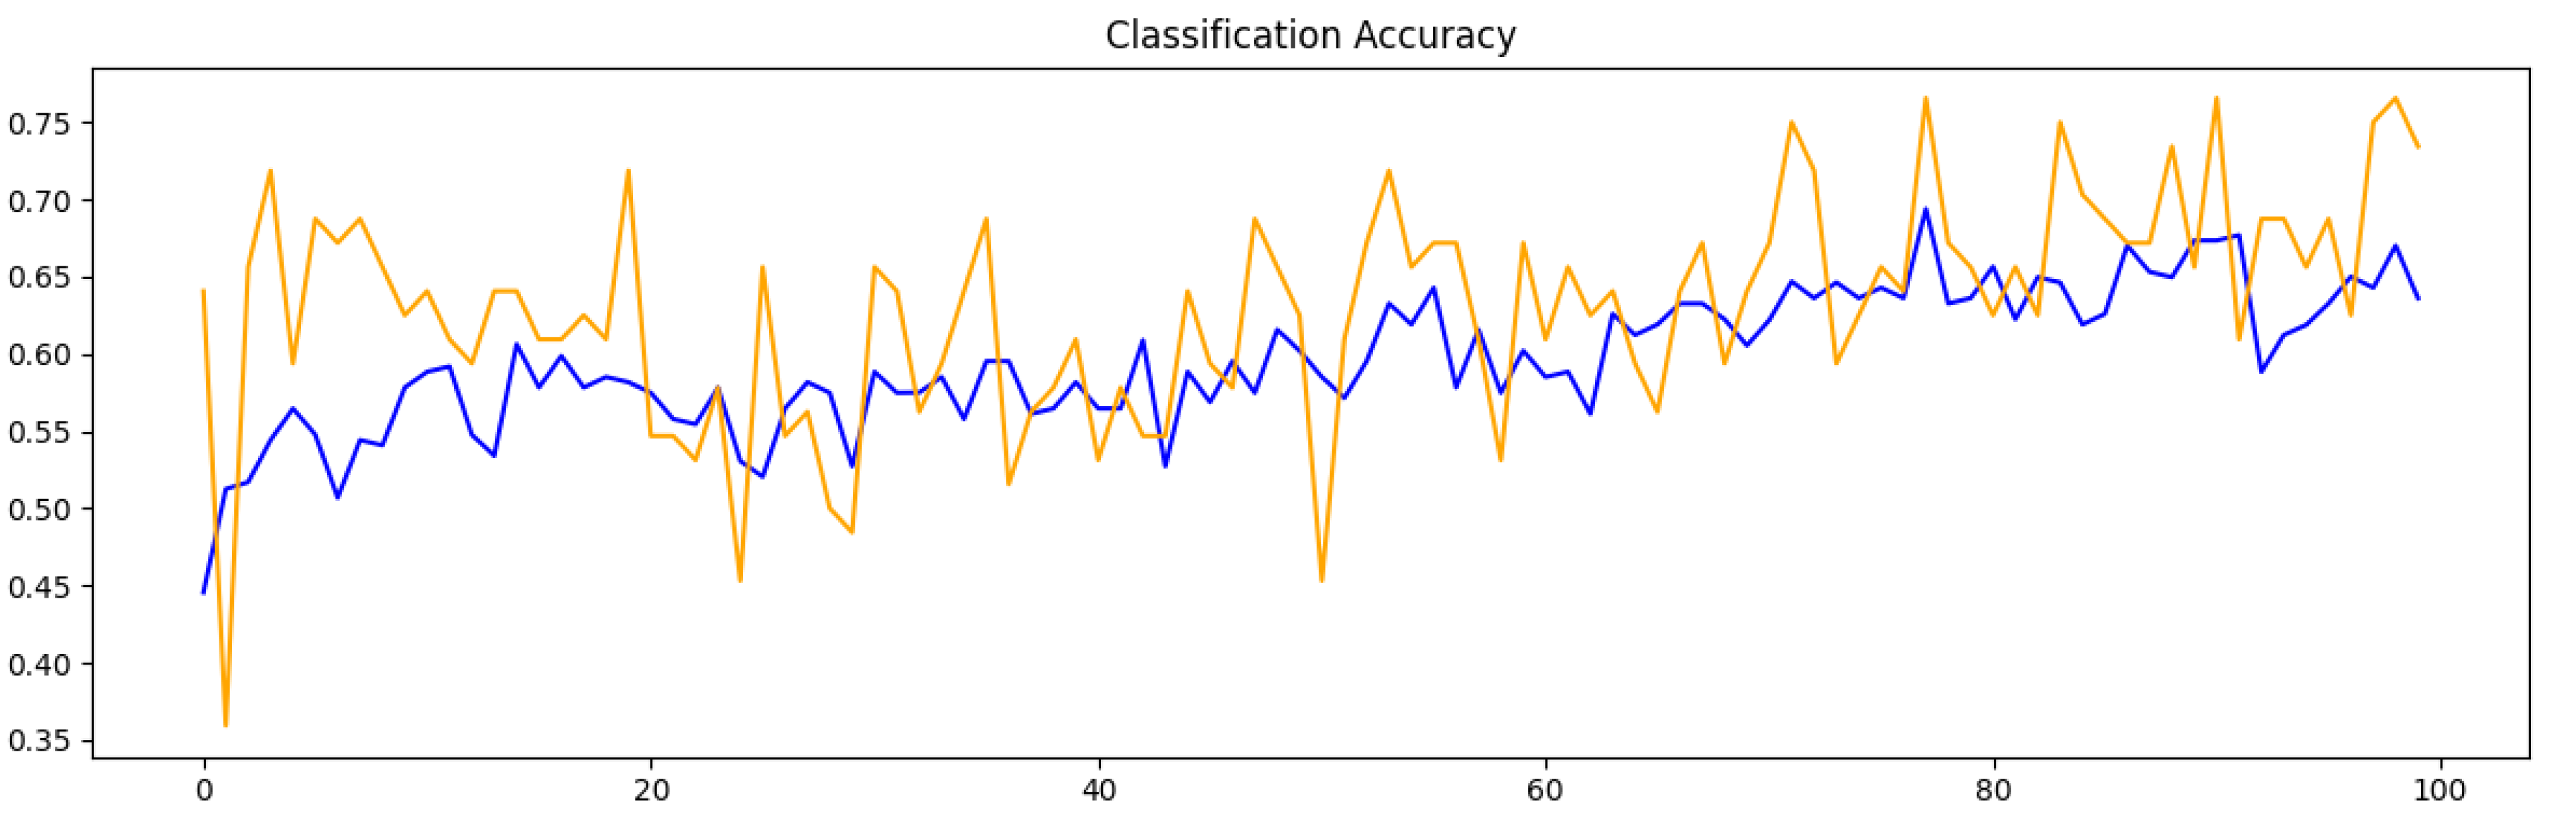
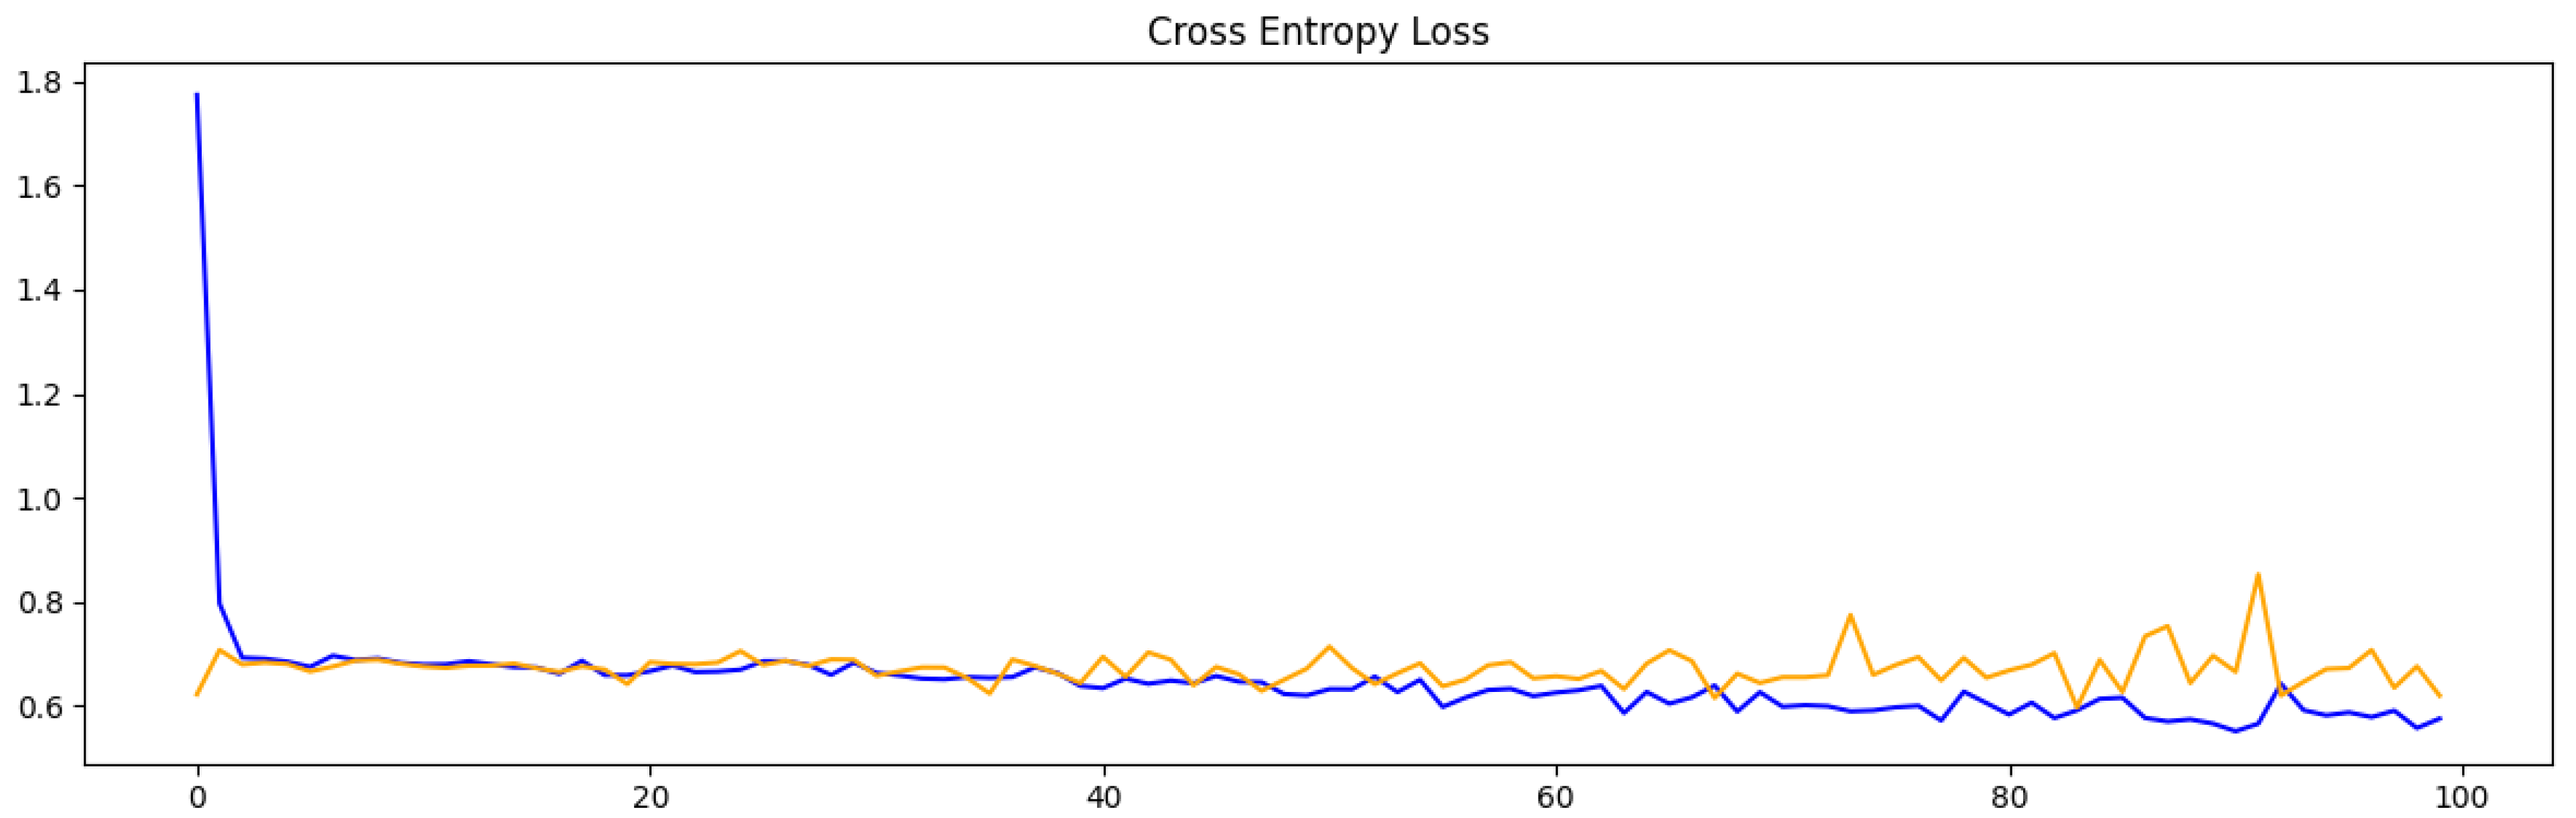
R was used to create PCA and K-Means models from the numerical dataset containing measurement values of the teeth. The PCA model let us understand the underlying variables of the collected microfossils. The K-Means model let us organize the samples into clusters. The Elbow Method and the Silhouette Plot were used to find the number of clusters. Then, a CNN was created to develop a classification model of P. bakkeri tooth images according to the clusters found with K-Means. Keras was used to create the CNN.
Figure 1 shows an example of an image in JPG format used in this study. Pictures were taken using a Dino-Lite Edge 3.0 digital microscope. The original images were cropped to remove extra information, such as mounting pins (Figure 2).
The image dataset, which had 412 images, was grouped according to the K-means analysis conducted on the numerical dataset. Initially, 135 images were mapped to Cluster 1, 72 pictures were mapped to Cluster 2, and 206 images were mapped to Cluster 3. The imbalance caused by the small number of samples in Cluster 2 resulted in low accuracy in the initial classification models. Therefore, we tried to determine why they were not well represented. As we studied teeth in similar troodontids, we found that those in Cluster 2 belonged to a different species. Thus, they were removed from this study since we were focusing on just one species.
We used Keras’ image augmentation to balance the number of samples in Cluster 1, so Cluster 1 and Cluster 3 had the same number of images. Specifically, 71 images were added to Cluster 1 through image augmentation to reach 206 images in that cluster. Figure 3 and Figure 4 provide examples of images before and after augmentation, which in this case were rotation and a horizontal flip.
The images in Cluster 1 and Cluster 3 were used to train a classification model using a CNN, which is a specialized type of artificial neural network designed to process structured grid data-like images. Its key strength lies in its ability to automatically and adaptively learn spatial hierarchies of features, from edges to complex patterns, directly from raw data.
A CNN is structured with an input layer, hidden layers, and an output layer. Among the hidden layers, one or more perform convolution operations, which are fundamental for extracting spatial features from the input data. Specifically, the convolution operation is used for the following: (1) feature extraction: convolutions apply small, learnable filters to the input data (e.g., an image), performing element-wise multiplication (dot products) across regions; (2) localized processing: the filters move across the image, focusing on local features (e.g., edges, textures) and preserving spatial relationships; and (3) dimensionality reduction: multiple layers of convolutions help reduce data complexity while retaining key information, allowing the network to understand high-level patterns.
The CNN model was trained and deployed on a server with the following specifications: two AMD Rome EPYC 7F32 8C/16T 3.7 GB 128M CPUs, two NVIDIA Quadro RTX A4000 16 GB GPUs, 512 GB RDIMM, and two SSDs of 1.9 TB.

3. Results

According to the PCA results, most of the data’s variance (82.1%) is found in dimensions 1 and 2 (top of Figure 5). Looking at the correlation plot (bottom of Figure 5), it is possible to see the presence of every feature per dimension. In Dimension 1, the most relevant feature is crown height (CH). In Dimension 2, the main features represented are primarily posterior denticles per millimeter (PDM), and much less importantly, fore-aft basal length (FABL). PCA was useful in analyzing the underlying variables of the microfossil dataset. The results highlighted the contributions of specific features to the overall variance, offering insights into patterns that are not readily apparent from the raw data.
In this study, we did not use PCA numerical results as an input for K-Means clustering. This decision was based on the manageability of the dataset’s original variable count. Moreover, by directly using the original variables in K-Means, we ensured the interpretability of clustering results, preserving the inherent context and meaning associated with each feature.
The Elbow and Silhouette Methods (Figure 6) were used to determine the proper number of clusters for splitting up the data in K-Means. The Elbow Method gives a quick visual representation to spot the optimal number of clusters. Still, it can sometimes be subjective as the curve does not always form a clear elbow, requiring judgment in ambiguous cases. The Silhouette Method provides a more quantitative measure of clustering quality. We used both methods to determine the number of clusters. As per the results from those algorithms in Figure 6, the K-Means algorithm was executed with three clusters.
Performing the K-Means clustering on the numerical dataset rendered Cluster 1 with 177 samples, Cluster 2 with 76 samples, and Cluster 3 with 206 samples (Figure 7). Table 1 shows the feature averages per cluster. Cluster 1 contains the largest denticles according to all measurements but the fewest denticles per millimeter. Cluster 2 has the smallest denticles with the most posterior denticles per millimeter. Cluster 3 has teeth that are intermediate in size and, consequently, an intermediate number of denticles per millimeter. The split between Cluster 2 and Cluster 3, and the continuation between Cluster 1 and Cluster 3, caused us to question whether Cluster 2 represented the same species as the other two clusters. As a result, we decided to remove Cluster 2 in further experiments. Due to the limited or nonexistent jaws with the teeth of a variety of troodontids, we were unable to assign a specific species to these teeth.
A Python script automatically organized the teeth images according to the clusters. Two directories were generated corresponding to Clusters 1 and 3, with associated image samples. Table 2 summarizes the deep learning topology used to train the model to classify images in Clusters 1 and 3.
Our CNN topology has eight layers. The first layer applies a convolution operation to the images. The convolutional layer is the CNN’s core, carrying most of the network’s computational load. In this layer, a dot product’s output is calculated between the area of an input image and a weight matrix (i.e., filter). The filter slides through the image, repeating the dot product operation. It has an output shape of (None, 180, 180, 16), where the None represents the batch size, 180, 180 represent the number of pixels in the input, and 16 is the filter count (i.e., the number of filters or kernels applied to the input data). The next layer applies max pooling to the output of the previous layer. This grouping layer reduces the spatial dimension without affecting the depth. It has an output shape of (None, 90, 90, 16). Max pooling was used to reduce the original input pixels per image in half (i.e., 180 × 180 pixels into 90 × 90 pixels). The following layer performs a dropout on the previous layer and has an output shape of (None, 90, 90, 16). This layer removes the contribution of some artificial neurons towards the subsequent layers. It is a regularization technique that prevents overfitting. The next layer is another convolution layer with an output shape of (None, 90, 90, 32). The following layer is a max pooling layer with an output shape of (None, 45, 45, 32). The layer after this is a flatten layer, which has an output shape of (None, 64,800). This layer combines all the pixels from the previous layer’s output into a one-dimensional vector. The next layer performs a dropout, and the output shape is (None, 64). The final layer is dense with an output shape of (None, 2). A dense layer (or fully connected layer) connects every artificial neuron in the layer to every artificial neuron in the previous layer.
Eighty percent of the images were used for training and twenty percent for validation per cluster. The results for training the model through 100 epochs for each cluster are shown in Table 2. The number of epochs refers to the times the entire training dataset is passed through the model during the training process. Each epoch allows the model to learn from the data, adjusting its weights to minimize error. The classification accuracy and cross-entropy loss for each epoch are shown in Figure 8 and Figure 9, respectively. In both figures, the orange line represents the validation score, and the blue line the training score. The training score reflects the model’s performance on the data it was trained on, measuring how well the model has learned the patterns within this dataset. The validation score, on the other hand, evaluates the model’s performance on a separate dataset not used during training, serving as an indicator of how well the model generalizes to unseen data. These two lines are necessary to evaluate if the model is overfitted. A large gap between the two scores, with the training score being much higher, typically signals overfitting, where the model memorizes training data but fails to generalize effectively. In our case, our model is not overfitted. This suggests our model generalizes well to unseen data.

4. Discussion

Classifying fossil specimens in the Troodontidae (Theropoda) is particularly challenging due to the scarcity of remains, often limited to a few teeth per species. P. bakkeri has been especially difficult to identify because of its complex taxonomy and fragmentary fossil record. This study addresses these challenges by applying machine learning to analyze a collection of P. bakkeri teeth recovered from Hanson Ranch bonebed quarries, demonstrating how computational methods can enhance classification based on physical parameters.
In this research, we show an approach for automatically classifying images of fossilized P. bakkeri teeth using machine learning, contributing a methodology to the existing work in microfossil classification. Our study employs unsupervised learning (PCA and K-means clustering) to explore intrinsic patterns in numerical sample data. We demonstrated our approach with physical measurements such as crown height, basal length and width, and denticle patterns. Through clustering, we assigned labels to images of P. bakkeri teeth, which served as a basis for CNN model training.
PCA was particularly useful to understand the underlying variables of the collected microfossils. Specifically, the PCA results reveal how different features contribute to the overall variation in the data, helping us uncover patterns that would be hard to see in the raw data.
The K-Means model let us organize the samples into three clusters. Cluster 2 was notably different from the nearest other cluster, which is Cluster 3. However, Clusters 1 and 3 showed a continuum between the two, even though they were split into two clusters. Upon further examination of other dromaeosaurids and troodontids, we found that the teeth in Cluster 2 belonged to a different species. The remaining two clusters (1 and 3) overlapped because there is a continuum in all measured features of the teeth in this organism. We suggest that this is a normal progression of size in the mouth of P. bakkeri, with the largest at the front and the smallest at the back. This is similar to what is found in other troodontid species.
Cluster 2 was excluded from model training with the CNN because these teeth represented a different species. The information from Clusters 1 and 3 was helpful in assigning a label to each image of P. bakkeri based on the cluster it belonged to. There are several dinosaurs with small teeth, such as Dromaeosaurids, Richardoestesia, Paronychodon, and Saurornitholestes, found in the Lance Formation. However, none expressed the large denticles seen in Pectinodon. Future discoveries will increase the number of specimens available to use for the AI analysis.
The created CNN topology provided a structured, multi-layered approach to image classification, allowing the model to learn, extract, and interpret complex image features efficiently. The initial convolutional layers captured essential details by applying filters across image regions, while pooling layers reduced dimensionality and computational load, preserving significant features. Regularization via dropout layers prevented overfitting, enhancing generalization. Lastly, dense layers enabled final classification by synthesizing all learned features.
In the initial experiments, the model’s results indicated an overfitting issue, which is when the training accuracy is vastly better than the validation accuracy. This was resolved by tweaking the topology to include regularization layers (e.g., dropout). Also, it is notable that there are peaks in the training results (as shown in Figure 8), but the overall trend is upward. The plot of the model’s loss (Figure 9) shows spikes toward the end, but the overall trend is still downward. Analyzing the lines in Figure 8 and Figure 9 was essential for assessing potential overfitting in the model. In this instance, the model does not show signs of overfitting, indicating that it has achieved a level of generalization suitable for accurately handling new, unseen data.
Detecting variations among the tooth images using the CNN proved to be a challenging task. This was because there appeared to be a lot of similarities between the teeth in the clusters, and because there was a continuum of physical features between the clusters. Also, there are multiple images with reflections and noise, and some inconsistencies with the background color of the images.

5. Conclusions and Future Work

This research aimed to utilize deep learning to classify microfossil P. bakkeri tooth images based on clusters created with unsupervised machine learning. Specifically, our method involves two main steps. First, we applied PCA and K-means clustering to a numerical dataset of 459 samples. The clustering results were then used to automatically organize P. bakkeri tooth images. In the second step, these images were used to train a CNN for classification. The resulting model achieved an accuracy of 71%. Although there are deep learning approaches to classifying microfossils, none specifically target dinosaur teeth. Our approach is helpful in cases where images need to be classified according to a particular criterion given by the clusters created with a numerical dataset.
For future work, image segmentation will be applied to the images to separate the tooth from the background. Moreover, RGB (red, green, blue) colors will be transformed into black and white to consider only the shape of the teeth for training and image classification. This approach will aim to prevent the deep learning model from getting confused with RGB colors that may not give relevant information. Also, we will fine-tune our model with additional augmentations, such as up and down flips, to increase variance for training the CNN. Furthermore, a limitation of this research was not considering tooth image size during the training process (i.e., all the images had the same size). So, another aspect of future work will be to account for the size of teeth when training the model. Also, we will study the impact of using ensemble models and transfer learning to evaluate if these techniques may offer more accurate results in the classifications. Specifically, on one hand, ensemble models could be useful to smooth out an individual model’s biases or even overfitting. In addition, by using ensemble models, the errors made by one model are likely corrected by others. On the other hand, by leveraging models that have already been trained on large datasets (like ImageNet), transfer learning can be used to transfer the learned features to our new, smaller dataset. Finally, we will apply the techniques presented in this paper to smaller and smaller datasets while at the same time improving accuracy, precision, and recall. Ultimately, we hope this methodology will enable the quick identification of vertebrate microfossils in the field.

Author Contributions

Conceptualization, G.H.A. and K.S.; Data curation, J.B. and K.S.; Formal analysis, J.B. and G.H.A.; Investigation, J.B., G.H.A. and K.S.; Methodology, G.H.A. and K.S.; Project administration, G.H.A.; Software, J.B.; Supervision, G.H.A. and K.S.; Validation, J.B. and G.H.A.; Visualization, J.B.; Writing—original draft, J.B., G.H.A. and K.S.; Writing—review and editing, G.H.A. and K.S. All authors have read and agreed to the published version of the manuscript.

Funding

This research received no external funding.

Data Availability Statement

The dataset and the source code used in the experiments are publicly available at https://github.com/jacobabahn/MicrofossilResearch (accessed on 18 May 2025).

Conflicts of Interest

The authors declare no conflicts of interest.

References

  1. Averianov, A.O.; Sues, H.D. A new troodontid (Dinosauria: Theropoda) from the Cenomanian of Uzbekistan, with a review of Troodontid records from the territories of the former Soviet Union. J. Vertebr. Paleontol. 2007, 27, 87–98. [Google Scholar]
  2. Bever, G.S.; Norell, M.A. The perinate skull of Byronosaurus (Troodontidae) with observations on the cranial ontogeny of paravian theropods. Am. Mus. Novit. 2009, 3657, 1–52. [Google Scholar] [CrossRef]
  3. Currie, P.J.; Evans, D.C. Cranial anatomy of new specimens of Saurornitholestes langstoni (Dinosauria, Theropoda, Dromaeosauridae) from the Dinosaur Park Formation (Campanian) of Alberta. Anat. Rec. 2020, 303, 691–715. [Google Scholar] [CrossRef]
  4. Duan, X. Automatic identification of conodont species using fine-grained convolutional neural networks. Front. Earth Sci. 2023, 10, 1046327. [Google Scholar] [CrossRef]
  5. DeMar, D.G. An Illustrated Guide to Latest Cretaceous Vertebrate Microfossils of the Hell Creek Formation of Northeastern Montana. Unpublished Work. 2012. Available online: https://naturalhistory.si.edu/sites/default/files/media/file/fossil-id-guide062812-accessible.pdf (accessed on 18 May 2025).
  6. Farlow, J.O.; Brinkman, D.L.; Abler, W.L.; Currie, P.J. Size, shape, and serration density of theropod dinosaur lateral teeth. Mod. Geol. 1991, 16, 161–198. [Google Scholar]
  7. Larson, D.W.; Currie, P.J. Multivariate analyses of small theropod dinosaur teeth and implications for paleoecological turnover through time. PLoS ONE 2013, 8, e54329. [Google Scholar] [CrossRef]
  8. Rogers, R.R.; Eberth, D.A.; Fiorillo, A.R. (Eds.) A practical approach to the study of bonebeds. In Bonebeds: Genesis, Analysis, and Paleobiological Significance; University of Chicago Press: Chicago, IL, USA, 2007; pp. 265–332. [Google Scholar]
  9. Eaton, J.G. New screen-washing approaches to biostratigraphy and paleoecology of nonmarine rocks, Cretaceous of Utah. Bull. Carnegie Mus. Nat. Hist. 2004, 36, 21–30. [Google Scholar]
  10. Vasile, S.; Csiki, Z. Comparative paleoecological analysis of some microvertebrate fossil assemblages from the Hateg Basin, Romania. Stud. Şi Comun. Ştiinţele Nat. 2010, 26, 315–322. [Google Scholar]
  11. Whitebone, S.A.; Funston, G.F.; Currie, P.J. An unusual microsite from the Upper Cretaceous Horseshoe Canyon Formation of Alberta, Canada. J. Vertebr. Paleontol. 2024, 43, e2316668. [Google Scholar] [CrossRef]
  12. Ullman, P.V.; Varricchio, D.; Knell, M.J. Taphonomy and taxonomy of a vertebrate microsite in the mid-Cretaceous (Albian-Cenomian) Blackleaf Formation, southwest Montana. Hist. Biol. 2011, 24, 311–328. [Google Scholar]
  13. Brinkman, D.B.; Divay, J.D.; DeMar, D.G., Jr.; Wilson-Mantila, G.P. A systematic reappraisal and quantitative study of the nonmarine teleost fishes from the late Maastrichtian of the Western Interior of North America: Evidence from vertebrate microfossil localities. Can. J. Earth Sci. 2021, 58, 936–967. [Google Scholar] [CrossRef]
  14. Brand, N.A.; Heckert, A.B.; Sanchez, I.; Foster, J.R.; Hunt-Foster, R.K.; Eberle, J.J. New Late Cretaceous microvertebrate assemblage from the Campanian-Maastrichtian Willinas Fork Formation, northwestern Colorado, USA, and its paleoenvironmental implications. Acta Palaeontol. Pol. 2022, 67, 579–600. [Google Scholar] [CrossRef]
  15. Heckert, A.B.; Foster, J.R. Ichthyoliths and other microvertebrate remains from the Morrison Formation (Upper Jurassic) of northeastern Wyoming: A screen-washed sample indicates a significant aquatic component to the fauna. Palaeogeogr. Palaeoclimatol. Palaeoecol. 2011, 305, 264–279. [Google Scholar]
  16. Blanco, A.; Szabo, M.; Blanco-Lapaz, A.; Marmi, J. Late Cretaceous (Maastrichtian) Chondrichthyes and Osteichthyes from northeastern Iberia. Palaeogeogr. Palaeoclimatol. Palaeoecol. 2017, 465, 278–294. [Google Scholar] [CrossRef]
  17. Mitra, R.; Marchitto, T.M.; Ge, Q.; Zhong, B.; Kanakiya, B.; Cook, M.S.; Fehrenbacher, J.S.; Ortiz, J.D.; Tripati, A.; Lobaton, E. Automated species-level identification of planktonic foraminifera using convolutional neural networks, with comparison to human performance. Mar. Micropaleontol. 2019, 147, 16–24. [Google Scholar] [CrossRef]
  18. Lipsword, H.L. Geology of Gulf Coast and Central Texas and Guidebook of Excursions; Houston Geological Society: Houston, TX, USA, 1962; pp. 16–57. [Google Scholar]
  19. Hou, C.; Lin, X.; Huang, H.; Xu, S.; Fan, J.; Shi, Y.; Lv, H. Fossil image identification using deep learning ensembles of data augmented multiviews. Methods Ecol. Evol. 2023, 14, 3020–3034. [Google Scholar] [CrossRef]
  20. Moore, T.C., Jr. Method of randomly distributing grains for microscopic examination. J. Sediment. Petrol. 1973, 43, 904–906. [Google Scholar]
  21. Itaki, T.; Taira, Y.; Kuwamori, N.; Maebayashi, T.; Takeshima, S.; Toya, K. Automated collection of single species of microfossils using a deep learning–micromanipulator system. Prog. Earth Planet. Sci. 2020, 7, 19. [Google Scholar] [CrossRef]
  22. Gaston, K.J.; O’Neill, M.A. Automated species identification: Why not? Philos. Trans. R. Soc. 2004, 359, 655–667. [Google Scholar] [CrossRef]
  23. Cifuentes-Alcobendas, G.; Domínguez-Rodrigo, M. Deep learning and taphonomy: High accuracy in the classification of cut marks made on fleshed and defleshed bones using convolutional neural networks. Sci. Rep. 2019, 9, 18933. [Google Scholar] [CrossRef] [PubMed]
  24. Hou, Y.; Cui, X.; Canul-Ku, M.; Jin, S.; Hasimoto-Beltran, R.; Guo, Q.; Zhu, M. ADMorph: A 3D digital microfossil morphology dataset for deep learning. IEEE Access 2020, 8, 148744–148756. [Google Scholar] [CrossRef]
  25. Itaki, T.; Taira, Y.; Kuwamori, N.; Saito, H.; Ikehara, M.; Hoshino, T. Innovative microfossil (radiolarian) analysis using a system for automated image collection and AI-based classification of species. Sci. Rep. 2020, 10, 21136. [Google Scholar] [CrossRef] [PubMed]
  26. Marchant, R.; Tetard, M.; Pratiwi, A.; Adebayo, M.; Garidel-Thoron, T. Automated analysis of foraminifera fossil records by image classification using a convolutional neural network. J. Micropalaeontol. 2020, 39, 183–202. [Google Scholar] [CrossRef]
  27. Ge, Q.; Richmond, T.; Zhong, B.; Marchitto, T.M.; Lobaton, E.J. Enhancing the morphological segmentation of microscopic fossils through localized topology-aware edge detection. Auton. Robot. 2021, 45, 709–723. [Google Scholar] [CrossRef]
  28. Xiaolu, Y.; Kai, Y.; Chongjiao, D.; Hanning, G.; Zhongliang, M. Microscopic recognition of micro fossils in carbonate rocks based on convolutional neural network. Pet. Geol. Exp. 2021, 43, 880–885. [Google Scholar]
  29. Mimura, K.; Minabe, S.; Nakamura, K.; Yasukawa, K.; Ohta, J.; Kato, Y. Automated detection of microfossil fish teeth from slide images using combined deep learning models. Appl. Comput. Geosci. 2022, 16, 100092. [Google Scholar] [CrossRef]
  30. Wang, H.; Li, C.; Zhang, Z.; Kershaw, S.; Holmer, L.E.; Zhang, Y.; Wei, K.; Liu, P. Fossil brachiopod identification using a new deep convolutional neural network. Gondwana Res. 2022, 105, 290–298. [Google Scholar] [CrossRef]
  31. Liu, X.; Jiang, S.; Wu, R.; Shu, W.; Hou, J.; Sun, Y.; Sun, J.; Chu, D.; Wu, Y.; Song, H. Automatic taxonomic identification based on the fossil image dataset (>415,000 images) and deep convolutional neural networks. Paleobiology 2023, 49, 1–22. [Google Scholar] [CrossRef]
  32. Ozer, I.; Ozer, C.K.; Karaca, A.C.; Gorur, K.; Kocak, I.; Cetin, O. Species-level microfossil identification for Globotruncana genus using hybrid deep learning algorithms from scratch via a low-cost light microscope imaging. Multimed. Tools Appl. 2023, 82, 13689–13718. [Google Scholar] [CrossRef]
  33. Sun, J.; Liu, X.; Huang, Y.; Wang, F.; Sun, Y.; Chen, J.; Chu, D.; Song, H. Automatic identification and morphological comparison of bivalve and brachiopod fossils based on deep learning. PeerJ 2023, 11, 16200. [Google Scholar] [CrossRef] [PubMed]
  34. Zhang, B.; Xin, C.; Yang, D.; Jiao, Z.; Liu, S.; Di, G.; Zhao, H. Numerical taxonomy and genus-species identification of Czekanowskiales in China based on machine learning. Palaeontol. Electron. 2024, 27, a10. [Google Scholar] [CrossRef] [PubMed]
  35. Courtenay, L.A.; Yravedra, J.; Huguet, R.; Aramendi, J.; Maté-González, M.Á.; González-Aguilera, D.; Arriaza, M.C. Combining machine learning algorithms and geometric morphometrics: A study of carnivore tooth marks. Palaeogeogr. Palaeoclimatol. Palaeoecol. 2019, 522, 28–39. [Google Scholar] [CrossRef]
  36. Sankey, J.T. Diversity of Latest Cretaceous (Late Maastrichtian) small theropods and birds: Teeth from the Lance and Hell Creek Formations, USA. In Vertebrate Microfossil Assemblages: Their Role in Paleoecology and Paleobiogeography; Sankey, J.T., Baszio, S., Eds.; Indiana University Press: Bloomington, IN, USA, 2008; pp. 117–134. [Google Scholar]
  37. Carpenter, K. Baby dinosaurs from the Late Cretaceous Lance and Hell Creek Formations and a description of a new species of theropod. Contrib. Geol. Univ. Wyo. 1982, 20, 123–134. [Google Scholar]
  38. Currie, P.J.; Rigby, K., Jr.; Sloan, R.E. Theropod teeth from the Judith River Formation of southern Alberta, Canada. In Dinosaur Systematics: Approaches and Perspectives; Carpenter, P.J., Currie, K., Eds.; Cambridge University Press: New York, NJ, USA, 1990; pp. 107–125. [Google Scholar]
  39. Longrich, N.R. Small theropod teeth from the Lance Formation of Wyoming, USA. In Vertebrate Microfossil Assemblages: Their Role in Paleoecology and Paleobiogeography; Sankey, J.T., Baszio, S., Eds.; Indiana University Press: Bloomington, IN, USA, 2008; pp. 135–158. [Google Scholar]
  40. Kiel, S. Assessing bivalve phylogeny using deep learning and computer vision approaches. bioRxiv 2021. [Google Scholar] [CrossRef]
  41. Zhao, Z.; Lu, Y.; Tong, Y.; Chen, X.; Bai, M. PENet: A phenotype encoding network for automatic extraction and representation of morphological discriminative features. Methods Ecol. Evol. 2023, 14, 3035–3046. [Google Scholar] [CrossRef]
Figure 1. Microfossil P. bakkeri tooth image.
Make 07 00045 g001
Figure 2. (Top): Microfossil tooth image before crop. (Bottom): After crop.
Make 07 00045 g002
Figure 3. (Left): Original tooth image. (Right): Augmented (rotated) tooth image.
Make 07 00045 g003
Figure 4. (Left): Original tooth image. (Right): Augmented (horizontal flip) tooth image.
Make 07 00045 g004
Figure 5. (Top): Scree plot of dimensional variance. (Bottom): Correlation plot of feature contribution to each dimension.
Make 07 00045 g005
Figure 6. (Top): Elbow Method plot. (Bottom): Silhouette Method plot.
Make 07 00045 g006
Figure 7. K-Means clustering result with three clusters.
Make 07 00045 g007
Figure 8. The model’s accuracy per epoch for classifying images in Cluster 1 and Cluster 3. The orange line represents the validation score, and the blue line the training score.
Make 07 00045 g008
Figure 9. The model’s loss per epoch for classifying images in Cluster 1 and Cluster 3. The orange line represents the validation score, and the blue line the training score.
Make 07 00045 g009
Table 1. Feature averages per cluster.
ClusterCrown Height mmFore-Aft Basal Length mmBasal Width mmPosterior Denticles per mm
14.4952.7741.1922
22.8542.1617854
33.6712.5419413
Table 2. Evaluation results for Cluster 1 and Cluster 3.
ClusterAccuracyPrecisionRecallF1-Score
Cluster 171707371
Cluster 371726870
Disclaimer/Publisher’s Note: The statements, opinions and data contained in all publications are solely those of the individual author(s) and contributor(s) and not of MDPI and/or the editor(s). MDPI and/or the editor(s) disclaim responsibility for any injury to people or property resulting from any ideas, methods, instructions or products referred to in the content.

