


Enhancing Visitor Forecasting with Target-Concatenated Autoencoder and Ensemble Learning


Abstract
1. Introduction
- Integration of Diverse Influencing Factors: This study addressed the challenges of previous tourism forecasting algorithms by integrating economic conditions, sociopolitical stability, and other external factors into the forecasting model. This comprehensive approach enhanced the model’s ability to capture and predict tourism demand accurately, overcoming the limitations of time series and regression models that often fail to consider these diverse influencing factors.
- Introduction of TCA for Feature Selection: This study resolved the limitations of related autoencoders for feature selection by introducing the TCA. Unlike traditional autoencoders that do not incorporate target information, TCA integrates the prediction target during the training process, ensuring that the learned representations are optimized for the specific forecasting task. This leads to more relevant and informative feature selection, improving the model’s predictive performance.
- Significant Implications for the Tourism Industry: By achieving lower MAPE and demonstrating computational efficiency, the proposed method provides a practical tool for tourism managers and policymakers. It enables accurate forecasts; facilitates better infrastructure development, marketing strategies, and resource allocation; supports sustainable growth; and minimizes negative impacts on local communities and environments.
2. Related Work
2.1. Tourism Demand Factors
2.2. Tourism Forecasting Algorithm
2.3. Autoencoder for Feature Selection
3. Proposed Method: Target-Concatenated Autoencoder and Ensemble Learning
3.1. Overview of the Target-Concatenated Autoencoder and Ensemble Learning Approach
- Start and Obtain Data: The process begins with data collection, encompassing key variables such as the number of tourist arrivals, economic factors, tourism resources, and other influencing factors. These data points form the foundation for the forecasting model.
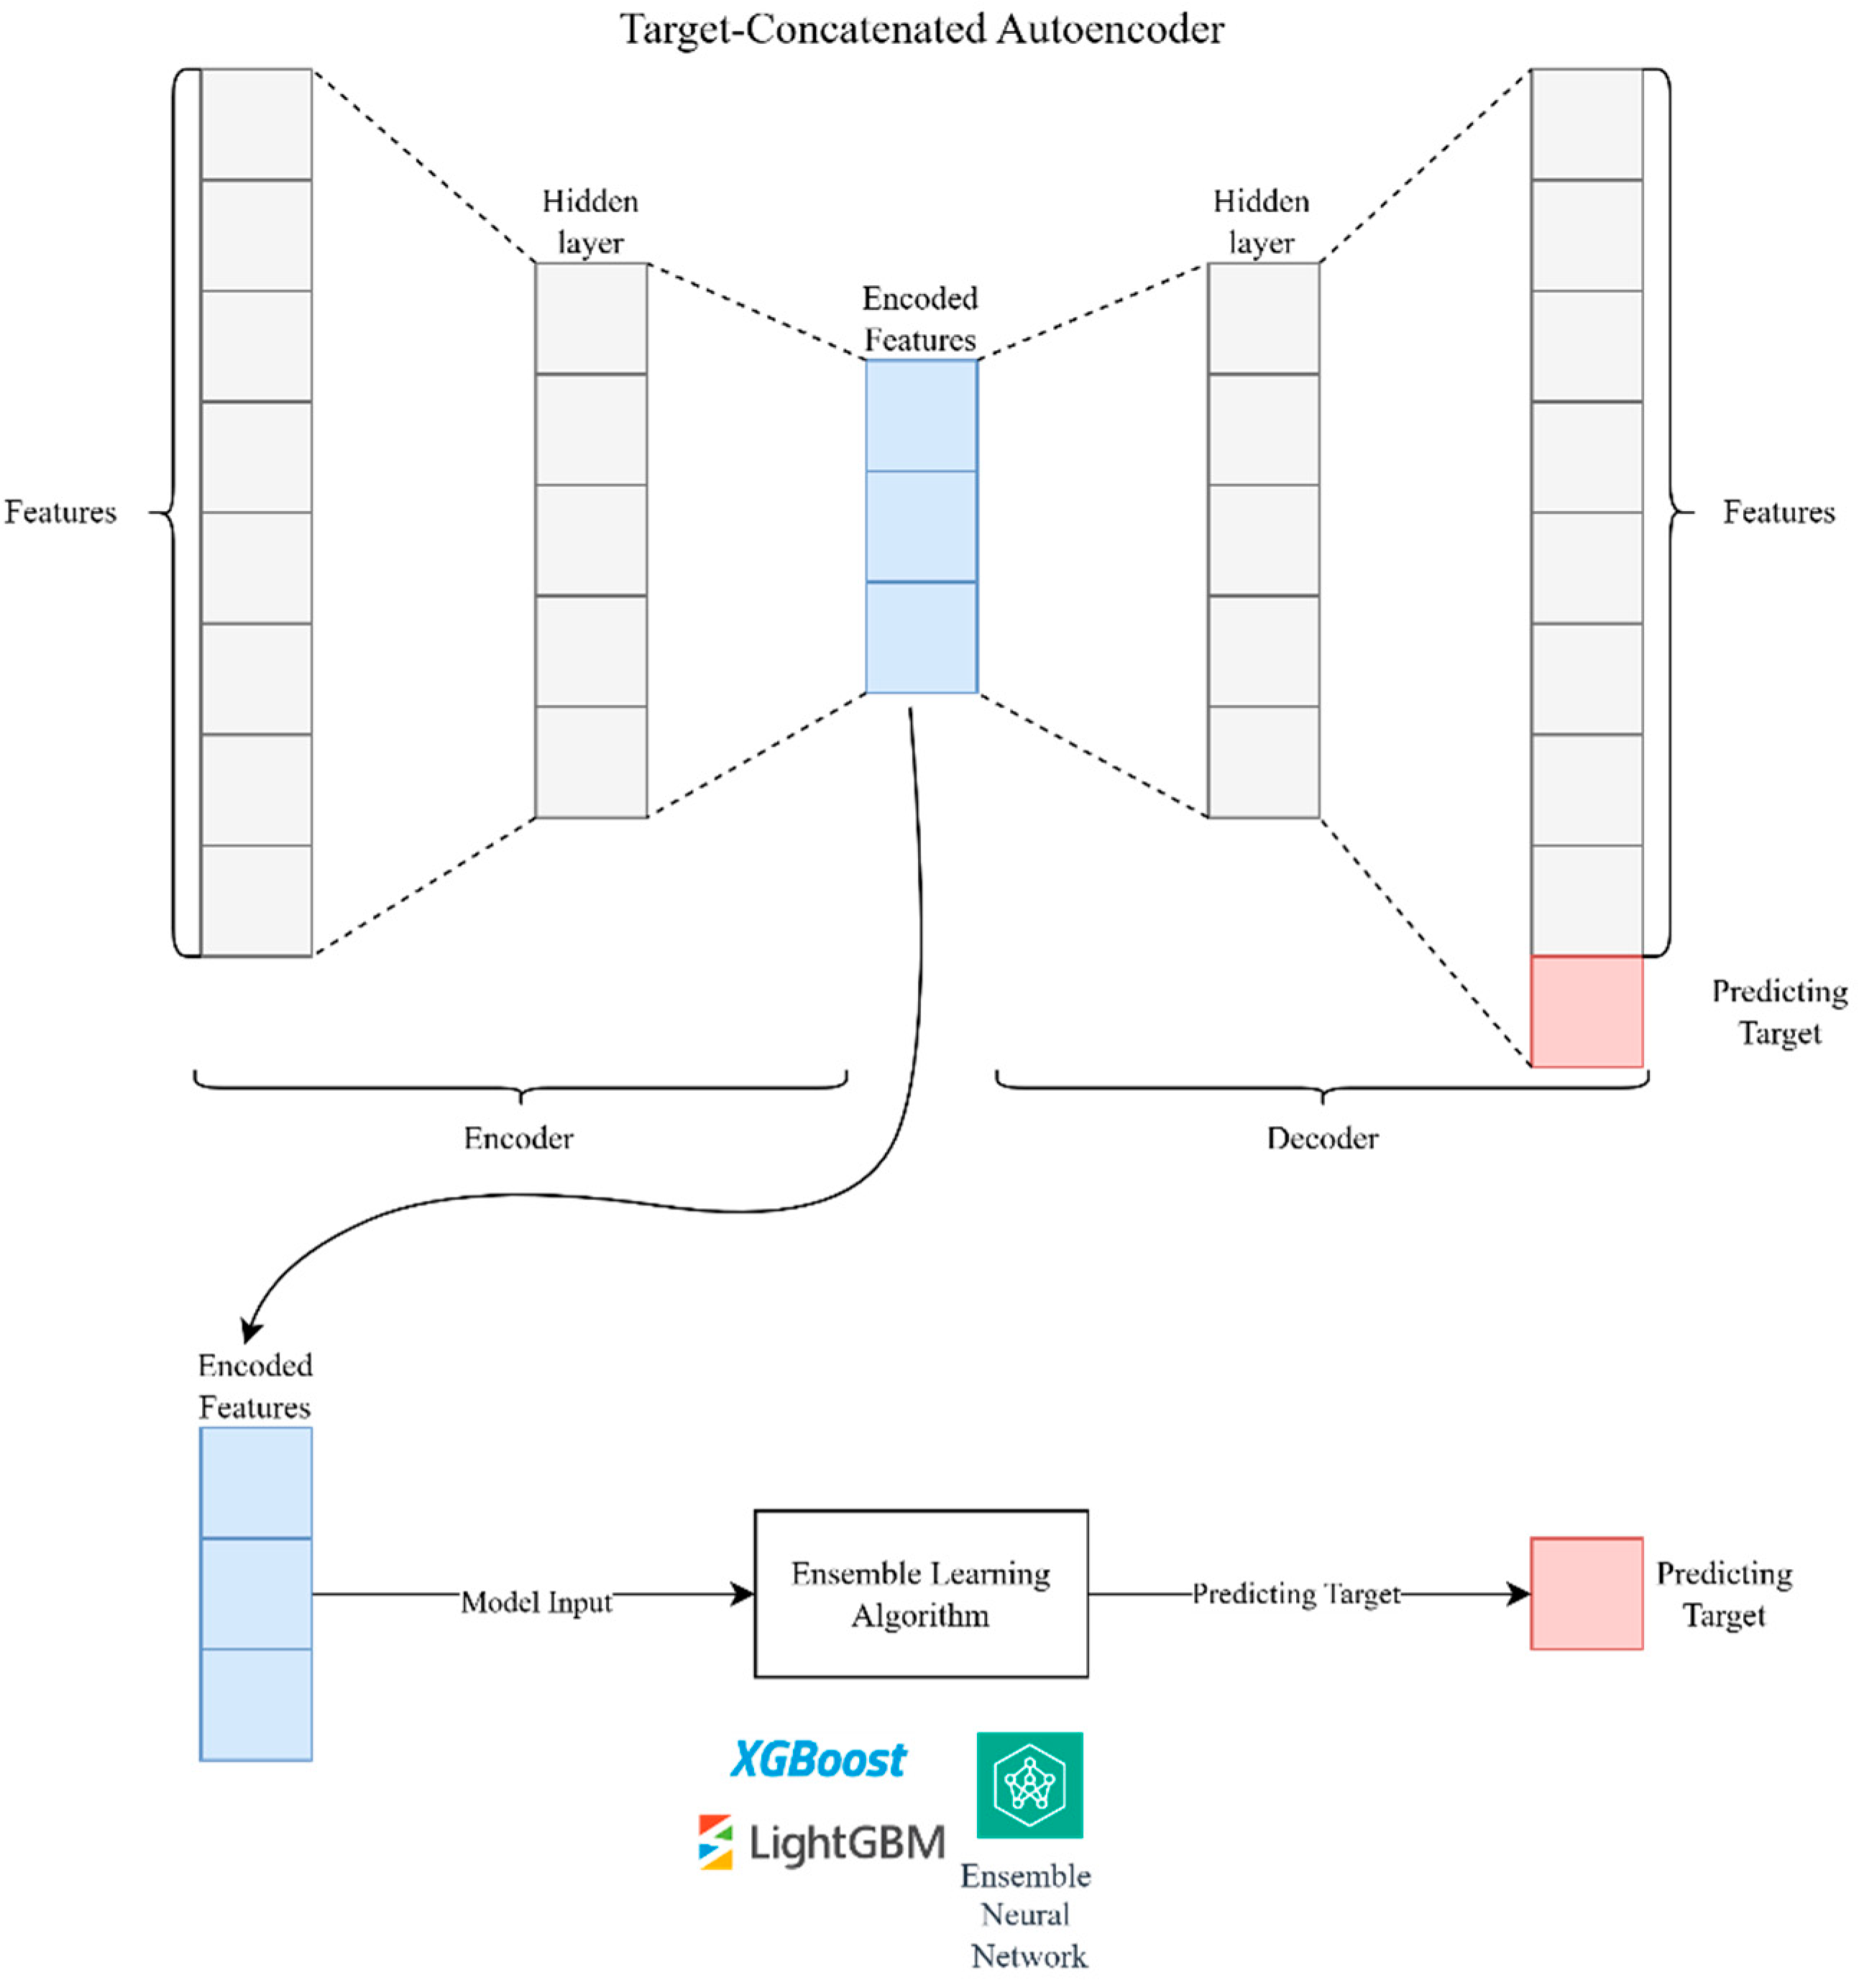
- Target-Concatenated Autoencoder Feature Selection: The TCA is employed at this stage. The encoder component of the autoencoder compresses the input data into a latent representation, while the decoder attempts to reconstruct the original input from this compressed form. By incorporating the target variable (e.g., visitor numbers) during training, the autoencoder learns features that represent the input data and predict the target, ensuring that the encoded features are highly relevant to the forecasting task.
- Feature Importance and Encoded Features: The encoded features generated by the autoencoder are then analyzed for their importance in predicting the target variable. This step helps identify and select the most significant features, which reduces dimensionality and enhances model interpretability.
- Ensemble Learning Algorithm: The selected encoded features are subsequently fed into an ensemble learning algorithm. Ensemble learning methods, such as XGBoost, LightGBM, or a combination of neural networks, aggregate the predictions of multiple models to improve overall prediction accuracy and reliability.
- Model Evaluation: The final step involves evaluating the performance of the ensemble model using various metrics (e.g., mean absolute error, root mean squared error, mean absolute percentage error). This evaluation ensures that the model meets the desired accuracy and reliability standards.
- Finish: The process concludes with the finalization of the model, which is ready to be deployed for forecasting visitor numbers accurately.
3.2. Architecture of Target-Concatenated Autoencoder
- Encoder: The encoder component of the autoencoder compresses the input features into a latent representation. This process involves multiple layers:
- ○
- The first layer processes the original input features through a dense layer with activation functions to capture non-linear relationships.
- ○
- Subsequent layers further compress the data, reducing its dimensionality while retaining essential information.
- Target Concatenation: At a specific stage within the encoding process, the target variable (e.g., the number of tourist arrivals) is concatenated with the intermediate features. This step ensures that the autoencoder considers the target information while learning the compressed representation. By doing so, the model learns to emphasize features that are more predictive of the target, enhancing the quality of the latent representation.
- Decoder: The decoder reconstructs the original input from the latent representation, ensuring that the encoded features retain enough information to reconstruct the input accurately. This reconstruction process helps the model learn a compact yet informative data representation.
- Feature Extraction: The encoded features are extracted from the autoencoder and used for further analysis. These features are now optimized to represent the input and predict the target, making them highly valuable for subsequent modeling tasks.
3.3. Feature Importance with Target-Concatenated Autoencoder
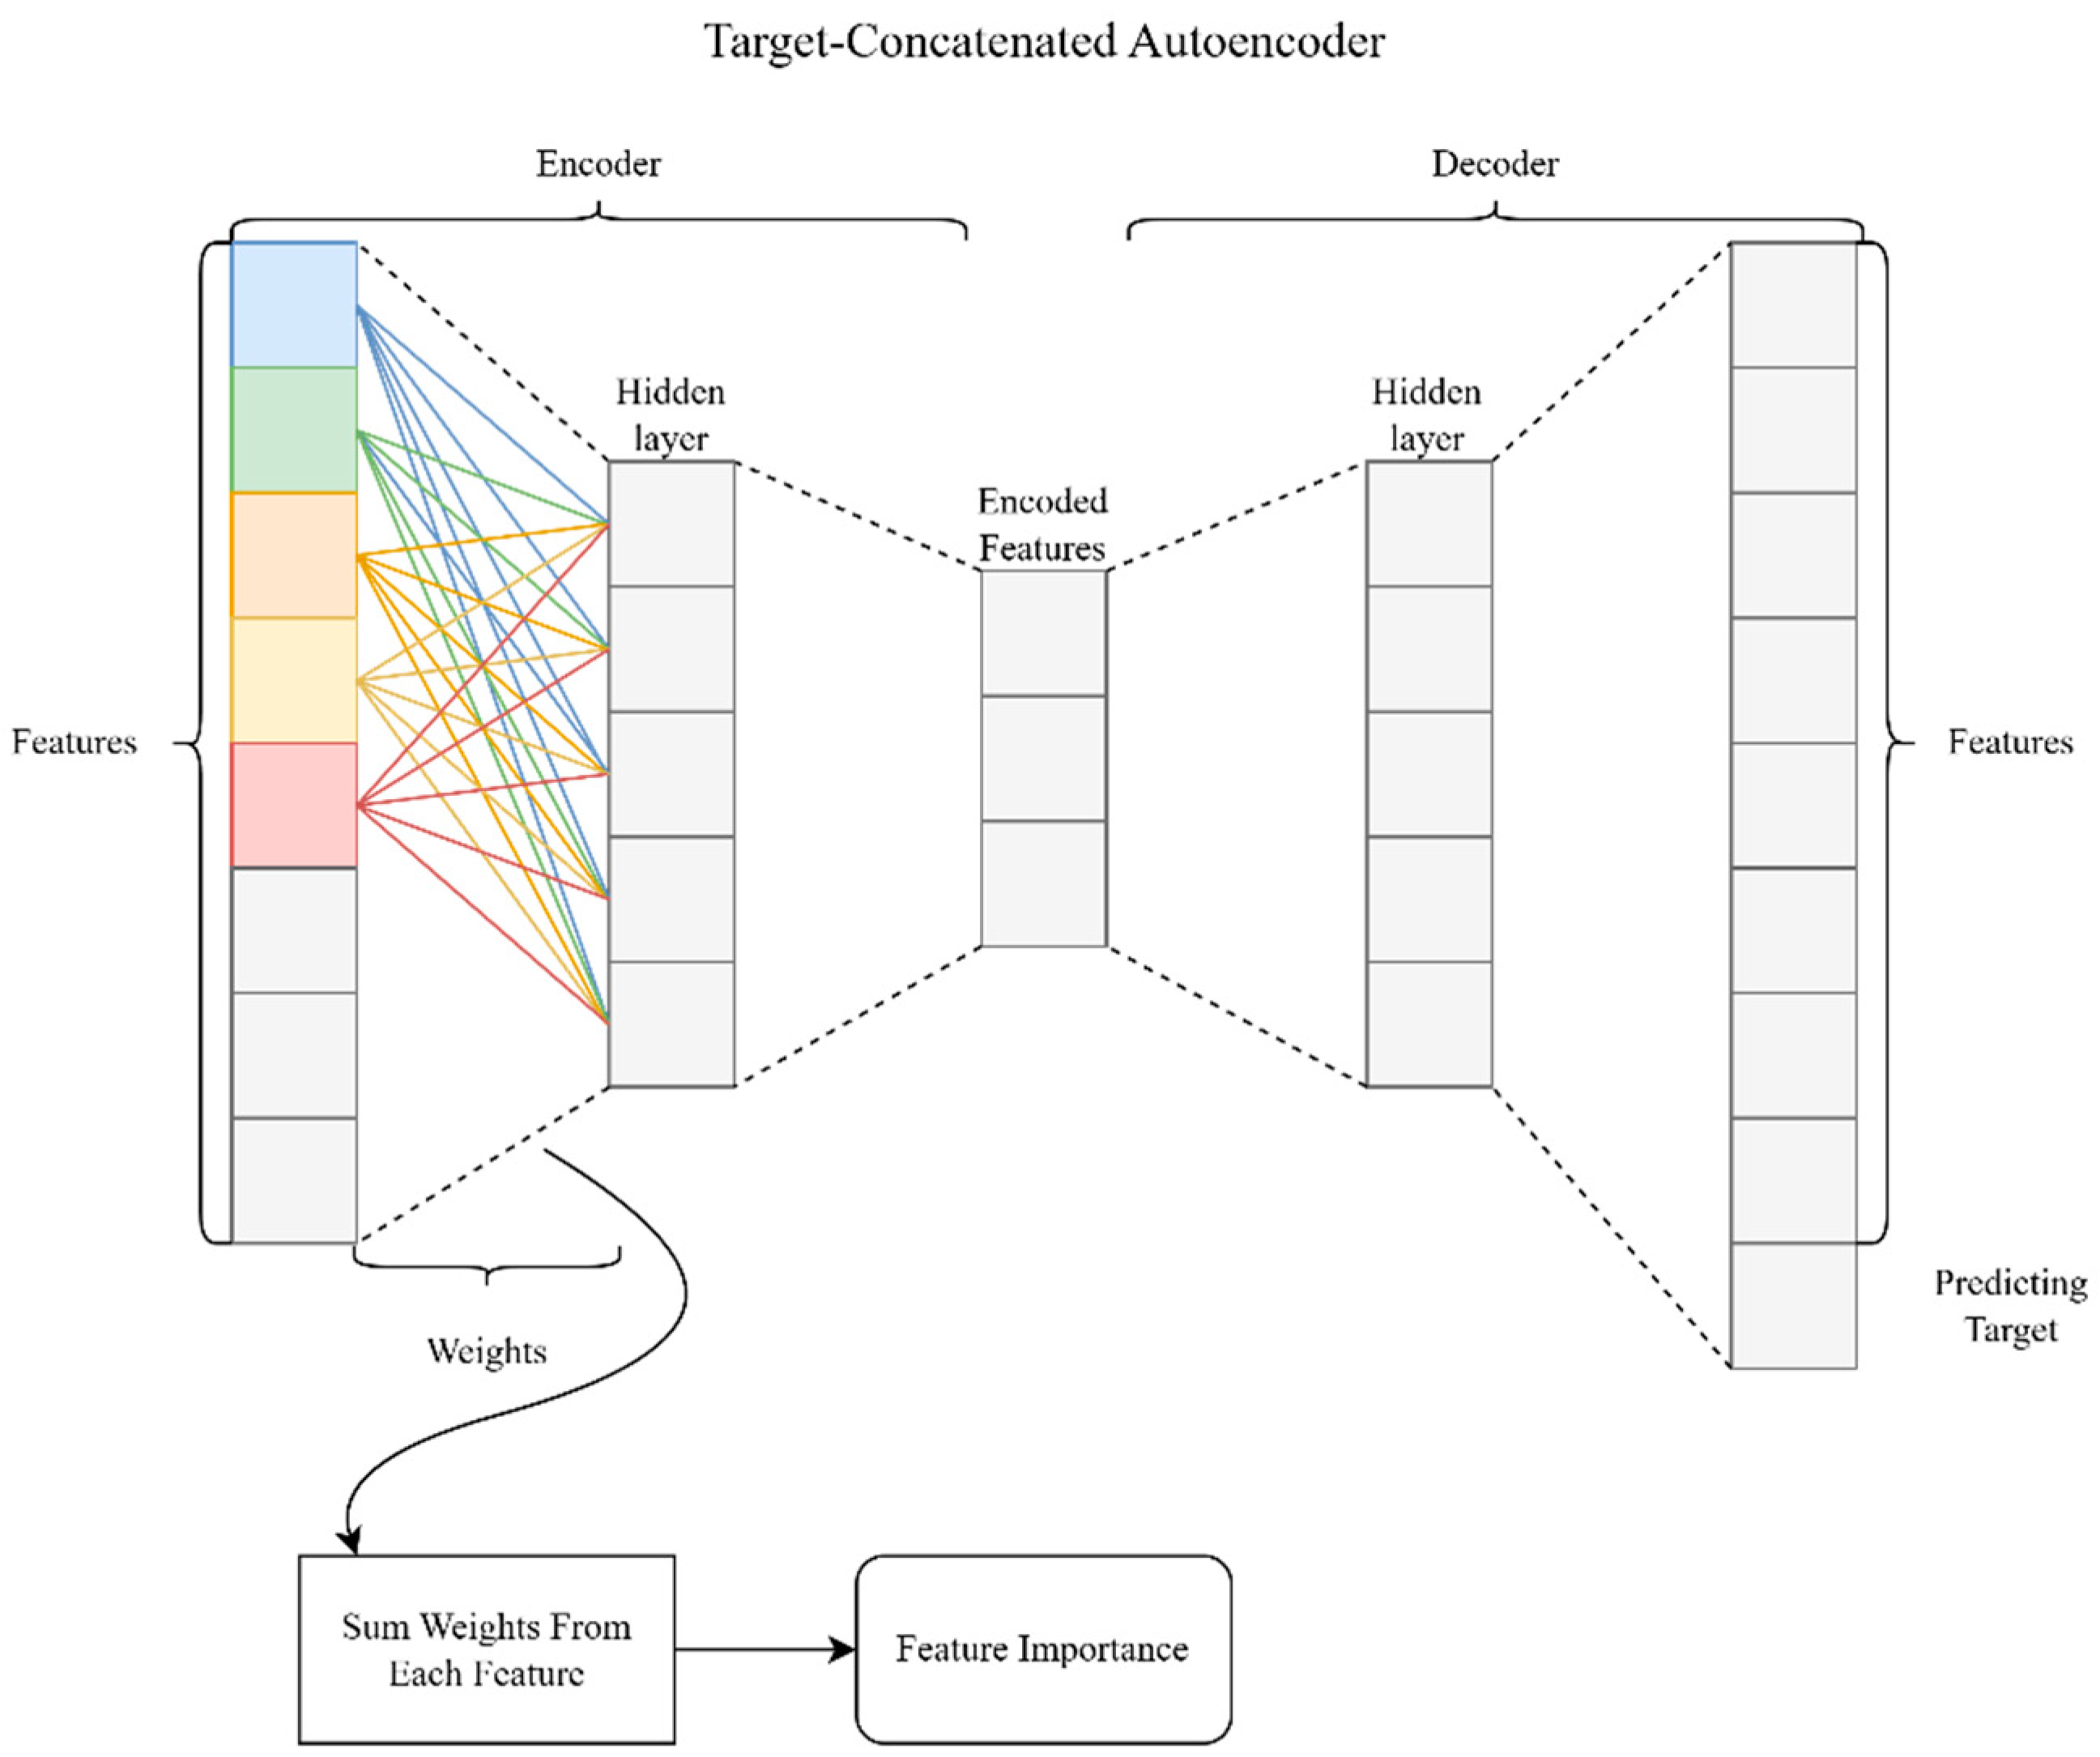
- Encoder: As the input features pass through the encoder, they are transformed into a lower-dimensional latent space. During this transformation, the network learns weights that capture the relationships between the input features and the target variable. These weights are crucial as they reflect the contribution of each input feature to the encoded representation.
- Weight Analysis: To determine feature importance, this study analyzed the weights connecting the input layer to the first hidden layer of the encoder. By summing the absolute values of these weights for each feature, the impact of each feature on the latent representation could be quantified. This sum represented the overall importance of the feature in predicting the target variable.
- Feature Importance Calculation: The summed weights were then normalized to provide a relative measure of feature importance. Features with higher summed weights were deemed more significant, indicating their crucial role in the prediction task. Conversely, features with lower weights had a lesser impact.
- Output: The final output was a ranked list of features based on their importance scores. This ranking helped identify the most relevant forecasting predictor, allowing for a more focused and efficient modeling process.
4. Experiment and Results
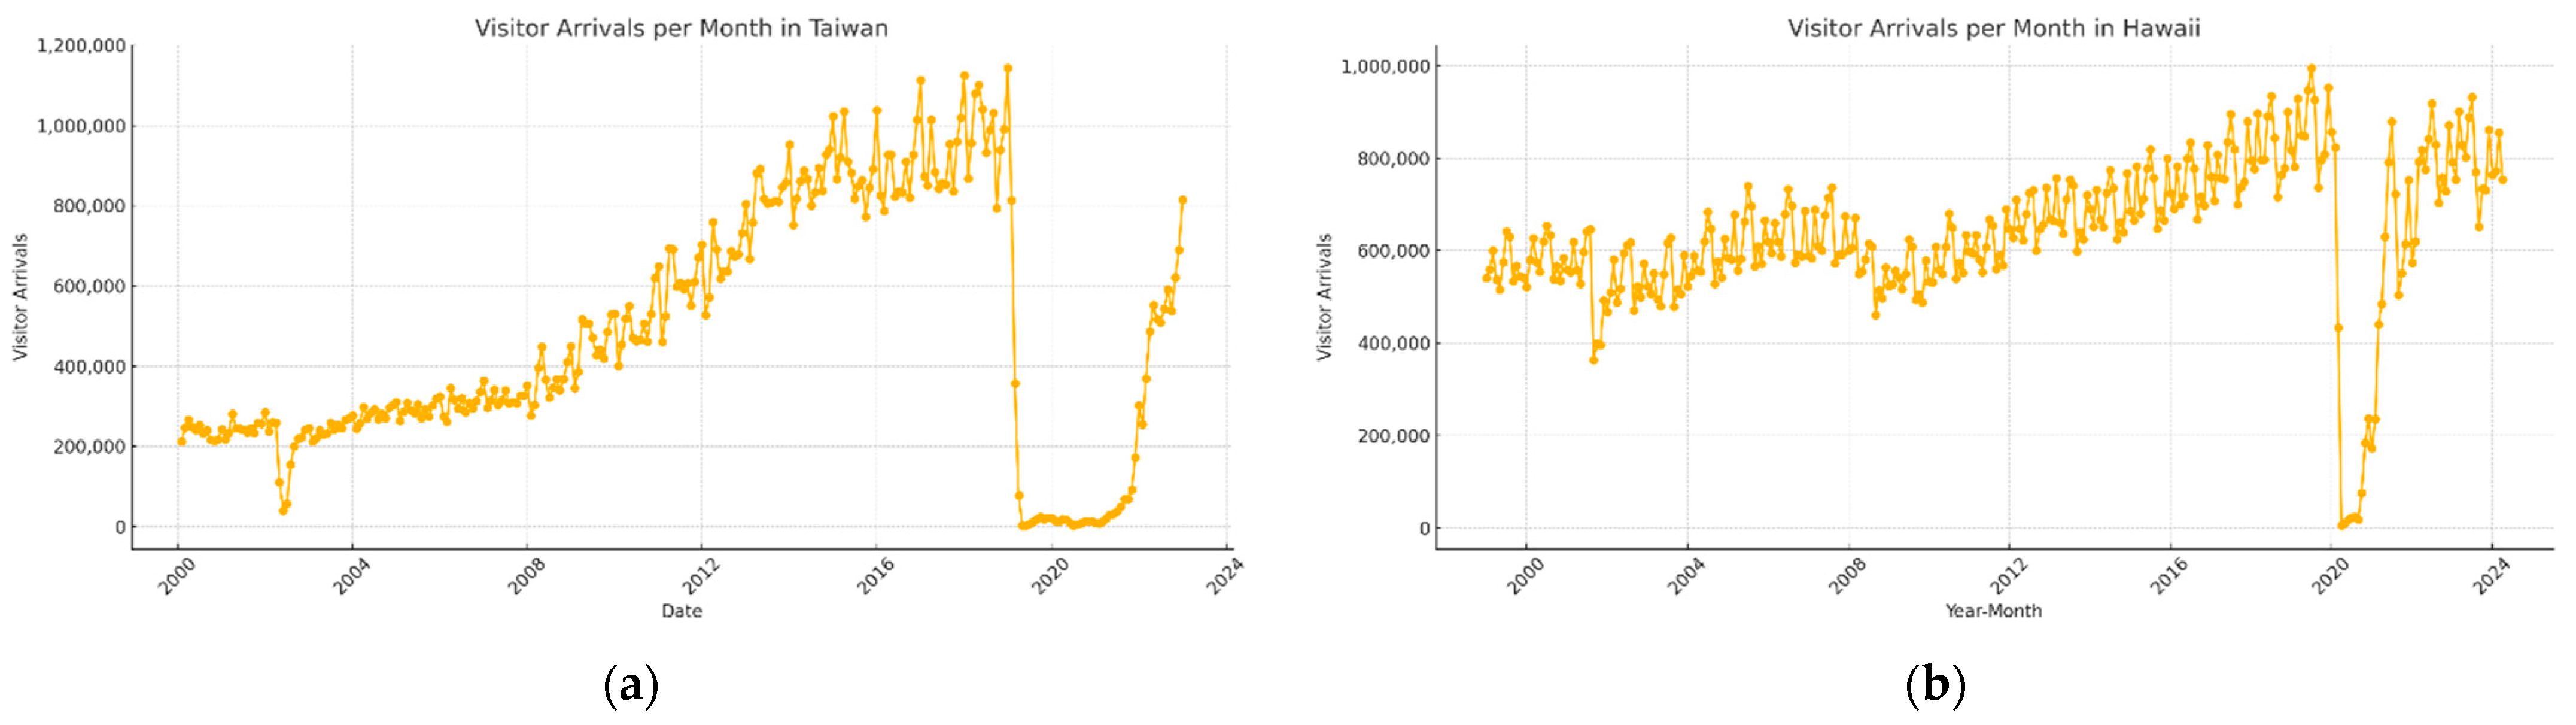
4.1. Dataset
- Taiwan National Statistics Database
- Taiwan Ministry of Transportation and Communications: Tourism Statistics
- Ministry of Transportation and Communications: Visitor Statistics
- Ministry of Transportation and Communications: Transportation Statistics
- Google Trends
- Data Taiwan
- Economic Factors: Economic stability and growth directly affect tourists’ disposable income and purchasing power, influencing their ability to travel. Exchange rates impact the cost of traveling to a destination, while GDP and GNI provide an overall economic context [46].
- Tourism Resources: The availability and quality of accommodation, transport infrastructure, and tourism facilities are crucial for attracting and retaining tourists. High occupancy rates indicate a healthy tourism sector, while the number of tourist establishments reflects the capacity to accommodate visitors [47,48].
- Other Factors: Weather conditions (e.g., precipitation days), crime rates, and economic indicators (e.g., export and import growth rates) also play significant roles. Favorable weather and safety enhance a destination’s appeal, while economic indicators reflect overall market conditions that can influence travel decisions.
4.2. Hyperparameters and Experimental Setup
4.3. Evaluation Metric
- Mean absolute percentage error (MAPE) quantifies prediction accuracy as a percentage, providing a scale-independent measure of error. It is computed as the average absolute percentage difference between the predicted and actual values, represented by the below formula:MAPE is particularly useful in scenarios where understanding the relative size of errors is essential. However, it can be sensitive to small actual values, potentially resulting in extremely high percentage errors.
- Mean absolute error (MAE) measures the average magnitude of errors in a set of predictions, without considering their direction. It is calculated as the average absolute difference between the predicted and actual values, represented by the below formula:MAE provides a straightforward interpretation of prediction errors, reflecting the average error magnitude in the same units as the data.
- Mean squared error (MSE) is a quadratic scoring rule that measures the average magnitude of errors. It squares the differences between predicted and actual values, averages them, and then takes the square root, represented by the below formula:MSE is particularly useful for identifying larger errors due to its quadratic nature, which penalizes significant deviations more than smaller ones. This makes MSE sensitive to outliers and provides a comprehensive measure of model accuracy.
- The coefficient of determination (R2) indicates the proportion of the variance in the dependent variable that is predictable from the independent variables, represented by the below formula:where is the mean of the observed data. R2 values range from 0 to 1, with higher values indicating better model performance.
4.4. Ablation Study
4.4.1. Impact of Encoding Dimensions on Model Performance
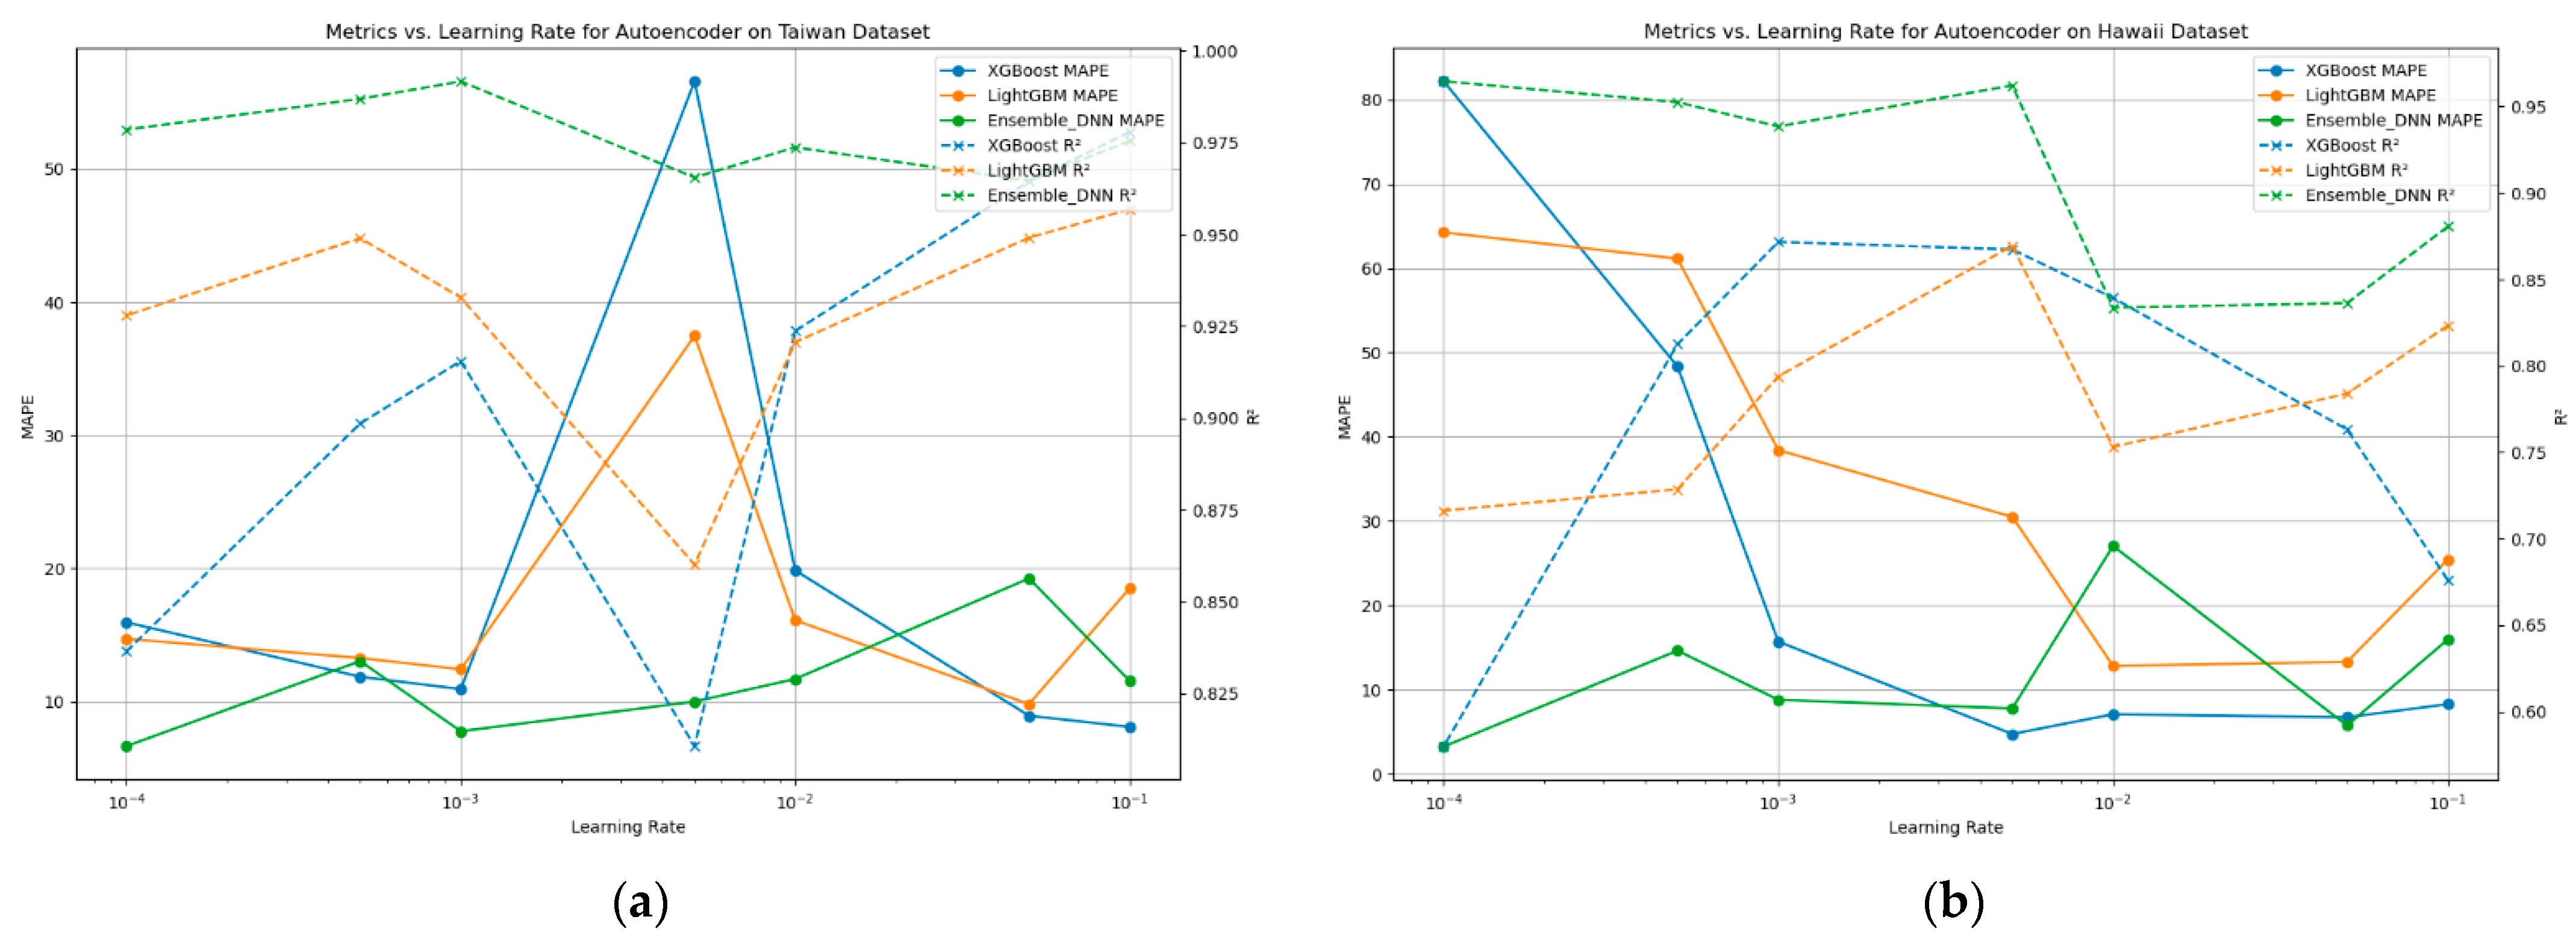
4.4.2. Impact of Learning Rate on Model Performance
4.4.3. Impact of Autoencoder Configurations on Model Performance
4.4.4. Performance Evaluation of the TCA + XGBoost Model on the Taiwan Dataset
4.5. Comparison Result
4.5.1. Comparison with Non-Ensemble and Feature Selection Algorithm
4.5.2. Computation Time Comparison of Ensemble Learning after Feature Selection Techniques
4.5.3. Comparison with Tourism Forecasting Algorithms
4.5.4. Comparison with Autoencoder for Feature Selection Algorithms
4.6. Feature Importance Analysis Using Target-Concatenated Autoencoder
5. Discussion and Future Works
5.1. Performance Comparison
5.2. Computational Efficiency
5.3. Ablation Study
5.4. Feature Importance Analysis
5.5. Future Work
- Integration with Real-Time Data: Incorporating real-time data streams and online learning techniques could further improve the responsiveness and accuracy of tourism forecasts. This approach could enable more dynamic and adaptive models.
- Expanded Feature Sets: Exploring additional features, such as social media trends, global travel advisories, and tourist sentiment analysis, could provide deeper insights into the factors influencing tourism demand. Incorporating these features could enhance the model’s predictive capabilities.
- Cross-Region and Cross-Sector Applications: Extending the application of the TCA to other regions and sectors, such as hospitality, retail, and transportation, could validate its versatility and effectiveness in different contexts. This broader application could uncover unique insights and improve forecasting accuracy across various domains.
- Hybrid Models: Combining the TCA with other advanced techniques, such as reinforcement learning and hybrid neural network architectures, could further improve prediction accuracy and reliability. These hybrid approaches could leverage the strengths of different methodologies to optimize forecasting performance.
- Explainability and Transparency: Developing methods to enhance the interpretability of the model’s predictions is valuable for stakeholders. Techniques like SHAP (SHapley Additive exPlanations) values could be integrated to provide clearer insights into feature importance and model decision-making processes. By addressing these areas, future research can continue to refine and extend the capabilities of the TCA and ensemble learning framework, solidifying its role as a powerful tool for tourism demand forecasting and beyond.
6. Conclusions
Author Contributions
Funding
Data Availability Statement
Conflicts of Interest
References
- Nguyen, L.Q.; Fernandes, P.O.; Teixeira, J.P. Analyzing and forecasting tourism demand in Vietnam with artificial neural networks. Forecasting 2021, 4, 36–50. [Google Scholar] [CrossRef]
- Li, X.; Zhang, X.; Zhang, C.; Wang, S. Forecasting tourism demand with a novel robust decomposition and ensemble framework. Expert Syst. Appl. 2024, 236, 121388. [Google Scholar] [CrossRef]
- Xu, S.; Liu, Y.; Jin, C. Forecasting daily tourism demand with multiple factors. Ann. Tour. Res. 2023, 103, 103675. [Google Scholar] [CrossRef]
- Li, X.; Xu, Y.; Law, R.; Wang, S. Enhancing tourism demand forecasting with a transformer-based framework. Ann. Tour. Res. 2024, 107, 103791. [Google Scholar] [CrossRef]
- Liao, Z.; Ren, C.; Sun, F.; Tao, Y.; Li, W. EMD-based model with cooperative training mechanism for tourism demand forecasting. Expert Syst. Appl. 2024, 244, 122930. [Google Scholar] [CrossRef]
- Dong, Y.; Zhou, B.; Yang, G.; Hou, F.; Hu, Z.; Ma, S. A novel model for tourism demand forecasting with spatial–temporal feature enhancement and image-driven method. Neurocomputing 2023, 556, 126663. [Google Scholar] [CrossRef]
- Subbiah, S.S.; Chinnappan, J. Opportunities and challenges of feature selection methods for high dimensional data: A review. Ing. Syst. d’Information 2021, 26, 67. [Google Scholar] [CrossRef]
- Jia, W.; Sun, M.; Lian, J.; Hou, S. Feature dimensionality reduction: A review. Complex Intell. Syst. 2022, 8, 2663–2693. [Google Scholar] [CrossRef]
- Zebari, R.; Abdulazeez, A.; Zeebaree, D.; Zebari, D.; Saeed, J. A comprehensive review of dimensionality reduction techniques for feature selection and feature extraction. J. Appl. Sci. Technol. Trends 2020, 1, 56–70. [Google Scholar] [CrossRef]
- Peng, X.; Xu, D.; Chen, D. Robust distribution-based nonnegative matrix factorizations for dimensionality reduction. Inf. Sci. 2021, 552, 244–260. [Google Scholar] [CrossRef]
- Liu, X.; Yang, W.; Meng, F.; Sun, T. Material recognition using robotic hand with capacitive tactile sensor array and machine learning. IEEE Trans. Instrum. Meas. 2024, 73, 1–9. [Google Scholar] [CrossRef]
- Feng, G. Feature selection algorithm based on optimized genetic algorithm and the application in high-dimensional data processing. PLoS ONE 2024, 19, e0303088. [Google Scholar] [CrossRef] [PubMed]
- Wang, L.; Huynh, D.Q.; Mansour, M.R. Loss switching fusion with similarity search for video classification. In Proceedings of the 2019 IEEE International Conference on Image Processing (ICIP), Taipei, Taiwan, 22–25 September 2019; IEEE: New York, NY, USA, 2019; pp. 974–978. [Google Scholar]
- Jarrett, D.; van der Schaar, M. Target-embedding autoencoders for supervised representation learning. arXiv 2020, arXiv:2001.08345. [Google Scholar]
- Yigit, G.O.; Baransel, C. A novel autoencoder-based feature selection method for drug-target interaction prediction with human-interpretable feature weights. Symmetry 2023, 15, 192. [Google Scholar] [CrossRef]
- Gidebo, H.B. Factors determining international tourist flow to tourism destinations: A systematic review. J. Hosp. Manag. Tour. 2021, 12, 9–17. [Google Scholar]
- Chang, C.-L.; McAleer, M. Aggregation, heterogeneous autoregression and volatility of daily international tourist arrivals and exchange rates. Jpn. Econ. Rev. 2012, 63, 397–419. [Google Scholar] [CrossRef]
- Santana-Gallego, M.; Ledesma-Rodríguez, F.J.; Pérez-Rodríguez, J.V. Exchange rate regimes and tourism. Tour. Econ. 2010, 16, 25–43. [Google Scholar] [CrossRef]
- Chao, C.-C.; Lu, L.-J.; Lai, C.-C.; Hu, S.-W.; Wang, V. Devaluation, pass-through and foreign reserves dynamics in a tourism economy. Econ. Model. 2013, 30, 456–461. [Google Scholar] [CrossRef]
- Goh, C.; Law, R. Incorporating the rough sets theory into travel demand analysis. Tour. Manag. 2003, 24, 511–517. [Google Scholar] [CrossRef]
- Xie, G.; Qian, Y.; Wang, S. Forecasting chinese cruise tourism demand with big data: An optimized machine learning approach. Tour. Manag. 2021, 82, 104208. [Google Scholar] [CrossRef]
- Albaladejo, I.; González-Martínez, M. A nonlinear dynamic model for international tourism demand on the Spanish Mediterranean coasts. Econ. Manag. 2018, 21, 65–78. [Google Scholar] [CrossRef]
- Englin, J.; Moeltner, K. The value of snowfall to skiers and boarders. Environ. Resour. Econ. 2004, 29, 123–136. [Google Scholar] [CrossRef]
- Kandampully, J.; Juwaheer, T.D.; Hu, H.-H. The influence of a hotel firm’s quality of service and image and its effect on tourism customer loyalty. Int. J. Hosp. Tour. Adm. 2011, 12, 21–42. [Google Scholar] [CrossRef]
- Huybers, T. Modelling short-break holiday destination choices. Tour. Econ. 2003, 9, 389–405. [Google Scholar] [CrossRef]
- Ongan, S.; Ișik, C.; Ozdemir, D. The effects of real exchange rates and income on international tourism demand for the USA from some European Union countries. Economies 2017, 5, 51. [Google Scholar] [CrossRef]
- Pan, B.; Yang, Y. Forecasting destination weekly hotel occupancy with big data. J. Travel Res. 2017, 56, 957–970. [Google Scholar] [CrossRef]
- Falk, M. Impact of weather conditions on tourism demand in the peak summer season over the last 50 years. Tour. Manag. Perspect. 2014, 9, 24–35. [Google Scholar]
- Becken, S. Measuring the effect of weather on tourism: A destination and activity-based analysis. J. Travel Res. 2013, 52, 156–167. [Google Scholar] [CrossRef]
- Bi, J.-W.; Liu, Y.; Li, H. Daily tourism volume forecasting for tourist attractions. Ann. Tour. Res. 2020, 83, 102923. [Google Scholar] [CrossRef]
- Álvarez-Díaz, M.; Rosselló-Nadal, J. Forecasting British tourist arrivals in the Balearic Islands using meteorological variables. Tour. Econ. 2010, 16, 153–168. [Google Scholar] [CrossRef]
- Bangwayo-Skeete, P.F.; Skeete, R.W. Can google data improve the forecasting performance of tourist arrivals? Mixed-data sampling approach. Tour. Manag. 2015, 46, 454–464. [Google Scholar] [CrossRef]
- Yang, X.; Pan, B.; Evans, J.A.; Lv, B. Forecasting Chinese tourist volume with search engine data. Tour. Manag. 2015, 46, 386–397. [Google Scholar] [CrossRef]
- Li, S.; Chen, T.; Wang, L.; Ming, C. Effective tourist volume forecasting supported by PCA and improved BPNN using Baidu index. Tour. Manag. 2018, 68, 116–126. [Google Scholar] [CrossRef]
- Li, K.; Lu, W.; Liang, C.; Wang, B. Intelligence in tourism management: A hybrid FOA-BP method on daily tourism demand forecasting with web search data. Mathematics 2019, 7, 531. [Google Scholar] [CrossRef]
- Pan, B.; Wu, D.C.; Song, H. Forecasting hotel room demand using search engine data. J. Hosp. Tour. Technol. 2012, 3, 196–210. [Google Scholar] [CrossRef]
- Zhang, B.; Pu, Y.; Wang, Y.; Li, J. Forecasting hotel accommodation demand based on LSTM model incorporating internet search index. Sustainability 2019, 11, 4708. [Google Scholar] [CrossRef]
- Law, R.; Li, G.; Fong, D.K.C.; Han, X. Tourism demand forecasting: A deep learning approach. Ann. Tour. Res. 2019, 75, 410–423. [Google Scholar] [CrossRef]
- Gardner, E.S., Jr. Exponential smoothing: The state of the art. J. Forecast. 1985, 4, 1–28. [Google Scholar] [CrossRef]
- Holt, C.C. Forecasting seasonals and trends by exponentially weighted moving averages. Int. J. Forecast. 2004, 20, 5–10. [Google Scholar] [CrossRef]
- Lee, Y.-S.; Tong, L.-I. Forecasting energy consumption using a grey model improved by incorporating genetic programming. Energy Convers. Manag. 2011, 52, 147–152. [Google Scholar] [CrossRef]
- Chang, Y.-W.; Tsai, C.-Y. Apply deep learning neural network to forecast number of tourists. In Proceedings of the 2017 31st International Conference on Advanced Information Networking and Applications Workshops (WAINA), Taipei, Taiwan, 27–29 March 2017; IEEE: New York, NY, USA, 2017; pp. 259–264. [Google Scholar]
- Chen, T.; Guestrin, C. XGBoost: A scalable tree boosting system. In Proceedings of the 22nd ACM SIGKDD International Conference on Knowledge Discovery and Data Mining, San Francisco, CA, USA, 13–17 August 2016; pp. 785–794. [Google Scholar]
- Ke, G.; Meng, Q.; Finley, T.; Wang, T.; Chen, W.; Ma, W.; Ye, Q.; Liu, T.-Y. LightGBM: A highly efficient gradient boosting decision tree. In Proceedings of the 31st Conference on Neural Information Processing Systems (NIPS 2017), Long Beach, CA, USA, 4–9 December 2017; Volume 30. [Google Scholar]
- Vahdat, A.; Kautz, J. NVAE: A deep hierarchical variational autoencoder. Adv. Neural Inf. Process. Syst. 2020, 33, 19667–19679. [Google Scholar]
- Khan, N.; Hassan, A.U.; Fahad, S.; Naushad, M. Factors affecting tourism industry and its impacts on global economy of the world. SSRN Electron. J. 2020, 1, 1–32. [Google Scholar] [CrossRef]
- Sapkota, P.; Vashisth, K.K.; Ranabhat, D. A systematic literature review on factors affecting rural tourism. In International Conference on Intelligent Computing & Optimization; Springer: Cham, Switzerland, 2023; pp. 45–55. [Google Scholar]
- Luo, Y.; Yi, X. Tourism industry resilience and its influencing factors: An experience from 60 countries. E3S Web Conf. 2023, 409, 06005. [Google Scholar]
- De Rainville, F.-M.; Fortin, F.-A.; Gardner, M.-A.; Parizeau, M.; Gagne, C. DEAP: A python framework for evolutionary algorithms. In Proceedings of the 14th Annual Conference Companion on Genetic and Evolutionary Computation, Philadelphia, PA, USA, 7–11 July 2012; pp. 85–92. [Google Scholar]


| Factor Class | Feature Name |
|---|---|
| Economic Factors | Average Exchange Rate NTD/USD, Economic Growth Rate, GDP Nominal Value Million NTD, Average GDP per Capita NTD, GNI Nominal Value Million NTD, Average GNI per Person NTD, National Income Million NTD, Basic Consumer Price Index, CPI Food, Export Annual Growth Rate, Import Annual Growth Rate, Taiwan Weighted Index, Taiwan Annual Growth Rate |
| Tourism Resources | Overview of Hotels and B&Bs, Number of Rooms, International Tourist Hotel Number, International Tourist Hotel Rooms, General Hotels Guesthouse Rooms, Tourist Hotel Occupancy Rate, International Tourist Hotel Occupancy Rate, General Tourist Hotel Occupancy Rate, Number of Passengers, Total Number of Tourist Hotels, Total Number of Tourist Hotel Rooms, International Tourist Hotels Houses, General Tourist Hotels Rooms |
| Other Factors | Number of Precipitation Days Taipei, Number of Occurrences Including Supplementary Reports, Monthly Indicators (Is January, Is February, Is March, etc.), Criminal Case Incidence Rate |
| Non-Ensemble Algorithm | Ensemble Algorithm | ||||||||||
|---|---|---|---|---|---|---|---|---|---|---|---|
| ML Algorithm | Linear Regression | Support Vector Regression | XGBoost | LightGBM | Ensemble DNN | ||||||
| Metrics | Taiwan Dataset | Hawaii Dataset | Taiwan Dataset | Hawaii Dataset | Taiwan Dataset | Hawaii Dataset | Taiwan Dataset | Hawaii Dataset | Taiwan Dataset | Hawaii Dataset | |
| N/A | MAPE(%) | 44.37 | 16.21 | 153.95 | 106.46 | 6.30 | 5.48 | 10.71 | 34.71 | 6.45 | 7.62 |
| R2 | 0.96 | 0.95 | 0.44 | 0.01 | 0.98 | 0.92 | 0.97 | 0.78 | 0.99 | 0.96 | |
| MAE | 48,191.56 | 29,607.05 | 272,444.50 | 127,291.25 | 30,176.27 | 35,045.92 | 33,087.99 | 53,033.07 | 19,708.60 | 20,488.88 | |
| MSE | 3,580,592,919.74 | 1,428,550,200.08 | 122,502,556,231.60 | 29,136,902,542.55 | 1,545,737,496.62 | 2,431,270,227.28 | 1,810,755,913.05 | 6,306,689,740.96 | 686,173,563.94 | 10,444,29,832.88 | |
| PCA | MAPE(%) | 30.98 | 116.07 | 153.95 | 106.45 | 8.47 | 98.02 | 10.80 | 93.79 | 7.68 | 93.14 |
| R2 | 0.97 | 0.02 | 0.44 | 0.01 | 0.96 | 0.02 | 0.98 | 0.42 | 0.99 | 0.42 | |
| MAE | 44,413.17 | 88,792.58 | 272,445.54 | 127,291.36 | 45,902.30 | 76,612.07 | 37,033.22 | 64,840.58 | 19,781.80 | 61,009.96 | |
| MSE | 2,876,436,756.27 | 29,295,102,232.71 | 122,502,714,091.85 | 29,137,198,570.28 | 3,778,180,675.34 | 28,133,109,043.76 | 2,072,797,773.85 | 16,577,496,052.83 | 618,026,385.05 | 16,697,134,852.70 | |
| NMF | MAPE(%) | 10.00 | 113.10 | 153.95 | 106.46 | 13.87 | 110.64 | 22.65 | 88.71 | 22.05 | 103.59 |
| R2 | 0.98 | 0.06 | 0.44 | 0.01 | 0.96 | 0.01 | 0.97 | 0.44 | 0.98 | 0.33 | |
| MAE | 35,905.75 | 78,195.33 | 272,448.92 | 127,295.17 | 40,632.38 | 88,337.42 | 42,452.38 | 62,554.41 | 26,025.87 | 62,003.89 | |
| MSE | 1,763,518,534.39 | 27,017,646,693.74 | 122,506,951,824.28 | 29,138,263,565.44 | 3,155,862,181.89 | 28,544,686,820.03 | 2,790,969,394.51 | 16,273,102,607.65 | 1,310,598,482.89 | 19,442,662,498.81 | |
| ICA | MAPE(%) | 30.98 | 116.07 | 153.95 | 106.46 | 96.35 | 10.79 | 105.08 | 42.43 | 17.00 | 64.84 |
| R2 | 0.97 | 0.02 | 0.44 | 0.01 | 0.58 | 0.84 | 0.65 | 0.75 | 0.99 | 0.40 | |
| MAE | 44,413.17 | 88,792.58 | 272,467.79 | 127,293.88 | 142,846.21 | 42,586.48 | 139,005.58 | 55,865.14 | 26,311.08 | 62,962.40 | |
| MSE | 2,876,436,756.27 | 29,295,102,232.71 | 122,516,110,191.73 | 29,137,926,008.70 | 36,115,301,305.40 | 4,671,807,062.51 | 30,189,483,312.54 | 7,101,395,924.60 | 1,169,826,432.83 | 16,180,779,860.68 | |
| GA | MAPE(%) | 15.88 | 12.82 | 153.94 | 87.58 | 3.97 | 13.49 | 10.07 | 87.14 | 5.94 | 85.61 |
| R2 | 0.99 | 0.82 | 0.44 | 0.02 | 0.98 | 0.85 | 0.98 | 0.86 | 0.99 | 0.94 | |
| MAE | 18,597.52 | 49,775.85 | 272,440.82 | 114,824.03 | 26,015.40 | 42,986.75 | 31,416.39 | 44,144.06 | 17,685.21 | 29,444.51 | |
| MSE | 579,034,917.90 | 4,512,793,296.79 | 122,500,280,086.79 | 25,690,312,566.67 | 1,336,329,997.87 | 4,163,766,490.20 | 1,689,813,130.69 | 4,057,405,850.44 | 542,619,854.65 | 1,661,177,597.14 | |
| AE | MAPE(%) | 13.85 | 16.43 | 153.94 | 106.46 | 8.87 | 5.73 | 17.24 | 12.29 | 8.30 | 11.15 |
| R2 | 0.90 | 0.72 | 0.44 | 0.01 | 0.97 | 0.88 | 0.98 | 0.81 | 0.96 | 0.90 | |
| MAE | 632,82.15 | 518,83.72 | 272,443.50 | 127,294.46 | 40,602.58 | 38,273.52 | 37,472.40 | 45,745.87 | 34,241.51 | 33,786.79 | |
| MSE | 8,606,617,153.48 | 8,122,755,005.22 | 122,502,875,176.51 | 29,137,715,139.45 | 2,958,574,653.26 | 3,495,323,416.13 | 2,024,845,387.51 | 5408,841,511.93 | 2,076,884,185.44 | 2871,565,836.54 | |
| Proposed TCA | MAPE(%) | 23.60 | 100.90 | 153.96 | 106.46 | 3.39 | 4.01 | 4.20 | 12.24 | 3.82 | 5.40 |
| R2 | 0.93 | 0.35 | 0.44 | 0.01 | 0.99 | 0.94 | 0.99 | 0.95 | 0.99 | 0.93 | |
| MAE | 57,597.40 | 71,267.4 | 272,423.22 | 127,292.40 | 17,546.36 | 24,622.89 | 20,411.49 | 26,424.88 | 20,265.13 | 32,021.74 | |
| MSE | 5,305,466,415.67 | 18,828,240,838.64 | 122,484,233,648.75 | 29,137,155,794.53 | 572,043,855.45 | 1,511,766,621.07 | 704,602,763.48 | 1,410,040,762.55 | 797,674,876.20 | 1,939,227,582.49 | |
| Feature Selection Algorithm (sec) | XGBoost | LightGBM | DNN |
|---|---|---|---|
| N/A | 0.6702 | 0.0582 | 28.073 |
| GA | 0.2656 | 0.0514 | 26.3374 |
| AE | 0.3321 | 0.0413 | 22.4690 |
| Proposed TCA | 0.2429 | 0.0410 | 20.6280 |
| Forecasting Algorithm | Dataset | |||||||
|---|---|---|---|---|---|---|---|---|
| Taiwan Dataset | Hawaii Dataset | |||||||
| Metric | MAPE(%) | R2 | MAE | MSE | MAPE(%) | R2 | MAE | MSE |
| Xin Li et al. [2] | 11.7960 | 0.59 | 502759.63 | 350522908752.52 | 8.2054 | 0.62 | 650606.63 | 450379091178.05 |
| Shilin Xu et al. [3] | 18.7761 | 0.42 | 160452.71 | 56406622541.15 | 14.7302 | 0.05 | 109171.56 | 25844328174.50 |
| Xin Li et al. [4] | 15.9470 | 0.40 | 188488.32 | 58782250414.49 | 16.2598 | 0.11 | 102129.15 | 23907956381.84 |
| Zhixue Liao et al. [5] | 56.3386 | 0.26 | 123353.41 | 34060171896.04 | 16.1864 | 0.12 | 200205.85 | 57409595119.83 |
| Yunxuan Dong et al. [6] | 32.5634 | 0.08 | 264340.13 | 105147294705.17 | 13.9422 | 0.07 | 130939.70 | 28906322391.38 |
| Proposed TCA + XGBoost | 3.3947 | 0.99 | 17546.36 | 572043855.45 | 4.0059 | 0.95 | 24622.89 | 1511766621.07 |
| Autoencoder for Feature Selection Algorithm | Ensemble Algorithm | |||||||||||
|---|---|---|---|---|---|---|---|---|---|---|---|---|
| XGboost | LightGBM | DNN | ||||||||||
| Metric | MAPE(%) | R2 | MAE | MSE | MAPE(%) | R2 | MAE | MSE | MAPE(%) | R2 | MAE | MSE |
| LSFNet [13] | 8.1555 | 0.95 | 42525.26 | 4341837554.26 | 20.0276 | 0.91 | 52919.48 | 7471447265.09 | 11.4890 | 0.97 | 28609.67 | 2430952014.99 |
| TEA [14] | 6.2099 | 0.98 | 26631.71 | 1319270923.18 | 5.0711 | 0.99 | 21020.31 | 685203513.18 | 7.7560 | 0.99 | 19770.87 | 584301475.34 |
| Yigit et al. [15] | 14.5297 | 0.88 | 62040.50 | 9989434231.52 | 22.5313 | 0.94 | 52751.88 | 5495490699.08 | 7.7506 | 0.94 | 34930.77 | 5338013378.45 |
| Proposed TCA | 3.3947 | 0.99 | 17546.36 | 572043855.45 | 4.1990 | 0.99 | 20855.41 | 767308943.62 | 3.8246 | 0.99 | 20265.13 | 797674876.20 |
| Feature | Importance |
|---|---|
| General_tourist_hotel_occupancy_rate_ | 980.2686 |
| Tourist_hotel_occupancy_rate_ | 890.6157 |
| International_tourist_hotel_occupancy_rate_ | 880.665 |
| Hualien_Port_Vessel_Number | 606.4426 |
| US_NAS_Annual_Growth_Rate_ | 593.4832 |
| _International_Number_of_tourist_hotel_rooms_rooms_ | 586.5709 |
| Tourist_hotelsaverage_room_rateinternational_hotels_NTD | 549.1753 |
| Midterm_population_person | 547.4845 |
| Singapore_Annual_Growth_Rate_ | 528.6199 |
| Revenue_NT1000 | 524.0346 |
| Is_December | 517.9967 |
| International_tourist_hotel_number_of_rooms | 517.4117 |
| Total_Number_of_tourist_hotel_rooms_rooms | 516.4645 |
| _Taichung_Port_Vessel_Number | 503.0249 |
| International_Number_of_tourist_hotels_houses | 498.6601 |
| Taiwan_Annual_Growth_Rate_ | 492.6557 |
| Shenzhen_Composite_Index | 489.9534 |
| Is_November | 485.3672 |
| Is_January | 485.2595 |
| International_tourist_hotel_number | 480.1551 |
Disclaimer/Publisher’s Note: The statements, opinions and data contained in all publications are solely those of the individual author(s) and contributor(s) and not of MDPI and/or the editor(s). MDPI and/or the editor(s) disclaim responsibility for any injury to people or property resulting from any ideas, methods, instructions or products referred to in the content. |
© 2024 by the authors. Licensee MDPI, Basel, Switzerland. This article is an open access article distributed under the terms and conditions of the Creative Commons Attribution (CC BY) license (https://creativecommons.org/licenses/by/4.0/).
Share and Cite
Chang, R.-I.; Tsai, C.-Y.; Chang, Y.-W. Enhancing Visitor Forecasting with Target-Concatenated Autoencoder and Ensemble Learning. Mach. Learn. Knowl. Extr. 2024, 6, 1673-1698. https://doi.org/10.3390/make6030083
Chang R-I, Tsai C-Y, Chang Y-W. Enhancing Visitor Forecasting with Target-Concatenated Autoencoder and Ensemble Learning. Machine Learning and Knowledge Extraction. 2024; 6(3):1673-1698. https://doi.org/10.3390/make6030083
Chicago/Turabian StyleChang, Ray-I, Chih-Yung Tsai, and Yu-Wei Chang. 2024. "Enhancing Visitor Forecasting with Target-Concatenated Autoencoder and Ensemble Learning" Machine Learning and Knowledge Extraction 6, no. 3: 1673-1698. https://doi.org/10.3390/make6030083
APA StyleChang, R.-I., Tsai, C.-Y., & Chang, Y.-W. (2024). Enhancing Visitor Forecasting with Target-Concatenated Autoencoder and Ensemble Learning. Machine Learning and Knowledge Extraction, 6(3), 1673-1698. https://doi.org/10.3390/make6030083