Article

Enhancing Docking Accuracy with PECAN2, a 3D Atomic Neural Network Trained without Co-Complex Crystal Structures

by
Heesung Shim
1,*,
Jonathan E. Allen
2 and
W. F. Drew Bennett
1,*
1
Physical and Life Sciences, Lawrence Livermore National Laboratory, Livermore, CA 94550, USA
2
Global Security Computing Applications Division, Lawrence Livermore National Laboratory, Livermore, CA 94550, USA
*
Authors to whom correspondence should be addressed.
Mach. Learn. Knowl. Extr. 2024, 6(1), 642-657; https://doi.org/10.3390/make6010030
Submission received: 8 January 2024 / Revised: 22 February 2024 / Accepted: 27 February 2024 / Published: 11 March 2024

Abstract

:
Decades of drug development research have explored a vast chemical space for highly active compounds. The exponential growth of virtual libraries enables easy access to billions of synthesizable molecules. Computational modeling, particularly molecular docking, utilizes physics-based calculations to prioritize molecules for synthesis and testing. Nevertheless, the molecular docking process often yields docking poses with favorable scores that prove to be inaccurate with experimental testing. To address these issues, several approaches using machine learning (ML) have been proposed to filter incorrect poses based on the crystal structures. However, most of the methods are limited by the availability of structure data. Here, we propose a new pose classification approach, PECAN2 (Pose Classification with 3D Atomic Network 2), without the need for crystal structures, based on a 3D atomic neural network with Point Cloud Network (PCN). The new approach uses the correlation between docking scores and experimental data to assign labels, instead of relying on the crystal structures. We validate the proposed classifier on multiple datasets including human mu, delta, and kappa opioid receptors and SARS-CoV-2 Mpro. Our results demonstrate that leveraging the correlation between docking scores and experimental data alone enhances molecular docking performance by filtering out false positives and false negatives.

1. Introduction

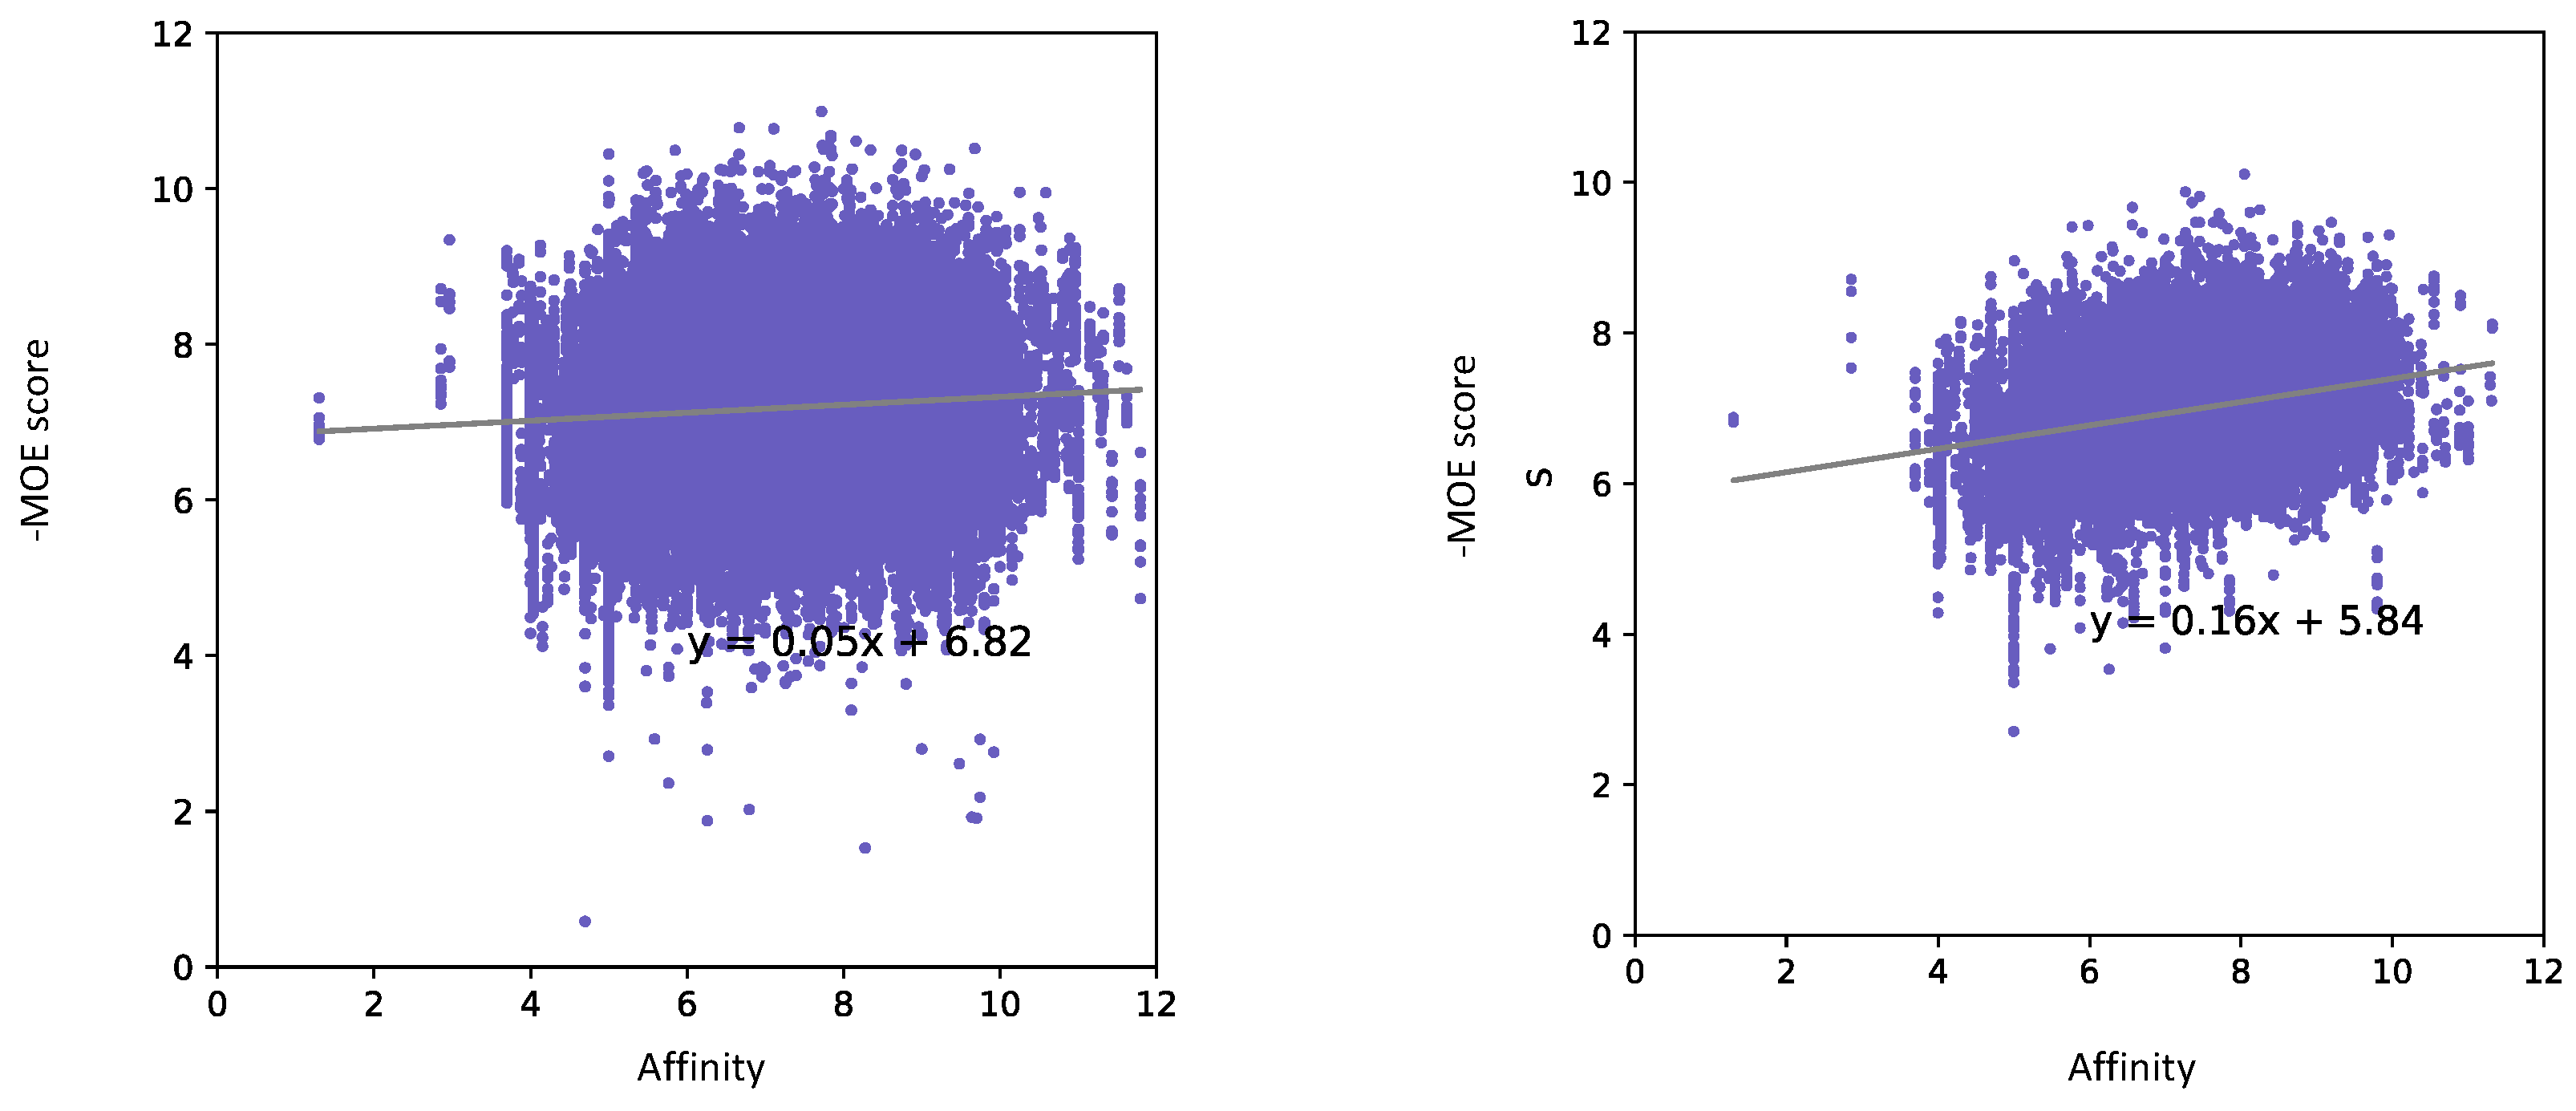
Screening a chemical library to identify lead compounds is one of the most important tasks in the early stage of the drug development process. Because there are estimated to be 1060 possible drug-like molecules, accurate and cheap screening methods can help discover novel chemicals that possess favorable pharmacological properties [1]. Finding and developing new drugs from a vast number of compounds requires significant computational time and resources. Computational modeling methods have been used extensively in the past and are becoming increasingly popular with novel methods and increasing computer power. Among these methods, virtual high-throughput screening using molecular docking has been widely employed due to its relatively low computational cost. Molecular docking utilizes scoring functions to predict the binding affinity and orientation of a small molecule (ligand) within the active site of a target protein. In pursuit of this objective, a variety of scoring functions have been proposed, including force field-based [2,3], knowledge-based [4,5], and empirical scoring functions [6]. However, each scoring function comes with several limitations. Force field scores require careful parameterization, which can be time-consuming and might not cover all cases, leading to inaccuracies. Representing protein and ligand flexibility in these models is challenging, affecting binding energy predictions. Force fields simplify calculations but may miss real-world complexities [7,8]. Knowledge-based scores depend on diverse training data quality. Relying on limited or biased data leads to inaccuracies [5,9]. Empirical scores struggle with complexity, relying on predefined parameters and limited training data quality, which can be inaccurate for new molecules. These models struggle with flexibility, overlook energy contributions, and are less effective in complex contexts or differing systems [10,11]. Due to these limitations, the docking process often yields docking poses that do not reflect the true binding conformation leading to the inaccurate calculation of chemical binding properties. Figure 1 shows a scatter plot illustrating the correlation between the docking scores of ligands docked to the mu opioid receptor using the commonly used docking programs Autodock Vina and MOE and their experimentally measured affinity. The ligands were docked to the protein, and their docking scores were plotted against the experimentally measured affinity values. The Pearson correlation between the docking scores and the experimentally measured affinities is weak: 0.122 and 0.083 for Autodock Vina and MOE, respectively. Therefore, relying on the molecular docking scores to down-select compounds for follow-up experiments remains relatively inefficient.
To address these challenges, numerous studies have been conducted to predict the binding affinity of ligands and identify the active compounds using machine learning. Various machine learning algorithms, such as support vector machines (SVM) [12], random forests (RFs) [13], and gradient boosting [14,15], have been utilized to explore non-linear relationships between descriptors and binding affinity, with descriptors encoding information about the ligand, the protein, or intermolecular interactions in the protein–ligand complex. One of the recently widely used technologies is convolutional neural networks (CNNs). CNNs [16] represent a category of neural networks aimed at addressing the limitations of feed-forward neural networks. They utilize convolution operations in certain layers instead of matrix multiplication. Wallach et al. [17] introduced a deep convolutional network based on molecular structures for predicting bioactivity, specifically classifying small drug-like molecules into two activity categories, against a designated target. In recent years, numerous alternative architectures using CNNs have emerged for predicting binding affinity. Prominent instances include Pafnucy [18], DeepAtom [19], as well as OnionNet [20] and its successor OnionNet-2 [21], along with RoseNet [22]. Graph neural networks (GNNs) have gained significant attention and application in the field of drug development and have shown complimentary properties to CNNs [23]. GNNs are a class of machine learning models designed to work with graph-structured data, making them well suited for tasks involving molecular structures, protein interactions, and other complex chemical and biological systems [24,25]. Lately, generative machine learning models have been extensively utilized in drug development. These models, which include Generative Adversarial Networks (GANs) and Variational Autoencoders (VAEs), are capable of generating new data samples that resemble the training data. In the context of drug development, generative models can be employed to create novel molecular structures with desired properties. Corso et al. [26] developed DiffDock, a molecular docking approach using the diffusion model, one of the generative model methods. Additionally, Urbina et al. [27] created molecule analogue generation software called MegaSyn by utilizing generative models. However, these technology applications using machine learning are not without their drawbacks. According to Buttenschoen et al. [28], machine learning-based molecular docking methods were found to exhibit issues related to physical plausibility when evaluated using their developed ‘PoseBuster’ program. Furthermore, most studies rely on PDBbind for training, a curated collection of protein–ligand complexes with experimentally determined binding affinity data [29]. The database is publicly accessible and serves as an invaluable resource for training and validating machine learning models in the field of drug development. However, protein–ligand structures obtained through crystallography or other experimental techniques do not represent the full range of protein conformations and dynamics that occur in real biological systems. Additionally, the selection of protein structures for crystallization can be biased towards certain targets or conformations based on various factors, such as the ease of crystallization or research interest. Crystallizing proteins that are embedded in cell membranes, such as G protein-coupled receptors (GPCRs) and ion channels, present unique challenges due to their hydrophobic nature and complex interactions with the membrane [30]. Consequently, the PDBbind dataset contains a relatively limited number of these membrane proteins. Additionally, the performance of training models trained on the PDBbind dataset may be less effective when applied to these specific membrane proteins. Yang et al. [31] demonstrate how biased these datasets can be in their study. In addition, the number of crystalized ligands remains small relative to the size of the virtual chemical space. Li et al. [32] show how the PDBbind dataset lacks generalizability by testing it against a completely different dataset in their study.
Thus, ML models trained exclusively on PDBbind lack generalizability and motivate the need for transfer learning and additional fine-tuning to a specific protein target and chemical space. Otherwise, the lack of access to co-crystal structures for the majority of protein receptors constrains model applicability.
To address these challenges, we developed a novel machine-learning approach that does not rely on the most commonly used and structurally biased datasets, PDBbind and DUD-E [31], and does not require crystal structures of protein–ligand complexes. Our method can be trained using only the protein structures, known binding sites, experimental binding affinity data of ligands, and their docking poses. The primary objective of this pose classifier is similar to our original PECAN model [33]. However, our new proposed method does not require any co-complex structures. The labeling of a pose is based on its correlation with the pose docking score and experimentally measured binding affinity. The goal is to train the model for the specific binding site of the target receptor. Only the poses that are predicted as correlated to binding affinity are retained in the results, while the poses predicted as uncorrelated to binding affinity are filtered out. PECAN2 filters molecular docking poses, improving virtual high-throughput screening by at least 10%, specifically in detecting strong binders.

2. Materials and Methods

2.1. Data

To conduct experiments and assess the proposed pose classification, we employed a range of datasets containing protein–ligand complexes. We initially utilized a dataset comprising mu, kappa, and delta opioid receptors, which are integral parts of the opioid receptor system and play a significant role in the human response to opioids and other pain-relieving substances, along with their corresponding ligands (drugs). Data were sourced from BindingDB [34] and Pharos [35]. BindingDB is a comprehensive and publicly accessible database that provides quantitative measurements of binding affinities such as dissociation constants, inhibition constants, or binding constants between ligands and their target proteins. BindingDB contains experimental data obtained from various sources, including the scientific literature, patents, and other public databases. Pharos is the interface for a large NIH-funded database that focuses on three of the most commonly drug-targeted protein families, namely, G protein-coupled receptors (GPCRs), Ion channel (ICS), and Kinase [35].
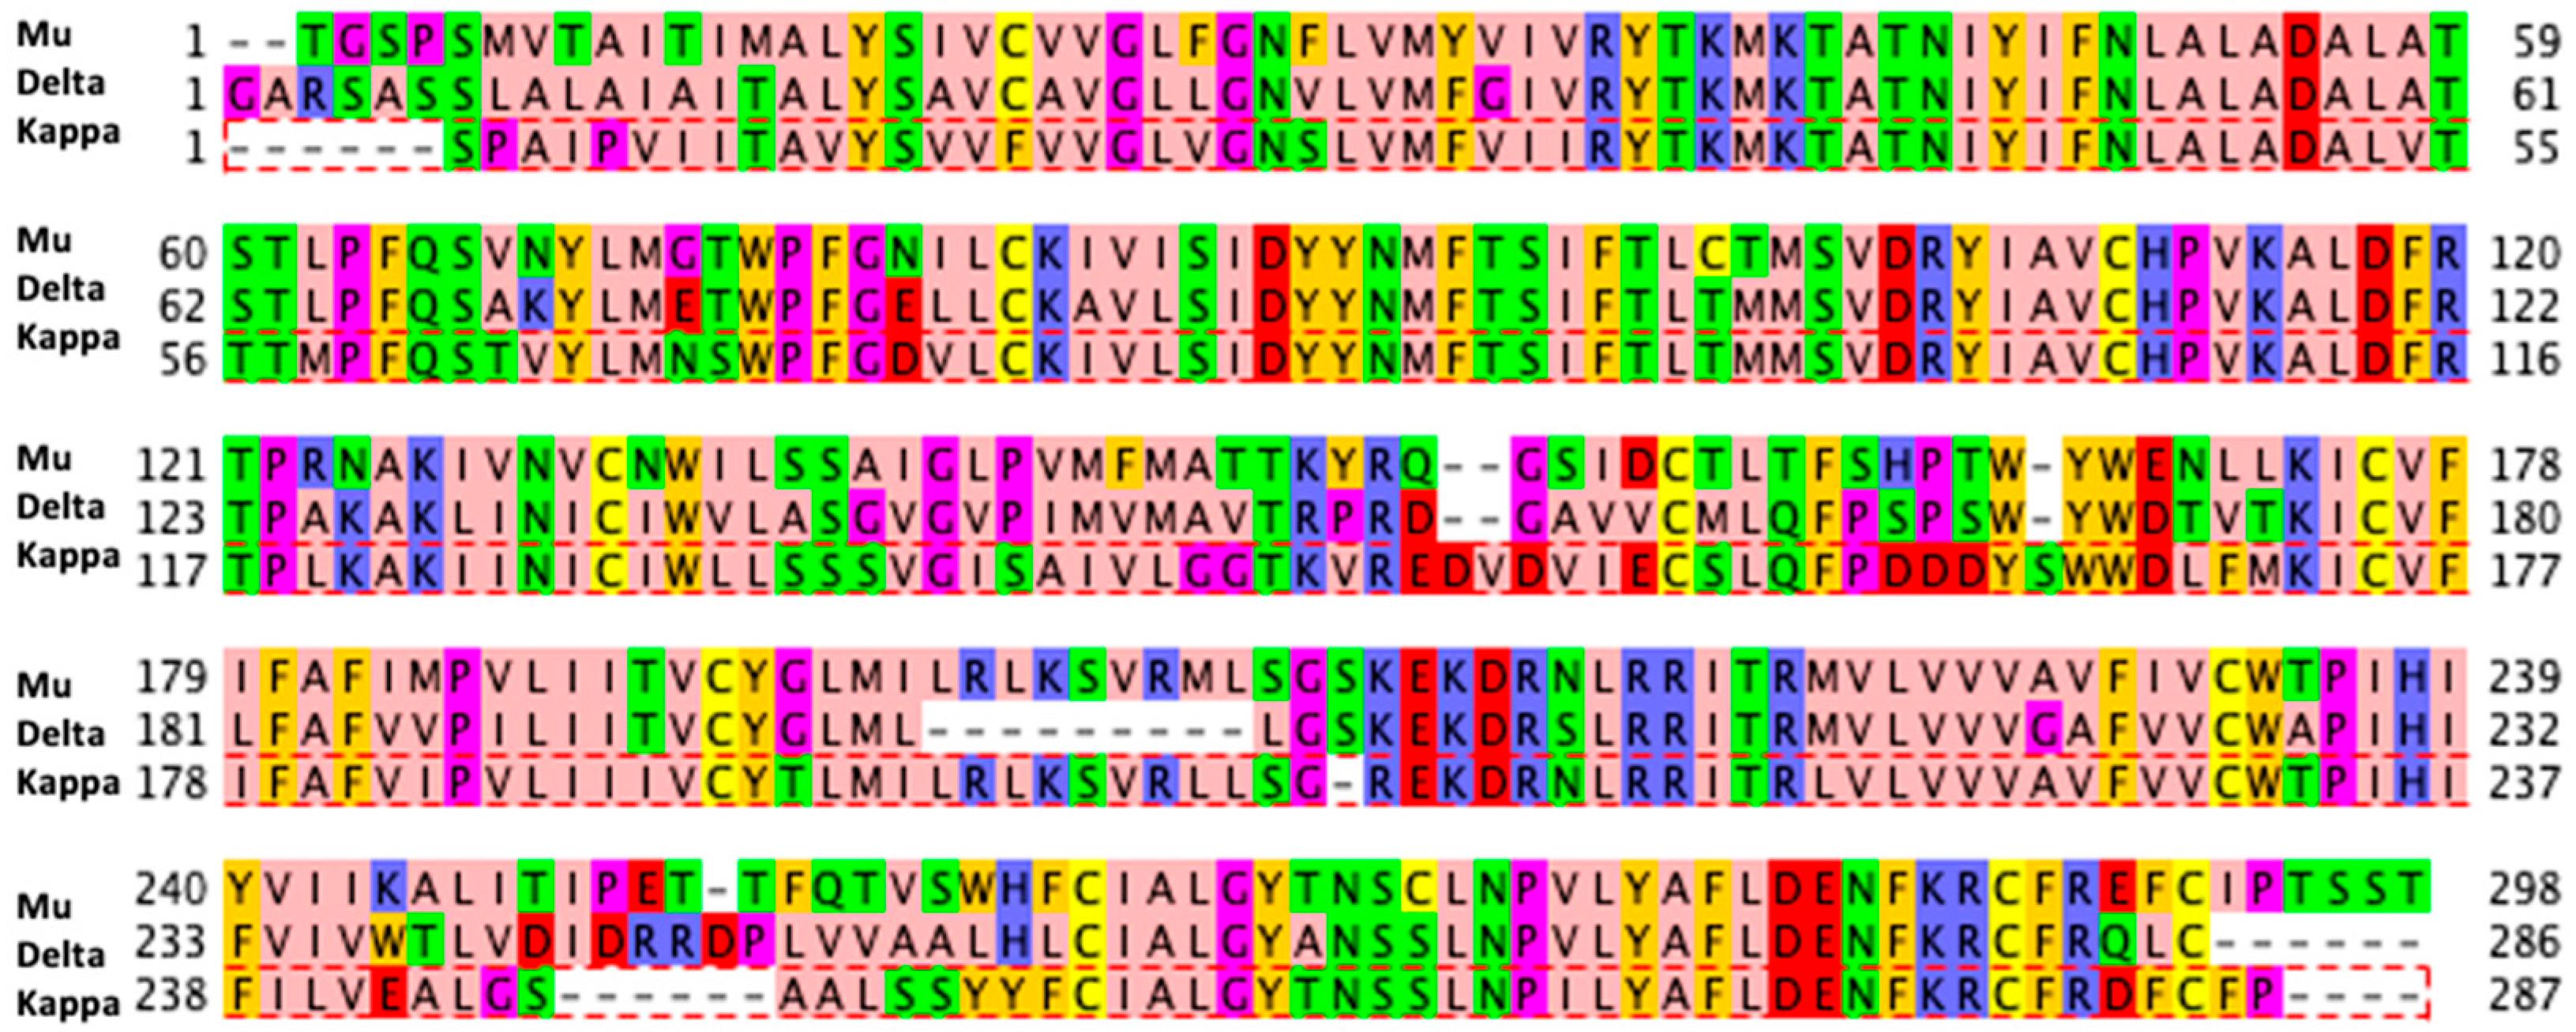
The structures of the opioid receptors were downloaded from the protein data bank, and the pdb ids of three opioid receptors are 4DKL(mu) [36], 4DJH(kappa) [37], and 4RWA(delta) [38]. We procured 2338 ligands for the mu opioid receptor from Pharos, and 7419 from BindingDB. Furthermore, we acquired 8549 ligands for the delta receptor and 8576 ligands for the kappa receptor, all sourced from BindingDB. The three opioid receptors—mu, delta, and kappa—belong to the same family of G protein-coupled receptors (GPCRs), specifically the opioid receptor family. Despite having distinct roles and specificities, they share structural and functional similarities due to their common origin within this receptor family. The three opioid receptors—delta, kappa, and mu—exhibit sequence identities ranging from 55% to 58% when compared to each other [39]. The sequence similarity is illustrated in Figure 2.
The availability of mu opioid receptor structure data was checked in the Protein Data Bank. Our search yielded approximately 17 crystal structures related to the mu opioid receptor, 15 protein–ligand complexes and 2 proteins alone. This confirmed the limited number of structures available for effective machine learning training. In pursuit of testing our classifier against real-world data, we chose SARS-CoV-2 main protease (Mpro) data as our next target. The COVID-19 pandemic caused by SARS-CoV-2 remains a persistent global public health threat, igniting the development of antiviral therapies. The main protease (Mpro) of SARS-CoV-2, due to its vital role in the virus life cycle and high conservation across SARS-CoVs, stands out as an appealing drug target. The protein structure was downloaded from the PDB (pdbid: 6LU7) [40], and 4271 ligands with experimental measurements were retrieved from GOSTAR [41] and POSTERA [42].

2.2. Preprocessing

The ligand SDF files in 2D structure format require some preprocessing for further utilization. For ligand preparation, the formal charges of the ligand and the energy-minimized conformation were calculated by MOE [43]. The protein structures were refined by MOE quick prep preparation. In this process, MOE Protein Quick Prep adds missing hydrogen atoms, assigns partial charges, optimizes sidechain conformations, and addresses structural issues such as gaps or missing residues. The protein was truncated, leaving only the structures within a radius of 12 Å from the binding site. To assess the sensitivity of the pose classifier to the choice of docking program, we docked our ligand data to the target protein using two molecular docking programs, Autodock Vina [44], and MOE. Autodock Vina was used in the conveyor LC [45] pipeline at Lawrence Livermore National Laboratory. A total of 20 docking poses were generated using Autodock Vina, and 10 poses using MOE for each ligand. To increase the chances of obtaining accurate docking results, it was necessary to restrict the molecular weight (MW) of the ligands to 700 Da or lower, and all duplicate data were eliminated. The interaction features used as input for training the PCN model were computed using the Open Drug Discovery Toolkit (ODDT) [46] (https://github.com/oddt/oddt, accessed on 3 April 2023). Four interaction features were calculated: the number of hydrogen bonds, the number of hydrophobic contacts, the number of pi–pi stacking, and the number of salt bridges. The atomic representation was composed of 19 features, as described in Jones et al. [23]. Computational outcomes were collected and stored within a sequence of HDF5 files.

2.3. Point Cloud Network (PCN)

A Point Cloud Network (PCN) is a type of neural network architecture designed to process and analyze point cloud data [47]. Point clouds are sets of data points in a three-dimensional space that represent the shape and structure of objects. Molecular structures of drugs and proteins can be represented as point clouds, where each point corresponds to an atom’s position in three-dimensional space. The PCN model can be used to process these point clouds and extract meaningful features, such as spatial arrangements of atoms or local surface properties. Unlike convolutional neural networks, PCN does not rely on a voxel grid, resulting in fewer model parameters and a significantly faster training process. A detailed description of the architecture of the PCN is given in our previous study [33].

2.4. Experimental Setup

PCN models were developed using PyTorch [23] and executed on multiple NVIDIA TITAN Xp GPUs. For training, we employed the widely used BCE (Binary Cross-Entropy) loss function and utilized the Adam optimizer with a learning rate of 0.001. The training was carried out with a minibatch size of 50 and ran for a total of 50 epochs, a choice guided by considerations from our previous research [33].
The following describes how we labeled the data. The points inside the plots of Figure 3 represent individual docking poses. A scatter plot depicting the relationship between experimental affinity and docking score was generated (see Figure 3a). All docking scores were multiplied by −1 to be consistent with affinity values transformed into pKi and pIC50 by taking the logarithm of Ki or IC50 values and multiplying by −1. Subsequently, the z-scores of both the docking score and affinity were computed to effectively address any outliers. In this process, values with a z-score less than 3 were removed (refer to Figure 3b). Next, the docking score and affinity values underwent normalization, resulting in a range between 0 and 1 (refer to Figure 3c). A reference guideline y = x was introduced to measure the distance between the scatter plot’s x, y coordinates and the guideline. Based on this distance, a distinction was determined: points falling within the defined distance were labeled as correct poses (label = 1), whereas points beyond this distance were labeled as incorrect poses (label = 0) (refer to Figure 3d). The specific distance value (the arrow d inside Figure 3d) chosen hinges on the unique outcomes of the docking process. Since docking poses and docking scores generated from docking results can vary from program to program and even from data to data, the distribution of correlations can also vary. For these reasons, the defined distance inevitably varies with each docking. For example, if there are many correlated poses between docking scores and affinities, meaning that they are densely clustered around the y = x guideline, then the defined distance would be short. Conversely, if there are few poses around the y = x guideline, then the defined distance would be longer. This is because, for unbiased training, the number of blue and yellow points should be balanced when plotting figures like Figure 3d. We iteratively found distance ‘d’ until the number of blue and yellow points became well balanced, with the difference being within approximately 1%. The aim was to select a distance that strikes a balance between the number of correlated and uncorrelated poses.
The data splitting was carried out using two methods: random splitting and scaffold-based splitting to ensure non-overlapping chemical structures. For random splitting, we utilized the random selection feature available in Pandas (version 1.5.3), a software library written for Python, while for scaffold splitting, we employed the AMPL [48] pipeline with Bemis–Murcko scaffold [49]. We opted to remove outliers and normalize the data due to the variability in scatter plots between the docking score and the experimental affinity of the docking results. This preprocessing step was essential as it allowed us to avoid the necessity of establishing different labeling guidelines, which would have been required if we had not performed these adjustments.

3. Results

We conducted several evaluations to quantitatively measure the effectiveness of the proposed pose classification approach. Our evaluation report on model performance includes (1) randomly sampled data used for training, (2) training and test sets with completely different structures (scaffold splits), (3) training on one dataset and testing on another (cross-testing), and (4) the impact of varying the size of the training set. To address these evaluations, we used datasets for mu, delta, and kappa opioid receptor and the SARS-CoV-2 main protease.

3.1. Pose Classification Model Performance

3.1.1. Random Split

The mu, kappa, and delta opioid receptor ligand data were randomly split into training, validation, evaluation1, and evaluation2 at a 70:10:10:10 ratio. We employed two evaluation sets for specific reasons. The first set was designed without outliers and a normalization process, while the second set underwent the same processing as the training and initial evaluation sets. The purpose of this distinction is to enable testing our model on the evaluation set that reflects conditions similar to those of random ligand data, as our model is intended to handle such scenarios, including potential outliers. The second set was labeled with normalized data, excluding outliers, similar to the training and validation sets. This was used to examine the results of the training. The Pearson correlation value for the evaluation1 set was computed twice: once solely based on docking performance and then again after applying the PECAN2 machine learning model to filter out incorrect poses. We then compared the resulting Pearson correlation values. We also collected the top 5% ranked compounds from the evaluation set and counted how many strong binders (affinity value, pKi, or pIC50, is greater than 7) each model reported. Table 1 shows the results of the PCN model for the evaluation1 set of the mu, kappa, and delta opioid dataset using Autodock Vina and MOE.
Overall, when the PECAN2 pose classifier was applied, we observed a notable improvement in the Pearson correlation coefficients between binding affinity and docking score compared to when PECAN2 was not applied. Additionally, upon examining the compounds ranked in the top 5%, it was observed that the number of strong binders increased. Experiments with docking poses using both Autodock Vina and MOE consistently demonstrated the most significant improvement in Pearson coefficients for the delta receptor data. In Autodock Vina, it went from 0.165 to 0.416, while in MOE, it increased from 0.094 to 0.448. In strong binder detection, Autodock Vina showed the most improvement with delta data (33%), while MOE exhibited the most improvement with kappa data (27%). In general, the Pearson value increased by an average of 0.29, and the number of strong binders, when using PECAN2, found an average of 24.5% more strong binders compared to when it was not used. These results were not limited to compounds with a binding affinity of 7 or higher but also extended to compounds with binding affinities of 8 and 9 or higher. All scatter plots and histograms are provided in Figure S1 of the Supporting Information. This improvement is due to the application of the PECAN2 model, which resulted in the removal of uncorrelated poses. As one example, when looking at the scatter plot of the delta result in Figure 4, it becomes evident that the rise in correlation between the docking score and affinity results from the filtration of false positive and false negative poses.

3.1.2. Scaffold Split

Although there were no identical compounds overlapping between randomly split training and evaluation sets, there could be structurally similar compounds. To ensure structurally different, non-overlapping datasets between training and evaluation, we split the dataset into training and test sets based on the scaffold of compounds to ensure non-overlapping structural patterns. The structure-based split results demonstrate that the pose classifier can distinguish between correlated and uncorrelated poses, even when the structures of the ligands in the training and testing sets are different.
Overall, similar to the random split data experiment, the application of the PECAN2 pose classifier resulted in improved Pearson coefficients. When reviewing the compounds ranked in the top 5%, an increase in the number of strong binders was observed, as detailed in Table 2. In general, the Pearson value increased by an average of 0.24, and the number of strong binders, when using PECAN2, found an average of 10.5% more strong binders compared to when it was not used. Differing from random splitting, in Autodock Vina docking, the delta receptor data displayed the most notable increase in Pearson value, going from 0.24 to 0.49, while in MOE docking, the mu receptor data demonstrated the most substantial increase in Pearson value, going from 0.04 to 0.4. In strong binder detection, both Autodock Vina and MOE showed the most significant improvement with delta data, with 17% and 20%, respectively. All scatter plots and histograms are provided in Figure S2 of the Supporting Information.

3.1.3. Cross-Testing

Due to the high similarity in the structures of the three opioid receptors (Figure 2), we evaluated model performance when trained on one receptor and applied to the other two opioid receptors. For instance, after training on the mu Autodock Vina dataset, we tested the model on both the whole kappa and delta Autodock Vina datasets separately. We employed this approach to test the mu and kappa datasets on the model trained with the delta dataset, and tested the mu and delta datasets on the model trained with the kappa dataset. This was also applied in MOE.
The Pearson correlation between docking score and binding affinity increased when PECAN2 was used across all experiments, as detailed in Table 3. When both programs were trained on mu data and tested on kappa data, Autodock Vina showed the most significant improvement, increasing from −0.02 to 0.113, while MOE improved from 0.015 to 0.23. In general, the Pearson value increased by an average of 0.11, and the number of strong binders, when using PECAN2, found an average of 7.25% more strong binders compared to when it was not used. The results of testing the delta data with the model trained using kappa showed a decrease in the number of identified strong binders. While there could be several reasons for this observation, one potential factor is that the docking results of kappa receptor data using Autodock Vina are less favorable compared to others. When examining the Pearson correlation between the binding score and experimental affinity after docking kappa data with Autodock Vina, it showed the lowest value of −0.02. Therefore, even when testing with mu data after training with kappa, the Pearson correlation also increased the least, at 0.03, and the identification of strong binders increased by only 4%. Since all data for each receptor were used for testing, there were significantly more poses used in the testing than in previous experiments. Figure 5 shows a scatter plot representing the docking results for the mu receptor, and it clearly shows that many uncorrelated poses have been filtered out after applying the PECAN2 model trained with delta data. Despite training on a different receptor, this experiment demonstrates a discernible advantage in extending the application to a near neighboring receptor.

3.1.4. Data Limitation Experiment

The previous experiments used relatively large training set sizes (thousands of compounds), while most protein targets are likely to have smaller data sets available. This prompted us to investigate how the ML model’s performance is affected by the training set size, by conducting the same experiment with reduced data quantities. We trained the MOE delta model with 5061 ligands, then 725 ligands, and finally 300 ligands (Table 4), and evaluated performance on the same test set. The training, validation, and testing sets were all split randomly, and we used 726 ligands in the validation set and 740 ligands in the test set. As expected, the model’s performance decreases as the amount of training data decreases; however, even with the smallest training set size, there was a noticeable improvement when using PECAN2. As shown in Table 4, the docking model started with a Pearson correlation of 0.035, which increased after using PECAN2 to 0.352, 0.272, or 0.108 depending on the training set size (5061, 725, or 300, respectively).
As for finding strong binders, the model trained with 5061 ligands found 30 strong binders, the one trained with 725 found 27, and the model trained with 300 found only 24 strong binders, which improved on using only docking, which identified only 20. Figure 6 illustrates how false positive and false negative poses are filtered out based on training set size.

3.1.5. SARS2 Mpro Data

To examine whether our approach extends to different types of proteins, we applied our method to the SARS-CoV-2 main protease (Mpro) target. Mpro has fewer ligands (4271 ligands) and is a different protein class compared to the opioid receptor. Both IC50 and Ki experimental results were utilized. Similar to the opioid receptors, PECAN2 was also effective at improving the docking results for the Mpro data. Table 5 displays the changes in Pearson values with and without PECAN2, as well as the number of strong binders among the top 5% ranked compounds. When utilizing the PECAN2 method instead of relying only on docking results, the Pearson correlation increased, and we identified a greater number of strong binders. When using Autodock Vina, the Pearson value increased from 0.17 to 0.40, while with MOE, it increased from 0.23 to 0.45. The number of compounds with a binding affinity of 7 or higher found in the top 5% was four to six for Autodock Vina and three to five for MOE. Similar to other experiments, using the PECAN2 model allowed us to find more of the strong binders.
This demonstrates that PECAN2 can be applied to different classes of protein targets and improve on multiple docking programs. All scatter plots and histograms are provided in Figure S4 of the Supporting Information.

3.2. Speed Test on PECAN2

Unlike existing models that can be applied universally to different datasets after being trained once, our approach requires new training whenever protein targets and docking programs change. Therefore, the training time is a significant factor to consider. In our previous study [33], we demonstrated that PCN is approximately 30 times faster than a comparable 3D-CNN. We measured the times for both training and testing per pose. While times varied slightly depending on the structures of the ligands and the protein structures, on average, it took 3.03 s per pose for training and 0.005 s per pose for testing. Assuming there are 5000 ligands, and a docking program generates 10 poses for each ligand, the time required to train on 50,000 poses would be calculated as follows: (3.03 × 5K × 10)/3600 = 42 h. If testing is conducted on 500 ligands, the time required would be: (0.005 × 500 × 10) = 25 s. The runtimes were measured using an NVIDIA TITAN Xp GPU. In the case of Autodock Vina docking, assuming the use of five processors and a single node machine, the docking time per ligand took approximately 3.46 s.

4. Discussion

Predicting ligand–protein binding remains a fundamental problem in computational biology. Traditional computational docking approaches have been well studied and have been used in drug discovery for virtual screening for decades, but more accurate methods are required for rapid drug development. As described above, it is challenging to identify high-affinity compounds using existing molecular docking methods. The primary reason is that real physiological systems involve an abundance of variables, and as a result, docking scores do not correlate with experimentally measured binding affinity. Therefore, we believed that by identifying correlated docking poses that vary across different docking programs and proteins and utilizing them for training in our high-throughput screening, we could increase the hit rate of the virtual high-throughput screening. Our proposed method, utilizing a 3D atomic neural network (PCN) to learn the correlations between docking scores and experimental data of each docking method, offers two distinct benefits when compared to other machine learning approaches, especially neural network approaches using 3D atomic representations. First, most of the neural network approaches conducted binding affinity prediction and classification experiments predominantly using the PDBBind dataset. However, this PDBBind dataset is somewhat limited in terms of the variety of protein types, making those approaches challenging for application in all virtual screening scenarios. Our approach is not limited to protein types, so as long as there is the crystal structure of the binding site and sufficient ligand experimental data, it can be applied to any protein type. Second, for many protein receptors, the protein–ligand complex crystal structure data are not available while only experimental binding affinity data are available. In this case, the machine learning methods relying on the complex or ligand crystal structures, such as atomic-level 3D-CNN- or graph neural networks (GNN)-based binding affinity prediction [50], are not applicable. Furthermore, machine learning methods to classify docking poses such as PECAN [33] and the method of Shen et al. [51] cannot be used as they need to train the models on the crystal structure data and the protein types in the PDBBind datasets are limited. On the other hand, our approach is applicable to many cases with the absence of complex crystal structures. In addition to the benefits above, our method uses a light-weight neural network based on PCN, enabling fast training, compared to other neural network types such as 3D-CNN and spatial graph CNN (SG-CNN).
To test our approach in experiments, we utilized the opioid receptor datasets in this study and further extended our experiments to include SARS2 Mpro data. We used two different widely used docking programs, Autodock Vina and MOE. We initially split the training and testing data using two different methods to evaluate the model’s performance. Firstly, we randomly partitioned all data into training, validating, and testing sets. Secondly, we divided the data based on the structures of the ligands to ensure that the training and validation/test sets do not overlap structurally. The model performance (Section 3.1.1) shows that the proposed method can effectively increase the Pearson value and find more strong binders. For the scaffold splitting experiment (Section 3.1.2), while the results were not as favorable, this approach still identified a greater number of strong binders in terms of the Pearson correlation between affinity and docking score. We anticipated that the results of the scaffold experiment would not be as favorable as the random experiment because predicting outcomes becomes more challenging when the structures of ligands are entirely different. Figure 7 is a histogram that compares the number of strong binders when selecting the top 5% based on docking scores in both random splitting and scaffold splitting experiments. It is evident that in both experiments, using PECAN2 resulted in finding a greater number of strong binders, regardless of the specific docking program used. This demonstrates that our method may also work when we apply it to new datasets in the future.
As mentioned in Section 2, due to the high sequence similarity of the mu, kappa, and delta opioid receptors, we tested whether a docking model trained on one protein could be applied to another protein. While the improvement in Pearson value was less significant relative to testing on the same protein after training on a single protein, there was still an overall improvement (Section 3.1.3). We also attempted to apply the model trained on the delta receptor dataset to the SARS2 data. All scatter plots and histograms are provided in Figure S3 of the Supporting Information. As anticipated, this model not only failed to improve the Pearson correlation of the SARS2 data but also resulted in a decline. This was in line with our expectations because the protein structures of the two datasets are very different. This demonstrates the versatility of our approach, indicating its potential applicability across diverse scenarios. For instance, within the same protein family where sequences are similar, if data for one protein are limited, training on data from another protein within the family could be conducted for testing purposes.
Since the initial experiments used larger training set sizes than would be available in many real-world drug discovery projects, we considered models trained on smaller dataset sizes (Section 3.1.4). As expected, the increase in Pearson correlation decreased as the training dataset size reduced from 5061 to 725 and then to 300. However, these results still demonstrate that models trained with smaller datasets were still effective compared to models that were not trained using PECAN2.
The definitions of strong binder and weak binder can vary considerably depending on the characteristics of the drug and its target molecule. However, in our context, we consider a ligand to be a strong binder if its Kd value is below 100 nM (pKd ≥ 7), a medium binder if it falls within the range of 100 nM–10 μM (pKd = 4–7), and a weak binder if the Kd value is above 10 μM (pKd ≤ 4). Based on these criteria, our data contain 52 weak binders in the mu dataset, 85 weak binders in the delta dataset, and 18 weak binders in the kappa dataset. In our experiment described above, we excluded outliers and normalized the data for training, so we did not include ligands that were completely non-binders. However, considering the presence of non-binders in real data, we conducted an experiment to see how many non-binders PECAN2 could filter out by adding data for non-binders, which are ligands with no activation at all. We supplemented the original 712 delta test data with an additional 387 non-binders and ran PECAN2. Analyzing the top 5% docking score ligands from a total of 1099 ligands, we identified 24 strong binders without using PECAN2 and 36 strong binders when PECAN2 was employed. Additionally, out of the 387 non-binders, approximately 40%, or 154 non-binders, were filtered out. The utilization of PECAN2 in filtering out non-binders aided in the identification of strong binders.
Our experiments also considered the sensitivity of performance to the choice of docking program. For instance, using delta data with the two different docking programs, while binding affinity remains constant for each ligand, docking scores varied with the two docking programs. As a result, even for the same pose, it could be labeled differently as a correlated pose or an uncorrelated pose depending on the docking program. Overall, applying the PECAN2 model to the results of docking with MOE showed a greater improvement in Pearson correlation compared to applying PECAN2 to the results of docking with Autodock Vina. However, this may be attributed to the fact that, in general, the Pearson correlation of MOE docking without PECAN2 was lower than that of Autodock Vina docking. Various docking programs yield different results because they utilize distinct search algorithms and scoring functions to predict the binding poses and affinities between ligands and target proteins. Nevertheless, in our experiments, both tested programs showed improved screening results when the PECAN2 model was employed, which implies that this approach should apply to other docking programs.
Nonetheless, our proposed methodology has its limitations as it relies on the poses generated by existing docking programs. For instance, a major drawback of molecular docking, in which the docking scores are always highly correlated with molecular weight, cannot be addressed by our method. This is because our proposed methodology does not involve creating new docking poses or generating new docking scores. Instead of attempting to alter these tendencies, our approach focuses on leveraging them to enhance the identification of strong binders. By filtering out poses generated by the original docking program, we aim to optimize the selection process and improve the accuracy of identifying potential candidates.

5. Conclusions

We developed and tested PECAN2, a novel ML model that uses a 3DPCN to enhance the performance of molecular docking-based screening tools such as Autodock Vina and MOE. We applied our pose classifier to two different types of experimental datasets, opioid receptors, a type of G protein-coupled receptor (GPCR) which is not well-studied in the machine learning-based drug development community, and SARS2, which has garnered significant research attention worldwide due to its global impact on public health. By integrating our PCN pose classification into docking screening, we significantly improved the identification of compounds with activity against these targets. We introduced a novel labeling method that allows the use of PCN for classification without relying on crystal structures of ligands. This approach has the advantage of not being limited to protein structures and not requiring the PDBbind data often used in machine learning experiments. We also highlighted its applicability in cases where experimental data related to ligands, such as ion channels or GPCRs, are abundant but crystal structures are insufficient for machine learning training. More importantly, our study illustrated how pose classification enhances the overall screening process in docking. Our new approach filtered out false positive poses and weak-binding compounds, resulting in the enrichment of true positives among the top-scoring compounds, thus ensuring improved outcomes in the virtual screening process for docking.

Supplementary Materials

The following supporting information can be downloaded at: https://www.mdpi.com/article/10.3390/make6010030/s1, Figure S1: Random split—Scatter plot between docking scores and experimental ligand affinities for all docking poses and a histogram indicating the count of strong binders; Figure S2: Scaffold split—Scatter plot between docking scores and experimental ligand affinities for all docking poses and a histogram indicating the count of strong binders; Figure S3: Scatter plot between MOE docking scores and experimental ligand affinities for all docking poses of SARS2 Mpro data and a histogram indicating the count of strong binders (training PECAN2 with the delta opioid receptor docking data); Figure S4: Scatter plot between docking scores and experimental ligand affinities for all docking poses of SARS2 Mpro data and a histogram indicating the count of strong binders.

Author Contributions

Conceptualization, H.S., J.E.A. and W.F.D.B.; methodology, H.S.; software, H.S.; data curation, H.S.; writing—original draft preparation, H.S.; writing—review and editing, H.S., J.E.A. and W.F.D.B.; supervision, J.E.A. and W.F.D.B.; project administration, W.F.D.B.; funding acquisition, W.F.D.B. All authors have read and agreed to the published version of the manuscript.

Funding

J.E.A. was funded in part by the Defense Threat Reduction Agency (DTRA) under Award HDTRA1036045. Additionally, H.S. and W.F.D.B. were funded in part by the Joint Science and Technology Office (JSTO) under Award CB100035. Computing support for this work came from the Lawrence Livermore National Laboratory (LLNL) Institutional Computing Grand Challenge program. This work is performed under the auspices of the U.S. Department of Energy by the Lawrence Livermore National Laboratory under Contract DE-AC52-07NA27344, release number LLNL-JRNL-858354.

Data Availability Statement

The implementation of the PCN models is freely available as open source (MIT license) on the author’s GitHub: https://github.com/llnl/PECAN2 (accessed on 19 December 2023).

Conflicts of Interest

The authors declare no conflicts of interest.

References

  1. Lyu, J.; Irwin, J.J.; Shoichet, B.K. Modeling the expansion of virtual screening libraries. Nat. Chem. Biol. 2023, 19, 712–718. [Google Scholar] [CrossRef]
  2. Jones, G.; Willett, P.; Glen, R.C.; Leach, A.R.; Taylor, R. Development and validation of a genetic algorithm for flexible docking. J. Mol. Biol. 1997, 267, 727–748. [Google Scholar] [CrossRef]
  3. Ewing, T.J.A.; Makino, S.; Skillman, A.G.; Kuntz, I.D. DOCK 4.0: Search strategies for automated molecular docking of flexible molecule databases. J. Comput. Aided Mol. Des. 2001, 15, 411–428. [Google Scholar] [CrossRef] [PubMed]
  4. Muegge, I. PMF scoring revisited. J. Med. Chem. 2006, 49, 5895–5902. [Google Scholar] [CrossRef] [PubMed]
  5. Velec, H.F.; Gohlke, H.; Klebe, G. DrugScore(CSD)-knowledge-based scoring function derived from small molecule crystal data with superior recognition rate of near-native ligand poses and better affinity prediction. J. Med. Chem. 2005, 48, 6296–6303. [Google Scholar] [CrossRef] [PubMed]
  6. Jin, Z.; Wu, T.; Chen, T.; Pan, D.; Wang, X.; Xie, J.; Quan, L.; Lyu, Q. CAPLA: Improved prediction of protein-ligand binding affinity by a deep learning approach based on a cross-attention mechanism. Bioinformatics 2023, 39, btad049. [Google Scholar] [CrossRef] [PubMed]
  7. Beveridge, D.L.; DiCapua, F.M. Free energy via molecular simulation: Applications to chemical and biomolecular systems. Annu. Rev. Biophys. Biophys. Chem. 1989, 18, 431–492. [Google Scholar] [CrossRef]
  8. Kollman, P. Free energy calculations: Applications to chemical and biochemical phenomena. Chem. Rev. 1993, 93, 2395–2417. [Google Scholar] [CrossRef]
  9. Huang, S.Y.; Zou, X. An iterative knowledge-based scoring function to predict protein-ligand interactions: I. Derivation of interaction potentials. J. Comput. Chem. 2006, 27, 1866–1875. [Google Scholar] [CrossRef]
  10. Eldridge, M.D.; Murray, C.W.; Auton, T.R.; Paolini, G.V.; Mee, R.P. Empirical scoring functions: I. The development of a fast empirical scoring function to estimate the binding affinity of ligands in receptor complexes. J. Comput. Aided Mol. Des. 1997, 11, 425–445. [Google Scholar] [CrossRef]
  11. Wang, R.; Lai, L.; Wang, S. Further development and validation of empirical scoring functions for structure-based binding affinity prediction. J. Comput. Aided Mol. Des. 2002, 16, 11–26. [Google Scholar] [CrossRef]
  12. Cortes, C.; Vapnik, V. Support-vector networks. Mach. Learn. 1995, 20, 273–297. [Google Scholar] [CrossRef]
  13. Breiman, L. Random Forests. Mach. Learn. 2001, 45, 5–32. [Google Scholar] [CrossRef]
  14. Mason, L.; Baxter, J.; Bartlett, P.; Frean, M. Boosting Algorithms as Gradient Descent in Function Space; NIPS: New Orleans, LA, USA, 1999. [Google Scholar]
  15. Friedman, J.H. Stochastic gradient boosting. Comput. Stat. Data Anal. 2002, 38, 367–378. [Google Scholar] [CrossRef]
  16. Krizhevsky, A.; Sutskever, I.; Hinton, G.E. ImageNet classification with deep convolutional neural networks. Commun. ACM 2017, 60, 84–90. [Google Scholar] [CrossRef]
  17. Wallach, I.; Dzamba, M.; Heifets, A. AtomNet: A Deep Convolutional Neural Network for Bioactivity Prediction in Structure-based Drug Discovery. arXiv 2015, arXiv:1510.02855. [Google Scholar]
  18. Stepniewska-Dziubinska, M.M.; Zielenkiewicz, P.; Siedlecki, P. Development and evaluation of a deep learning model for protein–ligand binding affinity prediction. Bioinformatics 2018, 34, 3666–3674. [Google Scholar] [CrossRef]
  19. Li, Y.; Rezaei, M.A.; Li, C.; Li, X.; Wu, D. DeepAtom: A Framework for Protein-Ligand Binding Affinity Prediction. arXiv 2019, arXiv:1912.00318. [Google Scholar]
  20. Zheng, L.; Fan, J.; Mu, Y. OnionNet: A Multiple-Layer Intermolecular-Contact-Based Convolutional Neural Network for Protein–Ligand Binding Affinity Prediction. ACS Omega 2019, 4, 15956–15965. [Google Scholar] [CrossRef]
  21. Wang, Z.; Zheng, L.; Liu, Y.; Qu, Y.; Li, Y.-Q.; Zhao, M.; Mu , Y.; Li , W. OnionNet-2: A Convolutional Neural Network Model for Predicting Protein-Ligand Binding Affinity Based on Residue-Atom Contacting Shells. Front. Chem. 2021, 9, 753002. [Google Scholar] [CrossRef]
  22. Hassan-Harrirou, H.; Zhang, C.; Lemmin, T. RosENet: Improving Binding Affinity Prediction by Leveraging Molecular Mechanics Energies with an Ensemble of 3D Convolutional Neural Networks. J. Chem. Inf. Model. 2020, 60, 2791–2802. [Google Scholar] [CrossRef] [PubMed]
  23. Jones, D.; Kim, H.; Zhang, X.; Zemla, A.; Stevenson, G.; Bennett, W.F.D.; Kirshner, D.; Wong, S.E.; Lightstone, F.C.; Allen, J.E. Improved Protein-Ligand Binding Affinity Prediction with Structure-Based Deep Fusion Inference. J. Chem. Inf. Model. 2021, 61, 1583–1592. [Google Scholar] [CrossRef] [PubMed]
  24. Atz, K.; Grisoni, F.; Schneider, G. Geometric Deep Learning on Molecular Representations. arXiv 2021, arXiv:2107.12375. [Google Scholar] [CrossRef]
  25. Bronstein, M.M.; Bruna, J.; Cohen, T.; Veličković, P. Geometric Deep Learning: Grids, Groups, Graphs, Geodesics, and Gauges. arXiv 2021, arXiv:2104.13478. [Google Scholar]
  26. Corso, G.; Stärk, H.; Jing, B.; Barzilay, R.; Jaakkola, T. DiffDock: Diffusion Steps, Twists, and Turns for Molecular Docking. arXiv 2022, arXiv:2210.01776. [Google Scholar]
  27. Urbina, F.; Lowden, C.T.; Culberson, J.C.; Ekins, S. MegaSyn: Integrating Generative Molecular Design, Automated Analog Designer, and Synthetic Viability Prediction. ACS Omega 2022, 7, 18699–18713. [Google Scholar] [CrossRef] [PubMed]
  28. Buttenschoen, M.; Morris, G.M.; Deane, C.M. PoseBusters: AI-based docking methods fail to generate physically valid poses or generalise to novel sequences. arXiv 2023, arXiv:2308.05777. [Google Scholar] [CrossRef]
  29. Wang, R.; Fang, X.; Lu, Y.; Wang, S. The PDBbind database: Collection of binding affinities for protein-ligand complexes with known three-dimensional structures. J. Med. Chem. 2004, 47, 2977–2980. [Google Scholar] [CrossRef]
  30. Stauch, B.; Cherezov, V. Serial Femtosecond Crystallography of G Protein-Coupled Receptors. Annu. Rev. Biophys. 2018, 47, 377–397. [Google Scholar] [CrossRef]
  31. Yang, J.; Shen, C.; Huang, N. Predicting or Pretending: Artificial Intelligence for Protein-Ligand Interactions Lack of Sufficiently Large and Unbiased Datasets. Front. Pharmacol. 2020, 11, 69. [Google Scholar] [CrossRef]
  32. Li, J.; Guan, X.; Zhang, O.; Sun, K.; Wang, Y.; Bagni, D.; Head-Gordon, T. Leak Proof PDBBind: A Reorganized Dataset of Protein-Ligand Complexes for More Generalizable Binding Affinity Prediction. arXiv 2023, arXiv:2308.09639v1. [Google Scholar]
  33. Shim, H.; Kim, H.; Allen, J.E.; Wulff, H. Pose Classification Using Three-Dimensional Atomic Structure-Based Neural Networks Applied to Ion Channel-Ligand Docking. J. Chem. Inf. Model. 2022, 62, 2301–2315. [Google Scholar] [CrossRef] [PubMed]
  34. Liu, T.; Lin, Y.; Wen, X.; Jorissen, R.N.; Gilson, M.K. BindingDB: A web-accessible database of experimentally determined protein-ligand binding affinities. Nucleic Acids Res. 2007, 35, D198–D201. [Google Scholar] [CrossRef]
  35. Sheils, T.K.; Mathias, S.L.; Kelleher, K.J.; Siramshetty, V.B.; Nguyen, D.T.; Bologa, C.G.; Jensen, L.J.; Vidovic, D.; Koleti, A.; Schurer, S.C.; et al. TCRD and Pharos 2021: Mining the human proteome for disease biology. Nucleic Acids Res. 2021, 49, D1334–D1346. [Google Scholar] [CrossRef] [PubMed]
  36. Manglik, A.; Kruse, A.C.; Kobilka, T.S.; Thian, F.S.; Mathiesen, J.M.; Sunahara, R.K.; Pardo, L.; Weis, W.I.; Kobilka, B.K.; Granier, S. Crystal structure of the micro-opioid receptor bound to a morphinan antagonist. Nature 2012, 485, 321–326. [Google Scholar] [CrossRef] [PubMed]
  37. Wu, H.; Wacker, D.; Mileni, M.; Katritch, V.; Han, G.W.; Vardy, E.; Liu, W.; Thompson, A.A.; Huang, X.P.; Carroll, F.I.; et al. Structure of the human kappa-opioid receptor in complex with JDTic. Nature 2012, 485, 327–332. [Google Scholar] [CrossRef] [PubMed]
  38. Fenalti, G.; Zatsepin, N.A.; Betti, C.; Giguere, P.; Han, G.W.; Ishchenko, A.; Liu, W.; Guillemyn, K.; Zhang, H.; James, D.; et al. Structural basis for bifunctional peptide recognition at human delta-opioid receptor. Nat. Struct. Mol. Biol. 2015, 22, 265–268. [Google Scholar] [CrossRef]
  39. Dreborg, S.; Sundstrom, G.; Larsson, T.A.; Larhammar, D. Evolution of vertebrate opioid receptors. Proc. Natl. Acad. Sci. USA 2008, 105, 15487–15492. [Google Scholar] [CrossRef]
  40. Jin, Z.; Du, X.; Xu, Y.; Deng, Y.; Liu, M.; Zhao, Y.; Zhang, B.; Li, X.; Zhang, L.; Peng, C.; et al. Structure of M(pro) from SARS-CoV-2 and discovery of its inhibitors. Nature 2020, 582, 289–293. [Google Scholar] [CrossRef]
  41. Global Online Structure Activity Relationship Database (GOSTAR), Excelra. Available online: https://www.gostardb.com/gostar/newui/applications.jsp (accessed on 28 September 2023).
  42. Morris, A.; McCorkindale, W.; Consortium, T.C.M.; Drayman, N.; Chodera, J.D.; Tay, S.; London, N.; Lee, A.A. Discovery of SARS-CoV-2 main protease inhibitors using a synthesis-directed de novo design model. Chem. Commun. 2021, 57, 5909–5912. [Google Scholar] [CrossRef]
  43. Molecular Operating Environment (MOE); Chemical Computing Group: Montreal, QC, Canada, 2023.
  44. Eberhardt, J.; Santos-Martins, D.; Tillack, A.F.; Forli, S. AutoDock Vina 1.2.0: New Docking Methods, Expanded Force Field, and Python Bindings. J. Chem. Inf. Model. 2021, 61, 3891–3898. [Google Scholar] [CrossRef] [PubMed]
  45. Zhang, X.; Wong, S.E.; Lightstone, F.C. Toward fully automated high performance computing drug discovery: A massively parallel virtual screening pipeline for docking and molecular mechanics/generalized Born surface area rescoring to improve enrichment. J. Chem. Inf. Model. 2014, 54, 324–337. [Google Scholar] [CrossRef] [PubMed]
  46. Wojcikowski, M.; Zielenkiewicz, P.; Siedlecki, P. Open Drug Discovery Toolkit (ODDT): A new open-source player in the drug discovery field. J. Cheminform. 2015, 7, 26. [Google Scholar] [CrossRef] [PubMed]
  47. Qi, C.R.; Su, H.; Mo, K.; Guibas, L.J. PointNet: Deep Learning on Point Sets for 3D Classification and Segmentation. arXiv 2016, arXiv:1612.00593. [Google Scholar]
  48. Minnich, A.J.; McLoughlin, K.; Tse, M.; Deng, J.; Weber, A.; Murad, N.; Madej, B.D.; Ramsundar, B.; Rush, T.; Calad-Thomson, S.; et al. AMPL: A Data-Driven Modeling Pipeline for Drug Discovery. J. Chem. Inf. Model. 2020, 60, 1955–1968. [Google Scholar] [CrossRef]
  49. Bemis, G.W.; Murcko, M.A. The properties of known drugs. 1. Molecular frameworks. J. Med. Chem. 1996, 39, 2887–2893. [Google Scholar] [CrossRef] [PubMed]
  50. Zhang, S.; Jin, Y.; Liu, T.; Wang, Q.; Zhang, Z.; Zhao, S.; Shan, B. SS-GNN: A Simple-Structured Graph Neural Network for Affinity Prediction. ACS Omega 2023, 8, 22496–22507. [Google Scholar] [CrossRef] [PubMed]
  51. Shen, C.; Hu, X.; Gao, J.; Zhang, X.; Zhong, H.; Wang, Z.; Xu, L.; Kang, Y.; Cao, D.; Hou, T. The impact of cross-docked poses on performance of machine learning classifier for protein-ligand binding pose prediction. J. Cheminform. 2021, 13, 81. [Google Scholar] [CrossRef]
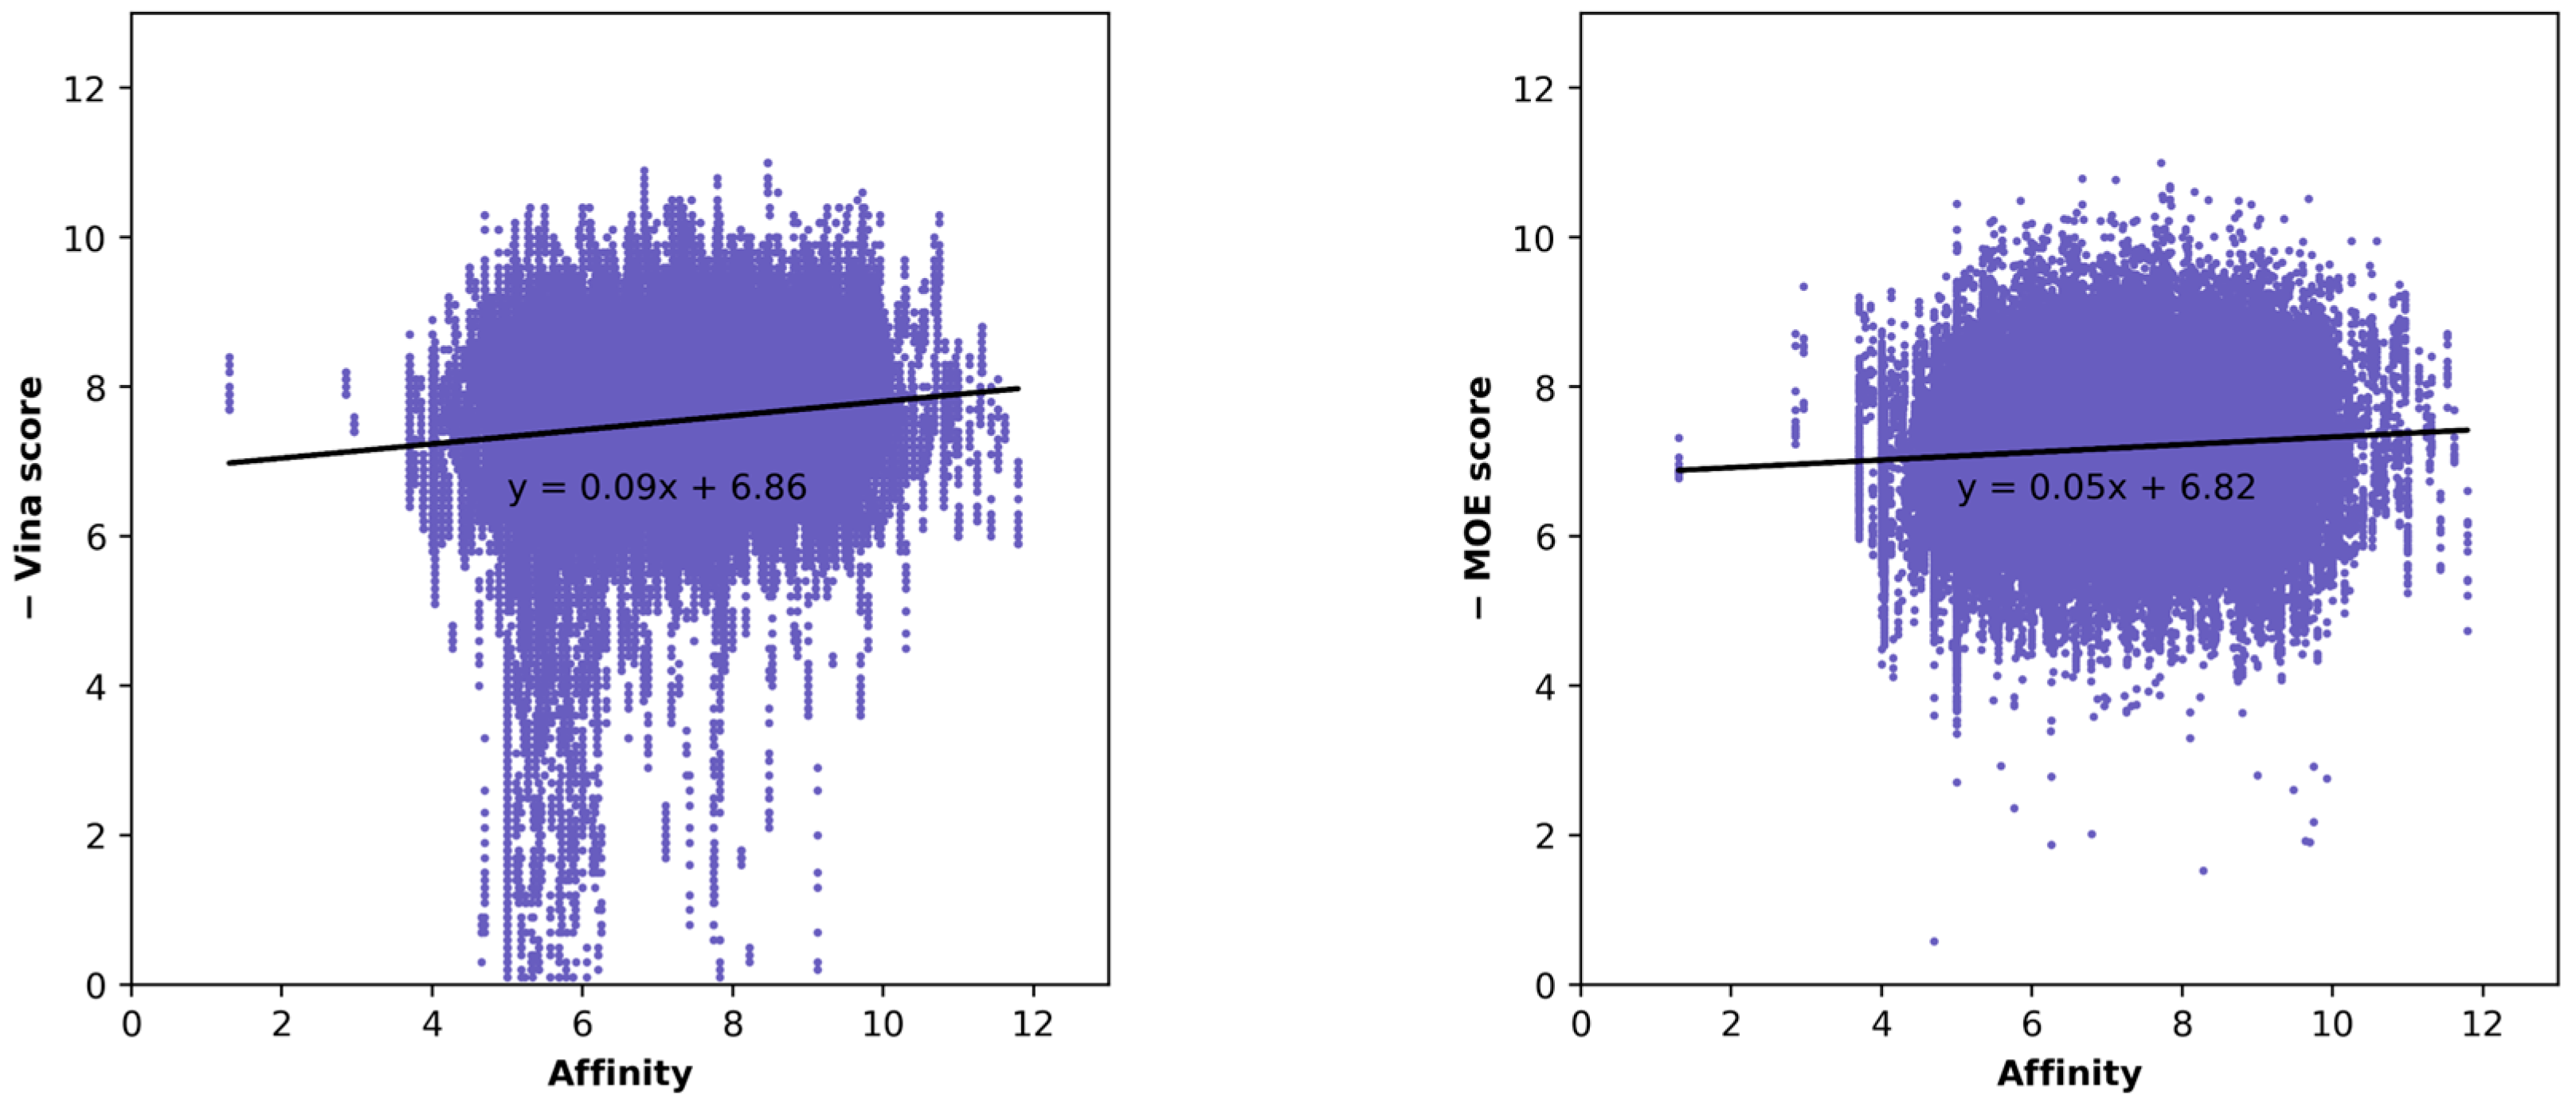
Figure 1. Correlation scatter plot showing the relationship between docking scores and experimental ligand affinities for all docking poses of the mu opioid receptor dataset from Autodock Vina and MOE.
Make 06 00030 g001
Figure 2. Comparison of mu, delta, and kappa opioid receptor sequences.
Make 06 00030 g002
Figure 3. Labeling process of mu opioid receptor. (a) A scatter plot depicting the relationship between docking scores and affinity. (b) Scatter plot after removing outliers. (c) Scatter plot after normalization. (d) Scatter plot with the guideline—yellow represents poses where binding affinity and docking score are correlated, while blue represents poses where binding affinity and docking score are uncorrelated.
Make 06 00030 g003
Figure 4. Two scatter plots depict the docking poses of delta opioid receptor ligands (MOE). The scatter plot on the left illustrates the correlation without the utilization of the PECAN2 model, while the scatter plot on the right showcases the correlation after the removal of uncorrelated poses predicted by the PECAN2 model.
Make 06 00030 g004
Figure 5. Two scatter plots depict the docking poses of mu opioid receptor ligands using the MOE program. The scatter plot on the left illustrates the correlation without the utilization of the PECAN2 model, while the scatter plot on the right demonstrates the correlation after the removal of incorrectly predicted poses, achieved by training the PECAN2 model on the delta dataset and then testing it on the entire set of mu opioid receptor docking poses.
Make 06 00030 g005
Figure 6. Pearson correlations between docking scores and binding affinities with a reduced number of training data points. (a) Scatter plot using only the MOE docking program. (b) Scatter plot after applying the PECAN2 model trained with 5061 ligands. (c) Scatter plot after applying the PECAN2 model trained with 725 ligands. (d) Scatter plot after applying the PECAN2 model trained with 300 ligands.
Make 06 00030 g006
Figure 7. Comparison of results between randomly splitting the training and test sets and splitting based on scaffold.
Make 06 00030 g007
Table 1. In the random split experiment, the Pearson values before and after filtering out uncorrelated poses using PECAN2, along with the number of strong binders found in the top 5% ranked compounds.
Docking
Program
Name of Opioid Receptor
(Number of Testing Ligands)
Pearson Values
(+Difference)
Number of Strong Binders/Number of the Top 5% Ranked Compounds
(+Difference)
Without PECAN2With PECAN2Without PECAN2With PECAN2
Autodock
Vina
Mu (906)0.1480.393 (+0.245)34/46, 74%42/46, 91% (+17%)
Kappa (729)−0.0480.168 (+0.216)17/37, 45%28/37, 75% (+30%)
Delta (712)0.1650.416 (+0.251)17/36, 47%29/36, 80% (+33%)
MOEMu (927)0.1080.436 (+0.328)28/47, 59%38/47, 80% (+21%)
Kappa (740)0.0350.352 (+0.317)20/37, 54%30/37, 81% (+27%)
Delta (717)0.0940.448 (+0.354)22/36, 61%29/36, 80% (+19%)
Table 2. In the scaffold split experiment, the Pearson values before and after filtering out uncorrelated poses using PECAN2, along with the number of strong binders found in the top 5% ranked compounds.
Docking
Program
Name of Opioid Receptor
(Number of Testing Ligands)
Pearson Values
(+Difference)
Number of Strong Binders/Number of the Top 5% Ranked Compounds
(+Difference)
Without PECAN2With PECAN2Without PECAN2With PECAN2
Autodock
Vina
Mu (821)0.170.39 (+0.22)31/42, 73%36/42, 86% (+13%)
Kappa (653)−0.1150.035 (+0.15)17/33, 52%18/33, 55% (+3%)
Delta (585)0.240.49 (+0.25)15 /30, 50%20/30, 67% (+17%)
MOEMu (839)0.040.4 (+0.36)29/42, 69%32/42, 76% (+7%)
Kappa (665)0.0190.27 (+0.25)18/34, 53%19/34, 56% (+3%)
Delta (592)0.210.42 (+0.21)15/30, 50%21/30, 70% (+20%)
Table 3. In the cross-testing experiment, the Pearson values before and after filtering out uncorrelated poses using PECAN2, along with the number of strong binders found in the top 5% ranked compounds.
Docking
Program
Training DataTesting
(Number of Testing Ligands)
Pearson Values
(+Difference)
Number of Strong Binders/Number of the Top 5% Ranked Ligands
(+Difference)
Without PECAN2With PECAN2Without PECAN2With PECAN2
Autodock
Vina
MuDelta
(7120)
0.1970.247 (+0.05)197/356, 55%223/356
63% (+8%)
Kappa
(7294)
−0.020.113 (+0.133)192/365, 53%229/365
63% (+10%)
KappaMu
(9069)
0.140.17 (+0.03)305/454, 67%323/454
71% (+4%)
Delta
(7120)
0.1970.21 (+0.013)197/356, 55%194/356
54% (−1%)
Delta Mu
(9069)
0.140.22 (+0.08)305/454, 67%357/454
79% (+12%)
Kappa
(7294)
−0.020.073 (+0.093)192/365, 53%223/365
61% (+8%)
MOE MuDelta
(7178)
0.0930.18 (+0.087)184/359, 51%194/359
54% (+3%)
Kappa
(7407)
0.0150.23 (+0.215)179/371, 48%223/371
60% (+12%)
KappaMu
(9270)
0.0830.213 (+0.13)289/464, 62%326/464
70% (+8%)
Delta
(7178)
0.0930.24 (+0.147)184/359, 51%195 /359
54% (+3%)
DeltaMu
(9270)
0.0830.292 (+0.209)289/464, 62%342/464
74% (+12%)
Kappa
(7407)
0.0150.18 (+0.165)179/371, 48%208/371
56% (+8%)
Table 4. Effect of dataset size for kappa using the MOE program. Pearson values and the number of strong binders before and after filtering out the incorrect poses.
Docking
Program
Number of Training CompoundsPearson Values
(+Difference)
Number of Strong Binders/Number of the Top 5% Ranked Ligands
(+Difference)
Without PECAN2With PECAN2Without PECAN2With PECAN2
MOE5061 0.0350.352 (+0.317)20/37, 54%30/37, 81% (+27%)
7250.272 (+0.237)27/37, 73% (+19%)
3000.108 (+0.073)24/37, 65% (+9%)
Table 5. In the SARS2 Mpro experiment, the Pearson values before and after filtering out uncorrelated poses using PECAN2, along with the number of strong binders found in the top 5% ranked compounds.
Docking
Program
Pearson Values
(+Difference)
Number of Strong Binders/Number of the Top 5% Ranked Ligands
(+Difference)
Without PECAN2With PECAN2Without PECAN2With PECAN2
Autodock Vina0.170.40 (+0.23)4/21, 19%6/21, 29% (+10%)
MOE0.230.45(+0.22)3/22, 14%5/22, 23% (+9%)
Disclaimer/Publisher’s Note: The statements, opinions and data contained in all publications are solely those of the individual author(s) and contributor(s) and not of MDPI and/or the editor(s). MDPI and/or the editor(s) disclaim responsibility for any injury to people or property resulting from any ideas, methods, instructions or products referred to in the content.