Article

Unraveling COVID-19 Dynamics via Machine Learning and XAI: Investigating Variant Influence and Prognostic Classification

1
Department of Cybernetics and Artificial Intelligence, Faculty of Electrical Engineering and Informatics, Technical University of Kosice, Letna 9, 040 01 Košice, Slovakia
2
Department of Infectology and Travel Medicine, Faculty of Medicine, L. Pasteur University Hospital, Pavol Jozef Šafárik University, 041 90 Košice, Slovakia
*
Author to whom correspondence should be addressed.
Mach. Learn. Knowl. Extr. 2023, 5(4), 1266-1281; https://doi.org/10.3390/make5040064
Submission received: 28 July 2023 / Revised: 5 September 2023 / Accepted: 21 September 2023 / Published: 25 September 2023

Abstract

:
Machine learning (ML) has been used in different ways in the fight against COVID-19 disease. ML models have been developed, e.g., for diagnostic or prognostic purposes and using various modalities of data (e.g., textual, visual, or structured). Due to the many specific aspects of this disease and its evolution over time, there is still not enough understanding of all relevant factors influencing the course of COVID-19 in particular patients. In all aspects of our work, there was a strong involvement of a medical expert following the human-in-the-loop principle. This is a very important but usually neglected part of the ML and knowledge extraction (KE) process. Our research shows that explainable artificial intelligence (XAI) may significantly support this part of ML and KE. Our research focused on using ML for knowledge extraction in two specific scenarios. In the first scenario, we aimed to discover whether adding information about the predominant COVID-19 variant impacts the performance of the ML models. In the second scenario, we focused on prognostic classification models concerning the need for an intensive care unit for a given patient in connection with different explainability AI (XAI) methods. We have used nine ML algorithms, namely XGBoost, CatBoost, LightGBM, logistic regression, Naive Bayes, random forest, SGD, SVM-linear, and SVM-RBF. We measured the performance of the resulting models using precision, accuracy, and AUC metrics. Subsequently, we focused on knowledge extraction from the best-performing models using two different approaches as follows: (a) features extracted automatically by forward stepwise selection (FSS); (b) attributes and their interactions discovered by model explainability methods. Both were compared with the attributes selected by the medical experts in advance based on the domain expertise. Our experiments showed that adding information about the COVID-19 variant did not influence the performance of the resulting ML models. It also turned out that medical experts were much more precise in the identification of significant attributes than FSS. Explainability methods identified almost the same attributes as a medical expert and interesting interactions among them, which the expert discussed from a medical point of view. The results of our research and their consequences are discussed.

1. Introduction

COVID-19, also known as the coronavirus disease, has become a dominant topic of global debate and has led to restrictions on free movement, schools, and business closures, significantly affecting the daily lives of millions of people. Despite the relatively long time since the outbreak of the pandemic, the topic is still important in many research fields, including medicine, epidemiology, economics, psychology, and sociology. COVID-19 has proven to be a serious health problem affecting millions of people worldwide, becoming one of the most significant health threats of our time. As it turns out, some people are more susceptible to coronavirus infection than others and have a higher risk of a severe course of the disease. It also appears that some people were more affected by the different variants of COVID-19, whereas others had the exact opposite experience. There are also comorbidities and other factors that may influence the course of the disease but are not traditionally looked at in the first place. For this reason, in this work, we decided to analyze the risk factors that influence the progression of this disease using machine learning tools, as well as study the information about the current prevailing COVID-19 variant, to find out if it influences the resulting ML models. In all aspects of our work, there was a strong involvement of medical experts, which is, in our opinion, a very important aspect of the ML and knowledge extraction process that is usually neglected in similar research papers.
We first focused on analyzing the current state of the art in Section 2, where we analyzed the machine learning models used in open-access studies and compared their performance. We also examined the risk factors identified in existing studies, where we summarized the factors that most influenced the course of the disease. In Section 3, we focused on the methodology and experiments on the open data of patients with COVID-19 disease using the CRISP-DM methodology. First, we examined the impact of adding information about the predominant COVID-19 variant on the performance of each model. Secondly, we took a look at classification models that aim to predict whether a patient has a predisposition to be admitted to the Intensive Care Unit (ICU) or not. The focus here was on knowledge extraction related to the main factors influencing the prognosis of the COVID-19 disease. We also used two ML explainability methods—SHAP and LIME—to analyze local and global interactions among the most important attributes identified by their means. We then evaluated all the models and summarized their results. In the last section, we summarized the main findings, answered the stated Research Questions (RQ), discussed their implications, and sketched our future work.
The main contributions of this study are experimental evidence that information about the COVID-19 variant did not influence the performance of the resulting ML models if provided on the level of prevalent virus type in a given region. We also showed that the role of medical experts is inevitable in the process of important attribute identification and further analysis of their importance in accordance with the human-in-the-loop principle. Finally, explainability methods identified almost the same attributes as medical experts and interesting interactions among them, which, in connection with human expertise, provide interesting insights.

2. Related Work

Coronavirus disease 2019 (COVID-19) is a highly contagious viral disease caused by the SARS-CoV-2 (severe acute respiratory syndrome—coronavirus 2) virus. The severity of the course depends not only on the characteristics of the virus but also on the host itself. Identifying the factors of a severe course of the disease is still very important [1], mainly because it enables the priority allocation of resources for high-risk patients to minimize deaths.
Various statistical approaches are used, as well as ML methods, to identify the risk factors. The most frequently used ML algorithms and their performance are analyzed in Section 2.1. Besides the use of ML models for predictive purposes, they are also used for knowledge extraction in order to identify the main factors influencing the course of COVID-19. We analyze related work from the knowledge extraction perspective in Section 2.2.

2.1. Related Work on Machine Learning Algorithms

The most frequently used machine learning algorithms were logistic regression models, random forest models, and decision trees [2]. Also, frequently used models include the Cox proportional hazards regression model [3] and various gradient boosting models [4]. These predictive models are used to classify patients according to the expected severity of the course of the disease or survival and also to identify key risk factors.
Interesting analyses have been made by Kenneth Chi-Yin Wong et al. [5], who focused on detecting clinical risk factors influencing the course of COVID-19 and using them to predict severe cases. They created four different types of analyses, which they predicted using the XGBoost prediction model. The target groups of these analyses were hospitalizations/fatal cases—outpatient cases; fatal cases—outpatient cases; hospitalizations/fatal cases—a population with no known infection; and fatal cases—a population with no known infection. The AUC ROC values, i.e., recall, sensitivity, specificity, and accuracy, were used to evaluate the quality of each model. The AUC values ranged from 69.6% to 82.5%, recall ranged from 0.5% to 74.8%, sensitivity ranged from 55.7% to 83%, and specificity ranged from 66.6% to 71.9%. The accuracy was similar in the three analyses, ranging from 66.5% to 68.6%. The most accurate analysis, with 72% accuracy, predicted the target group of fatal cases vs. outpatient cases.
Machine learning algorithms have been used by Krajah et al. in [6] to predict the target class of “death”, i.e., to predict the death or survival of a patient depending on the patient’s health status and other predictors. They conducted this experiment using data originating from Mexico provided by the General Directorate of Epidemics. In this case, the researchers used a partially preprocessed dataset available on Kaggle [7]. Krajah et al. used classification algorithms such as Logistic Regression, Linear Discriminant Analysis (LDA), Classification and Regression Trees (CART), Support Vector Machines (SVM), Naive Bayes (NB), and k-Nearest Neighbors (k-NN). These models were trained with 11 predictors, which included attributes such as “intubated”, “icu” “pneumonia”, etc. In the final stage of this work, they included logistic regression and SVM models. After finalizing the models, they achieved an average accuracy of 84% for the logistic regression algorithm and an average accuracy of 85% for the SVM algorithm. In comparison, the overall success rates of these models were 83% and 82% for the logistic regression and SVM algorithms, respectively.
Using machine learning, Holy and Rosa [8] predicted the target class “icu”, which represents the placement or non-placement of a patient in the Intensive Care Unit using the same data as in the study [6]. Three SVM algorithms were used: the linear kernel, polynomial kernel, and RBF kernel. These models were trained using three- and five-fold cross-validation with different numbers of predictors. The most successful models in this study achieved the following accuracies: linear SVM—77.16%, polynomial SVM—80.44%, and RBF SVM—81.27%. These accuracies were acquired using the models with five-fold cross-validation using 16 predictors.
Holy and Rosa [8] used “accuracy” as the metric of model performance, with the best model achieving an accuracy of 81.27%. However, presenting only the accuracy can be misleading, as other metrics like AUC value, precision of each class, or their recall are not mentioned. In this case, it is particularly important because of highly imbalanced data.
The imbalance of classes in the dataset [7] (with only 11% of the records in the positive class) can affect the model’s performance, even after balancing the classes. The AUC metric reflects this, likely showing a value of around 0.5, indicating that the model has no class separability. In this situation, we cannot consider the relevant results, as the model may classify almost all cases into the majority class (0), indicating patients who did not require ICU care. The main findings of the related analysis focused on ML algorithms used in the context of our research are summarized in Table 1.

2.2. Related Work on Identified COVID-19 Risk Factors

Older age and some comorbidities such as chronic kidney disease, lung disease, heart disease, and diabetes are well-known predictors of worse prognosis in patients with COVID-19 disease [9,10]. Multimorbidities have been shown to play an important role in general [11]. In addition to the mentioned chronic diseases, some other parameters include obesity, diarrhea, or male gender. Laboratory indicators include hypoxemia, high values of C-reactive protein (CRP), interleukin 6 (IL-6), ferritin, D-dimer, and LDH [12,13]. However, the results of individual studies differ for some indicators.
A retrospective cohort study [14] in Wuhan, China, examined the clinical course and risk factors for mortality in patients hospitalized at the local Jinyintan Hospital and Wuhan Lung Hospital. In this study, the researchers included all patients hospitalized in the aforementioned hospitals and older than 18 years of age. They used demographic, laboratory, clinical, and treatment data to detect the risk factors. They used univariate and multivariate logistic regression to identify the risk factors. Univariate logistic regression identified diabetes and coronary heart disease as factors leading to death in COVID-19 patients. Also, age, lymphopenia, and leukocytosis were associated with death in this analysis. Using multiple logistic regression, the researchers found that higher age, higher SOFA (a diagnostic marker of sepsis) score, and d-dimer greater than 1 μg/mL predisposed patients to death. They also found that the median coronavirus-shedding time for surviving patients was 20 days. On the other hand, in patients who did not survive, coronavirus was detectable until death.
In a comprehensive global analysis, Orwa Albitar et al. [15] used data on risk factors influencing mortality in coronavirus when they used data from open databases. This study aimed to extract all patients with COVID-19 who had a clear positive test result at the individual level from the open databases reported by Xu et al. in their study [16]. In this way, they extracted data such as patient demographics, comorbidity records, and key dates such as the date of hospital admission, date of positive test result for COVID-19, date of symptom onset, and date of discharge or death. As a result of the study, older age, male gender, hypertension, and diabetes are the identified risk factors that most influence mortality in COVID-19 patients. They also found that positively tested American citizens are at a higher risk of coronavirus death than Asian citizens. Also, chronic lung disease, chronic kidney disease, and cardiovascular disease are associated with COVID-19 mortality but were identified as non-significant factors in this analysis.
Sven Drefahl and colleagues reported an interesting study [3], where they attempted to uncover sociodemographic risk factors influencing mortality in COVID-19. These researchers obtained data from the Swedish authorities on all recorded deaths from COVID-19 in Sweden up to May 2020. Via survival analysis, they found that men, people with low or no income, with only primary education, unmarried, and those born in a low- or middle-income county have a high predicted risk of death from COVID-19.
Related work analyzing COVID-19 risk factors are summarized in Table 2. None of the related work analyzed the influence of predominant COVID-19 virus types on the resulting ML models’ performance. Moreover, the analyses in related works were performed by computer scientists, without considering the expert opinion.

3. Methodology and Experiments

Based on the related work analyses, we defined three research questions. RQ1. Does information about the predominant COVID-19 virus type influence the performance of the predictive ML models? RQ2. Which approach to the selection of risk factors will provide better prognostic results: factors selected by medical experts, or factors extracted automatically by forward stepwise selection? RQ3. When we extract knowledge employing explainability methods to analyze how particular comorbidities influence ICU prediction and compare it with selections of domain experts and FSS resp., which one is better?
To answer these research questions, we used open data from the studies analyzed in Section 2 and the well-known CRISP-DM methodology [17]. In all aspects of our work, there was a strong involvement of medical experts, which is in our opinion a very important aspect of the ML and knowledge extraction process and is usually neglected in similar research papers. The following subsections correspond to particular CRISP-DM phases.

3.1. Business Understanding

In the wake of the COVID-19 pandemic, businesses, schools, health providers, etc. worldwide have been confronted with unprecedented challenges. From disruptions in supply chains and shifts in consumer behavior to the urgent need for accurate and timely decision-making, the pandemic has highlighted the critical role of technology in navigating these uncertain times. It was probably the most urgent in the healthcare sector, on which the eyes of the whole world were fixed with hope. Machine learning methods have emerged as powerful tools as analyzed in [18] for, e.g., diagnosis and detection, outbreak and prediction of virus spread, and potential treatment. In the case of diagnosing, the focus is often on X-ray and CT scan data using deep learning ML approaches [19]. However, this task was simple in the case of X-ray images for doctors. Moreover, CT is not broadly accessible for massive use in case of epidemics. What is more difficult is the identification of relevant factors that influence the subsequent course of the disease to properly perform the triage of patients and prescribe adequate treatment. For this purpose, a broader extent of patient data is necessary, whether clinical, demographic, or laboratory information.
To achieve this “business” goal, we used machine learning algorithms to classify patients based on the risk factors that may influence the course of disease in hospitalized patients, whether it is a deterioration of the patient’s condition or an improvement in their condition. In the modeling section, we used data from Mexico, which were obtained from the database of the General Directorate of Epidemiology [20]. Primarily, we used data from the year 2022, and in case of a significant imbalance in the target class, we also used data from the year 2021. But we also used data from the year 2020 [7] in the modeling part.
Firstly, we focused on two studies in the modeling section: one predicting patient survival [6] and the other predicting ICU admission [8]. We reproduced these experiments, used them as baseline models, and created our models using different preprocessing and predictors. We compared these models using accuracy and also included information on COVID-19 variants to see if it affected predictions (to answer RQ1).
Then, we performed two experiments consisting of two groups of models: in the first group, we used the predictive features identified as important by the domain expert. In the second group, we used the predictive features identified by the forward stepwise selection algorithm (to answer RQ2).
Moreover, we applied three different explainability methods to analyze how particular comorbidities influenced ICU prediction. Two methods were used to compute the global importance of the predictors for the population sample (a transparent logistic regression model using statistical tests and model-agnostic Shapley Additive Explanations—SHAP—method). Additionally, we applied the local interpretable model-agnostic explanations—LIME—method to compute the local importance of the combination of predictors. The resulting set of important attributes was compared using FSS and domain expert selections (RQ3).
After understanding and processing the data, we used various boosting models, logistic regression, random forest, and other classification models to classify or identify the risk factors influencing the patient’s admission to ICU care. We will measure the success rate of each of the models using the AUC metric. We also measured the accuracy and precision of these models for both the target classes.

3.2. Data Understanding

3.2.1. Datasets from 2020

The selected dataset sourced from the kaggle.com [7] website (accessed on 1 March 2023), which was extracted from the Mexican government datasets, contains 23 attributes and 566.602 records. Of these 23 attributes, 1 attribute is numeric, 19 attributes are nominal, and 3 attributes are interval attributes in the form of dates.
When visualizing some attributes (icu, intubated, and diabetes), we found that the data were slightly imbalanced, and for some attributes, the data were strongly imbalanced. In most cases, strongly imbalanced data can cause significant problems in the modeling and result evaluation phases.
We also performed a missing value analysis of the dataset. Missing or unknown values were denoted by the values “97, 98, 99” in this dataset. We replaced these values with the NaN value. By analyzing the missing values, we found that the attributes “icu” and “intubated” contained the most missing values, with more than 78%. The seven attributes of the dataset did not contain any missing values.
We also performed a correlation analysis of the attributes, which found that 38 pairs of attributes had a correlation greater than 0.8, i.e., they were strongly correlated. The most highly correlated attribute pairs were, for example, “sex—pregnancy”, “patient_type—intubated” or “diabetes—copd” (copd stands for chronic obstructive pulmonary disease).

3.2.2. Datasets from 2021 and 2022

The datasets from 2021 and 2022 share several characteristics. Both datasets have a total of 40 attributes, including 4 interval attributes that represent dates, 1 numeric attribute that represents age, and 35 nominal attributes. Missing, or unknown values are again noted by the values “97”, “98”, and “99”. The attribute names in the datasets were originally in Spanish and have since been translated into English.
Although the datasets shared many common features, there were also some important differences between them. One such difference was the number of records in each dataset. The 2021 dataset had 8.830.345 records, whereas the 2022 dataset had 6.330.966 records.
By analyzing the distribution of values, we found that the values for the target attribute are highly imbalanced; in both datasets, class “1” does not even reach 10% of the total number of records when the missing values are removed. Class “1” in the dataset indicates that the patient will be hospitalized in the Intensive Care Unit (ICU); on the other hand, class “0” indicates that the patient will not be hospitalized in the Intensive Care Unit.
When analyzing the missing values, we found that the attribute “Migrant” had the most missing values in both cases. The target group also had a lot of missing values, and in both datasets, it was over 93%.

3.2.3. COVID-19 Variants Dataset

We obtained COVID-19 variant data from the GISAID database (https://gisaid.org/hcov19-variants/ accessed on 1 March 2023) with 6 attributes (2 nominal, 3 numeric, and 1 interval). The data contain sequencing results of COVID-19 samples from different countries and dates, and particular COVID-19 variants are named by WHO (World Health Organisation). No missing values were found after the analysis.
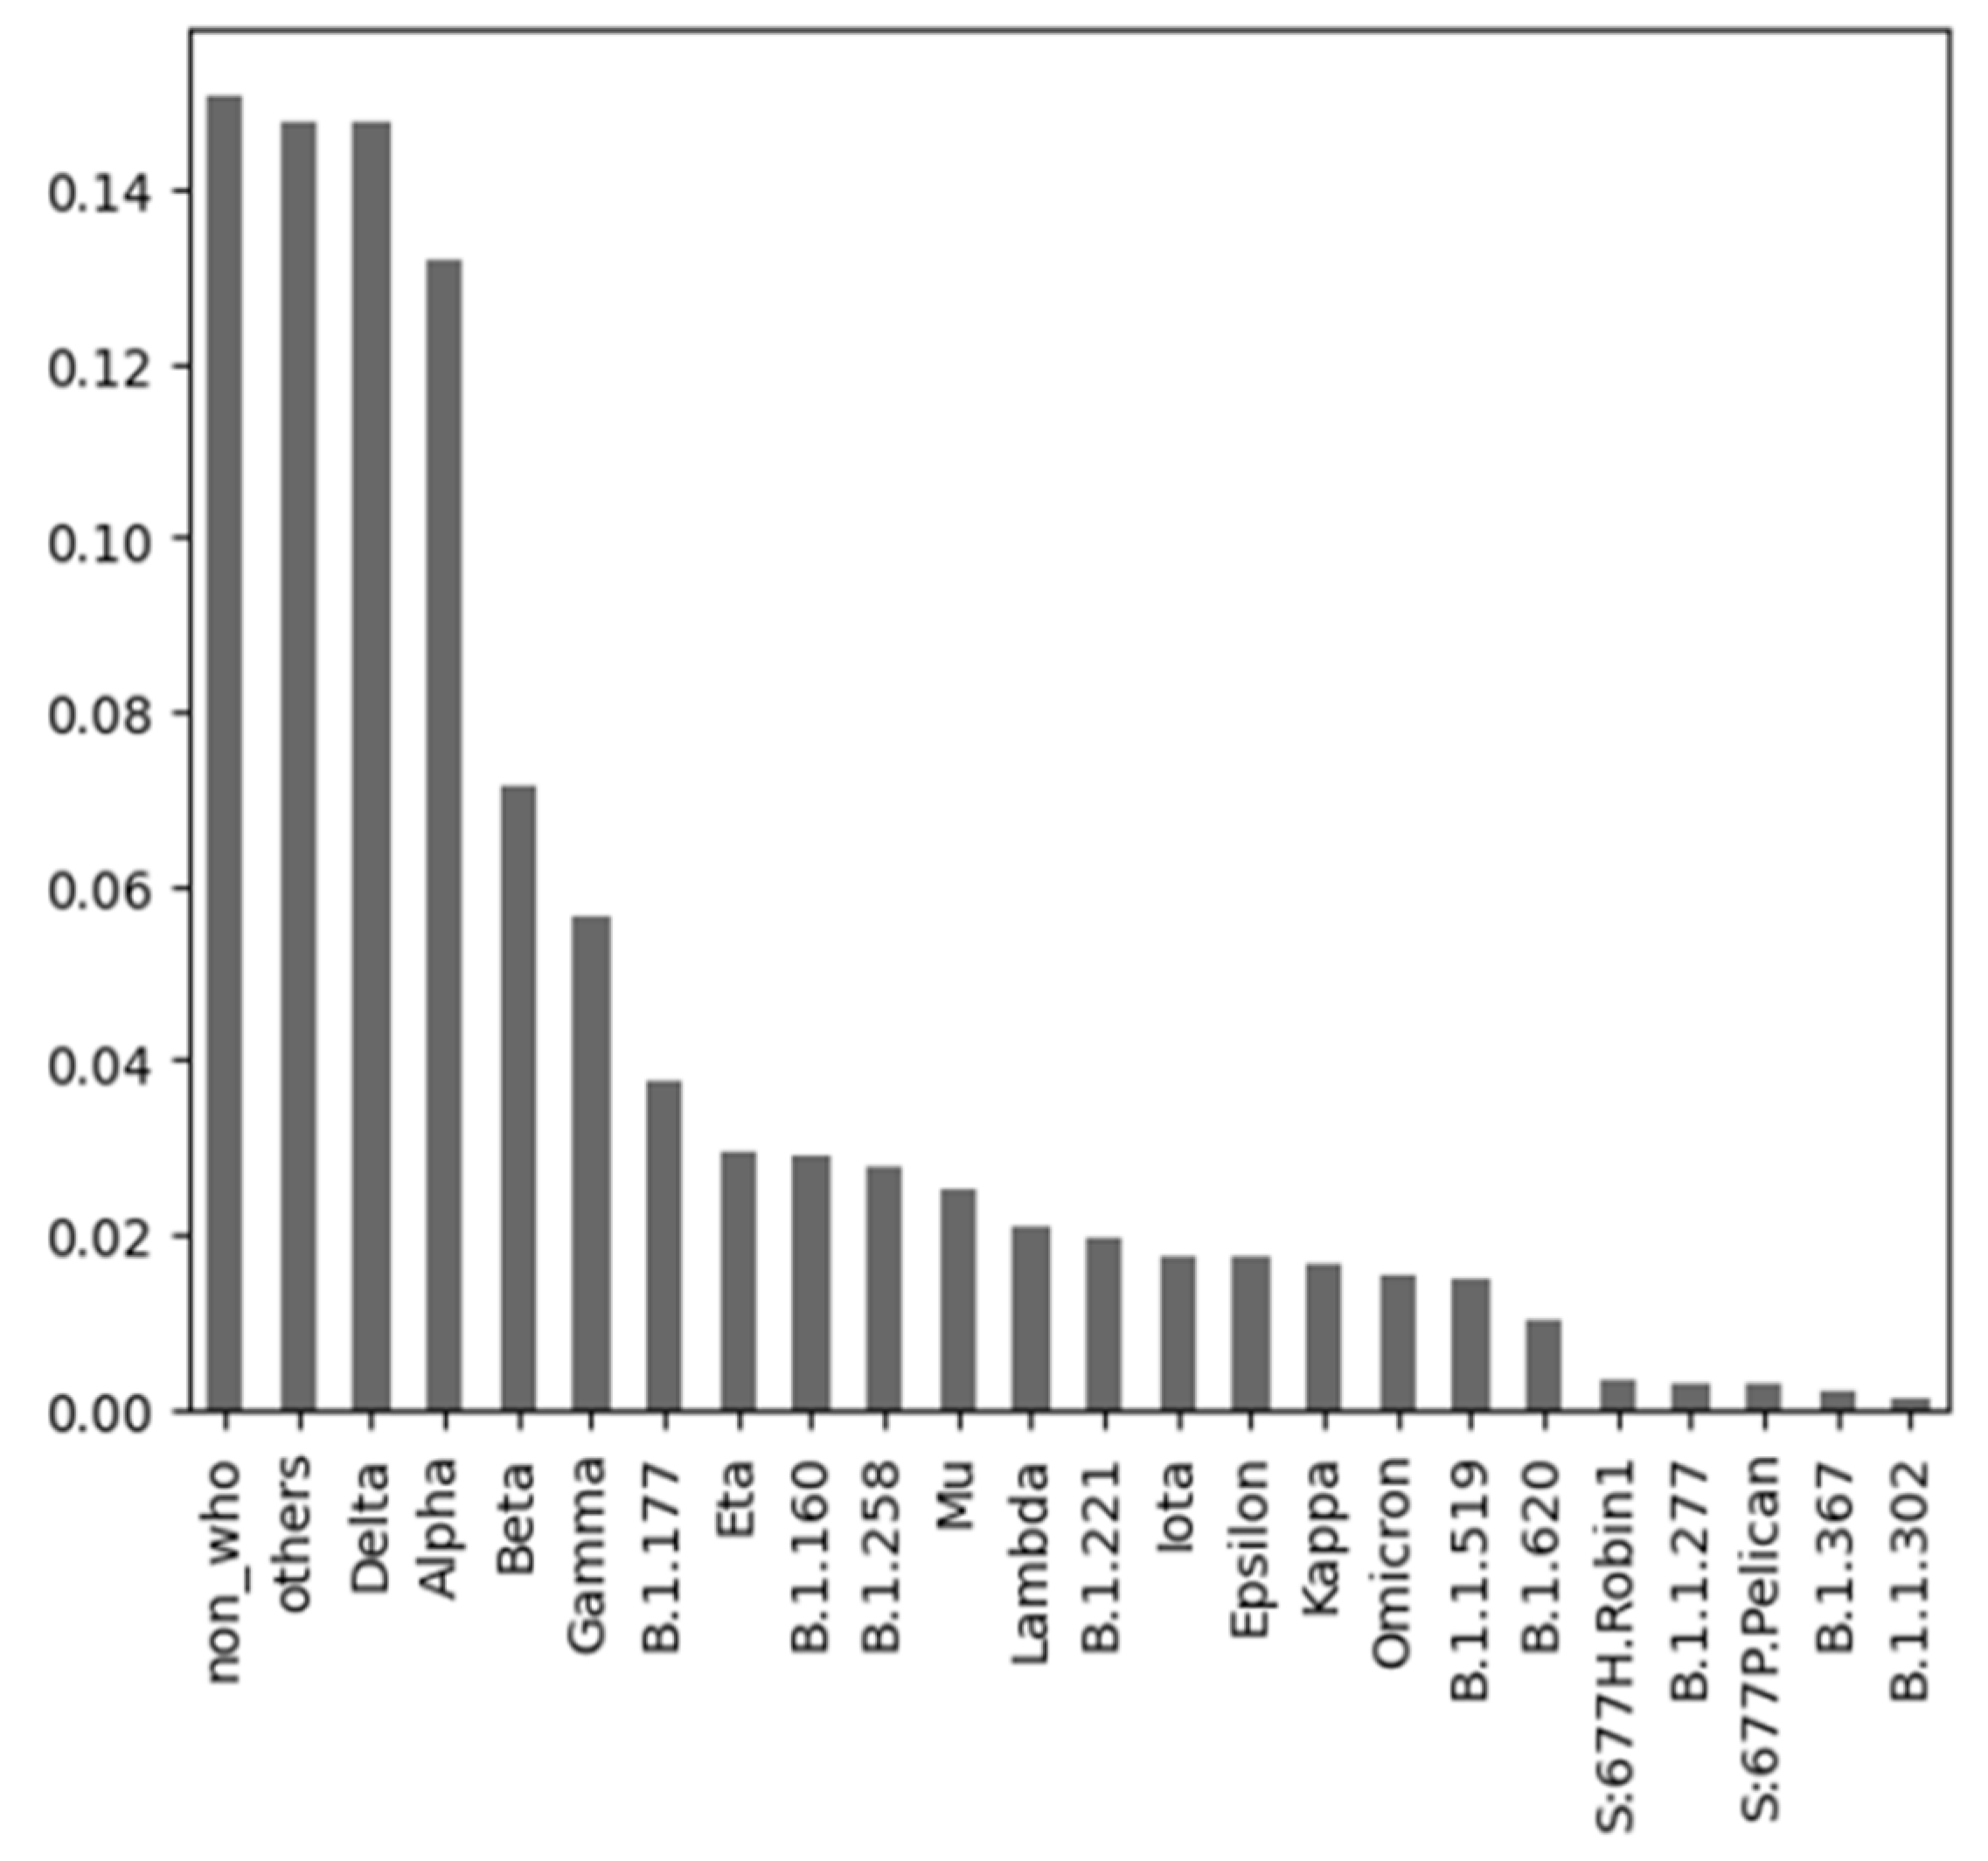
By analyzing the distribution of the “variant” attribute for 2020 data (see Figure 1), we found a skewed distribution with “non_who” and “others” having the highest values.
Variant data for 2021 are similar (see Figure 2), but with more evenly distributed values including “delta”, “alpha”, and “beta”. Adding variants to clinical data is, therefore, only reasonable for 2021 data due to the skewed distribution of 2020 data, where “non_who” and “others” dominate.

3.3. Data Preparation

General data preprocessing operations include removing all missing data, or entire records with missing values (NaN or values 97, 98, 99), which account for approximately 97% to 99.3% of records. Additionally, a binary attribute “dead” was created based on the patient’s date of death, and an attribute “incubation_period” was created, representing the time in days between the date of COVID-19 symptom onset and the date of hospitalization. Attributes with dates, such as “LAST_UPDATE”, “HOSPITALIZATION_DATE”, “DATE_SYMPTOM” and “DATE_DEATH” were removed.
In preprocessing the Mexican datasets from 2021 and 2022, attribute names were translated from Spanish to English, and categorical attributes that were in string format were encoded using binarization. An attribute “y-w” was created to represent the year and week of COVID-19 symptom onset for each record (e.g., 2020-01-01 −> 2020-01), and the prevailing variant was assigned based on the date of COVID-19 symptom onset.
In preprocessing the COVID-19 variant dataset, records from Mexico were extracted. An attribute “y-w” was created to represent the year and week of sequencing, and the prevailing variant was extracted for each week.

3.4. Modeling

3.4.1. Predicting the Target Class “dead”

In this part of the experiment, to answer RQ1, we used the study by Krajah et al. [6] as a reference, in which researchers used several machine learning algorithms to predict patient survival, but for our comparison, we only considered the basic algorithms without any special tuning, namely the logistic regression (LR) and random forest (RF) models. For validation, we used a 10-fold cross-validation.
Using statistical tests, the authors selected the following predictors in the study [6]: intubed, icu, age (61–90), age (0–30), pneumonia, covid_res, diabetes, hypertension, contact_other_covid, age (31–60), and obesity.
From the 2020 data, the FSS algorithm selected the following attributes: sex, patient_type, intubated, age, covid_res, pneumonia, diabetes, contact_other_covid, and renal_chronic.
From the data for 2021, the FSS algorithm selected the following attributes: pneumonia, type_patient, antigen_sample_taking, age, final_classification, result_antigen, intubated, sex, hypertension, icu, sector_healthcare, renal_chronic, contact_other_covid, other_disease, obesity, origin, tobacco, diabetes, immunosuppressed, hospital_region, cardiovascular, nationality, p_birth_region, p_language_speech, nationality. 1, epoc, and asthma. In 2021, more predictor attributes were selected due to a larger dataset. Following the same data preprocessing used in the study [6], we created six classification models.

3.4.2. Predicting the Target Class “icu”

We conducted another experiment to answer RQ2 using the study by Holy and Rosa [8] as a reference, where we focused on the target class “icu”, i.e., whether the patient will be hospitalized in the ICU or not. In that study, the researchers used the SMOTE algorithm to balance the target class and used 5-fold cross-validation for validation. We selected the SVM-linear model and SVM-RBF as the reference models. Researchers in the aforementioned study selected the following attributes: pneumonia, patient_type, cardiovascular, other_disease, immunosuppressed, tobacco, asthma, renal_chronic, copd, obesity, diabetes, contact_other_covid, sex, hypertension, covid_res, and incubating_period. As in the previous experiment, we created six models that were compared with the models from the reference study, and this time, we used the same data preprocessing as the researchers used in the reference study.
We decided to merge the two datasets mentioned above, the data for 2021 and 2022, for this classification task. The purpose was to increase the volume of data for the minority class. To balance the class distribution in the dataset and enhance the classification model’s performance, we used an under-sampling method called Tomek Links [21]. This approach also helped us to avoid overfitting.

3.4.3. Knowledge Extraction—Important COVID-19 Attributes

(a) Identifying the right attributes that significantly impact the prediction results is crucial for building successful machine learning models. There are several methods for attribute selection, including forward stepwise selection and determination of attributable importance. For the modeling, we chose the forward attribute selection algorithm, which identified the following attributes: type_patient, final_classification, incubating_period, contact_other_covid, sector_healthcare, origin, pneumonia, intubated, hypertension, pregnant, p_birth_city, language_speech, age, nationality.1, renal_chronic, patient_region, migrant, origin_country, and tobacco.
(b) Moreover, we also asked an expert, an associate professor, and a doctor at the Department of Infectology and Travel Medicine of the Faculty of Medicine from Pavol Jozef Šafárik University in Košice to help us identify important attributes from our dataset that medically influence the course of COVID-19 disease. Selected attributes included hospital_region, sex, age, pregnant, diabetes, copd, asthma, immunosuppressed, hypertension, other_disease, obesity, renal_chronic, and tobacco. We used nine classification algorithms, namely XGBoost, CatBoost, LightGBM, logistic regression, Naive Bayes, random forest, SGD, SVM-linear, and SVM-RBF for modeling.
(c) Besides the discrete attribute selection and assessment of attribute importance by domain experts, we applied various global and local explainability methods to further understand the relative importance of the attribute in the context of the particular predictive model to answer RQ3.
In the first analysis, we trained a logistic regression model (a transparent explainability method) and analyzed the global importance of the attributes. The coefficients of the linear logistic model were directly interpretable, and it was possible to test their importance statistically. The statistical test was based on the null hypothesis that the model’s coefficient had a 0 value, i.e., the corresponding attribute was unimportant for the prediction. Suppose the test statistic (p-value) of the feature is less than the significance level (commonly 0.05 or 0.01). In that case, the sample data provide enough evidence to reject the null hypothesis, and this attribute is important for the classification. Table 3 lists the model’s coefficients and corresponding p-values ordered from the most significant to the least significant attribute. When we used the significance value of p = 0.05, we obtained 11 statistically important attributes.
Another (post hoc) method explaining the attributes’ global importance is SHAP. SHAP is a game theoretic approach based on the Shapley values that explain how to assign payouts to players depending on their contribution to the total payout. In the context of the explainability of the ML models, the players correspond to the input attributes, and the payload corresponds to the prediction of the model. Shapley values can then be applied to explain how the input attribute contributes to the prediction for the given instance, averaged over the testing set. The additive importance of the attributes is presented in Figure 3. Based on this, we can state that SHAP identified nine important attributes, whereas eight of them have been also identified by the LR approach above.
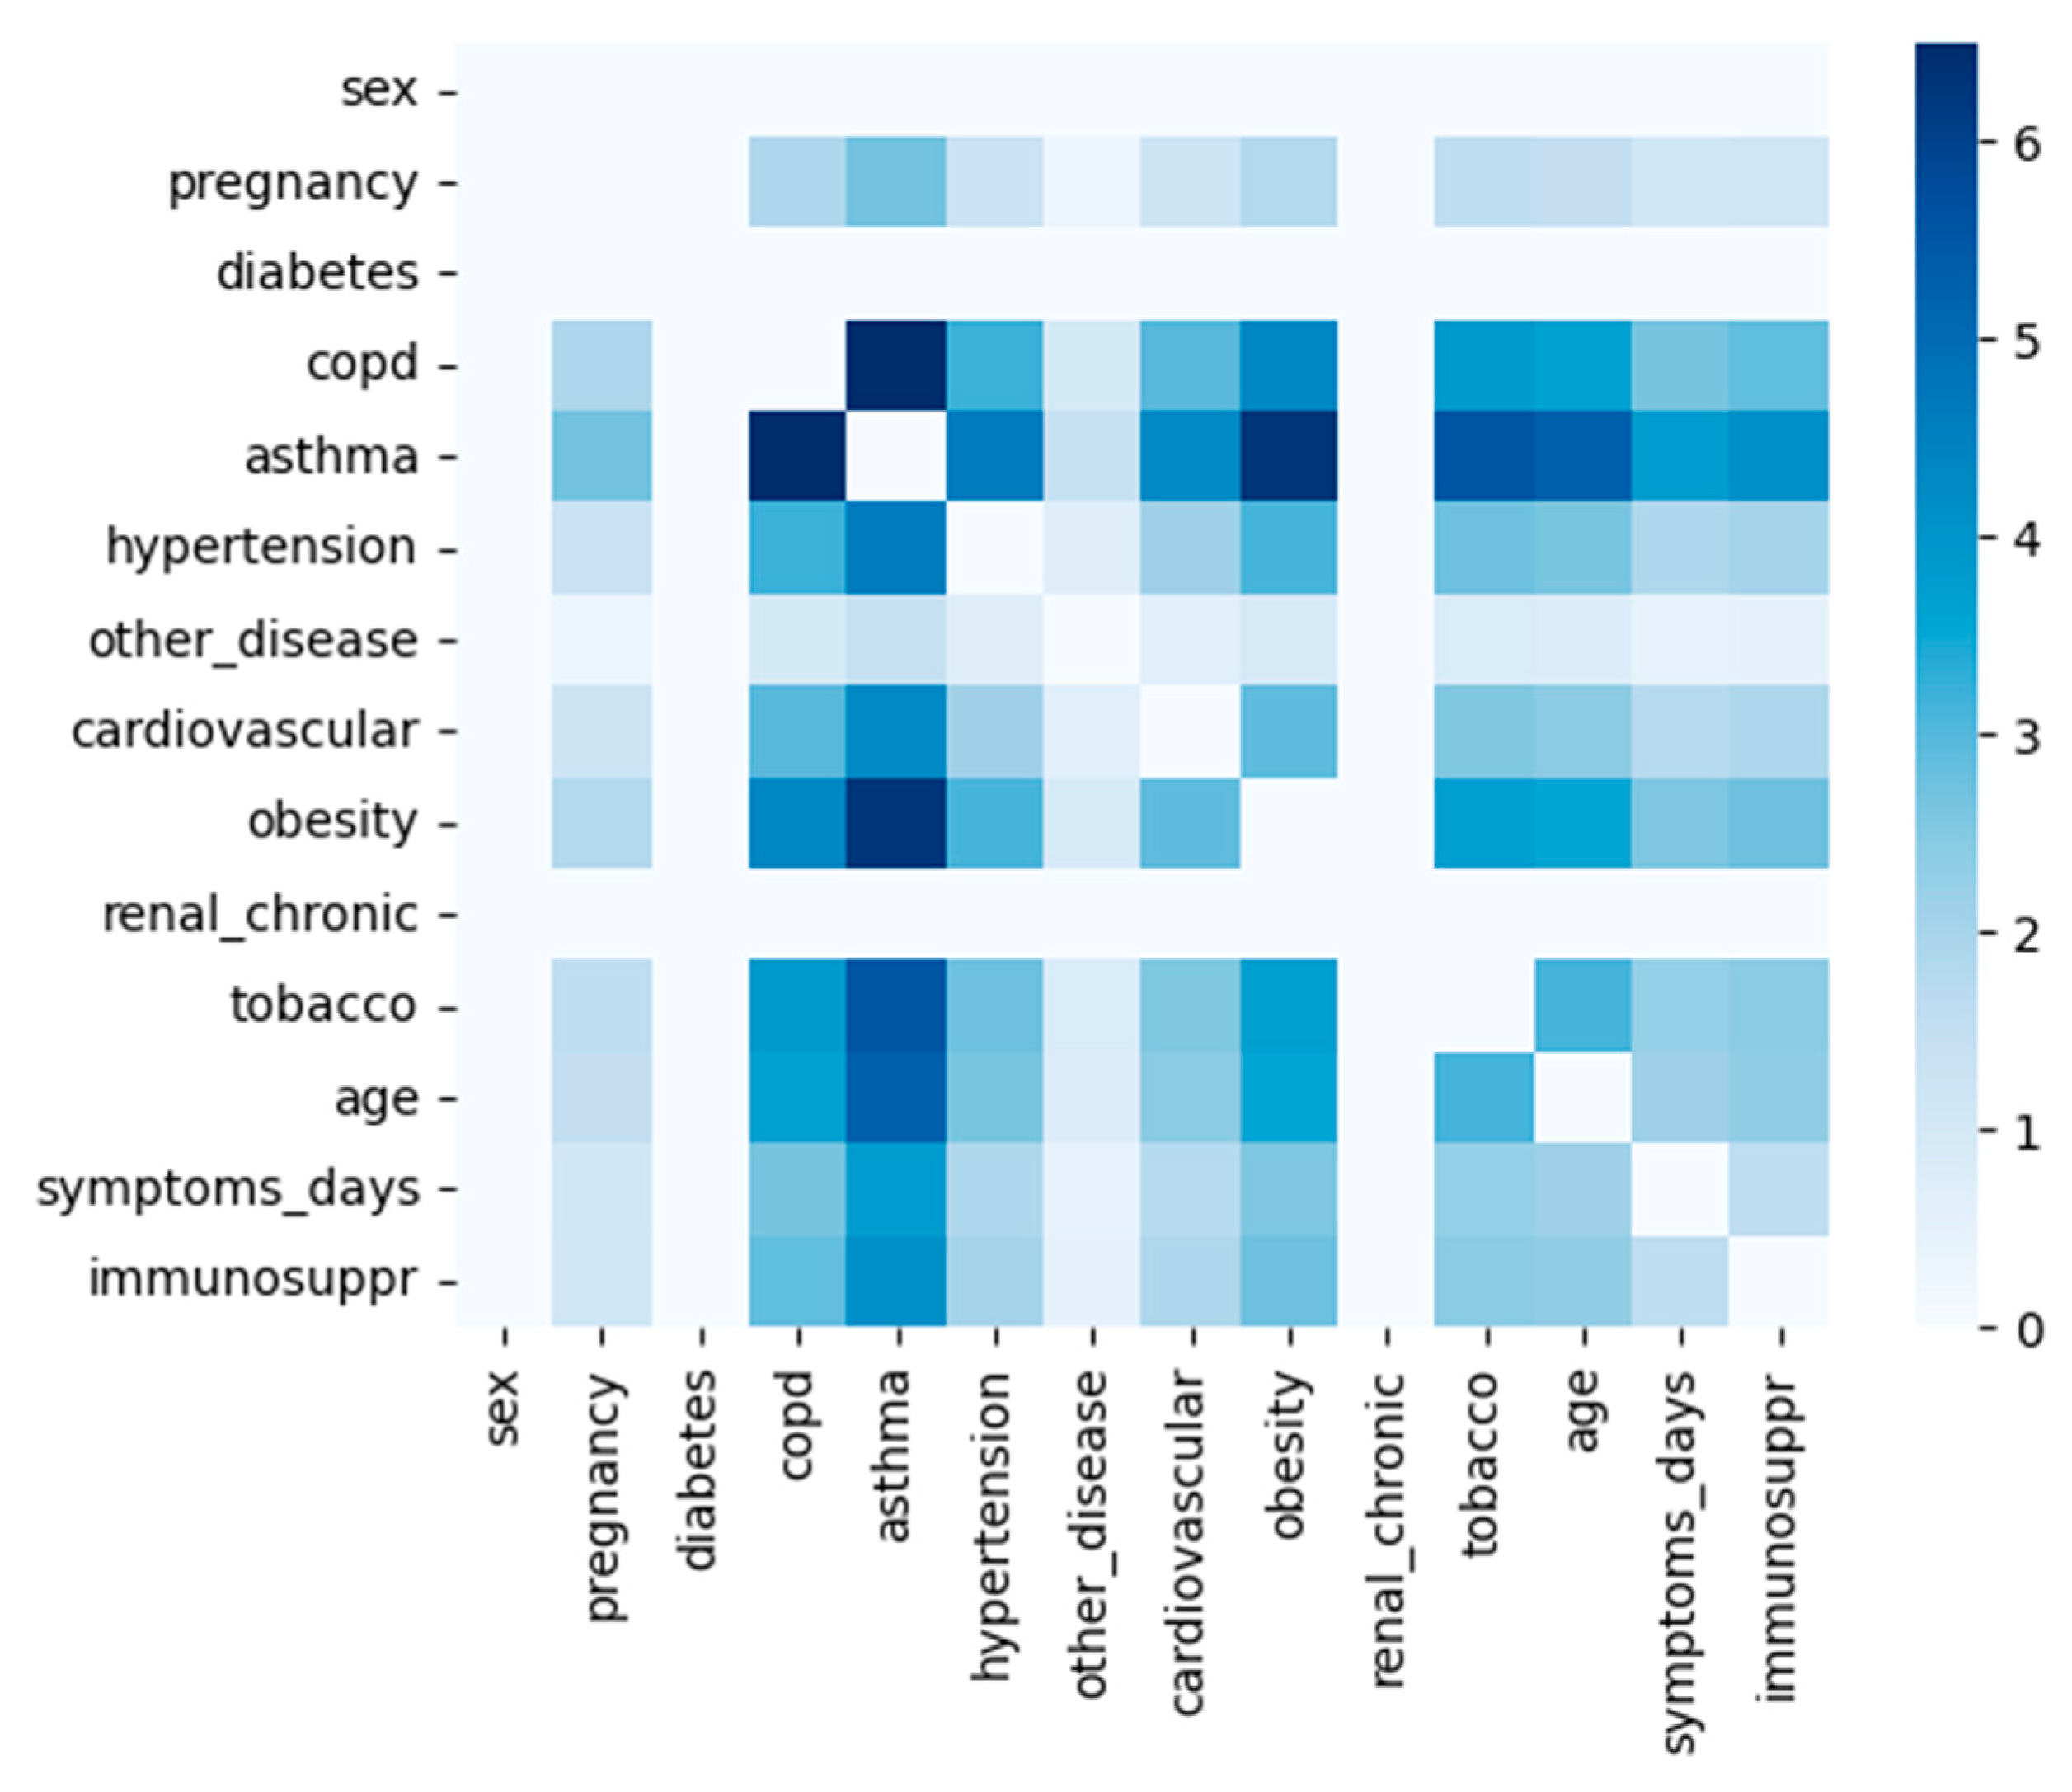
The previous methods are based on the global importance of the attributes. However, a specific attribute can be significant only for a specific subset of the instances or in combination with the other attributes. To evaluate such local dependencies, we analyzed the impact of the attributes using the local interpretable model-agnostic explanations (LIME) method. The LIME method is based on the local approximation of the black-box model using the explainable surrogate models for each tested instance. At first, we split data into the training and testing sets and trained the black-box XGboost model. Then, we generated explanations with attribute weights for each instance in the test set using the logistic regression surrogate models. All interactions among the most important attributes are visualized using a heatmap in Figure 4.
We selected five of the most important attributes and accumulated the pair interactions for all examples from the ICU class in the testing set (i.e., aggregated the sum of products between the weights of two attributes). The most frequent interactions between attributes important for the ICU classification were asthma-copd, asthma-cardiovascular, and asthma-tobacco.
The presented heatmap accumulates positive and negative contributions to the prediction in both cases whether the binary attribute (e.g., asthma, cardiovascular, etc.) is present or not. To gain further insights into how the model classifies examples and to analyze false positive and false negative errors, we decomposed contributions to positive/negative-present/non-present dependencies (i.e., what is the average local importance of the binary attribute if it is present or not-present vs. the correct or incorrect ICU classification). The results are presented in Table 4.
From the results, the majority of the positive predictions are based on the absence of the binary attributes, e.g., if the patient does not have asthma, it is highly probable that s/he will be not hospitalized in ICU (averaged positive weight contributing to the true prediction for asthma was 0.2290). The most important binary attributes were asthma, copd, cardiovascular, renal_chronic, tobacco, and other_disease, followed by numerical attributes symptoms_days and age.
The second column in Table 4 summarizes the impact of the attributes on the false negative and false positive errors. From this perspective, the most common attributes for false negative cases are symptoms_days (for more than seven days between symptoms and hospitalization), age (for patients younger than 38 years), tobacco use, and cardiovascular disease. The most common attributes for false positive errors correspond with the importance of the correct predictions, which reflects an unbalanced ratio between the rare positive and very frequent negative class. The exception is immunosuppr attribute, which does not contribute much to the correct predictions (the average weight of immunosuppr attribute not reported in Table 4 for correct predictions was 0.006).
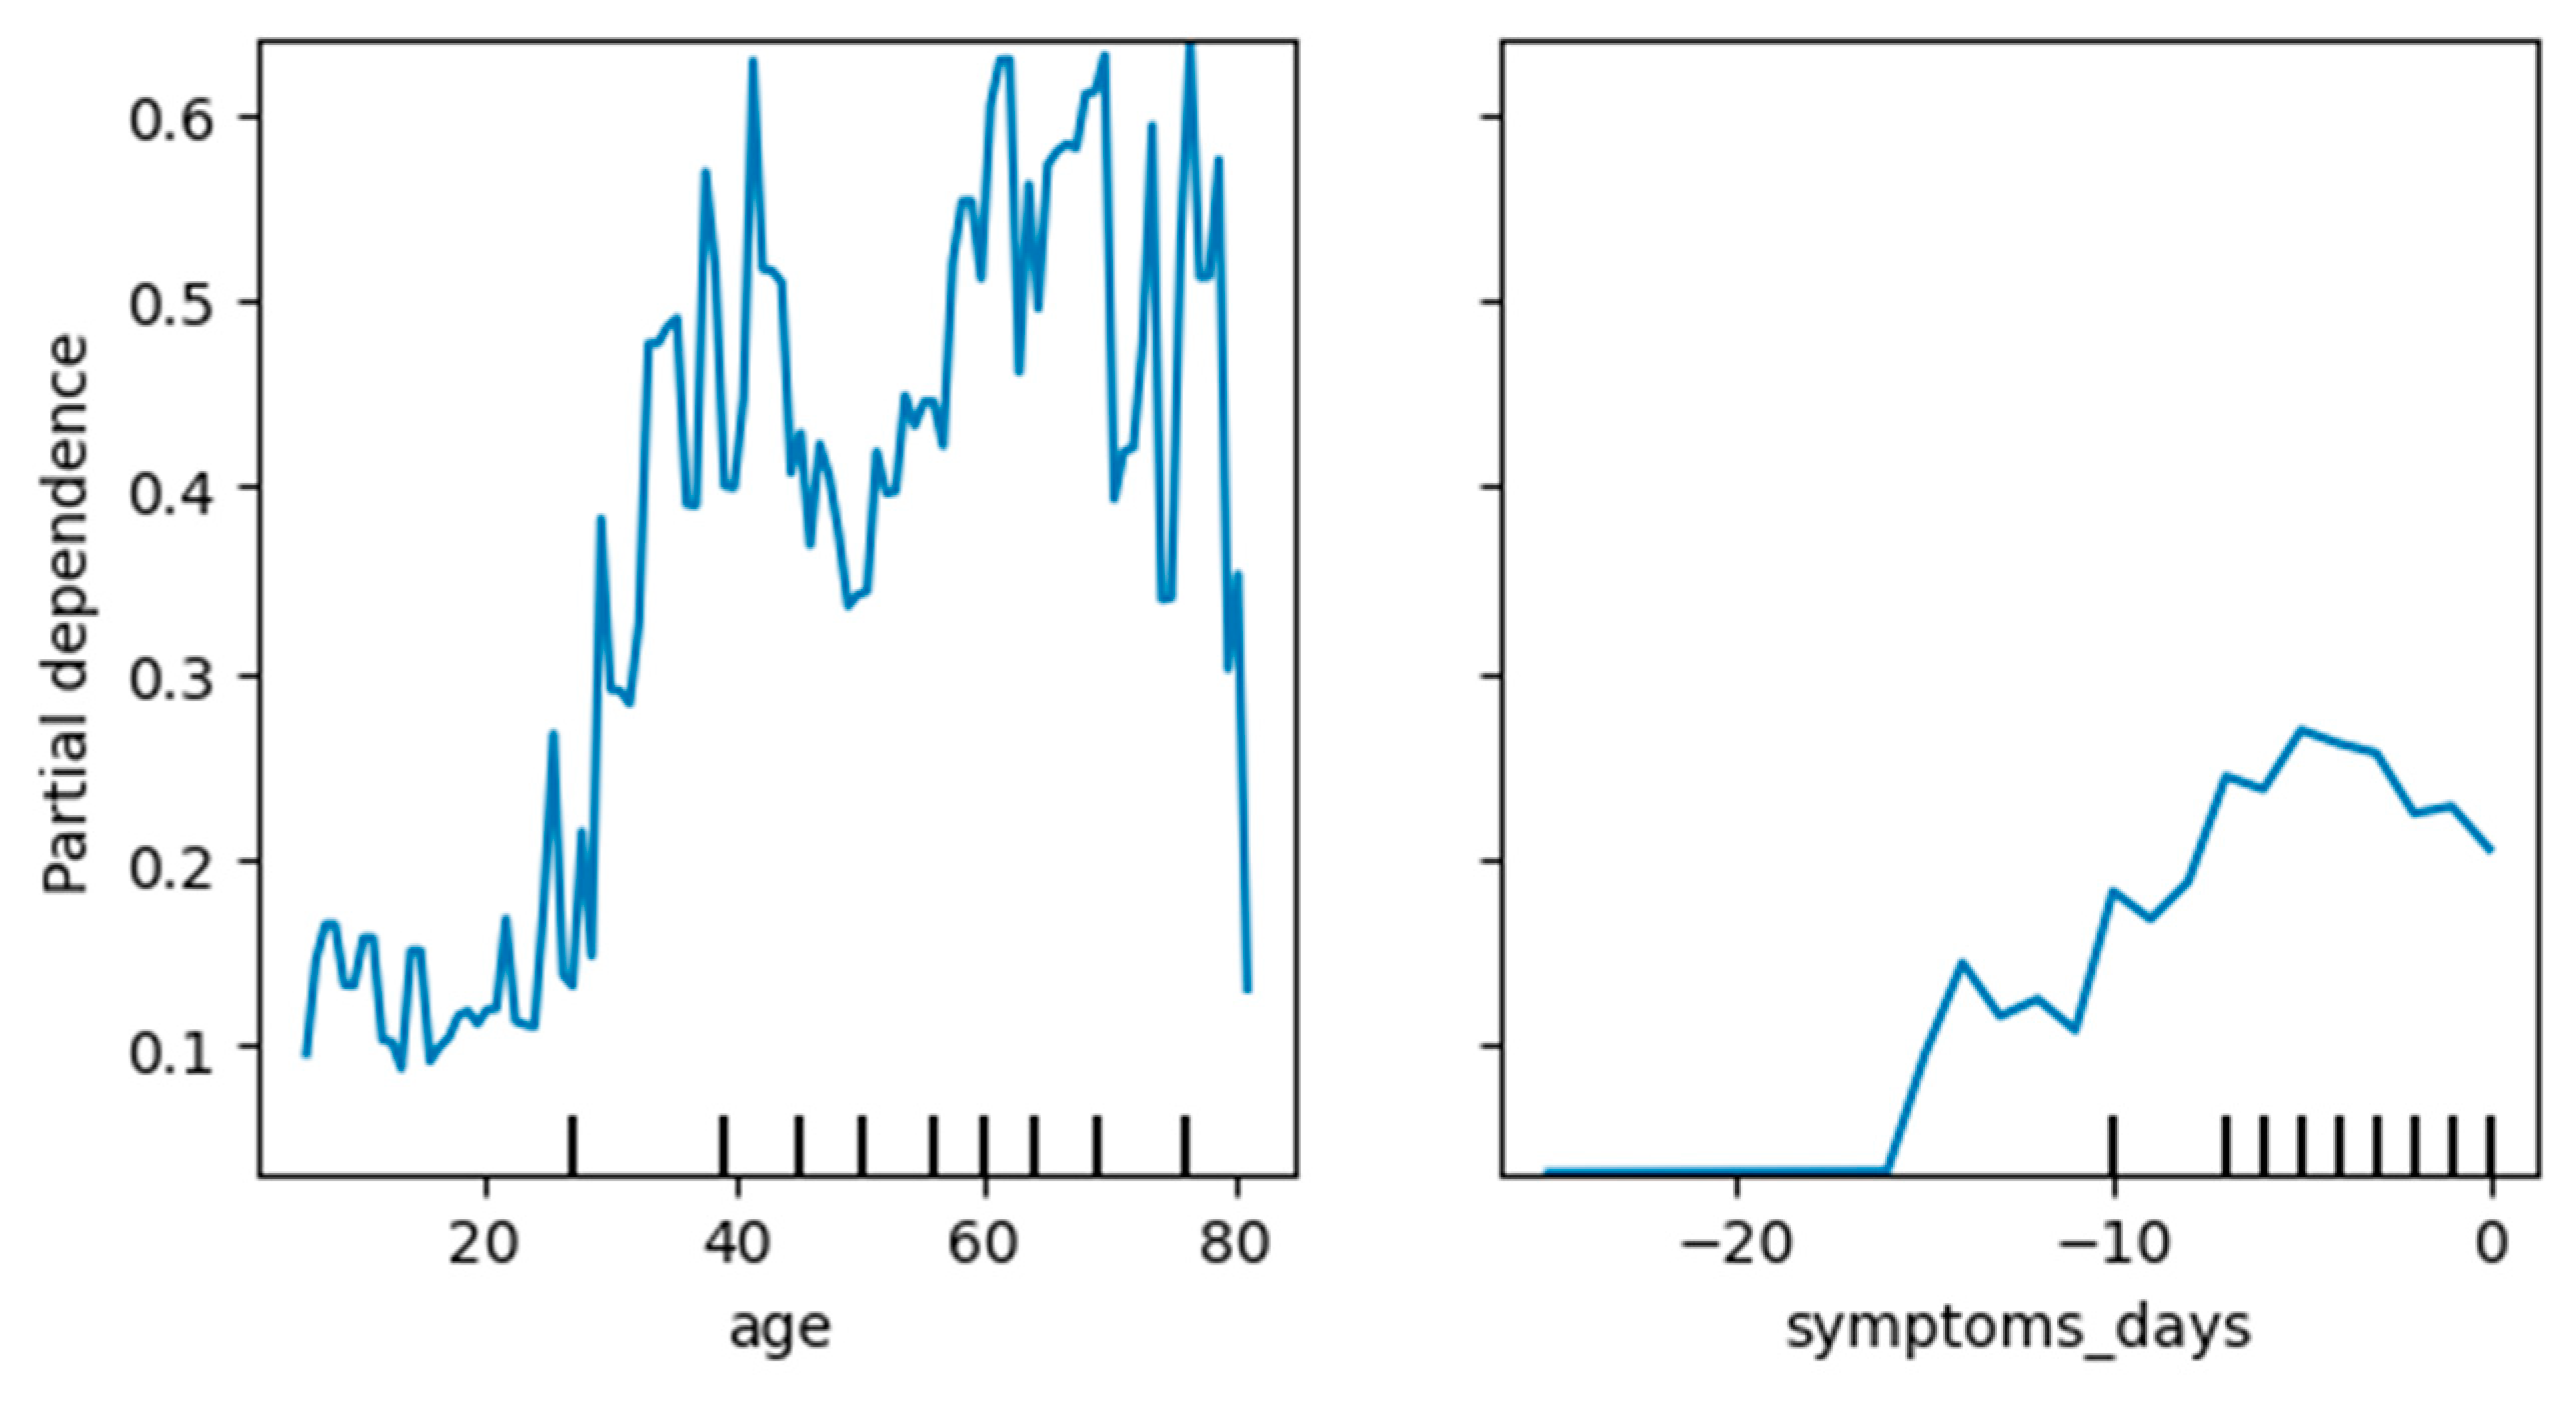
Additionally, for the numerical attributes, we generated partial dependence plots (PDP), which show the dependence between the target response (ICU prediction in our case) and a set of input features of interest, marginalizing over the values of all other input features. The plots for age and days of symptoms before hospitalization are presented in Figure 5.
From the plot for the age attribute, there is a peak of higher probability for ICU hospitalization for patients around 40 years old, and then the probability increases with age over 60.

3.5. Evaluation

In the first part, we conducted experiments to investigate whether information about the prevalent COVID-19 variant affects the performance of the models, comparing our models with referential from Krajah et al. [6]. The results are shown in Table 5.
An experiment with custom data preprocessing and predictor selection showed that forward attribute selection improved the model performance. However, the accuracies for both 2020 and 2021 were lower than those for the reference models. In the second part of the experiments, we compared our models with the reference models from a study by Holy and Rosa [8] and also investigated the effect of COVID-19 variant information on the performance of the models.
In Table 6, we can see that our models’ performance for 2020 was lower compared to the reference models, despite balancing the target class using the SMOTE algorithm. The SVM-linear model achieved 14% accuracy in classifying positive instances and 93% accuracy in classifying negative instances. The SVM-RBF model achieved 14% accuracy in classifying positive instances and 91% accuracy in classifying negative instances. However, for 2021 data, both models achieved 96% classification accuracy. Adding COVID-19 variant information again did not affect the models’ performance.
Although our models achieved high accuracy, further analysis revealed that they could not distinguish between classes, with an AUC metric of 0.5. This is a common issue in classifying highly imbalanced data, and it is challenging to solve since it depends on the data type. The last part was dedicated to the classification into the target class “icu”.
Table 7 contains the results of models where we used the attributes identified by the medical expert. There are significant differences in Class 1 accuracy between the models, with CatBoost achieving the highest accuracy (0.83), whereas NB had the lowest accuracy (0.24). For the other classes, the models were more accurate overall, but their AUC ROC (area under the ROC curve) was low.
Table 8 shows the results of the models where the predictor attributes were selected using the forward selection algorithm. In terms of class 1 accuracy, the results in this table are better compared to the first case. The highest class 1 accuracy was achieved by LR (0.92). Still, its AUC was lower than the XGBoost, CatBoost, and LightGBM models, which had high class 1 accuracy and also achieved the highest AUC, indicating that these models were able to better separate the classes.

4. Discussion and Conclusions

In this article, we used ML to answer two research questions aimed at a better understanding of COVID-19. In order to better evaluate our results, we used two reference studies to create ML prognostic models that predicted the “dead” and “icu” classes. We first created models with the same data (2020) preprocessing as in the reference studies and then with our own data preprocessing.
In the first part of our experiments related to RQ1, we examined the 2021 data and added information about the prevailing COVID-19 variant, which we gathered from other sources of open data. It did not affect the performance of the models. In both types of models (targeted to prognose “dead” and “icu” resp.), the impact of COVID-19 variant information was none or very marginal. So, our answer to RQ1 based on the available data is NO, i.e., the information about the predominant COVID-19 virus type does not influence the performance of the resulting predictive ML models. The current dominant variant of COVID-19—the Omicron—leads to a much less severe course of COVID-19 than the previous variants. The set we monitored was from the pre-Omicron period, and according to our results, the variants known until then did not show differences in the number of deaths or ICU admissions.
On the “dead” class data, we found that our models for (2020) data performed more or less the same as the referential models. Models for (2021) data in this case achieved slightly lower performance than those for (2020) data.
The situation differed for the “icu” target class, where our models performed worse than the referential models. Much better results have been achieved for (2021) data. The results may be affected by several factors, such as different training and test sets and hyperparameters settings, as well as some preprocessing of data that have been used but not described in the reference study.
To answer the RQ2, we used the classification of patients into the “icu” target class, i.e., whether the patient will be admitted to the Intensive Care Unit or not. We performed the analysis using data from the General Directorate of Epidemiology in Mexico.
We discovered that the models used were most successful within the scope of feature attributes selected by the forward selection algorithm rather than the ones selected by the domain expert. Of the models used, XGBoost, CatBoost, and LightGBM achieved the best results. So, the answer to RQ2 is that knowledge extracted by the ML approaches like forward stepwise selection for the selection of relevant factors provides better prediction performance than factors selected merely on the medical expertise.
On the other side, when we examined the models from the explainability point of view RQ3, the domain expert was much more precise in identifying the most important attributes. When we compared the expert’s selection (13 selected attributes), it covered 10 out of 11 significant attributes identified by logistic regression and accompanied statistical tests. Similarly, in the case of selection made by the SHAP methods, 8 out of 9 selected attributes were identified by domain experts as well. On the other hand, FSS selection (19 selected attributes) was able to cover only 5 out of 11 significant attributes identified by logistic regression and 4 out of 9 by SHAP.
Our results show a peak of higher probability for ICU hospitalization for patients around 40 years old, and then the probability increases with age over 60 (Figure 5). This is a remarkable result, as most works report that the risk of ICU admission increases with age. Cohen et al. in their study [22] report results from four European countries, in which the summary proportions of individuals around <40–50, around 40–69, and around ≥60–70 years old among all COVID-19-related ICU admissions were 5.4% (3.4–7.8; I2 89.0%), 52.6% (41.8–63.3; I2 98.1%), and 41.8% (32.0–51.9; I2 99%), respectively. However, since many patients with advanced age suffer from advanced chronic disease, it is necessary to distinguish whether the risk factor is only age or its combination with chronic diseases. According to the results of the study by Kämpe et al. [23], the risk associations for co-morbidities were generally stronger among younger individuals compared to older individuals.
The finding that the duration of symptoms before the patient’s hospitalization correlates with the severity of the course and the probability of admission to the ICU can be explained by the fact that early use of antiviral agents like remdesivir (<5 days from symptoms onset) may reduce COVID-19 progression. The delayed admission to the hospital is associated with a delayed administration of remdesivir and with a worse outcome, as reported by Falcone et al. in [24].
Our results demonstrate some interesting findings and are unique in tight cooperation with medical experts (infectologists), reflecting the human-in-the-loop concept. There are some limitations imposed by the characteristics and extent of the available datasets. For this reason, in our future work, we plan to create our own real dataset extracted from about 2500 electronic health records of patients in the local hospital.

Author Contributions

Conceptualization, J.P. and P.B.; methodology, J.P. and P.B.; software, M.H, and P.B.; validation, O.L., P.B. and Z.P.; formal analysis, J.P.; medical domain expertise and consultation: Z.P.; data selection and processing, M.H., P.B. and O.L.; writing—original draft preparation, J.P., O.L., P.B., Z.P. and M.H.; writing—review and editing, O.L., J.P., P.B. and Z.P.; visualization, M.H. and P.B.; supervision, J.P.; project administration, J.P.; funding acquisition, J.P. All authors have read and agreed to the published version of the manuscript.

Funding

This research was funded by the Scientific Grant Agency of the Ministry of Education, Science, Research, and Sport of the Slovak Republic and the Slovak Academy of Sciences under grant number 1/0685/21, and by the Slovak Research and Development Agency under contract No. APVV-20-0232, and contract No. APVV-16-0213.

Data Availability Statement

In the experiments described in this paper, the COVID-19 patient precondition dataset has been used. It is available on the Kaggle website here: https://www.kaggle.com/datasets/tanmoyx/covid19-patient-precondition-dataset. (accessed on 1 March 2023).

Conflicts of Interest

The authors declare no conflict of interest.

References

  1. Cascella, M.; Rajnik, M.; Aleem, A.; Dulebohn, S.C.; Di Napoli, R. Features, Evaluation, and Treatment of Coronavirus (COVID-19); StatPearls Publishing: Treasure Island, FL, USA, 2023. Available online: https://www.ncbi.nlm.nih.gov/books/NBK554776/ (accessed on 21 January 2023).
  2. An, C.; Lim, H.; Kim, D.-W.; Chang, J.H.; Choi, Y.J.; Kim, S.W. Machine learning prediction for mortality of patients diagnosed with COVID-19: A nationwide Korean cohort study. Sci. Rep. 2020, 10, 18716. [Google Scholar] [CrossRef] [PubMed]
  3. Drefahl, S.; Wallace, M.; Mussino, E.; Aradhya, S.; Kolk, M.; Brandén, M.; Malmberg, B.; Andersson, G. A population-based cohort study of socio-demographic risk factors for COVID-19 deaths in Sweden. Nat. Commun. 2020, 11, 5097. [Google Scholar] [CrossRef] [PubMed]
  4. Guan, X.; Zhang, B.; Fu, M.; Li, M.; Xu, Y.; Zhu, Y.; Peng, J.; Guo, H.; Lu, Y. Clinical and inflammatory features based machine learning model for fatal risk prediction of hospitalized COVID-19 patients: Results from a retrospective cohort study. Ann. Med. 2021, 53, 257–266. [Google Scholar] [CrossRef] [PubMed]
  5. Wong, K.C.Y.; Xiang, Y.; Yin, J.; So, H.-C. Uncovering Clinical Risk Factors and Predicting Severe COVID-19 Cases Using UK Biobank Data: Machine Learning Approach. JMIR Public Health Surveill. 2021, 7, e29544. [Google Scholar] [CrossRef] [PubMed]
  6. Krajah, A.; Almadani, Y.F.; Saadeh, H.; Sleit, A. Analyzing COVID-19 Data Using Various Algorithms. In Proceedings of the 2021 IEEE Jordan International Joint Conference on Electrical Engineering and Information Technology (JEEIT), Amman, Jordan, 16–18 November 2021; pp. 66–71. [Google Scholar]
  7. Mukherjee, T. COVID-19 Patient Pre-Condition Dataset. 2020. Available online: https://Kaggle.com (accessed on 1 March 2023).
  8. Fransiska, A.; Holy, C.; Prima Rosa, P.H. Classification of COVID-19 Patients Requiring Intensive Care Unit. In Proceedings of the 25th International Computer Science and Engineering Conference, Chiang Rai, Thailand, 18–20 November 2021; pp. 469–472. [Google Scholar]
  9. Shi, Y.; Wang, Y.; Shao, C.; Huang, J.; Gan, J.; Huang, X.; Bucci, E.; Piacentini, M.; Ippolito, G.; Melino, G. COVID-19 infection: The perspectives on immune responses. Cell Death Differ. 2020, 27, 1451–1454. [Google Scholar] [CrossRef] [PubMed]
  10. Zhou, F.; Yu, T.; Du, R.; Fan, G.; Liu, Y.; Liu, Z.; Xiang, J.; Wang, Y.; Song, B.; Gu, X.; et al. Clinical course and risk factors for mortality of adult inpatients with COVID-19 in Wuhan, China: A retrospective cohort study. Lancet 2020, 395, 1054–1062. [Google Scholar] [CrossRef] [PubMed]
  11. Majnarić, L.T.; Babič, F.; O’Sullivan, S.; Holzinger, A. AI and Big Data in Healthcare: Towards a More Comprehensive Research Framework for Multimorbidity. J. Clin. Med. 2021, 10, 766. [Google Scholar] [CrossRef]
  12. Bhargava, A.; Fukushima, E.A.; Levine, M.; Zhao, W.; Tanveer, F.; Szpunar, S.M.; Saravolatz, L. Predictors for Severe COVID-19 Infection. Clin. Infect. Dis. 2020, 71, 1962–1968. [Google Scholar] [CrossRef]
  13. Aziz, M.; Haghbin, H.; Lee-Smith, W.; Goyal, H.; Nawras, A.; Adler, D.G. Gastrointestinal predictors of severe COVID-19: Systematic review and meta-analysis. Ann. Gastroenterol. 2020, 33, 615–630. [Google Scholar] [CrossRef]
  14. Mostaza, J.M.; Garcia-Iglesias, F.; Gonzalez-Alegre, T.; Blanco, F.; Varas, M.; Hernandez-Blanco, C.; Hontañón, V.; Jaras-Hernández, M.J.; Martínez-Prieto, M.; Negreiros, A.Z.; et al. Clinical course and prognostic factors of COVID-19 infection in an elderly hospitalized population. Arch. Gerontol. Geriatr. 2020, 91, 104204. [Google Scholar] [CrossRef] [PubMed]
  15. Albitar, O.; Ballouze, R.; Ooi, J.P.; Ghadzi, S.M.S. Risk factors for mortality among COVID-19 patients. Diabetes Res. Clin. Pr. 2020, 166, 108293. [Google Scholar] [CrossRef] [PubMed]
  16. Xu, E.; Xie, Y.; Al-Aly, Z. Long-term neurologic outcomes of COVID-19. Nat. Med. 2022, 28, 2406–2415. [Google Scholar] [CrossRef] [PubMed]
  17. Schröer, C.; Kruse, F.; Marx Gómez, J. A Systematic Literature Review on Applying CRISP-DM Process Model. Procedia Comput. Sci. 2021, 181, 526–534. [Google Scholar] [CrossRef]
  18. Alsharif, M.H.; Alsharif, Y.H.; Chaudhry, S.A.; Albreem, M.A.; Jahid, A.; Hwang, E. Artificial intelligence technology for diagnosing COVID-19 cases: A review of substantial issues. Eur. Rev. Med. Pharmacol. Sci. 2020, 24, 9226–9233. [Google Scholar] [CrossRef] [PubMed]
  19. Alsharif, M.H.; Alsharif, Y.H.; Yahya, K.; Alomari, O.A.; Albreem, M.A.; Jahid, A. Deep learning applications to combat the dissemination of COVID-19 disease: A review. Eur. Rev. Med. Pharmacol. Sci. 2020, 24, 11455–11460. [Google Scholar] [CrossRef] [PubMed]
  20. Gobierno de Mexico. Datos Abiertos. 2021. Available online: https://www.gob.mx/salud/documentos/datos-abiertos-152127 (accessed on 1 March 2023).
  21. Swana, E.F.; Doorsamy, W.; Bokoro, P. Tomek Link and SMOTE Approaches for Machine Fault Classification with an Imbalanced Dataset. Sensors 2022, 22, 3246. [Google Scholar] [CrossRef] [PubMed]
  22. Cohen, J.F.; Korevaar, D.A.; Matczak, S.; Chalumeau, M.; Allali, S.; Toubiana, J. COVID-19-Related Fatalities and Intensive-Care-Unit Admissions by Age Groups in Europe: A Meta-Analysis. Front. Med. 2021, 7, 560685. [Google Scholar] [CrossRef] [PubMed]
  23. Kämpe, J.; Bohlin, O.; Jonsson, M.; Hofmann, R.; Hollenberg, J.; Wahlin, R.R.; Svensson, P.; Nordberg, P. Risk factors for severe COVID-19 in the young—Before and after ICU admission. Ann. Intensiv. Care 2023, 13, 31. [Google Scholar] [CrossRef] [PubMed]
  24. Falcone, M.; Suardi, L.R.; Tiseo, G.; Barbieri, C.; Giusti, L.; Galfo, V.; Forniti, A.; Caroselli, C.; Della Sala, L.; Tempini, S.; et al. Early Use of Remdesivir and Risk of Disease Progression in Hospitalized Patients with Mild to Moderate COVID-19. Clin. Ther. 2022, 44, 364–373. [Google Scholar] [CrossRef]
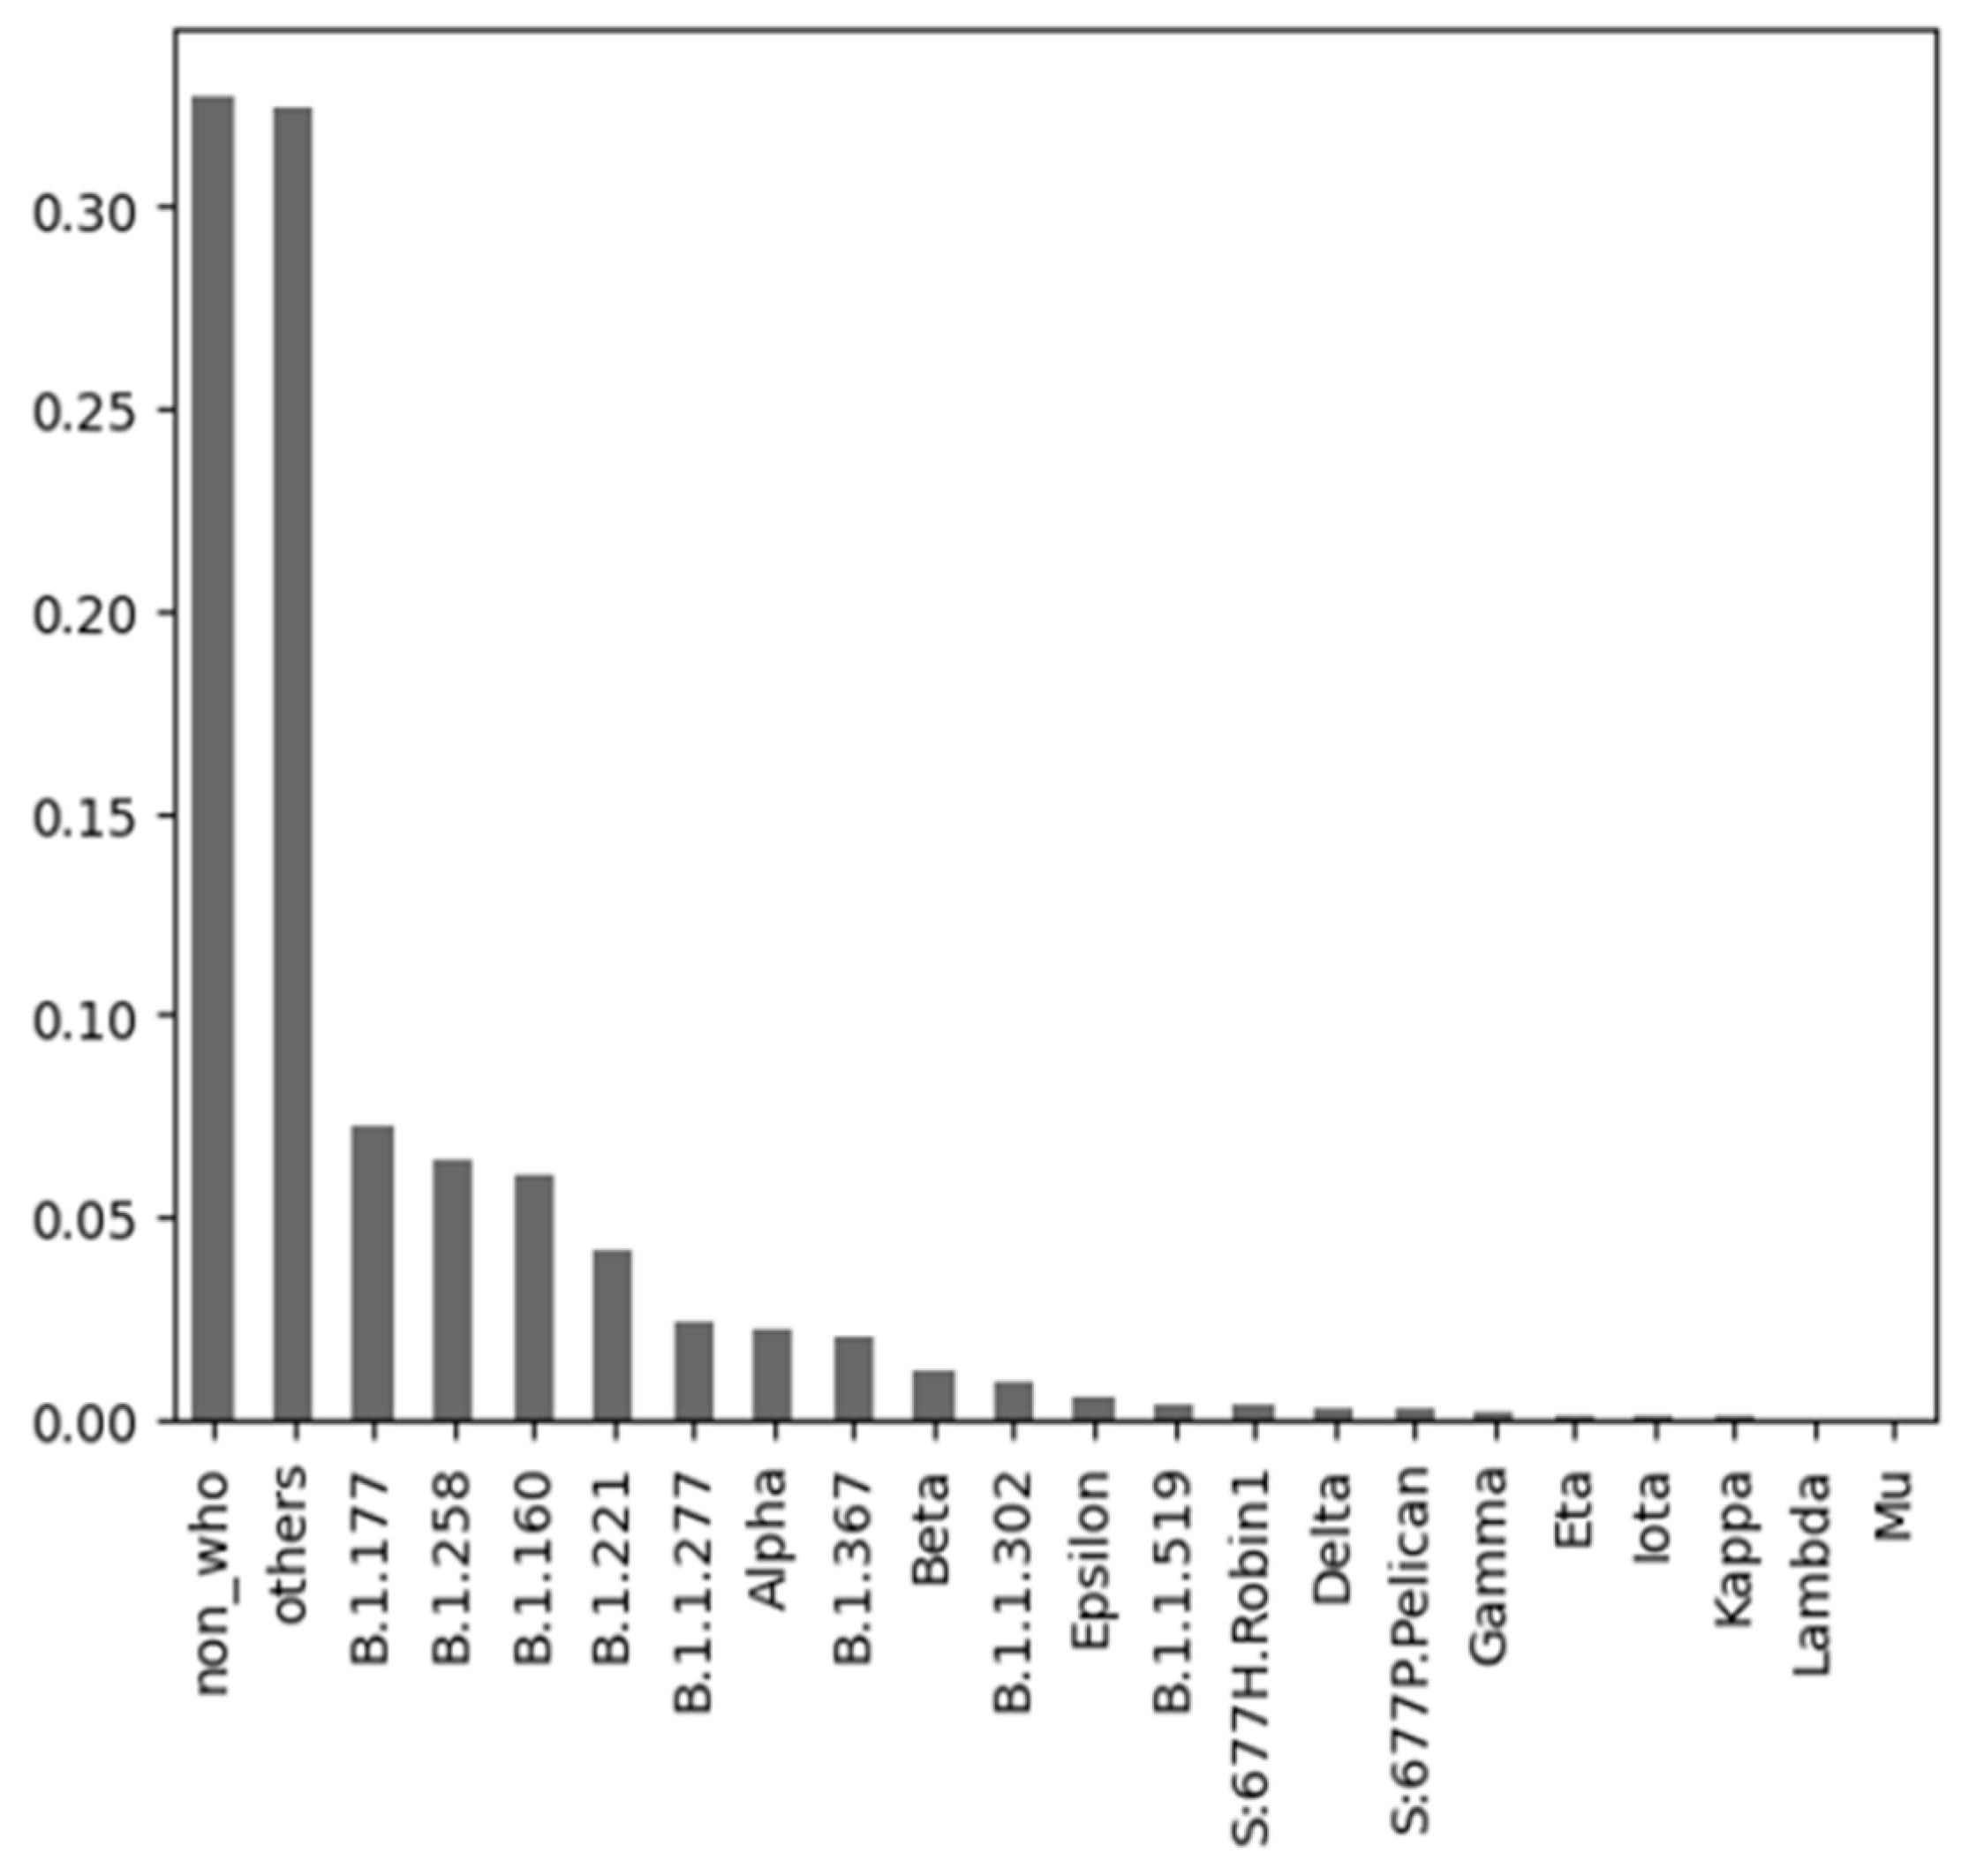
Figure 1. Distribution of values of the variable “variant” for the year 2020.
Make 05 00064 g001
Figure 2. Distribution of values of the variable “variant” for the year 2021.
Make 05 00064 g002
Figure 3. Shapley values of the attributes for the ICU classification.
Make 05 00064 g003
Figure 4. Local interactions among the most important attributes identified employing LIME.
Make 05 00064 g004
Figure 5. Dependence between ICU prediction, age, and days of symptoms before hospitalization marginalized over the values of all other input attributes plots by PDP.
Make 05 00064 g005
Table 1. Summary of related work on ML algorithms.
AuthorPredicted ClassUsed AlgorithmsResulting Statistics
Kenneth Chi-Yin Wong et al. [5]Severity of COVID-19 casesXGBoost prediction modelAUC ROC: 69.6% to 82.5%; recall: 0.5% to 74.8%; sensitivity: 55.7% to 83%; specificity: 66.6% to 71.9%; accuracy: 66.5% to 68.6%. Best analysis: 72% accuracy for fatal cases vs. outpatient cases.
Krajah et al. [6]Patient Survival (Death or Survival)Logistic regression, LDA, CART, SVM, NB, k-NNLogistic regression: average accuracy 84%; SVM: average accuracy 85%; overall success rates: logistic regression 83% and SVM 82%.
Holy and Rosa [8]Placement in ICUSVM (linear, polynomial, and RBF)Accuracies obtained with 5-fold cross-validation using 16 predictors: Linear SVM: 77.16%;
Polynomial SVM: 80.44%; RBF SVM: 81.27%.
Table 2. Summary of related work on COVID-19 risk factors.
Study and ReferenceKind of Data UsedMethodology for Risk Factor IdentificationIdentified Risk Factors
Wuhan Cohort Study [14]Demographics, laboratory data, clinical information, and treatment recordsUnivariate and
multivariate logistic regression
Diabetes, coronary heart disease, older age, lymphopenia, leukocytosis, higher SOFA score, and d-dimer > 1 μg/mL
Global Analysis by Orwa Albitar et al. [15]Demographics, comorbidities, and key dates (hospital admission, test results, symptom onset, discharge, or death)Comprehensive
analysis based on open databases
Older age, male gender, hypertension, diabetes, and differences in risk by nationality (American vs. Asian). The following risk factors are associated but not significant: Chronic lung disease, chronic kidney disease, and cardiovascular diseases
Sociodemographic Study by Sven Drefahl et al. [3]Data on recorded COVID-19 deaths in SwedenSurvival
analysis
Men, low or no income, only primary
education, unmarried, and born in a low or
middle-income county
Table 3. Attribute importance based on the logistic regression model for the ICU classification.
FeatureCoefficientp-Value
sex0.25310
tobacco0.19670
asthma0.16980
age0.06731.3263 × 10−69
diabetes0.04775.2488 × 10−54
hypertension0.05362.0673 × 10−53
renal_chronic0.02772.0746 × 10−28
other_disease0.02413.7978 × 10−19
pregnancy0.02793.3495 × 10−16
copd0.01781.221 × 10−12
immunosuppressed0.01361.566 × 10−8
cardiovascular0.00230.34459
Table 4. Positive and negative contributions to the prediction of ICU classes identified by LIME.
Correct ICU Predictions Incorrect ICU Predictions
not asthma0.2290False negative
not copd0.1555symptoms_days <= −7−0.0608
not cardiovascular0.1466age <= 38−0.0416
not renal_chronic0.1306tobacco−0.0126
not tobaco0.1195cardiovascular−0.0106
not other_disease0.1008False positive
−4 < symptoms_days <= −20.0190not asthma0.2164
age > 640.0253not copd0.1522
51 < age <= 640.0032not cardiovascular0.1452
not renal_chronic0.1315
not tobacco0.1109
not immunosuppr0.1095
Table 5. Comparison of models with referential for the target class “DEAD”.
MEX Data—Model Comparison—Target Class “DEAD” (Accuracy)
Reference Model 2020 by [6]Model 2020Model 2021Model 2021 + Variants
LR accuracy—predictors by [6]0.8280.8420.76830.7688
RF accuracy—predictors by [6]0.820.8030.75060.75
LR accuracy—own predictors0.8280.710.730.73
RF accuracy—own predictors0.820.710.730.73
Table 6. Comparison of models with reference models for the target class “icu”.
MEX Data—Model Comparison—Target Class “icu” (Accuracy)
Reference Model 2020 by [8]Model 2020Model 2021Model 2021 + Variants
SVM-linear0.77150.41010.96620.9662
SVM-RBF0.81540.56310.96620.9662
Table 7. Evaluation of models with attributes important according to the medical experts.
ModelPrecision Class 0Precision Class 1AccuracyAUC
XGBoost0.90.350.870.57
CatBoost0.90.830.90.57
LightGBM0.910.50.890.59
Random Forest0.890.40.880.52
Logistic Regression0.90.60.890.54
Naive Bayes0.910.240.820.59
SGD0.8900.890.5
SVM-linear0.8900.890.5
SVM-RBF0.8900.890.5
Table 8. Evaluation of models with attributes according to the forward stepwise selection algorithm.
ModelPrecision Class 0Precision Class 1AccuracyAUC
XGBoost0.930.830.930.71
CatBoost0.930.870.920.68
LightGBM0.930.830.930.71
Random Forest0.910.90.910.63
Logistic Regression0.920.920.920.66
Naive Bayes0.930.440.880.68
SGD0.890.290.880.51
SVM-linear0.930.760.920.68
SVM-RBF0.8900.890.5
Disclaimer/Publisher’s Note: The statements, opinions and data contained in all publications are solely those of the individual author(s) and contributor(s) and not of MDPI and/or the editor(s). MDPI and/or the editor(s) disclaim responsibility for any injury to people or property resulting from any ideas, methods, instructions or products referred to in the content.