Article

Can Principal Component Analysis Be Used to Explore the Relationship of Rowing Kinematics and Force Production in Elite Rowers during a Step Test? A Pilot Study

1
Department of Exercise Science, Physical and Health Education, University of Victoria, Victoria, BC V8P 5C2, Canada
2
Canadian Sport Institute-Pacific, Victoria, BC V9E 2C5, Canada
3
Department of Biomedical Physiology and Kinesiology, Simon Fraser University, Vancouver, BC V5A 1S6, Canada
*
Authors to whom correspondence should be addressed.
Mach. Learn. Knowl. Extr. 2023, 5(1), 237-251; https://doi.org/10.3390/make5010015
Submission received: 6 January 2023 / Revised: 3 February 2023 / Accepted: 15 February 2023 / Published: 17 February 2023
(This article belongs to the Section Data)

Abstract

:
Investigating the relationship between the movement patterns of multiple limb segments during the rowing stroke on the resulting force production in elite rowers can provide foundational insight into optimal technique. It can also highlight potential mechanisms of injury and performance improvement. The purpose of this study was to conduct a kinematic analysis of the rowing stroke together with force production during a step test in elite national-team heavyweight men to evaluate the fundamental patterns that contribute to expert performance. Twelve elite heavyweight male rowers performed a step test on a row-perfect sliding ergometer [5 × 1 min with 1 min rest at set stroke rates (20, 24, 28, 32, 36)]. Joint angle displacement and velocity of the hip, knee and elbow were measured with electrogoniometers, and force was measured with a tension/compression force transducer in line with the handle. To explore interactions between kinematic patterns and stroke performance variables, joint angular velocities of the hip, knee and elbow were entered into principal component analysis (PCA) and separate ANCOVAs were run for each performance variable (peak force, impulse, split time) with dependent variables, and the kinematic loading scores (Kpc,ls) as covariates with athlete/stroke rate as fixed factors. The results suggested that rowers’ kinematic patterns respond differently across varying stroke rates. The first seven PCs accounted for 79.5% (PC1 [26.4%], PC2 [14.6%], PC3 [11.3%], PC4 [8.4%], PC5 [7.5%], PC6 [6.5%], PC7 [4.8%]) of the variances in the signal. The PCs contributing significantly (p ≤ 0.05) to performance metrics based on PC loading scores from an ANCOVA were (PC1, PC2, PC6) for split time, (PC3, PC4, PC5, PC6) for impulse, and (PC1, PC6, PC7) for peak force. The significant PCs for each performance measure were used to reconstruct the kinematic patterns for split time, impulse and peak force separately. Overall, PCA was able to differentiate between rowers and stroke rates, and revealed features of the rowing-stroke technique correlated with measures of performance that may highlight meaningful technique-optimization strategies. PCA could be used to provide insight into differences in kinematic strategies that could result in suboptimal performance, potential asymmetries or to determine how well a desired technique change has been accomplished by group and/or individual athletes.

1. Introduction

Rowing requires the optimization of limb coordination to produce efficient mechanics and technique during the stroke. Rowing studies have investigated gross technique differences between novice and elite rowers [1], the effect of training on different rowing ergometers [2,3], spinal motion during varied speeds of rowing [4,5,6,7,8,9], and synchronization of rowing technique amongst rowers in a crew [10] in attempts to determine the most effective kinematic strategies for rowing performance. When exploring optimal kinematic patterns, it is important to focus on the motion of the main force-generating segments of the body in the context of the validated performance metrics relevant to timing and power development. As such, key kinematics metrics analyzed and used for technical feedback in rowing include joint angular and linear displacement, velocity and accelerations for the hip, knee, ankle, shoulder, elbow, and torso [11,12]. For example, significant increases in kinematic consistency of movement were observed when using accelerometer-based feedback on a rowing ergometer; however, this specific feedback metric showed no significant improvement on performance-related measures such as distance traveled and power development consistency [13]. It is therefore critically important to determine whole-body kinematic strategies that are related to valuable performance metrics and translate these features into simplified metrics that can form the basis of biofeedback tools. The performance metrics often used as important performance outcomes are normally kinetic metrics related to force, work and power, and include such variables as impulse and peak force at the handle or stretcher [14]. Further, split time has been used as a key metric for rowing performance and as an accessible feedback metric during coaching that relates to both rowing speed and power [14].
The force-developing phase of the rowing stroke is termed the drive. The drive requires coordination between three main components of movement: extension at the knee (leg drive); extension of the trunk about the hips (trunk swing); and elbow flexion (arm pull) [12,13]. The timing of the movements of the limbs must be coordinated over 200+ times in a 2000 m race to transfer optimal force to the oar and, ultimately, efficiently manage boat velocity [4,14]. Additionally, on water it is critical to have consistent timing of limb movements amongst all athletes to ensure optimal timing between athlete patterns of force development [15]. As such, limb kinematics representative of leg drive, trunk swing and arm pull are key components of the drive and used as feedback parameters for coaches and athletes during training sessions. However, determining the optimal timing and velocity of trunk and limb movement during the drive remains somewhat subjective, as studies may be limited to partial investigations of kinematics and not include no objective performance outcomes related to force or power development [9]. It is therefore important to investigate methods of analysis to assist in the determination of optimal limb kinematics linked to key performance metrics for the purpose of informing our understanding of sport performance and coaching best practice.
Principal component analysis (PCA) is a powerful analytical technique that can reduce the number of variables within complex movement patterns and detect fundamental patterns and relationships within groups and between individuals [16]. PCA extracts a small number of features from a large dataset, representing the basic waveforms, or principal components (PC) which make up the most common elements of the signal and, therefore, explain most of the dataset variance [17]. Once identified, PCs enable statistical correlation of patterns of variance within the dataset with performance metrics (i.e., speed, force development). While PCA has been used previously in rowing analysis, kinematic and kinetic data were not statistically linked, thereby limiting interpretation of the effect of kinematics on performance [9]. Relating PCs to performance metrics is essential to support accurate interpretation of how variance within movement patterns is related to performance [17,18]. Therefore, the purpose of this study was to evaluate the potential of using PCA of the kinematics of the rowing stroke together with performance metrics to determine key kinematic movement patterns that are associated with optimal performance. These relationships were explored across different stroke rates during a step-test evaluation on a dynamic rowing ergometer. We aimed to establish the use of PCA data reduction and reconstruction as a valuable analytic approach to rowing kinematic and kinetic technique assessment. We hypothesized that PCA would be able to differentially quantify key kinematic features related to optimal performance metrics in this elite cohort. Specifically, based on the experimental step-rate protocol, PCA would allow the determination of the dominant kinematic strategies used by athletes to increase stroke rate and maintain best performance. Overall identification of these movement patterns could be valuable as biofeedback metrics used to optimize coordination during the rowing stroke [19].

2. Materials and Methods

2.1. Participants and Test Procedure

Twelve elite competitive male rowers (mean ± SD: age = 26.3 ± 2.9 yr, mass = 93.8 ± 4.6 kg, height = 192 ± 5.1 cm, 2 km Personal Best 5:57.3 min ± 4.5 s) were purposively recruited from the Canadian National Rowing team and provided their informed written consent under Human Ethics at the University of Victoria. The inclusion criteria were the following: athletes of national level; >6 years of rowing experience; and athletes regularly trained on the rowing ergometer. Participants were excluded in case of any injury at the time of the study or injuries in the six months prior to enrollment. Within a regular training cycle, participants performed an incremental step test on a Rowperfect sliding ergometer (Rowperfect3 (RP3), Belper, UK; Figure 1) at the following stroke rates of 20, 24, 28, 32, and 36 strokes/min [20]. Each step consisted of a 1-min interval followed by 1 min of active recovery at a self-determined rate. The 1-min intervals were chosen as the common active and rest period for the test. For analysis, only the last 10 strokes from each step were used and the strokes from the beginning were used as familiarization to the current stroke rate. This ensured that the strokes analyzed at each step had the highest consistency at any given rate. Participants were instructed to perform each step at 75% of their maximum perceived competition intensity for each stroke rate. Prior to starting the step test, the subjects performed a low-intensity self-selected warm-up on the ergometer for approximately 10 min. The design of this study was an analytical, observational cohort study.

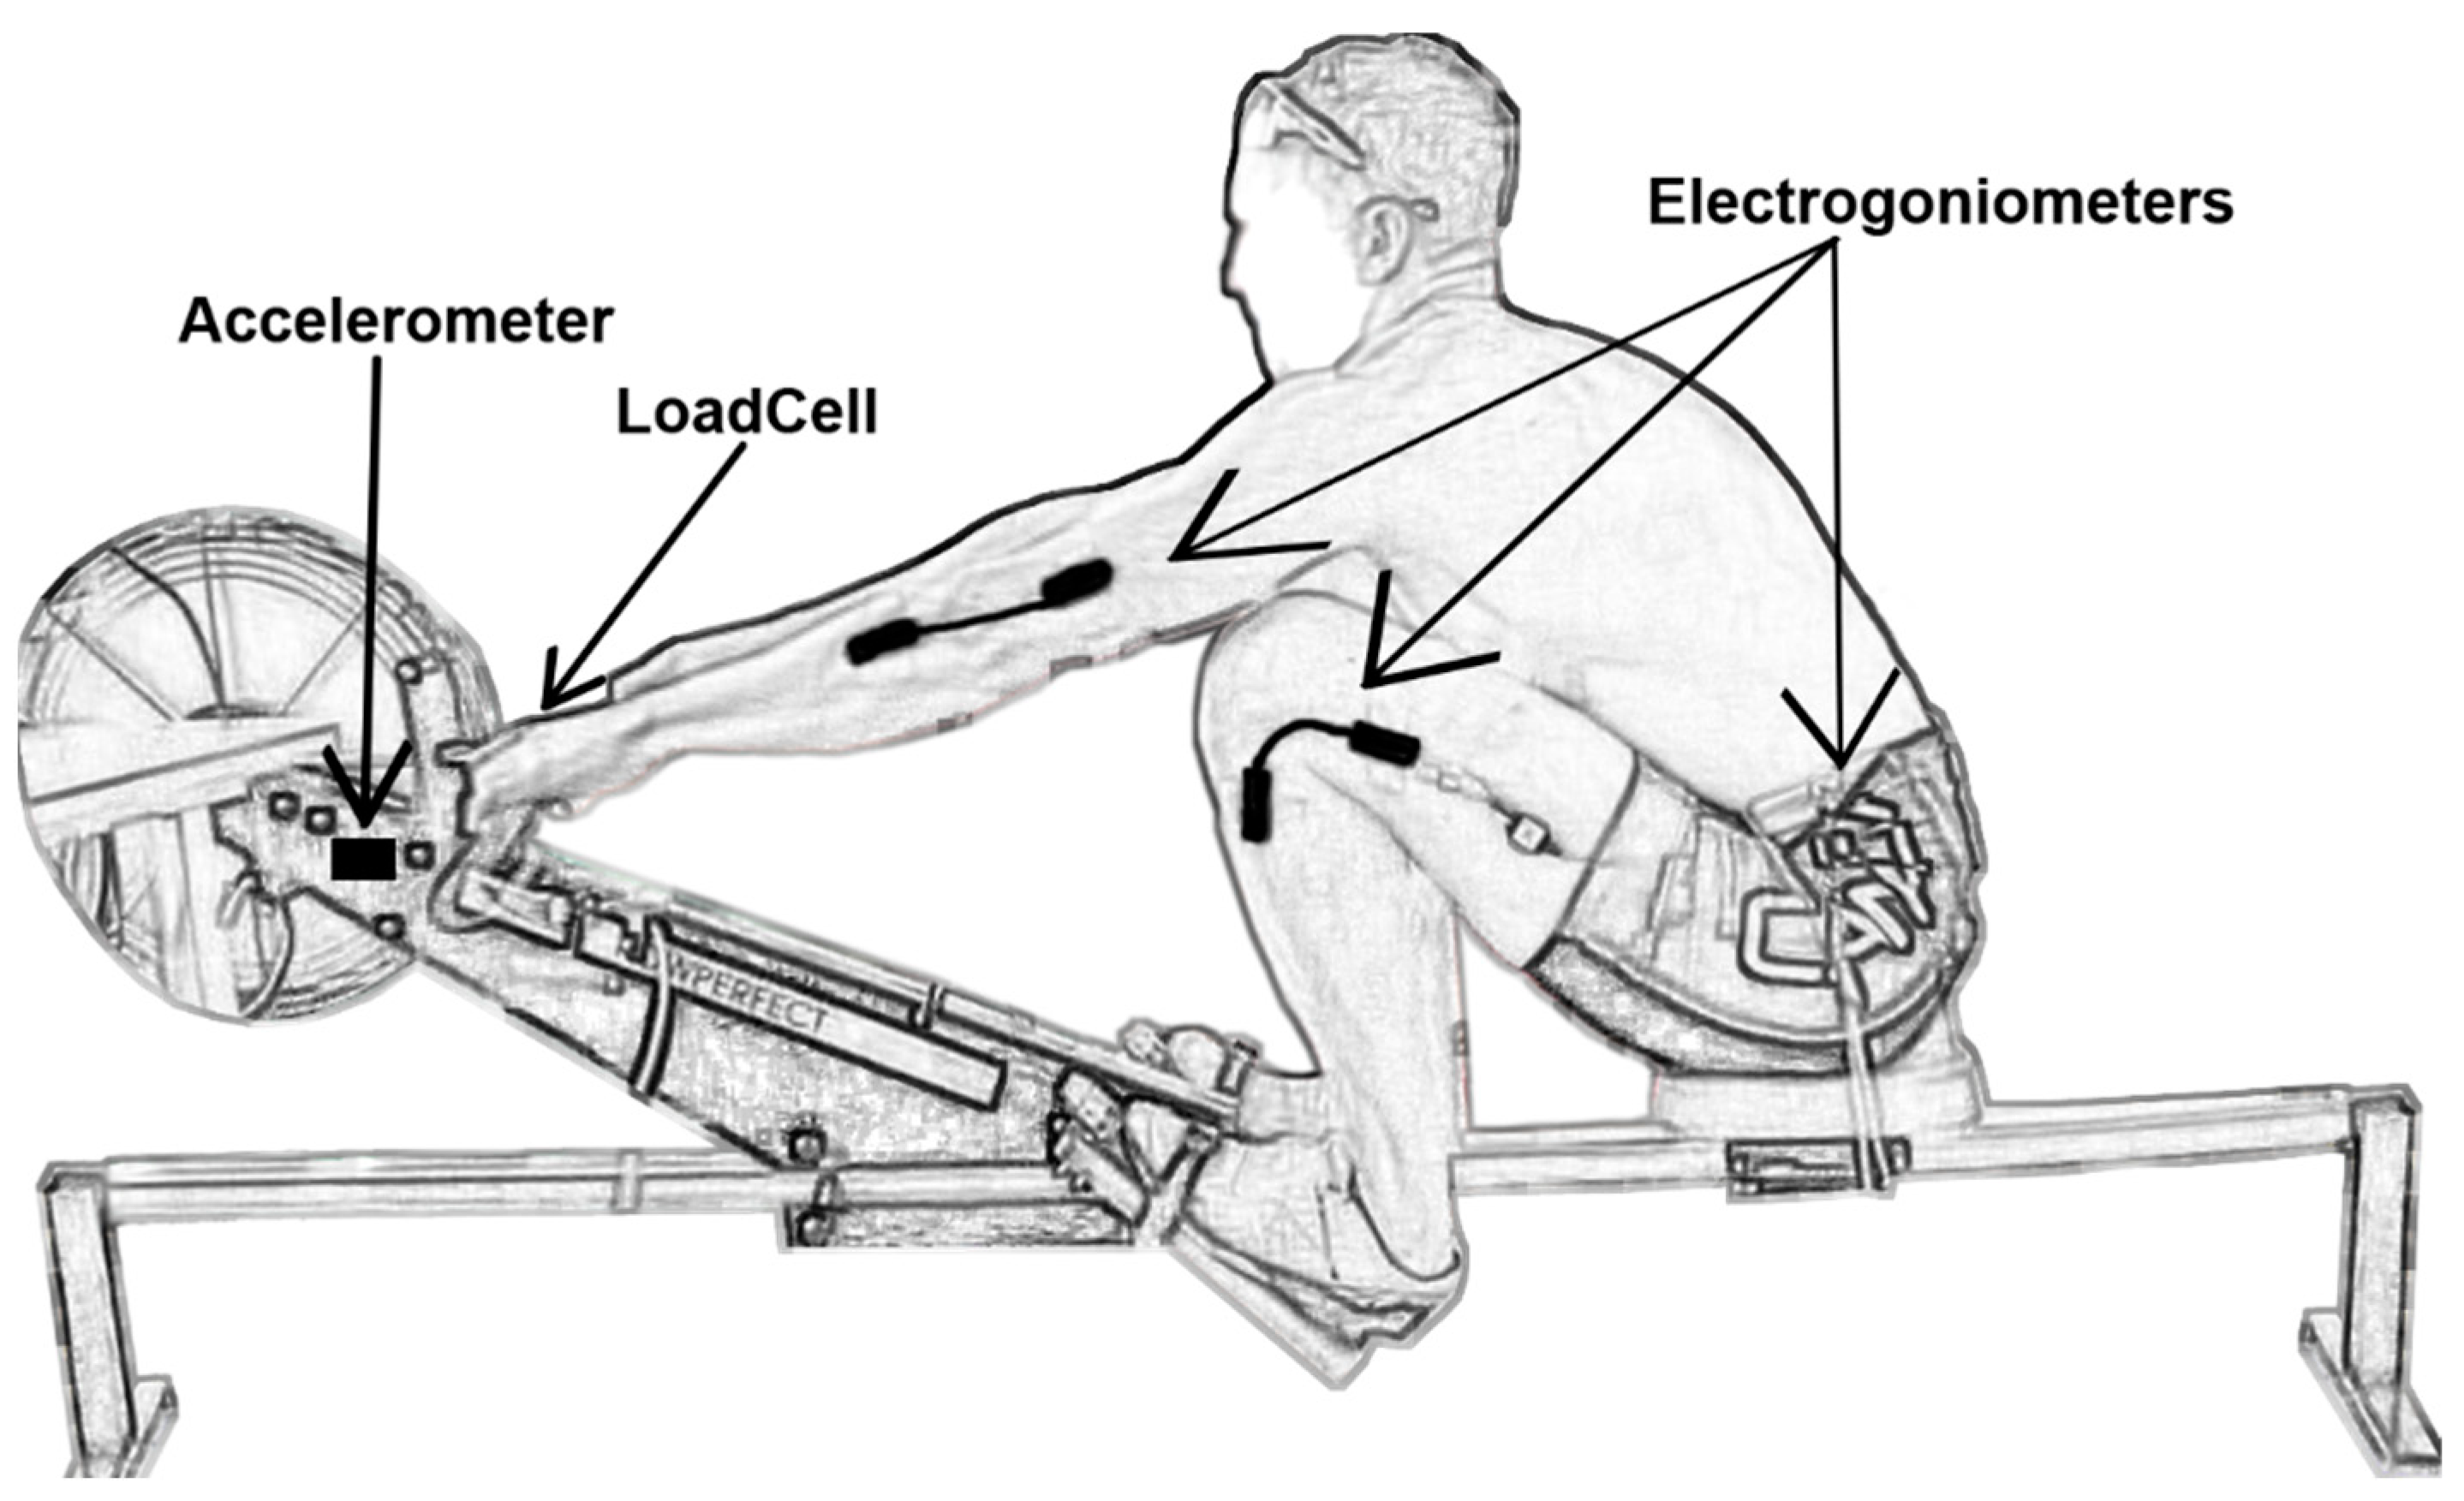
2.2. Data Collection

Angular kinematics of the elbow, hip and knee were measured using twin axis electrogoniometers (SG150; Biometrics Ltd., Ladysmith, VA, USA) (Figure 1). The goniometers were affixed to the lateral side of the joints along the long axis of the limb segments that make up the elbow, hip, and knee joint, in accordance with the manufacturer’s guidelines. Force development was measured by a compression-tension strain gauge (LC-201; Omegadyne, Stamford, CT, USA), that was placed in line between the handle and ergometer chain. A tri-axial accelerometer (ADXL-335, Adafruit, New York, NY, USA) was affixed to the flywheel unit to identify important phase transitions. The handle force, hip/knee/elbow kinematics, and accelerometer data were synchronously recorded at 2000 Hz using a 16-bit A/D converter (PCI-6034E; National Instruments, Austin, TX). Data were recorded and stored for the full timing of each 1-min interval using custom software (LabView; National Instruments, Austin, TX, USA). RP3 software was also used to record values from the RP3 and saved to the computer. Force data from the RP3 were obtained from the RP3 software and based on the relationship between linear torque and angular moment of force. First, the moment of force was calculated as the product of the known flywheel moment of inertia and angular acceleration derived from the measured flywheel velocity. Force was then calculated as the moment of force divided by the radius of the flywheel to the attached chain connected to the handle [21].
The data were synchronized with the direct-force measurement from the load cell to obtain split times for each stroke throughout. All testing was performed at the Canadian Sport Institute Pacific athlete lab, which is a climate-controlled indoor environment (Victoria, BC, Canada).

2.3. Data Analysis

Angular displacement data measured using the electrogoniometers were differentiated to calculate angular velocity of the knee, hip and elbow and filtered using a zero-lag Butterworth low-pass filter with a cut-off frequency of 10 Hz [18]. Rowing stroke data (force, joint angular kinematics) were segmented, phase-aligned and time-normalized (100 samples) for each athlete and stroke rate. To properly segment data, significant phase transitions were determined using signal changes that correlated with the catch and finish of the rowing stroke on the RP3 (Figure 2). The catch was defined as the positive zero crossing of the accelerometer signal, affixed to the flywheel head, after the peak deceleration into the catch phase followed by the peak acceleration (Figure 2). This accelerometer signal was used due to the unique movement of the RP3 as a dynamic ergometer, as the head unit can be in motion before force is initiated on the handle. The finish was defined as the first zero crossing of the force signal after a subsequent peak [22].
The PCA data reduction and reconstruction methodology is consistent with previous studies [23]. Kinematic data for the last 10 strokes for each stroke rate and athlete were compiled to form a data matrix to be subject to a principal components analysis. Data were arranged into matrix A
A = [ a 11 a 1 p a n 1 a n p ] ,
where each row represents a time series waveform for each trial for each subject and each column represents the magnitude of the values of the kinematic or kinetic variable.
Matrix A was a 300 column (3 joints × 100 angular velocities samples per stroke) × 600 row (total number of rowing strokes [12 subjects’ × 10 strokes × 5 stroke rates]) data matrix (with removed mean). From matrix A, a covariance matrix B was calculated
B = [ b 11 b 1 p b p 1 b p p ] .
The diagonal elements (bii) represent the variance at each instant of the waveform determined by calculating the mean of the ith column of A and then the average squared distance between the mean and each n waveform values at that time
b i i = k = 1 n ( x k i x i ¯ )   2 n 1 ,
The principal components are extracted from the covariance matrix B by transforming the original covariance matrix through orthogonal decomposition
UtBU = D,
U is the orthogonal transformation matrix that brings the data into the new coordinate system, which are the principal components. The columns of U are the eigenvectors of B and considered the weightings. The eigenvalues (loading scores) of B were determined from the diagonal covariance matrix elements of D and represent the variation associated with each principal component. U is then used to transform the original data into the new principal components (Z)
Z = [ X X ¯ ] U
Each column of Z are the kinematic PC weightings (Kpc,w) and the eigenvalues of B are the kinematic loading scores (Kpc,ls). The relative proportion (%) of the kinematic joint movement (pattern) explained by each PC was given by eigenvector × B (covariance matrix).
To visualize the impact of different kinematic strategies on each performance metric separately, kinematic patterns were reconstructed from the sum of the products of the PC weighting and PC loading score for each rowing stroke. First, a number of PC were selected for analysis that individually accounted for ~5% of the total variance and together accounted for ~80% of the total variance. Then, separate ANCOVAs were run for each performance variable (peak force, impulse, split time) as the dependent variable and the kinematic loading scores (Kpc,ls) as covariates with athlete/stroke rate as fixed factors. For each performance metric (peak force, impulse, and split time), if the Kpc,ls from the ANCOVA had a significant effect on the factor, then the product of the PC weightings and Kpc,ls were used to reconstruct the kinematic measure with the top 100 (best) and bottom 100 (worst) strokes based on each performance metric. If the Kpc,ls had no significant effect on the factor, then the mean Kpc,ls for each PC weighting was used to reconstruct the kinematic factor [18]. Thus, the main kinematic features that occurred with the best and worst values for the given performance metrics were used to reconstruct each kinematic pattern. The relationship between PC1 loading score and split time was further analyzed with plotting of a regression line, for either the individual athlete or stroke rate (Figure 3 and Figure 4.

2.4. Statistics

The PC data matrix A was used to perform separate ANCOVAs for each performance measure, and the Shapiro–Wilk test was used to evaluate the distribution of data in SPSS (Version 20, IBM, Chicago, IL, USA). This enabled the determination of the significant features of the kinematic patterns to be used to reconstruct kinematic variables. Linear regression (Pearson correlation coefficient) was performed on the relationship of PCs and performance variables, for either the individual athlete or stroke rate (Figure 3 and Figure 4). The mean values for performance metrics are presented with the associated standard deviation (mean ± SD). The mean difference for the top and bottom 100 associated with each performance metric used in PCA data reconstruction is presented with the associated confidence limits at the 90% confidence level (mean [lower limit to upper limit]). Sample size power was calculated post hoc using mean split time between stroke rate 20 and stroke rate 36 using SPSS.

3. Results

To explore relationships between kinematic patterns and stroke-performance variables, joint angular velocities of the hip, knee and elbow were entered into principal component analysis (PCA) and separate ANCOVAs were run for each performance variable (peak force, impulse, split time) with dependent variables and the kinematic loading scores (Kpc,ls) as covariates with athlete/stroke rate as fixed factors. Kinematic patterns were then reconstructed based on significant PCs for each performance variable. We hypothesized that this method would be able to differentially quantify key kinematic features related to different performance metrics in this elite cohort such that the reconstructed kinematics would be based on a different subset of PCs dependent on which performance variable was targeted.

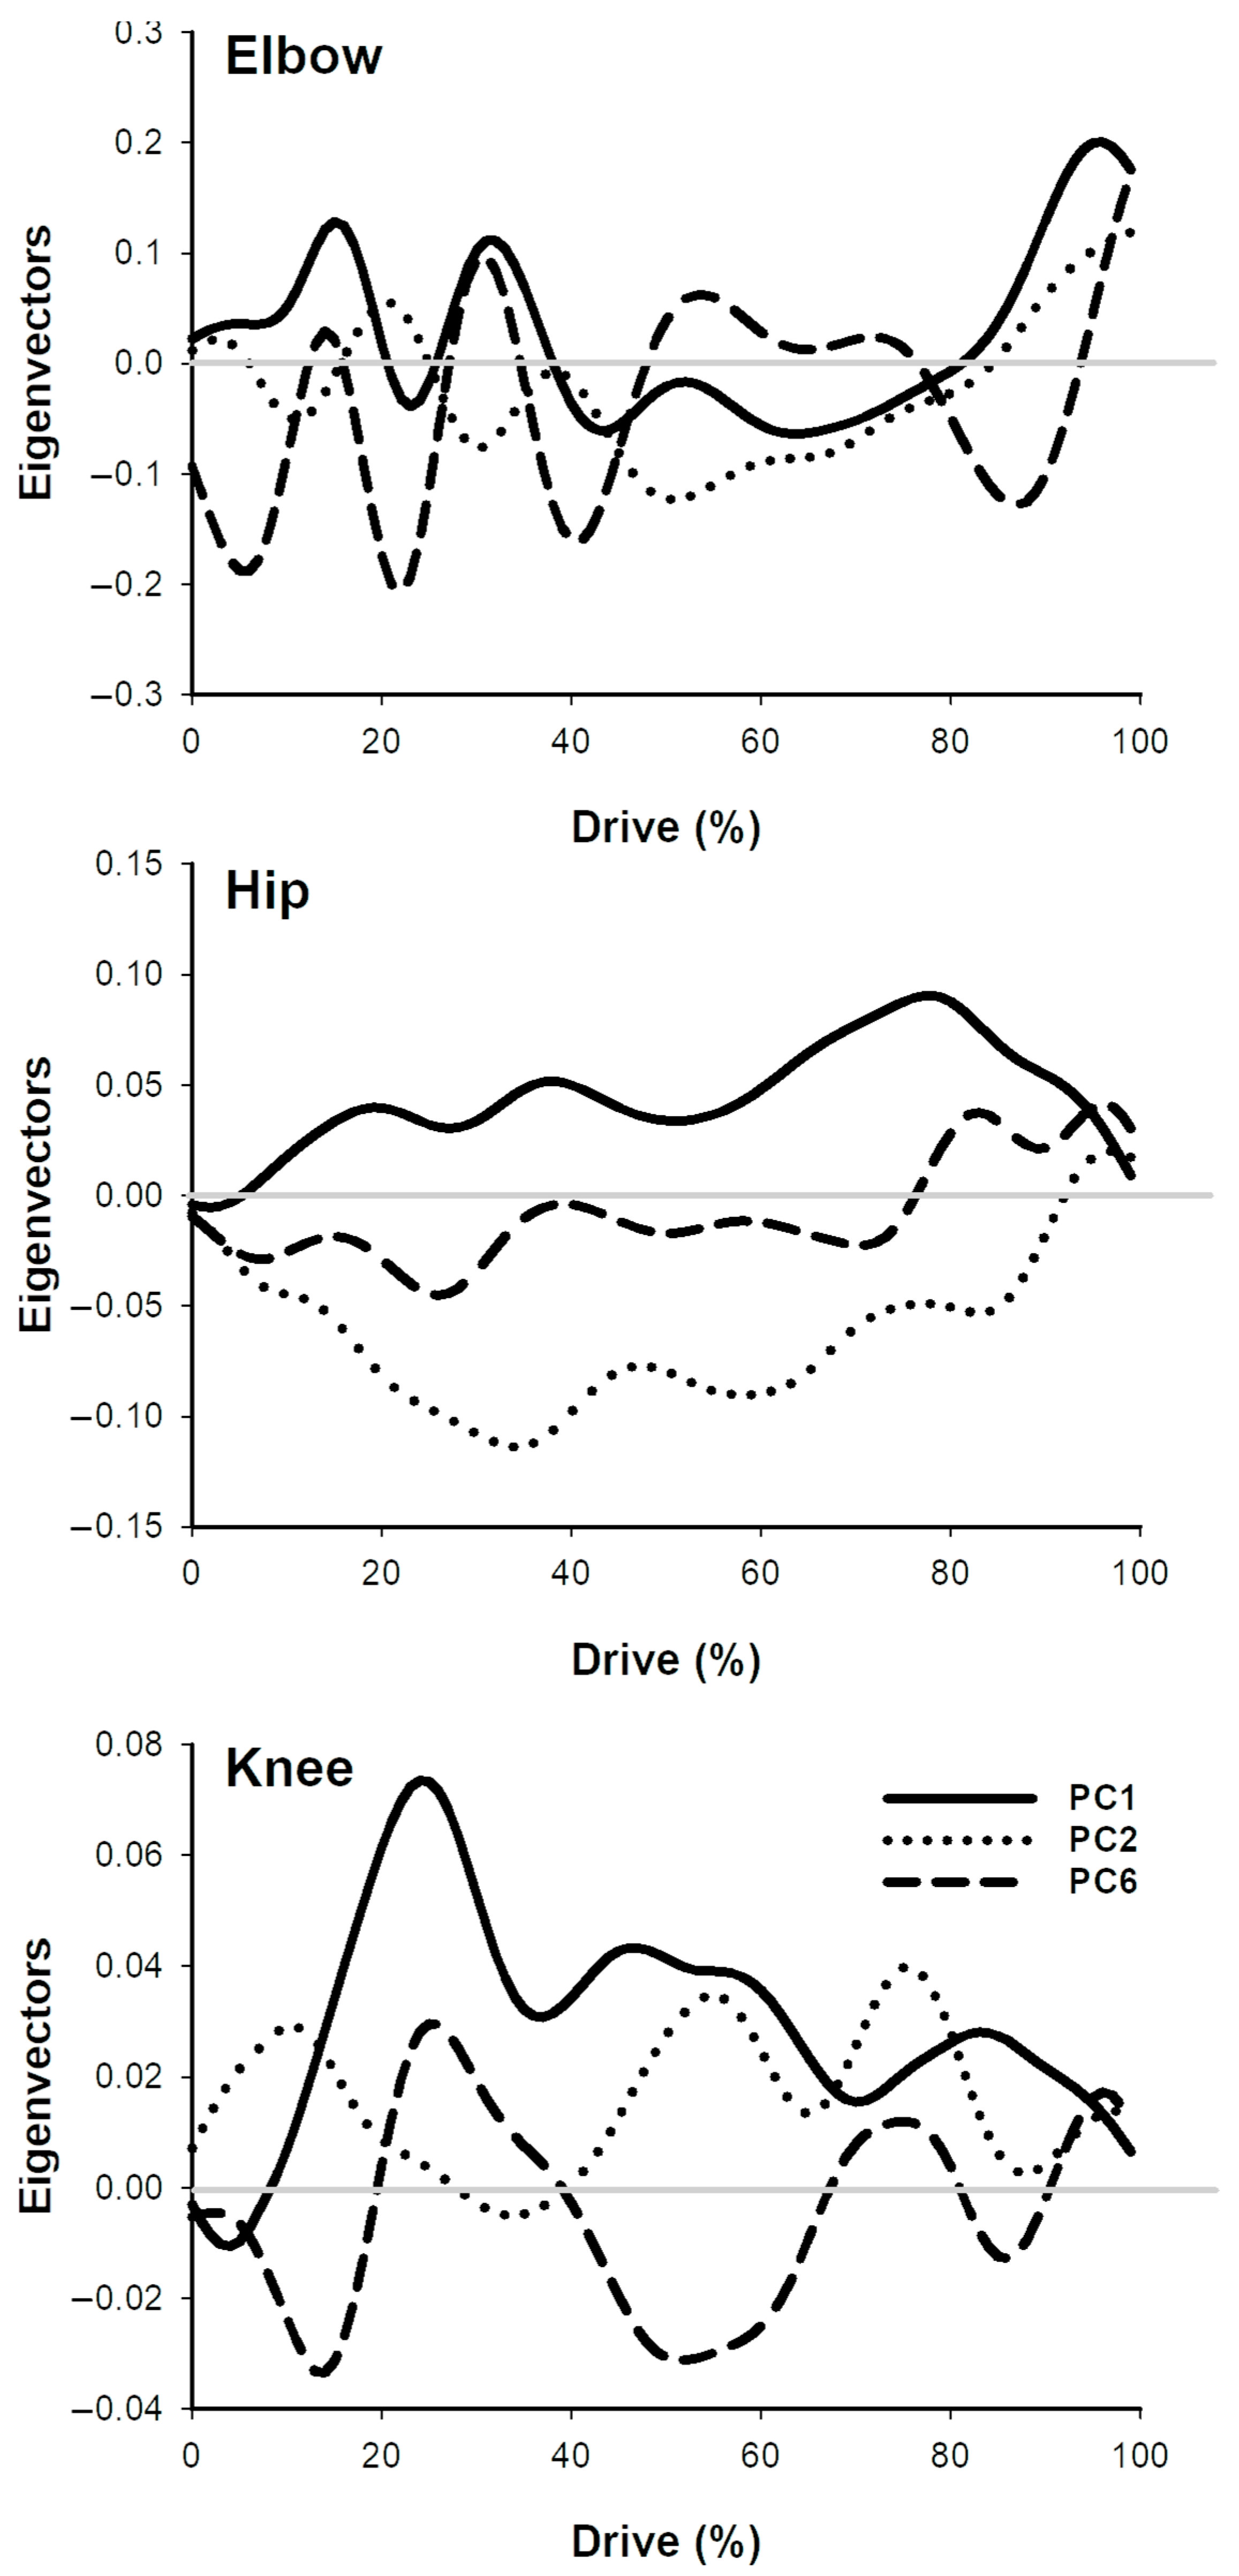
3.1. Principal Components Analysis

The first seven PCs accounted for 79.5% (PC1 [26.4%], PC2 [14.6%], PC3 [11.3%], PC4 [8.4%], PC5 [7.5%], PC6 [6.5%], PC7 [4.8%]) of the variance in the signal. The PCs contributing significantly (p ≤ 0.05) to performance metrics based on PC loading scores from an ANCOVA were (PC1, PC2, PC6) (Figure 5 for split time, (PC3, PC4, PC5, PC6) for impulse, and (PC1, PC6, PC7) for peak force. The PC scores identified represent the factors that are most important for high peak force, high impulse, and low split times. The significant PCs for each mechanical factor were used to reconstruct elbow, hip, and knee angular velocity patterns (Figure 6). The reconstructions show the pattern of joint angular velocity associated with the best and worst performances [e.g., top 100 strokes representative of fastest split times (solid line) and bottom 100 strokes representative of the slowest split times (dashed line)] as it relates to each performance metric.

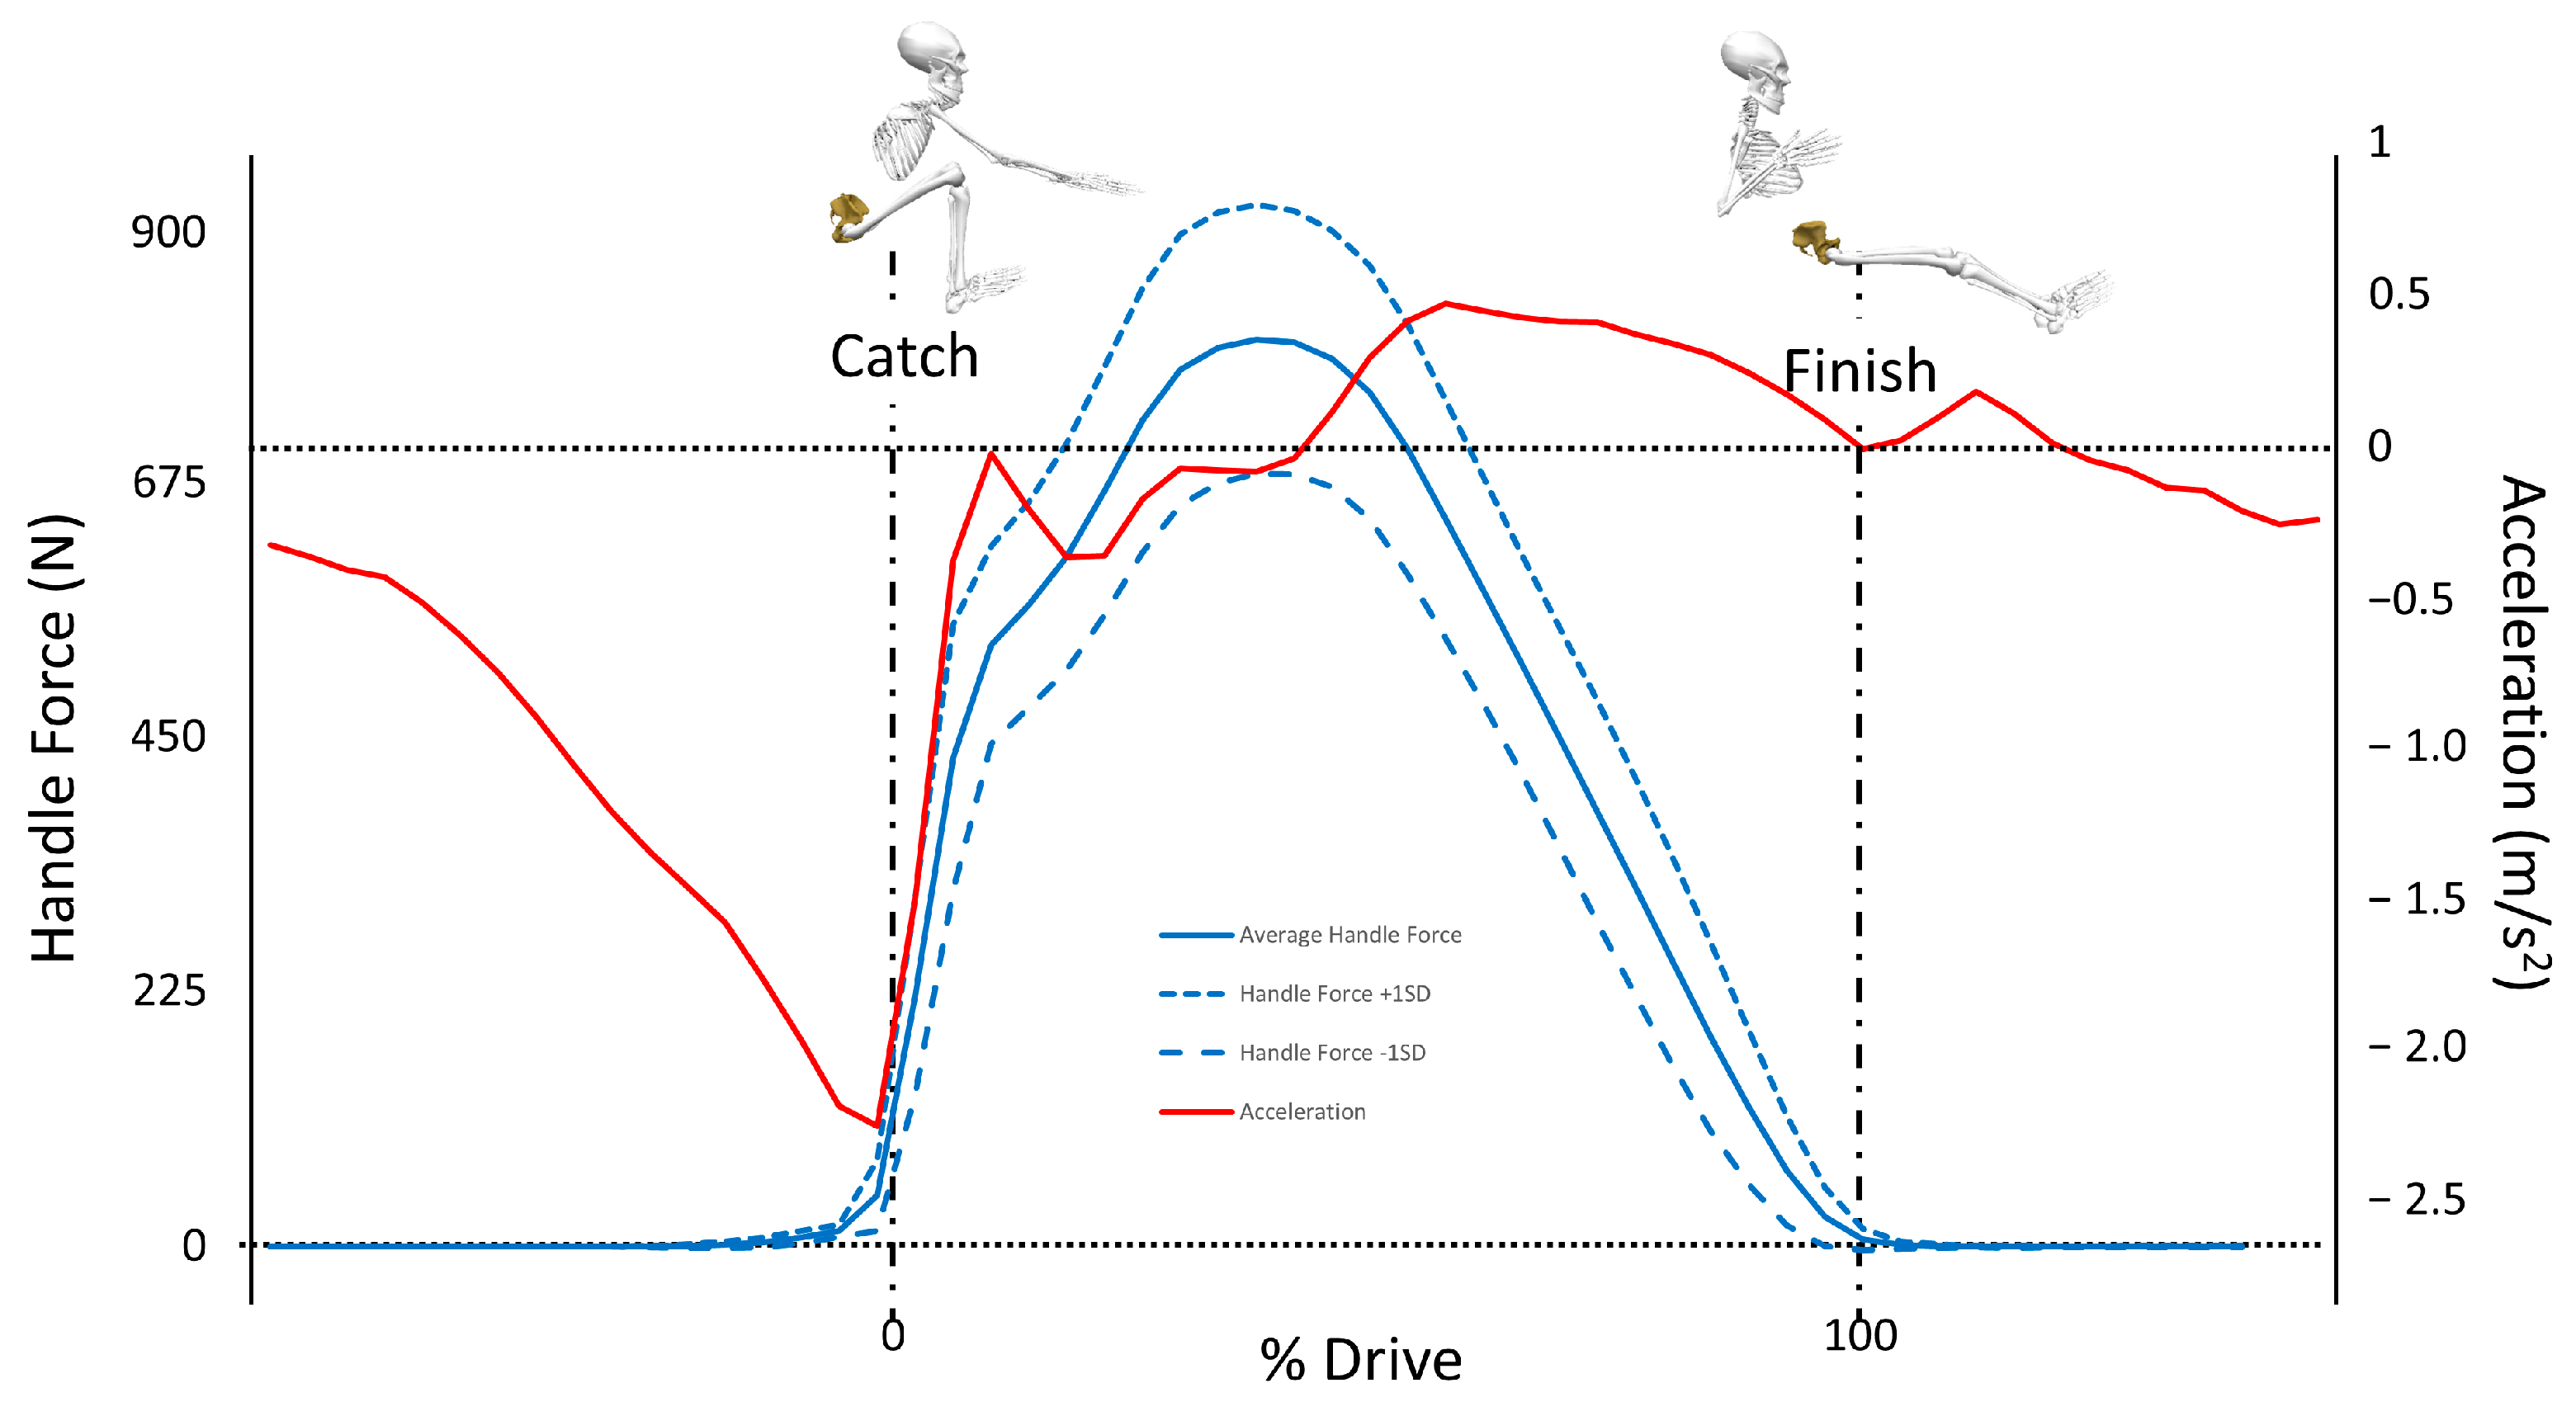
3.2. Mean Kinematic Patterns

The description of patterns for each segment are described here.
Elbow: During the initial 35–40 percent of the drive, there is a rapid oscillation in flexion angular velocity at the elbow during the initial phase of force development in the early drive. This is followed by a rapid and consistent increase in elbow flexion angular velocity beginning at ~35% of the drive and reaching a peak at 75% of the drive.
Hip: Immediately at the catch of the stroke, the hip demonstrates initiation of hip extension. During the initial 35% of the drive, there is a sharp increase in hip extension angular velocity. The peak hip extension angular velocity is reached at approximately 40% of the drive and this velocity is maintained until 75% of the drive at which point the hip extension velocity decreases towards the finish of the drive. The pattern of hip extension angular velocity follows the pattern of force generation at the handle.
Knee: At the catch of the stroke there is a rapid increase in the knee extension angular velocity that quickly reaches a peak at ~15% of the drive which coincides with the first initial peak of the force curve. The knee extension angular velocity is maintained until a second (maximum) peak at 25% of the drive at which point the knee angular velocity steadily decreases to zero in a curvilinear manner.

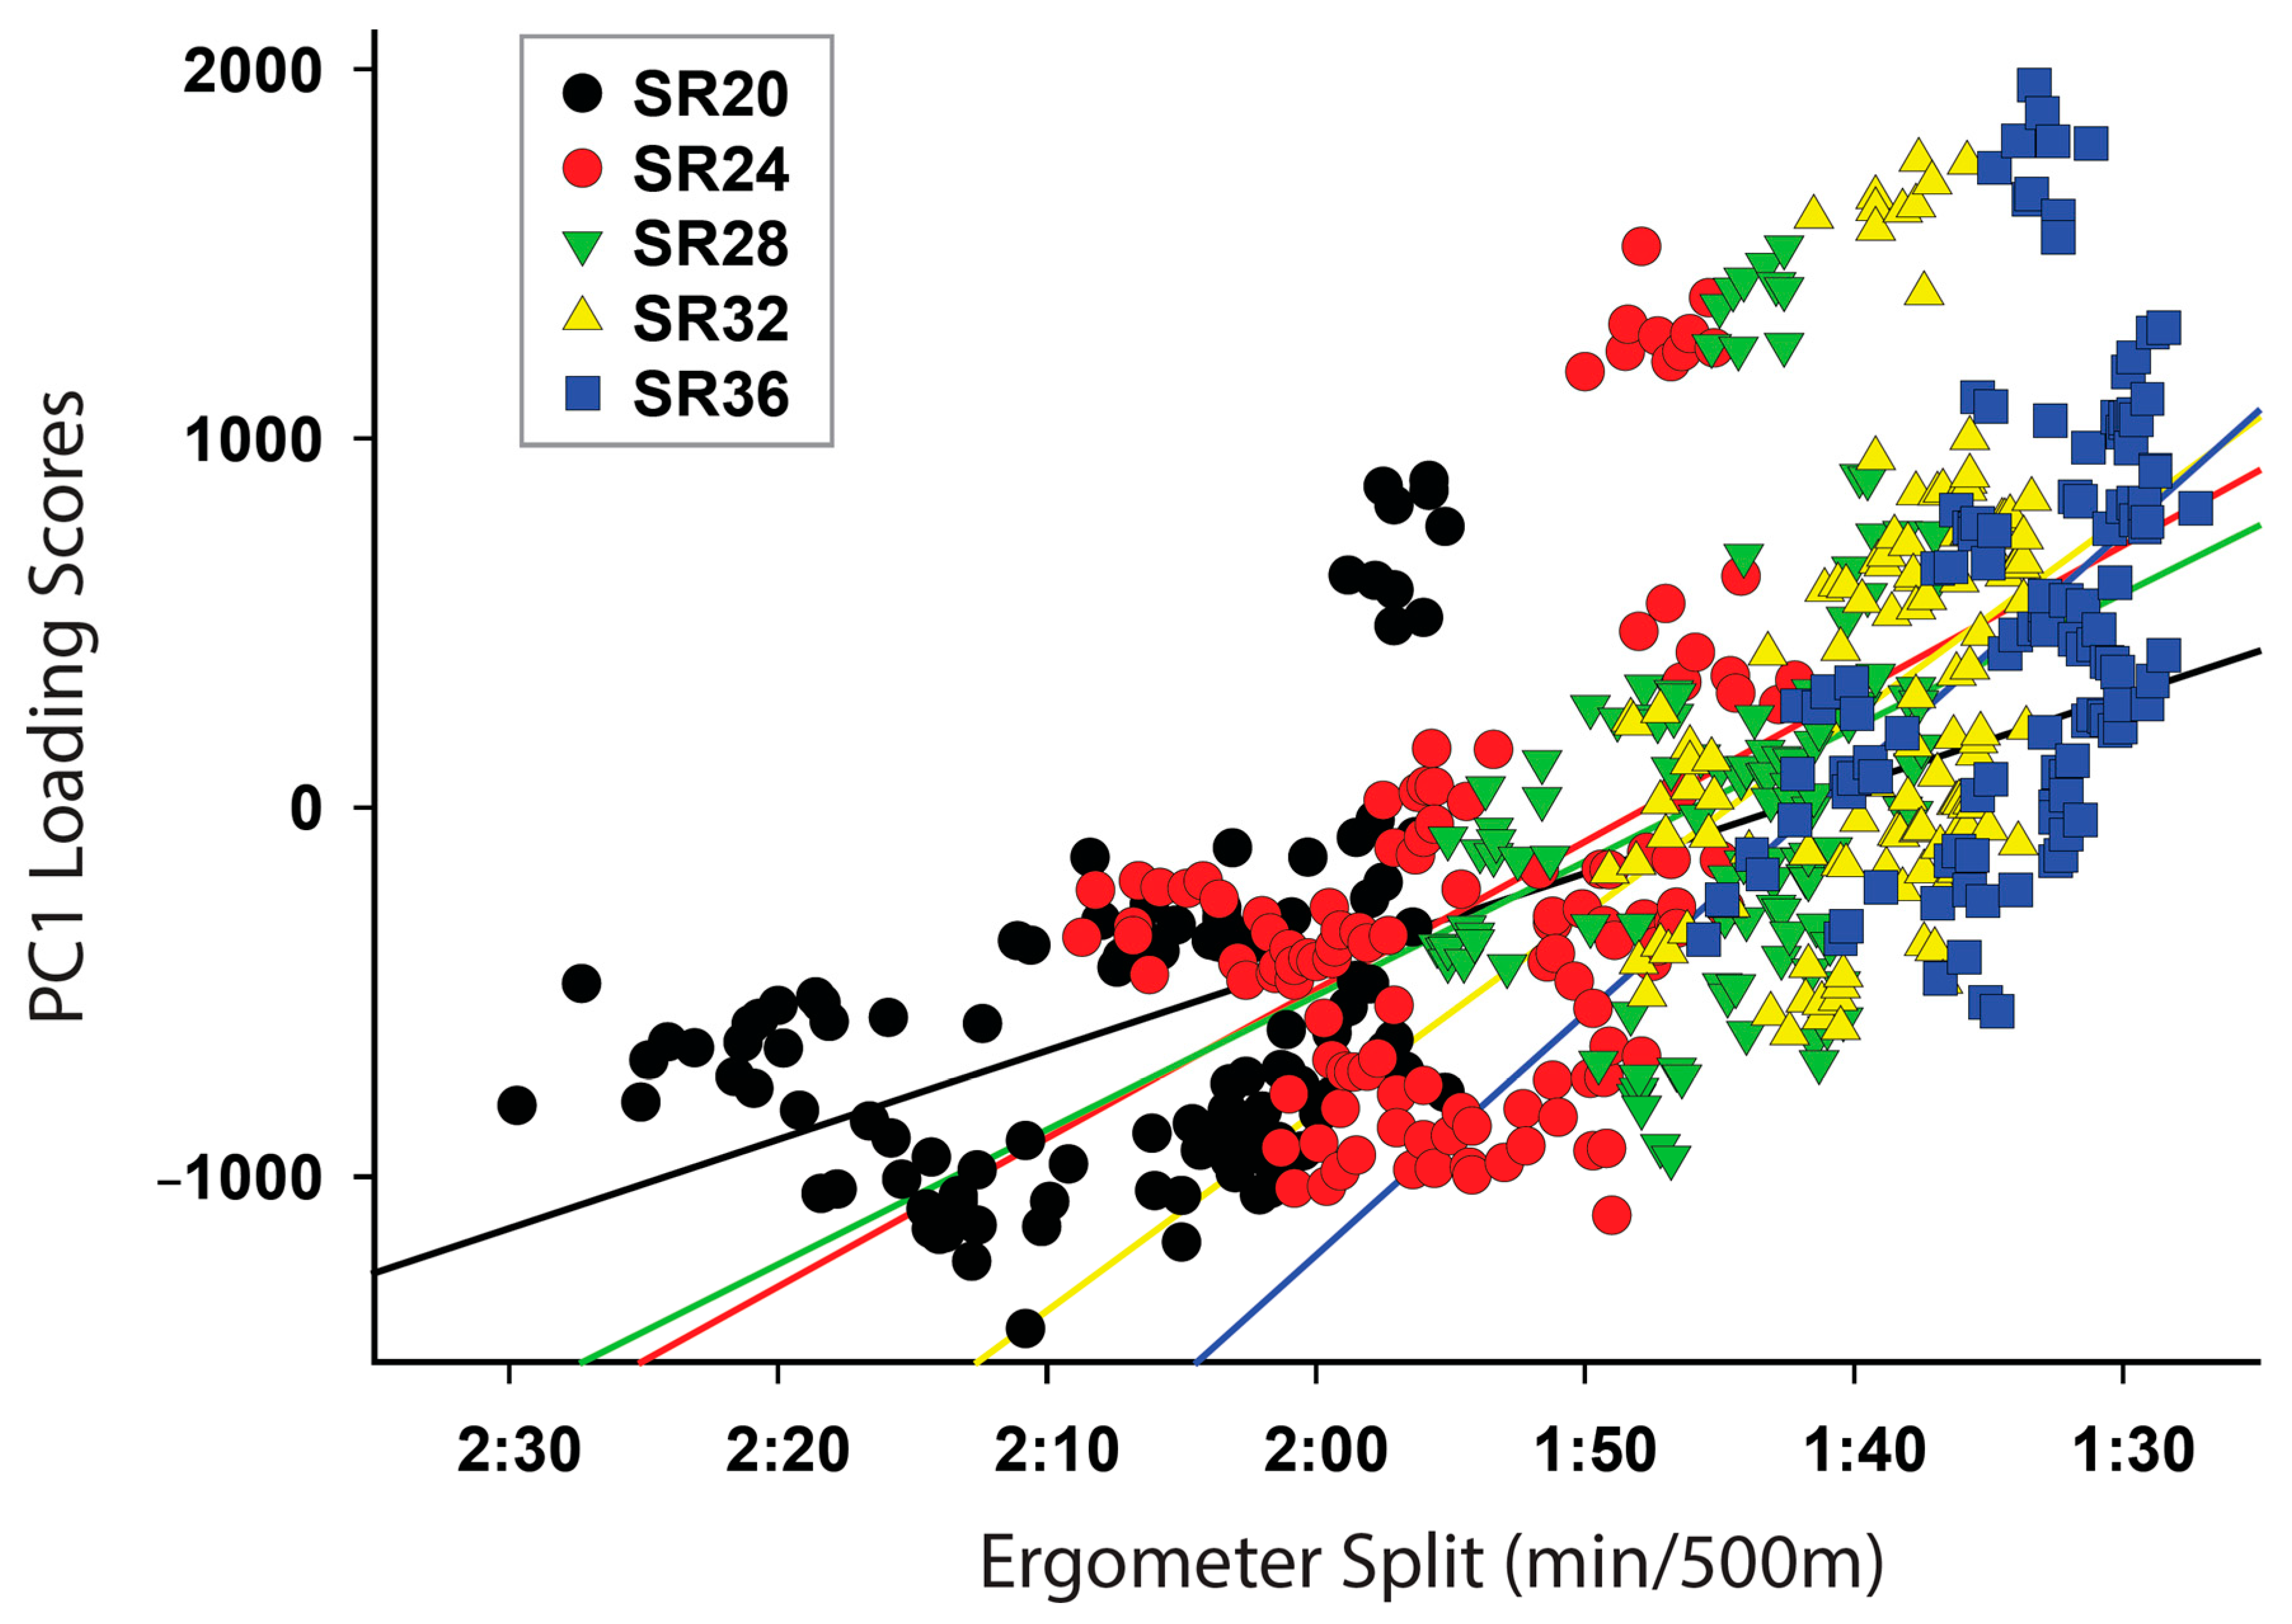
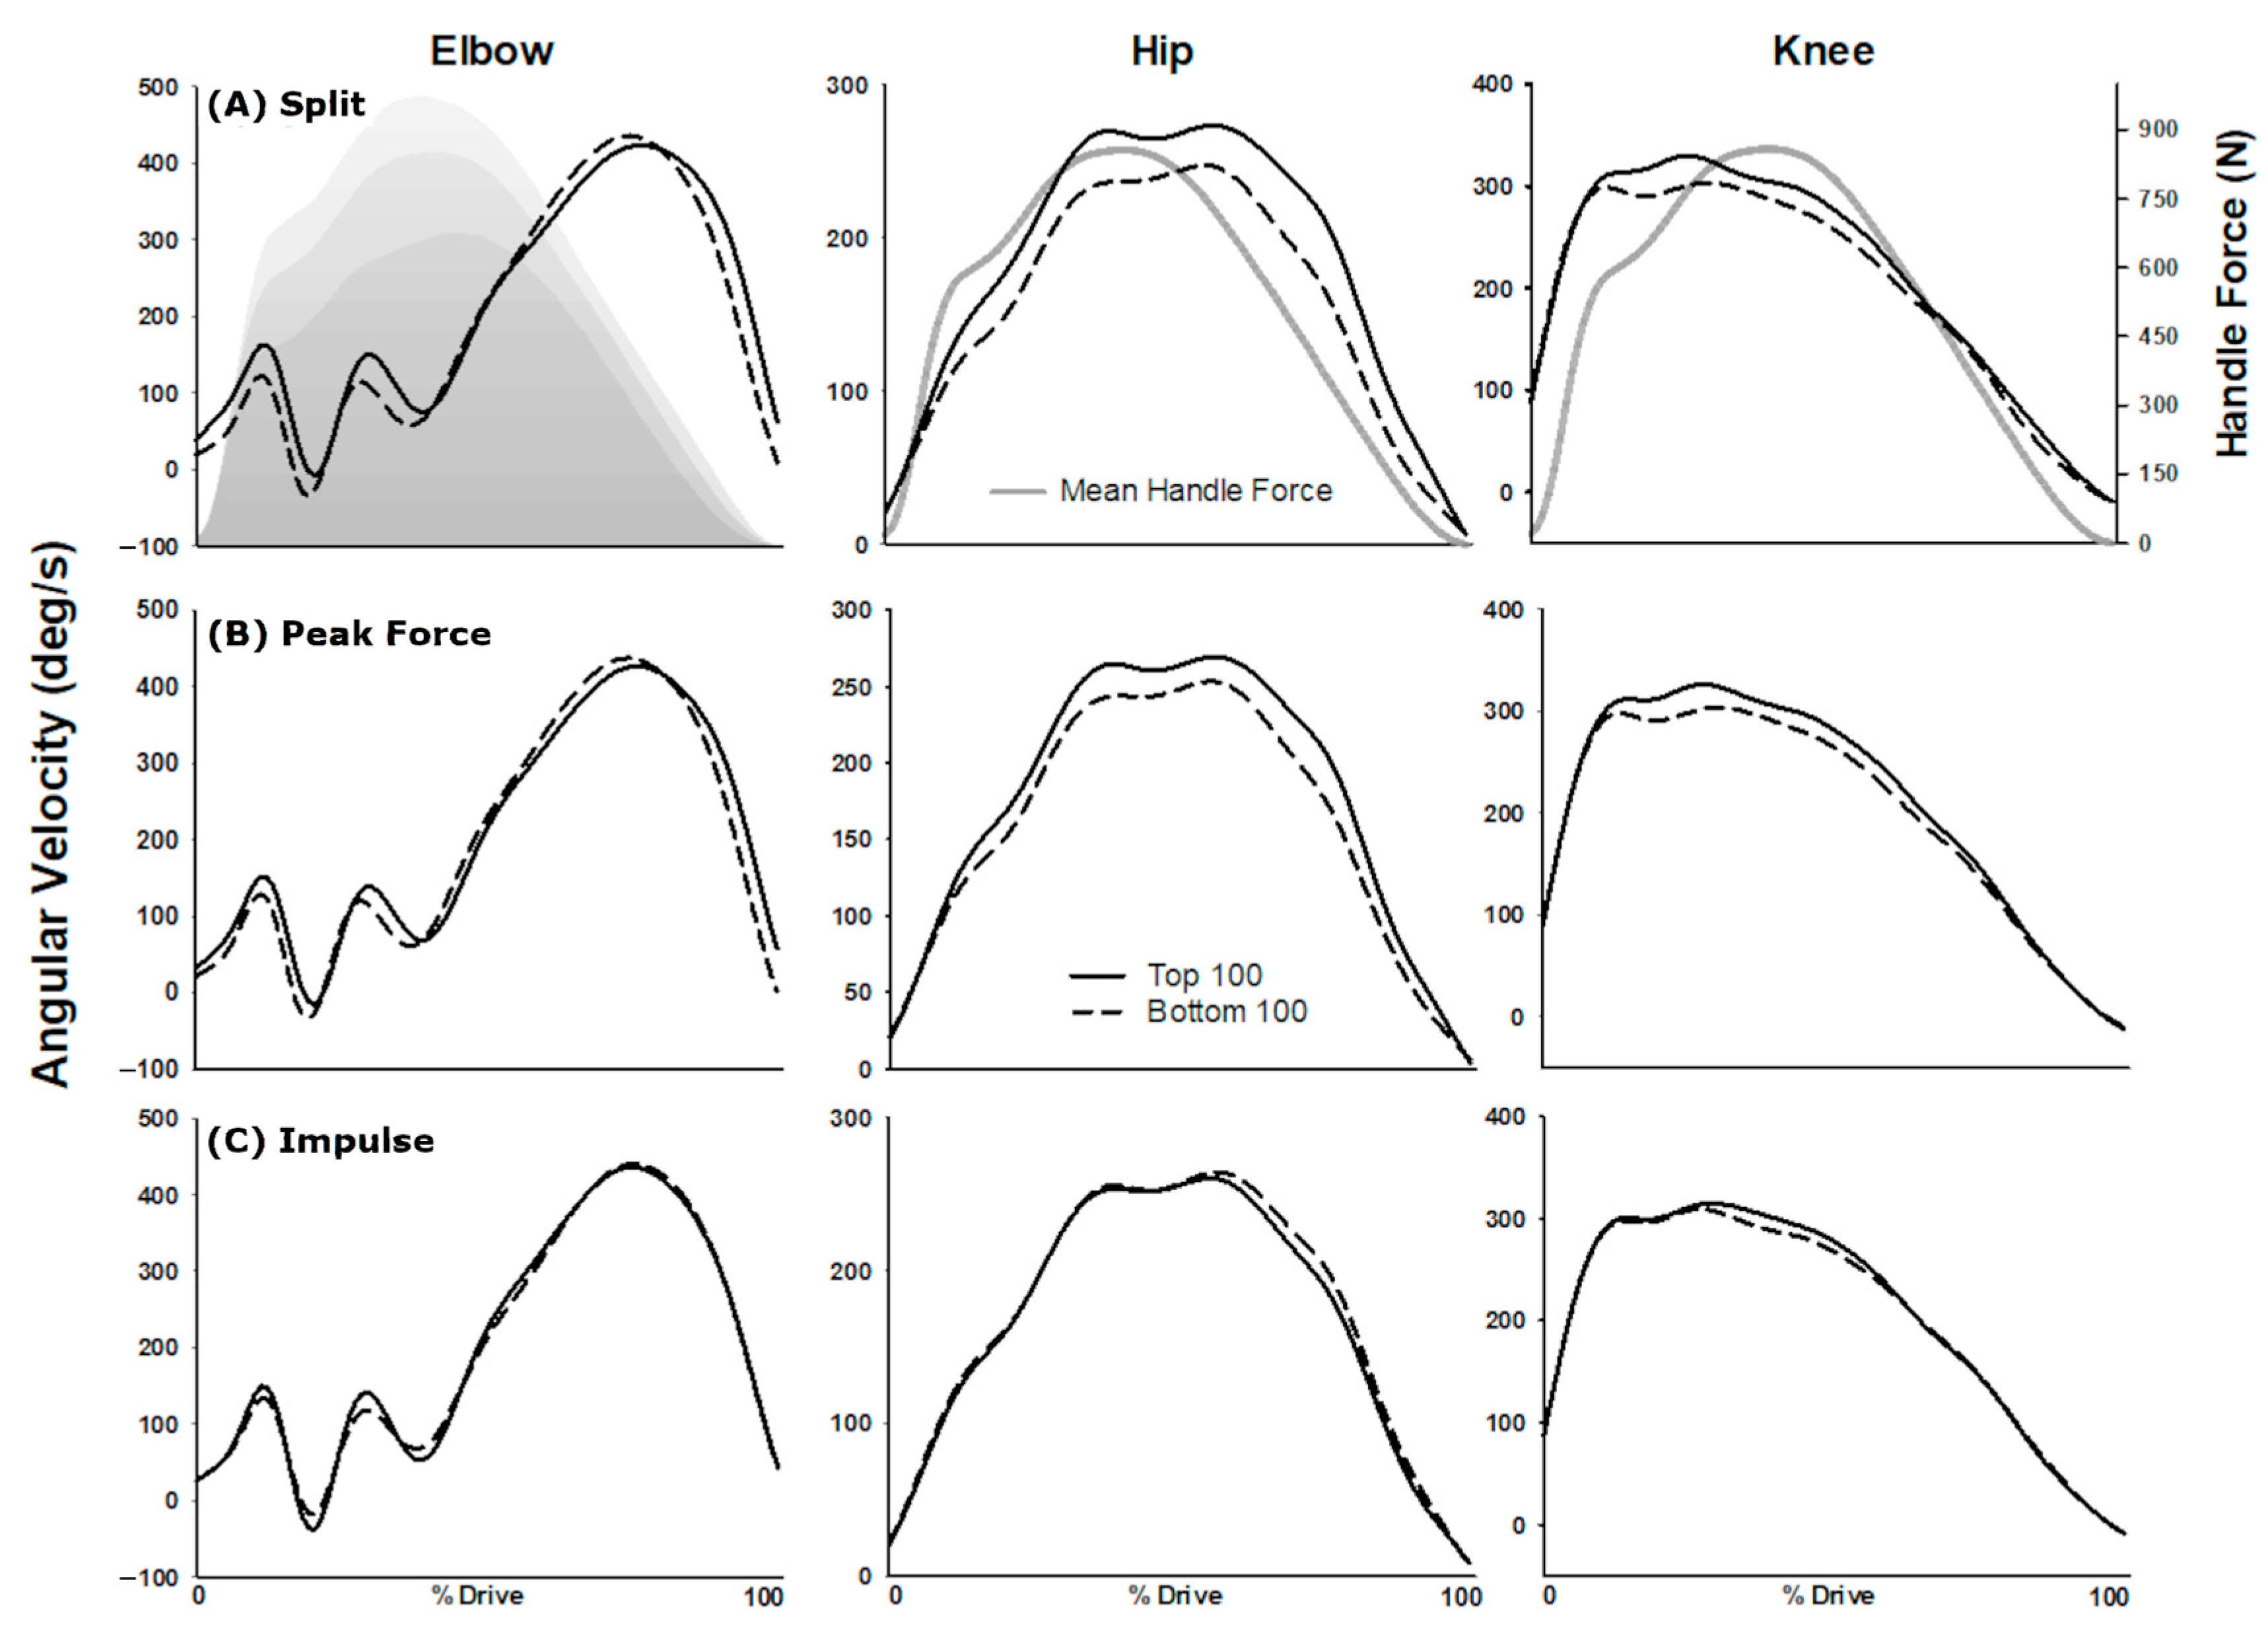
3.3. Stroke Kinematics Differentiated by Split Times

Figure 6A shows the reconstruction of the elbow, hip, and knee angular velocities during the drive of the rowing stroke. The strokes with the fastest split times (solid) show hip extension angular velocity is faster (9.5%) than those with slower split times. The faster strokes show faster knee angular velocity (8.1%) than the slower strokes beginning at approximately 15% of the drive and differentiate the two stroke-speed groups throughout the drive until approximately 95%. The mean split time for each of the stroke rates (20, 24, 28, 32 and 36 spm) were 136.8 ± 8.5, 124.3 ± 6.4, 114.8 ± 4.9, 109.1 ± 4.1, 103.7 ± 4.1 (s/500 m), respectively. The mean of the fastest and slowest 100 strokes were 101.9 [101.6 to 102.2 s/500 m] and 139.5 [138.3 to 140.7 s/500 m], respectively.

3.4. Stroke Kinematics Differentiated by Peak Force

When joint angular velocities were reconstructed based on their relationship to peak force (Figure 6B) the strokes with the highest peak force (solid) show hip extension angular velocity is faster (5.9%) than those with the lower peak force. The strokes with a higher peak force show faster knee angular velocity (6.9%) than the strokes with the lower peak force beginning at approximately 15% of the drive and differentiate the two stroke groups throughout the drive until approximately 80%.

3.5. Stroke Kinematics Differentiated by Impulse

Figure 6C shows reconstruction of joint angular velocities based on 100 strokes with the largest stroke impulse (solid) and 100 strokes with the smallest stroke impulse (dashed). Elbow, hip, and knee angular velocity patterns do not demonstrate notable differences in the movement pattern or in amplitude of angular velocity between large and small impulse groups.

3.6. Handle Force

The mean force at the handle is overlaid in grey in Figure 6A. Overall the force at the handle shows an initial sharp rise in force occurring at the handle until approximately 15% of the drive at which point the rate of increase in force decreases until the peak force occurs at approximately 40% of the drive. The mean peak force for each stroke rates (20, 24, 28, 32 and 36) were 771.2 ± 137.0, 860.6 ± 147.1, 913.9 ± 117.3, 934.2 ± 114.6, and 948.8 ± 107.3 N, respectively. The mean impulse for stroke rates (20, 24, 28, 32 and 36) were 295.6 ± 41.6, 303 ± 34.1, 298.7 ± 22.6, 292.0 ± 21.7, and 285.3 ± 21.1 N.s, respectively. The mean of the largest and smallest 100 peak forces at the handle were 1093.0 [1084.7 to 1101.2N] and 675.9 [663.5 to 688.2N], respectively. The mean of the largest and smallest 100 impulses were 338.8 [337.1 to 340.4N.s] and 246.6 [244.3 to 248.8 N.s], respectively.

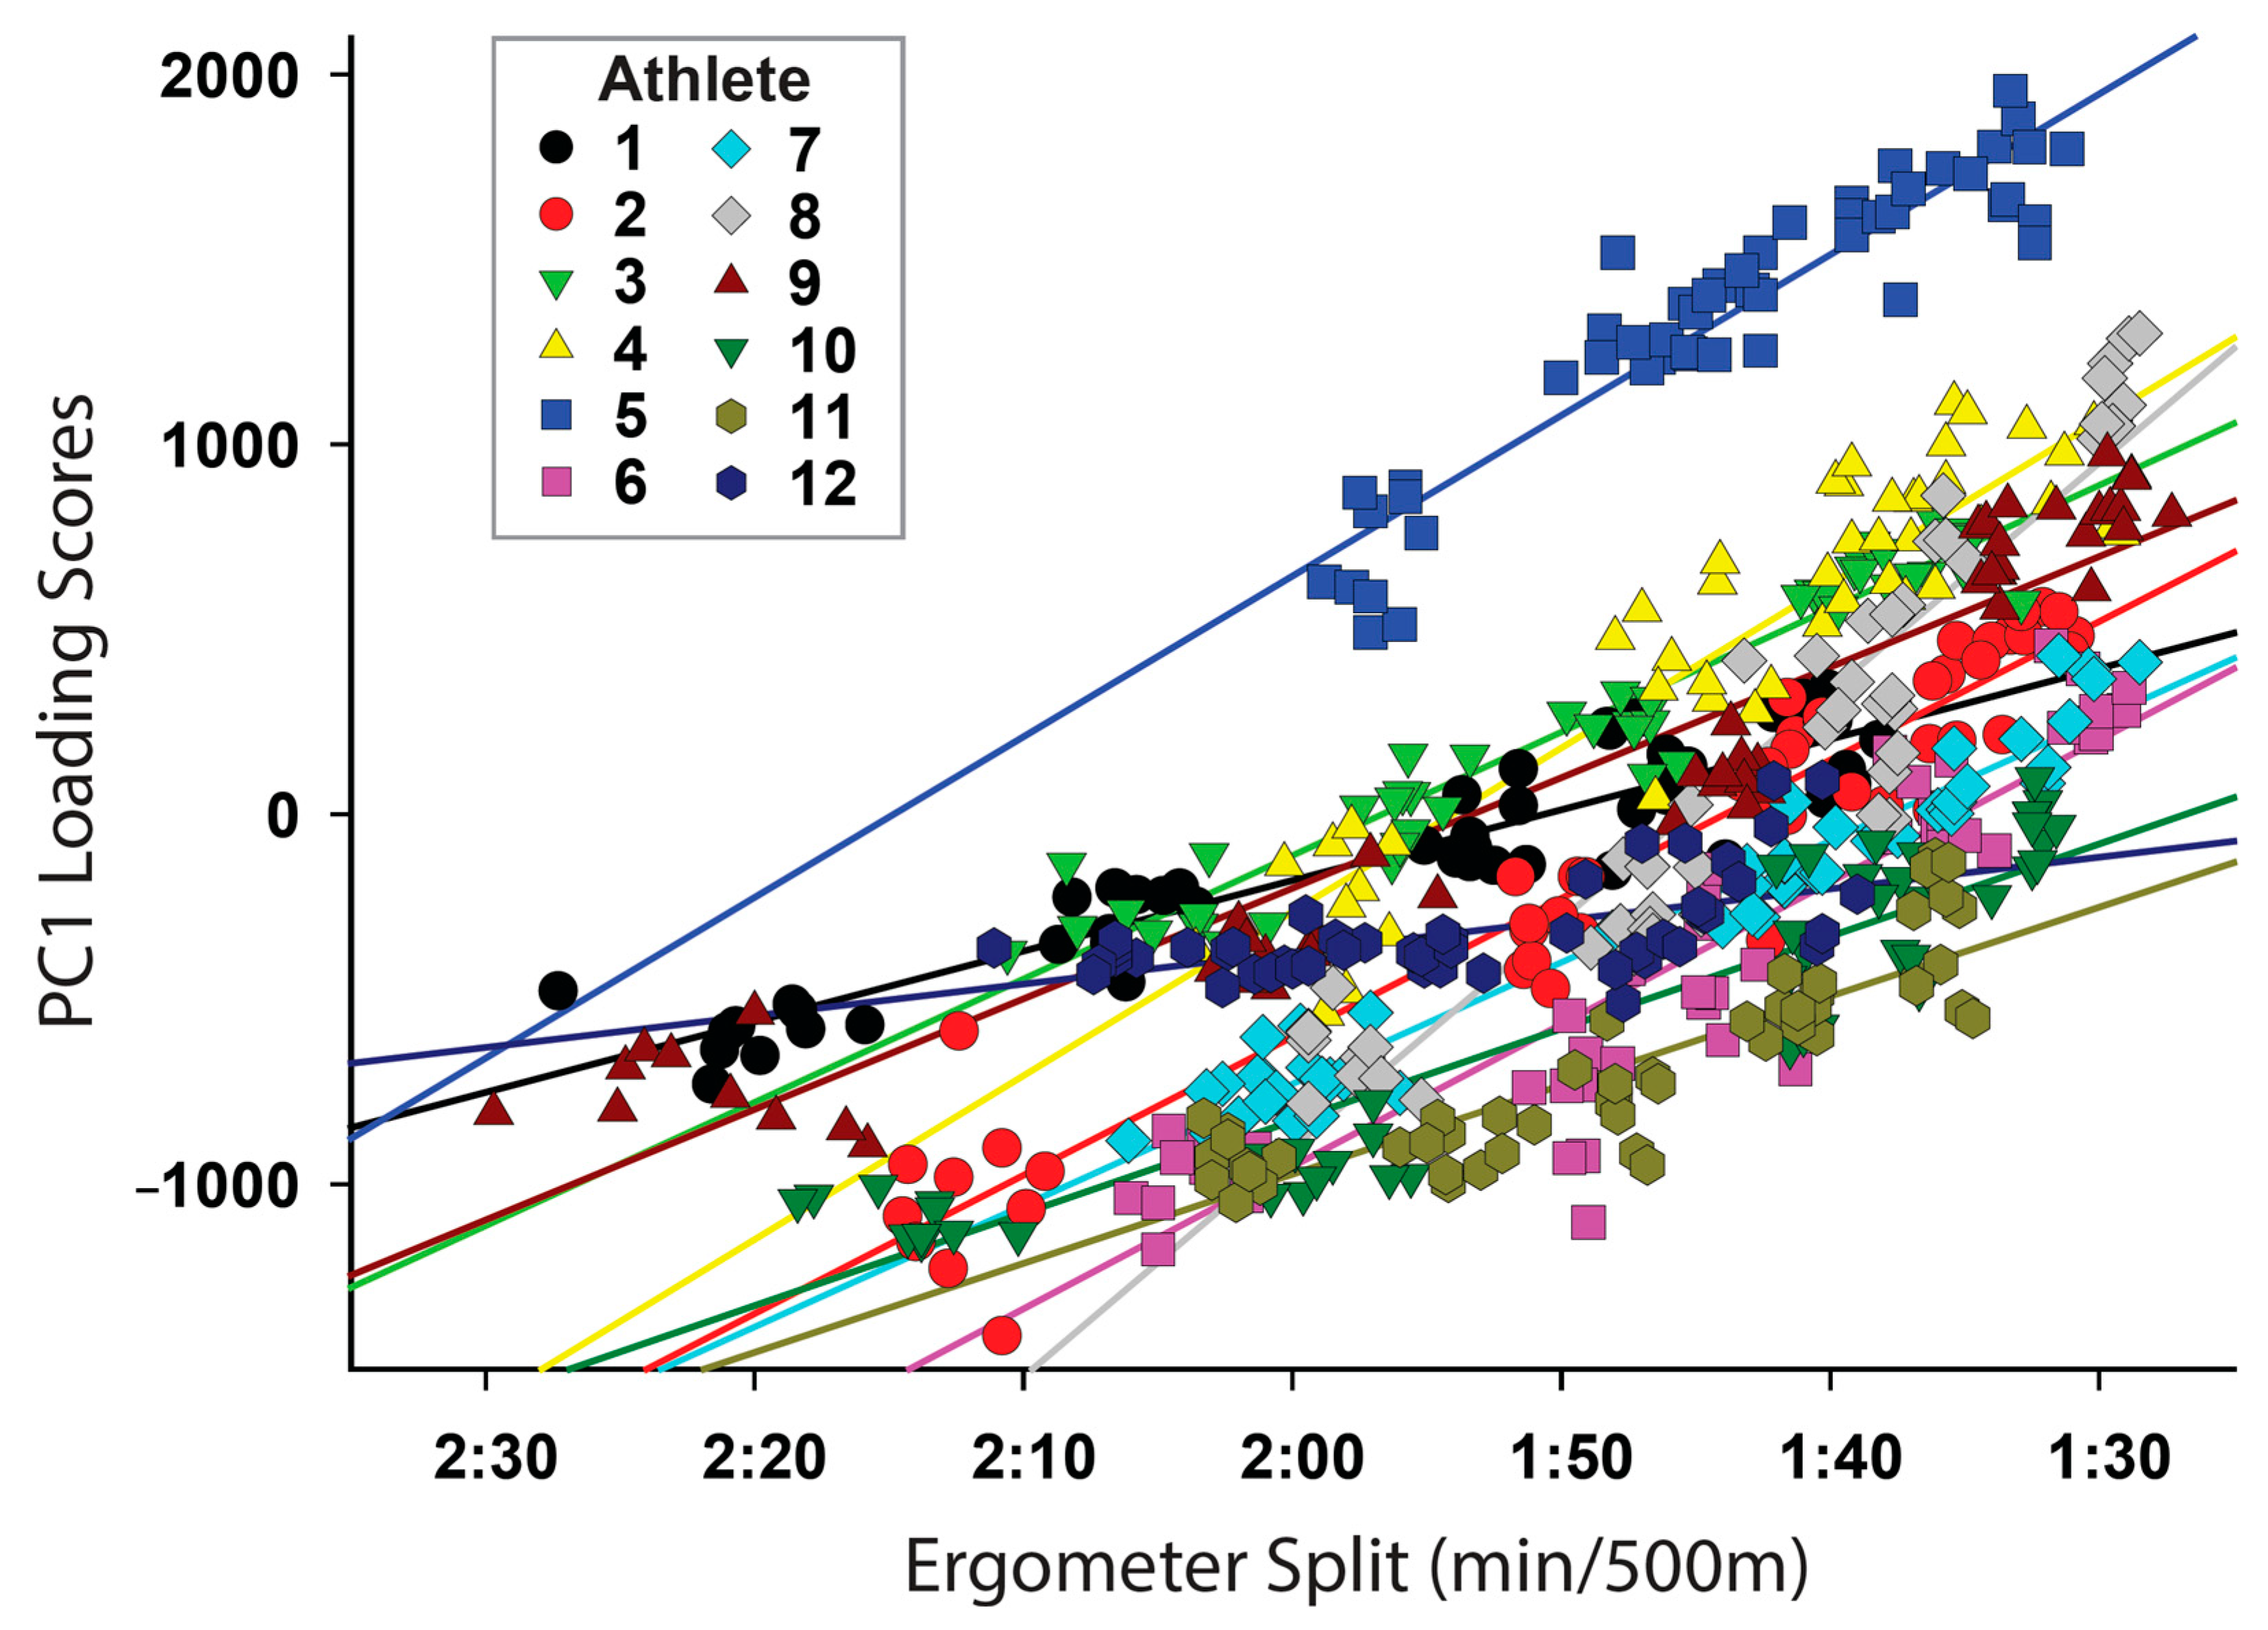
3.7. Performance Variable and Individual Athlete Kinematic Association

While each variable of split time, peak force and impulse were used separately in the reconstruction, a correlation between these variables was performed to show the association between these variables. The correlation between split time and peak force was −0.73, while impulse had a correlation of −0.29 with split time. Impulse and peak force had a correlation of 0.71. Therefore, while associations are present between performance variables, they still represent unique metrics for evaluation. This is corroborated by the different set of PCs used for kinematic reconstruction based on performance metrics.
The correlation of PC1 with the kinematic patterns for all athletes was −0.64, however 10 of the subjects had correlations >−0.90 supporting a very strong correlation between athlete kinematic patterns and PC1. As PC 1 represented an increase in hip and knee drive angular velocity this may demonstrate an athlete’s reliance on this specific kinematic strategy.
A Shapiro–Wilk test showed that data was normally distributed and post hoc power calculation was 1, indicating sufficient sample size for our study design.

4. Discussion

This is the first study to use a powerful data reduction technique to isolate kinematic patterns that include elbow, hip, and knee movements to optimize performance metrics during a step test in elite rowers. Overall, we confirmed our hypothesis that principal component analysis (PCA) is a valuable statistical tool in elite rowing analysis that can be used to: (1) identify optimal kinematic patterns of the elite rowing stroke related to key performance metrics; (2) provide visualizations that could be used to distinguish differences between stroke rates and athletes; and (3) enable improved ability to support informed performance feedback to coaches and athletes. Our findings suggest that PCA applied to the rowing stroke was able to identify changes in joint kinematics associated with faster rowing performance measures (split times). Additionally, PCA was able to differentiate between stroke rates as well as individual rower performance along a set progression of stroke rates for measures of split time. Therefore, PCA could enable targeted evaluations of kinematic patterns for group and individual athletes. These data suggest that PCA could result in more accurate data analytics to allow for enhanced visualization of these athletes’ specific, performance-linked, movement patterns that may assist coaching of the rowing stroke at an elite level with both real-time and delayed delivery of feedback.

4.1. Identification of Kinematic Pattern Associated to Key Performance Metrics

In this study, we explored the kinematic patterns of the rowing stroke in the context of performance metrics of split time, peak force, and impulse, which are common performance metrics in rowing. Reconstruction of the kinematic pattern of the rowing stroke based on split time provided the most notable kinematic differences between best and worst strokes. Split time is a measure of time to complete 500 m and is the most-used rowing metric related to the overall performance outcome in a racing event.
When examining the kinematic patterns of variance from individual PCs, it is interesting to note that split time was associated with both PCs 1 and 2, that account for the largest amount of variance, 26.4% and 14.6%, respectively, of the movement pattern of the rowing stroke. The eigenvectors describing the patterns of movement of the hip and knee specifically (Figure 5) show that the patterns of PC1 and PC2 markedly oppose each other. Accordingly, for the fastest strokes, PC1 loading scores are strongly positively weighted (646) and are negatively weighted for PC2 (−72). As the opposing pattern of PC2 is somewhat reversed by the negative loading scores, the resulting movement pattern combining separately weighted PC1 and PC2 is that of increased angular velocity of the hip and knee during the rowing stroke, as seen in the reconstructions of the rowing pattern associated with the fastest strokes. As peak force is strongly correlated with split time (−0.73), it is not surprising that reconstruction of the rowing pattern based on strokes with the highest and lowest peak force is somewhat similar to that of the split. However, the absence of a significant contribution from PC2 to peak force likely accounts for the less notable differentiation. PC6 significantly contributes to the reconstruction of each performance metric differentially based on loading scores (Table 1).
This pattern of variance for the hip is distinguished by a negative waveform until approximately 80% of the drive which then becomes positive. Based on the loading scores for split time and peak force PC6 would contribute to a small depression of angular velocity for the first 80% of the drive with maintenance of hip angular velocity for the final 20%. For impulse, the loading scores would contribute to increased hip angular velocity for the first 80% of the drive with a decrease in hip angular velocity for the final 20%. The difference in the loading scores of PC6 seem to contribute to an important distinction between the patterns of hip movement between peak force and split time for the final 20% of the stroke, where split time reconstruction results in maintenance of hip angular velocity longer in the drive.
In the present study, the fastest rowing split times were associated with an overall faster (9.5%) hip extension that was maintained throughout the drive (15–95% of the drive) and an increase in knee extension (8.1%) angular velocity (Figure 6A). Previous studies have demonstrated the contribution of hip kinematic parameters at the catch, such as flexion range of motion associated with higher peak-handle force [4] and a single value during the drive, such as peak hip-extension angular velocity and peak force [9,14]. While these studies may inform isolated aspects of optimization of the stroke at a single point in time (e.g., at the catch), the use of PCA in the current study allows for a greater understanding of the complete movement pattern of the three main force-developing components (leg drive, trunk swing, arm pull) of the rowing stroke throughout the entire drive phase and links these patterns to the optimization of specific variables of split time and peak force. For example, when observing the pattern of hip extension angular velocity, one can see that not only is the increase in peak extension angular velocity associated with faster split times, but the maintenance of this faster movement for a longer duration of the drive is also identifiable as an important feature associated with increased drive velocity. The results of an outcome of a single value may be practically interpreted for coaching purposes as ‘reach this peak speed of movement of the hips at mid-drive’, whereas the benefit of understanding the entire pattern from the present results, can be interpreted as ‘maintaining a fast speed of hip extension from 10% to 95% of the drive’. Additionally, information is provided about optimization of the leg drive, trunk swing and arm pull in relation to one another. This supports the potential for a change in inter-joint coordination throughout the drive rather than simply an overall increase in any joint angular velocities at a single point in time. Identification of these movement patterns linked with faster split times provides athletes and coaches movement optimization feedback throughout the rowing stroke and a method of re-evaluation as the athlete strives towards achieving these subtle changes.

4.2. Differences between Stroke Rate and Athletes

An important potential use of PCA is to inform the relationship between key kinematic patterns across stroke rates for individual athletes within an elite cohort. It is important to note that this analytic tool is likely best used amongst specific training groups as optimal technique will be specific to such variables as ergometer used, rower weight class, gender, and coaching philosophies regarding technique [24,25,26]. The strength of the correlation between split time and the loading scores of PC1 varies at different stroke rates (Figure 3). The relationship between PC1 and split time was strongest at stroke rate 36 (r = 0.46) and weakest at stroke rate 28 (r = 0.32) which may suggest that the kinematic strategy identified by PC1 contributes to split times more so as stroke rate increases. This may also suggest that at high stroke rates, the ability to improve split time is constrained to a specific kinematic strategy, while at lower stroke rates kinematic strategies are more variable. This has important implications for the training of race pace rowing techniques, as common race stroke rates are between 32–40 strokes per minute. Refining stroke kinematics may contribute specifically to race pace training.
When comparing the relationship between PC1 and split time between athletes in Figure 4, there was a differential relationship between split time and PC1 loading between athletes. As PC 1 represented an increase in hip and knee drive angular velocity this figure demonstrates the difference in individual athletes’ reliance on this specific strategy to improve performance which could impact team pairing, coordination strategies and feedback. For example, Athlete 7 had a high correlation (r = 0.97) with PC 1, demonstrating a strong reliance on this strategy, while athlete 12 had a low correlation (r = 0.57), which could suggest that they used a different kinematic strategy to accomplish a faster split time. There is also higher angular velocity at the knee and hip beginning at ~10% and 15% of the drive, respectively, where the mean force profile has a noticeable change in slope. There is also evidence of the maintenance of higher velocities at the knee and hip throughout the drive, starting at approx. 15% and 30%, respectively, of the drive. The use of PCA could provide insight into differences in kinematic strategies that could result in suboptimal performance, potential asymmetries or to determine how well a desired technique change has been accomplished by group and/or individual athletes. For example, asymmetric crew kinematics can cause an unnecessary net torque at the center of the rowing shell, which may upset the balance or alter the direction of the shell. This can lead to greater shell drag and slower boat velocity [12].

4.3. Support for Informed Performance Feedback

As previously discussed, PCA of the rowing stroke facilitates a greater detailed understanding of the kinematics associated with improved split times and peak force generation. Amongst the current group of elite heavyweight male rowers included in this study, we can further examine changes in movement patterns associated with these performance variables in the context of practical applications.
The initial steep increase in handle force following the catch of the stroke reaches an inflection point at approximately 10% of the stroke in both the fastest and slowest strokes. From the perspective of the rower, this is the point at which a sharp increase in the resistive load is experienced. Although this point in the handle force is similar between the fastest and slowest strokes, the movement pattern that follows from this point differentiates the fastest and slowest stroke rates. This phase of the drive is characterized as the leg drive. The leg drive associated with the fastest strokes demonstrates faster knee extension (8.1%) from this time until past peak force at the handle occurs.
Hip extension is critical for transfer of force to the oar from the powerful leg drive. The fastest strokes of these heavyweight men demonstrated faster hip extension angular velocity beginning at approximately 10% of the stroke and maintained until approximately 80% of the drive, whereas the slower strokes showed a decline in hip extension angular velocity at approximately 60% of the drive.
Summarized, the faster strokes of these heavyweight male rowers (compared to the slower strokes) are characterized by faster knee extension (leg drive) from the point of increased load felt on the handle and maintained throughout peak force generation at the handle, and faster hip extension (trunk swing) from the point of increased load felt at the handle (10% of the drive) and maintained throughout the drive. This kinematic information, coupled with real-time movement pattern biofeedback on the rowing ergometer, is likely to prove valuable to dryland training on rowing [11,27].
It is important to note that a limitation in this study is that the present approach can only support inference about the performance measure contribution to the rowing kinematic pattern and may not be related to an absolute performance outcome, such as an athlete’s overall performance. This type of analysis could potentially be reproduced in vivo during competition conditions with wearable sensors.

5. Conclusions

Identifying areas for improvement in technique at the elite level of competitive rowing can be challenging; however, these changes may result in the outcome of faster performances. The results from this study present compelling data showing that PCA was able to reveal features of rowing techniques which correlated with key performance metrics and highlighted meaningful technique optimization strategies. For example, the fastest rowing split times were associated with an overall faster hip extension that was maintained throughout the drive and an increase in knee-extension angular velocity. These kinematic features could be used by athletes and coaches to modify techniques and optimize performance and form the basis for a biofeedback training tool. A major practical benefit of understanding the relationship between kinematic patterns and force is that this will better inform coaching language and lead to an improved understanding of coordinated joint movements. Further research could be performed while using this tool in varying rowing conditions and interventions related to kinematic performance optimization.

Author Contributions

Conceptualization, M.J., T.S. and M.K.; methodology, M.J., T.S. and M.K.; software, M.J., J.W. and M.K.; validation, M.J.; formal analysis, M.J., T.S., C.P., J.W. and M.K.; investigation, M.J.; resources, M.J.; data curation, M.J.; writing—original draft preparation, M.J. and M.K.; writing—review and editing, M.J., T.S., J.W., C.P. and M.K.; visualization, M.J.; supervision, M.K. and T.S.; project administration, M.K.; funding acquisition, M.J. and M.K. All authors have read and agreed to the published version of the manuscript.

Funding

This work was part of a project funded by Mitacs. The Mitacs Accelerate PhD Fellowship has been awarded to M.J. and the project was supervised by M.K. and T.S.

Institutional Review Board Statement

The study was conducted in accordance with the Declaration of Helsinki, and approved by the Human Research Ethics Board of University of Victoria (Ethics Protocol Number 15-42, approved 23 November 2015).

Informed Consent Statement

Informed consent was obtained from all subjects involved in the study.

Data Availability Statement

Data supporting the conclusion of this article may be made available by the authors upon request without undue reservation. Code used for analysis is available upon request due to privacy issues with respect to National Team Rowers currently active with the team.

Acknowledgments

The authors gratefully acknowledge Rowing Canada for their cooperation and support with this project.

Conflicts of Interest

The authors have no conflict of interest related to this study, nor does the information in this study constitute product endorsement by the authors.

References

  1. Černe, T.; Kamnik, R.; Vesnicer, B.; Žganec, G.J.; Munih, M. Differences between elite, junior and non-rowers in kinematic and kinetic parameters during ergometer rowing. Hum. Mov. Sci. 2013, 32, 691–707. [Google Scholar] [CrossRef]
  2. Steer, R.; McGregor, A.H.; Bull, A. A comparison of kinematics and performance measures of two rowing ergometers. J. Sports Sci. Med. 2006, 5, 52–59. [Google Scholar] [PubMed]
  3. Vinther, A.; Alkjaer, T.; Kanstrup, I.L.; Zerahn, B.; Ekdahl, C.; Jensen, K.; Holsgaard-Larsen, A.; Aagaard, P. Slide-based ergometer rowing: Effects on force production and neuromuscular activity. Scand. J. Med. Sci. Sports 2012, 23, 635–644. [Google Scholar] [CrossRef]
  4. Buckeridge, E.M.; Hislop, S.; Bull, A.; McGregor, A.H. Kinematic asymmetries of the lower limbs during ergometer rowing. Med. Sci. Sports Exerc. 2012, 44, 2147–2153. [Google Scholar] [CrossRef]
  5. Bull, A.; McGregor, A.H. Measuring spinal motion in rowers: The use of an electromagnetic device. Clin. Biomech. 2000, 15, 772–776. [Google Scholar] [CrossRef] [PubMed] [Green Version]
  6. Giustino, V.; Zangla, D.; Messina, G.; Pajaujiene, S.; Feka, K.; Battaglia, G.; Bianco, A.; Palma, A.; Patti, A. Kinematics of Cervical Spine during Rowing Ergometer at Different Stroke Rates in Young Rowers: A Pilot Study. Int. J. Environ. Res. Public Heal. 2022, 19, 7690. [Google Scholar] [CrossRef]
  7. McGregor, A.H.; Patankar, Z.S.; Bull, A.M.J. Longitudinal changes in the spinal kinematics of oarswomen during step testing. J. Sports Sci. Med. 2007, 6, 29–35. [Google Scholar] [PubMed]
  8. McGregor, A.H.; Patankar, Z.S.; Bull, A.M.J. Spinal Kinematics in Elite Oarswomen during a Routine Physiological “Step Test”. Med. Sci. Sports Exerc. 2005, 37, 1014–1020. [Google Scholar]
  9. Pollock, C.L.; Jones, I.C.; Jenkyn, T.R.; Ivanova, T.D.; Garland, S.J. Changes in kinematics and trunk electromyography during a 2000 m race simulation in elite female rowers. Scand. J. Med. Sci. Sports 2010, 22, 478–487. [Google Scholar] [CrossRef]
  10. Hill, H. Dynamics of coordination within elite rowing crews: Evidence from force pattern analysis. J. Sports Sci. 2002, 20, 101–117. [Google Scholar] [CrossRef]
  11. Baudouin, A.; Hawkins, D. A biomechanical review of factors affecting rowing performance. Br. J. Sports Med. 2002, 36, 396–402. [Google Scholar] [CrossRef] [PubMed] [Green Version]
  12. Soper, C.; Hume, P. Towards an ideal rowing technique for performance: The contributions from biomechanics. Sports Med. 2004, 34, 825–848. [Google Scholar] [CrossRef] [PubMed]
  13. Anderson, R.; Harrison, A.; Lyons, G.M. Accelerometry-based feedback--can it improve movement consistency and performance in rowing? Sports Biomech. 2005, 4, 179–195. [Google Scholar] [CrossRef]
  14. Buckeridge, E.M.; Bull, A.M.J.; McGregor, A.H. Biomechanical determinants of elite rowing technique and performance. Scand. J. Med. Sci. Sports 2014, 25, e176–e183. [Google Scholar] [CrossRef] [PubMed]
  15. Turpin, N.A.; Guével, A.; Durand, S.; Hug, F. Effect of power output on muscle coordination during rowing. Eur. J. Appl. Physiol. 2011, 111, 3017–3029. [Google Scholar] [CrossRef]
  16. Witte, K.; Ganter, N.; Baumgart, C.; Peham, C. Applying a principal component analysis to movement coordination in sport. Math. Comput. Model. Dyn. Syst. 2010, 16, 477–488. [Google Scholar] [CrossRef]
  17. Robertson, D.G.E.; Caldwell, G.E.; Hamill, J.; Kamen, G.; Whittlesey, S.N. Research Mehods in Biomechanics, Second ed.; Human Kinetics: Champaign, IL, USA, 2013; Volume 428. [Google Scholar]
  18. Blake, O.M.; Champoux, Y.; Wakeling, J.M. Muscle coordination patterns for efficient cycling. Med. Sci. Sports Exerc. 2012, 44, 926–938. [Google Scholar] [CrossRef] [PubMed]
  19. Baudouin, A.; Hawkins, D. Investigation of biomechanical factors affecting rowing performance. J. Biomech. 2004, 37, 969–976. [Google Scholar] [CrossRef] [PubMed]
  20. Hofmijster, M.J.; Landman, E.H.; Smith, R.M.; Van Soest, A.J. Effect of stroke rate on the distribution of net mechanical power in rowing. J. Sports Sci. 2007, 25, 403–411. [Google Scholar] [CrossRef]
  21. Colloud, F.; Bahuaud, P.; Doriot, N.; Champely, S.; Chèze, L. Fixed versus free-floating stretcher mechanism in rowing ergometers: Mechanical aspects. J. Sports Sci. 2006, 24, 479–493. [Google Scholar] [CrossRef] [PubMed]
  22. McGregor, A.H.; Bull, A.; Byng-Maddick, R. A comparison of rowing technique at different stroke rates: A description of sequencing, force production and kinematics. Int. J. Sports Med. 2004, 25, 465–470. [Google Scholar] [CrossRef] [PubMed] [Green Version]
  23. Wakeling, J.M.; Horn, T. Neuromechanics of muscle synergies during cycling. J. Neurophysiol. 2009, 101, 843–854. [Google Scholar] [CrossRef] [PubMed]
  24. Doyle, M.; Lyttle, A.; Elliott, B. The Consistency of Force and Movement Variables as an Indicator of Rowing Performance. In Proceedings of the 28 International Conference on Biomechanics in Sports, Marquette, MI, USA, 19–23 July 2010. [Google Scholar]
  25. Jones, J.A.; Allanson-Bailey, L.; Jones, M.D.; Holt, C.A. An ergometer based study of the role of the upper limbs in the female rowing stroke. Procedia Eng. 2010, 2, 2555–2561. [Google Scholar] [CrossRef] [Green Version]
  26. Attenborough, A.S.; Smith, R.M.; Sinclair, P.J. Effect of gender and stroke rate on joint power characteristics of the upper extremity during simulated rowing. J. Sport. Sci. 2012, 30, 449–458. [Google Scholar] [CrossRef] [PubMed]
  27. Gorman, A.J.; Willmott, A.P.; Mullineaux, D.R. The effects of augmented biofeedback on novel motor-task learning. In Proceedings of the 33rd International Conference on Biomechanics in Sport, Poitiers, France, 29 June–3 July 2015; pp. 503–506. [Google Scholar]
Figure 1. Experimental setup of rower at the catch position; initiation of the drive which is the force producing segment of the stroke. The drive is initiated with extension of the knee, extension of the hip, and flexion of the elbow.
Make 05 00015 g001
Figure 2. Average data from stroke rate 28 showing how accelerometer and handle-force data were used to identify the catch and finish, respectively.
Make 05 00015 g002
Figure 3. Relationship between rowing ergometer split and the loading scores for the kinematic patterns of PC 1 grouped by stroke rate. Stroke rate 36 had the highest correlations (r = 0.46), while stroke rate 28 had the lowest correlations (r = 0.32).
Make 05 00015 g003
Figure 4. Relationship between rowing ergometer split and the loading scores for the kinematic patterns of PC 1 grouped by athlete. PC1 explained 26.4% of the signal and was significantly affected by split time (p = 0.0001). PC1 loading score was correlated with the rowing ergometer split (r = 0.64). Athlete 12 had the lowest correlation (r = 0.57), and athlete 7 had the highest correlations (r = 0.97).
Make 05 00015 g004
Figure 5. Eigenvectors representative of PC1, PC2, and PC6 for the elbow, hip and knee.
Make 05 00015 g005
Figure 6. Kinematic patterns for the elbow, hip and knee, reconstructed from the top (solid) and bottom (dashed) 100 strokes for: (A) split (PC 1,2,6); (B) peak force (PC 1,6,7); and (C) impulse (PC 3,4,5,6). Overlaid (solid grey) the elbow split reconstructions is the mean handle force, along with top 100 (light grey) and bottom 100 (dark grey) for all rowing strokes. Mean handle force (grey line) overlaid hip and knee for split reconstruction.
Make 05 00015 g006
Table 1. Loading Scores means of Kinematic Patterns based on Performance Metrics top and bottom 100 for Principal Components 1–7. * Significant to bottom, p < 0.05.
SplitPeak ForceImpulse
BottomTopBottomTopBottomTop
PC1−684646 *−610450 *
PC2190−72 *
PC3 149−97 *
PC4 98193
PC5 −35776 *
PC692200 *33−79 *−9152 *
PC7 −34133 *
Note: Shaded cells indicate that PC loading score (for all strokes) had a significant effect on the mechanical factor (split, peak force, impulse), and was used in data reconstruction.
Disclaimer/Publisher’s Note: The statements, opinions and data contained in all publications are solely those of the individual author(s) and contributor(s) and not of MDPI and/or the editor(s). MDPI and/or the editor(s) disclaim responsibility for any injury to people or property resulting from any ideas, methods, instructions or products referred to in the content.

