1. Introduction
Occupational injuries in the tourism sector commonly occur, resulting in morbidity, mortality, and with a negative impact across all demographic groups [
1]. Occupational Injuries have negative social and financial implications for both organisations and employees. There is a need to understand and determine how circumstances, factors, characteristics of the employee, work environment and conditions result in occupational injuries [
2]. The analysis of types of occupational injuries that have occurred in the past and of underlying factors that can be used for the prediction of these injuries is important at the workplace [
3]. It is important that the correct combination of the factors that influence occupational injuries are used as input for predictive models [
4]. Data obtained from compensation claims provide useful information, such as nature of the occupational injuries, the body regions that are affected and demographic information on workers [
5].
Machine learning models have a high degree of flexibility compared to traditional statistical models because of the capability of predicting complex relationships with multi-dimensions that are not linear or additive [
6]. Machine Learning models are useful in the prediction of different classes or categories of an outcome and have been applied with considerable predictive accuracy in medical diagnosis and failure of critical body organs, predicting injuries in football, mining, steel industry, agribusiness and construction [
4,
5,
6,
7,
8,
9,
10,
11,
12]. Machine Learning has been applied in the prediction of injuries and work-related accidents in the steel, agribusiness, mining and construction sector [
4,
5,
7,
8,
12,
13]. Chen et al. applied the k-means algorithm to predict fall injuries for employees in the construction industry and achieved an accuracy of 62% [
12]. Support Vector Machines (SVM) and Neural networks have also been regularly applied in the prediction of work related accidents that result in injuries. Kakhki, et al. successfully applied the SVM algorithm in the prediction of occupational injuries for 33,000 employees in agribusiness and achieved a high accuracy rate F-score of 93% and overall accuracy of 98.44% [
5]. The SVM model has also been applied in the prediction of work related accidents for 11,054 workers using 21 features based on work conditions and nature of work [
13]. The SVM model reported a recall of 97.45% and overall accuracy of 99.77%.
Neural Networks with 14 input variables have been applied in the prediction of work-related injuries for 1182 mine workers [
4]. The MLP Neural Network predicted work-related injuries with an accuracy of 80.4%. The RBF Neural Network with the four most important variables achieved a higher accuracy of 84.9%. Sarkar, et al. predicted occupational injuries using both SVM and Neural Networks [
14]. The SVM had a slightly higher accuracy rate of 90.7% compared to Neural Networks, which achieved an accuracy rate of 89.3%. The findings from these research studies indicate that SVM and Neural Networks can potentially predict occupational injuries with a high level of accuracy. XGBoost models that integrate decision trees and gradient boosting have been applied on data sets with moderate sizes and have provided accurate predictions that are comparable to deep learning algorithms and superior to other machine learning models [
15]. Stochastic Gradient Tree Boosting has been applied in the construction sector to accurately predict types of injuries and affected body parts [
16]. The research studies that have been reviewed in this section show that there is a high potential for successfully applying various machine-learning models in the accurate prediction of occupational injuries.
Machine-learning models have the capability of predicting injuries such that the employees that are at risk of experiencing occupational injuries can be identified. They have the capability of using large amounts of multi-dimensional data from several sources in the organization and of improving their accuracy of making predictions with more data acquired overtime, which makes them useful for making accurate predictions and time-related decisions. This allows organisations to use these predictions to implement targeted preventive and safety measures to avoid the occurrence of injuries. Currently, there is no literature or research investigating the application of machine learning models in the prediction of different types or classes of occupational injuries in National Parks. The application of machine-learning models can be useful for the following purposes:
Identifying important factors that can be used in the prediction of types or classes of occupational injuries
Identifying employees who are at risk of these occupational injuries, developing appropriate interventions and implementing the relevant preventive or corrective actions.
Therefore, the main aim of this research study is to investigate the application of machine learning in the prediction of occupational injuries using underlying factors such as demographic, period which the accident occurred and injury related factors. Several machine learning models are appropriately applied to real world data and their performance in the prediction of occupational injuries is critically assessed. The purpose is to investigate whether the best performing model in the prediction of injuries can be used to identify employees who are at risk of occupational injuries and consequently develop timely interventions and prevention measures.
2. Materials and Methods
This section presents a detailed description of the methodology that was used. This section will start by outlining how the data was acquired and pre-processed. Furthermore, the features and the response variables are clearly defined. The architecture of the machine learning models that are applied for the prediction of categories of occupational injuries and the performance metrics that are used for the evaluation of the models will be outlined.
2.1. Acquisition of Data
The data used in the research study was obtained from the electronic records from the Department of Employment and Labour’s Compensation Fund, containing occupational injuries cross sectional data for 1531 employees for the period from the year 2007 to 2019. Data on injury on duty claims covered by COIDA was collected and reviewed from the Compensation Fund data base. Permission to collect and review data from the data base at Compensation Fund was granted on 18 May 2018. Data collected included demographic data and injury related data. The data extracted consisted of records of injury classifications, ICD10 codes, ICD10 descriptions of injuries, provinces, foreigner status, gender, age at the date of the accident and year at which the accident occurred. The data was checked for any missing or null values. Only 8 employee records were found to be missing or have null values and were dropped from the data, resulting in 1523 employees’ data remaining.
2.2. Definition of Features
The research study focused on two categorical and two numerical features that could be used for prediction. These features were the provinces where the company resided, gender of the employee, age at the date of the accident and year at which the accident occurred.
Table 1 below shows the description and type of features.
2.3. Definition of Categories of the Response Variable
The occupational injuries categorized according to the affected body regions and nature of injuries were used as the response variable. There were 10 categories in the response variable and these are shown in
Table 2 below.
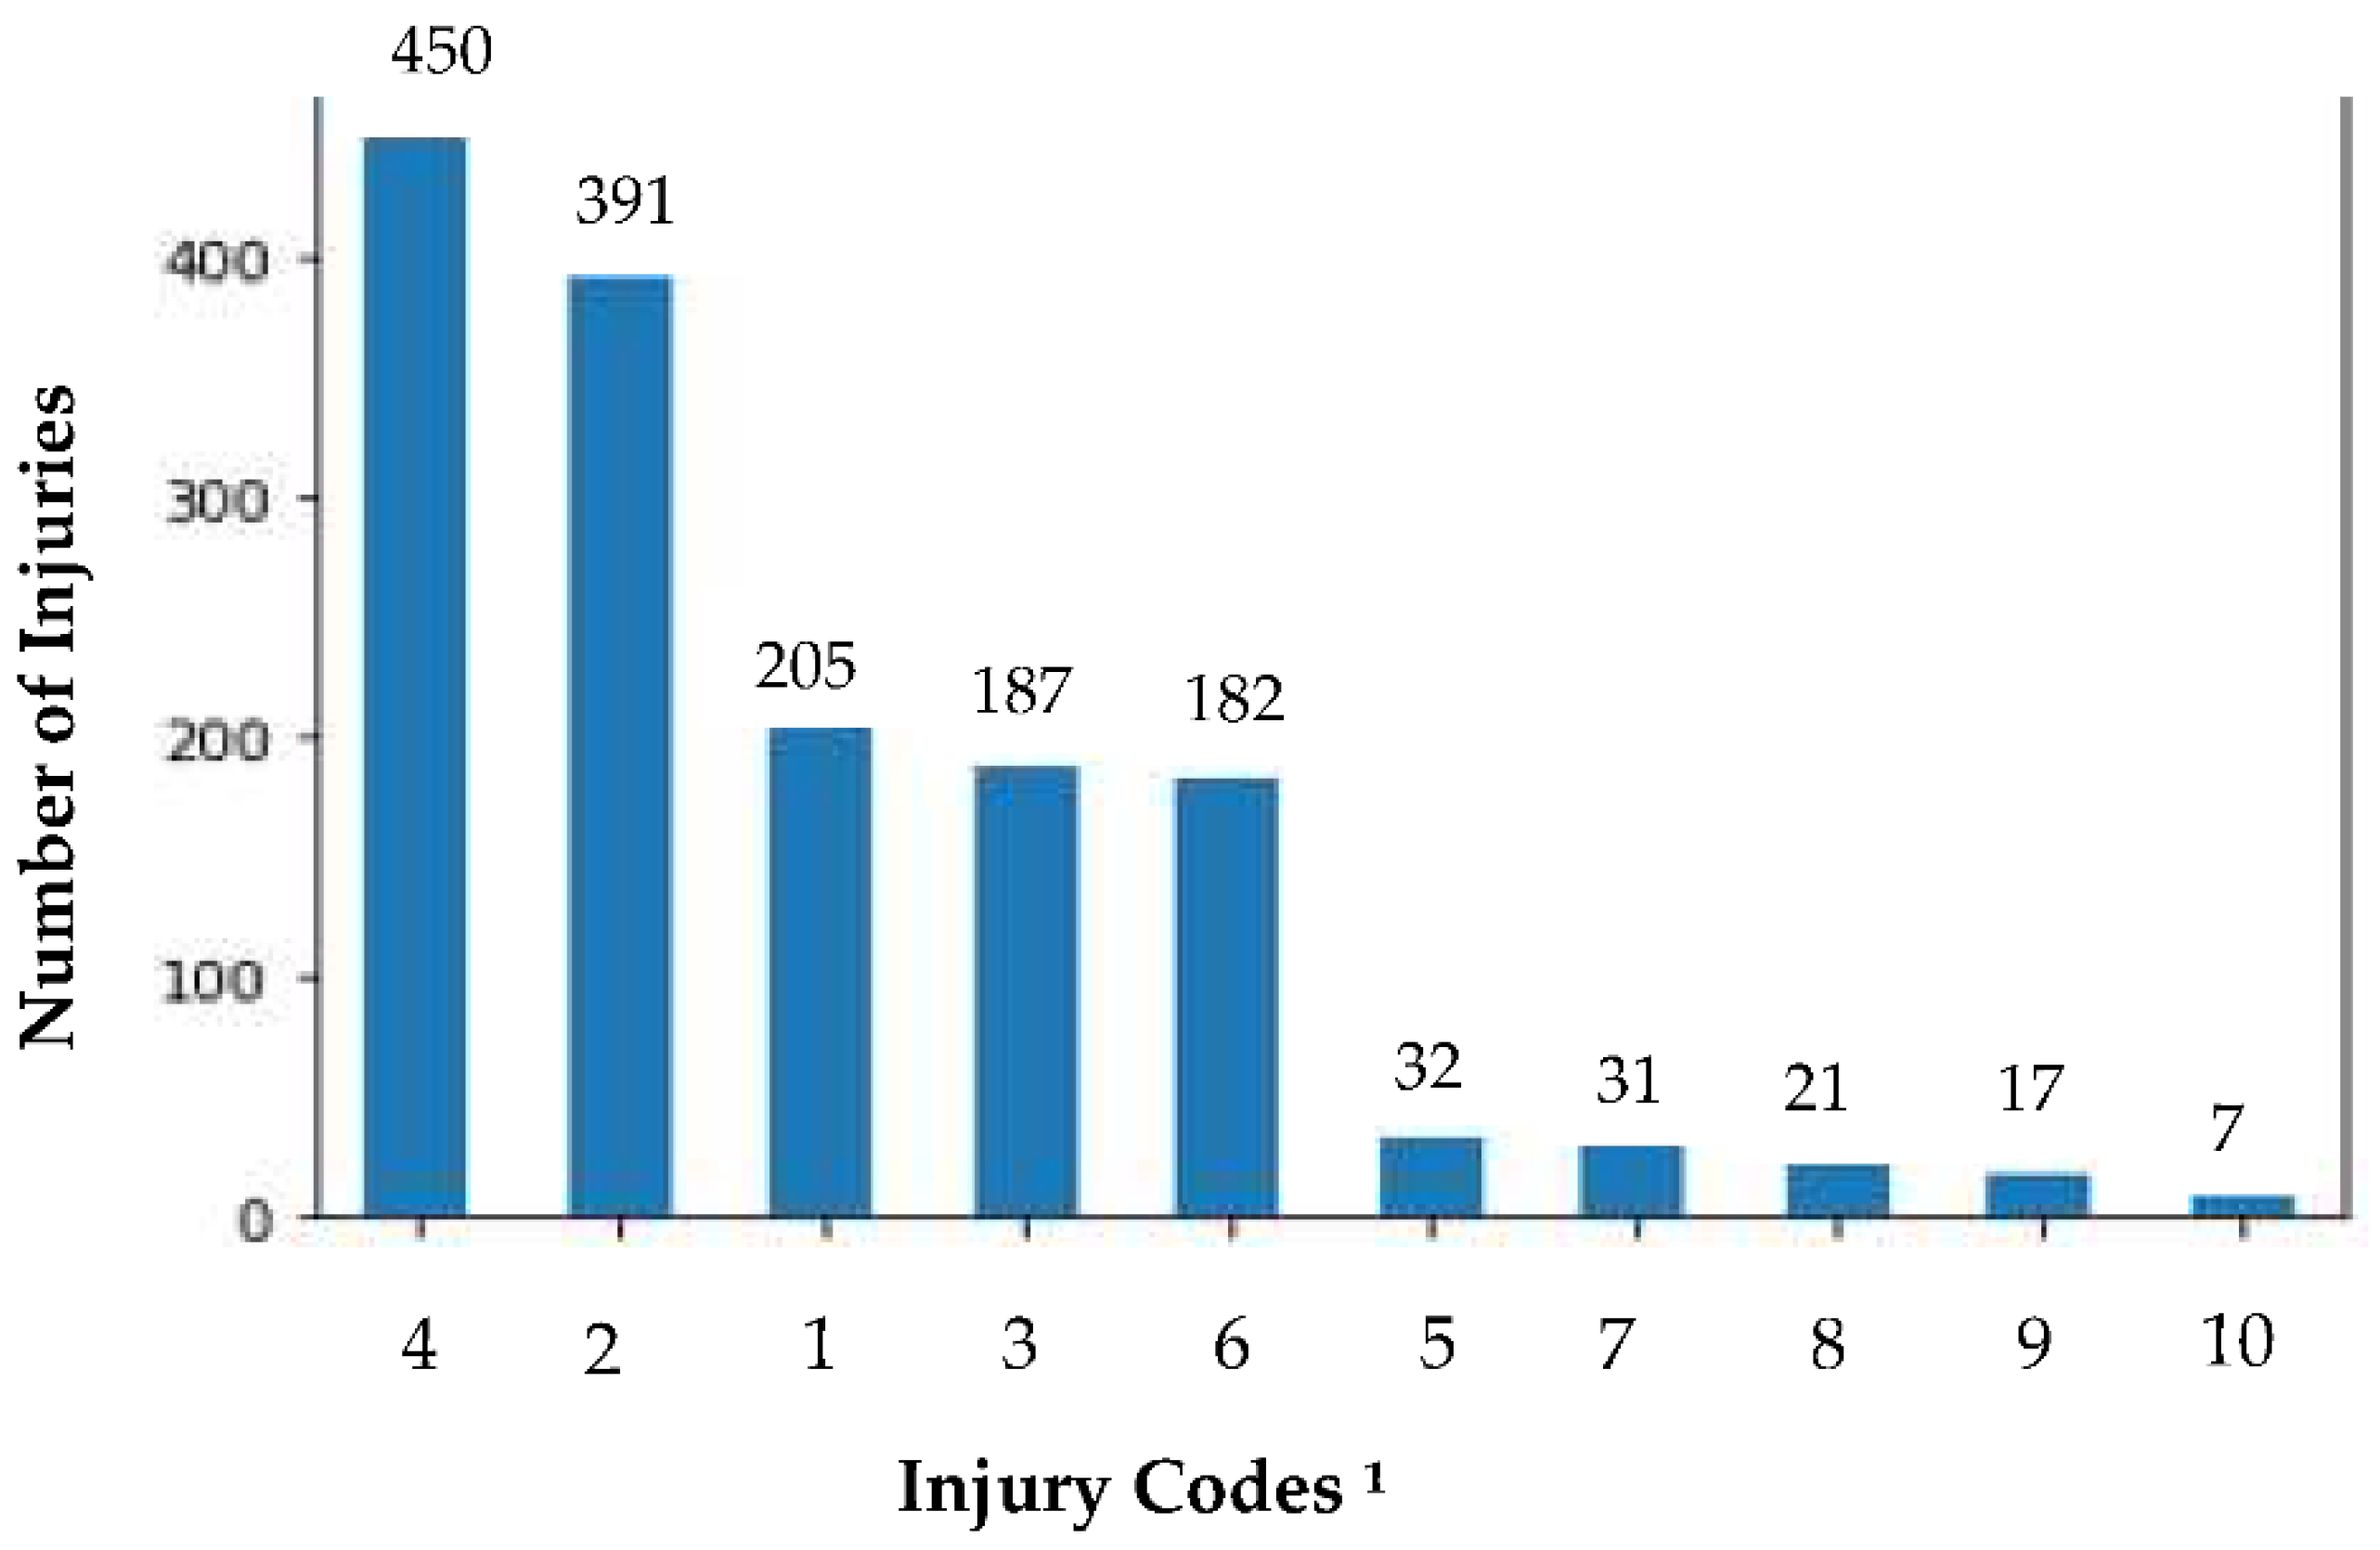
There was a need to explore the distribution of the number of employees among the different categories of the injury classification so as to assess the imbalance of the categories of the response variable because this may negatively affect the performance of the model.
Figure 1 below shows the distribution of the number of employees for the different categories of occupational injuries.
The data is unbalanced amongst the different classifications of the injuries. Therefore, there is a need to use evaluation measures that take into account the imbalance of the data amongst the classes and to consider models using data that has been randomly oversampled for the classes that are underrepresented in the data. The most frequently occurring occupational injuries affected the Lower Extremity and the Torso and Hands region.
2.4. Machine Learning Models
It was necessary to investigate the application of several machine learning models and compare the performance of these models in predicting categories of occupational injuries. The models that the research focused on were decision trees, XG boost classifier, Support Vector Machines (SVM), K-nearest neighbours (KNN), and deep learning neural networks. These models were implemented using scikit-learn, which is an open-source machine learning package for Python.
Decision tree classifiers consist of nodes and branches that are built on procedures such as splitting, pruning and stopping [
17]. At the decision node, a decision is made based on the best choice on how to split the data. These splits result in a tree structure consisting of internal nodes and leaf nodes after the terminal splits. The features or input variables are used in the splitting of the data. Developing the decision tree model requires a decision to be made at the decision node on the best feature to split the data. A stopping criteria determines how complex the tree can grow and can be based on parameters such as the minimum number in the leaf node and the depth of the tree. Another option, besides using a stopping criterion in a decision tree, is pruning which involves building a tree with a large size and then pruning it down to get an optimally sized tree. The Classification and Regression Tree (CART) algorithm is the most basic machine learning technique for a decision tree. The CHAID (Chi-Squared Automatic Interaction Detection) is more appropriate when the target variable is categorical, such as different classes of injuries.
Boosting refers to a technique that is used for developing an accurate model from the combination of simple and inaccurate techniques, rules of thumb or weak learner models such as decision trees with single splits [
10]. The prediction of models developed from boosting is based on the majority vote of the weak learner models. Gradient boosting involves the optimisation of a loss function, development and predictions of the weak learning models, and finally an additive model or technique that combines the weak learners such that the loss function is minimised. The gradient descent technique will add decision trees to the model that decreases the loss. This can be done by tuning parameters of the tree such that losses of the tree are reduced. A lower learning rate ensures that the model will properly fit and slowly learn complex data patterns and usually has values lower than 0.3. Stochastic gradient boosting involves randomly selecting subsets of the data to fit the weak learners for the purpose of ensuring that the weak learners have a low correlation. Regularisation is a technique that ensures that the weights are smoothened and prevents overfitting. XG Boost was developed to increase the extent of boosted tree algorithms [
18]. XG Boost can be implemented in Python and its machine learning package scikit-learn. XG Boost is fast and usually has a reliable and superior model performance for regression and classification prediction tasks.
The k-nearest neighbours (KNN) is a simple algorithm that classifies data that does not have a target variable class to the most similar target class based on the features of the data set [
19]. The basic KNN uses the Euclidean distance as a measure of the similarity. The expression below shows the Euclidean distance between data point
and
which has
features.
The parameter k is important in that it decides how many points will be used in the neighbourhood of the data point to allocate it to the target class. A large value of k results in a model with lower variance, is less flexible and can have a large bias if there is complexity in the pattern of the data. Therefore, an optimal value of k provides a balance between variance and bias. The value of k influences whether a model is under-fitting or over-fitting the training data.
SVM is a statistical learning approach that optimally separates two classes using a constructed hyperplane that maximises the margin between the training data for the two classes [
20]. The training data points that are closer to the margin influence the construction of the hyperplane and are referred to as support vectors. Kernels are transformations of the training data that develop features that facilitate the separation of two different classes [
21]. The most common kernels are the linear, sigmoid and Gaussian RBF kernels.
Artificial Neural Networks (ANN) develop a model for the relation between input features and output target similar to how the brain develops a response to a given stimuli. The ANN consists of neurons that facilitate statistical learning and prediction of responses based on a given input [
21]. The inputs to the neurons in the ANN are aggregated using activation functions such as the ReLu, Sigmoid, Gaussian and hyperbolic tangent. The simplest structure of ANN consists of an input layer of neurons for the input training data, a single hidden layer after the input layer, and finally an output layer, which produces the response. The number of neurons in the input layer should be similar to the number of features in the data and the number of the output neurons should be similar to the number of classes being predicted. An ANN structure with two or more hidden layers is referred to as a Deep Neural Network (DNN). The more complex the structure of the ANN the greater the capability of learning more complicated predictive or classification problems. In ANN there is an algorithm that trains the data by setting the values of the weights of the inputs to the neurons. The algorithm will adjust the weights according to the learning rate such that there is the largest decrease in the error of the prediction. Complex problems generally require a lower learning rate for more accurate prediction.
2.5. Evaluation
Classification reports were used for the evaluation of the machine learning models. The classification report contained the following measures of accuracy:
Recall which is also known as the True Positive rate and is given by the expression below:
precision is used for the evaluation of the correct classification of injuries as a proportion of the total number of the positively predicted classes. and is given by the expression below:
f1-score is comprehensive and is the harmonic mean of the recall and precision. It is given by the expression below:
In the case where the data has class imbalance, the recall is useful for assessing the class with the lower representation, precision can be used to assess the proportion of the correctly classified classes as a proportion of the positive class prediction, and the f1-score is considered most appropriate and comprehensive for assessing models that are using imbalanced data [
22,
23]. The average accuracy is usually the average for the f1-scores for the different classes.
2.6. Models Used in the Prediction of Injuries for Employees with Lower Extremity Injuries and Injuries in the Torso and Hands Region
The data was filtered for injuries in the Torso and hands region (Injury class 2) and lower extremity injuries (Injury class 4) to facilitate a one versus one classification of these injuries. The parameters of the Support Vector Machines (SVM), k-nearest neighbours (KNN), XG boost classifier and deep learning neural networks (DNN) were tuned to reach the optimal accuracy. The Grid search approach was used for the Support Vector Machines (SVM) and XG boost classifier. k was adjusted for the k-nearest neighbours (KNN) to maximise the accuracy. For the DNN, the number of hidden layers and the number of neurons in the hidden layers were adjusted to maximise the accuracy of the models. This process was repeated using data with random oversampling.
Table 3 below shows the parameters for the machine learning models that were used for the machine learning models.
3. Results
This section reports and compares the performance of the four machine learning models that were used for the prediction of the occupational injuries. The performance of the Support Vector Machines (SVM), k-nearest neighbours (KNN), XG boost classifier and deep learning neural networks (DNN)) are presented as classification reports. The results for the application of the models using resampled training data with random oversampling are also presented.
3.1. Prediction of Injuries for Employees with Lower Extremity Injuries and Injuries in the Torso and Hands Region
The results of the predictions of the models for injuries of employees with lower extremity injuries (Injury class = 4) versus those with and injuries in the Torso and hands region (Injury class = 2) are shown in
Table 4 below.
The Deep Neural Network is a not a good classifier overall because it always makes a prediction of lower extremity injuries for every employee. This model reported an overall accuracy of 53% and this can be considered as the baseline for comparison since the model always makes the same prediction. The SVM using grid search and training data with Random oversampling had the highest overall accuracy of 56%. This was slightly above the baseline accuracy of 53%. The model predicted injuries in the Torso and hands region (Injury class = 2) with a precision of 53%, recall of 65% and f1-score of 58% supported by 120 injuries. Furthermore, this model predicted lower extremity injuries (Injury class = 4) with a precision of 60%, recall of 48% and f1-score of 54% supported by 133 injuries. The SVM model using grid search and training data with Random oversampling was the only machine learning model that performed better than the baseline of 53%. The other models either achieved an accuracy that was either below or equivalent to that of the baseline model. This indicates that the models where not better than a model that always predicts lower extremity injuries.
3.2. Importance of Features
The importance of the features in predicting the lower extremity injuries and Torso, hands, fingers, elbow, shoulders, forearm, wrist, and arm injuries was assessed using chi-square importance scores are shown in
Figure 2 below.
Gender had the highest importance in predicting the injury classes, whilst the year which the accident occurred (c2-score = 4.02) had the lowest importance (c2-score = 0.002).
4. Discussion
The research study investigated the use of supervised machine learning models in predicting commonly occurring classes of occupational injuries in South African National Parks and Nature Reserves. The features used for the prediction models were province, gender, age at the accident date and year that the accident occurred. The results showed that the SVM using grid search and data with random oversampling had the best performance in the classification between injuries in the Torso and hands region and lower extremity injuries. The model reported an overall accuracy of 56% that was only slightly above the baseline model, which always makes the same prediction of low extremity injuries. Gender had the most significant importance in the predictions. The other machine learning models that were used for classifying between lower extremity injuries and injuries in the Torso and hands regions performed below the baseline accuracy level for a model that always makes the same prediction.
The overall accuracy of the SVM model performed well below the findings of other previous studies that have used SVM models to predict occupational injuries or accidents and reported accuracy levels above 90% [
14,
15]. Furthermore, the performance was below the reported accuracy from other previous studies that applied machine learning models in the prediction of work related injuries and achieved minimum accuracy levels of 62% [
4,
5,
12,
13,
14]. These models used a number of features ranging from 14 to 21 which were based on work conditions and nature of work. There were only four features used in this study, which were only based on the demographics of the employee and year which the accident occurred. There were no features that concerned the working conditions, environment and the nature of work or textual information narrating how the accident occurred. Furthermore, gender was the only feature that had importance scores that were significantly greater than zero. Findings in previous literature have found that the rate of claims being made for occupational injuries have been higher for males than females [
24]. This indicates that the gender of the employee can potentially influence the chances of experiencing occupational injuries. The other features did not have significant effect on the prediction of whether an employee would experience an injury in the Torso and hands regions and lower extremity injuries.
The application of the findings in this research study are only limited to the prediction of whether employees who would have previously experienced injuries in the lower extremity or in the Torso and hands region will experience any of these injuries again because the data was only filtered for these types of injuries. This will be useful in the identification of employees of who are vulnerable to experiencing these injuries again in the future. The organisation can then implement targeted preventive or safety measures and provide safety training for these vulnerable employees.
5. Conclusions
The research study investigated the application of machine learning models in the prediction of occupational injuries classes based on affected body regions in South African National Parks and Nature Reserves. Currently, there are no known techniques that have been investigated or implemented in South African National Parks for the purpose of predicting occupational injuries. This research study demonstrated the application of several machine learning models which included Support Vector Machines(SVMs) in predicting whether an employee will experience an injury in the lower extremity or Torso and hands region given that they have once experienced these injuries before. There were only four features that were used as input in the machine learning models, which were mainly based on demographic characteristics and year which the accident occurred. Gender was the most important feature for predicting between injuries in the lower extremity (Injury Class = 4) or Torso and hands (Injury Class = 2). The accuracy of the best performing machine learning model was only slightly above the baseline and was lower than the minimum level obtained from the findings from previous research that has applied machine learning models in predicting occupational injuries or accidents. This was potentially caused by the fact that there were no features concerning working conditions, environment and the nature of work, or textual information narrating how the accident occurred.
This study provides new baseline findings in the prospect of applying machine learning in the prediction of occupational injury classes in South African National Parks. It is recommended that, in addition to demographic factors, future studies should include other work-related aspects and factors related to working conditions such as the type of work, contract category, level of skill, role, tenure, working hours, work environment, risk factors and safety related factors as features in the predictive models. This study did not consider the history of injuries that employees had experienced, which is important for the prediction of whether an employee will experience a further injury. The study was limited to individuals who had experienced injuries in the lower extremity injuries and Torso and hands/fingers region. The data in future studies should include more types or classes of injuries and those employees that have not experienced any injuries, so that the data is a representation of wider reality.
Author Contributions
Conceptualization, M.C.; methodology, M.C., J.K. and A.S.; validation, M.C., J.K. and A.S.; formal analysis, M.C.; investigation, M.C.; data curation, M.C.; writing—original draft preparation, M.C.; writing—review and editing, M.C., J.K. and A.S.; supervision, J.K. and A.S.; funding acquisition, M.C. All authors have read and agreed to the published version of the manuscript.
Funding
This research received the University Capacity Development Grant (UCDG) from the University of Johannesburg: UCDG36/2019.
Institutional Review Board Statement
The study was conducted in accordance with the Declaration of Helsinki, and approved by the University of the Witwatersrand, Human Research Ethics Committee (Medical) (clearance certificate No. M171197).
Informed Consent Statement
Not applicable.
Data Availability Statement
Not applicable.
Conflicts of Interest
The authors declare no conflict of interest.
References
- Matzarakis, A.; Freitas, C.R.D. Proceedings of the First International Workshop on Climate, Tourism and Recreation; December 2001; The Meteorological Institute of the University of Freiburg: Freiburg, Germany, 2002; pp. 5–10. [Google Scholar]
- Hollnagel, E.; Speziali, J. Study on Developments in Accident Investigation Methods: A Survey of the”State-of-the-Art”; SKI Report 2008:50; Ecole des Mines de Paris: Paris, France, 2008. [Google Scholar]
- Stemn, E. Analysis of Injuries in the Ghanaian Mining Industry and Priority Areas for Research. Saf. Health Work 2019, 10, 151–165. [Google Scholar] [CrossRef] [PubMed]
- Ivaz, J.; Nikolić, R.R.; Petrović, D.; Djoković, J.M.; Hadzima, B. Prediction of the Work-related Injuries Based on Neural Networks. CZOTO 2021, 3, 19–37. [Google Scholar] [CrossRef]
- Kakhki, F.D.; Freeman, S.A.; Mosher, G. Evaluating machine learning performance in predicting injury severity in agribusiness industries. Saf. Sci. 2019, 117, 257–262. [Google Scholar] [CrossRef]
- Majumdar, A.; Bakirov, R.; Hodges, D.; Scott, S.; Rees, T. Machine Learning for Understanding and Predicting Injuries in Football. Sports Med. 2022, 8, 1–10. [Google Scholar] [CrossRef] [PubMed]
- Cheng, C.-W.; Leu, S.-S.; Cheng, Y.-M.; Wu, T.-C.; Lin, C.-C. Applying data mining techniques to explore factors contributing to occupational injuries in Taiwan’s construction industry. Accid. Anal. Prev. 2011, 48, 214–222. [Google Scholar] [CrossRef] [PubMed]
- Debnath, J.; Biswas, A.; Sivan, P.; Sen, K.N.; Sahu, S. Fuzzy inference model for assessing occupational risks in construction sites. Int. J. Ind. Ergon. 2016, 55, 114–128. [Google Scholar] [CrossRef]
- Cheng, B.; Zhou, P.; Chen, Y. Machine-learning algorithms based on personalized pathways for a novel predictive model for the diagnosis of hepatocellular carcinoma. BMC Bioinform. 2022, 23, 1–19. [Google Scholar] [CrossRef] [PubMed]
- Bendavid, I.; Statlender, L.; Shvartser, L.; Teppler, S.; Azullay, R.; Sapir, R.; Singer, P. A novel machine learning model to predict respiratory failure and invasive mechanical ventilation in critically ill patients suffering from COVID-19. Sci. Rep. 2022, 12, 1–14. [Google Scholar] [CrossRef] [PubMed]
- Teixeira, R.; Rodrigues, C.; Moreira, C.; Barros, H.; Camacho, R. Machine learning methods to predict attrition in a population-based cohort of very preterm infants. Sci. Rep. 2022, 12, 1–10. [Google Scholar] [CrossRef] [PubMed]
- Chen, H.; Luo, X. Severity prediction models for falling risk for workers at height. Procedia Eng. 2016, 164, 439–445. [Google Scholar] [CrossRef]
- Sánchez, A.S.; Fernándeza, P.R.; Lasherasb, F.S.; .de Cos Juezc, F.J.; Nietoears, P.J.G. Prediction of work-related accidents according to working conditions using support vector machines. Appl. Math. Comput. 2011, 2018, 3539–3552. [Google Scholar] [CrossRef]
- Sarkar, S.; Vinay, S.; Raj, R.; Maiti, J.; Mitra, P. Application of optimized machine learning techniques for prediction of occupational accidents. Comput. Oper. Res. 2019, 106, 210–224. [Google Scholar] [CrossRef]
- Memon, N.; Patel, S.B.; Patel, D.P. Comparative Analysis of Artifcial Neural Network and XGBoost Algorithm for PolSAR Image Classifcation. In Pattern Recognition and Machine Intelligence; Deka, B., Ed.; Springer: Berlin/Heidelberg, Germany, 2019; pp. 452–460. [Google Scholar] [CrossRef]
- Tixier, A.; Hallowell, M.; Rajagopalan, B.; Bowman, D. Application of machine learning to construction injury prediction. Autom. Constr. 2016, 69, 102–114. [Google Scholar] [CrossRef] [Green Version]
- Song, Y.-y.; Lu, Y. Decision tree methods: Applications for classification and prediction. Shanghai Arch. Psychiatry 2015, 27, 130–135. [Google Scholar] [PubMed]
- Brownlee, J. XG Boost with Python: Gradient Boosted Trees with XGBoost and Scikit-Learn; Machine learning Mastery: New York, NY, USA, 2018. [Google Scholar]
- Zhang, Z. Introduction to machine learning: K-nearest neighbors. Ann. Transl. Med. 2016, 4, 218. [Google Scholar] [CrossRef] [PubMed] [Green Version]
- Hastie, T.; Tibshirani, R.; Friedman, J. The Elements of Statistical Learning: Data Mining, Inference, and Prediction, 2nd ed.; Springer: California, CA, USA, 2017. [Google Scholar]
- Lantz, B. Machine Learning with R, 2nd ed.; Packt Publishing: Birmingham, UK, 2015. [Google Scholar]
- Fernandez, A.; García, S.; Galar, M.; Prati, R.C.; Krawczyk, B.; Herrera, F. Learning from Imbalanced Data Sets, 1st ed.; Springer: New York, NY, USA, 2018. [Google Scholar]
- He, H.; Ma, Y. Imbalanced Learning: Foundations, Algorithms, and Applications, 1st ed.; John Wiley & Sons: Hoboken, NJ, USA, 2013. [Google Scholar]
- Berecki-Gisolf, J.; Smith, P.M.; Collie, A.; McClure, R.J. Gender differences in occupational injury incidence. Am. J. Ind. Med. 2015, 58, 299–307. [Google Scholar] [CrossRef] [PubMed]
| Publisher’s Note: MDPI stays neutral with regard to jurisdictional claims in published maps and institutional affiliations. |
© 2022 by the authors. Licensee MDPI, Basel, Switzerland. This article is an open access article distributed under the terms and conditions of the Creative Commons Attribution (CC BY) license (https://creativecommons.org/licenses/by/4.0/).


