Article

Bag of ARSRG Words (BoAW)

1
Information Technology Services, University of Naples “L’Orientale”, 80121 Naples, Italy
2
Secondary School Teacher of Computer Science, Mattei Istitute of Aversa, 81031 Aversa (CE), Italy
*
Author to whom correspondence should be addressed.
Current address: Via Nuova Marina, 59, 80133 Naples, Italy.
Mach. Learn. Knowl. Extr. 2019, 1(3), 871-882; https://doi.org/10.3390/make1030050
Submission received: 24 June 2019 / Revised: 30 July 2019 / Accepted: 1 August 2019 / Published: 5 August 2019
(This article belongs to the Section Learning)

Abstract

:
In recent years researchers have worked to understand image contents in computer vision. In particular, the bag of visual words (BoVW) model, which describes images in terms of a frequency histogram of visual words, is the most adopted paradigm. The main drawback is the lack of information about location and the relationships between features. For this purpose, we propose a new paradigm called bag of ARSRG (attributed relational SIFT (scale-invariant feature transform) regions graph) words (BoAW). A digital image is described as a vector in terms of a frequency histogram of graphs. Adopting a set of steps, the images are mapped into a vector space passing through a graph transformation. BoAW is evaluated in an image classification context on standard datasets and its effectiveness is demonstrated through experimental results compared with well-known competitors.

1. Introduction

In the last few years the problem of image classification has benefited from analytical approaches and data descriptors. The literature provides a wide range of methods in which the features are extracted and then stored in a discriminative format easily and correctly accessible by multimedia tools. Bag of visual words (BoVW) is one of the most commonly adopted approaches. It provides a dense sampling of features which can, in some cases, lead to a performance degradation. The primary concern for improvement is to reduce features, without losing the discrimination and important details of the image to describe. Clearly, it is an interesting challenge, and there can be multiple solutions maintaining the balance with performance. Our main motivations arise from two aspects of this particular research field. First, finding a connection between local and global features during image representation different from BoVW and, second, reducing considerably the number of features which encode the representation in order to improve the calculation and matching time. In this context, our aim is addressing two important aspects of the image classification problem. First, image representation: We faced the problem of encoding both spatial and structural information adopting a graph based representation termed ARSRG (attributed relational SIFT (scale-invariant feature transform) regions graph) [1]. Differently to what happens in the dense sampling step (e.g., dense SIFT) in BoVW, our approach selects only relevant candidates through the result of image segmentation. The second aspect concerns the image classification problem. We adopt a hybrid approach based on a graph-based method, to encode spatial information, and a local information method as in BoVW. Unlike BoVW, a word is conceived as a graph structure which represents an image. A graph words vocabulary, which contains prototypes also called medoids, using a graphs similarity measure and a clustering algorithm, is created. Finally, a graph is represented in form of a vector and contains the similarities, extracted through an appropriate metric, between the elements of vocabulary. Substantially, it is a mapping from a graph space to a vector space. The whole framework is tested within an object recognition task where the main problems concern the best image representation and matching, which greatly impacts performance.
The paper is organized as follows: In Section 2 BoVW approaches are analyzed. In Section 3 the proposed framework is described. Section 4 provides a wide experimental phase. Finally Section 5 reports conclusions and future works.

2. Related Work

The BoVW model is generally adopted to tackle image classification, object recognition and disparate computer vision problems. The main drawback concerns the features vector representation of an image which lacks relational and spatial information. Specifically, the visual words spatial arrangements describe the image and contain useful features for representation and classification. Recent proposed works encode both local and structural information using graph based image representation. Likewise BoVW, adopting different approaches, creates a graph-visual words vocabulary, leading to represent and classify each graph like a vector in terms of similarities among vocabulary elements. Unlike the proposed approach, the literature presents some interesting variants. The main difference, with the approaches listed below, concerns the segmentation step that allows the filtering of the features extracted from the original image. The removal of small segments, through a threshold, allows the exclusion of less representative features falling into them. This step appears to be very advantageous, especially during the matching phase.
In [2], the authors propose additional BoVW models: bag of graph words (BoGW), bag of singleton graphs (BoSG) and bag of visual graphs (BoVG), for digital object representation compliant to different applications. These models, which map images in graph space, are evaluated on IAM repository datasets and report great accuracy and execution time.
In [3], a new solution is presented for the graph classification problem by adopting two alternative graph representations: the bag of vertices (BoV), which utilizes node features, extracted by learning procedures, and the bag of partitions (BoP), which adopts standard features, extracted by metrics applications. The experimental procedure is performed on 43 real-life graphs from seven different domains and provides a significant improvement in graph classification performance.
In [4], the authors propose the bag of visual graphs (BoVG), a paradigm to describe the spatial relations of visual words using a codebook of visual-word layouts, in the form of graphs. This representation provides a vector for encoding imagse which includes both the frequency of the occurrence of visual words and their spatial relationships.
In [5], the authors propose an attributed multi-scale graph-based approach in which the dictionary label describes the geometric layout of the local information considering the different scales. They find the optimal matching by computing the distances of any graph pairs described by image grids. Then, a kernel for image classification is built measuring similarities of graphs at different scales. Experimental results are performed on the Caltech 101, Caltech 256, Scene Categories, and Six Actions datasets.
In [6], the authors propose an innovative bag of features (BoF) approach based on a graph structure in hierarchical form. It leads to gathering structural and local features, with the purpose of creating a selective structural model adapted for a particular object classification task.
In [7], the authors work on improvement of the discriminating power of BoVW. Using graph sequence representation they build a model which includes the structural relations between the interest points. The model provides competitive results for human action recognition and can be adopted to address the graph sequences classification problem.
In [8], an algorithm to represent the geometric layout of the BoVW model is described. The relative position of visual words is encoded by subdividing the image into a grid and detecting each point as an origin. Indeed, it includes only the spatial information and not the frequency of occurrence of visual words. The result is a features vector useful for image retrieval and classification.
In [9], the authors propose an approach, called Hybrid Geometric Spatial Image Representation (HGSIR), which includes a mixture of histograms calculated on the rectangular, triangular and circular regions of each image. The performance of the proposed approach is measured on five standard image datasets.
In [10], the authors propose a spatial layout-based approach, called Region Similarity Arrangement (RSA), with the purpose of enhancing the bag of words BoW model in image retrieval. This method employs the geometric position of interest regions. For each image it builds a region property space describing each regions pair as a point in a polar coordinate system (scale, angle) and includes this information in the BoW array.

3. Bag of ARSRG Words

The BoVW [11] paradigm requires a dense sampling during features extraction to achieve high performance. Our aim is to create a hybrid scheme with the purpose of joining BoVW and visual oriented graph (VoG) paradigms. Particularly, we build an image description which includes both global and spatial information of the feature points. In contrast to the dense sampling approach (e.g., dense SIFT [12]), the descriptors are selected only among candidates, detected through image segmentation results. In this way, images will be divided into regions of descriptors. Indeed, regions too small, or not very discriminant, are discarded through a thresholding procedure. Finally, we obtain a drastic reduction of the points that characterize the image, with the addition of spatial information. This representation requires that each feature point must necessarily belong to a single image region. For this purpose, images are represented by structures much more complex, such as graphs. The proposed framework, described in pseudocode version of Algorithm 1, named bag of ARSRG words(BoAW), is composed of the following steps:
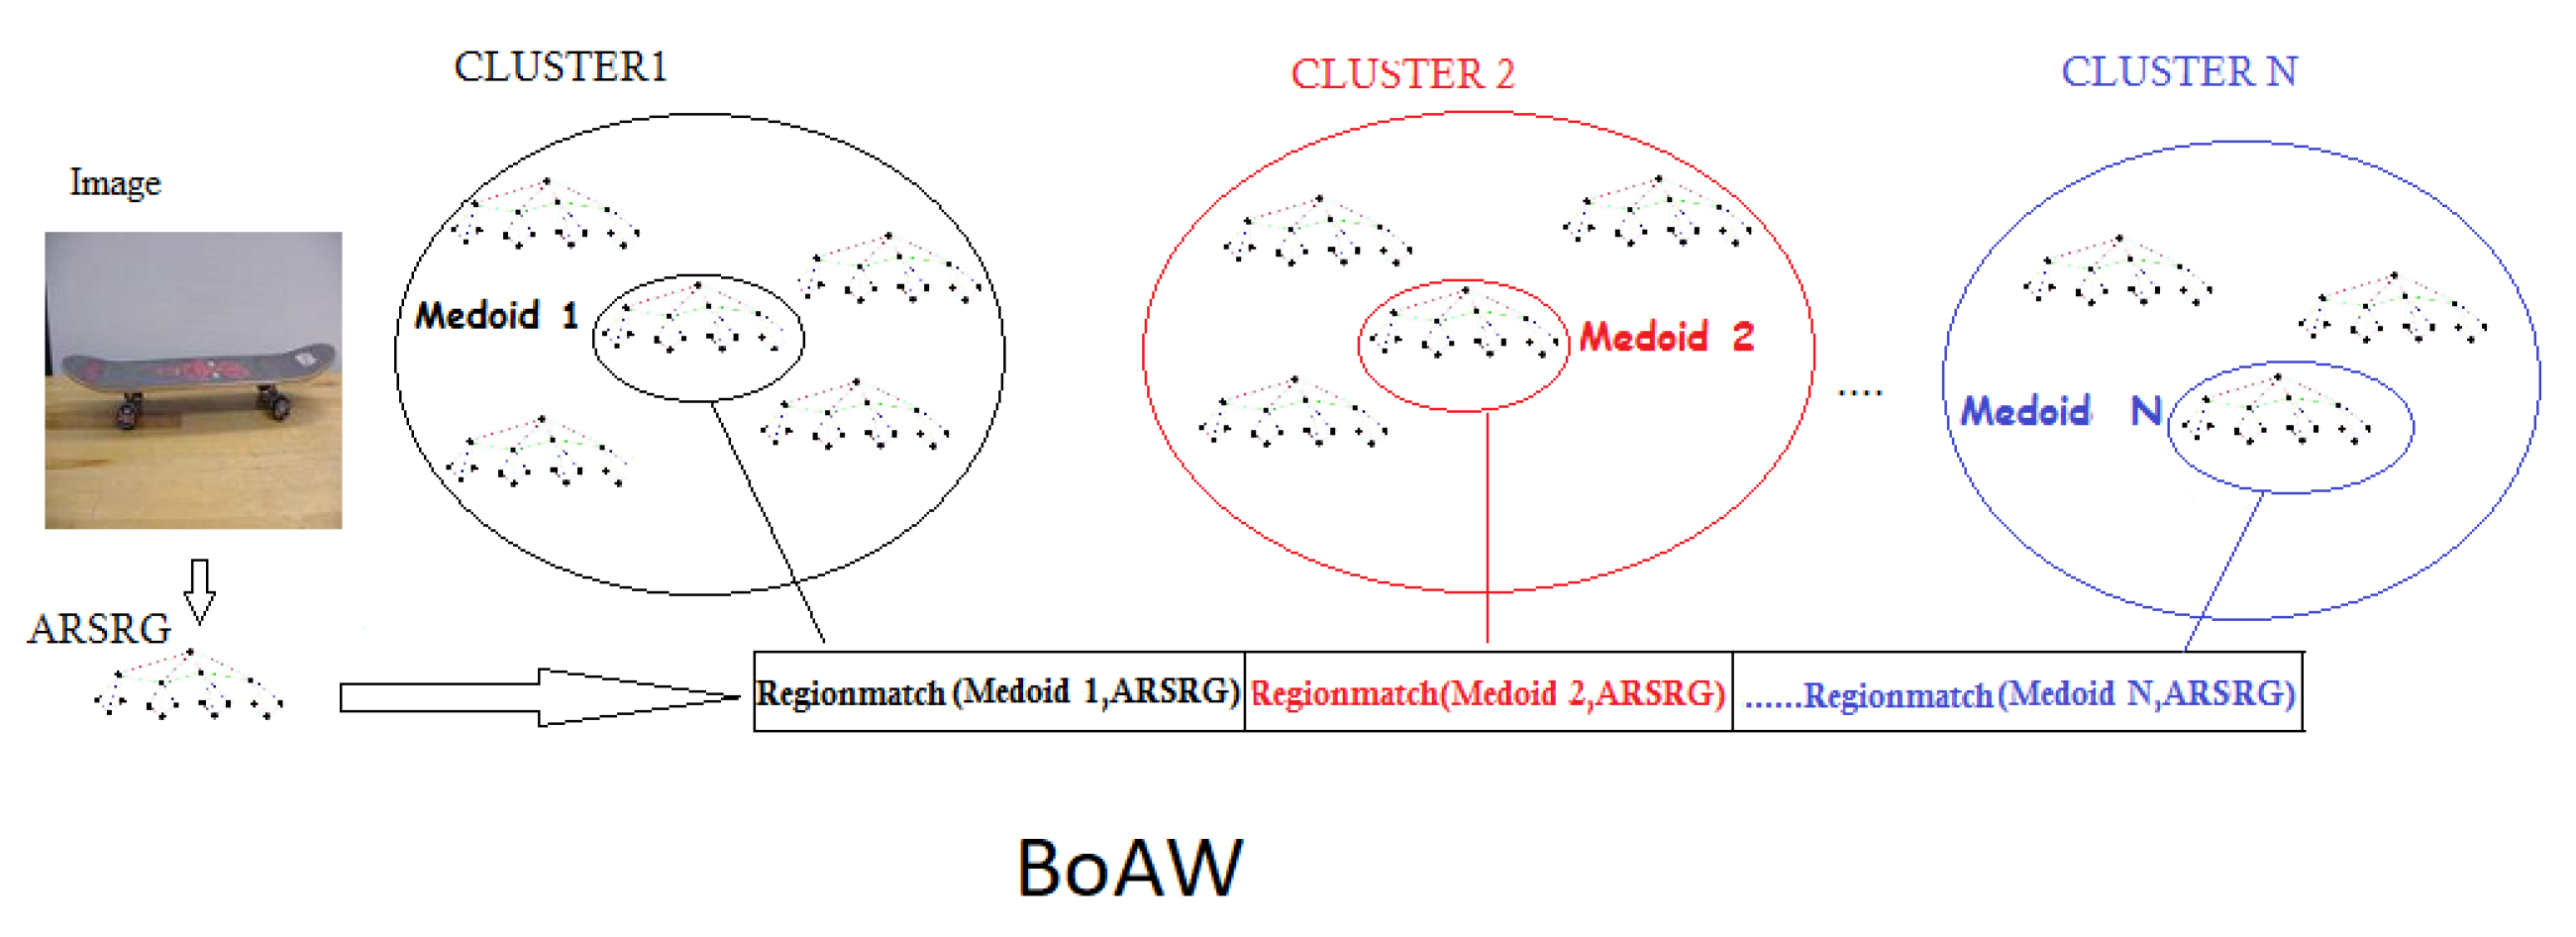
  • Image to graph (lines 2–4). The image is represented using a graph structure named ARSRG [1]. From now, we will identify the ARSRG structure simply as a graph;
  • Similarity matrix (line 8). A matrix to store the distance of a fixed number of graphs for each image class is created;
  • Graph words vocabulary (line 9). A clustering algorithm on the similarity matrix is applied. The goal is the production of a vocabulary consisting of the graph prototypes of each cluster.
  • Graph to vector (lines 10–12). Similarities between graphs and graph prototypes of vocabulary are calculated. The ith element of the BoAW vector represents a graph which will be equal to the distance between the ith element of the vocabulary and the graph itself;
  • Image classification (line 13). An algorithm in the vector space for the classification phase is adopted;
In the following sections the different phases in detail are described. A graphical example of the proposed framework in Figure 1 is shown. Mediods, representing the clusters obtained, encode the image-classes and are adopted for the BoAW vector representation, step 4. The number of clusters is closely related to classes which are included in the experimental datasets and is obtained empirically with the aim of optimizing performance.
Algorithm 1
1:
procedureBOAW(Images)
2:
for all imgImages do
3:
  Graphsi = Compute_ARSRG()
4:
end for
5:
for all ARSRGGraph do
6:
  Gi = Selection_Training(Graphs, n, c)
7:
end for
8:
W = Build_Similarity_Matrix(G)
9:
M = Find_Medoids(W)
10:
for all ARSRGGraph do
11:
  Vector_BoAW = Compute_BoAW(M, Graphs)
12:
end for
13:
Classi f ication = Logistic_Label_Propagation(Vector_BoAW)
14:
 
15:
end procedure

3.1. Image to Graph: ARSRG

We adopted the attributed relational SIFT-based regions graph (ARSRG) [1] as image representation. The structure is composed of three layers: root node, region nodes and leaf nodes. The root node represents the entire image and connects nodes to the second level, the region adjacent graph (RAG) [13]. RAG nodes describe the spatial relations among areas. Regions of interest (ROIs) of the image are extracted through a segmentation algorithm [14]. In this way, adjacent regions are encoded by connected nodes. Finally, leaf nodes encode the set of scale-invariant feature transform (SIFT) [15] descriptors extracted from the original image, with the purpose of creating a unique association between the SIFT and the corresponding region. The A R S R G 1 s t structure region based can be formalized as the tuple
G = ( V r e g i o n s , E r e g i o n s , V F S I F T , E r e g i o n s S I F T )
where:
  • V r e g i o n s is a set of region nodes;
  • E r e g i o n s V r e g i o n s × V r e g i o n s is a set of unidirectional edge, where e E r e g i o n s and e = ( v i , v i ) is an edge between two nodes ( v i , v j ) V r e g i o n s ;
  • V F S I F T is a set of SIFT nodes;
  • E r e g i o n s S I F T V r e g i o n s × V F S I F T is a set of directional edge, where e E r e g i o n s S I F T e e = ( v i , v f j ) is an edge from the source node v i V r e g i o n s to a destination node v f j V F S I F T ;
The computational complexity is related to the cardinality of the four sets: V r e g i o n s —number of regions extracted through segmentation, E r e g i o n s —number of connections among regions, V F S I F T —number of SIFT, E r e g i o n s S I F T —number of SIFT belonging to regions.

3.2. Similarity Matrix

A similarity matrix is built to describe the distance of a fixed number of graphs. The matrix will be of n c × n c size, where n is the number of graphs belonging to the c classes. Each element of the similarity matrix represents the distance between two graphs. To compare two graphs, an additional matrix, called D I S T M A T R I X , is created. It is composed of a certain number of rows and columns corresponding to the number of regions (nodes) of the first and second graph respectively. Each element contains the difference of size (pixels) in absolute value between regions of compared graphs. A comparison between the corresponding regions is performed when the minimum value of each row in D I S T M A T R I X is found. Matching between regions is managed with an algorithm based on graph matching and ratio testing [16]. A SIFT key P k S from the source image is positively SIFT matched to a SIFT key P l d to target image if the distance:
U k s U l d 2 = min j = 1 , .... m ( U k s U j d 2 )
U k s U l d 2 U k s U l 2 d 2 < ρ
where U l 2 d is the descriptor of the target image with the second shortest distance from U k s and 0 ρ 1 , called the ratio value, is a threshold that controls the false positive. A support matrix S is adopted to compare SIFTs belonging to regions. The dimension of S is equal to the number of SIFTs of the first region, rows, and second region, columns. Two SIFTs will have a match if they validate the criteria of the ratio test [16]. A match between SIFT i and SIFT j is identified as value 1 at position i , j in the matrix S. If two regions have a number of SIFT less than or equal to a given threshold, they will not contribute to the accumulation of matches found. The procedure is performed K times and at each step excludes minimum values calculated at previous iterations. The minimum of D I S T M A T R I X is extracted due to regions having a very small pixel difference. Also similar in terms of content, are those with a higher probability of match. The total number of SIFT matches found between the two graphs is divided by the total number of SIFTs belonging to the second graph. The similarity matrix creation is the most expensive term of the framework. The computational complexity can be estimated in the order of N 2 ( K ) N , where N is the number of maximum regions adopted during the comparison between two structures and K represents the number of iterations during the procedure.

3.3. Graph Words Vocabulary

Inspired by BoVW [17], we proceed with a clustering algorithm application on the similarity matrix in order to produce a vocabulary consisting of graphs representing prototypes for each cluster. K-medoids [18], after examining different methods operating on graphs, is adopted. It allows the obtainment of medoids (ARSRG prototypes) from the similarity matrix, indeed medoids are structures with a minimum distance within a cluster. Similarity matrix values are adopted as the distance between ARSRG structures. In this way the clustering algorithm adopts the same distance measures of the similarity matrix. K-medoids takes as input parameters, the number of clusters to achieve, and as output returns the medoids which will be part of the dictionary, similar to what happens in BoVW. In contrast to BoVW, where the words are extracted with only local information, K-medoids considers the words represented by ARSRG structures. If we mistakenly opted to consider ARSRG regions as vocabulary words, a number of unbalanced regions, due to the result of image segmentation, would have a consequent loss of spatial information. Local information, in conjunction with the spatial information, will then be adopted to perform creation and comparison of BoAW. Given the medoid m i at step t belonging to the range { 1 , , k } and given the element x j of dataset belonging to the range { 1 , , n } , where x j m i for each ( i , j ) . Given d ( · ) the distance obtained from the input similarity matrix, the steps of the algorithm can be summarized as:
  • k points are randomly chosen from the n data and are considered as initial medoids;
  • Each point is associated with the nearest medoid, using the input similarity matrix;
  • For each medoid m and for each non-medial point x, m with x is exchanged and the total cost configuration is calculated;
  • The minimum cost configuration is chosen and the procedure is repeated from step 2. The cost is defined as
    c o s t = i = 1 k j = 1 n d ( x j , m i ) .
  • The procedure is repeated until the configuration within each cluster remains practically unchanged.
The computational complexity is related to n dataset elements and k mediods. The cost can be estimated in the order of k ( n k ) 2 , that can be reduced to n 2 .

3.4. Graph to Vector

The BoAW consists of a vector in which elements describe similarities among graphs and prototypes of vocabulary. The algorithm adopted to calculate the distances is the same as described in Section 3.2. As previously discussed, the algorithm detects the number of SIFT matched regions, belonging to images, between two graphs. Unlike the BoVW, in which the number of SIFT images having the minimum distance from each vocabulary words are found, we count the number of SIFT matched images between the graph and each prototypes of the vocabulary. Unlike the BoVW, in which a word represents a part, a named patch of image that includes only local features, in the proposed approach a word represents an entire image, a graph structure that includes local and global features. Formally, given a labeled set of sample graphs
S = { G 1 , G 2 , G 3 , , G n }
a graph similarity measure s ( G i , G j ) is considered. We can define a set of prototypes as
P = { P 1 , P 2 , P 3 , , P m }
taken appropriately from the set S , using a clustering algorithm. Computing the similarities measure s of a given input graph G j with each prototype P k P , leads to m similarities
s 1 ( G j , P 1 ) , , s m ( G j , P m ) .
A graph can be expressed in an m-dimensional array ( s 1 , , s m ) . Now, we can define the BoAW vector as
Φ j P ( G j ) = ( s ( G j , P 1 ) , , s m ( G j , P m ) )
where s ( G j , P i ) is a graph similarity distance between graph G j and the i t h prototype. The computational complexity is linked to three factors: number of graphs n belonging to set S, number of prototypes m belonging to set P, and the type of graph similarity s.

4. Results

In this section we describe the results obtained on public datasets. In order to correctly assess performance, the setup as described in well-known object recognition methods is adopted, in which the crucial point concerns the selection of graph prototypes with purpose to best represent objects-classes.

4.1. Datasets

We test our approach on a dataset containing object images. Datasets adopted are:
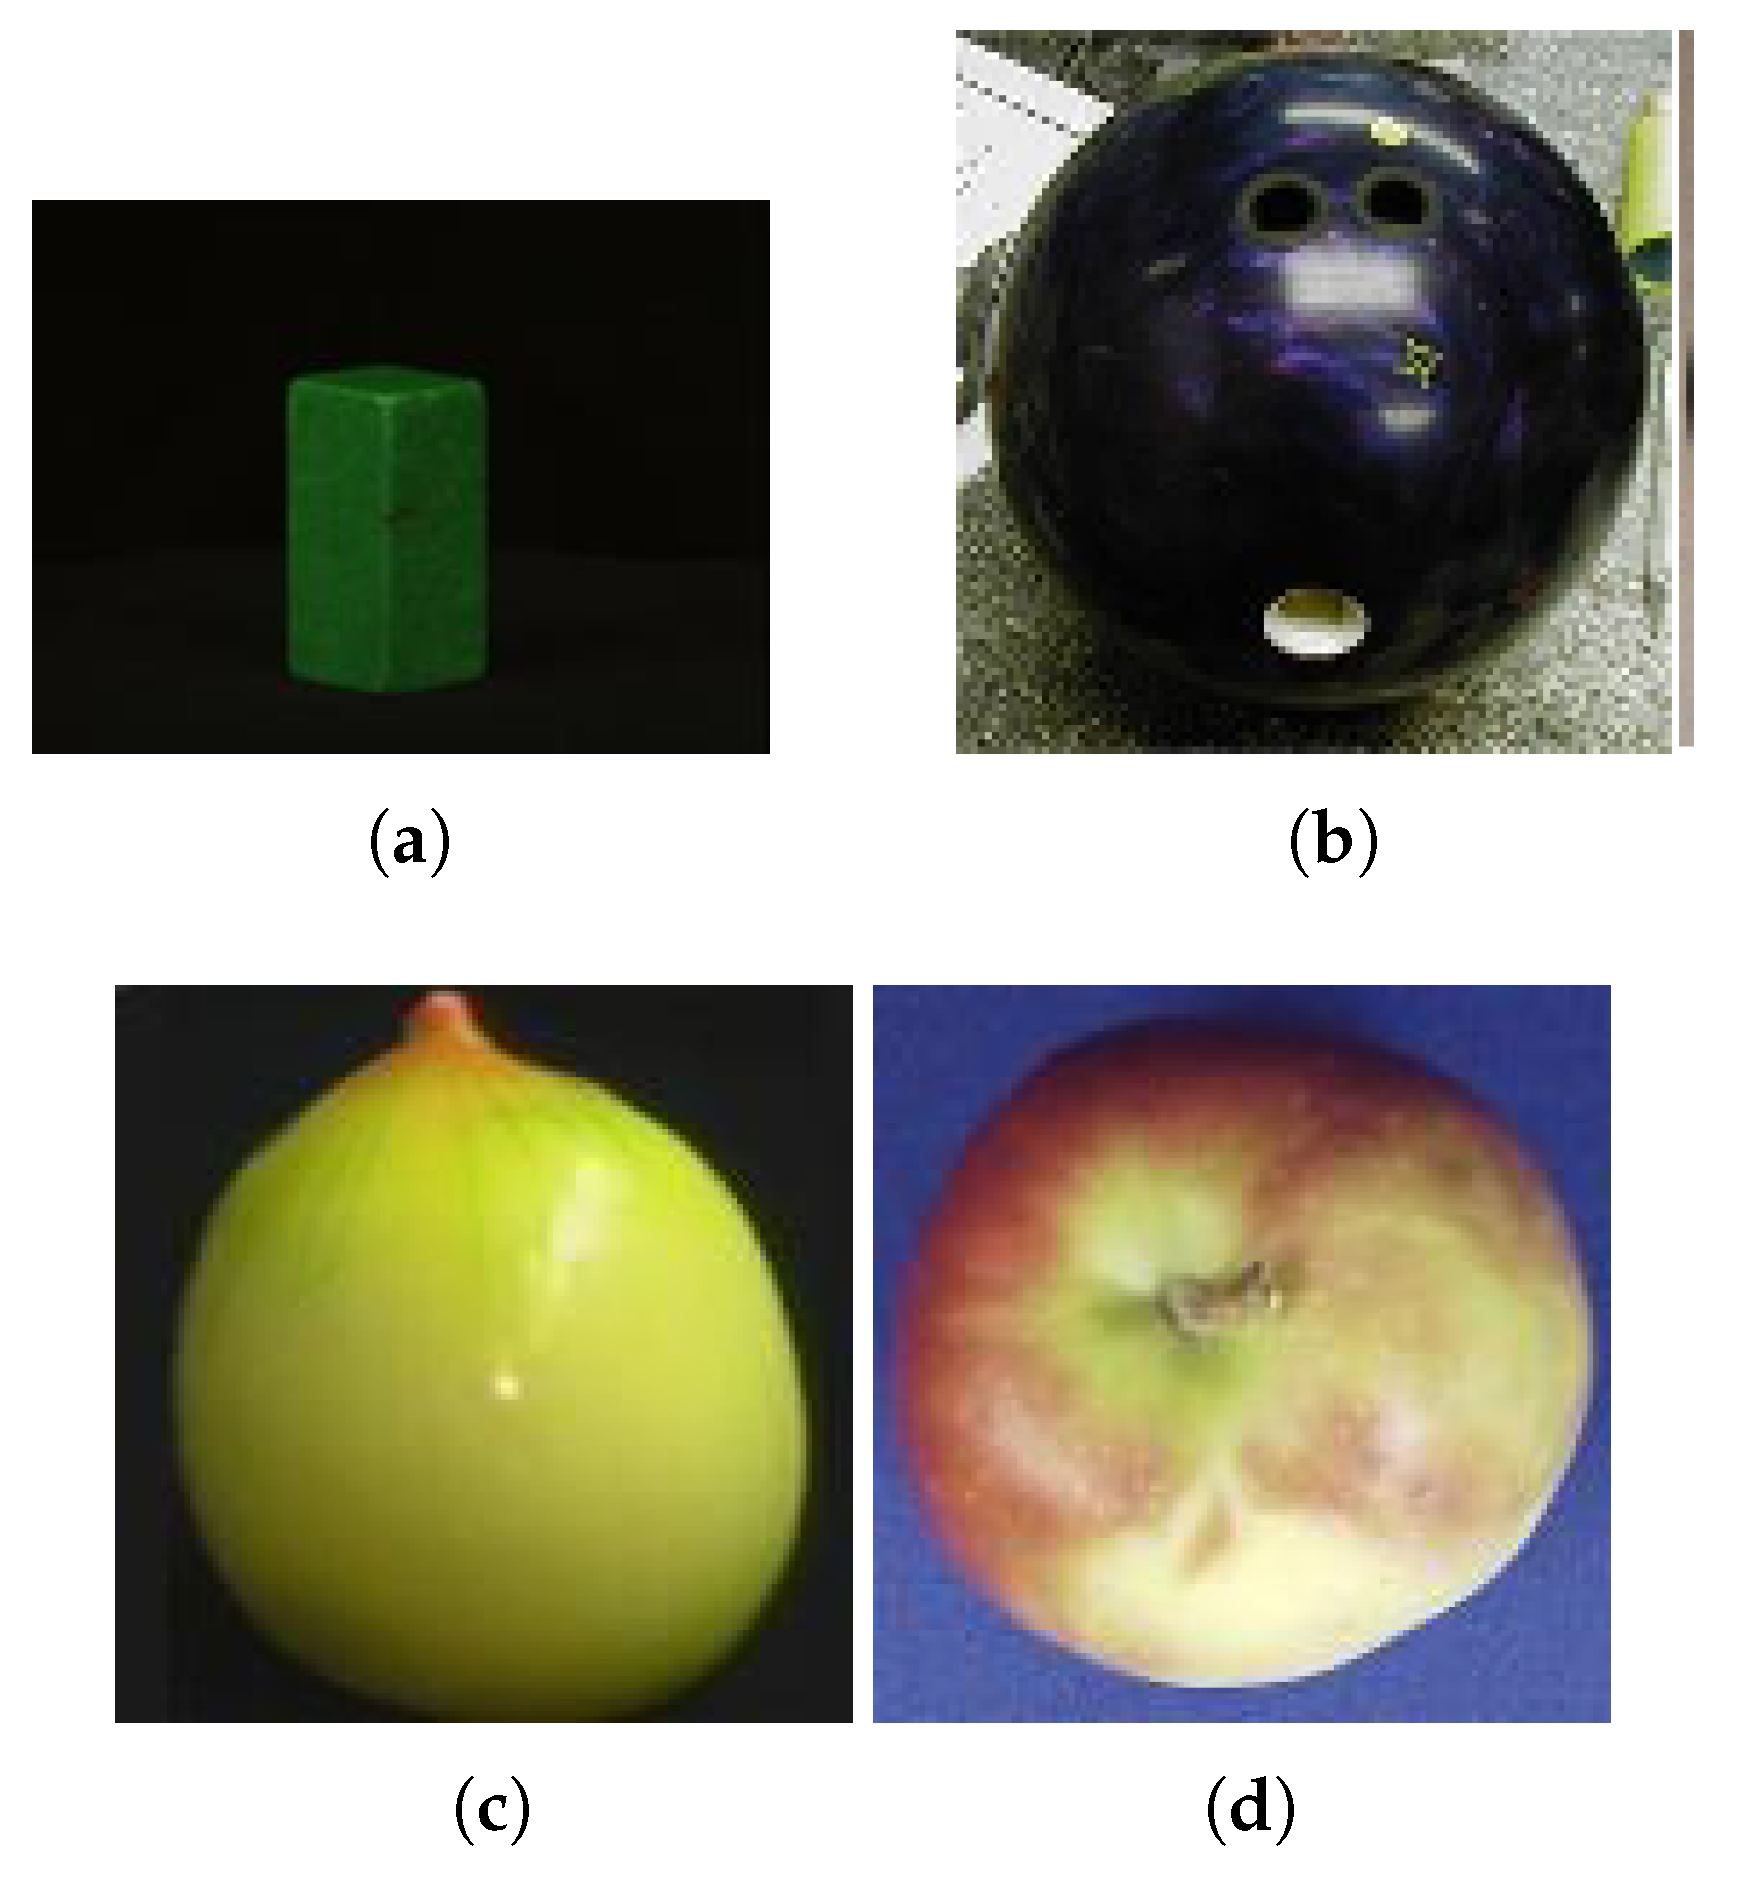
  • Amsterdam Library of Object Images (ALOI) [19]. It is a color image selection of 1000 small objects. Objects was recorded varying viewing angle, illumination angle and illumination color in order to capture the sensory variation. In addition was captured wide-baseline stereo image.
  • Caltech 101 [20]. It is an objects image collection belonging to 101 categories, with about 40 to 800 images per category. Most categories have about 50 images.
  • Columbia Object Image Library (COIL-100) [21]. It is a image collection of 100 objects. The images were taken at pose internals of 5 degrees.
  • The ETH-80 [22]. It is a image collection of 80 objects from 8 categories. Each object is described by 41 different views, thus obtaining a total of 3280 images.
ALOI, COIL-100 and ETH-80 datasets are represented on a simple background then the classification is less difficult than the dataset Caltech 101 where images have a not uniform background. Figure 2 shows some examples of datasets.

4.2. Experimental Setup

The classification stage is managed with logistic label propagation (LLP) [23]. Tests are performed using a one-versus-all (OvA) paradigm for 30 executions. A shuffling operation is applied to ensure the training and test set are always different. Images, before performing the procedure of Section 3.1, are scaled to 150 × 150 pixels size, to avoid performance degradation. Image segmentation is performed using the algorithm in [14] and the default parameters are: the threshold for color quantization is in the range 0 600 , the threshold for the region merging is fixed to 0.4 , then the scale factor is automatically calculated from the image size. The SIFT dimensional vector is fixed to 128. Settings for graph matching are: ρ = 0.6 threshold value for false positives, and the parameter for the minimum number of SIFTs matched, for which two regions can be considered similar, is fixed at 3. For D I S T M A T R I X the threshold value, which excludes too small regions is fixed to 100. The number of iterations K about the minimum on the rows in the matrix D I S T M A T R I X is fixed to 35. Finally, similarity matrix is built through an appropriate procedure that takes the graph of each classes and produces the expected output vector. BoAW is computed through a special procedure which takes, as input, the vector containing the portion of the graphs of the similarity matrix, the vector of all graphs of a given class, and finally the medoids. The framework was completely developed in Matlab code. Moreover, we adopted the related code, in C language, of the JSEG algorithm [14], and the related code, a combination of Matlab and C language, of the SIFT [15] algorithm, to perform image segmentation. Finally, the performances are measured in terms of accuracy, based on the OvA paradigm, according to the following formula:
A c c u r a c y = T P + T N T P + T N + F P + F N .
  • TP. Positive classified image belonging to the positive class;
  • TN. Negative classified image belonging to the negative class;
  • FP. Positive classified image belonging to the negative class;
  • FN. Negative classified image belonging to the positive class;

4.2.1. ALOI

Table 1 reports experiments performed on the ALOI dataset. Results are listed in order of average accuracy and the approach that provided the best performance is highlighted. In order to validate the robustness of the proposed framework, experiments are performed thorough a considerable increase in the number of images. In addition, we adopted the same settings reported in [24] to perform a correct comparison. Therefore, only 100 objects are considered, images are converted to grayscale, and the second image of each class is used for training and the others for testing. Two images are taken into account for each class, with a total of 200 images. At each iteration, for each class, an additional training image is added. In Table 1 we present only the results considering a batch of 400 images, since intermediate results do not provide particular improvements. We show the results achieved by BoVW and those obtained in [24] using some variants of linear discriminant analysis (ILDAaPCA, batchLDA, ILDAonK and ILDAonL) and in [25] (ARSRGemb). ILDAaPCA creates a PCA subspace using the k dimensional reconstructive subspace and c 1 additional vectors having discriminative features. Those additional vectors are created by vectors that would be removed when the subspace to k-dimensions is deleted. Using this approach, those descriptive features are adopted. Afterwards, the final LDA output from the resulting obtained subspace is built. BatchLDA creates a new model for each step through the same number of images in order of incremental approach. ILDAonK increases a PCA truncated to the size k ^ = k + c 1 . The parameter k includes 80% of the information as a total variance ratio and of the constant reference model during the test. ILDAonL increases the ( c 1 )-dimensional LDA basis and exclusively descriptive information is adopted.
As can be seen, BoAW is able to provide best performance for the object recognition task. Indeed, the combination of local and spatial information provides clear benefits in image representation and matching.

4.2.2. Caltech 101

Table 2 summarizes the results obtained on the Caltech 101 dataset. Experimental results are performed comparing the BoAW with BoVW based on pyramidal representation [11]. Experimental comparisons are performed using the following image categories: bowling, cake, calculator, cannon, cd, chess-board, joy-stick, skateboard, spoon and umbrella. The best performances are obtained with a training set, and the test set at 60% and 40% of the dataset respectively. Results are listed in form of average accuracy and the approach that provided the best performance is highlighted.
As can be seen the performance differs when images are composed of non-uniform backgrounds. BoVW is more efficient and does not suffer this detail, and is otherwise decisive for the proposed approach which incorporates structural information. This aspect considerably distorts image representation and consequently the classification phase. This problem could be solved with a segmentation phase, during the preprocessing, to remove the uninformative background or with a filtering application, thus going to work exclusively on the object to be represented. This loophole does not always work because removing the background is not easy.

4.2.3. COIL-100

Table 3 shows results on the COIL-100 dataset. In order to obtain a valid comparison with the methods in [26,27] we adopted the same settings: 25 objects are randomly selected and 11% are used as the training set and 89% are used as the testing set. Therefore, results obtained by BoVW are shown and those obtained in [26,27] by applying their solution (VFSR) and the approaches proposed in [28] (gdFil), in [29] (APGM), in [30] (VEAM), in [31] (DTROD-AdaBoost), in [32] (RSW+Boosting), in [33] (Sequential Patterns), in [34] (LAF) and in [25] (ARSRGemb). Results are listed in form of average accuracy and the approach that provided the best performance is highlighted. Also in this case our approach confirms its qualities obtaining the best performance.

4.2.4. ETH-80

Table 4 shows results on the ETH-80 dataset. We adopted the same setup in [26] to perform a direct comparison. The setting consists of six categories (apples, cars, cows, cups, horses, and tomatoes). The training set is composed of four objects for each class and 10 different views for each object with an amount of 240 images. The testing set is composed of 60 per category (15 views per object). We present tests performed by BoVW and those achieved in [26] by employing the solution proposed in [25] (ARSRGemb), [28] (gdFil), in [29] (APGM), and in [30] (VEAM). Also in this case the results are listed highlighting the accuracy of the best approach. As can be seen BoAW provides better results than competitors also when view points changes occur.

5. Conclusions

In this work, the object recognition problem is addressed through a new paradigm. We propose an image classification approach oriented to more complex structures that incorporate spatial information and local feature points. The goal is providing adequate performance with a certain number of reduced image feature points compared to the BoVW approach that makes a dense sampling during image description. Indeed, BoAW adopts, on average, 95% less feature points than BoVW. The ARSRG building process takes an average 0.1 ms due to massive filtering on features and the successively clustering algorithm creates a dictionary reducing the number of mediods. It has been shown, through a large experimental phase, that BoAW is robust in the case of images with uniform backgrounds while partially failing in the case of non uniform backgrounds. This aspect is linked to the image representation, which is not able to capture enough structure to be considered important in the matching phase. Future works concern the possibility of improving the image description and adapting the framework to any type of image classification/retrieval application.

Author Contributions

Both authors conceived the study and contributed to the writing of the manuscript and approved the final version.

Acknowledgments

This work is dedicated to Alfredo Petrosino. With him we took our first steps in the field of Computer Science. During these years spent together, we learned the firmness in achieving the goals and the love and passion for the work. We will be forever grateful. Thank you to our great master.

Conflicts of Interest

The authors declare no conflict of interest.

References

  1. Manzo, M.; Petrosino, A. Attributed relational sift-based regions graph for art painting retrieval. In Proceedings of the International Conference on Image Analysis and Processing, Naples, Italy, 9–13 September 2013; Springer: Berlin, Germany, 2013; pp. 833–842. [Google Scholar]
  2. Silva, F.B.; Werneck, R.d.O.; Goldenstein, S.; Tabbone, S.; Torres, R.d.S. Graph-based bag-of-words for classification. Pattern Recognit. 2018, 74, 266–285. [Google Scholar] [CrossRef]
  3. Bhuiyan, M.; Al Hasan, M. Representing Graphs as Bag of Vertices and Partitions for Graph Classification. Data Sci. Eng. 2018, 3, 150–165. [Google Scholar] [CrossRef] [Green Version]
  4. Da Silva, F.B.; Goldenstein, S.; Tabbone, S.; Torres, R.D.S. Image classification based on bag of visual graphs. In Proceedings of the IEEE International Conference on Image Processing (ICIP), Melbourne, VIC, Australia, 15–18 September 2013; pp. 4312–4316. [Google Scholar]
  5. Hu, D.; Xu, Q.; Tang, J.; Luo, B. Multi-scale Attributed Graph Kernel for Image Categorization. In Proceedings of the Chinese Conference on Pattern Recognition and Computer Vision (PRCV), Guangzhou, China, 23–26 November 2018; Springer: Berlin, Germany, 2018; pp. 610–621. [Google Scholar]
  6. Clément, M.; Kurtz, C.; Wendling, L. Learning spatial relations and shapes for structural object description and scene recognition. Pattern Recognit. 2018, 84, 197–210. [Google Scholar] [CrossRef]
  7. Cortés, X.; Conte, D.; Cardot, H. Bags of Graphs for Human Action Recognition. In Proceedings of the Joint IAPR International Workshops on Statistical Techniques in Pattern Recognition (SPR) and Structural and Syntactic Pattern Recognition (SSPR), Beijing, China, 17–19 August 2018; Springer: Berlin, Germany, 2018; pp. 429–438. [Google Scholar] [Green Version]
  8. Penatti, O.A.; Silva, F.B.; Valle, E.; Gouet-Brunet, V.; Torres, R.D.S. Visual word spatial arrangement for image retrieval and classification. Pattern Recognit. 2014, 47, 705–720. [Google Scholar] [CrossRef]
  9. Ali, N.; Zafar, B.; Riaz, F.; Dar, S.H.; Ratyal, N.I.; Bajwa, K.B.; Iqbal, M.K.; Sajid, M. A hybrid geometric spatial image representation for scene classification. PLoS ONE 2018, 13, e0203339. [Google Scholar] [CrossRef] [PubMed]
  10. Zhang, D.; Tang, J.; Jin, G.; Zhang, Y.; Tian, Q. Region similarity arrangement for large-scale image retrieval. Neurocomputing 2018, 272, 461–470. [Google Scholar] [CrossRef]
  11. Lazebnik, S.; Schmid, C.; Ponce, J. Beyond bags of features: Spatial pyramid matching for recognizing natural scene categories. In Proceedings of the 2006 IEEE Computer Society Conference on Computer Vision and Pattern Recognition (CVPR’06), New York, NY, USA, 17–22 June 2006; Volume 2, pp. 2169–2178. [Google Scholar]
  12. Liu, Y.; Liu, S.; Wang, Z. Multi-focus image fusion with dense SIFT. Inform. Fus. 2015, 23, 139–155. [Google Scholar] [CrossRef]
  13. Trémeau, A.; Colantoni, P. Regions adjacency graph applied to color image segmentation. IEEE Trans. Image Process. 2000, 9, 735–744. [Google Scholar] [CrossRef] [PubMed]
  14. Deng, Y.; Manjunath, B. Unsupervised segmentation of color-texture regions in images and video. IEEE Trans. Pattern Anal. Mach. Intell. 2001, 23, 800–810. [Google Scholar] [CrossRef] [Green Version]
  15. Lowe, D.G. Object recognition from local scale-invariant features. In Proceedings of the Seventh IEEE International Conference on Computer Vision, Kerkyra, Greece, 20–27 September 1999; Volume 99, pp. 1150–1157. [Google Scholar]
  16. Sanromà Güell, G.; Alquézar Mancho, R.; Serratosa Casanelles, F. Graph matching using sift descriptors: an application to pose recovery of a mobile robot. In Proceedings of the 5th International Conference on Computer Vision Theory and Applications, Angers, France, 17–21 May 2010; pp. 249–254. [Google Scholar]
  17. Szeliski, R. Computer Vision Algorithms and Application; Springer: Berlin, Germany, 2003. [Google Scholar]
  18. Kaufman, L.; Rousseeuw, P.J. Finding Groups in Data: An Introduction To Cluster Analysis; John Wiley & Sons: Hoboken, NJ, USA, 2009; Volume 344. [Google Scholar]
  19. Geusebroek, J.M.; Burghouts, G.J.; Smeulders, A.W. The Amsterdam library of object images. Int. J. Comput. Vis. 2005, 61, 103–112. [Google Scholar] [CrossRef]
  20. Fei-Fei, L.; Fergus, R.; Perona, P. Learning generative visual models from few training examples: An incremental bayesian approach tested on 101 object categories. Comput. Vis. Image Underst. 2007, 106, 59–70. [Google Scholar] [CrossRef]
  21. Nene, S.A.; Nayar, S.K.; Murase, H. Object Image Library (Coil-100). Available online: http://citeseerx.ist.psu.edu/viewdoc/summary?doi=10.1.1.360.6420 (accessed on 1 August 2019).
  22. Leibe, B.; Schiele, B. Analyzing appearance and contour based methods for object categorization. In Proceedings of the IEEE Computer Society Conference on Computer Vision and Pattern Recognition, Madison, WI, USA, 18–20 June 2003; Volume 2, p. II–409. [Google Scholar]
  23. Kobayashi, T.; Watanabe, K.; Otsu, N. Logistic label propagation. Pattern Recognit. Lett. 2012, 33, 580–588. [Google Scholar] [CrossRef] [Green Version]
  24. Uray, M.; Skocaj, D.; Roth, P.M.; Bischof, H.; Leonardis, A. Incremental LDA Learning by Combining Reconstructive and Discriminative Approaches. In Proceedings of the British Machine Vision Conference 2007 (BMVC), Warwick, UK, 10–13 September 2007; pp. 1–10. [Google Scholar]
  25. Manzo, M.; Pellino, S.; Petrosino, A.; Rozza, A. A novel graph embedding framework for object recognition. In Proceedings of the European Conference on Computer Vision, Zurich, Switzerland, 6–12 September 2014; Springer: Berlin, Germany, 2014; pp. 341–352. [Google Scholar]
  26. Morales-González, A.; Acosta-Mendoza, N.; Gago-Alonso, A.; García-Reyes, E.B.; Medina-Pagola, J.E. A new proposal for graph-based image classification using frequent approximate subgraphs. Pattern Recognit. 2014, 47, 169–177. [Google Scholar] [CrossRef]
  27. Morales-González, A.; García-Reyes, E.B. Simple object recognition based on spatial relations and visual features represented using irregular pyramids. Multimed. Tools Appl. 2013, 63, 875–897. [Google Scholar] [CrossRef]
  28. Gago-Alonso, A.; Carrasco-Ochoa, J.A.; Medina-Pagola, J.E.; Fco, J.; Martínez-Trinidad, J.F. Full duplicate candidate pruning for frequent connected subgraph mining. Integr. Comput. Aided Eng. 2010, 17, 211–225. [Google Scholar] [CrossRef] [Green Version]
  29. Jia, Y.; Zhang, J.; Huan, J. An efficient graph-mining method for complicated and noisy data with real-world applications. Knowl. Inf. Syst. 2011, 28, 423–447. [Google Scholar] [CrossRef]
  30. Acosta-Mendoza, N.; Gago-Alonso, A.; Medina-Pagola, J.E. Frequent approximate subgraphs as features for graph-based image classification. Knowl. Based Syst. 2012, 27, 381–392. [Google Scholar] [CrossRef]
  31. Wang, Y.; Gong, S. Tensor discriminant analysis for view-based object recognition. In Proceedings of the 18th International Conference on Pattern Recognition, Hong Kong, China, 20–24 August 2006; Volume 3, pp. 33–36. [Google Scholar]
  32. Marée, R.; Geurts, P.; Piater, J.; Wehenkel, L. Decision trees and random subwindows for object recognition. In Proceedings of the ICML Workshop on Machine Learning Techniques for Processing Multimedia Content (MLMM2005), Bonn, Germany, 11 August 2005. [Google Scholar]
  33. Morioka, N. Learning object representations using sequential patterns. In Proceedings of the Australasian Joint Conference on Artificial Intelligence, Auckland, New Zealand, 1–5 December 2008; Springer: Berlin, Germany, 2008; pp. 551–561. [Google Scholar]
  34. Obdrzalek, S.; Matas, J. Proceedings of the Object Recognition using Local Affine Frames on Distinguished Regions, Cardiff, UK, 2–5 September 2002; Volume 2, pp. 113–122.
Figure 1. Bag of ARSRG words (BoAW). ARSRG (attributed relational SIFT regions graph), SIFT (scale-invariant feature transform).
Make 01 00050 g001
Figure 2. Dataset images: (a) ALOI, (b) Caltech 101, (c) COIL-100, (d) ETH-80.
Make 01 00050 g002
Table 1. Results on the ALOI dataset.
Method2004008001200160020002400280032003600
BoAW98.29%92.83%98.80%96.80%96.76%98.15%89.52%82.65%79.96%79.88%
ARSRGemb86.00%90.00%93.00%96.00%95.62%96.00%88.00%81.89%79.17%79.78%
BoVW49.60%55.00%50.42%50.13%49.81%48.88%49.52%49.65%48.96%49.10%
batchLDA51.00%52.00%62.00%62.00%70.00%71.00%74.00%75.00%75.00%77.00%
ILDAaPCA51.00%42.00%53.00%48.00%45.00%50.00%51.00%49.00%49.00%50.00%
ILDAonK42.00%45.00%53.00%48.00%45.00%51.00%51.00%49.00%49.00%50.00%
ILDAonL51.00%52.00%61.00%61.00%65.00%69.00%71.00%70.00%71.00%72.00%
Table 2. Results on the Caltech 101 dataset.
MethodAccuracy
BoAW74.00%
BoVW83.00%
Table 3. Results on the COIL-100 dataset.
MethodAccuracy
BoAW99.77%
ARSRGemb99.55%
BoVW51.71%
gdFil32.61%
VFSR91.60%
APGM99.11%
VEAM99.44%
DTROD-AdaBoost84.50%
RSW+Boosting89.20%
Sequential Patterns89.80%
LAF99.40%
Table 4. Results on the ETH-80 dataset.
MethodAccuracy
BoAW89.29%
ARSRGemb89.26%
BoW58.83%
gdFil47.59%
APGM84.39%
VEAM82.68%

