Article

Implementation of Composite Materials for Lightweighting of Industrial Vehicle Chassis

Department of Mechanical and Industrial Engineering, University of Brescia, Via Branze 38, 25123 Brescia, Italy
*
Author to whom correspondence should be addressed.
J. Compos. Sci. 2025, 9(11), 611; https://doi.org/10.3390/jcs9110611
Submission received: 3 October 2025 / Revised: 23 October 2025 / Accepted: 2 November 2025 / Published: 5 November 2025

Abstract

This research study investigates the use of composite materials to reduce the weight of heavy industrial vehicle chassis. A new Carbon Fibre Reinforced Polymer (CFRP) crossmember was developed to replicate the mechanical performance of the traditional steel component while achieving substantial weight reduction. A multi-step approach was adopted: analytical and finite-element analyses were performed on single crossmembers to assess bending and torsional stiffness. The CFRP design achieved increases of 6.8% in torsional stiffness and 5.0% in bending stiffness, with a 68.1% weight reduction. After confirming stiffness equivalence, full chassis simulations were carried out to evaluate global performance. The steel model reproduced experimental results with a relative error of 1.13%, while the CFRP configuration enhanced overall torsional stiffness by 7.8%. Extending these results to all crossmembers, the initial cost increase of the CFRP solution could be recovered within about 2 years for the diesel scenario and 3.5 years for the electric one. Environmental benefits were also quantified, with annual CO2 reductions of 708.4 kg and 298.6 kg, and cost savings of up to 463.3 EUR/year and 299.8 EUR/year, respectively.

1. Introduction

The transportation of goods has always played a crucial role in the economy. In the cited sector, considering the EU, road transport is the second most adopted weight transport, with 25.3% of goods moved through this method [1]. In Italy, the percentage share of road freight transport relative to the total inland freight transport stood at approximately 88% in 2023 [2]. Regarding the emissions, in Italy the transport sector was responsible for 25.2% of the total national greenhouse gases (GHGs) emissions in 2019, 92.6% of which were caused by road transport [3]. Being a non-avoidable cost, and considering also that the shortage of fossil fuel is increasing rapidly, there is an increasing demand for greater efficiency in this area. One of the several strategies adopted to reduce the costs of road transport is the so-called lightweight design (LWD) [4]. On individual vehicle components of industrial vehicle used for goods transport, this process can be implemented through different methods: for example modifying the geometry of the component [5] or both the geometry and its production process [6], the application of the topology optimization method [7], or the substitution of traditional materials with other unconventional materials [8,9]. LWD can be applied to each component of heavy vehicles, such as the front underrun protective device [10], the axle [11], or even the carriage [12]. Some of the author’s previous articles also apply the LWD in different fields: for example, considering hoisting machines, jib cranes, and overhead cranes have been studied with the aim of reaching a weight reduction through the adoption of composite materials and prestressing techniques [13,14]. Among all the components of an industrial vehicle, the chassis constitutes an important share of the vehicle mass. Here, the weight reduction process has already been implemented in the literature through the adoption of different materials: Ufuk et al. [15] designed a heavy-duty chassis using unidirectional fibre composite material, one in CFRP and another one in glass fibre reinforced polymer (GFRP), and compared the two new solutions with the traditional one, observing mainly the weight savings. Here, through the adoption of the finite-element methodology, the fatigue aspect has been analysed, obtaining a weight reduction of up to 50%. Siraj et al. [16] also did a comparative analysis between three dump truck chassis made in different materials: one in mild steel and two in composite materials (even here, the materials adopted are CFRP and GFRP). Basing each simulation on the condition of the truck being stationary, they analysed three load conditions: bending load case, torsion load scenario, and the combination of these two conditions. It was found that the weight of the chassis is reduced by 4.8 times for carbon epoxy and 3 times for glass epoxy, compared to the mild steel solution. Agarwal et al. [17] proposed an optimized heavy-duty truck chassis, substituting the conventional steel with a potential metal matrix composite lightweight Graphite Al GA 7–230 Metal Matrix Composite material. Through FEM, a structural optimization has been conducted using an optimal space-filling design scheme, obtaining a mass reduction of 70% compared to the traditional solution. Svensson et al. [18] analysed how the welding process can contribute to the weight reduction of heavy vehicle chassis. Observing two cases, one in high-strength steels and another in cast aluminium, the research paper highlighted the benefits and the issues of the application of the welding process, adopting these materials instead of traditional steel. In all these research articles, the results obtained are not always validated by experimental analysis, and the main focus is always on the structural behaviour of the component, without considering the economic aspect of the innovative solution. With this in mind, the authors want to implement a design approach aimed at the adoption of composite materials in a heavy industrial vehicle chassis, highlighting the importance of experimental analysis to check the results obtained and observe that the LWD can lead to considerable economic savings. The rest of this research study is organized as follows: Section 2 describes the analysed component and how the LWD is implemented here. Section 3 shows the optimization process and the theoretical background of this design approach, while Section 4 shows the results obtained from the numerical simulations. Section 5 then discusses the results of the innovative configuration, with a focus on the economic aspects of the component. Finally, Section 6 provides a summary and critique of the results.

2. Description of the Component

In this research work, a chassis for heavy commercial vehicles (HCV) was analysed. Its structure is basically a flat “ladder-like” frame composed of two longitudinal elements (side members) connected by several transversal beams (crossmembers). The traditional assembly of the truck analysed can be observed in Figure 1: the main parameter to distinguish different configurations is the distance between the centres of the front and the rear wheels, the so-called wheelbase. The reason for having the same assembly with different dimensions is based on the need for the buyer of the heavy industrial vehicle: a short-wheelbase chassis offers better manoeuvrability but lacks stability, compared with a long-wheelbase chassis. About the traditional configuration chosen for the comparison with the innovative solution, it has a wheelbase value of equal to 3690 mm (considered as a short-wheelbase chassis) with both front and rear air suspensions and is designed for 18-tonne vehicles.
Regarding the innovative solutions, the idea is to design a new type of crossmember in composite material, keeping the same sidemembers and reaching a similar behaviour to the traditional chassis in terms of torsional stiffness.

3. Materials and Methods

3.1. Theoretical Background of the Design Approach

The design approach, aimed at reducing the weight of a component through the use of composite materials, is already explained by one of the authors’ previous research article [19]. Here, focusing on a chassis frame, the schematization of the problem begins with the loads to which the component is subjected, here defined:
  • weight of the body, passengers, and cargo loads;
  • vertical and twisting load owing to uneven road surfaces;
  • lateral forces caused by the road camber, side wind, and steering of the vehicle;
  • inertial forces caused by sudden acceleration or braking and sharp turns.
To withstand all these forces, the design of the chassis must have adequate torsional and bending stiffness. To achieve this similarity in stiffness, when a torque or bending moment is applied, a similar rotation or deformation has to be obtained. During the design phase, as a first approximation, the main boundary conditions to be fulfilled are the ones described in Equation (1):
G s t e e l · J s t e e l G c o m p · J c o m p ; E s t e e l · I s t e e l E c o m p · I c o m p
where for the torsional stiffness, G s t e e l is the shear modulus of steel, which is the material of the traditional configuration, and J s t e e l is the polar moment of inertia of the steel beam. Regarding the composite material, G c o m p is the so-called G x y , while J c o m p is the polar moment of inertia of the composite crossmember. For the bending stiffness, E s t e e l is the Young’s modulus of the steel, while I s t e e l is the area inertia moment of the steel beam. Regarding the composite material, E c o m p is the so-called E x , while I c o m p is the area inertia moment of the composite crossmember. G x y and E x are derived by the composite laminate theory, described after, in Section 3.3. Since the study of the whole chassis stiffness could increase the computational cost of the simulation, here the idea is to study the bending and torsional stiffness of the singular crossmember (a similar approach was already defined in the literature [20]). Once the crossmembers obtained have similar torsional and bending stiffness, the entire current chassis frame can be studied from both numerical and experimental perspectives, focusing on stiffness characteristics. Finally, after validating the numerical model of the chassis frame, the complete chassis with the proposed composite solution is simulated, and the results are compared with those of the current steel design.

3.2. Methods and Criteria Adopted

Since the initial case study of the crossmembers can be represented by beams, beam theory must be observed.
By analysing moments and angular momentum, it is possible to evaluate the support reactions and find the force distribution diagrams, which encompass tensile forces, bending moments, shear forces, and torques. The diagrams facilitate the identification of the most stressed positions. Upon defining the geometry, the material’s stress can be analysed using De Saint Venant’s theory, Bredt’s formula, and Jourasky’s formula [21]. The stress profiles are delineated by Equation (2):
σ n = F A ; σ f ( y ) = M f I · y ; τ M t = M t 2 Ω s ; τ t = T S J n n s
where σ n is the normal stress imposed by force F on the section area A, σ f ( y ) is the stress due to the bending moment at a distance y from the section’s centreline, M f is the bending moment, I is the moment of inertia with respect to the centreline, τ M t is the stress from the torque, M t is the applied torque to the section, Ω is the mean area of the section, s is the profile thickness, τ t is the shear stress, T represents the shear force, and S is the static moment of the section.
In this research, the crossmembers’ torsional and bending stiffness can also be related to the beam’s theory: to analyse this aspect of these components, each crossmember was studied as a cantilever beam with an applied torque/load at the opposite end with respect to the constraint, as shown in Figure 2.
In this scenario, the evaluation of the rotation or the displacement can be easily evaluated through Equation (3) [21]:
α = M t l G J ; δ = P l 3 3 E I
where for the torsional moment, α is the angle of twist (in radians), M t is the applied torque at the free end, l is the beam’s length, G is the shear modulus of the material, and J is the polar moment of inertia of the cross-section. About the bending moment: δ is the bending deflection at the beam’s free end; P is the applied load; E is the Young’s modulus; and I is the moment of inertia with respect to the centreline. To analyse the torsional moment, depending on the order of magnitude of the applied torque and the studied geometry, it is suggested to also put another constraint at the free end. This procedure is usually done to prevent potential bending actions due to the asymmetric geometry and the shear stress on the beam. The constraint is needed to study only the applied torque, without the influence of other actions. Through Equation (3), the meaning of stiffness can be found, due to the relation between the applied load and the caused displacement. Considering that the length of the beam is an unmodifiable parameter for this study, the factors that influence the stiffness of the structure are the material, represented in the formula by G and E, and the cross-section geometry, represented by J and I.
In addition to this, modal analyses are needed to evaluate the natural frequencies and corresponding mode shapes of the structure. External excitation and internal power sources, including engine vibration and road excitation, are the origins of frame resonance. The road vibration frequency of automobiles ranges from 0 to 100 Hz [22], and the fundamental vibration frequency of the vehicle body must exceed 20 Hz, as the primary road excitations occur within this frequency range [10]. Equation (4) is provided to evaluate the engine frequency of the vehicle:
f = 2 n z 60 τ
where τ is the number of engine strokes, z is the number of engine cylinders, and n is the engine speed, defined in RPM. Since this research study focuses on heavy commercial vehicles, it was assumed that the design of the truck utilizes a six-cylinder, four-stroke diesel internal combustion engine.
An engine is used in this design of the truck, and for the calculation, a rated speed of 2500 RPM is chosen to be in a critical situation. After these considerations, it was evaluated that the diesel engine vibrates at a frequency of 125 Hz.

3.3. Choice of the Materials

In addition to defining the geometry, the materials must also be chosen. The majority of structural components in industrial vehicles are produced in steel, an isotropic material exhibiting superior mechanical properties compared to other metals. This study is focused on using composite materials instead of metals, thanks to their benefits in weight reduction. The selection of material is dependent upon various factors: supplier availability, the production methodology, the material’s performance in the analysed context, and its cost relative to alternative options. A preliminary selection can be facilitated through Ashby’s diagrams [23]: here, the stiffness-density ratio assists in selecting a replacement for the material currently employed in the existing solution, with the aim of reducing the component’s weight.
To assess the mechanical properties of these materials, it is essential to identify the mechanical properties of both the fibre and the matrix, usually given by manufacturers. Assuming the fibres are oriented along the primary longitudinal axis, Equations (5) and (6) derived from the micromechanics theory of orthotropic plates [24] can be used:
ρ = ρ f V f + ρ m V m ; ν 12 ( = ν 13 ) = ν f V f + ν m V m ; E 1 = E f V f + E m V m ;
E 2 ( E 3 ) = E f E m V m E f + V f E m ; X T = σ f t V f ; Y C = σ m c [ 1 + ( V f V f ) ( 1 E m E f ) ]
Y C = σ m c [ 1 + ( V f V f ) ( 1 E m E f ) ] Y T = σ m t E 2 E m ( 1 V f 1 3 ) ;
To determine the longitudinal compressive strength X C , the failure mode must be analysed. Naik and Kumar [25] evaluated the different analytical models to predict the longitudinal compressive strength and compared their predictions to experimental results. They identified that both Xu-Reifsnider [26] and Budiansky [27] models predict the compressive strength quite accurately when the parameter representative of the actual material system is ascertained properly. The first model predicted the compressive strength based on the analysis of microbuckling of a representative volume element using a beam on an elastic foundation model. The effect of matrix slippage and the fibre–matrix bond condition was included by two factors, namely ξ and η . The final expression in terms of the constituent properties and micro-geometrical parameters is given by Equation (8):
X C = G m V f + E m E f ( 1 V f ) 2 ( 1 + ν m ) π π η r f 3 E m E f ( V f E m E f + 1 V f ) ( 1 + V f ν f + ν m ( 1 V f ) ) + 1 ξ s i n π ξ 2 π
where ξ is the empirical factor representing matrix slippage, η is the empirical factor representing fibre matrix bond and r f is the radius of fibre.
The second model unified the Rosen (based on microbuckling of the fibres) and Argon formula (based on the principle that the component of interlaminar shear stress due to the presence of misalignment produces kinking) for an elastic, ideally plastic composite. The expression as given by Budiansky is defined by Equation (9):
X C = G m ( 1 V f ) ( 1 + ϕ ¯ / γ y )
where ϕ ¯ is the initial fibre misalignment angle in unidirectional composites and γ y is the matrix yield strain.
The shear strength S and critical load are difficult to determine using formulas due to multiple uncertainty factors and the different behaviour of the matrix and fibre before failure [28,29]. Typically, this value is provided by the composite material supplier or can be evaluated through experimental tests such as single-fibre fragmentation testing, short beam shear, or the Iosipescu shear test [30].
Upon determining the component’s geometry and the proportion of each ply type, classical composite theory for two-dimensional laminates [24] can be used for preliminary analysis. By establishing a reference system with the initial two axes aligned with the lamina and disregarding the deformation ϵ 3 (which is perpendicular to the lamina plane), the deformations of a specifically orthotropic lamina can be assessed using Formulas (10) and (11). The components S i j of the compliance matrix S are derived from the elastic constants of the lamina:
ϵ 1 ϵ 2 γ 12 = S 11 S 12 0 S 12 S 22 0 0 0 S 66 σ 1 σ 2 τ 12 ;
S 11 = 1 E 1 ; S 22 = 1 E 2 ; S 12 = ν 12 E 1 = ν 21 E 2 ; S 66 = 1 G 12
To derive stresses from deformations, the stiffness matrix Q (the inverse of the compliance matrix) must be utilized. These formulations are applicable to laminas with fibers reinforced along the principal axis. Nevertheless, if a relative angle θ exists, the rotation matrix T must be employed, where c = cos θ and s = sin θ , as delineated in the Equation (12):
σ 1 σ 2 τ 12 = Q 11 Q 12 0 Q 12 Q 22 0 0 0 Q 66 ϵ 1 ϵ 2 γ 12 T = c 2 s 2 2 s c s 2 c 2 2 s c s c s c c 2 s 2
To adapt the compliance matrix S and the stiffness matrix Q to the new direction, the following Equation (13) must be adopted:
[ S ¯ ] = [ T ] T [ S ] [ T ] [ Q ¯ ] = [ T ] T [ Q ] [ T ]
Moreover, Equation (14) shows the expression for evaluating stresses in a generic lamina:
σ x σ y τ x y = Q 11 ¯ Q 12 ¯ Q 16 ¯ Q 12 ¯ Q 22 ¯ Q 26 ¯ Q 16 ¯ Q 26 ¯ Q 66 ¯ ϵ x ϵ y γ x y
Now, to obtain a first approximation of the deformation values, the extensional stiffness matrix A must first be derived. By setting the total number of laminas N and the composite thickness h, a coordinate system can be defined (as shown in Figure 3), and then A can be evaluated using Equation (15):
A i j = k = 1 N ( Q ¯ i j ) k ( z k z k 1 )
where i represents the rows of the matrix, j the columns, and k the number of layers. Through this matrix, it is possible to evaluate the membrane stiffness constants: these constants are needed as a first approximation to compare the stiffness of the steel configuration with the one in composite material. In particular, the constants needed for the torsional and the bending stiffness are the ones described in Equation (16):
E x = A 11 h ; G x y = A 66 h
where h is the thickness of the composite laminate, A 11 is the A-matrix component representing the axial stiffness of the laminate along the first direction, while A 66 is the A-matrix component representing the in-plane shear stiffness. Additionally, a local reference system has been defined to evaluate stresses. Using the deformation values, obtained analytically by multiplying the inverse of the A-matrix with the stress matrix (calculated using Equation (2) and the laminate thickness), it is possible to use Equation (17) to calculate the local stresses along each lamina’s directions within the entire laminate:
ϵ x ϵ y γ x y = h A 1 σ f 0 τ t σ x σ y τ x y = Q ¯ ϵ x ϵ y γ x y σ 1 σ 2 τ 12 = T σ x σ y τ x y
By relating the local reference system to the lamina’s system, and considering the maximum bending stress and maximum shear stress, the Tsai–Hill criterion can be implemented, described in Equation (18), or the maximum stress criterion, described in Equation (19), based on the material resistance values.
F I = σ 1 2 X 1 2 σ 1 σ 2 X 1 2 + σ 2 2 X 2 2 + τ 12 2 S 2 ; F O S = 1 F I
X C < σ 1 < X T ; Y C < σ 2 < Y T ; τ 12 < S
where X 1 represents X T if σ 1 > 0 or X C if σ 1 < 0, while X 2 represents Y T if σ 2 > 0 or Y C if σ 2 < 0. To determine if the ply will theoretically fail, the factor of safety (FOS) must be less than 1.
Finally, to increase resistance to weathering or sunlight, a protective film described by Komartin et al. [31] or Zhang et al. [32] should be applied to the surface of the component.

3.4. Experimental Setup and Procedure

To validate the numerical simulations and the new composite solution, a comparison between the numerical model and experimental tests was carried out. The torsion test represents the main test to evaluate the strength and the stiffness of the HCV chassis. The experimental tests were conducted using a custom test bench with the following structure visible in Figure 4:
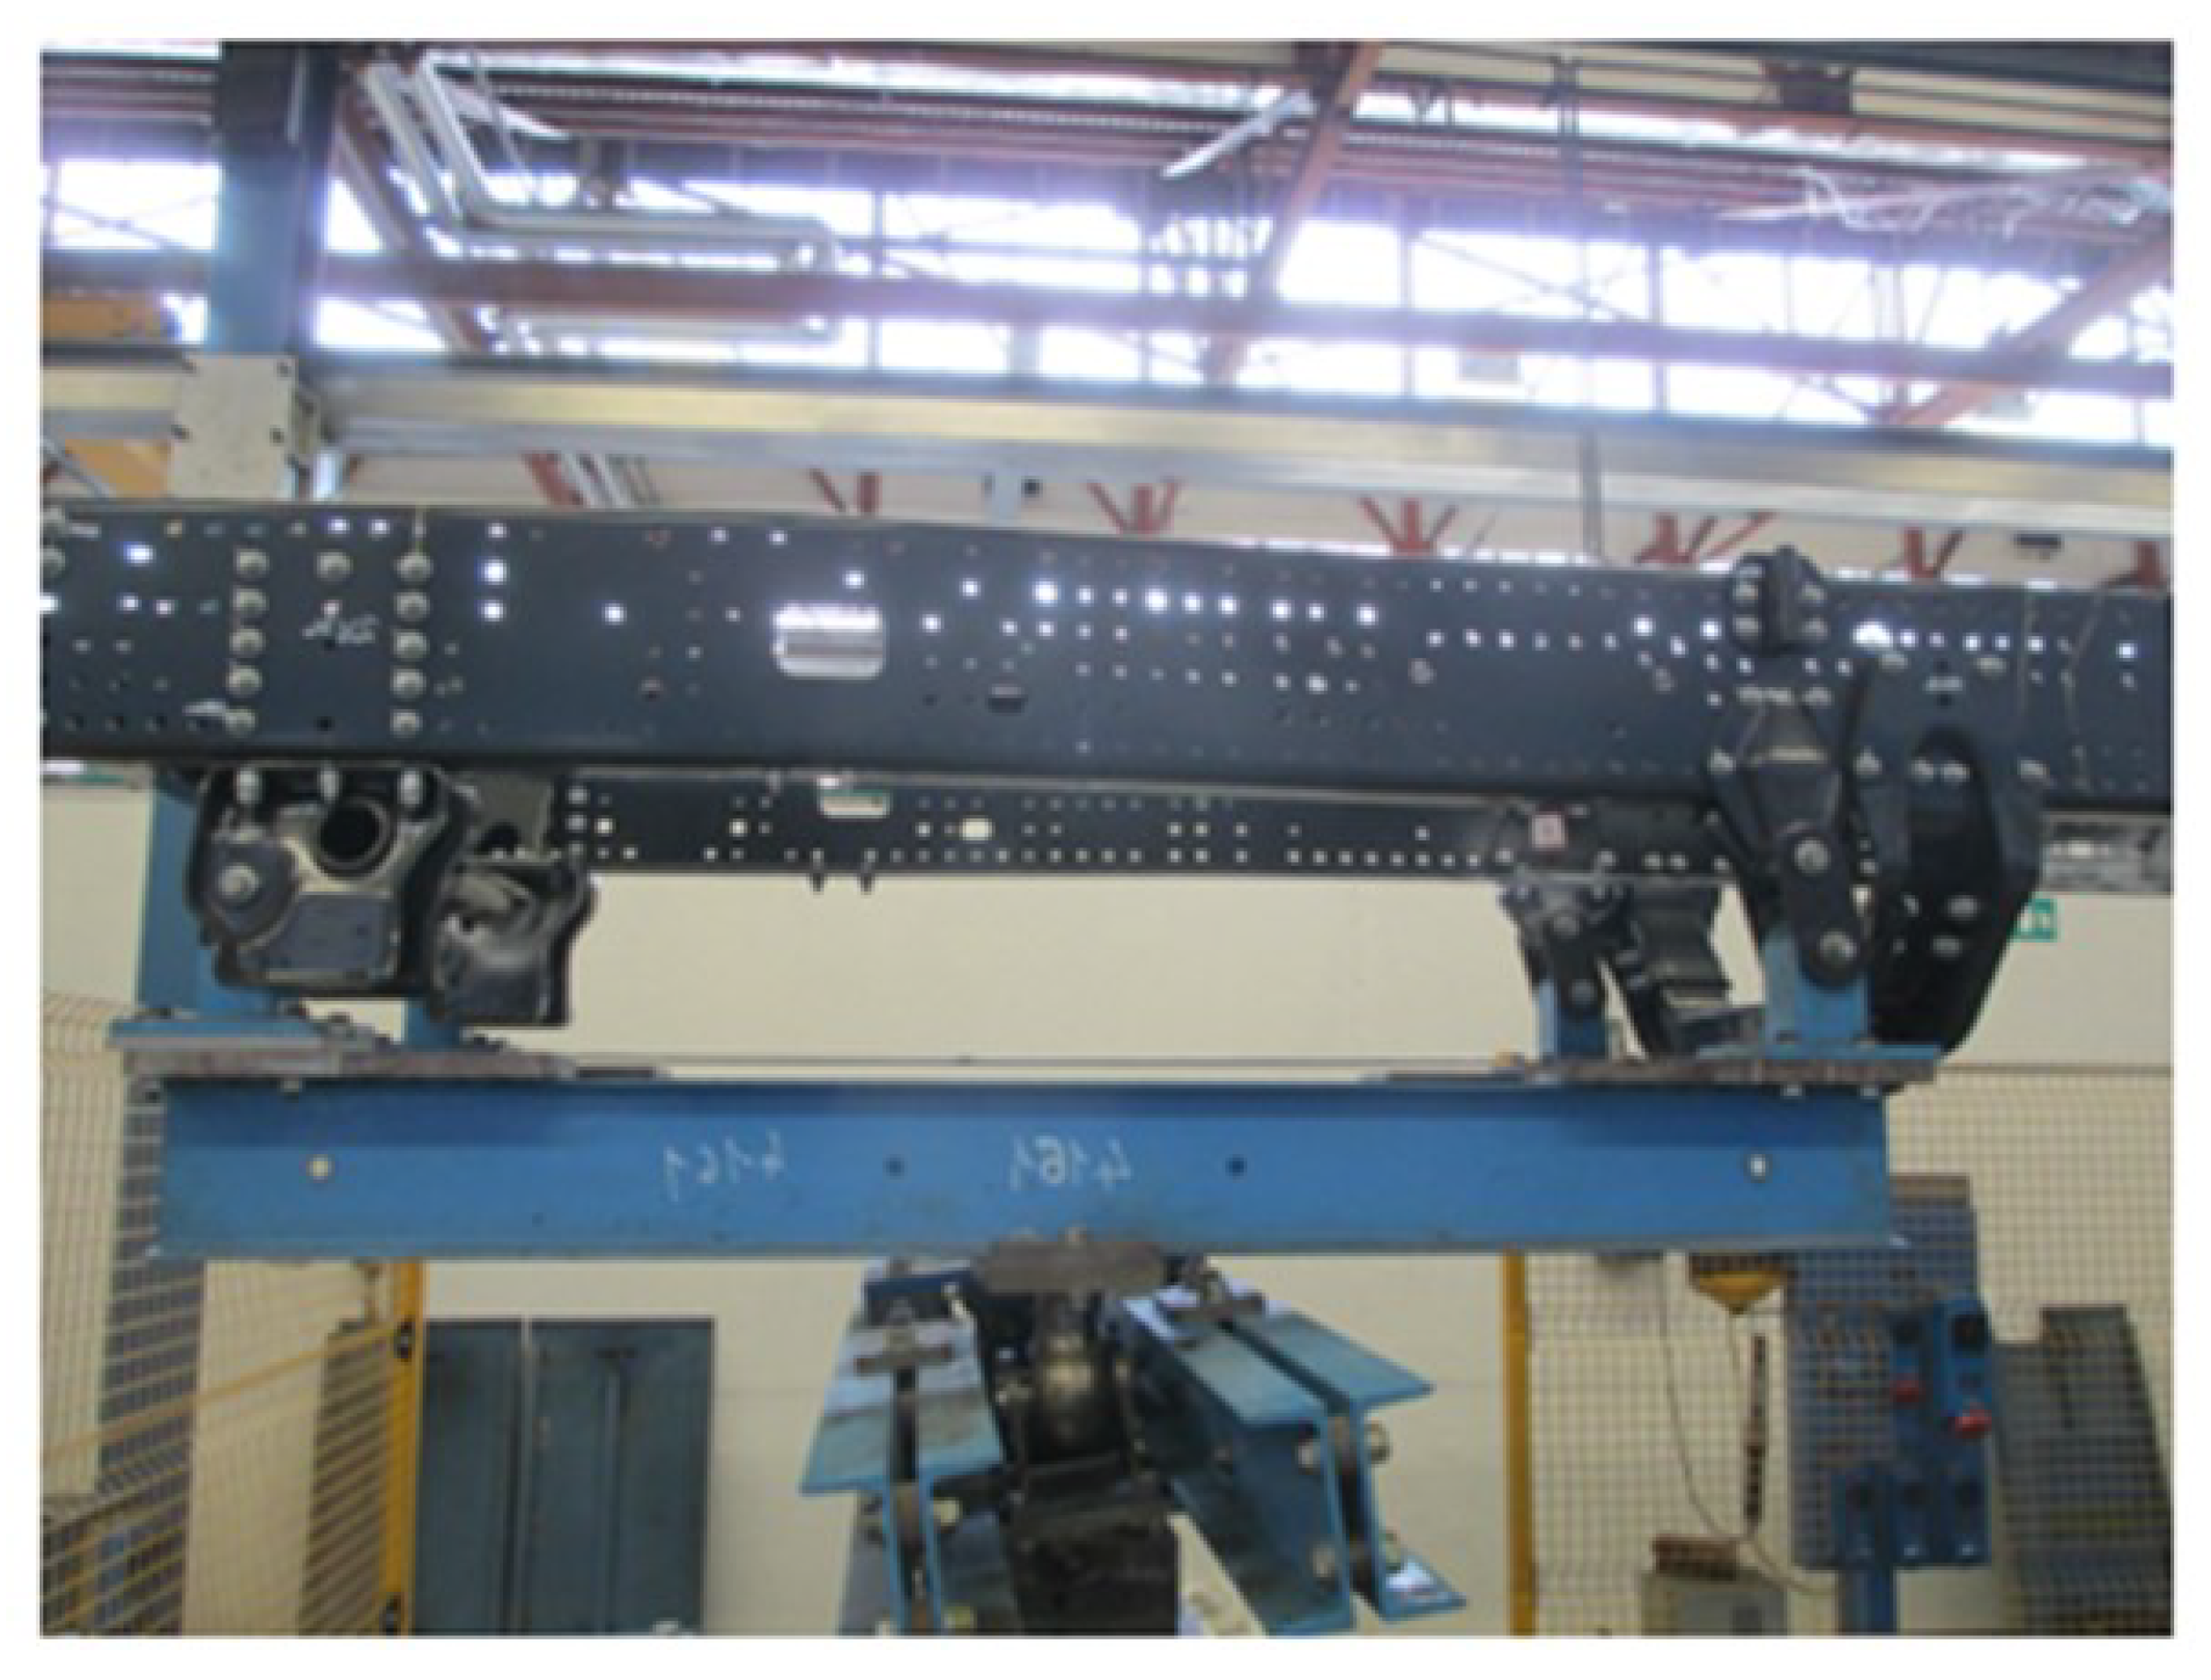
  • Front Support: the front side of the chassis frame was constrained to the test bench at the front suspension mounting points as shown in Figure 5. This configuration permitted the frame the rotation, enabling load application at this side. The front suspension was replaced by a rigid element that can tilt.
    Figure 5. Front constraints of the HCV chassis frame.
    Figure 5. Front constraints of the HCV chassis frame.
    Jcs 09 00611 g005
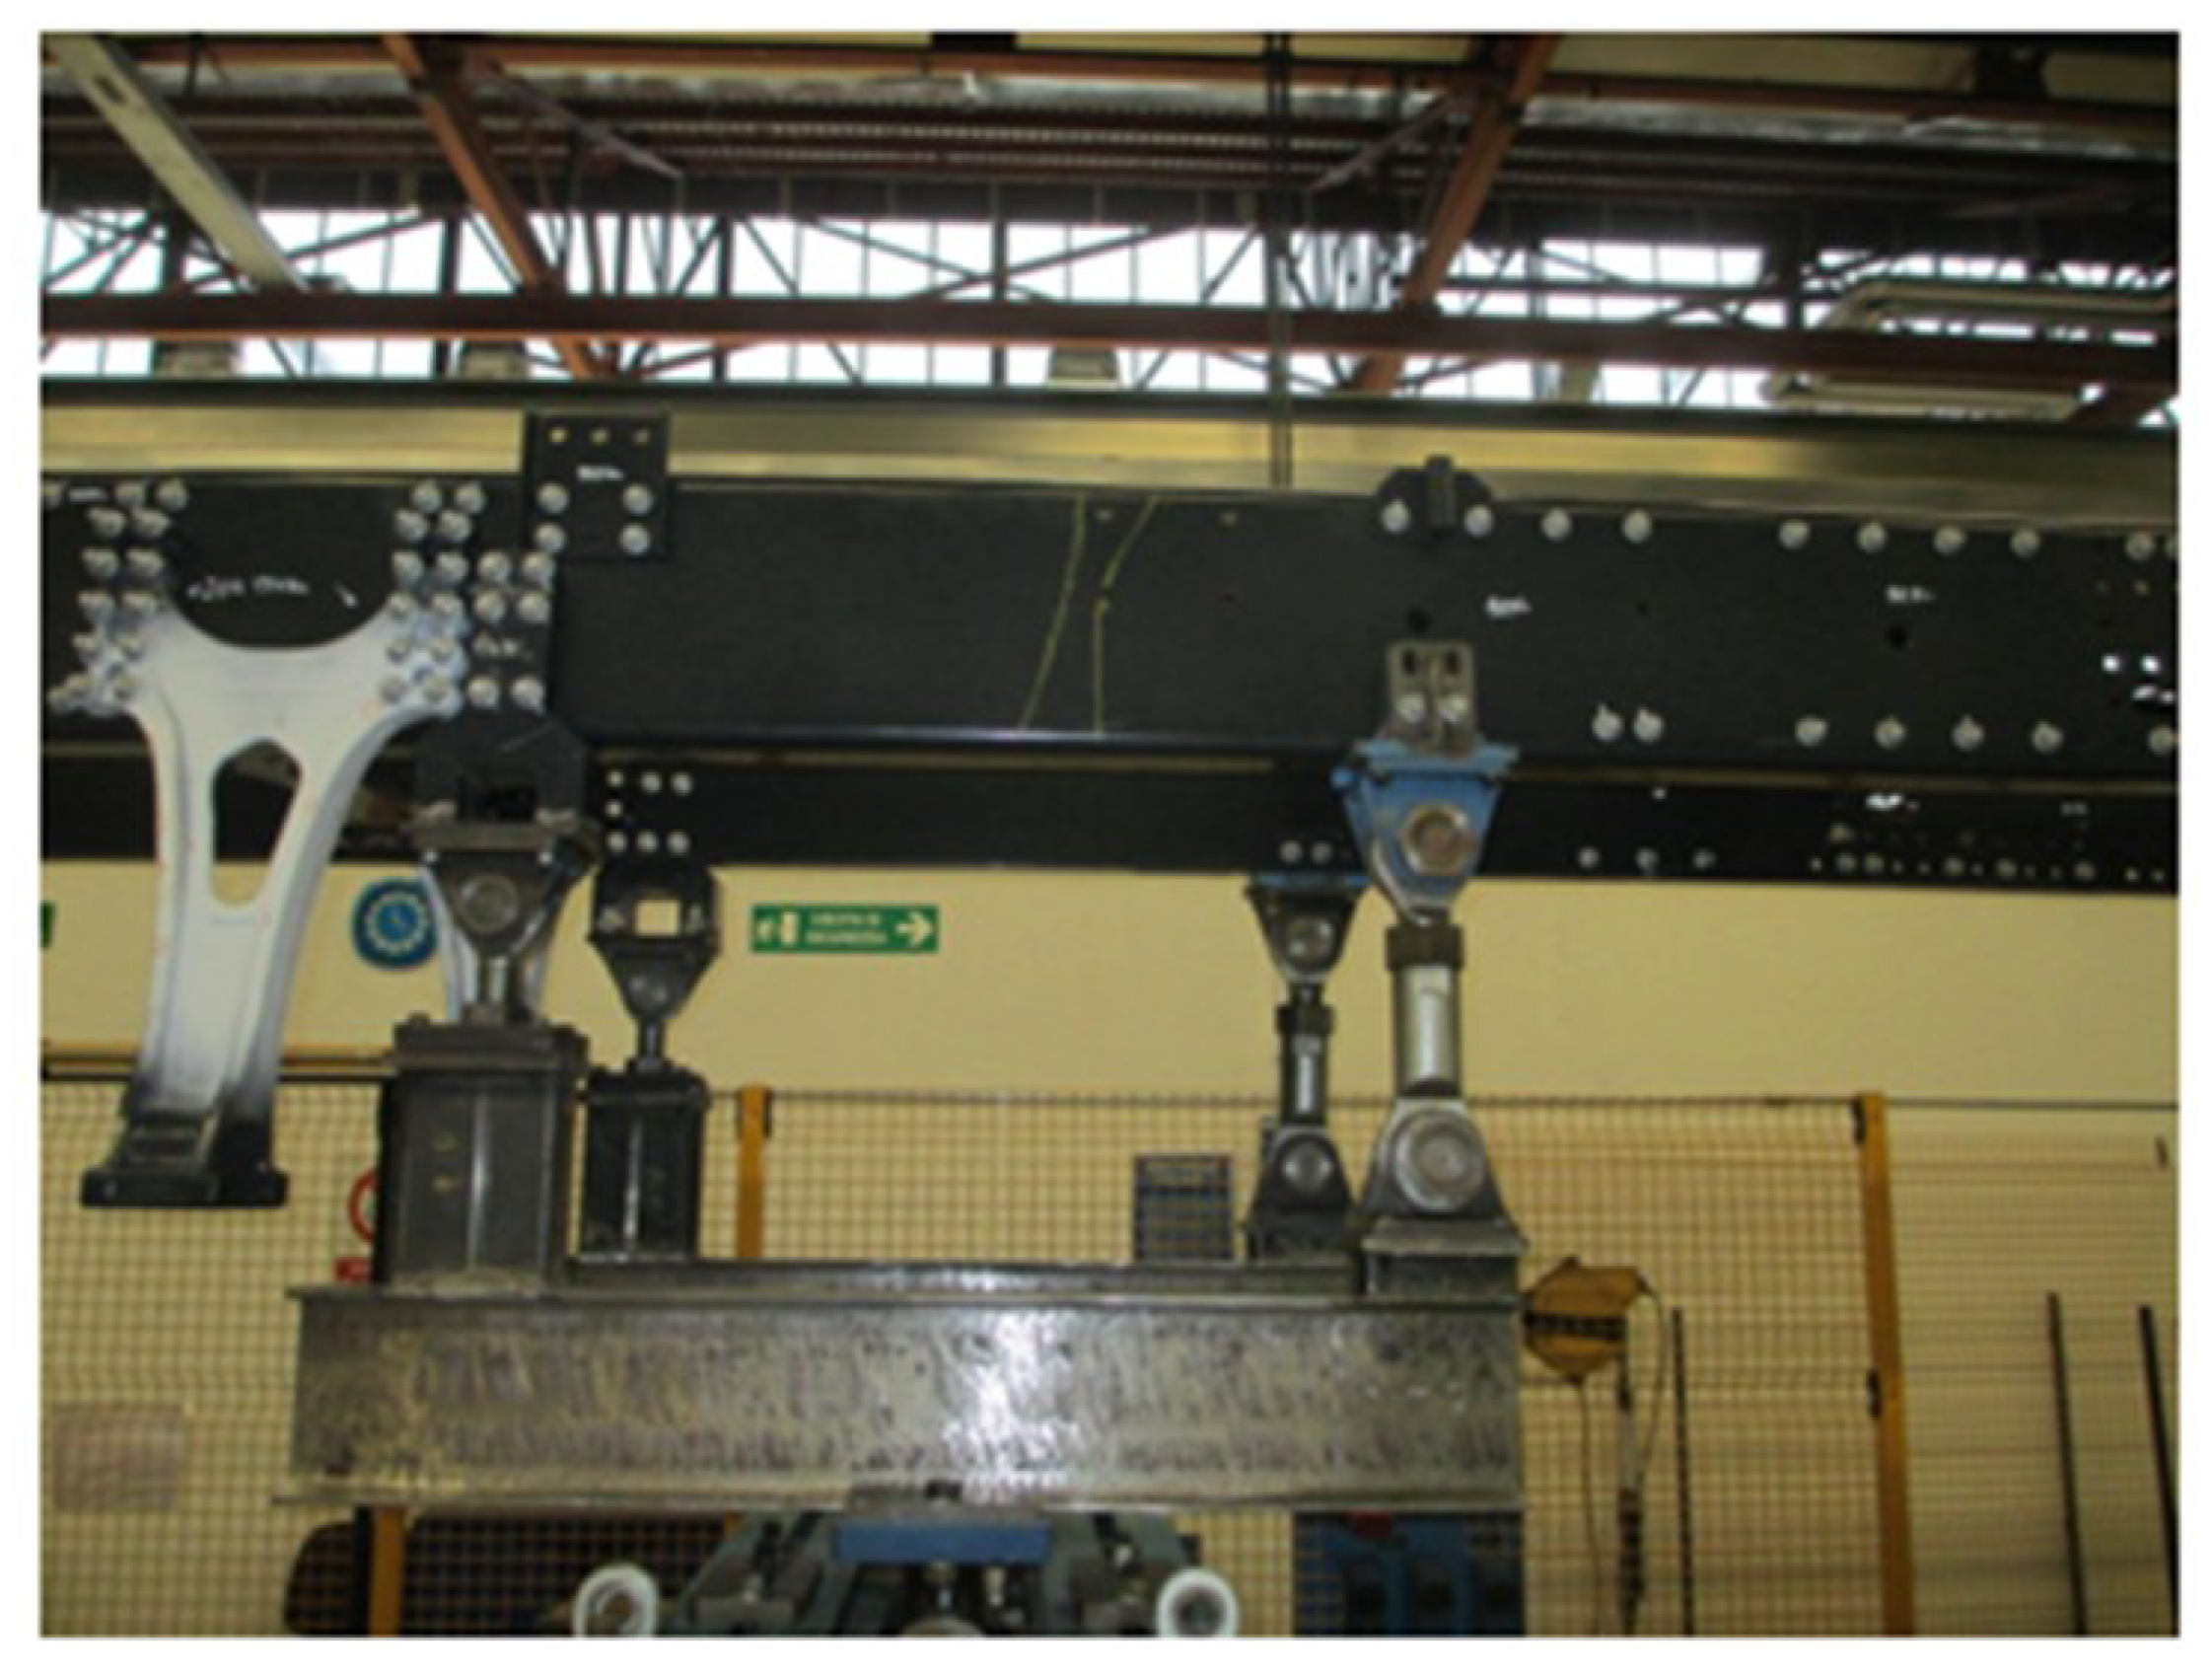
  • Rear Support: the rear side of the chassis frame was constrained to the test bench at the rear suspension mounting points. The rear support was fixed to the longitudinal beams of the chassis frame to prevent excessive stiffness increase while stabilizing the structure under load. The rear suspension was represented by a structure that can be seen in Figure 6, which mimics the air bellows of the first rear axle in the HCV configuration.
    Figure 6. Rear constraints of the HCV chassis frame.
    Figure 6. Rear constraints of the HCV chassis frame.
    Jcs 09 00611 g006
All the connections between the chassis frame and the test bench consisted of steel–rubber bushings so that the structure can replicate the real constraint condition. The frame is constrained along the vertical direction (Z-axis in Figure 4) and along the direction perpendicular to the side members (X-axis in Figure 4) in the area where the rear axle is attached. Translation along the side member direction (Y-axis in Figure 4) is left free. The test is performed by applying a prescribed rotation in the area where the front axle is attached. Here, the frame is allowed to rotate around the side member direction (Y-axis in Figure 4). The torque resulting from the imposed rotation is measured using load cells placed at the points where the side members are fixed, in the area of the rear axle attachment. The characteristics of the sensor are:
  • Linearity: ±0.25% full-scale output
  • Repeatability: ±0.1% full-scale output
  • Operating range: 10–10,000 N
  • Operating temperature: −54 °C to +121 °C
Rotation measurements for rotation control are carried out using angular transducers (RDVT sensors) with these characteristics:
  • Linearity: ±0.25% full-scale output
  • Repeatability: ±0.01% full-scale output
  • Operating range: ±30°
  • Operating temperature: −55 °C to +125 °C
The torsion test was performed by applying an angular displacement of ±5° around the Y-axis at the front support. The following measurements were recorded:
  • Torsional Deformation: measured as the rotation of the chassis frame’s side members. Sensors were positioned along the length of the side members (Y-axis) to capture this deformation;
  • Torsional Stiffness: determined by the difference in rotation between the front axle section (where the load was applied) and the rear axle section.

3.5. Numerical Simulations

The numerical simulations were performed using Ansys® 2025 R1 software to accurately replicate the experimental test conditions. The computational model included the complete HCV chassis frame to be tested along with the relevant supporting beams of the test bench, as shown in Figure 7.
All frame components were modelled using S420MC steel (EN 10149-2 [33]), with material properties detailed in Table 1.
After a convergence study, a solid mesh based on curvature was used, with 206,000 nodes and 435,000 total elements. The type of solid elements used is linear hexahedral and quadratic tetrahedral elements, and varies by component. Since the purpose of the research work is the chassis frame, in the FE simulation, a mesh refinement on the chassis’ components was done, with an average size of 10 mm, while for the test bench beams, the average size of the element was set to 60 mm. The chassis frame components were connected using tied contacts, while the interface between the frame and test bench was modelled with bushing elements to match the physical test configuration. The bushing stiffness parameters, referenced to the coordinate system in Figure 7, are provided in Table 2.
A fixed constraint was imposed on the test bench beams at the rear section of the chassis frame, while a 5° rotation about the X-axis was applied to the front crossmember (orthogonal to the side members), as illustrated in Figure 8.

3.5.1. Crossmembers Simulation

Following the baseline analysis, the study focused on evaluating the replacement of the first steel crossmember (looking at the front side of the chassis) with a CFRP composite alternative. The component’s torsional and bending stiffness were investigated using a model with identical material properties to the chassis frame.
After a convergence study, a curvature-based solid mesh was implemented, with 109,000 nodes and 31,000 total elements. The type of solid elements used is linear hexahedral and quadratic tetrahedral elements, and varies by component. The crossmember connects to two side members through lateral supports and includes two small reinforcing gussets for enhanced stiffness. The interface with longitudinal side members was accurately modelled, with a fixed constraint applied to one side and the loads applied on the opposite side at the centre of the surface in contact with the side member, as defined by Figure 9. Two load cases are analysed:
  • For the bending stiffness: F x = 1000 N.
  • For the torsion stiffness: M α y = 1000 Nm.
The applied loads refer to the reference system in Figure 7. These magnitudes guarantee an elastic deformation of the component. The bending stiffness was found to be anisotropic, with higher values along the X-axis due to the reinforcing gussets. For conservative analysis, only the X-axis loading case was considered to prevent potential decreases in overall chassis torsional stiffness. Displacements were measured to calculate both bending and torsional stiffness values. The same study is then conducted on a crossmember made of CFRP.

3.5.2. CFRP Crossmember Solution

The CFRP solution, shown in Figure 10, was optimized through iterative testing to achieve optimal bending and torsional stiffness characteristics. The component production process considered is filament winding [34], as the tubular design of the component is suitable for this method. The design features:
  • Tubular profile with 7 mm wall thickness.
  • 28-layer laminate (each ply defined by 0.25 mm of thickness).
  • Layer Stacking Sequence (LSS) including 15% of the plies oriented at 5°, 15% at −5°, 27.5% at 45°, 27.5% at −45° and 15% at 90°.
  • M50J carbon fiber reinforcement [35] with SX10 epoxy matrix [36].
The materials’ mechanical properties are described in Table 3 while the composite material’s mechanical properties are described in Table 4.
The assembly includes steel support interfaces S420MC bonded to the CFRP tube using tied contacts to simulate adhesive joints. In this design, the connection between the supports and the CFRP crossmember is intended to be made using a film adhesive, as described by Ke et al. [37]. The shear stress in this area was numerically evaluated as equal to 15.5 MPa, below the stress limit for Ke’s film adhesive, as well as the in-plane and interlaminar shear strength of the composite material. After a convergence study, a solid mesh based on curvature was used, with 857,000 nodes and 770,000 total elements. The type of solid elements used is linear hexahedral and quadratic tetrahedral elements, and varies by component. In particular, the composite laminate is modeled through linear hexahedral elements Hex8, divided for each lamina, and an average element size of 3.5 mm; a similar mesh modeling concept is described by Chen et al. [38], with differences in the type of element and dimensions. The same boundary conditions and loading scenarios were applied as in the steel crossmember analysis.

4. Results

4.1. Simulation of the First Crossmember

The simulation models were prepared following the methodologies outlined in Section 3.5.1 and Section 3.5.2. In particular, to evaluate the crossmember’s rotation α y by the numerical resulted reported, the Equation is described here:
α y = a r c s e n X R
where X represents the displacement along the X-axis, and R is the hole radius of the support, equal to 50 mm.
The displacements and rotations measured for the traditional steel and the CFRP solutions are shown in Figure 11 and Figure 12 present the measured displacements and rotations for both traditional steel and CFRP solutions, while Table 5 summarizes the calculated stiffness values. Off-axis displacements and rotations were negligible compared to the primary loading direction.
The optimized CFRP solution showed comparable mechanical behaviour to the steel reference:
  • +5% higher for bending stiffness.
  • +6.8% higher for torsional stiffness.
Given the critical role of the chassis frame in vibration management, a modal analysis was performed on the CFRP crossmember solution. The crossmember is fixed at both ends, simulating the boundary conditions of the crossmembers within the complete chassis frame, and no external load is applied. Figure 13 and Figure 14 show the main bending mode natural frequency and torsional mode natural frequency. All values significantly exceed typical external excitation frequencies (0–20 Hz), confirming the design’s structural safety. Compared to each other, the composite solution has even higher natural frequencies than the steel configuration.

4.2. Chassis Frame Results Comparison

The experimental tests were conducted following the procedure obtained in Section 3.4. The relationship between chassis rotation and applied torque can be observed in Figure 15.
Following the experimental test, the results were compared against numerical simulations of both the traditional steel chassis configuration and the modified chassis incorporating the CFRP solution described in Section 3.5.2.
As described in Section 3.5, an imposed rotation of 5° about the X-axis to the front crossmember oriented orthogonally to the side members was applied. The simulated reaction torque was compared with the applied torque found from the experimental tests. The percentage relative error E r % is described in Equation (21):
E r % = | M t , n u m M t , e x p | M t , e x p · 100 = 1.13 %
where M t , n u m is the torque moment evaluated by the numerical simulations, while M t , e x p is the torque moment measured during the experimental results. The comparative analysis revealed strong agreement between the traditional chassis simulation and experimental results, with only 1.13% deviation in torsional stiffness. Regarding the comparison between the traditional and the innovative configuration, the torsional stiffness difference in percentage Δ S t i f   f % between the traditional steel configuration and the innovative composite solution can be described by Equation (22):
Δ S t i f   f % = | M t , a c c M t , c o m p | M t , a c c · 100 = 7.66 %
where M t , a c c is the torque moment evaluated by the numerical simulations of the steel configuration, while M t , c o m p is the torque moment evaluated by the numerical simulations of the composite solution. The CFRP-modified configuration showed an increase of 7.76% in torsional stiffness compared to the baseline steel implementation. To summarize these results, Table 6 is shown below.
The CFRP-modified configuration showed an increase of 7.76% in torsional stiffness compared to the baseline steel implementation.

5. Discussion

Using data from manufacturer datasheets and the FEM program’s 3D models, the mass of the chassis for each configuration was determined.
Table 7 presents the weights of the crossmember in the configurations studied. The percentage of weight reduction (W) and the percentage increase in cost (c) were evaluated as described in Equation (23):
W R e d u c t i o n % = W C F R P W s t e e l W s t e e l · 100 ; c I n c r e a s e % = c C F R P c s t e e l c s t e e l · 100
A clear reduction in weight can be seen when comparing the steel solution to the composite material solutions: the carbon fibre solution shows a 68.08% reduction. However, the cost comparison reveals that the CFRP solution requires a higher initial investment (+241.14% of cost increase). If this approach is applied for each crossmember of the chassis, maintaining the same percentage of weight reduction and cost increase, the cost difference between the innovative solution and the traditional one is approximately 966.66€, considering a total weight of all the steel crossmembers equal to 118.6 kg and their cost equal to 400.87€. However, considering the economic savings from reduced fuel consumption, the time required to recover the initial investment is slightly more than 3 years for the CFRP solution, as illustrated in Figure 16. The calculations consider a vehicle lifetime of 11 years and an average mileage of 1.49 million kilometres [39], or 135,000 km per year.
The implementation of the CFRP solution is then analysed, considering a diesel and electric application. Table 8 shows an estimate of annual fuel consumption made for both the traditional and optimized solutions (diesel HCV), with a reduction of approximately 272.5 L/year for the CFRP solution. For the electric HCV, a reduction of approximately 893.9 kWh/year is achieved for the CFRP solution.
Based on these results, it was possible to estimate how fuel consumption reductions can impact both economic savings and CO2 emission reductions. This calculation was made using data on diesel engine performance for a diesel HCV, as diesel is the most common fuel for industrial vehicles. The economic savings were calculated based on the current fuel price of €1.7/L (the average price in Italy during 2024). For the electric HCV, the analysis is performed considering CO2 emission reductions per kWh with respect to an electric HCV with the standard chassis. The economic savings were calculated based on the current electric energy price of 0.335 EUR/kWh (the average price in Italy during 2025).

6. Conclusions

The primary goal of this study was to explore the feasibility of using composite materials, specifically CFRP, to reduce the weight of crossmembers in heavy industrial vehicle chassis and, at the same time, maintain comparable mechanical performance to steel solutions. The following approach was adopted:
A structured design method was applied to ensure the torsional and bending stiffness equivalence between steel and CFRP crossmembers.
Single crossmember simulations were conducted to reduce computational costs and eliminate the need to model the entire chassis during the optimization phase.
Experimental tests on the traditional steel chassis validated the numerical FEM model and allowed a reliable prediction of the behaviour of the CFRP solution.
The CFRP crossmember was subsequently incorporated into the comprehensive chassis FEM model to assess its overall impact on torsional stiffness and to facilitate comparison with experimental findings.
The main results of the research can be summarized as follows:
  • Reduction of computational cost: Focusing on the single crossmember allowed a significant decrease in simulation time and resources compared to a full chassis analysis during the design stage.
  • Weight savings: The CFRP crossmember achieved a 68.08% reduction in weight compared to the traditional steel solution.
  • Stiffness performance: The CFRP solution demonstrated a +5% increase in bending stiffness and a +6.8% increase in torsional stiffness over steel.
  • Economic benefits: Although the initial cost increased by 241.14%, the solution is economically viable with a payback time of approximately 3 years, considering fuel savings during vehicle operation.
  • Validation with experimental data: Numerical FEM results showed excellent agreement with experimental tests on the steel chassis and confirmed the robustness of the simulation approach.
  • Environmental impact: For both diesel and electric HCVs, the CFRP solution led to important reductions in CO2 emissions and operating expenses.
Future developments will focus on extending this lightweight design methodology to other structural components of industrial vehicles and heavy-duty machinery, such as cranes and earth-moving equipment, with the goal of further improvements in weight reduction, fuel efficiency, and environmental sustainability. Moreover, the contacts between CFRP and metallic materials will be further investigated to provide a comprehensive understanding of this mechanical issue.

Author Contributions

Conceptualization, L.S. and G.D.; methodology, L.S. and G.D.; software, I.T. and S.G.; validation, I.T., S.G. and L.S.; formal analysis, I.T. and S.G.; investigation, I.T. and L.S.; resources, L.S.; data curation, I.T.; writing—original draft preparation, I.T. and S.G.; writing—review and editing, L.S., G.D. and S.G.; visualization, I.T.; supervision, L.S. and G.D.; project administration, L.S.; funding acquisition, L.S. and G.D. All authors have read and agreed to the published version of the manuscript.

Funding

This research was supported/financed by the European Union-NextGenerationEU (National Sustainable Mobility Center CN00000023, Italian Ministry of University and Research Decree n. 1033-17/06/2022, Spoke 11-Innovative Materials and Lightweighting). The opinions expressed are those of the authors only and should not be considered as representative of the European Union or the European Commission’s official position. Neither the European Union nor the European Commission can be held responsible for them.

Informed Consent Statement

Not applicable.

Data Availability Statement

The original contributions presented in the study are included in the article; further inquiries can be directed to the corresponding author.

Acknowledgments

The material and opportunity for research were kindly provided by Team Iveco Brescia (Italy).

Conflicts of Interest

The authors declare no conflicts of interest.

Abbreviations

The following abbreviations are used in this manuscript:
HCVHeavy Commercial Vehicle
LWDLightweight Design
FEFinite-Element
FEMFinite-Element Method
CFRPCarbon Fibre Reinforced Polymer
GFRPGlass Fibre Reinforced Polymer

References

  1. Eurostat. Freight Transport Statistics–Modal Split. Statistics Explained. 2024. Available online: https://ec.europa.eu/eurostat/statistics-explained/index.php?oldid=194460 (accessed on 9 May 2025).
  2. Road/Total Inland Freight Transport in Italy 2005–2023. Statista. 2023. Available online: www.statista.com/statistics/1069154/italy-road-freight-share-of-inland-transport/ (accessed on 3 July 2025).
  3. Carboni, M.; Dall-Orsoletta, A.; Hawkes, A.; Giarola, S. The future of road freight transport and alternative technologies: A case study for Italy. Energy Convers. Manag. 2024, 299, 117819. [Google Scholar] [CrossRef]
  4. Czerwinski, F. Current trends in automotive lightweighting strategies and materials. Materials 2021, 14, 6631. [Google Scholar] [CrossRef]
  5. Topac, M.M.; Karaca, M.; Aksoy, B.; Deryal, U.; Bilal, L. Lightweight design of a rear axle connection bracket for a heavy commercial vehicle by using topology optimisation: A case study. Mechanics 2020, 26, 64–72. [Google Scholar] [CrossRef]
  6. Lowrie, J.; Pang, H.; Ngaile, G. Weight reduction of heavy-duty truck components through hollow geometry and intensive quenching. J. Manuf. Processes 2017, 28, 523–530. [Google Scholar] [CrossRef]
  7. Lim, S.; Misawa, R.; Furuta, K.; Maruyama, S.; Izui, K.; Nishiwaki, S. Weight reduction design of multi-material vehicle components using level set-based topology optimization. Struct. Multidiscip. Optim. 2022, 65, 100. [Google Scholar] [CrossRef]
  8. Poulikidou, S.; Schneider, C.; Björklund, A.; Kazemahvazi, S.; Wennhage, P.; Zenkert, D. A material selection approach to evaluate material substitution for minimizing the life cycle environmental impact of vehicles. Mater. Des. 2015, 83, 704–712. [Google Scholar] [CrossRef]
  9. Santos, J.; Gouveia, R.M.; Silva, F.J.G. Designing a new sustainable approach to the change for lightweight materials in structural components used in truck industry. J. Clean. Prod. 2017, 164, 115–123. [Google Scholar] [CrossRef]
  10. Zhang, Y.; Ma, L.; Su, H.; Qin, J.; Chen, Z.; Deng, K. Multi-Scale Design and Optimization of Composite Material Structure for Heavy-Duty Truck Protection Device. Comput. Model. Eng. Sci. (CMES) 2024, 139, 1961. [Google Scholar] [CrossRef]
  11. Kezhi, L.H.; Gao, F.Y.; Li, X.L.; Zhang, D.W.; Xiao, B.L. Structure lightweight optimization of truck axle on fatigue failure. Adv. Mater. Res. 2018, 1145, 27–32. [Google Scholar] [CrossRef]
  12. Wang, X.; Yuan, S.; Sun, W.; Hao, W.; Zhang, X.; Yang, Z. Analysis and Validation of Lightweight Carriage Structures Using Basalt Fiber Composites. Materials 2024, 17, 5723. [Google Scholar] [CrossRef] [PubMed]
  13. Solazzi, L.; Danzi, N. Jib crane lightweighting through composite material and prestressing technique. Compos. Struct. 2024, 343, 118283. [Google Scholar] [CrossRef]
  14. Solazzi, L.; Tomasi, I. Design of an Overhead Crane in Steel, Aluminium and Composite Material Using the Prestress Method. J. Compos. Sci. 2024, 8, 380. [Google Scholar] [CrossRef]
  15. Ufuk, R.; Ereke, M. Composite material optimization for heavy duty chassis by finite element analysis. Adv. Automot. Eng. 2018, 1, 41–59. [Google Scholar]
  16. Siraj, A.; Babu, N.R.; Reddy, K.S. Static analysis of dump truck chassis frame made of composite materials. Int. J. Eng. Sci. Technol. 2019, 11, 21–32. [Google Scholar] [CrossRef]
  17. Agarwal, A.; Mthembu, L. Weight optimization of heavy-duty truck chassis by optimal space fill design using light weight Graphite Al GA 7-230 MMC. Mater. Today Proc. 2022, 52, 1278–1287. [Google Scholar] [CrossRef]
  18. Svensson, L.E.; Karlsson, L.; Söder, R. Welding enabling light weight design of heavy vehicle chassis. Sci. Technol. Weld. Join. 2015, 20, 473–482. [Google Scholar] [CrossRef]
  19. Tomasi, I.; Grandi, S.; Solazzi, L. Implementation of Composite Materials for an Industrial Vehicle Component: A Design Approach. J. Compos. Sci. 2025, 9, 168. [Google Scholar] [CrossRef]
  20. Gawande, S.H.; Muley, A.A.; Yerrawar, R.N. Optimization of torsional stiffness for heavy commercial vehicle chassis frame. Automot. Innov. 2018, 1, 352–361. [Google Scholar] [CrossRef]
  21. Carpinteri, A. Scienza Delle Costruzioni 1; Società Editrice Esculapio: Bologna, Italy, 2023. [Google Scholar]
  22. Lombaert, G.; Degrande, G. The experimental validation of a numerical model for the prediction of the vibrations in the free field produced by road traffic. J. Sound Vib. 2003, 262, 309–331. [Google Scholar] [CrossRef]
  23. Ashby, M.F.; Cebon, D. Materials selection in mechanical design. MRS Bull. 2005, 30, 995. [Google Scholar] [CrossRef]
  24. Christensen, R.M. Mechanics of Composite Materials; Courier Corporation: North Chelmsford, MA, USA, 2012. [Google Scholar]
  25. Naik, N.K.; Kumar, R.S. Compressive strength of unidirectional composites: Evaluation and comparison of prediction models. Compos. Struct. 1999, 46, 299–308. [Google Scholar] [CrossRef]
  26. Xu, Y.L.; Reifsnider, K.L. Micromechanical modeling of composite compressive strength. J. Compos. Mater. 1993, 27, 572–588. [Google Scholar] [CrossRef]
  27. Fleck, N.A.; Budiansky, B. Compressive failure of fibre composites due to microbuckling. In Proceedings of the Inelastic Deformation of Composite Materials: IUTAM Symposium, Troy, NY, USA, 29 May–1 June 1990; Springer: New York, NY, USA, 1991. [Google Scholar] [CrossRef]
  28. Solazzi, L.; Vaccari, M. Reliability design of a pressure vessel made of composite materials. Compos. Struct. 2022, 279, 114726. [Google Scholar] [CrossRef]
  29. Solazzi, L. Reliability evaluation of critical local buckling load on the thin walled cylindrical shell made of composite material. Compos. Struct. 2022, 284, 115163. [Google Scholar] [CrossRef]
  30. Stojcevski, F.; Hilditch, T.; Henderson, L.C. Henderson. A modern account of Iosipescu testing. Compos. Part A Appl. Sci. Manuf. 2018, 107, 545–554. [Google Scholar] [CrossRef]
  31. Komartin, R.S.; Balanuca, B.; Necolau, M.I.; Cojocaru, A.; Stan, R. Composite materials from renewable resources as sustainable corrosion protection coatings. Polymers 2021, 13, 3792. [Google Scholar] [CrossRef] [PubMed]
  32. Zhang, J.; Zheng, Y. Constructing multi-protective functional polyurethane composite coating via internal-external dual modification: Achieving superhydrophobicity, enhanced barrier, corrosion inhibition, and UV aging resistance properties. Prog. Org. Coat. 2024, 194, 108540. [Google Scholar] [CrossRef]
  33. European Committee for Standardization (CEN). EN 10149-2:2013—Hot Rolled Flat Products Made of High Yield Strength Steels for Cold Forming—Part 2: Technical Delivery Conditions for Thermomechanically Rolled Steels; CEN: Brussels, Belgium, 2013. [Google Scholar]
  34. Visconti, I.C.; Caprino, G.; Langella, A. Materiali Compositi: Tecnologie, Progettazione, Applicazioni; U. Hoepli: Milano, Italy, 2009. [Google Scholar]
  35. Toray Composite Materials America Inc. M50J High Modulus Carbon Fiber. Available online: https://cdn.thomasnet.com/ccp/30164375/140079.pdf (accessed on 3 July 2025).
  36. Mates s.r.l. SX10–Scheda Tecnica Della Resina Epossidica SX10. n.d. Available online: https://fileserver.mates.it/Prodotti/2_Matrici/TDS/Resine/Mates/SX10_DS.pdf (accessed on 3 July 2025).
  37. Ke, L.; Li, C.; Luo, N.; He, J.; Jiao, Y.; Liu, Y. Enhanced comprehensive performance of bonding interface between CFRP and steel by a novel film adhesive. Compos. Struct. 2019, 229, 111393. [Google Scholar] [CrossRef]
  38. Chen, Y.; Ye, L.; Dong, H. Lightweight 3D carbon fibre reinforced composite lattice structures of high thermal-dimensional stability. Compos. Struct. 2023, 304, 116471. [Google Scholar] [CrossRef]
  39. Meszler, D.; Delgado, O.; Rodríguez, F.; Muncrief, R. European Heavy-Duty Vehicles: Cost-Effectiveness of Fuel-Efficiency Technologies For Long-Haul Tractor-Trailers in the 2025–2030 Timeframe; International Council on Clean Transportation: Washington, DC, USA, 2018. [Google Scholar]
  40. Zhu, X.; Shen, X.; Chen, K.; Zhang, Z. Research on the prediction and influencing factors of heavy duty truck fuel consumption based on LightGBM. Energy 2024, 296, 131221. [Google Scholar] [CrossRef]
  41. Sato, S.; Jiang, Y.J.; Russell, R.L.; Miller, J.W.; Karavalakis, G.; Durbin, T.D.; Johnson, K.C. Experimental driving performance evaluation of battery-powered medium and heavy duty all-electric vehicles. Int. J. Electr. Power Energy Syst. 2022, 141, 108100. [Google Scholar] [CrossRef]
  42. Kim, H.C.; Wallington, T.J. Life cycle assessment of vehicle lightweighting: A physics-based model to estimate use-phase fuel consumption of electrified vehicles. Environ. Sci. Technol. 2016, 50, 11226–11233. [Google Scholar] [CrossRef] [PubMed]
  43. Del Pero, F.; Berzi, L.; Antonacci, A.; Delogu, M. Automotive lightweight design: Simulation modeling of mass-related consumption for electric vehicles. Machines 2020, 8, 51. [Google Scholar] [CrossRef]
  44. Agenzia per la Protezione dell’Ambiente e dei Servizi Tecnici. Analisi dei Fattori di Emissione di CO2 dal Settore dei Trasporti. Available online: https://www.isprambiente.gov.it/contentfiles/00003900/3906-rapporti-03-28.pdf (accessed on 2 July 2025).
  45. Scarlat, N.; Prussi, M.; Padella, M. Quantification of the carbon intensity of electricity produced and used in Europe. Appl. Energy 2022, 305, 117901. [Google Scholar] [CrossRef]
  46. Cost Components of End Consumer Diesel Prices in the European Union as of February 2024, by Country. Available online: https://www.statista.com/statistics/1488574/eu-diesel-price-breakdown-by-country/ (accessed on 25 June 2025).
  47. Electricity Prices for Enterprises Worldwide in September 2024, by Select Country. Available online: https://www.statista.com/statistics/1369634/business-electricity-price-worldwide-in-selected-countries/ (accessed on 25 June 2025).
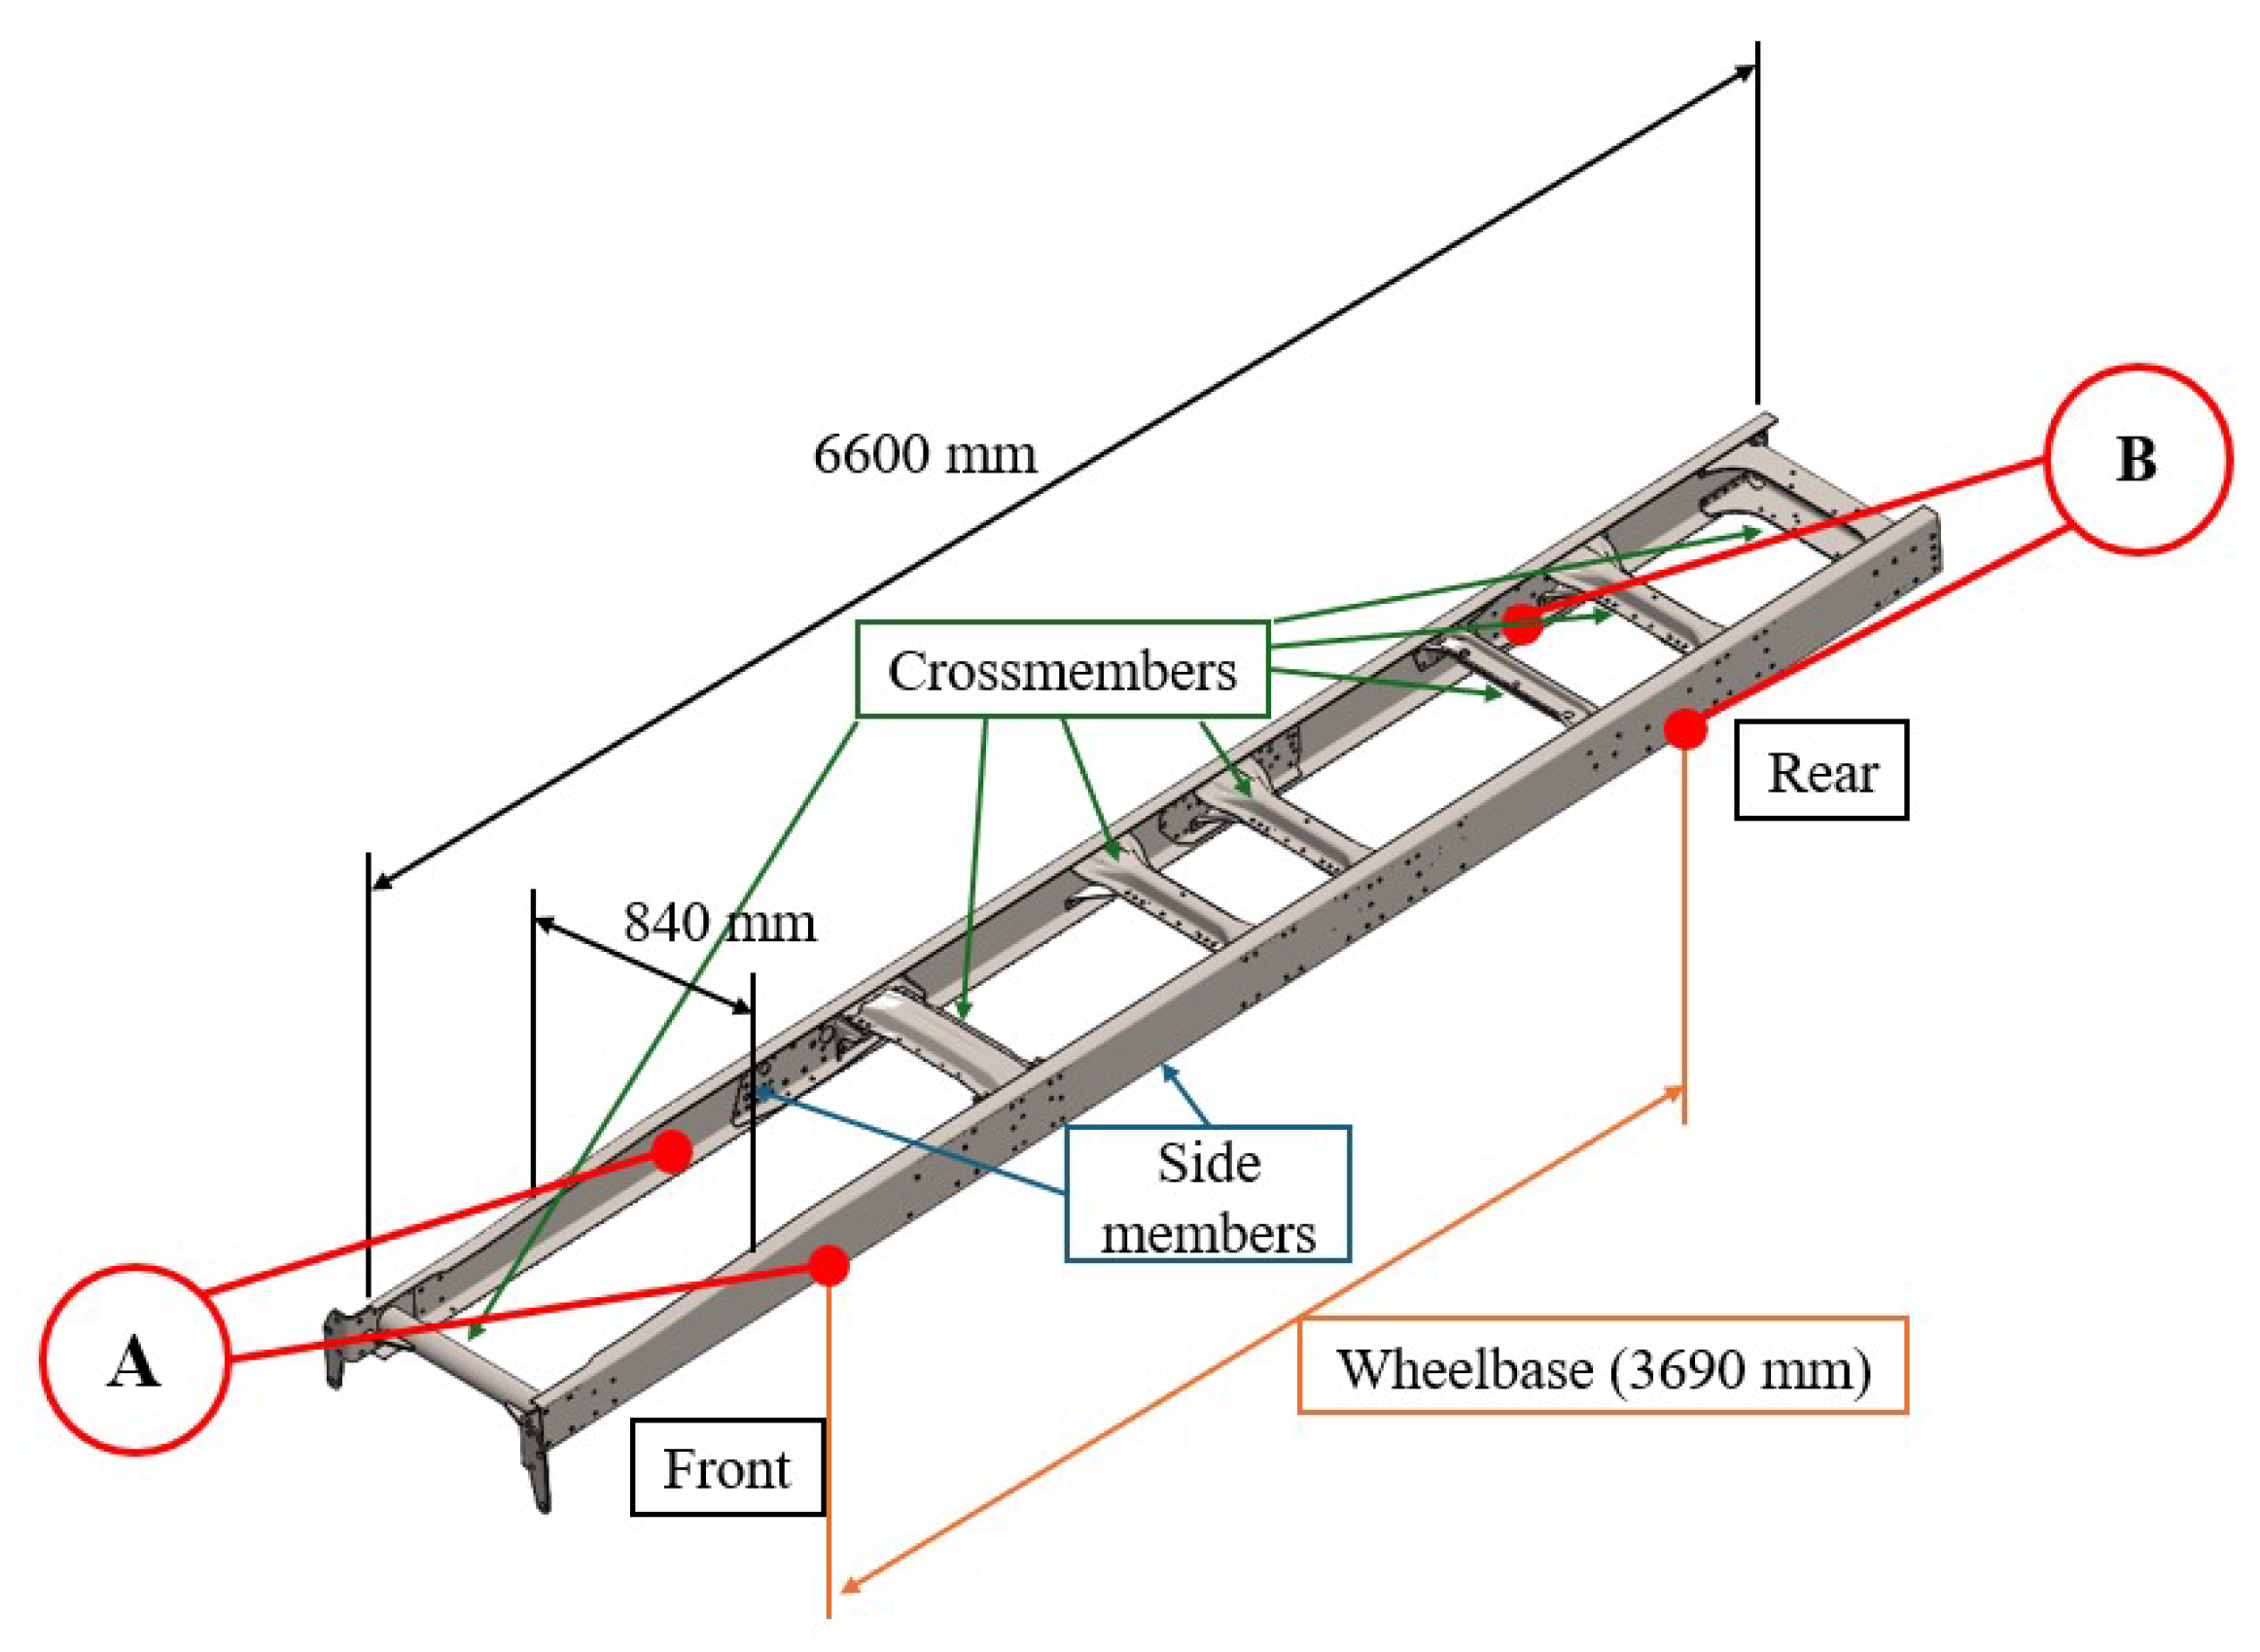
Figure 1. 3D draw of the chassis for a heavy industrial vehicle. The points depicted by the letter A represents the position where the front wheel axle is compared to the chassis, while the points represented by the letter B define the positions of the rear wheel axle compared to the chassis.
Jcs 09 00611 g001
Figure 2. Schematization of the analysis for the torsional and bending stiffness of the crossmember: constraints and loads. (a) Component analysed. (b) Schematization of the analysis for the torsional stiffness. (c) Schematization of the analysis for the bending stiffness.
Jcs 09 00611 g002
Figure 3. Coordinate system for the position of laminates.
Jcs 09 00611 g003
Figure 4. Test bench for an HCV chassis frame.
Jcs 09 00611 g004
Figure 7. Chassis frame model with some test bench beams (shown in red).
Jcs 09 00611 g007
Figure 8. Boundary conditions defined in the model of the whole chassis: fixed constraints (in blue) are applied in the middle of the rear test bench beams, where the rear wheel axle is supposed to be, while the imposed rotation (in yellow) is applied to the front transversal test bench beam, where the front wheel axle is designed to be placed.
Jcs 09 00611 g008
Figure 9. Crossmembers model of the traditional chassis frame with all the boundary conditions shown. (a) Model of the crossmember analysed. (b) Fixed constraint applied to the crossmember. (c) Boundary conditions imposed on the crossmember: the green area is where the forces or the torque moment are applied, needed to evaluate the bending and the torsional stiffness of the component.
Jcs 09 00611 g009
Figure 10. Geometrical representation of the CFRP solution.
Jcs 09 00611 g010
Figure 11. Displacements in the two load cases studied for the S420MC solution.
Jcs 09 00611 g011
Figure 12. Displacements in the two load cases studied for the CFRP solution.
Jcs 09 00611 g012
Figure 13. Bending and torsional mode natural frequencies for the S420MC solution.
Jcs 09 00611 g013
Figure 14. Bending and torsional mode natural frequencies for the CFRP solution.
Jcs 09 00611 g014
Figure 15. Experimental results: graph of the applied torque moment related to the rotation.
Jcs 09 00611 g015
Figure 16. Graphs of the amortization for the two innovative solutions. (a) Chart of savings considering a diesel engine. (b) Chart of savings considering an electric engine.
Jcs 09 00611 g016
Table 1. Mechanical properties of S420MC.
Ultimate Tensile StrengthYield StrengthYoung’s ModuleDensityPoisson’s Coefficient
R m [MPa] R p 0.2 [MPa]E [MPa] ρ [kg/m3] ν
480420210,00078600.29
Table 2. Bushing properties.
K x [N/m] K y [N/m] K z [N/m] K α x [Nm/rad] K α y [Nm/rad] K α z [Nm/rad]
48,500,00032,000,00048,500,0003016030
Table 3. Property of the M50J carbon fibre and SX10 epoxy resin.
Carbon FibreEpoxy Resin
PropertySymbolValueSymbolValue
Density ρ f 1880 kg/m3 ρ m 1200 kg/m3
Young modulus E f 475 GPa E m 3.3 GPa
Tensile strength σ f t 4120 MPa σ m t 65 MPa
Compressive strength σ f t - σ m c 120 MPa
Poisson ratio ν f 0.28 ν m 0.34
Table 4. Mechanical properties of CFRP.
Mechanical PropertySymbolValueU.O.M.
Longitudinal tensile elasticity modulus E 1 286GPa
Transversal tensile elasticity modulus E 2 8.16GPa
Shear elasticity modulus G 12 3GPa
Longitudinal tensile strength X T 2472MPa
Transversal tensile strength Y T 45MPa
Longitudinal compression strength X C 880GPa
Transversal compression strength Y C 99.2MPa
Shear strengthS59MPa
Density ρ 1608kg/m3
Poisson ratio ν 12 0.3
carbon fiber percentage V f % 60%
Table 5. Bending and the torsional stiffness of the traditional and CFRP crossmember.
X-axis lateral force F x = 1000 N
SolutionDisplacement d x [m]Load [N]Stiffness K x   [ N m ] Variation [%]
Traditional8.92 × 10 4 10001.12 × 10 6 -
CFRP8.49 × 10 4 10001.18 × 10 6 +5%
Torque M α y = 1000 Nm
SolutionRotation d α y [rad]Torque [Nm]Stiffness K α y   [ Nm rad ] Variation [%]
Traditional3.47 × 10 2 10002.88 × 10 5 -
CFRP3.24 × 10 2 10003.09 × 10 5 +6.8%
Table 6. Numerical and experimental results comparison applying a 5° rotation of the chassis frame.
Results TypeChassis TypeTorque M α x [Nm]Torsional Stiffness K α x   [ Nm rad ] Relative Error
ExperimentalTraditional240027,502-
NumericalTraditional242727,8111.13%
NumericalCFRP solution261329,9437.66%
Table 7. Costs and weight of the different solutions.
Steel S420MCCarbon Fibre
Reinforced Polymer
Weight [kg]Cost [€]Weight [kg]Cost [€]
crossmember19.23653.55212.95
links--2.598.75
Total19.23656.14221.70
Percentage change--−68.08%+241.14%
Table 8. Evaluation of the economical savings and reduction of CO2 emissions.
PropertyValue CFRP (Diesel)Value CFRP (Electric)U.O.M.
Standard consumption [40,41]0.43671.54L/km–kWh/km
Annual mileage [39]135,000135,000km/year
Fuel—Energy consumption58,954.5207,900L/year–kWh/year
Fuel—Energy consumption variation index for Internal Combustion Engine Vehicles (ICEVs) [42]—Electric Vehicles (EVs) [43]0.0000250.000082L/(km kg)–kWh/(km kg)
Mass decrease with respect to the standard solution80.7580.75kg
Optimized consumption0.00200.0066L/km–kWh/km
Fuel—Energy consumption (optimized chassis)58,682207,006.1L/year–kWh/year
Fuel—Energy consumption decrease (with respect to the standard solution)272.5893.9L/year–kWh/year
CO2 emissions per kilogram of diesel [44]3.17-kgCO2/kgdiesel
Density of diesel (at 15 °C)820-kg/m3
CO2 emissions per liter of diesel/CO2 emissions per kWh [45]2.600.334kgCO2/Ldiesel–kgCO2/kWh
Reduction of CO2 emissions (with respect to the standard solution)708.4298.6kgCO2/year
Current diesel price/Current electric energy price [46,47]1.70.335€/L–€/kWh
Economic saving (with respect to the standard solution)463.28299.80€/year
Disclaimer/Publisher’s Note: The statements, opinions and data contained in all publications are solely those of the individual author(s) and contributor(s) and not of MDPI and/or the editor(s). MDPI and/or the editor(s) disclaim responsibility for any injury to people or property resulting from any ideas, methods, instructions or products referred to in the content.