Article

In Situ Polymerization as an Effective Method, Compared to Melt Mixing, for Synthesis of Flexible Poly(lactic acid) Nanocomposites Based on Metal Nanoparticles

by
Kyriaki Lazaridou
,
Rafail O. Ioannidis
and
Dimitrios N. Bikiaris
*
Laboratory of Polymer Chemistry and Technology, Department of Chemistry, Aristotle University of Thessaloniki, GR-541 24 Thessaloniki, Greece
*
Author to whom correspondence should be addressed.
J. Compos. Sci. 2025, 9(11), 610; https://doi.org/10.3390/jcs9110610
Submission received: 19 September 2025 / Revised: 30 October 2025 / Accepted: 2 November 2025 / Published: 5 November 2025
(This article belongs to the Special Issue Feature Papers in Journal of Composites Science in 2025)

Abstract

A comprehensive investigation was conducted focusing on two series of poly(lactic acid) (PLA)-based nanocomposites filled with small amounts (0.5 and 1.0%) of metal (Ag/Cu) nanoparticles (NPs). Our work aimed to synthesize PLA/Ag nanocomposites via in situ ring-opening polymerization (ROP), and for comparison purposes, the same materials were also prepared via solution casting followed by melt mixing. PLA/Cu nanocomposites were also prepared via melt extrusion. Gel permeation chromatography (GPC) and intrinsic viscosity measurements [η] showed that the incorporation of Ag nanoparticles (AgNPs) resulted in a decrease in the molecular weight of the PLA matrix, indicating a direct effect of the AgNPs on its macromolecular structure. Fourier-transform infrared spectroscopy (FTIR) revealed no significant changes in the characteristic peaks of the nanocomposites, except for an in situ sample containing 1.0 wt% of AgNPs, where slight interactions in the C=O region were detected. Differential scanning calorimetry (DSC) analysis confirmed the semi-crystalline nature of the materials. Glass transition temperature was strongly affected by the presence of NPs in the case of the in situ-based samples. Melt crystallized studies suggested potential indirect polymer–NP interactions, while isothermal melt crystallization experiments confirmed the nucleation ability of the NPs. The mechanical performance was assessed via tensile and flexural measurements, revealing that the in situ-based samples exhibited remarkable flexibility. Moreover, during the three-point bending tests, none of the in situ nanocomposite samples broke. In this context, next-generation PLA-based nanocomposites have been proposed for advanced applications, including flexible printed electronics.

Graphical Abstract

1. Introduction

The rapid increase in global plastic production, estimated at 150 million tons in 2023 and expected to exceed 590 million by 2050, has highlighted more than ever the urgent need for alternative, sustainable materials [1,2,3]. Since industrial-scale production began in the 1950s, approximately 9 billion tons have been produced, mainly from petrochemical materials, whose persistence poses long-term sustainability issues [4]. Despite these concerns, conventional plastics continue to dominate in the global market owing to their favorable functional advantages and properties. In response to these challenges, polymer scientists and governments are increasingly promoting biobased and biodegradable alternatives, supporting the transition toward a circular and sustainable bioeconomy [5,6,7,8,9].
Poly(lactic acid) (PLA), often described as the “polymer of the 21st century”, represents one of the most promising candidates in the search for sustainable materials [10,11]. PLA is a linear aliphatic thermoplastic polyester that can be derived from lactic acid (2-hydroxypropionic acid). This acid is primarily obtained from renewable plant-based sources, such as cellulose, starch, corn, and agricultural wastes. Lactic acid can be converted into l- or d-lactide, following a polymerization step for the synthesis of PLA, via ROP [12].
Owing to its biocompatibility, melt processability, and versatile performance, PLA has been widely adopted in fields such as medical devices, packaging materials, films, fibers, the automotive industry, and agriculture [13,14,15]. Depending on its molecular weight and stereochemical composition, PLA may exhibit either semicrystalline or amorphous behavior, achieving a balance between mechanical robustness and ductility [16,17]. Despite its advantages, PLA presents several drawbacks, including low melt strength, fragility, and sensitivity to moisture and gases. It also has modest antioxidant capacity, low thermal resistance, and a slow crystallization and degradation rate [18,19,20].
To address some of these inherent limitations, recent research has focused on the incorporation of organic/inorganic fillers and nanoadditives to optimize its functional properties. Such developments have inspired innovative approaches to improve the mechanical, thermal, and other physical characteristics of PLA, often at low additive concentrations [21,22,23,24]. Hybrid nanotechnology, in particular, has created a new revolution in the area of material science, developing the most advanced high-tech composites for applications such as electronics [25,26,27,28].
Silver is a soft, noble metal with well-known conductive and antimicrobial properties. In its nanoscale form, AgNPs are classified as metal-based nanomaterials and exhibit enhanced functionality compared to bulk silver. Metal nanoparticles (MNPs), especially AgNPs, exhibit exceptional physicochemical properties that have made them the focus of sustained scientific interest. Owing to these features, they are extensively studied for applications across diverse fields such as electronics, textiles, sensors, and nanomedicine. AgNPs stand out among nanomaterials due to their remarkable antimicrobial, electrical, optical, thermal, and catalytic properties [29,30,31,32,33,34,35,36].
Similarly, copper (Cu), a 3d transition metal, exhibits remarkable optical, thermal, and electrical properties, making it another promising candidate for incorporation into PLA-based nanocomposites. Copper nanoparticles (CuNPs) have been synthesized using various methods, including chemical reduction, thermal reduction, and microemulsion techniques. Their earth-abundance and low cost have made them particularly attractive for large-scale applications. Currently, CuNPs are widely used in agricultural, industrial, and technological fields, and have demonstrated valuable properties such as antimicrobial, bactericidal, and catalytic activity. These properties have led to their use in antibacterial pharmaceuticals, textiles, photocatalysis, electrical conductors, biochemical sensors, and coatings for medical equipment. However, a significant drawback of CuNPs is their susceptibility to oxidation during synthesis, which can limit their stability and overall functionality [37,38,39].
Several studies have investigated the incorporation of Ag and Cu NPs into PLA matrices, with several literature documents indicating mainly improvements in antimicrobial performance. Specifically, PLA/Ag systems have been widely reported for their enhanced stability in biomedical and packaging applications. Similarly, CuNP/PLA nanocomposites exhibit catalytic activity (based on the literature), with potential in thermal and electrical applications. Typical preparation routes include melt mixing and solution casting, combined with stabilizers or green synthesis approaches to avoid oxidation and agglomeration. However, despite these promising advances, the preparation of PLA-based nanocomposites via in situ polymerization, a strategy that can directly influence the resulting material properties, has not yet been explored [40,41,42,43,44].
In situ ROP [12,45] enables the development of strong interfacial interactions between polymer chains and nanofillers, resulting in homogeneous filler dispersion and enhanced material performance. Graphene- and biochar-filled nanocomposites prepared via in situ ROP have demonstrated increased electrical conductivity and thermal stability, while lignin-based PLA composites exhibited improved mechanical strength, antioxidant activity, and UV-shielding properties. Likewise, PLA/sepiolite nanocomposites synthesized through in situ ROP revealed stronger hydrogen-bonding interactions and enhanced crystallinity and melting behavior. Furthermore, the incorporation of organically modified montmorillonite was shown to promote the PLA crystallization process, whereas silane-modified nanosilica led to a significant enhancement in crystallinity accompanied by a marked reduction in O2 and CO2 permeability [46,47,48,49,50]. To the best of our knowledge, the in situ-based synthesis of PLA nanocomposites including Ag NPs was reported recently by our group for the first time, where the in situ samples exhibited improved conductive properties [51]. Thus, the present work focused on the different optical and mechanical properties that the materials may exhibit compared to those prepared by melt mixing. Moreover, preliminary experiments of isothermal crystallization kinetics from the melt were conducted in order to investigate the crystallization rates of the materials.
In summary, this work thoroughly investigated the preparation of poly(lactic acid) (PLA)-based nanocomposites incorporating copper and silver NPs at two different weight ratios (0.5 wt% and 1.0 wt%). The synthesis of the nanocomposite materials based on Ag was carried out using two distinct methods: ROP and melt mixing. The prepared nanocomposites were comprehensively characterized using a wide range of techniques and methods (optical, infrared spectroscopy, thermal analysis, mechanical testing, etc.), providing valuable insights into their morphology, structure, thermal behavior, mechanical performance, and overall material properties. The objective of this study was to assess the impact of MNP type and concentration on the multifunctional performance of PLA-based nanocomposites, aiming to understand the structure–property relationships of these materials, for advanced applications such as printed electronics [52,53,54,55]. Last but not least, it is important to note that the in situ method of incorporation of AgNPs that was suggested in the present work led to flexible PLA nanocomposite substrates, indicating strong polymer–NP interactions.

2. Materials and Methods

2.1. Materials

1-dodecanol, tin(II) 2-ethylhexanoate (Sn(Oct)2 was supplied from Aldrich Co. (London, UK). L-lactide (LA) (99.9%) was purchased from PURAC Biochem BV (Gorinchem, The Netherlands) under the brand name PURASORB®L, and Luminy® PLA L175, of melt flow index (MFI) at 8 g/10 min (Flow, 210 °C/2.16 kg) and 3 g/10 min (Flow, 190 °C/2.16 kg), was purchased from Corbion N.V. (Gorinchem, The Netherlands). Ag nanopowder, APS 20–40 nm (99.9%), and Cu nanopowder, APS 20–50 nm (99.9%) nanoparticles were supplied by ThermoFisher Scientific (Erlenbachweg 2, 76870 Kandel, Germany). All other materials and solvents used were of analytical grade.

2.2. Synthesis of PLA and PLA Nanocomposites Based on Ag via Ring-Opening Polymerization

PLA and PLA/Ag nanocomposites were synthesized through ROP of L-lactide (Figure 1). The polymerization was carried out in a round-bottomed flask in the presence of L-lactide and AgNPs (for 0.5 and 1.0 wt%) (Table 1), and 400 ppm (or 0.1 mmol) of stannous octoate [Sn(Oct)2] (as solution in toluene). As an initiator, 1-dodecanol (0.05 g/mL acetone) was dissolved in acetone and introduced into the reaction mixture. To eliminate the presence of oxygen, the mixture was degassed by evacuation/refilling cycles using nitrogen. The reaction was then conducted under a nitrogen atmosphere at 160 °C for 2 h. After polymerization, a high vacuum (~5.0 Pa) was gradually applied over 15 min while maintaining the temperature at 180 °C to enhance the molecular weight of the PLA matrix and remove any residual monomer. The reaction was terminated by rapidly cooling the flask to room temperature.

2.3. Masterbatch Preparation via Solvent Casting

Prior to melt mixing, PLA-based masterbatches containing either silver or copper NPs (Table 1) were prepared using the solvent casting method (Figure 1). Commercial PLA was dissolved in chloroform at a concentration of 40 mg/mL, while silver and copper NPs were separately dispersed in chloroform at a concentration of 1 mg/mL. Both dispersions underwent ultrasonication for 1 h. Afterward, the two solutions were mixed and further sonicated for 1 h to ensure homogeneity. The resulting solution was placed under vacuum for solvent evaporation, forming thin nanocomposite films. These films were cut into small pieces and subsequently used as masterbatches in the melt mixing process.

2.4. Preparation of PLA-Based Nanocomposites via Melt Mixing

The masterbatch samples together with commercial PLA were introduced into a Haake–Buchler twin-screw co-rotating extrudermelt mixer equipped with roller blades (Figure 1). This method was used to produce additional PLA-based nanocomposites containing either silver (PLA/Ag) or copper (PLA/Cu) NPs. Prior to processing, both polymer matrices were dried at 80 °C under vacuum for 24 h to eliminate moisture. Melt mixing was conducted at 190 °C for 5 min at a rotor speed of 30 rpm.

Film Preparation

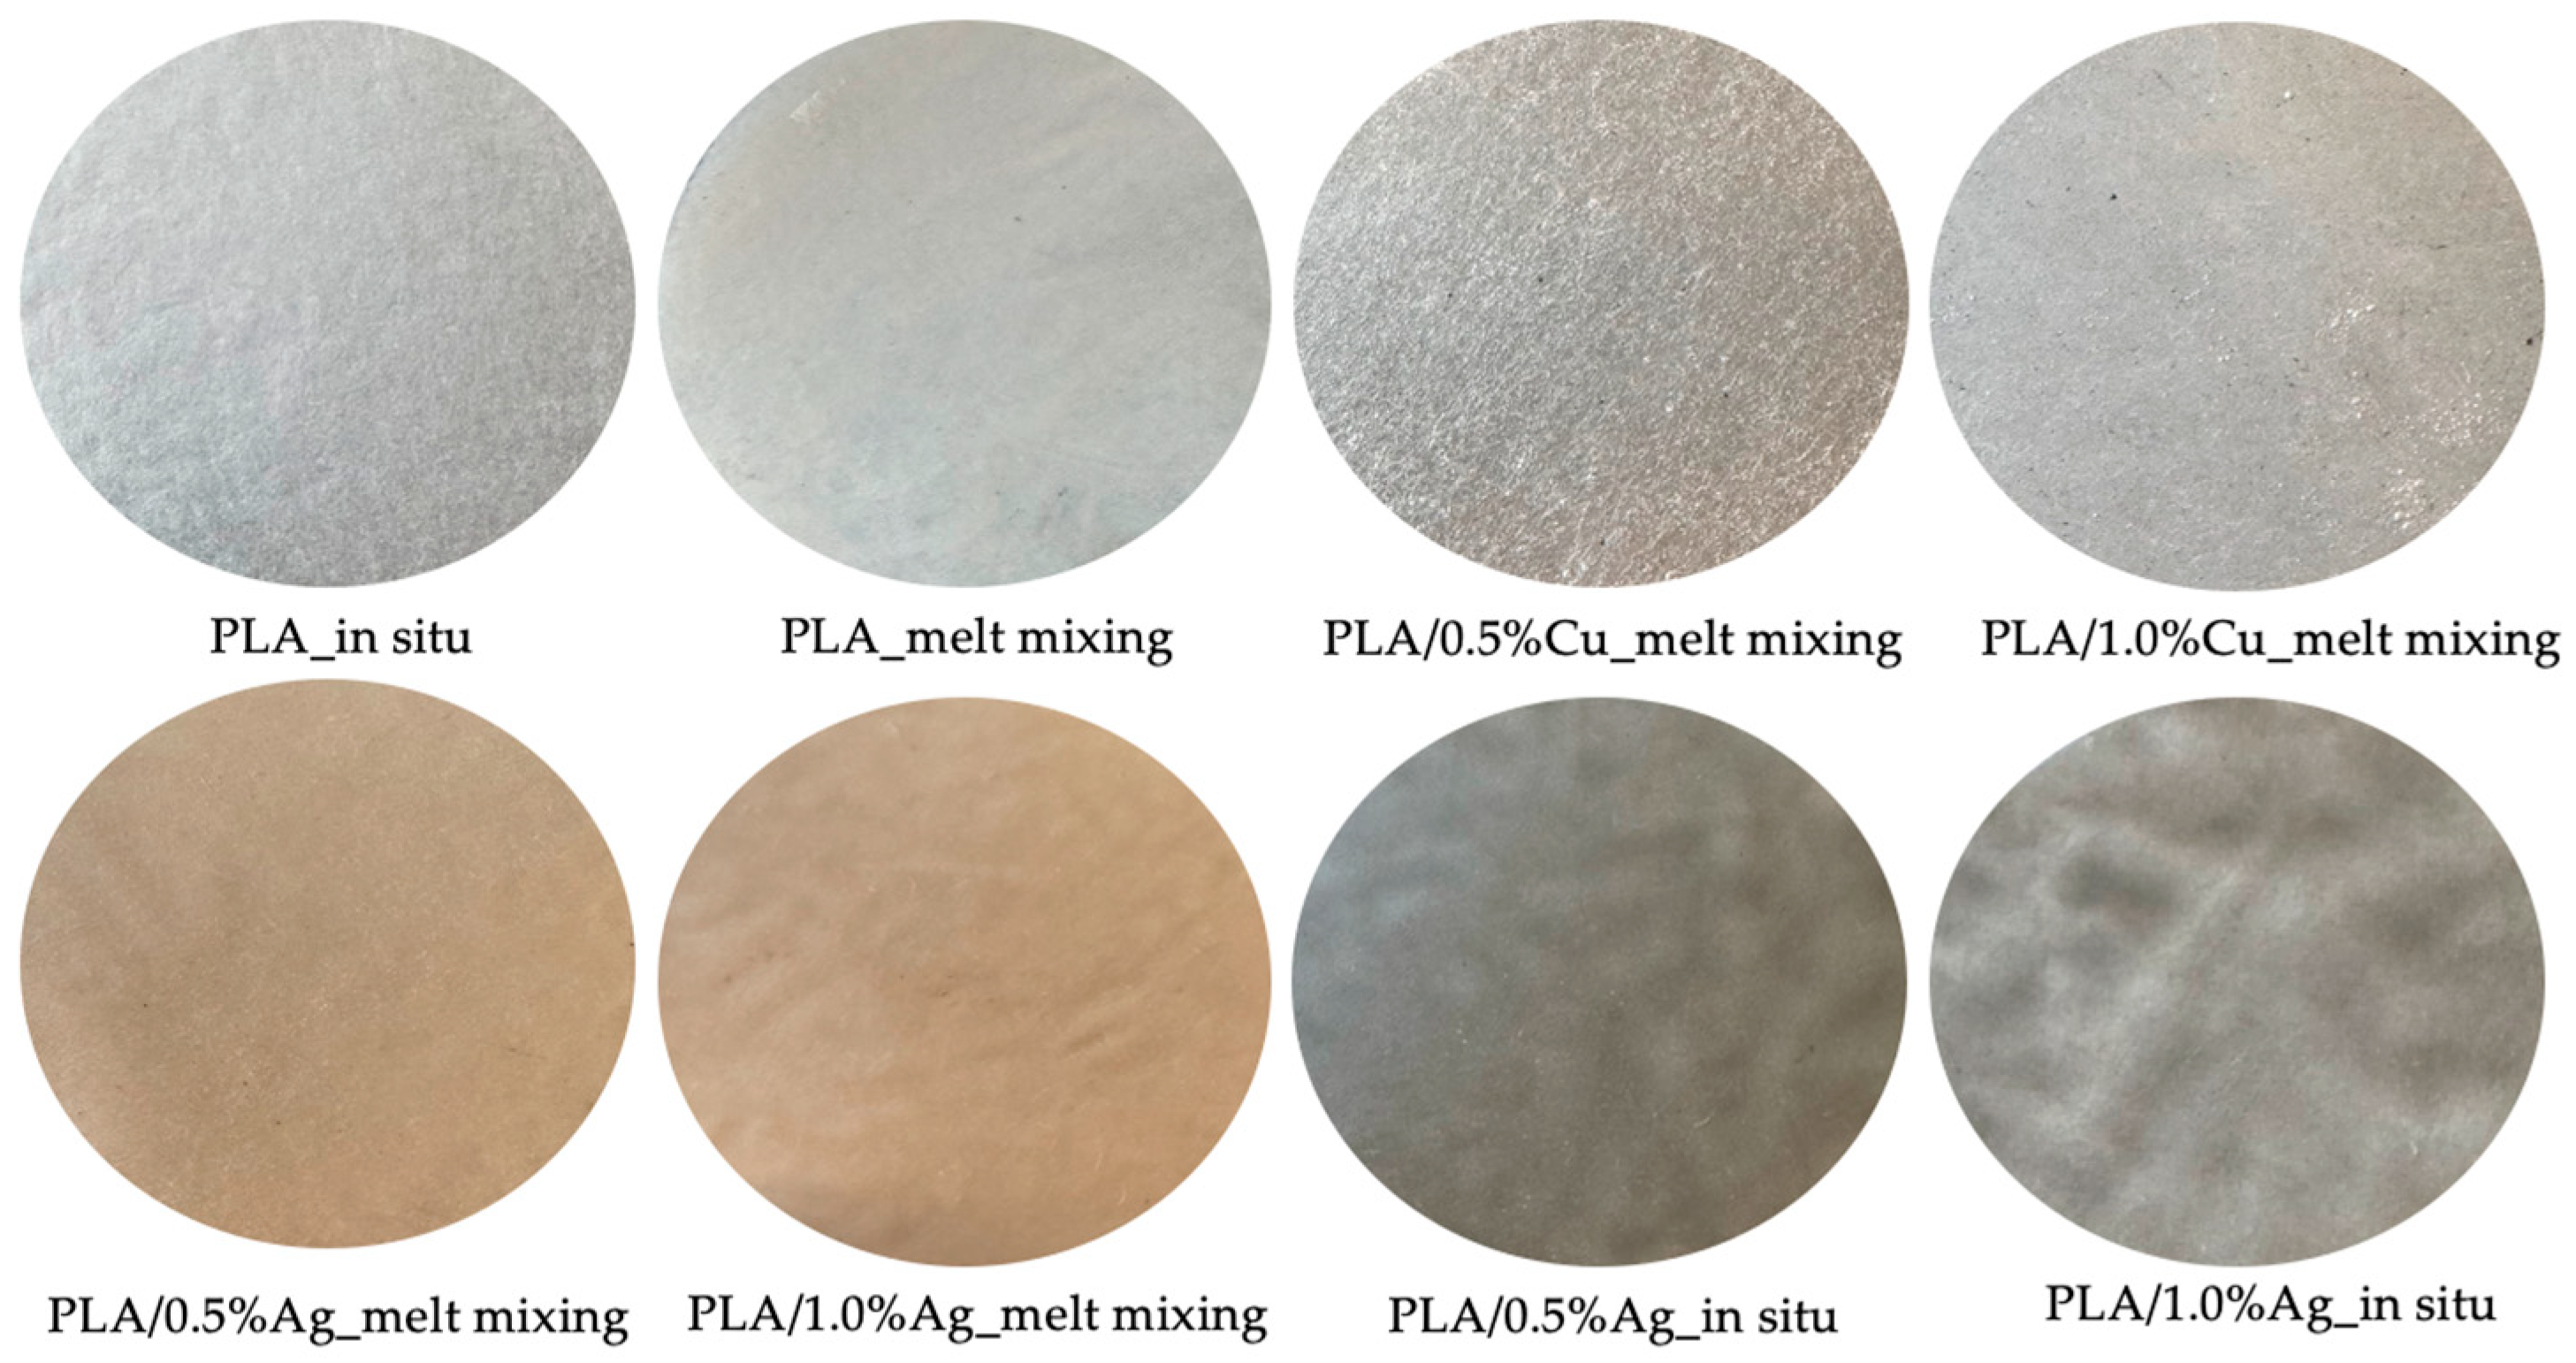
Compression molding samples were prepared using an Otto Weber Type PW 30 hydraulic press (Stuttgart, Germany) equipped with an Omron E5AX temperature controller (Kyoto, Japan). The compression molding conditions differed depending on the origin of the material. For the materials synthesized via ROP (PLA and PLA/Ag samples), molding was performed at 162.5–165 °C and 100 mbar. In contrast, for the nanocomposites prepared via melt mixing (PLA, PLA/Ag and PLA/Cu samples), the molding temperature was higher, ranging from 172.5 to 175 °C and 100 mbar. The films were then cooled to room temperature (Figure 2). All samples exhibited a uniform thickness of approximately 0.40 ± 0.03 mm.

2.5. Characterization Techniques

2.5.1. Intrinsic Viscosity

Intrinsic viscosity [η] measurements were conducted using an Ubbelohde viscometer (capillary 0c) at 25 °C, with chloroform as the solvent. The solutions were filtered through a disposable Teflon membrane to remove any solid residues. Intrinsic viscosity was calculated by applying the Solomon–Cuita equation:
η = 2 t t o ln t t o 1 1 / 2 c
where c is the solution concentration, t is the flow time of the solution, and t0 is the flow time of pure solvent. Each measurement was performed twice.

2.5.2. Gel Permeation Chromatography (GPC)

The molecular weight of the materials was determined using GPC/SEC analysis. The analysis was conducted on an Agilent 1260 Infinity II LC system (Agilent Technologies, Santa Clara, CA, USA), which included an isocratic G7110B pump, an automatic vial sampler G7129A, a refractive index detector (RID) G7162A, a PLgel 5 μM (50 × 7.5 mm) guard column, and two PLgel 5 μM (300 × 7.5 mm) MIXED-C columns. Calibration was performed using poly(methyl methacrylate) (PMMA) standards with molecular weights ranging from 0.535 to 1.591 kg/mol. Samples were prepared by dissolving them in CHCl3 at a concentration of 3 mg/mL and filtering the solution through a 0.45 µm PTFE microfilter to eliminate any solid residues. Each sample was injected in a 20 μL volume, with a total elution time of 30 min. Both the column and RID temperatures were maintained at 40 °C throughout the analysis. Each measurement was performed twice.

2.5.3. Attenuated Total Reflectance Fourier-Transform Infrared Spectroscopy (ATR-FTIR)

FTIR spectra were recorded using an IRTracer-100 spectrophotometer (Shimadzu, Kyoto, Japan) equipped with a QATR™ 10 single-reflection ATR accessory. Each spectrum was collected in the wavenumber range of 4000–500 cm−1, with a resolution of 2 cm−1, and a total of 32 co-added scans. The obtained spectra were normalized prior to analysis.

2.5.4. Color Measurements

Color measurements were performed using a Datacolor Spectraflash SF600 plus CT UV reflectance colorimeter (Datacolor, Marl, Germany) using the D65 illuminant, 101 standard observer with UV component excluded and specular component included. In each case, fivefold measurements were performed using a special holder (Datacolor) and the mean values were calculated. The color values were calculated using the CIE L*a*b* color space system. In this system, L* represents the lightness (L* = 0: black, L* = 100: white). The a* value corresponds to the green–red axis, where negative a* values indicate green and positive a* values indicate red hues. The b* value represents the blue–yellow axis, where negative b* values indicate blue and positive b* values indicate yellow hues.

2.5.5. Differential Scanning Calorimetry (DSC)

Differential scanning calorimetry (DSC) analysis was performed using a PerkinElmer Pyris Diamond DSC (Solingen, Germany) calibrated with pure indium, tin, and zinc standards. The instrument was equipped with a PerkinElmer Intracooler 2 cooling accessory and operated under a nitrogen atmosphere. Samples of 5.0 ± 0.1 mg were sealed in aluminum pans prior to testing to evaluate the thermal behavior of the polymers. In order to erase the thermal history of the sample, an initial heating scan was performed (Tm + 30 °C). After the first heating scan, the samples were quenched at 150 °C/min, and then reheated at 20 °C/min to determine the glass transition temperature (Tg), cold crystallization temperature (Tcc), and melting temperature (Tm). Finally, the samples were cooled again from 200 °C to Tg − 40 °C at 10 °C/min to determine their crystallization temperature (Tc).
Isothermal melt crystallization experiments were performed to evaluate the crystallization rates of the materials. The samples were heated at 40 °C above their Tm and held there for 3 min to erase any thermal history, and then a cooling step in the DSC at the highest rate possible was performed at specific crystallization temperatures. The final step was a subsequent heating at 40 °C above their Tm, with a heating step at 20 °C/min. All measurements were performed twice.

2.5.6. X-Ray Diffraction (XRD)

Samples were subjected to X-ray diffraction measurements with the MiniFlex II XRD system from Rigaku Co. (Tokyo, Japan) with CuKa radiation (λ = 0.154 nm) in the angle 2θ range from 5 to 45° at a scanning rate of 1 °C/min. The sample holder for the measurements was approximately 32 mm in diameter. For each case, flat compression-molded samples were used.

2.5.7. Tensile Properties

The tensile properties of the samples were measured using a Shimadzu EZ Test Tensile Tester (Model EZ-LX) (1, Nishinokyo Kuwabara-cho, Nakagyo-ku, Kyoto 604-8511, Japan) equipped with a 2 kN load cell, in accordance with ASTM D882, at a crosshead speed of 5 mm/min. Dumbbell-shaped tensile specimens (central portion: 5 mm wide × 0.5 mm thick, 22 mm gauge length) were prepared by cutting the compression-molded samples using a Wallace cutting press. At least five measurements were performed for each sample, and mean values were calculated for the tensile parameters.

2.5.8. Flexural Properties

Three-point bending tests were conducted using a Shimadzu EZ Flexural Tester (Model EZ-LX) equipped with a 2 kN load cell, in accordance with ASTM D790-17. Compression-molded samples were prepared using a thermopress, with dimensions of 12.7 mm in width and 1.6 mm in thickness. The samples were tested flatwise on the support span, with a support span-to-depth ratio of 16:1 (±1 tolerance). For each sample type, at least five measurements were performed, and mean values were calculated for the flexural modulus and flexural strength.

2.5.9. Water Contact Angle

Water contact angles were measured using the sessile drop method with an Ossila Contact Angle Goniometer (model L2004A1; Ossila Ltd., Sheffield, UK). All measurements were performed in triplicate, and the results are reported as mean and standard deviation (SD).

3. Results and Discussion

3.1. Synthesis and Structural Investigation of PLA and PLA/Ag-Cu Nanocomposites

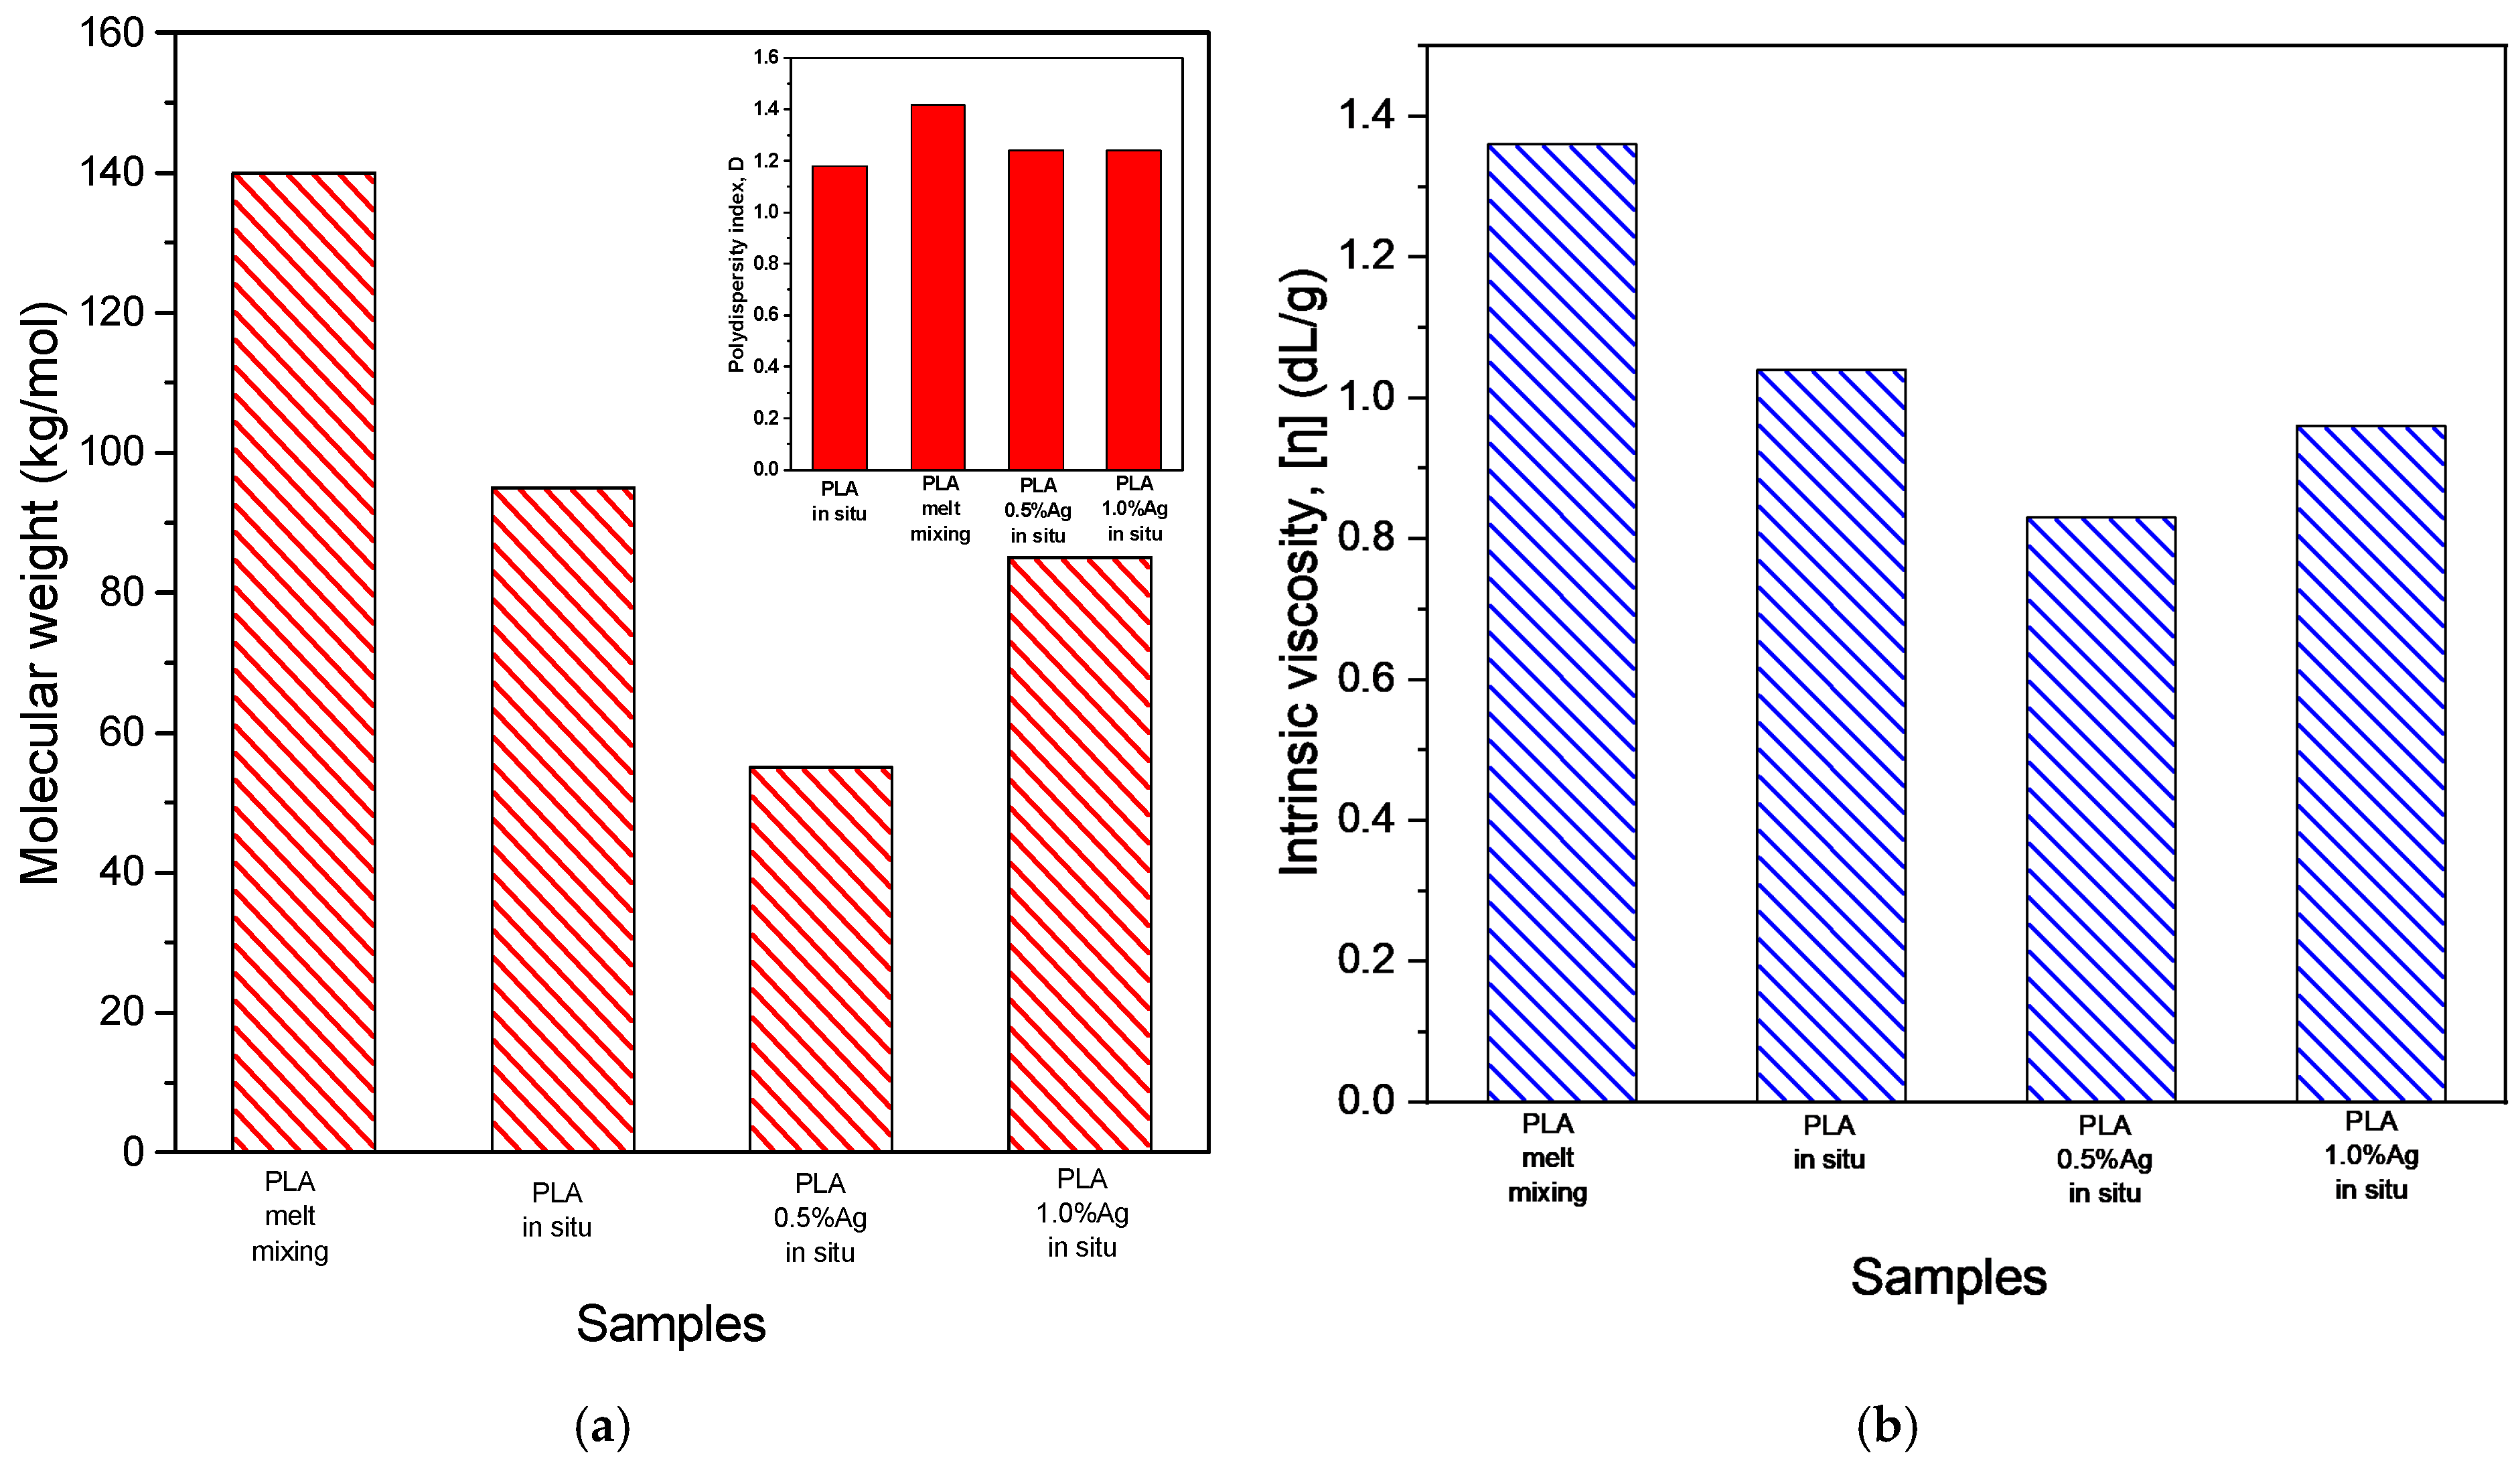
Gel permeation chromatography (GPC) (Figure 3) analysis was performed to determine the number-average molecular weight ( M n ¯ ) of the synthesized in situ nanocomposite materials and PLA commercial samples, along with intrinsic viscosity [η] measurements (Figure 4). From the GPC analysis, it was observed that the incorporation of AgNPs into the PLA matrix at both 0.5 wt% and 1.0 wt% led to a decrease in both molecular weight and intrinsic viscosity values [46]. These findings suggested that the presence of AgNPs directly affected the macromolecular structure of PLA. The Ag NPs probably provided additional active sites for the ROP of L-lactide, facilitating PLA chain growth while maintaining a nearly unchanged polydispersity index [51]. This behavior correlated with the reduced glass transition temperature and crystalline fraction of the PLA in situ-based nanocomposites compared to the neat in situ PLA sample.
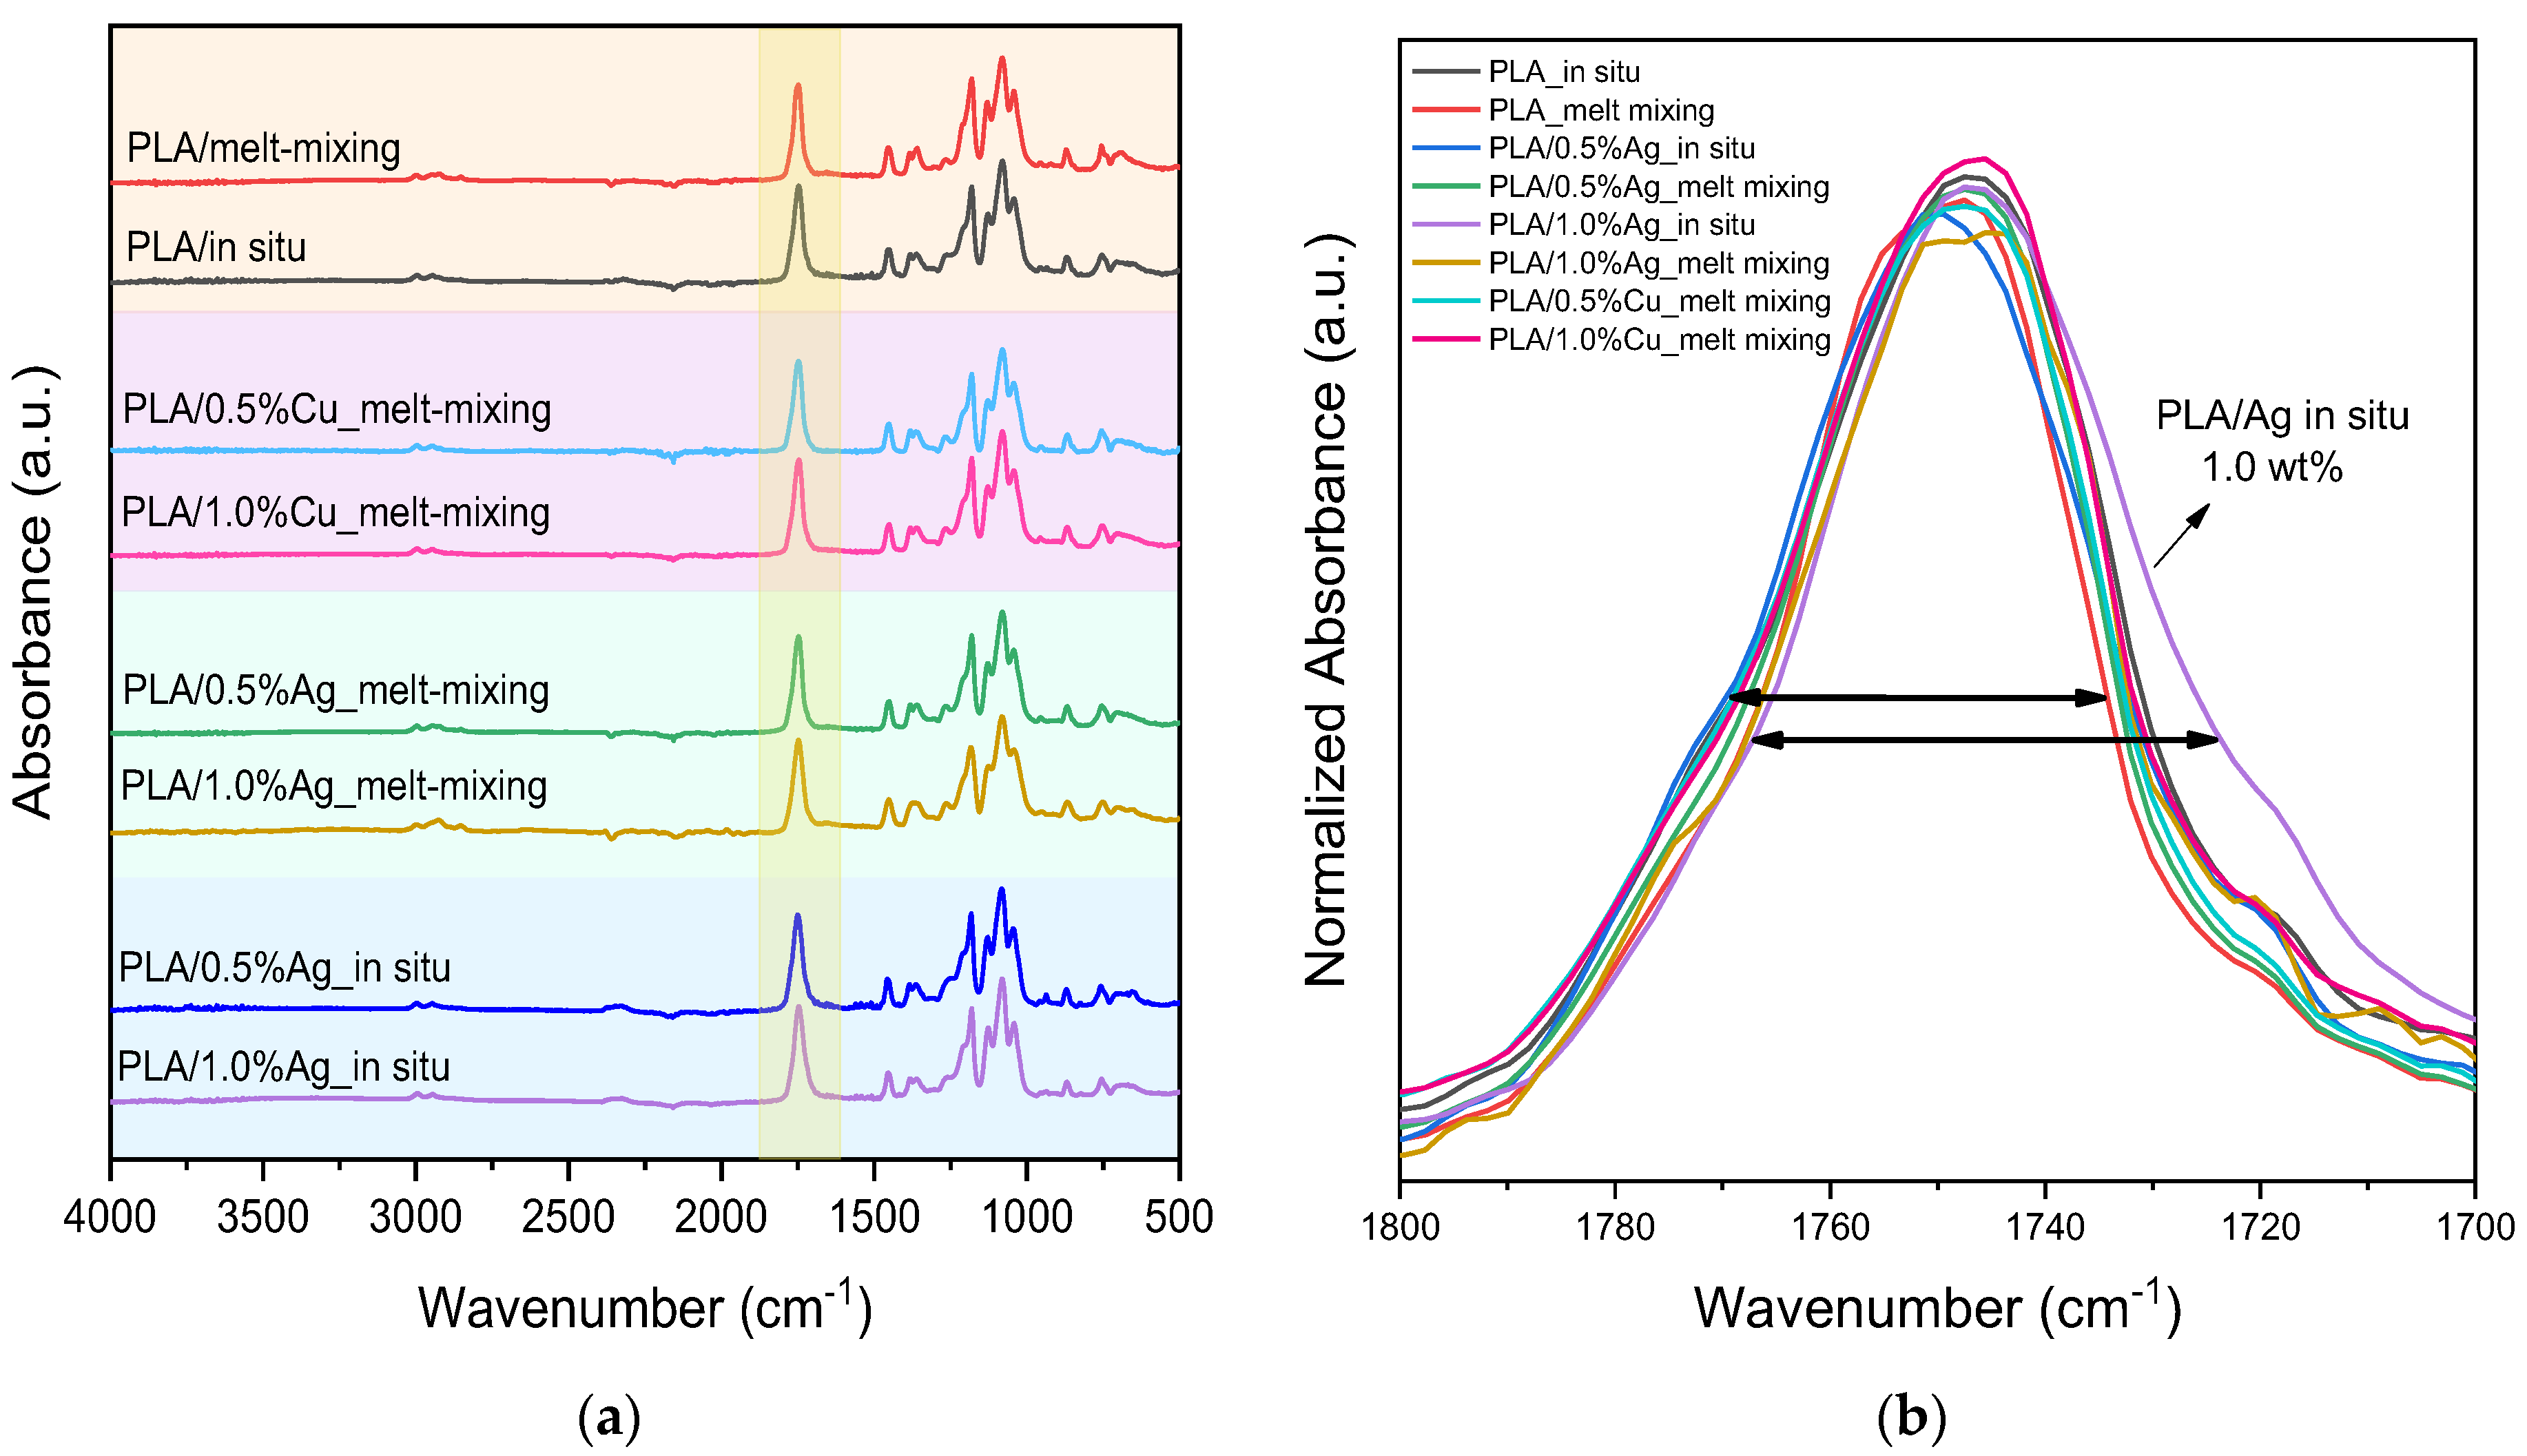
Figure 5a shows the ATR-FTIR spectra of the PLA neat and PLA-based nanocomposites. The main characteristic peaks of PLA are observed at 3000–2850 cm−1, corresponding to symmetric and asymmetric C–H stretching vibrations; at 1750 cm−1, attributed to carbonyl (C=O) stretching; and at 1500–1400 cm−1 and 1100–1000 cm−1, associated with C–H bending and C–O stretching vibrations, respectively. The spectra of the synthesized PLA via in situ ROP confirmed the successful polymerization [12,46,51]. For the case of nanocomposites, no additional peaks related to metallic copper and silver NPs were detected, indicating no chemical interactions between PLA and the NPs. Pure metals do not exhibit characteristic IR peaks, as metallic bonds do not present any specific vibrational modes as covalent bonds do [56,57].
Focusing on the carbonyl region around 1750 cm−1 (Figure 5b), the peak’s curve and intensity remained consistent, which means that the C=O bond’s electronic environment was not affected by the presence of the metals. However, only in the case of the sample PLA_1.0%Ag_in situ do we observe some interactions in the C=O area. This supports the presence of interfacial interactions between the Ag NPs and the PLA matrix, meaning that possible polymer–NP bonds could form during ROP.

3.2. Optical Properties

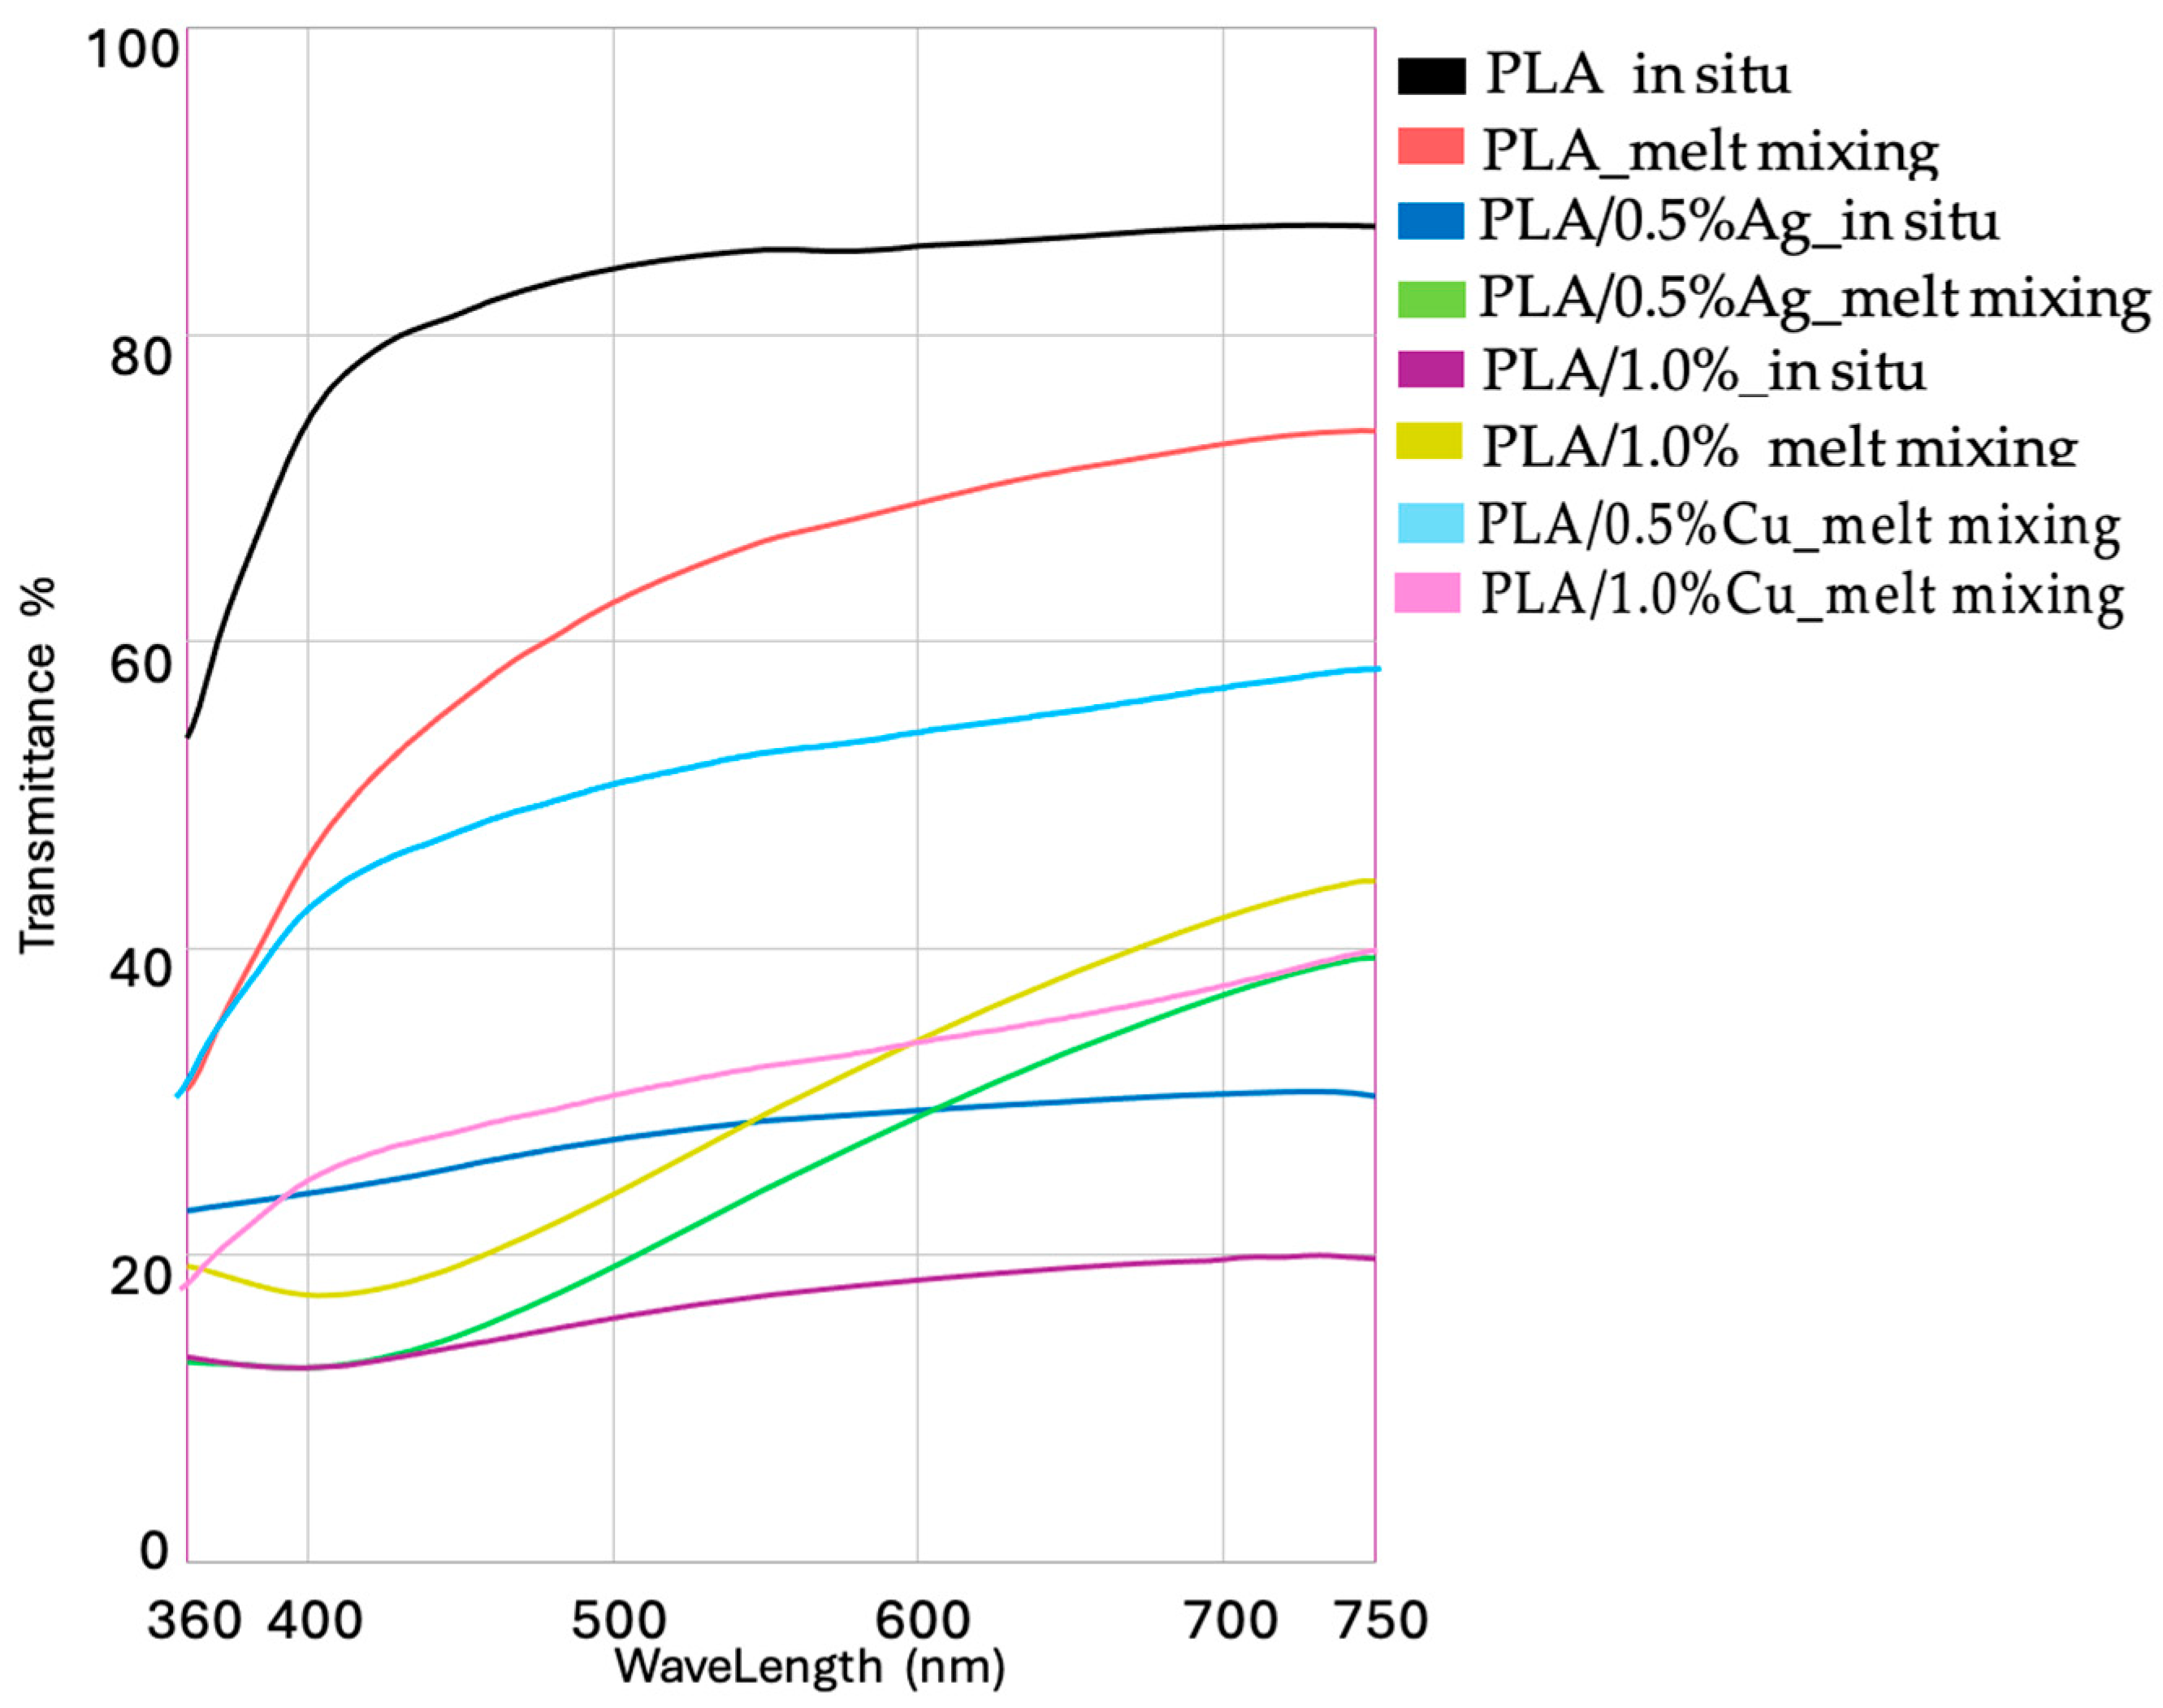
The optical properties of the samples were assessed and the color differences between the materials were expressed by L*a*b* parameters. The findings are presented in Figure 6, while Figure 7 and Figure 8 show the transmittance and color as recorded by the spectrophotometer.
PLA_in situ with L* values close to 94, a* and b* of −0.6 and 2.8, respectively, were considered as white color material (Figure 6). The PLA_melt mixing showed a drop in lightness (L* = 85 vs. 94), with a slight increase in both a* (from −0.6 to 0.07) and b* (from 2.8 to 9.00), compared to the PLA_in situ material. The PLA/1.0%Ag_melt mixing sample showed slightly higher lightness (L* = 61 vs. 56) but lower a* (4.70 vs. 5.20) and b* (16 vs. 18) values. This indicated that PLA/1.0%Ag_melt mixing appeared lighter and less saturated in red-yellow tones compared to PLA/0.5%Ag_melt mixing, which presented a deeper, more intense brownish hue. The PLA/0.5%Ag_in situ sample was significantly lighter (L* = 67.1) compared to PLA/1.0%Ag_in situ (L* = 48.5), indicating a brighter appearance. It also had higher a* (1.85 vs. 0.75) and b* (10.8 vs. 7.0) values. In contrast, PLA/1.0%Ag_in situ appeared darker and more neutral, with lower overall color intensity. Between the Cu-nanocomposites, PLA/0.5%Cu_melt mixing appeared lighter (L* = 77.8), whereas PLA/1.0%Cu_melt mixing was noticeably darker (L* = 63.6). Overall, the CIE color measurements indicated that the PLA-based nanocomposites prepared via the extruder (melt mixing) technique predominantly exhibited brownish hues. In contrast, the in situ samples were presented as neutral. This suggests that the preparation method significantly influenced the final visual appearance of the nanocomposites.
Figure 7 shows the transmittance of the materials, representing the fraction of incident light transmitted through the samples. The PLA in situ-based sample showed the highest transmittance, followed by a lower value for the PLA melt-mixed sample. The incorporation of Ag and Cu NPs further reduced the transmittance compared to neat PLA.

3.3. Thermal Properties, Crystallinine Behavior, and Isothermal Melt Crystallization

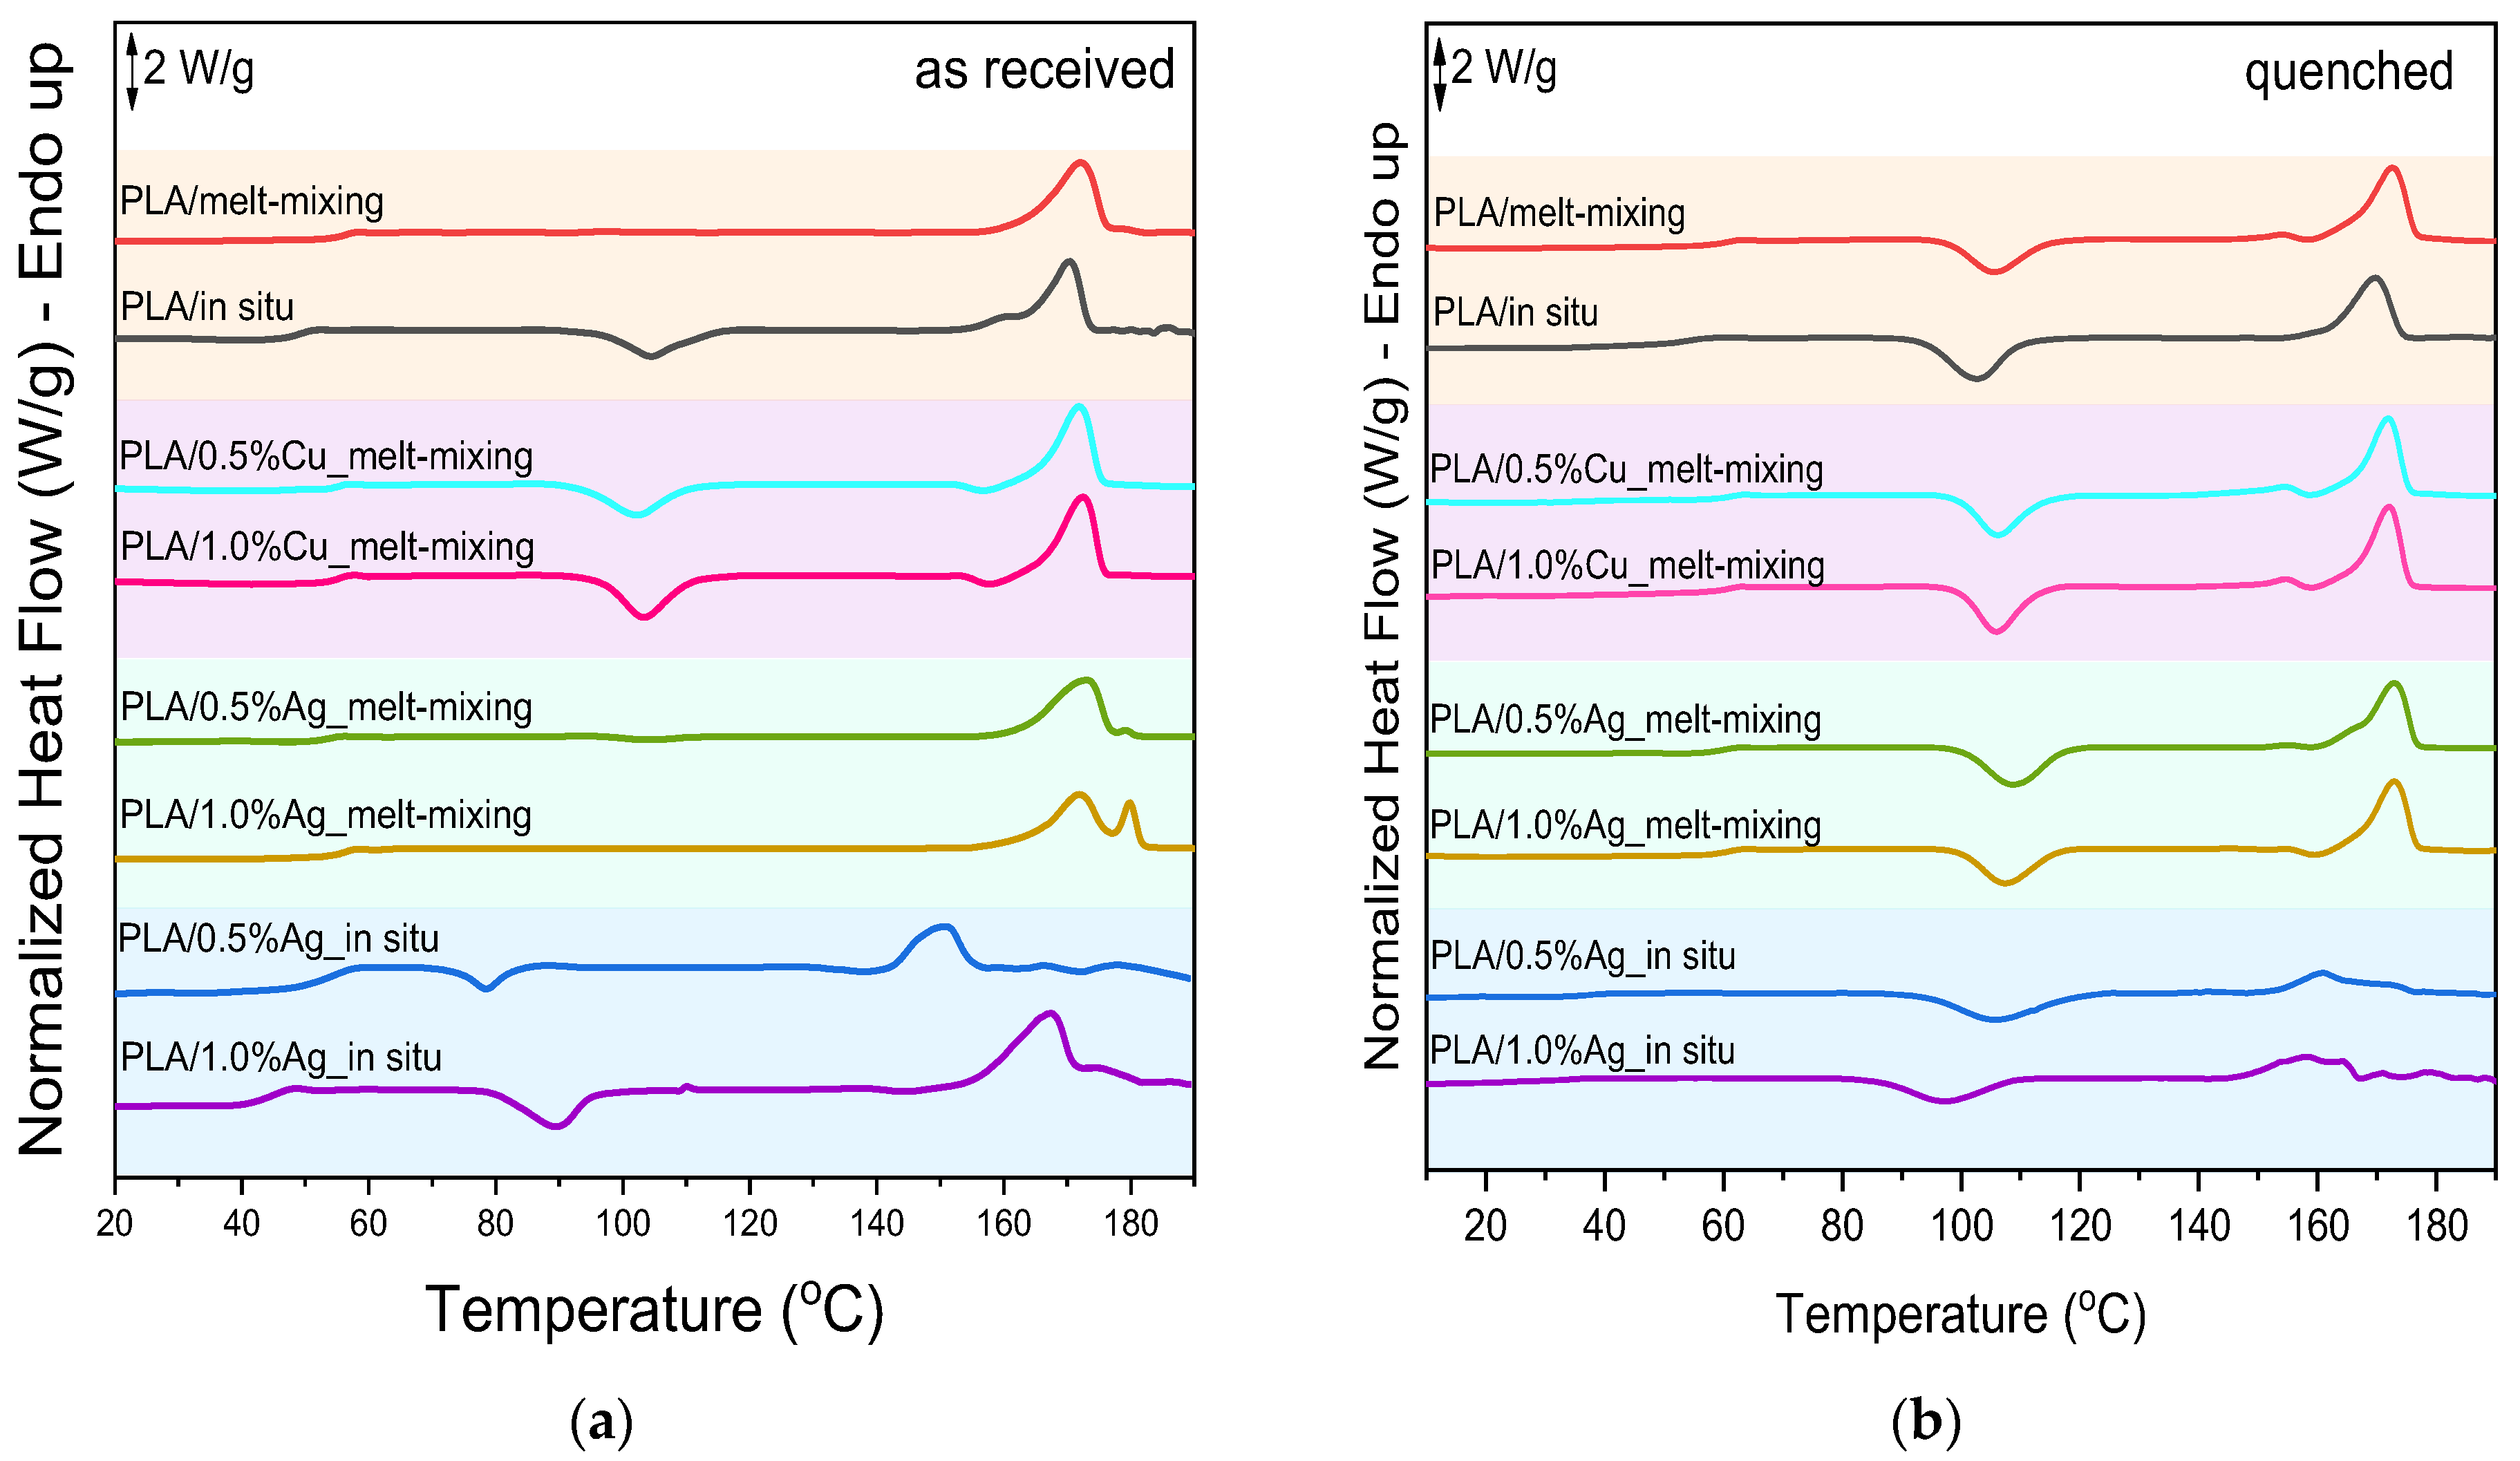
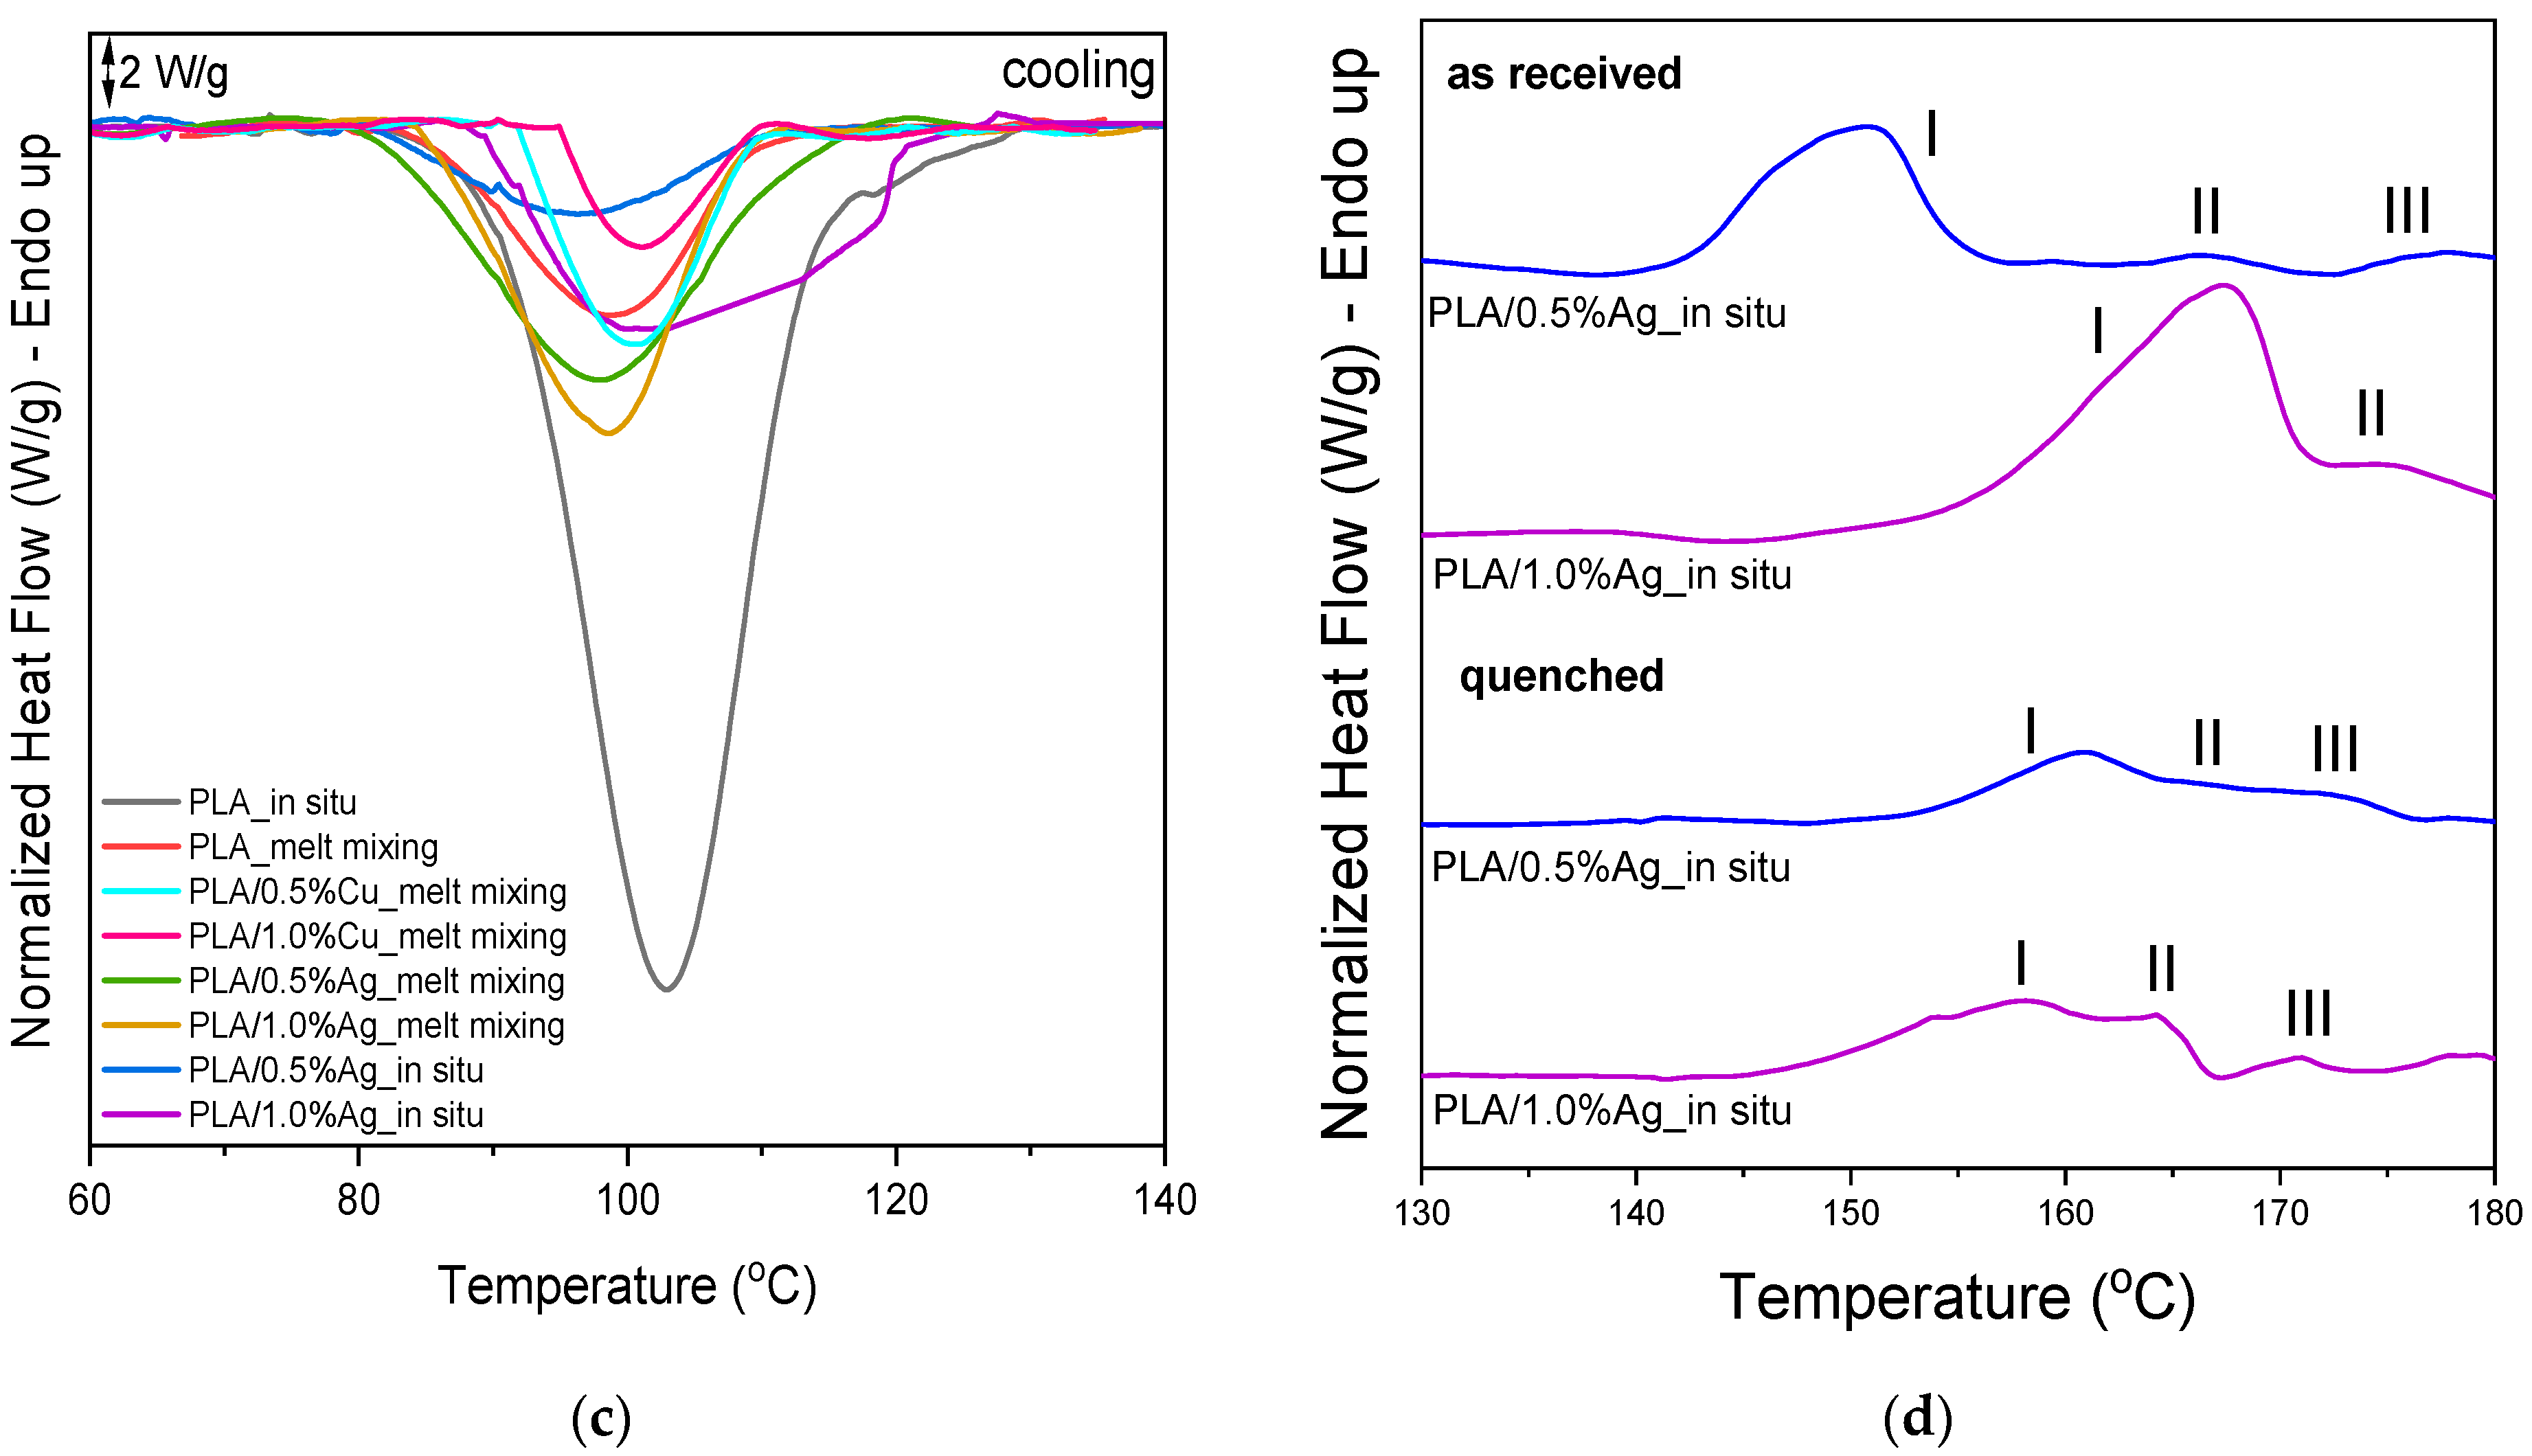
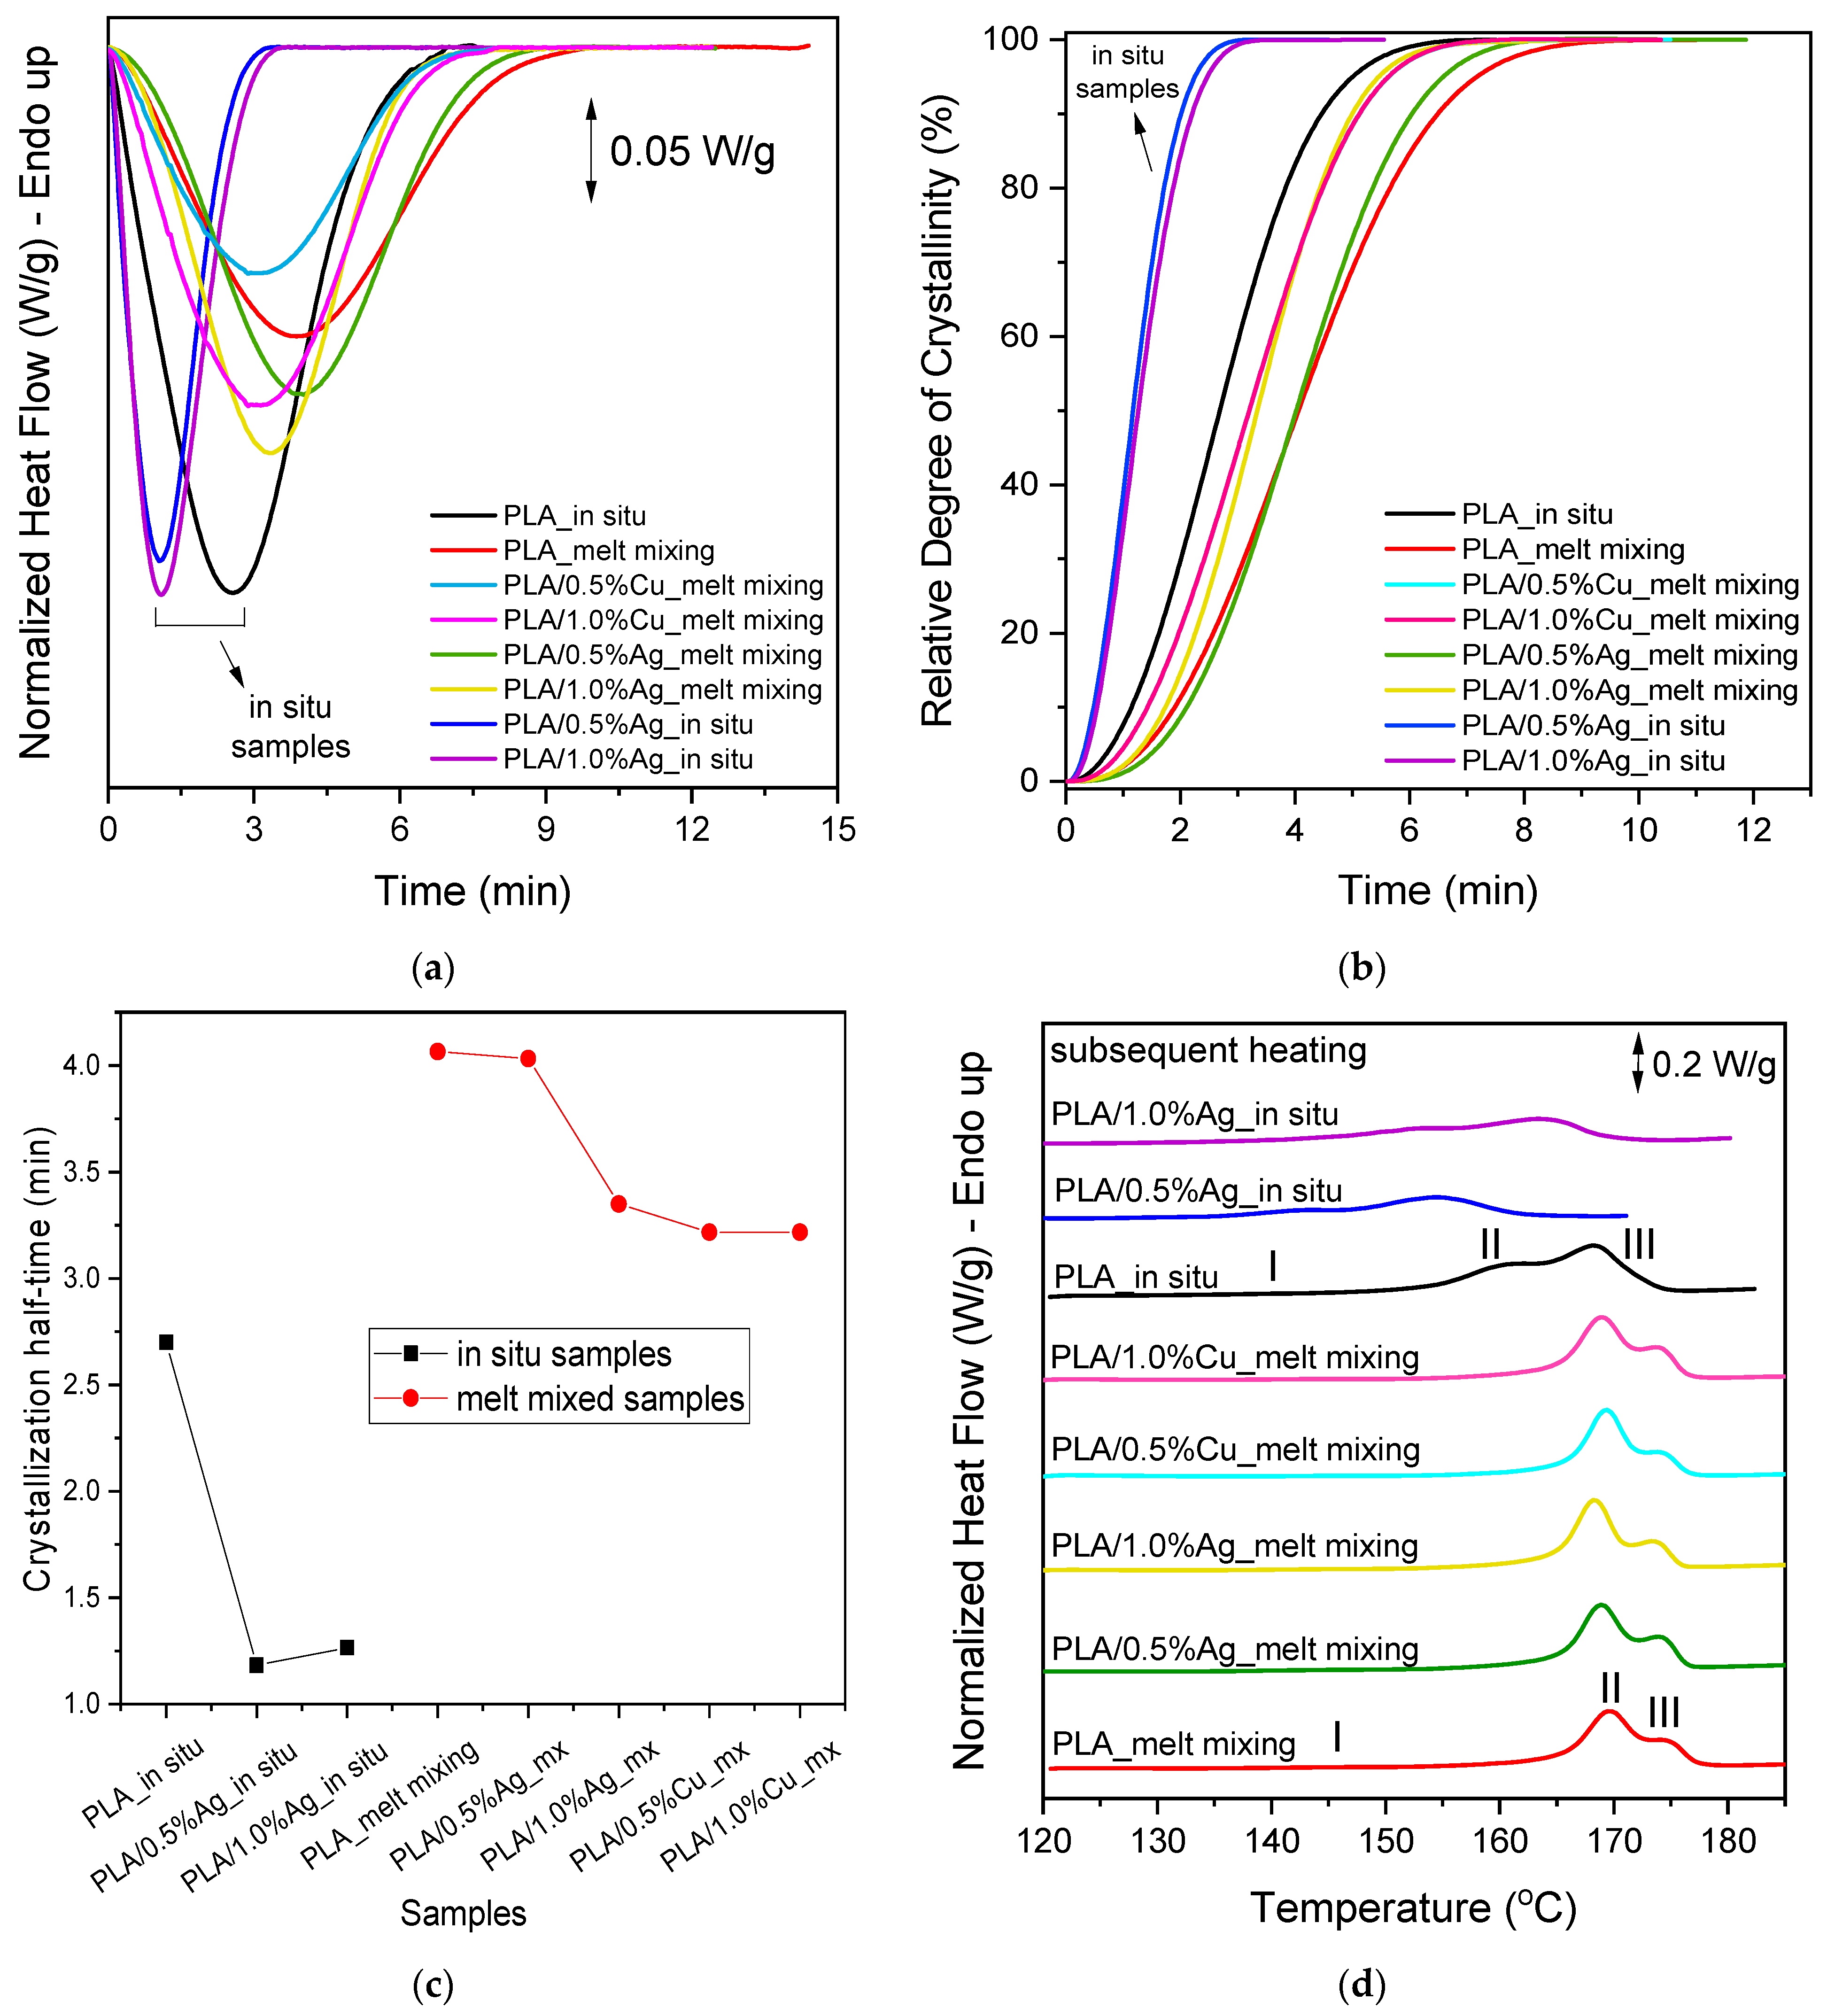
The DSC scans of the compression-molded samples are presented in the next figure for the first and second heating cycles, as well as traces during slow cooling, in order to illustrate the influence of NPs and the method of their incorporation. Firstly, during the first and second heating step (Figure 9a,b,d), additional melting peaks (Tm) were observed in the case of PLA/Ag nanocomposites prepared by melt mixing and ROP of L-lactide. The distinct and multiple peaks (Figure 9d) were related to the different crystal populations with different thermodynamic stability of the nanocomposites, caused by the presence of AgNPs, which acted as nucleation agents. Furthermore, the different endothermic peaks could be also associated with the coexistence of crystals with different degrees of imperfection. Specifically, the generated heterogeneous nucleation sites promoted spherulites with different lamellar thickness and, thus, multiple Tm due to local chain restrictions caused by the interfacial interactions between PLA chains and Ag NPs [58]. The in situ samples exhibited lower main Tm due to their lower M n ¯ compared with the PLA samples [59]. Similar multiple melting behavior was reported by Klonos and Klementina et al., where the authors attributed the appearance of distinct Tm peaks in PLA/Ag nanocomposites to different crystal populations and heterogeneous nucleation induced by AgNPs [60,61]. Popescu et al. observed a decrease in melting temperatures for PLA/Cu nanocomposites prepared with PEG–Cu clusters, attributed to catalytic degradation of PLA chains and altered nucleation behavior [57].
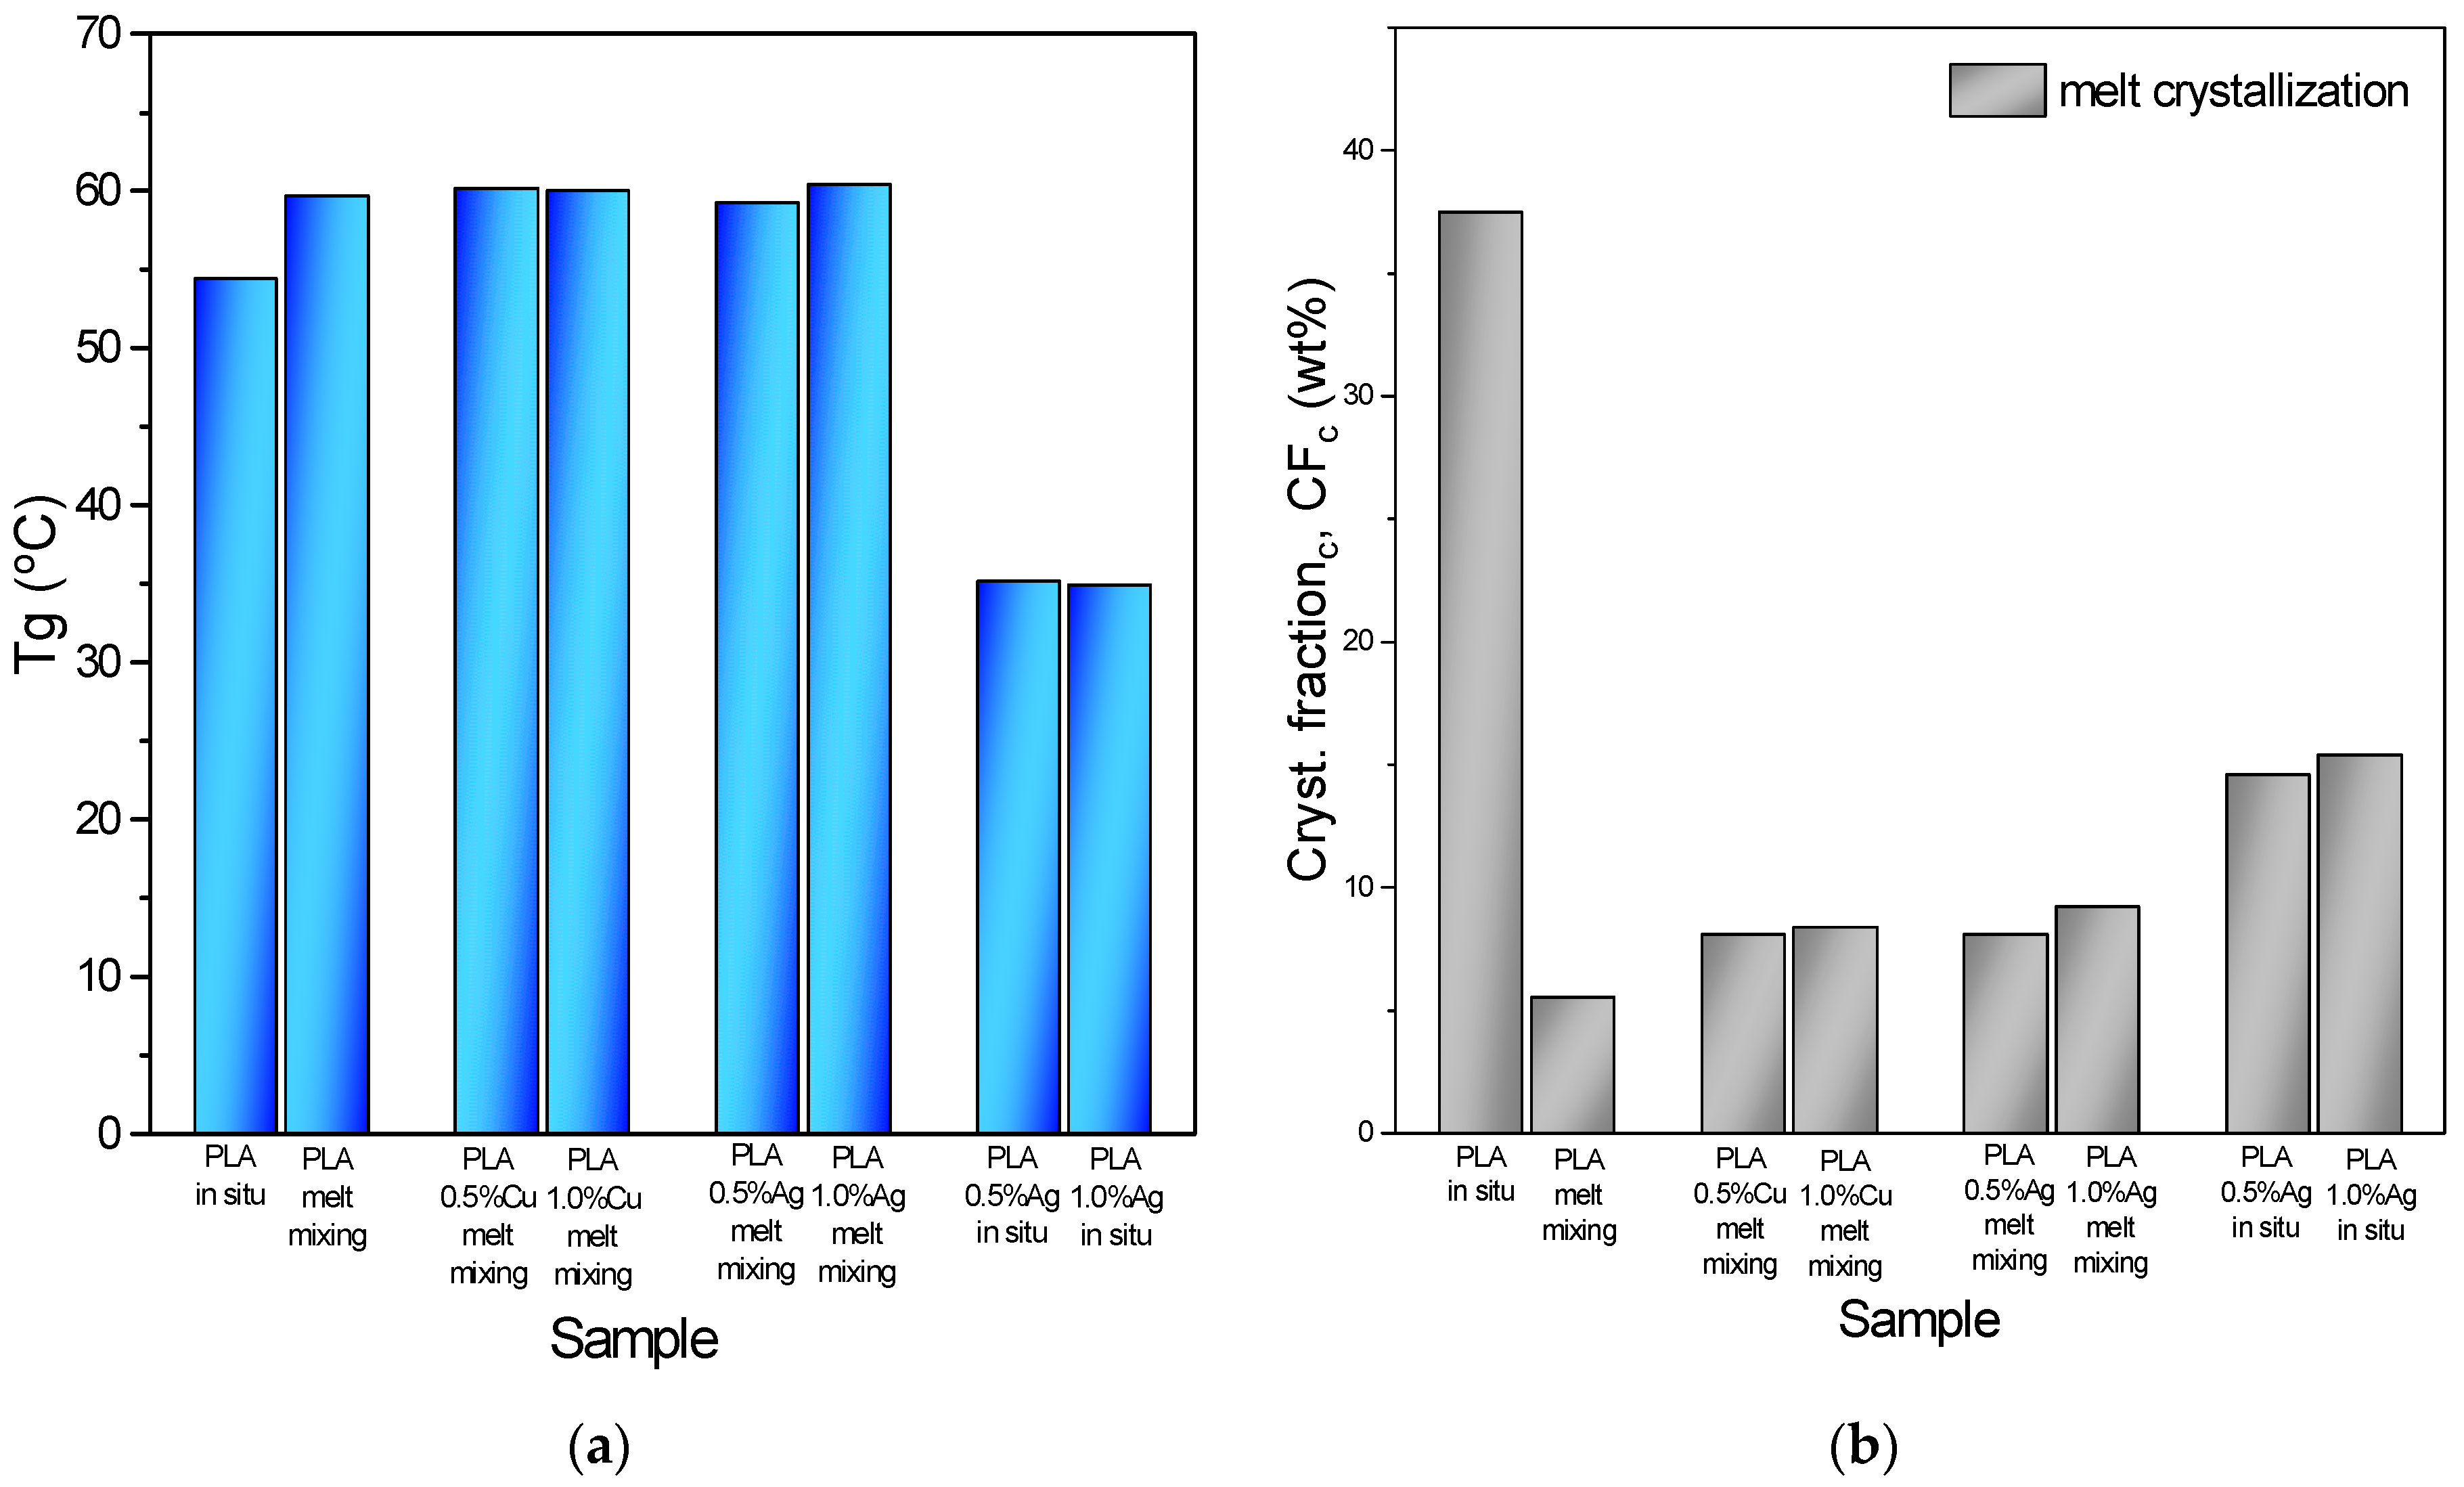
A significant decrease was observed in both glass transition temperature (Tg) (Figure 10a) and specific heat capacity (ΔCp) (Table 2) in the case of the nanocomposites prepared by the in situ method. The reduction in Tg clearly indicates that the molecular mobility of the polymer chains was significantly enhanced. For the melt-mixed nanocomposites (both Ag and Cu-based), no substantial decrease in Tg or ΔCp was detected. This finding was of particular importance, as the increased mobility of the in situ-based samples directly influenced the mechanical performance, ultimately leading to flexible nanocomposite substrates, which can further be correlated with the increase in free volume of PLA chains and the strong interfacial interactions. The in situ-based nanocomposites suggested a pronounced influence of the NP–PLA interface on the polymerization reaction. Specifically, during the ROP of L-lactide, Ag NPs acted as coordination sites for the growth of PLA chains, which led to transfer reactions or the early termination of the reaction. This possible mechanism was confirmed by the reduction in molecular weight (Figure 4b and Figure 5b), where the chain growth could possibly be interrupted by interactions with the surface of Ag NPs. The reduction in ΔCp observed in the present manuscript was in line with the findings of Klonos et al., who reported that the decrease in ΔCp in PLA/Ag systems originated from the formation of a rigid amorphous fraction associated with restricted polymer chain mobility near the NPs. The more pronounced decrease in Tg of the in situ-based samples was attributed to the enhanced chain mobility developed during the ROP process [51]. The latter could be further attributed to the overall reduction in the chain length of the samples (Figure 4b and Figure 5b), which led to the significant decrease in Tg. However, in most cases, Tg was not significantly affected for the melt-mixed samples [60,61].
During cooling (Figure 9c), the crystallization temperatures from the melt (Tc) exhibited an almost constant trend. Regarding CFc, PLA_in situ exhibited a significantly higher crystallinity (37.5%) compared to PLA_melt mixing (5.5%). The addition of Ag and Cu NPs through melt mixing slightly increased the crystallinity (Figure 10b). It was quite clear that the nanoparticles favored nucleation and the crystalline fraction, while Cu and Ag most probably acted as additional nucleating agents. On the other hand, in the in situ samples, the opposite effect was observed. The AgNPs appeared to play a different role, reducing the number of active crystallization nuclei despite being well dispersed in the polymer matrix. This could be attributed to the strong and numerous polymer–particle interactions that might have formed during the very early stages of the in situ ROP synthesis, which led to a loss of nucleation sites and promoting at the same time the growth chains of PLA [51]. However, the crystallinity values of the in situ samples remained higher than those of the melt-mixed ones. Mulla et al. summarized that the incorporation of inorganic NPs such as Ag, Cu, and ZnO into PLA can lead to variations in crystallinity due to heterogeneous nucleation and different crystal populations. In some cases, strong polymer–particle interactions, particularly in in situ-synthesized systems, can restrict chain mobility or change nucleation behavior (i.e., graphene-based nanocomposites) [22].
The thermal transitions of the materials after annealing at 110 °C for 1 h are shown in Figure 11a. After annealing, melt-mixed PLA showed a main Tm at approximately 178 °C in the case of the in situ-based PLA sample at 172 °C. The addition of Ag or Cu NPs via melt mixing led to a complex thermal behavior with two peaks at around 172 °C and 176–180 °C, indicating different crystalline morphologies. Moreover, the in situ Ag nanocomposites exhibited enhanced thermal stability (after annealing) by increasing their Tm at 3 and 5 °C for the samples of PLA/Ag 0.5 and 1.0 wt%, respectively.
The CFm of the annealed samples was significantly higher than that of the first heating (as-received) samples, confirming that the annealing process promoted crystal growth (Figure 11b). Samples prepared via melt mixing with the addition of NPs (both Ag and Cu-based) exhibited increased crystallinity compared to neat PLA, reinforcing the observation that NPs acted as nucleating agents, as also observed in the crystalline fraction of the melt-crystallized samples (CFc). In the annealed samples, the influence of CuNPs was slightly stronger than that of Ag. The addition of AgNPs in the in situ-based samples appeared to influence crystallization differently, reducing the number of active nucleation sites, a trend also reflected in the crystalline fraction of the melt-crystallized samples. This behavior was likely due to the formation of polymer–particle interactions from the earliest stages of the in situ ROP synthesis, which hindered the development of new crystallization nuclei [51].
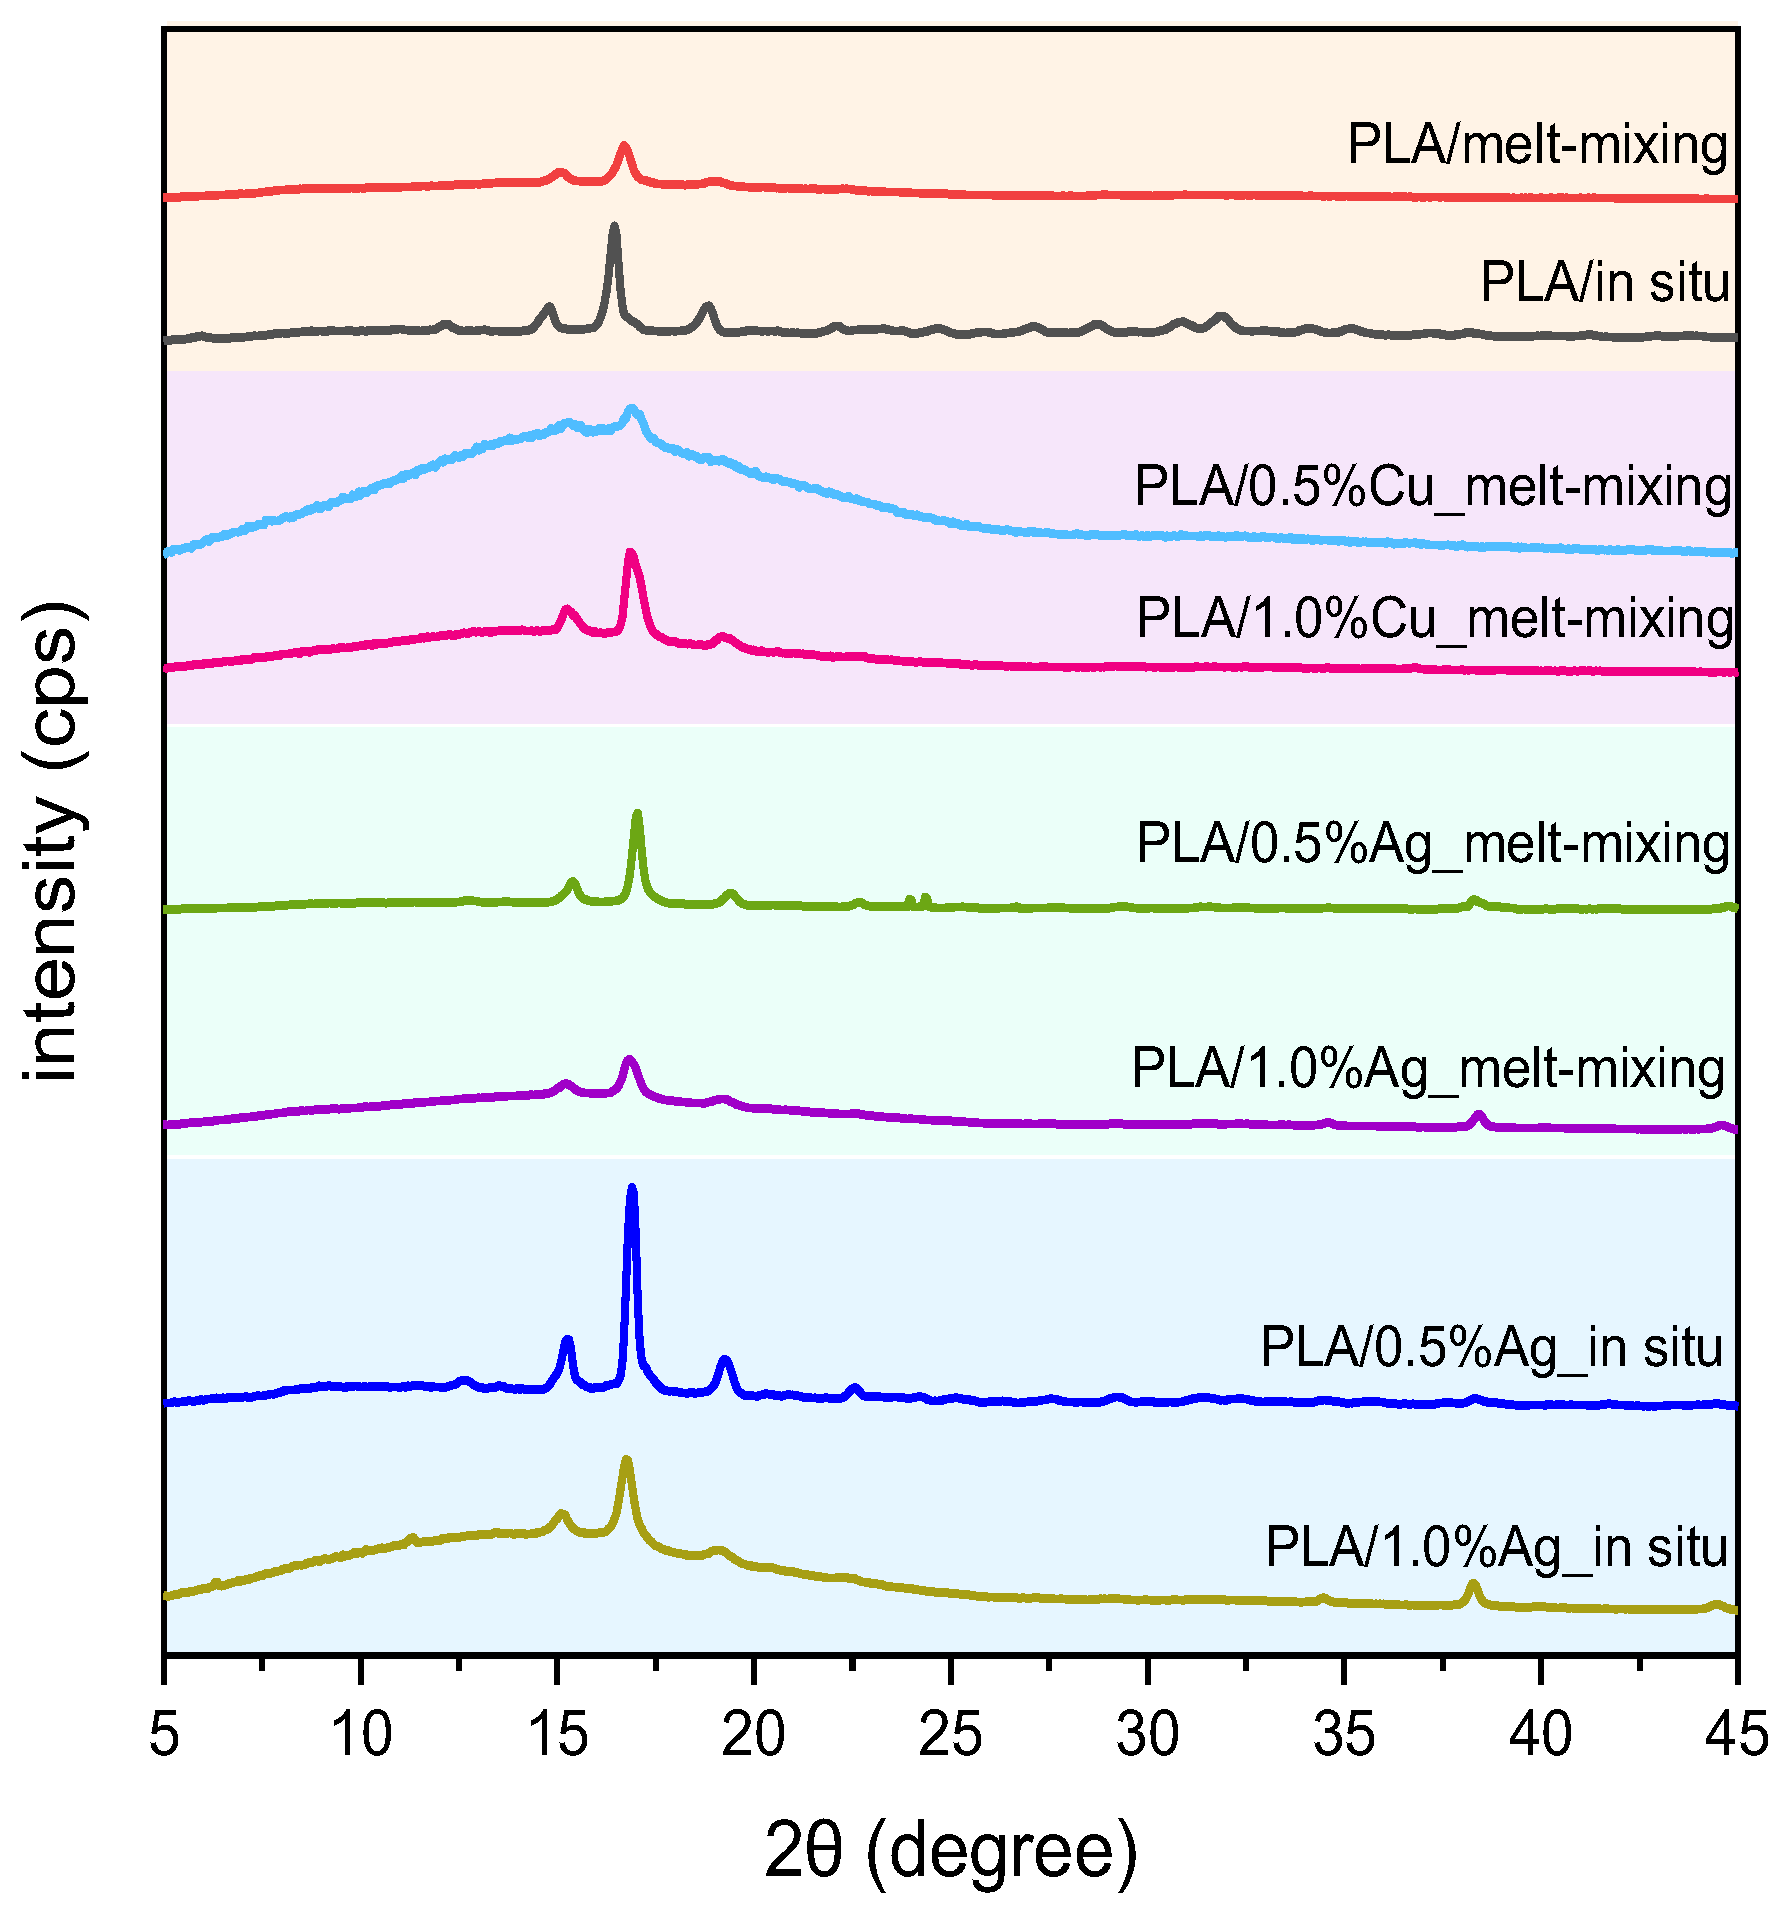
Figure 12 shows the XRD patterns of compression-molded PLA and the synthesized nanocomposite samples. PLA prepared by melt mixing exhibited three distinct diffraction peaks at approximately 15.05°, 16.7°, and 18.9° (2θ). In contrast, PLA synthesized via ROP exhibited diffraction peaks observed at around 14.8°, 16.45°, and 18.8° (2θ) with higher intensity. All nanocomposites exhibited the same PLA diffraction peaks without any changes on the diffraction peaks, indicating that silver/copper incorporation did not alter the PLA crystalline structure nor led to the development of additional crystalline phases. In this case, the results slightly differed from the DSC data provided during melt crystallization, because thermal analysis in that case was more sensitive and accurate. Only in the case of the in situ-based samples did a new diffraction peak appear at around 38°, attributed to the presence of AgNPs [62], confirming similar results reported in the literature [36].
In the case of PLA nanocomposites, crystallization is fundamental for connecting microstructure properties with the overall performance of the materials. Isothermal crystallization studies provide insight into how factors such as nanoparticle type and interfacial interactions govern crystal development and, consequently, the mechanical and thermal behavior of the materials. These properties are critical for optimizing formulations and aligning structural features with application requirements [63,64,65,66].
Preliminary isothermal melt crystallization studies of PLA samples and PLA nanocomposites were examined via DSC. Crystallization exothermic peaks are presented in Figure 13a. The relative degree of crystallinity (X(t)) was calculated based on the equation below to estimate the crystallization rate of the materials. X(t), as a function of crystallization time, was obtained (Figure 13b) based on the fact that the evolution of crystallinity was linearly proportional to the evolution of heat released during crystallization.
X ( t ) = 0 t ( d H c / d t ) d t 0 ( d H c / d t ) d t
where dHc denotes the enthalpy of crystallization of the slightest fraction of time interval dt. The limits t and ∞ on the integrals indicate the elapsed time during the process of crystallization and at the end of the crystallization, respectively. X(t) indicates the necessary time required to reach 50% of the overall crystallinity during the isothermal melt crystallization process. Then, the τ1/2 data were calculated (Figure 13c) in order to estimate the crystallization rate of the materials. The experiments were carried out and evaluated under a constant crystallization driving force (ΔΤ) to ensure comparability. ΔΤ defines as the difference between the melting peak temperature of the samples and the isothermal crystallization temperature at which the experiments were performed (ΔΤ = Tm − Tc) [67]. The subsequent heating traces were also recorded (Figure 13d).
Figure 13c shows that the crystallization kinetics of the materials prepared by in situ and melt mixing were significantly different. The commercial PLA sample presented the lowest crystallization rate compared to the other samples, as was expected due to its high molecular weight [59]. The incorporation of NPs into the PLA matrix via solution casting followed by melt mixing resulted in decreased crystallization half-times by the time the NPs acted as nucleation agents. Moreover, the Cu-filled samples presented higher crystallization rates than the silver-based materials, revealing the importance of investigating crystallization kinetics, which can differ from the results obtained by examining the thermodynamic properties of the materials through typical measurements via DSC (Table 2). For instance, the PLA/Ag melt-mixed samples exhibited more complex Tm than the PLA/Cu melt-mixed samples (Figure 11a). One of the most determinant factors directly affecting the crystallization kinetics of the polymers is their molecular weight; thus, the in situ-based samples exhibited improved crystallization rates. Furthermore, the addition of AgNPs via the in situ synthesis significantly affected the kinetic behavior of the samples, revealing their nucleation ability and also the fact that the in situ polymerization method used in the present work directly affected the crystallization kinetics of the materials [68,69]. Due to the high sensitivity of the isothermal crystallization experiments and the numerous factors that may directly affect the results, comparison with previous studies is rather difficult. For instance, amorphous materials tend to have significantly high crystallization half-times (i.e., low crystallization rates) [61]. Moreover, depending on the crystallization temperature at which the experiments occurred, the trend of the crystallization rates followed the opposite trend (i.e., high crystallization rates) [70]. Moreover, the subsequent heating traces (Figure 13d) showed that all samples exhibited multiple Tm [71].

3.4. Mechanical Evaluation via Tensile and Three-Point Bending Tests

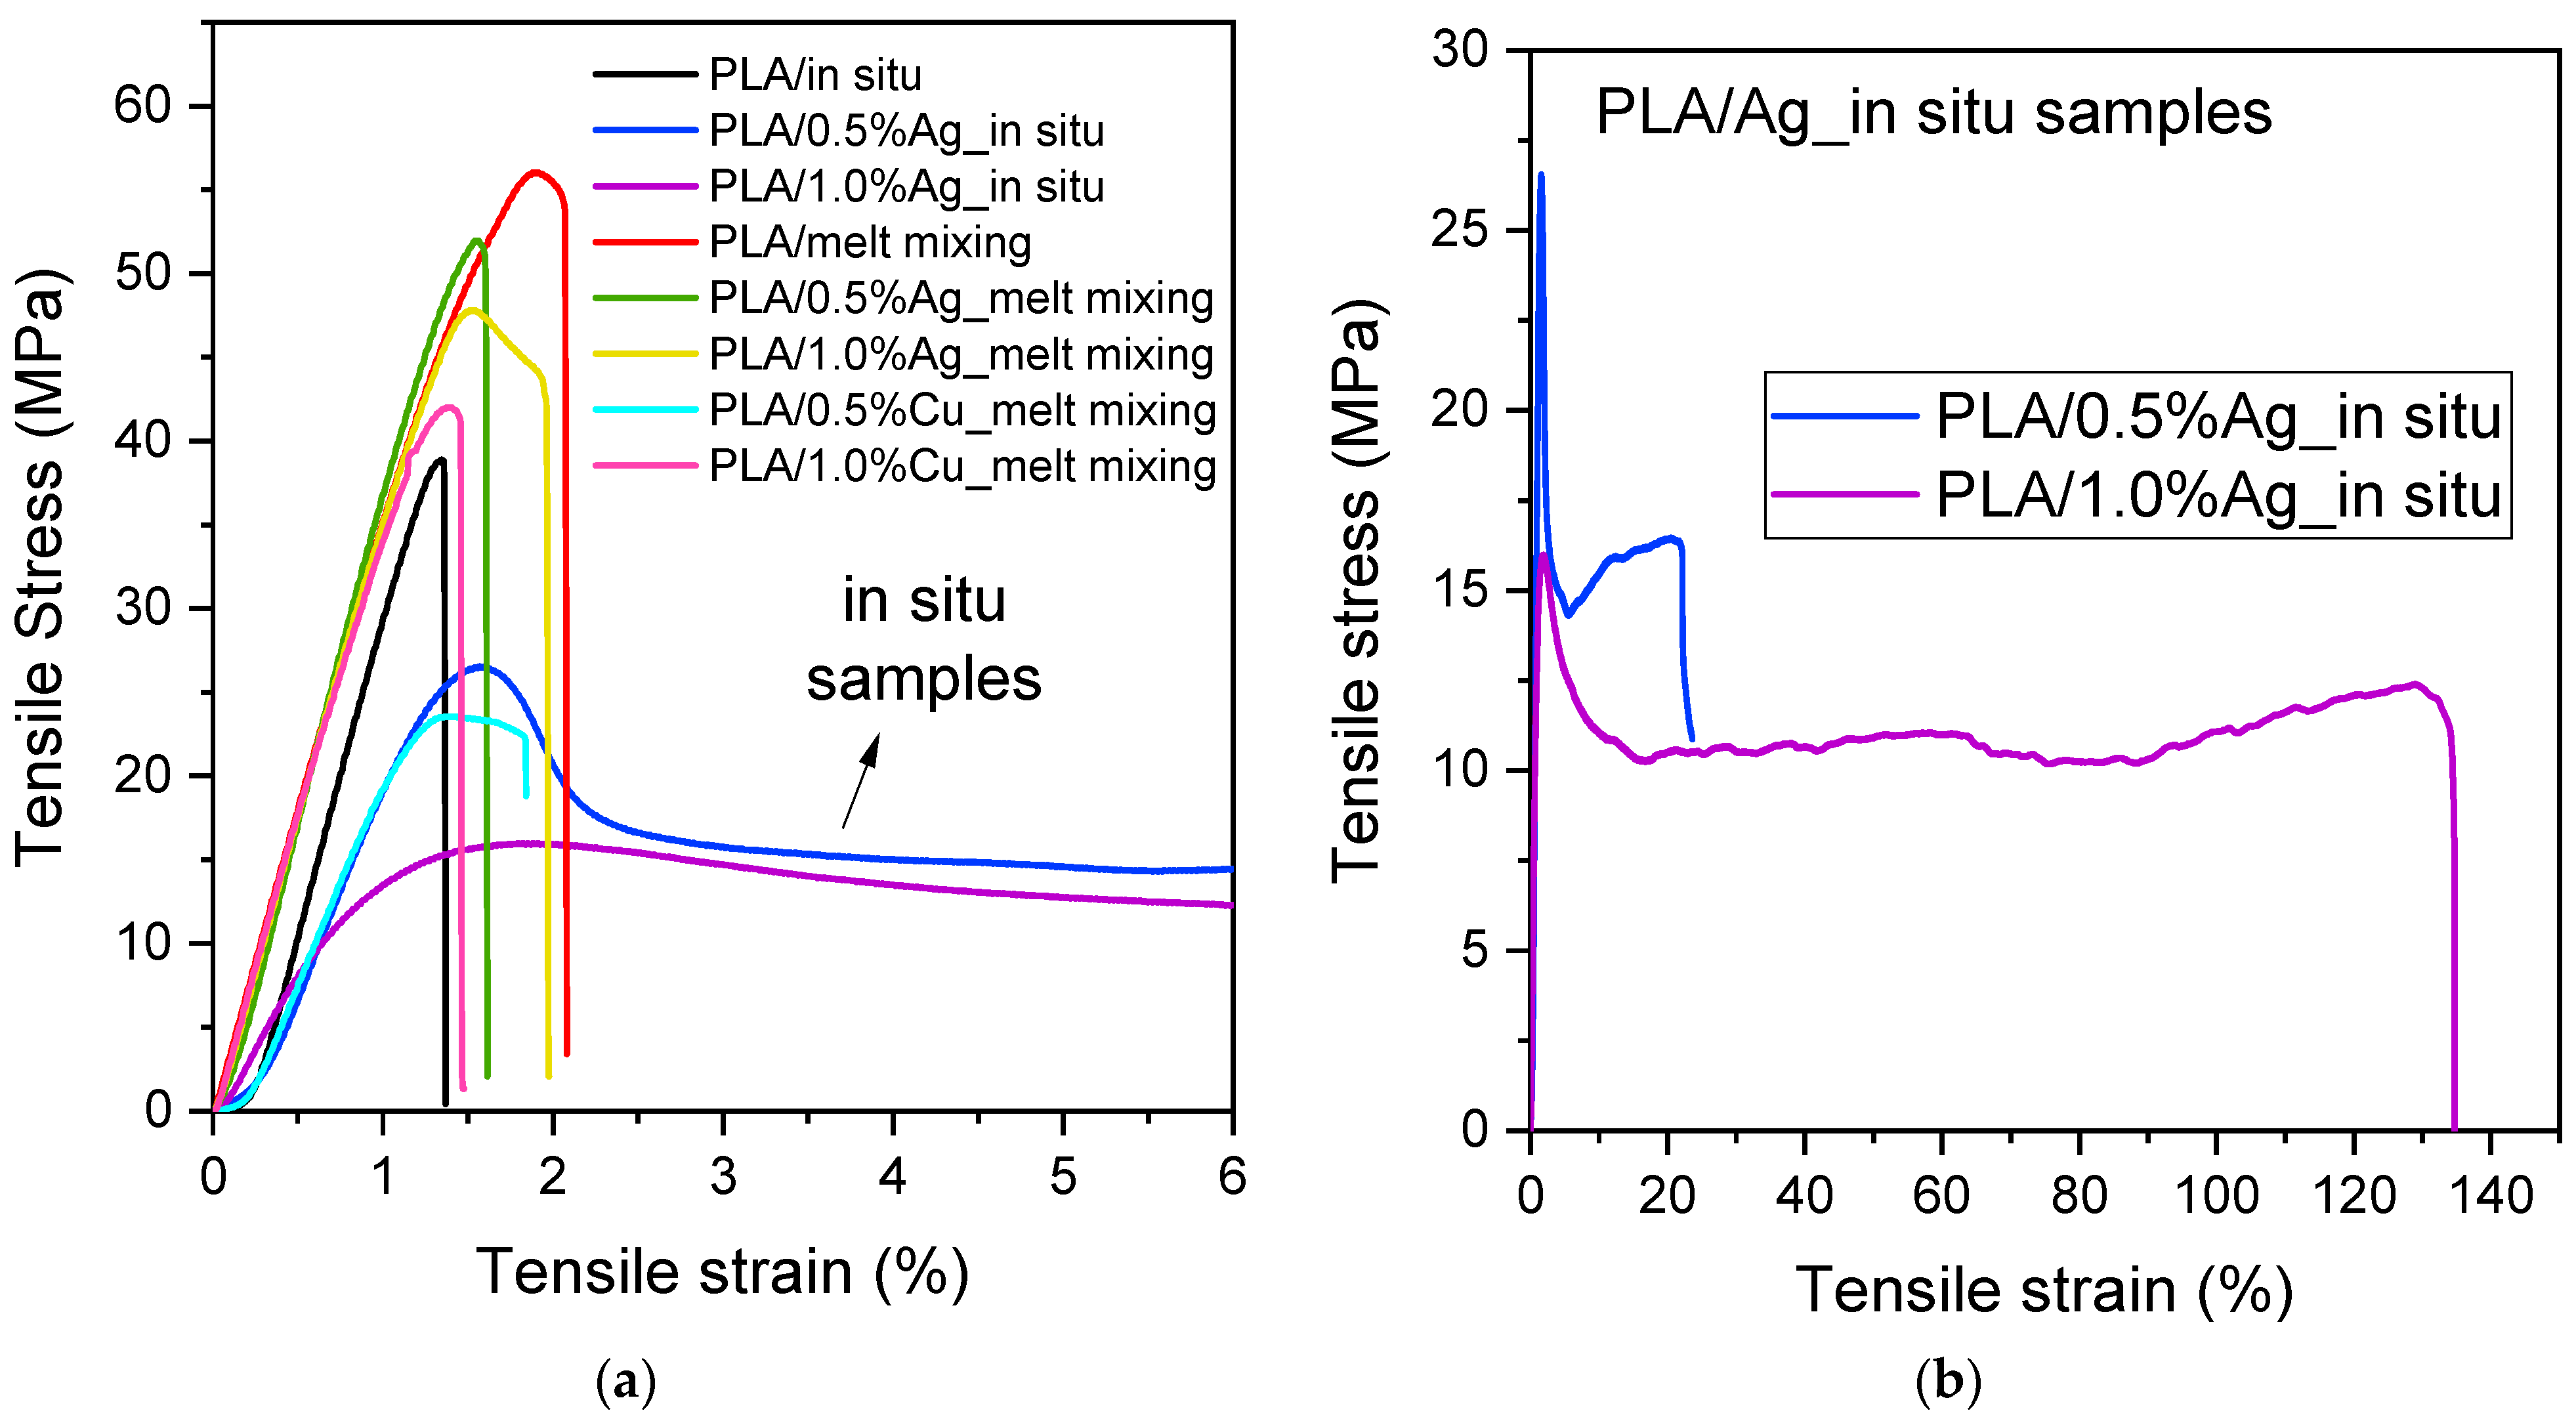
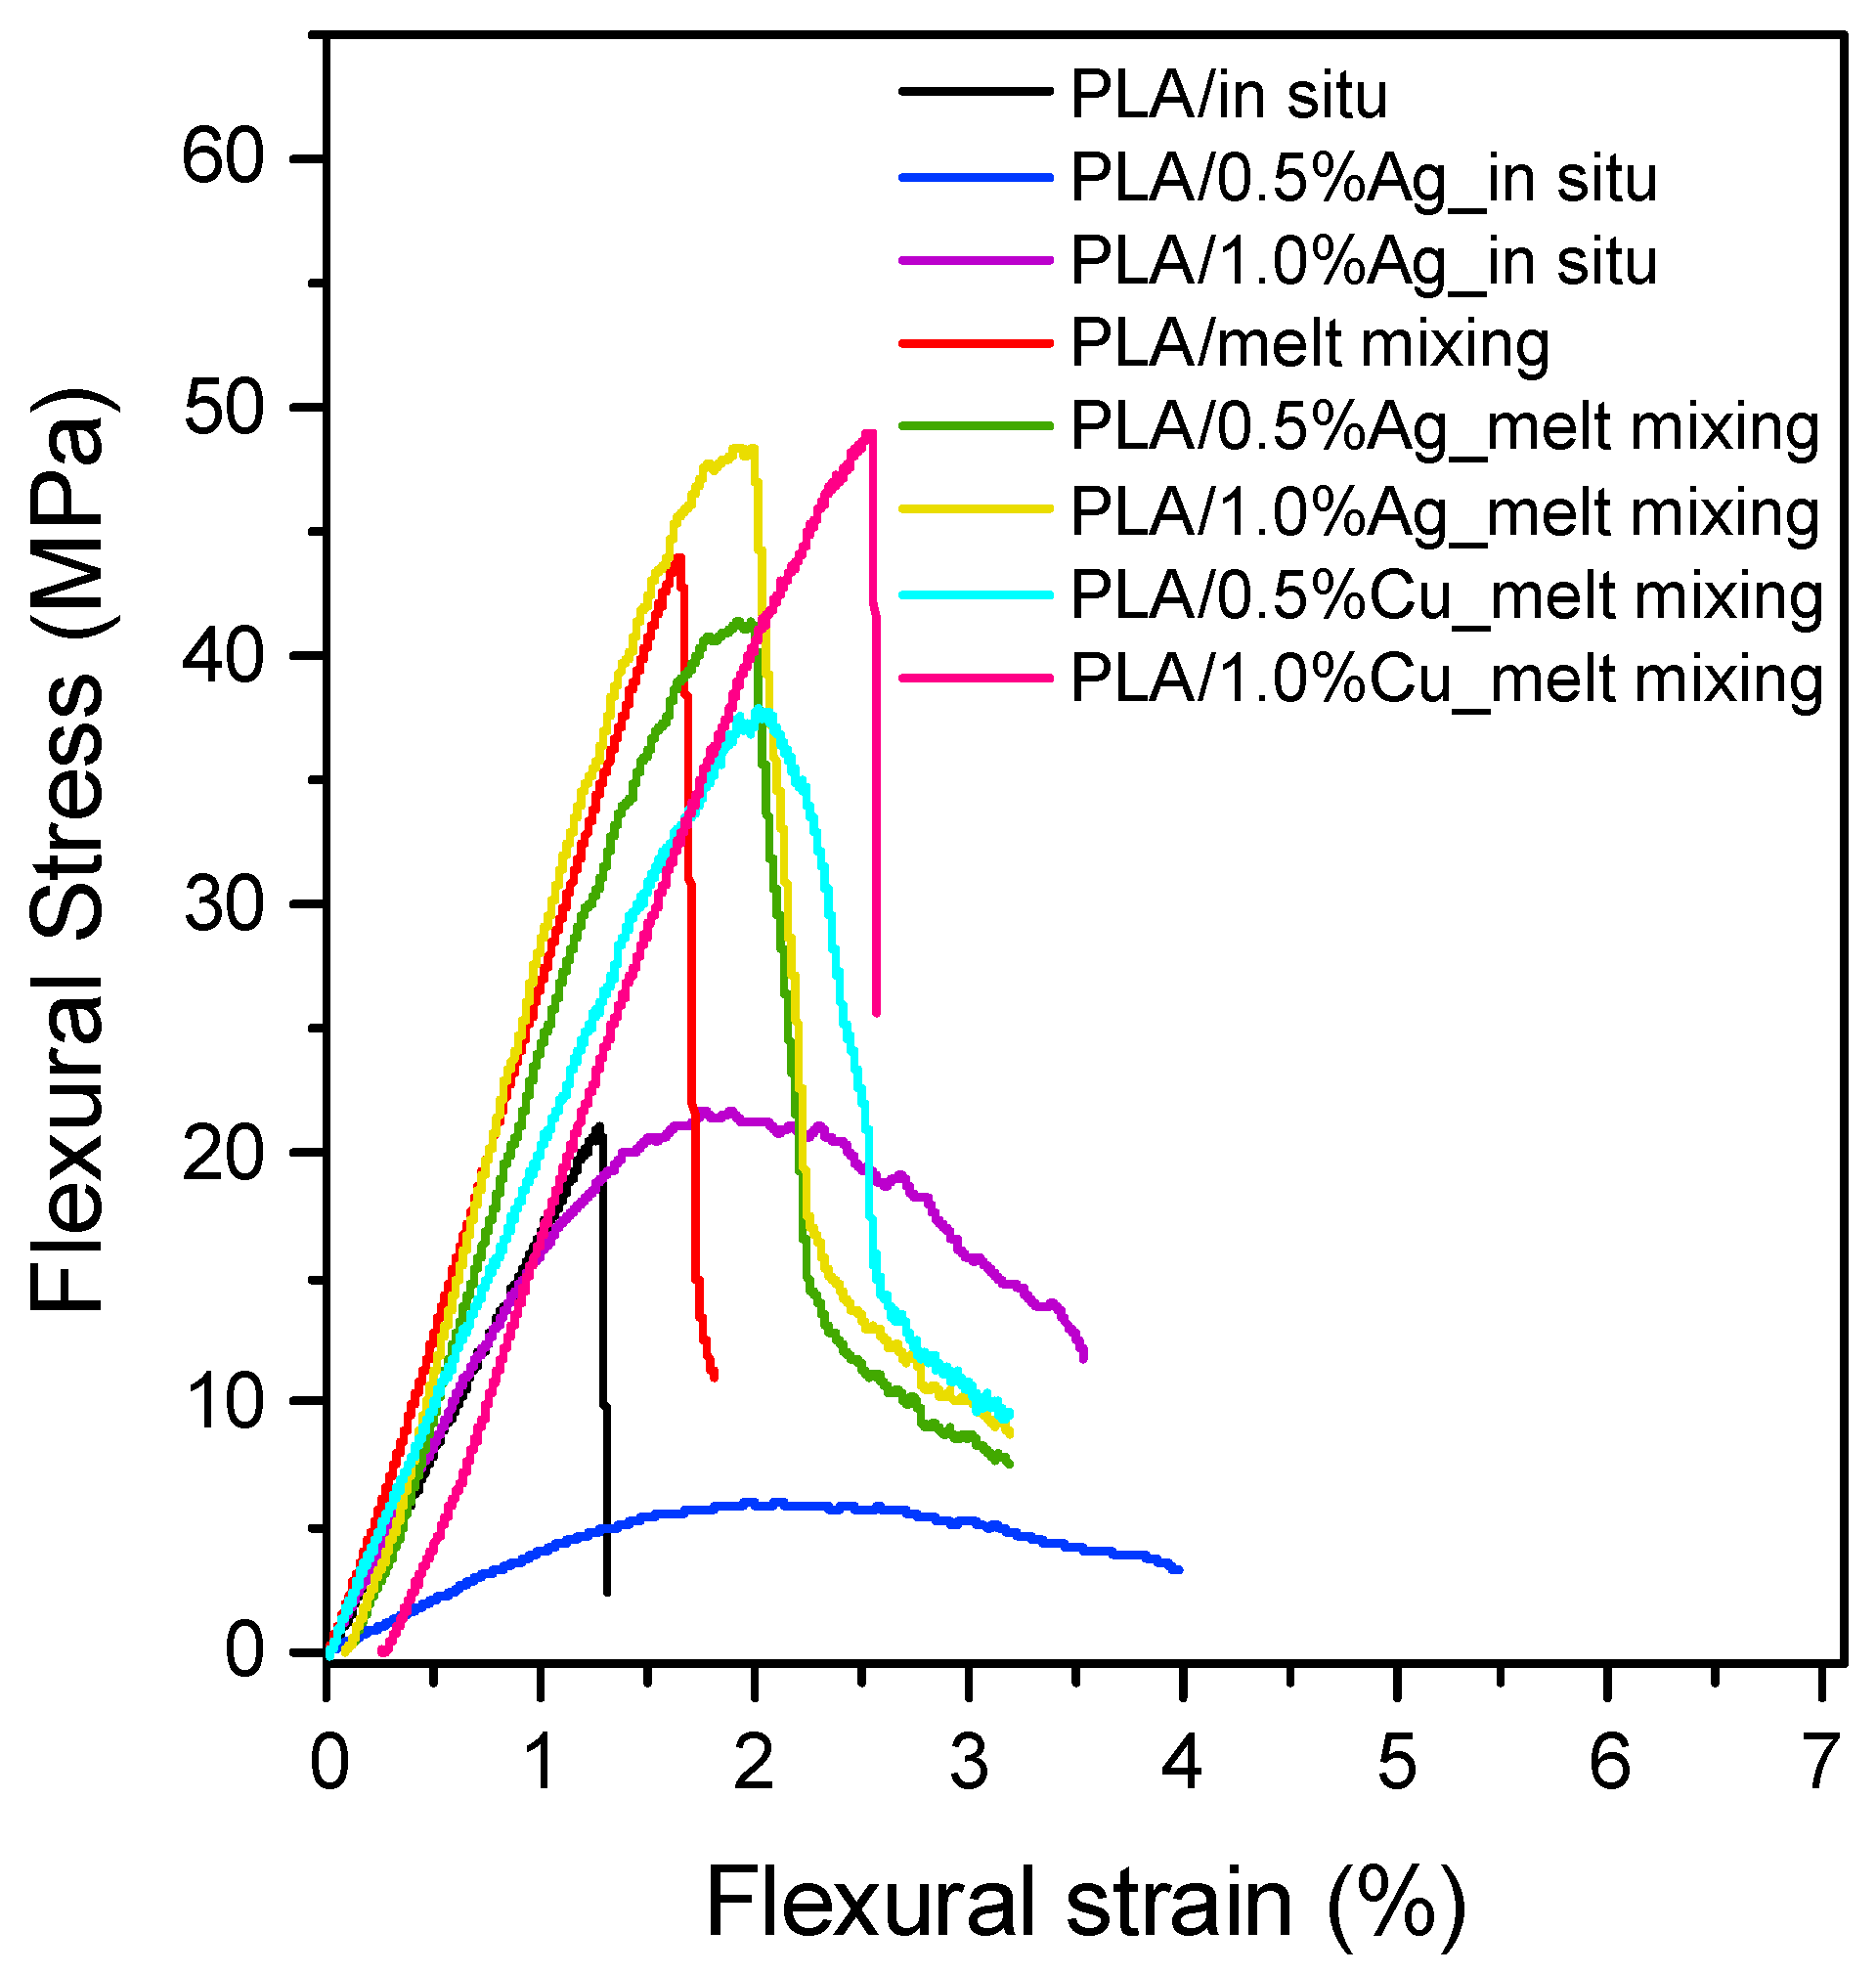
The mechanical performance of the PLA-based nanocomposites was thoroughly investigated through stress–strain and three-point bending measurements (Figure 14, Table 3).
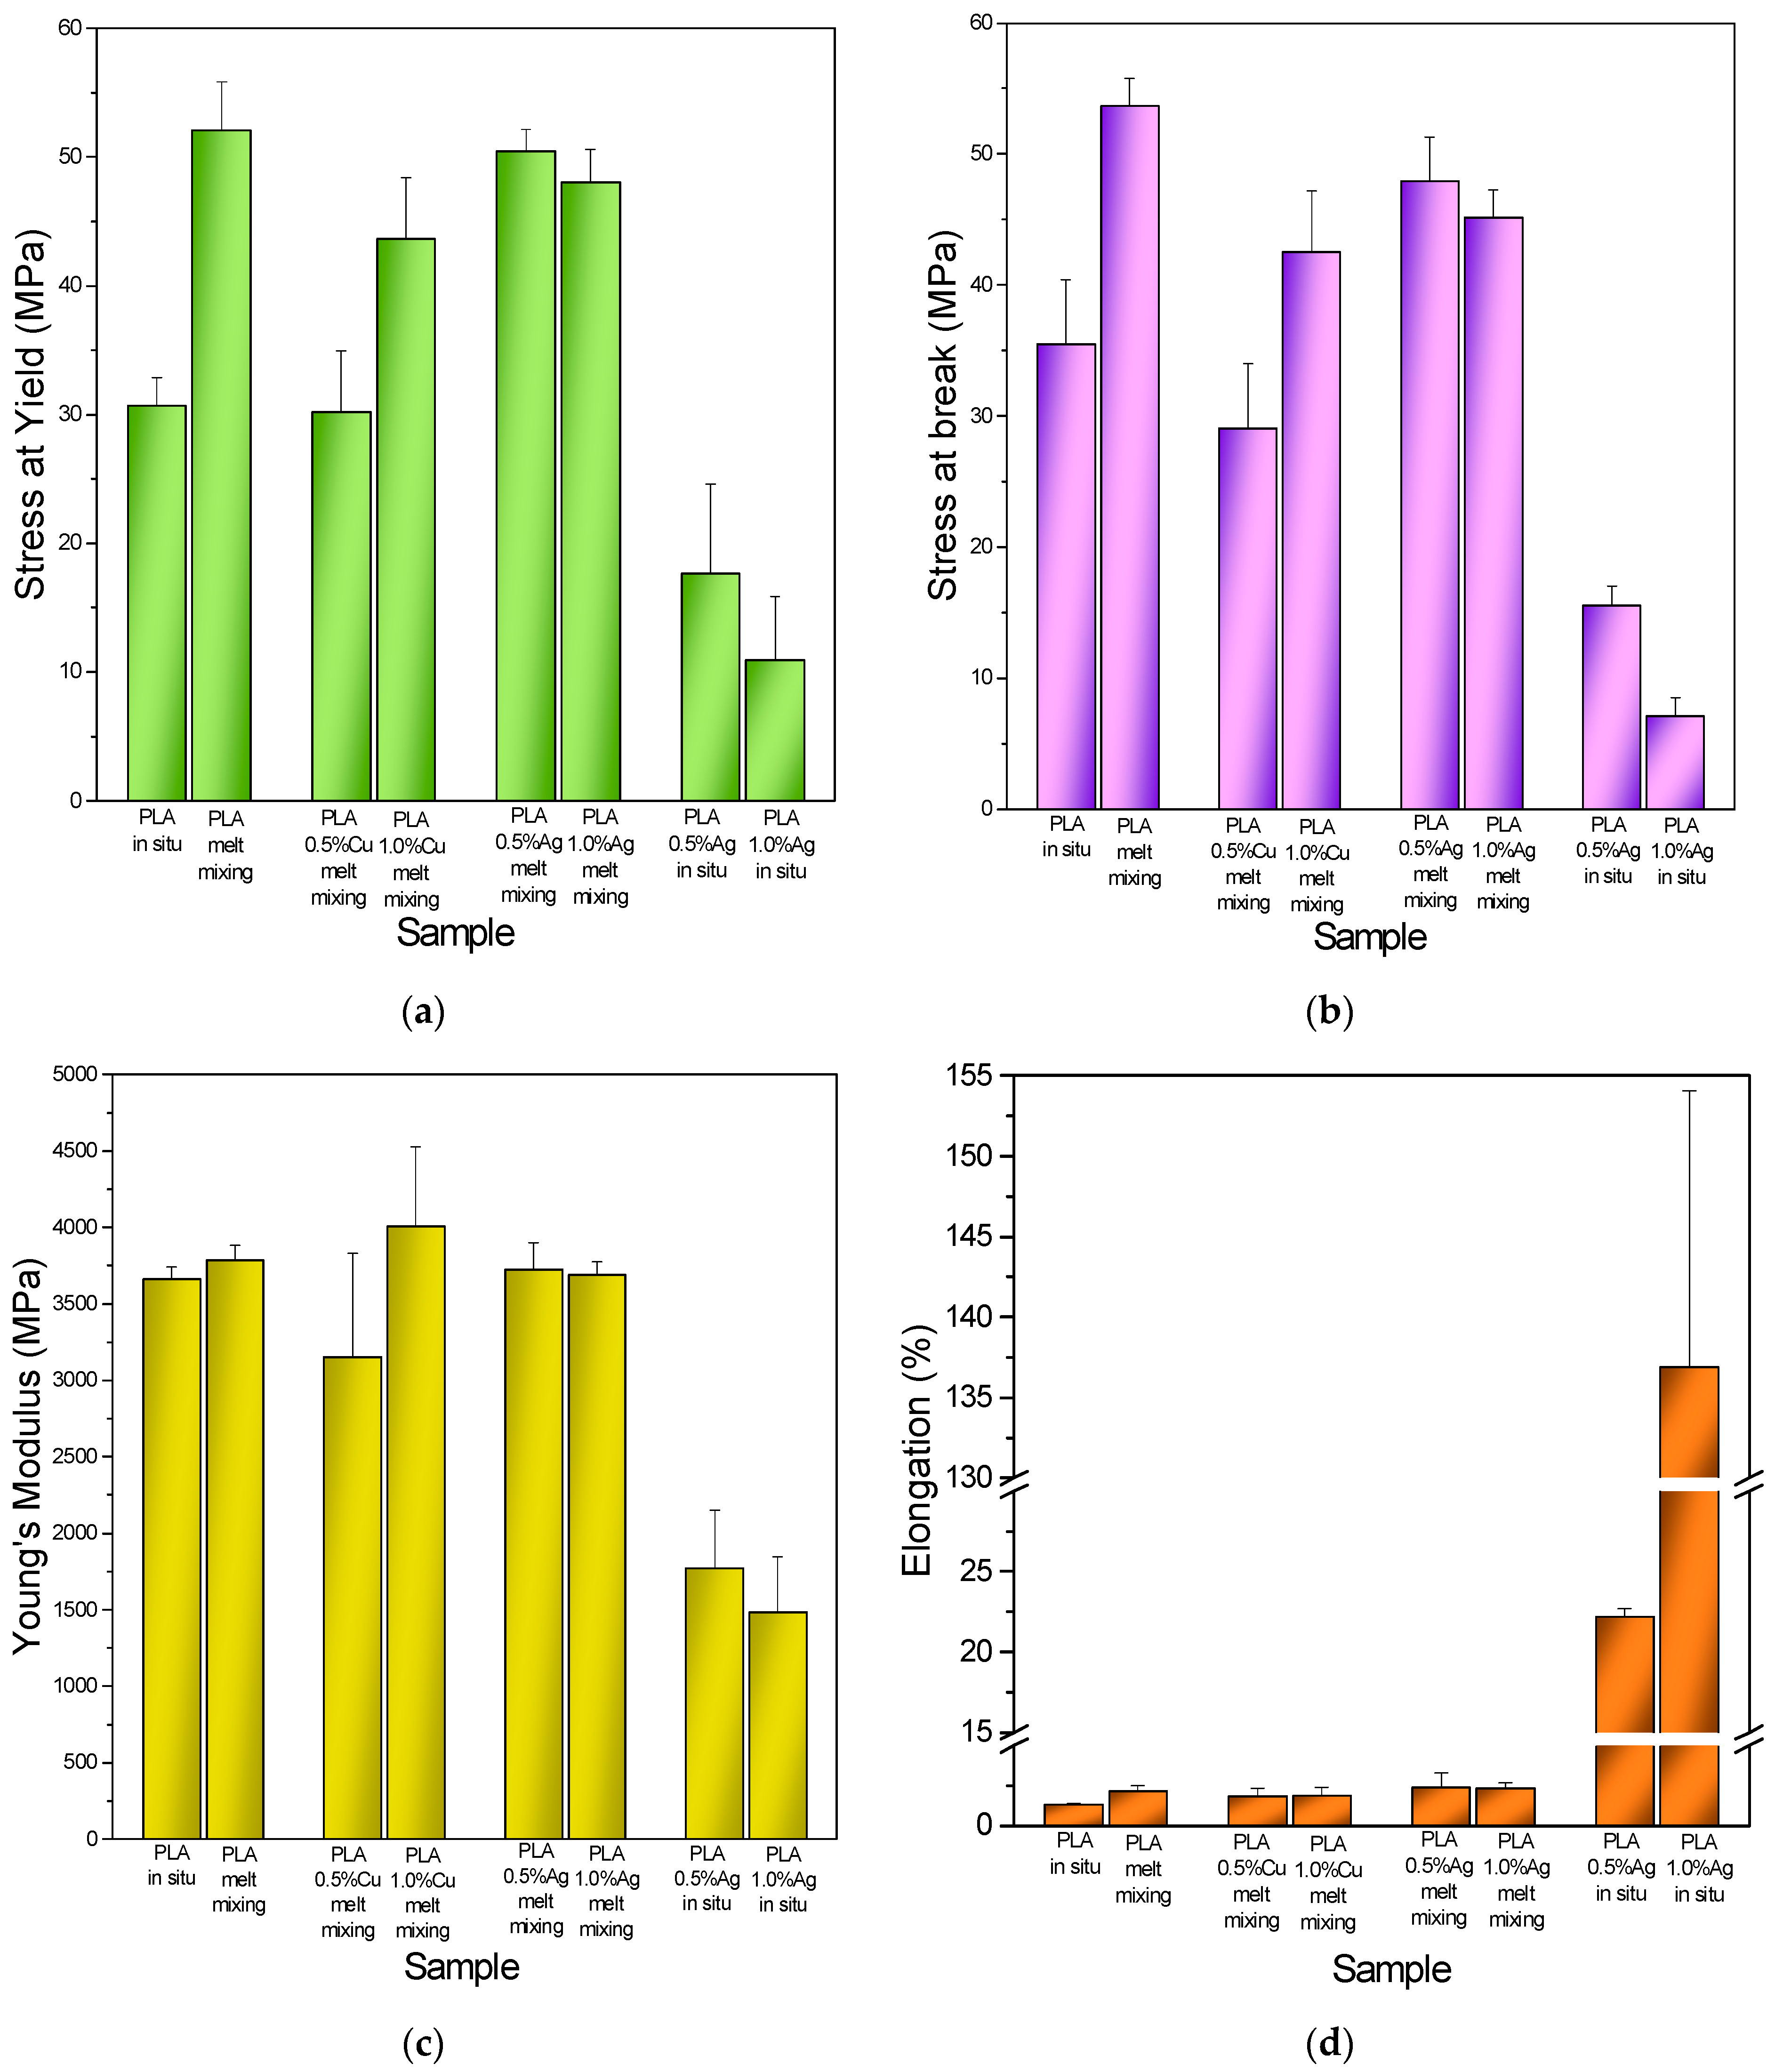
The PLA melt-mixed sample exhibited better mechanical performance compared to the sample synthesized via the in situ method. Specifically, the PLA_melt mixing sample demonstrated a yield stress of 52 MPa (Figure 15a), a break stress of 54 MPa, and a Young’s modulus of ~3790 MPa. In contrast, the in situ PLA-based material showed slightly lower values, with a yield stress of 30 MPa, break stress of 35 MPa, and a Young’s modulus of ~3660 MPa. Regarding the PLA/Ag nanocomposites, the addition of AgNPs at 0.5 wt% and 1.0 wt% via melt mixing did not alter the mechanical response of the PLA matrix. Both yield and break stresses remained at high values (e.g., yield stress: ~50 MPa and ~48 MPa; break stress: ~48 MPa and ~45 MPa, respectively), and the Young’s modulus (Figure 15c) was within the same range (~3720 MPa and ~3690 MPa) as that of neat PLA. This can be explained by the fact that the addition of silver and copper NPs via melt mixing did not significantly change the crystallinity of the samples, which directly affects the mechanical performance of the materials (Figure 10b) [72,73,74,75]. Similar behavior was also reported by Bautista and Nabgui et al., where the incorporation of AgNPs through melt mixing did not significantly affect the Young’s modulus of PLA-based composites [43,76]. A similar trend was observed in PLA/Cu nanocomposites, where only the 0.5 wt% Cu samples exhibited significantly lower mechanical performance compared to the 1.0 wt% Cu sample. These results were in agreement with the findings of Bruna et al., who reported that melt-mixed PLA/Cu nanocomposites maintained similar stiffness to neat PLA [38].
In contrast, the in situ samples of PLA/Ag nanocomposites resulted in remarkable differences in the mechanical properties among the samples prepared by melt mixing. Tensile strength (Figure 15b) reduced with increasing silver content. For instance, PLA/0.5%Ag_in situ showed a yield stress of 17 MPa and a break stress of 15 MPa, while for the PLA/1.0%Ag_in situ sample, these values dropped even further to 10 MPa and 7 MPa, respectively. Correspondingly, the Young’s modulus decreased to ~1770 MPa and ~1480 MPa. The drastic change in the mechanical performance of the materials occurred due to the reduction in Tg compared to the neat PLA in situ-based sample. This indicated increased molecular mobility in the amorphous regions, leading to a softer and less rigid material.
However, in the case of elongation at break for the in situ samples (Figure 14b), a surprising and noteworthy trend was observed. While both neat PLA and melt-mixed PLA/Ag nanocomposites exhibited extremely low elongation values, the in situ-prepared PLA/Ag samples demonstrated a remarkable increase in ductility. Specifically, PLA/0.5%Ag_in situ exhibited ~22% elongation at break, and PLA/1.0%Ag_in situ reached an impressive 137% (Figure 15d). This higher ductility occurred because of the increased chain mobility and flexibility (lower Tg), which allowed the material to undergo significant plastic deformation before failure. Despite their low strength and stiffness, these in situ materials exhibited exceptional mechanical performance compared to the inherent brittleness of PLA. These findings suggest that PLA/Ag nanocomposite samples synthesized via in situ ROP could be promising substrates for flexible printed electronic applications [77,78,79].
Flexural testing is a crucial technique in printed electronic applications as it evaluates device performance under bending and deformation. These experiments provide essential mechanical data for the design of more reliable printed devices and assist in identifying the deformation limits before functional failure occurs [80].
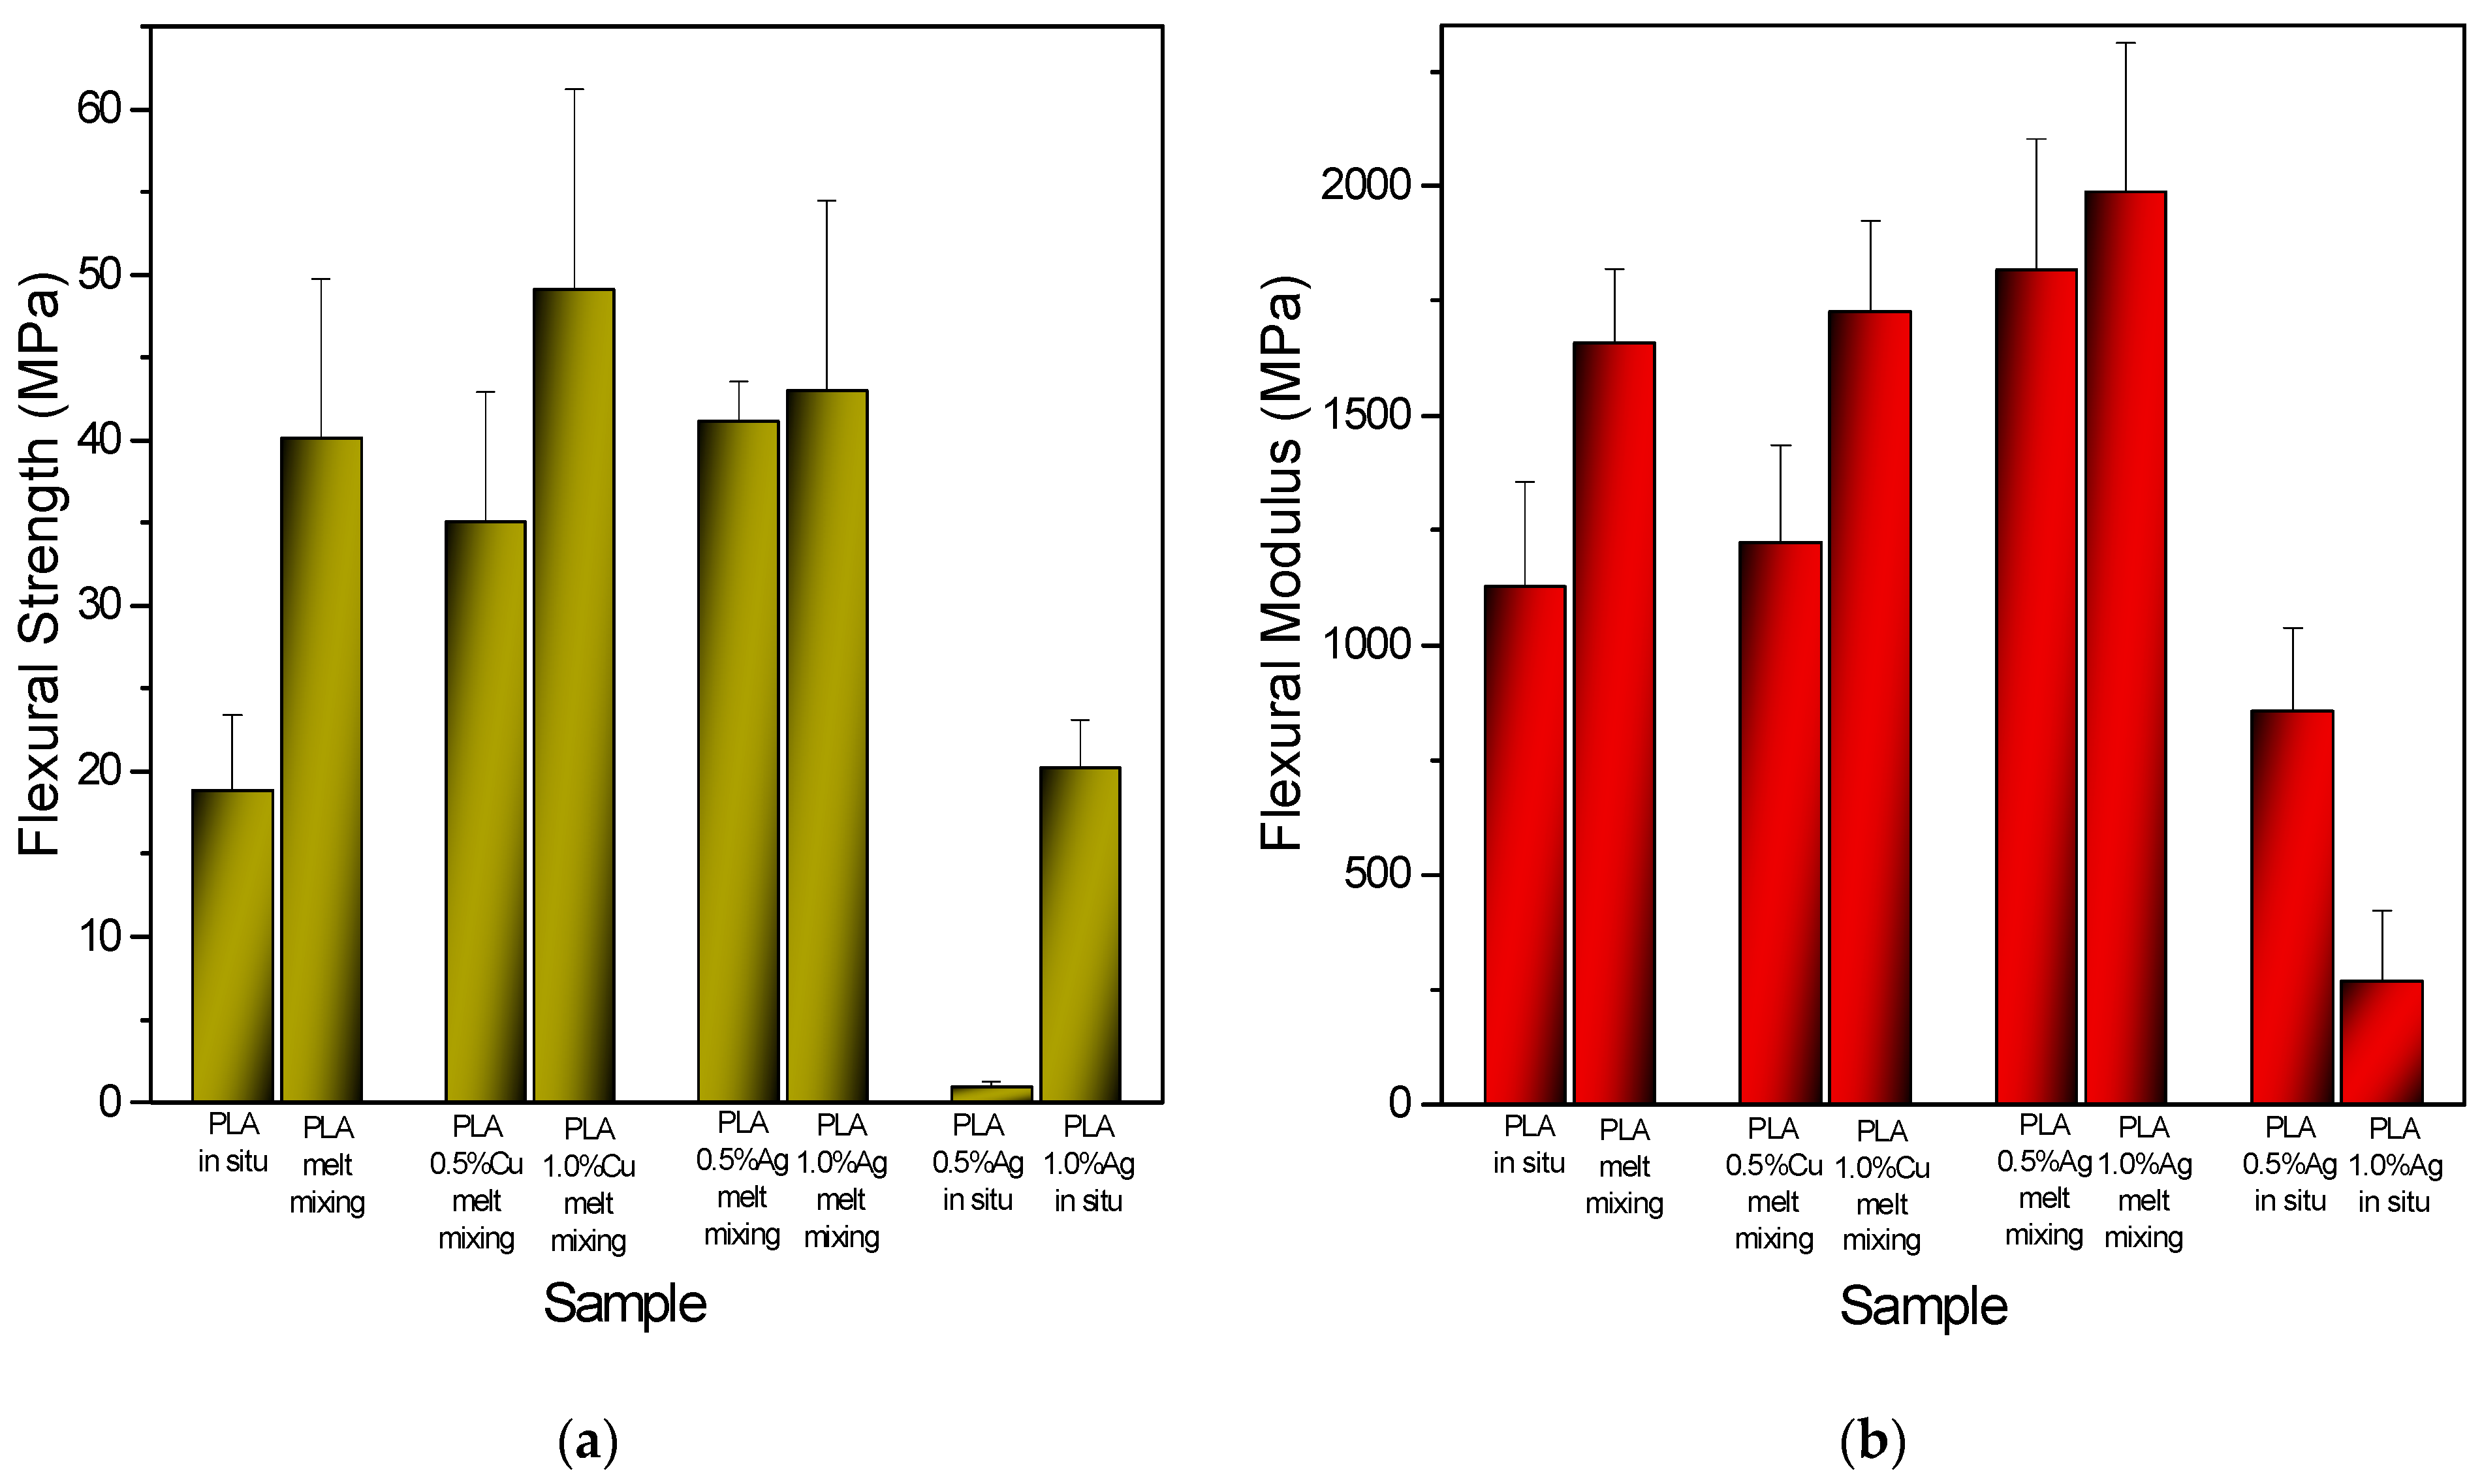
Moving on to the flexural properties, the results (Figure 16, Table 4) followed a similar trend to the tensile tests. Neat PLA prepared by melt mixing showed higher strength (Figure 17a) compared to in situ-synthesized PLA, while the incorporation of Ag and Cu NPs through melt mixing did not significantly affect the overall mechanical performance of PLA. In contrast, the in situ-fabricated PLA/Ag nanocomposites displayed lower flexural strength consistent with the trend observed in the tensile data. It is important to note that, during the three-point bending tests, none of the in situ nanocomposite samples fractured (Figure 16), which highlights their suitability as substrates for flexible printed electronic applications [80]. The flexural modulus (Figure 17b) followed the same overall tendency, where melt-mixed PLA nanocomposites showed higher stiffness compared to neat PLA, while the in situ-prepared PLA/Ag systems exhibited a decreased modulus.

3.5. Surface Properties

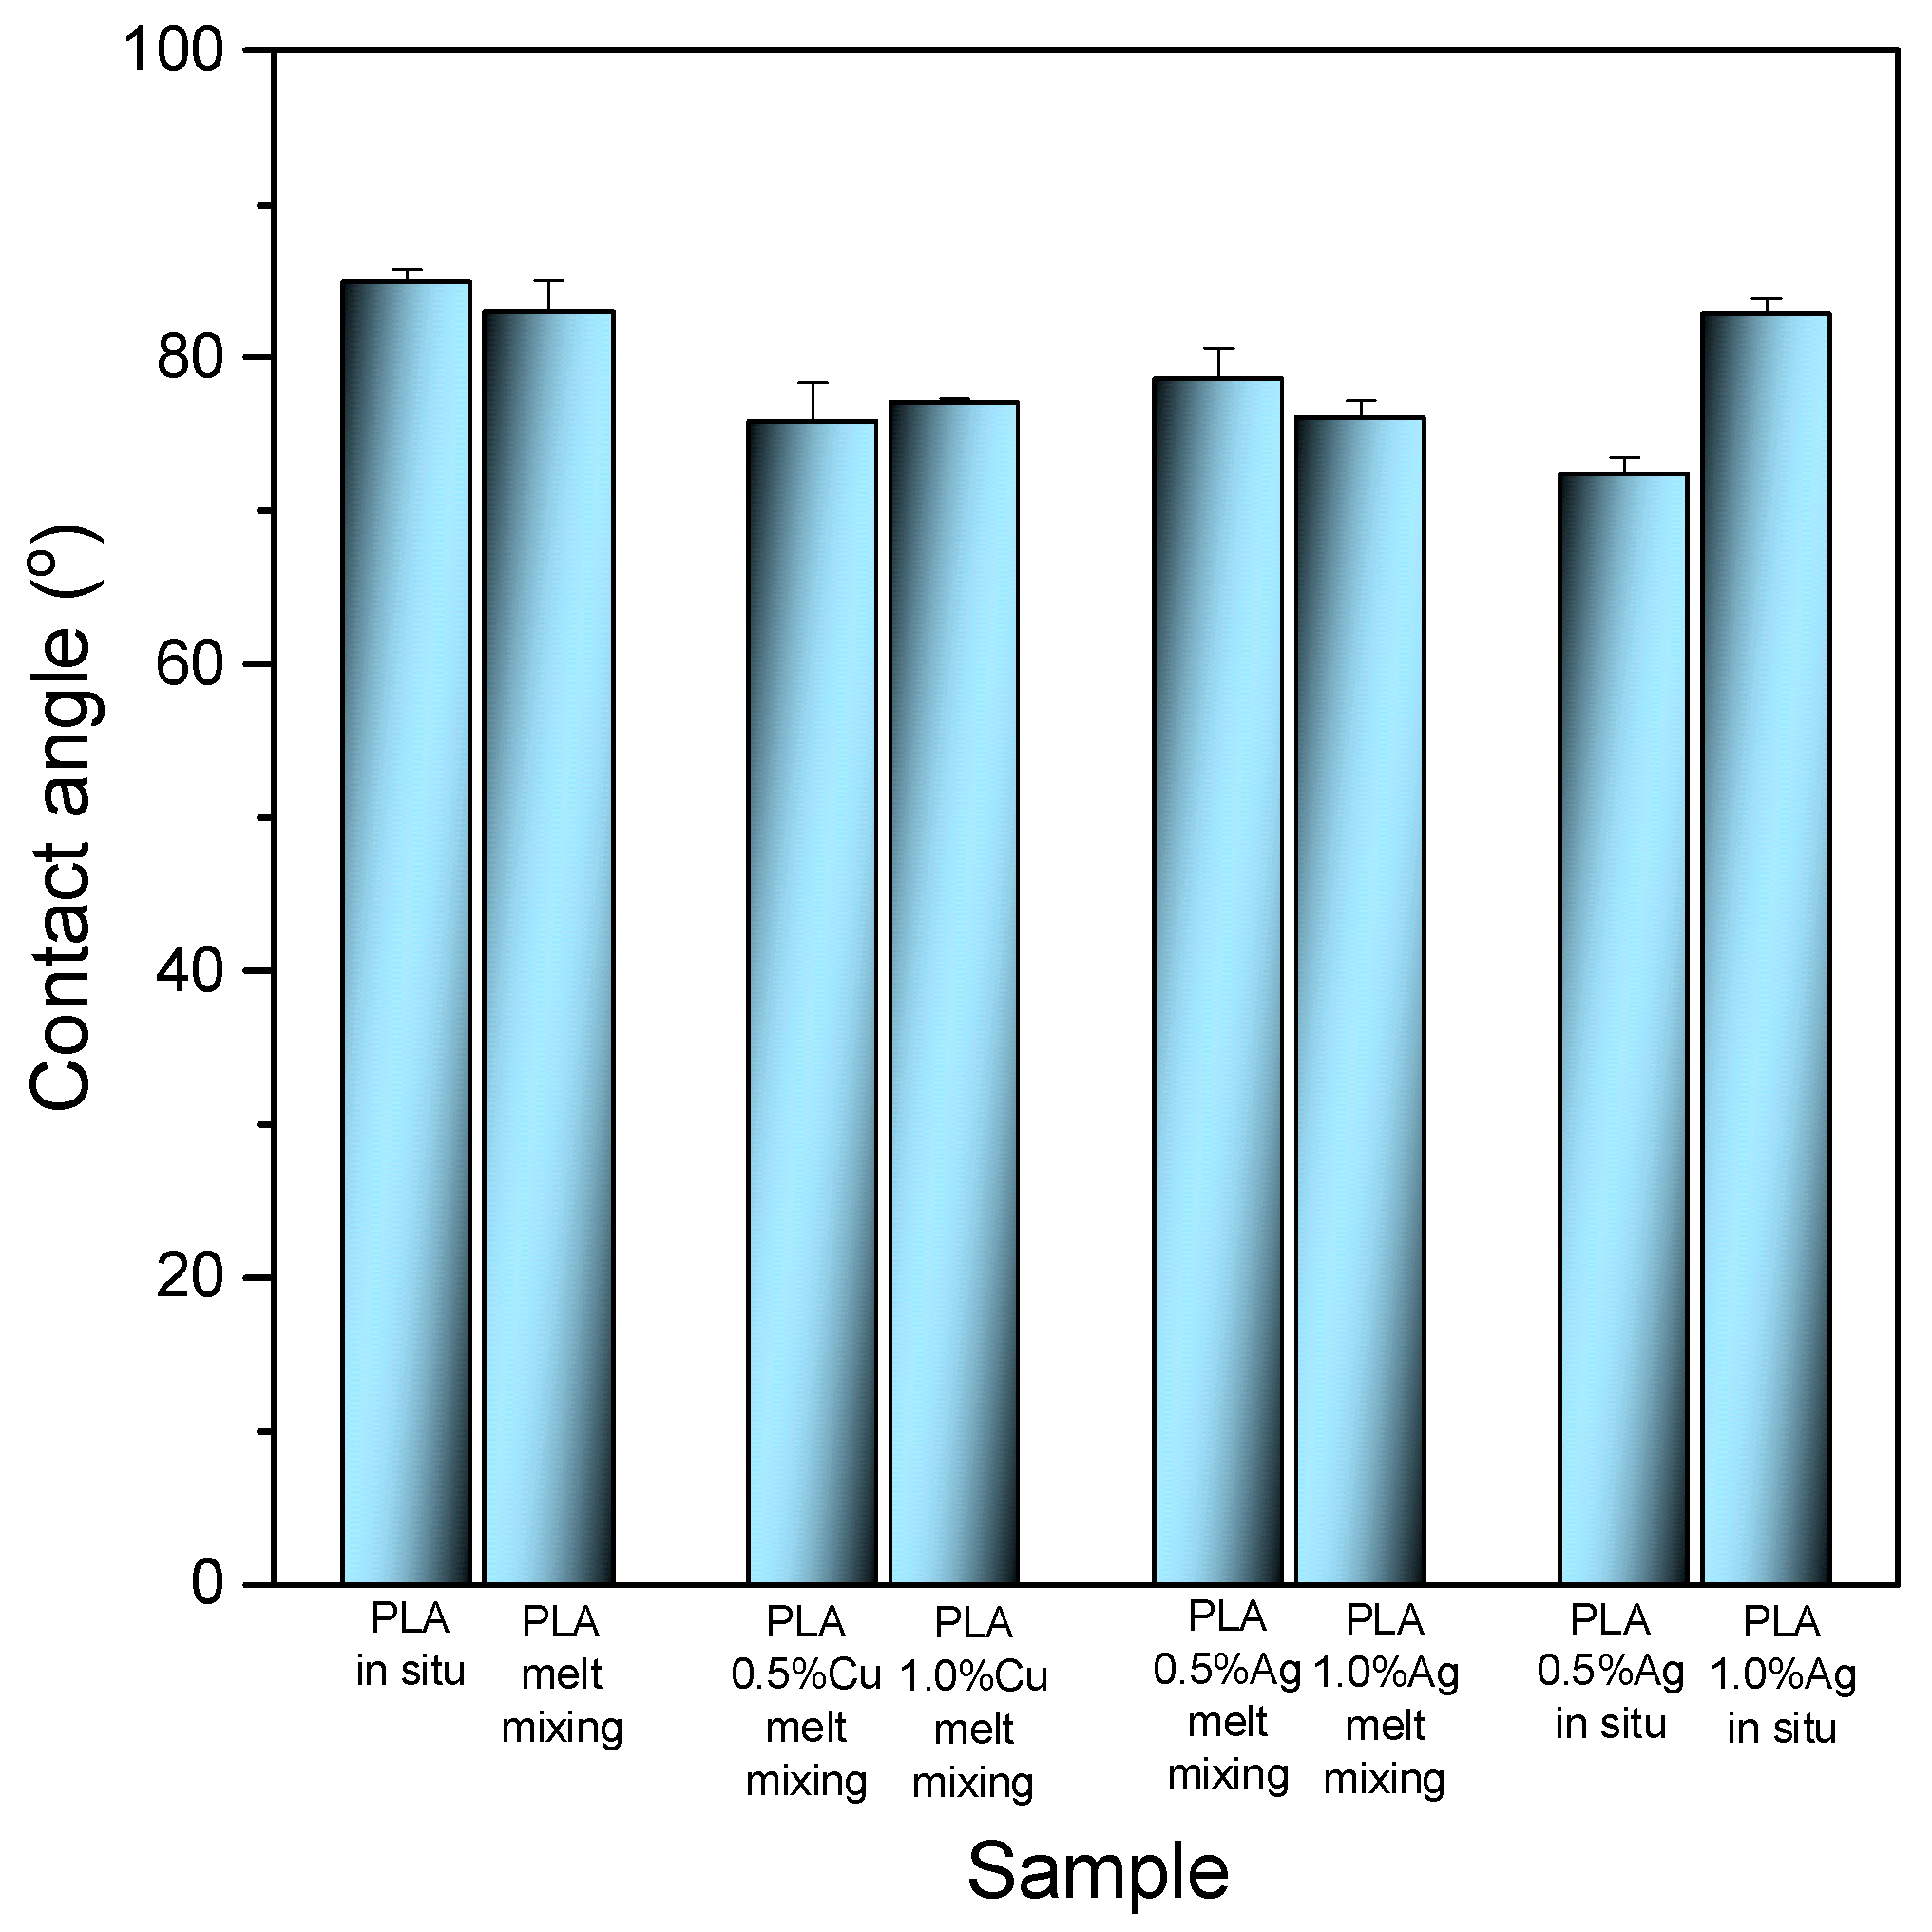
The effect of the hydrophilicity or hydrophobicity of the composites was explored by measuring the water contact angle (Figure 18). The water contact angle of polymers depends on various factors, including surface properties, preparation method, surface roughness, chemical composition, and temperature. The PLA samples (PLA_in situ and PLA_melt mixing) exhibited relatively high contact angles of approximately 85° and 83°, respectively. These values were consistent with the literature [81], indicating that neat PLA has a relatively hydrophobic surface. The small difference between the two samples suggested that the fabrication method (in situ polymerization vs. melt mixing) did not significantly influence the hydrophilicity of the PLA matrix. With the addition of copper and silver NPs via melt mixing, the contact angle decreased, indicating increased surface hydrophilicity. PLA/0.5%Ag_melt mixing shows a contact angle of ~79°, while for the sample of PLA/1%Ag_melt mixing, the angle decreased to ~76°. Similarly, the Cu-nanocomposites exhibited contact angles of ~76° for PLA/0.5%Cu_melt mixing and ~77° for PLA/1%Cu_melt mixing, indicating a slight increase in hydrophilicity compared to neat PLA. A similar trend was observed for the in situ-based samples, where PLA/0.5%Ag_in situ exhibited the lowest contact angle ~72°, whereas increasing the Ag content to 1%_in situ increased the water contact angle.

4. Conclusions

Ag nanocomposite materials based on PLA were successfully synthesized via in situ ring-opening polymerization (ROP), and additional materials were prepared by melt mixing prior to solvent casting based on Ag and Cu NPs. GPC measurements confirmed that the presence of silver nanoparticles affected the macromolecular structure of the PLA, leading to a reduction in molecular weight. Moreover, the optical properties revealed clear differences between the two prepared methods. The chemical structure was investigated by FTIR. The alteration in the ester group vibrations observed in the FTIR spectra of the PLA_1.0%Ag_in situ sample indicated polymer–NP interactions. According to the DSC, the materials exhibited semi-crystalline characteristics, as evidenced by XRD analysis. Moreover, Tg was significantly affected by the presence of NPs during the ROP of L-lactide, leading to softer materials with increased molecular mobility. Furthermore, during melt crystallization, significant differences in crystallinity between the two different synthesized methods were observed, indirectly indicating that strong polymer–NP interactions can occur through in situ polymerization. Isothermal melt crystallization studies confirmed the nucleation ability of the NPs, especially in the case of the in situ-based method of preparation. The mechanical evaluation indicated that while the melt-mixed samples maintained high strength and stiffness, the in situ nanocomposites showed remarkable flexibility, with PLA/1.0%Ag_in situ reaching an impressive elongation of 137%. Despite their lower strength and stiffness, the in situ-based materials did not break during the three-point bending tests. The surface properties of PLA did not significantly change with the addition of Ag and Cu nanoparticles. This work demonstrates the advantages of in situ ROP over conventional methods in achieving superior functional substrates for advanced engineering applications such as biosensors and wearable and flexible printed electronics. Future work should focus on the upscaled production of PLA nanocomposites based on various NPs, such as metal nanoparticles, via cast film extrusion in order to obtain cast film sheets, which can be used as substrates for engineering applications.

Author Contributions

Investigation, writing—original draft, writing—review and editing, visualization: K.L. and R.O.I.; conceptualization, writing—review and editing, supervision: D.N.B. All authors have read and agreed to the published version of the manuscript.

Funding

This research was funded by the European Union under the GA no 101070556 (Sustain-a-Print, https://www.sustainaprint.eu/). Views and opinions expressed are however those of the author(s) only and do not necessarily reflect those of the European Union or RIA. Neither the European Union nor the granting authority can be held responsible for them.

Data Availability Statement

The GPC, FTIR, CIE, DSC, XRD, tensile and flexural raw data are available on Zenodo (https://zenodo.org/records/17520935, accessed on 1 November 2025). The rest of the data supporting this article will be available upon request to the corresponding authors, uniquely in the frame of private communication.

Conflicts of Interest

All authors declare that the research was conducted in the absence of any commercial or financial relationships that could be construed as a potential conflict of interest.

References

  1. Ali, S.S.; Abdelkarim, E.A.; Elsamahy, T.; Altohamy, R.; Li, F.; Kornaros, M.; Zuorro, A.; Zuo, D.; Sun, J. Bioplastic production in terms of life cycle assessment: A state-of-the-art review. Environ. Sci. Ecotechnol. 2023, 19, 100254. [Google Scholar] [CrossRef] [PubMed]
  2. Mohammad, R.S.; Vivek Kumar, V. Impact of plastic pollution on ecosystems: A review of adverse effects and sustainable solutions. Environ. Monit. Assess. 2025, 197, 264. [Google Scholar] [CrossRef] [PubMed]
  3. Babaremu, K.; Oladijo, O.P.; Akinlabi, E. Biopolymers: A suitable replacement for plastics in product packaging. Adv. Ind. Eng. Polym. Res. 2023, 6, 333–340. [Google Scholar] [CrossRef]
  4. Chanda, M.; Roy, S.K. Industrial Polymers, Specialty Polymers, and Their Applications; CRC Press: Boca Raton, FL, USA, 2008. [Google Scholar]
  5. Terzopoulou, Ζ.; Bikiaris, D.N. Biobased plastics for the transition to a circular economy. Mater. Lett. 2024, 362, 136174. [Google Scholar] [CrossRef]
  6. Zhu, Y.; Romain, C.; Williams, C.K. Sustainable polymers from renewable resources. Nature 2017, 546, 67–70. [Google Scholar] [CrossRef]
  7. Schneiderman, D.K.; Hillmyer, M.A. 50th Anniversary Perspective: There Is a Great Future in Sustainable Polymers. Macromolecules 2017, 50, 3733–3749. [Google Scholar] [CrossRef]
  8. Velasquez, S.T.R.; Hu, Q.; Kramm, J.; Santin, V.C.; Völker, C.; Wurm, F.R. Plastics of the Future? An Interdisciplinary Review on Biobased and Biodegradable Polymers: Progress in Chemistry, Societal Views, and Environmental Implications. Angew. Chem. Int. Ed. 2025, 64, e202423406. [Google Scholar] [CrossRef]
  9. Ali, W.; Ali, H.; Souissi, S.; Zinck, P. Are bioplastics an ecofriendly alternative to fossil fuel plastics? Environ. Chem. Lett. 2023, 21, 1991–2002. [Google Scholar] [CrossRef]
  10. Armentano, I.; Bitinis, N.; Fortunati, E.; Mattioli, S.; Rescignano, N.; Verdejo, R.; Lopez-Manchado, M.A.; Kenny, J.M. Multifunctional nanostructured PLA materials for packaging and tissue engineering. Prog. Polym. Sci. 2013, 38, 1720–1747. [Google Scholar] [CrossRef]
  11. Naser, A.Z.; Deiab, I.; Darras, B.M. Poly(lactic acid) (PLA) and polyhydroxyalkanoates (PHAs), green alternatives to petroleum-based plastics: A review. RSC Adv. 2021, 11, 17151–17196. [Google Scholar] [CrossRef]
  12. Balla, E.; Daniilidis, V.; Karlioti, G.; Kalamas, T.; Stefanidou, M.; Bikiaris, N.D.; Vlachopoulos, A.; Koumentakou, I.; Bikiaris, D.N. Poly(lactic acid) a versatile biobased polymer of next decades with multifunctional properties. From monomer synthesis, polymerization techniques and molecular weight increase to PLA applications. Polymers 2021, 13, 1822. [Google Scholar] [CrossRef]
  13. Liu, S.; Qin, S.; He, M.; Zhou, D.; Qin, Q.; Wang, H. Current applications of poly(lactic acid) composites in tissue engineering and drug delivery. Compos. Part B Eng. 2020, 199, 108238. [Google Scholar] [CrossRef]
  14. DeStefano, V.; Khan, S.; Tabada, A. Applications of PLA in modern medicine. Eng. Regen. 2020, 1, 76–87. [Google Scholar] [CrossRef] [PubMed]
  15. Ngo, T.D.; Kashani, A.; Imbalzano, G.; Nquyen, K.T.Q.; Hui, D. Additive manufacturing (3D printing): A review of materials, methods, applications and challenges. Compos. Part B Eng. 2018, 143, 172–196. [Google Scholar] [CrossRef]
  16. Auras, R.; Harte, B.; Selke, S. An overview of polylactides as packaging materials. Macromol. Biosci. 2004, 4, 835–864. [Google Scholar] [CrossRef]
  17. Shen, L.; Worrell, E.; Patel, M.K. Comparing life cycle energy and GHG emissions of bio-based PET, recycled PET, PLA, and man-made cellulosics. Biofuels Bioprod. Biorefin. 2012, 6, 625–639. [Google Scholar] [CrossRef]
  18. Zhao, X.; Liu, J.; Li, J.; Liang, X.; Zhou, W.; Peng, S. Strategies and techniques for improving heat resistance and mechanical performances of poly(lactic acid) (PLA) biodegradable materials. Int. J. Biol. Macromol. 2022, 218, 115–134. [Google Scholar] [CrossRef]
  19. Bianchi, E.; Guidotti, G.; Soccio, M.; Siracusa, V.; Gazzano, M.; Salatelli, E.; Lotti, N. Biobased and Compostable Multiblock Copolymer of Poly(l-lactic acid) Containing 2,5-Furandicarboxylic Acid for Sustainable Food Packaging: The Role of Parent Homopolymers in the Composting Kinetics and Mechanism. Biomacromolecules 2023, 24, 2356–2368. [Google Scholar] [CrossRef]
  20. Lim, L.-T.; Auras, R.; Rubino, M. Processing technologies for poly(lactic acid). Prog. Polym. Sci. 2008, 33, 820–852. [Google Scholar] [CrossRef]
  21. Bikiaris, N.D.; Koumentakou, I.; Samiotaki, C.; Meimaroglou, D.; Varytimidou, D.; Karatza, A.; Kalantzis, Z.; Roussou, M.; Bikiaris, R.; Papageorgiou, G.Z. Recent Advances in the Investigation of Poly(lactic acid) (PLA) Nanocomposites: Incorporation of Various Nanofillers and their Properties and Applications. Polymers 2023, 15, 1196. [Google Scholar] [CrossRef]
  22. Mulla, M.Z.; Rahman, M.R.T.; Marcos, B.; Tiwari, B.; Pathania, S. Poly Lactic Acid (PLA) Nanocomposites: Effect of Inorganic Nanoparticles Reinforcement on Its Performance and Food Packaging Applications. Molecules 2021, 26, 1967. [Google Scholar] [CrossRef]
  23. Sha, L.; Chen, Z.; Chen, Z.; Zhang, A.; Yang, Z. Polylactic acid based nanocomposites: Promising safe and biodegradable materials in biomedical field. Int. J. Polym. Sci. 2016, 2016, 6869154. [Google Scholar] [CrossRef]
  24. Raquez, J.-M.; Habibi, Y.; Murariu, M.; Dubois, P. Polylactide (PLA)-based nanocomposites. Prog. Polym. Sci. 2013, 38, 1504–1542. [Google Scholar] [CrossRef]
  25. Kickelbick, G. Hybrid Materials—Past, Present and Future. Hybrid Mater. 2014, 1, 39–51. [Google Scholar] [CrossRef]
  26. Sarma, S.; Rao, V.R. Emerging synthesis and characterization techniques for hybrid polymer nanocomposites. Nanotechnology 2023, 35, 012002. [Google Scholar] [CrossRef]
  27. Machiels, J.; Verma, A.; Appeltans, R.; Buntinx, M.; Ferraris, E.; Deferme, W. Printed Electronics (PE) as an enabling Technology to Realize Flexible Mass Customized Smart Applications. Proc. CIRP 2020, 96, 115–120. [Google Scholar] [CrossRef]
  28. Klonos, P.A.; Ioannidis, R.O.; Pitsavas, A.; Bikiaris, N.D.; Makri, S.P.; Koutsourea, S.; Grigoropoulos, A.; Deligkiozi, I.; Zoikis-Karathanasis, A.; Kyritsis, A.; et al. Segmental mobility, interfacial polymer, crystallization and conductivity study in polylactides filled with hybrid lignin-CNT particles. Nanomaterials 2025, 15, 660. [Google Scholar] [CrossRef] [PubMed]
  29. Nicolae-Maranciuc, A.; Chicea, D.; Chicea, L.M. Ag Nanoparticles for Biomedical Applications—Synthesis and Characterization—A Review. Int. J. Mol. Sci. 2022, 23, 5778. [Google Scholar] [CrossRef]
  30. Abbas, R.; Luo, J.; Qi, X.; Naz, A.; Khan, I.A.; Liu, H.; Yu, S.; Wei, J. Silver Nanoparticles: Synthesis, Structure, Properties and Applications. Nanomaterials 2024, 14, 1425. [Google Scholar] [CrossRef] [PubMed]
  31. Nguyen, N.P.U.; Dang, N.T.; Doan, L.; Nguyen, T.T.H. Synthesis of Silver Nanoparticles: From Conventional to ‘Modern’ Methods—A Review. Processes 2023, 11, 2617. [Google Scholar] [CrossRef]
  32. Bruna, T.; Maldonado-Bravo, F.; Jara, P.; Caro, N. Silver Nanoparticles and Their Antibacterial Applications. Int. J. Mol. Sci. 2021, 22, 7202. [Google Scholar] [CrossRef]
  33. Jeevanandam, J.; Krishnan, S.; Hii, Y.S.; Pan, S.; Chan, Y.S.; Acquah, C.; Danquah, M.K.; Rodrigues, J. Synthesis Approach-Dependent Antiviral Properties of Silver Nanoparticles and Nanocomposites. J. Nanostruct. Chem. 2022, 12, 809–831. [Google Scholar] [CrossRef] [PubMed]
  34. Duman, H.; Eker, F.; Akdaşçi, E.; Witkowska, A.M.; Bechelany, M.; Karav, S. Silver Nanoparticles: A Comprehensive Review of Synthesis Methods and Chemical and Physical Properties. Nanomaterials 2024, 14, 1527. [Google Scholar] [CrossRef]
  35. Dhaka, A.; Mali, S.C.; Sharma, S.; Trivedi, R. A Review on Biological Synthesis of Silver Nanoparticles and Their Potential Applications. Results Chem. 2023, 6, 101108. [Google Scholar] [CrossRef]
  36. Shameli, K.; Ahmad, M.B.; Yunus, W.M.Z.W.; Ibrahim, N.A.; Rahman, R.A.; Jokar, M.; Darroudi, M. Silver/poly (lactic acid) nanocomposites: Preparation, characterization, and antibacterial activity. Int. J. Nanomed. 2010, 5, 573–579. [Google Scholar] [CrossRef]
  37. Ameh, T.; Sayes, C.M. The potential exposure and hazards of copper nanoparticles: A review. Environ. Toxicol. Pharmacol. 2019, 71, 103220. [Google Scholar] [CrossRef]
  38. Bruna, J.E.; Muñoz-Shugulí, C.; Espinoza, L.; Herrera, A.; Rodríguez-Mercadoz, F.J.; Ganga, M.A.; Guarda, A.; Galotto, M.J. Poly(lactic acid) and copper-modified montmorillonite nanocomposite films for antimicrobial food packaging. J. Appl. Polym. Sci. 2024, 142, 56406. [Google Scholar] [CrossRef]
  39. Powar, N.S.; Patel, V.J.; Pagare, P.K.; Pandav, R.S. Cu Nanoparticle: Synthesis, Characterization and Application. Chem. Methodol. 2019, 3, 457–480. [Google Scholar]
  40. Tan, K.S.; Cheong, K.Y. Advances of Ag, Cu, and Ag–Cu alloy nanoparticles synthesized via chemical reduction route. J. Nanopart. Res. 2013, 15, 1537. [Google Scholar] [CrossRef]
  41. Luceri, A.; Francese, R.; Lembo, D.; Ferraris, M.; Balagna, C. Silver Nanoparticles: Review of Antiviral Properties, Mechanism of Action and Applications. Microorganisms 2023, 11, 629. [Google Scholar] [CrossRef]
  42. Gawande, M.B.; Goswami, A.; Felpin, F.-X.; Asefa, T.; Huang, X.; Silva, R.; Zou, X.; Zbořil, R.; Varma, R.S. Cu and Cu-Based Nanoparticles: Synthesis and Applications in Catalysis. Chem. Rev. 2016, 116, 3722–3811. [Google Scholar] [CrossRef] [PubMed]
  43. Bautista-Del-Ángel, J.E.; Morales-Cepeda, A.B.; Wood-Adams, P.M. Compatibility, Crystallinity and Mechanical Properties of Poly(lactic acid)-Poly(ether-block-amide) Based Copper Nanocomposites. Polym. Int. 2020, 69, 1024–1037. [Google Scholar] [CrossRef]
  44. Tamayo, L.; Azócar, M.; Kogan, M.; Riveros, A.; Páez, M. Copper-Polymer Nanocomposites: An Excellent and Cost-Effective Biocide for Use on Antibacterial Surfaces. Mater. Sci. Eng. C 2016, 69, 1391–1409. [Google Scholar] [CrossRef] [PubMed]
  45. Pholharn, D.; Srithep, Y.; Morris, J. Effect of initiators on synthesis of poly(L-lactide) by ring opening polymerization. IOP Conf. Ser. Mater. Sci. Eng. 2017, 213, 012022. [Google Scholar] [CrossRef]
  46. Makri, S.P.; Xanthopoulou, E.; Klonos, P.A.; Grigoropoulos, A.; Kyritsis, A.; Deligkiozi, I.; Zoikis-Karathanasis, A.; Nikolaidis, N.; Bikiaris, D.N.; Terzopoulou, Z. Lignin Particle Size Affects the Properties of PLA Composites Prepared by In Situ Ring-Opening Polymerization. Polymers 2024, 16, 3542. [Google Scholar] [CrossRef]
  47. Papadopoulou, K.; Klonos, P.A.; Kyritsis, A.; Tarani, E.; Chrissafis, K.; Mašek, O.; Tsachouridis, K.; Anastasiou, A.D.; Bikiaris, D.N. Synthesis and Characterization of PLA/Biochar Bio-Composites Containing Different Biochar Types and Content. Polymers 2025, 17, 263. [Google Scholar] [CrossRef]
  48. Yang, J.-H.; Lin, S.-H.; Lee, Y.-D. Preparation and characterization of poly(L-lactide)–graphene composites using the in situ ring-opening polymerization of PLLA with graphene as the initiator. J. Mater. Chem. 2012, 22, 10805–10815. [Google Scholar] [CrossRef]
  49. Manju, P.; Krishnan, P.S.G.; Nayak, S.K. In-situ polymerised PLA-SEP bionanocomposites: Effect of silanol groups on the properties of PLA. J. Polym. Res. 2020, 27, 134. [Google Scholar] [CrossRef]
  50. Ortenzi, M.A.; Basilissi, L.; Farina, H.; Di Silvestro, G.; Piergiovanni, L.; Mascheroni, E. Evaluation of crystallinity and gas barrier properties of films obtained from PLA nanocomposites synthesized via “in situ” polymerization of L-lactide with silane-modified nanosilica and montmorillonite. Eur. Polym. J. 2015, 66, 478–491. [Google Scholar] [CrossRef]
  51. Klonos, P.A.; Ioannidis, R.O.; Lazaridou, K.; Kyritsis, A.; Bikiaris, D.N. Effects of Small Amounts of Metal Nanoparticles on the Glass Transition, Crystallization, Electrical Conductivity, and Molecular Mobility of Polylactides: Mixing vs. In Situ Polymerization Preparation. Electronics 2025, 14, 3826. [Google Scholar] [CrossRef]
  52. Gorman, A.M.; Clayton, A.; O’Connell, T.; Johnson, D. A recyclable screen ink with state-of-the-art performance developed using a bottom-up, safety and sustainability-driven approach. MRS Adv. 2023, 8, 311–316. [Google Scholar] [CrossRef]
  53. Vogel, K.; Carniello, S.; Beni, V.; Sudheshwar, A.; Malinverno, N.; Alesanco, Y.; Torrellas, M.; Harkema, S.; De Kok, M.; Rentrop, C.; et al. Defining and achieving next-generation green electronics: A perspective on best practices through the lens of hybrid printed electronics. IEEE Access 2025, 13, 117135–117161. [Google Scholar] [CrossRef]
  54. Qian, F.; Jia, R.; Cheng, M.; Chaudhary, A.; Melhi, S.; Mekkey, S.D.; Zhu, N.; Wang, C.; Razak, F.; Xu, X.; et al. An overview of polylactic acid (PLA) nanocomposites for sensors. Adv. Compos. Hybrid Mater. 2024, 7, 75. [Google Scholar] [CrossRef]
  55. Silva, M.M.; Lopes, P.E.; Li, Y.; Pötschke, P.; Ferreira, F.N.; Paiva, M.C. Polylactic acid/carbon nanoparticle composite filaments for sensing. Appl. Sci. 2021, 11, 2580. [Google Scholar] [CrossRef]
  56. Bautista-Del-Ángel, J.E.; Morales-Cepeda, A.B.; Lozano-Ramírez, T.; Sánchez, S.; Karami, S.; Lafleur, P. Enhancement of crystallinity and toughness of poly(l-lactic acid) influenced by Ag nanoparticles processed by twin screw extruder. Polym. Compos. 2018, 39, 2368–2376. [Google Scholar] [CrossRef]
  57. Popescu, V.; Prodan, D.; Cuc, S.; Saroşi, C.; Furtos, G.; Moldovan, A.; Carpa, R.; Bomboş, D. Antimicrobial Poly (Lactic Acid)/Copper Nanocomposites for Food Packaging Materials. Materials 2023, 16, 1415. [Google Scholar] [CrossRef] [PubMed]
  58. Saeidlou, S.; Huneault, M.A.; Li, H.; Park, C.B. Poly(lactic acid) crystallization. Prog. Polym. Sci. 2012, 37, 1657–1677. [Google Scholar] [CrossRef]
  59. Klonos, P.A.; Bikiaris, N.D.; Barmpalexis, P.; Kyritsis, A. Segmental mobility in linear polylactides of various molecular weights. Polymer 2024, 305, 127177. [Google Scholar] [CrossRef]
  60. Klonos, P.; Terzopoulou, Z.; Stefanos Koutsoumpis, S.; Zidropoulos, S.; Sotiria Kripotou, S.; Papageorgiou, G.Z.; Bikiaris, D.N.; Kyritsis, A.; Pissis, P. Rigid amorphous fraction and segmental dynamics in nanocomposites based on poly(L–lactic acid) and nano-inclusions of 1–3D geometry studied by thermal and dielectric techniques. Eur. Polym. J. 2016, 82, 16–34. [Google Scholar] [CrossRef]
  61. Črešnar, K.P.; Zemljič, L.F.; Papadopoulos, L.; Terzopoulou, Z.; Zamboulis, A.; Klonos, P.A.; Bikiaris, D.N.; Kyritsis, A.; Pissis, P. Effects of Ag, ZnO and TiO2 nanoparticles at low contents on the crystallization, semicrystalline morphology, interfacial phenomena and segmental dynamics of PLA. Mater. Today Commun. 2021, 27, 102192. [Google Scholar] [CrossRef]
  62. Köroğlu, M.; Ebin, B.; Stopić, S.; Gürmen, S.; Friedrich, B. One Step Production of Silver-Copper (AgCu) Nanoparticles. Metals 2021, 11, 1466. [Google Scholar] [CrossRef]
  63. Refaa, Z.; Boutaous, M.; Siginer, D.A. PLA crystallization kinetics and morphology development. Int. Polym. Process. 2018, 3, 336–344. [Google Scholar] [CrossRef]
  64. Vyazovkin, S.; Burnham, A.K.; Criado, J.M.; Pérez-Maqueda, L.A.; Popescu, C.; Sbirrazzuoli, N. ICTAC Kinetics Committee recommendations for performing kinetic computations on thermal analysis data. Thermochim. Acta 2011, 520, 1–19. [Google Scholar] [CrossRef]
  65. Müller, A.J.; Michell, R.M.; Lorenzo, A.T. Isothermal Crystallization Kinetics of Polymers. In Polymer Morphology: Principles, Characterization, and Processing; John Wiley & Sons, Inc.: Hoboken, NJ, USA, 2016. [Google Scholar]
  66. Lorenzo, A.T.; Arnal, M.L.; Albuerne, J.; Müller, A.J. DSC isothermal polymer crystallization kinetics measurements and the use of the Avrami equation to fit the data: Guidelines to void common problems. Polym. Test. 2007, 26, 222–231. [Google Scholar] [CrossRef]
  67. Ioannidis, R.O.; Xanthopoulou, E.; Terzopoulou, Z.; Zamboulis, A.; Bikiaris, D.N.; George, Z.; Papageorgiou, G.Z. Synthesis and thermal investigation of poly(propylene terephthalate-co-2,5-furan dicarboxylate) copolyesters. J. Ind. Eng. Chem. 2024, 131, 531–544. [Google Scholar] [CrossRef]
  68. Klonos, P.A.; Papadopoulos, L.; Papageorgiou, G.Z.; Kyritsis, A.; Pissis, P.; Bikiaris, D.N. Interfacial Interactions, Crystallization, and Molecular Dynamics of Renewable Poly(Propylene Furanoate) In Situ Filled with Initial and Surface Functionalized Carbon Nanotubes and Graphene Oxide. J. Phys. Chem. C 2020, 124, 10220–10234. [Google Scholar] [CrossRef]
  69. Wu, S.; Li, H.; Huang, G.; Wu, J. Nucleating effect of multi-walled carbon nanotubes and graphene on the crystallization kinetics and melting behavior of olefin block copolymers. RSC Adv. 2014, 4, 19024. [Google Scholar] [CrossRef]
  70. Salas-Papayanopolos, H.; Morales-Cepeda, A.B.; Wood-Adams, P.; Sanchez, S.; Lafleur, P.G.; Vazquez, H.P. Crystallization effect of poly(L-lactic acid)/silver nanocomposites blends, on barrier and mechanical properties using glyceryl triacetate as plasticizer. Polym. Bull. 2023, 80, 5273–5290. [Google Scholar] [CrossRef]
  71. Yasuniwa, M.; Iura, K.; Dan, Y. Melting behavior of poly(l-lactic acid): Effects of crystallization temperature and time. Polymer 2007, 48, 5398–5407. [Google Scholar] [CrossRef]
  72. Zhu, A.J.; Sternstein, S.S. Nonlinear viscoelasticity of nanofilled polymers: Interfaces, chain statistics and properties recovery kinetics. Compos. Sci. Technol. 2003, 63, 1113–1126. [Google Scholar] [CrossRef]
  73. Chen, Q.; Gong, S.; Moll, J.; Zhao, D.; Kumar, S.K.; Colby, R.H. Mechanical reinforcement of polymer nanocomposites from percolation of a nanoparticle network. ACS Macro Lett. 2015, 4, 398–402. [Google Scholar] [CrossRef] [PubMed]
  74. Klonos, P.A.; Bikiaris, R.D.; Terzopoulou, Z.; Mouchlianiti, K.; Tsachouridis, K.; Anastasiou, A.D.; Kyritsis, A.; Kyzas, G.Z. Structure-properties relationships in new polymer nanocomposites based on the renewable poly(butylene succinate) filled with low amounts of nanoparticles of 1-3D geometries. Polymer 2024, 296, 126841. [Google Scholar] [CrossRef]
  75. Papadopoulos, L.; Terzopoulou, Z.; Vlachopoulos, A.; Klonos, P.A.; Kyritsis, A.; Tzetzis, D.; Papageorgiou, G.Z.; Bikiaris, D.N. Synthesis and characterization of novel polymer/clay nanocomposites based on poly (butylene 2,5-furan dicarboxylate). Appl. Clay Sci. 2020, 190, 105588. [Google Scholar] [CrossRef]
  76. Nabgui, A.; Follain, N.; Vidović, E.; El Haskouri, J.; Marais, S.; El Meziane, A.; Lahcini, M.; Thebault, P. Preparation and study of the thermal, barrier and antibacterial properties of Polylactic acid-Fluorphlogopite-Silver nanoparticles nanocomposite films. Prog. Org. Coat. 2022, 171, 107041. [Google Scholar] [CrossRef]
  77. Kanon, K.; Sharif, S.S.; Irfan, A.; Sharif, A. Inorganic film materials for flexible electronics: A brief overview, properties, and applications. Eng. Rep. 2024, 6, e13006. [Google Scholar] [CrossRef]
  78. Bonnassieux, Y.; Brabec, C.J.; Cao, Y.; Carmichael, T.B.; Chabinyc, M.L.; Cheng, K.T.; Cho, G.; Chung, A.; Cobb, C.L.; Distler, A.; et al. The 2021 flexible and printed electronics roadmap. Flex. Print. Electron. 2021, 6, 023001. [Google Scholar] [CrossRef]
  79. Hui, Z.; Zhang, L.; Ren, G.; Sun, G.; Yu, H.-D.; Huang, W. Green Flexible Electronics: Natural Materials, Fabrication, and Applications. Adv. Mater. 2023, 35, 2211202. [Google Scholar] [CrossRef]
  80. Khan, Y.; Thielens, A.; Muin, S.; Ting, J.; Baumbauer, C.; Arias, A.C. A New Frontier of Printed Electronics: Flexible Hybrid Electronics. Adv. Mater. 2020, 32, 1905279. [Google Scholar] [CrossRef]
  81. Tümer, E.H.; Yılmaz, S.; Mert, B.; Öztürk, S.; Çolak, M.; Yılmaz, M.; Öztürk, B. Wetting of Superhydrophobic Polylactic Acid Micropillared Patterns. Langmuir 2022, 38, 10052–10064. [Google Scholar] [CrossRef]
Figure 1. Representative scheme of the preparation methods.
Jcs 09 00610 g001
Figure 2. Compression-molded samples of PLA, and PLA nanocomposites.
Jcs 09 00610 g002
Figure 3. GPC curves of PLA samples, and PLA/Ag nanocomposites prepared by ROP of the L-lactide.
Jcs 09 00610 g003
Figure 4. (a) Number-average molecular weight ( M n ¯ ) (GPC) and (b) intrinsic viscosity [η] of PLA samples and PLA_Ag/Cu nanocomposites.
Jcs 09 00610 g004
Figure 5. (a) ATR-FTIR spectra of PLA and PLA nanocomposites and (b) zoom area at the carbonylic region.
Jcs 09 00610 g005
Figure 6. CIE L*a*b* coordinates of PLA samples and PLA nanocomposites. L*: perceptual lightness, a* and b*: red–green and blue–yellow.
Jcs 09 00610 g006
Figure 7. Transmittance of PLA samples and PLA nanocomposites.
Jcs 09 00610 g007
Figure 8. Color PLA samples and PLA nanocomposites, as recorded by the spectrophotometer.
Jcs 09 00610 g008
Figure 9. DSC curves of PLA samples and PLA nanocomposites during (a) the first and (b) the second heating at 20 °C/min and (c) cooling at 10 °C/min, and (d) the zoom area of the melting temperatures during the first and second heating for the PLA/Ag in situ samples.
Jcs 09 00610 g009aJcs 09 00610 g009b
Figure 10. (a) Glass transition temperature and (b) the crystalline fraction during melt crystallization (cooling step).
Jcs 09 00610 g010
Figure 11. (a) DSC curves of the materials after the annealing experiments and (b) the crystalline fraction of the samples before and after annealing.
Jcs 09 00610 g011
Figure 12. XRD patterns of PLA samples and PLA nanocomposites.
Jcs 09 00610 g012
Figure 13. Isothermal crystallization of the samples for ΔT = 55. (a) Exothermic crystallization curves, (b) relative degree of crystallinity as a function of time, (c) crystallization half-time, and (d) subsequent heating traces of the materials.
Jcs 09 00610 g013
Figure 14. (a) Representative tensile stress–strain curves of PLA samples and PLA nanocomposites, and (b) the case of PLA/Ag in situ-based samples.
Jcs 09 00610 g014
Figure 15. Tensile properties of PLA samples and PLA nanocomposites. (a) Stress at Yield, (b) Stress at break, (c) Young’s Modulus, and (d) Elongation as a function of the samples.
Jcs 09 00610 g015
Figure 16. Representative flexural stress–strain curves of PLA samples and PLA nanocomposites.
Jcs 09 00610 g016
Figure 17. Flexural properties of the PLA nanocomposites materials. (a) Flexural strength, and (b) Flexural Modulus of the samples. The Flexural Strength indicates the maximum flexural stress the material can withstand during the experiments.
Jcs 09 00610 g017
Figure 18. Water contact angle of PLA samples and PLA nanocomposites.
Jcs 09 00610 g018
Table 1. Sample abbreviations and compositions.
AbbreviationContent wt%
PLA_in situ100-
PLA_melt mixing100-
PLA/0.5%Cu_melt mixing99.50.5
PLA/1.0%Cu_melt mixing99.01.0
PLA/0.5%Ag_melt mixing99.50.5
PLA/1.0%Ag_melt mixing99.01.0
PLA/0.5%Ag_in situ99.50.5
PLA/1.0%Ag_in situ99.01.0
Table 2. Thermal properties of PLA samples and PLA nanocomposites.
SampleAs ReceivedQuenchedCooling
Tm
(°C)
ΔHm
(J/g)
Tg
(°C)
ΔCp
[J/(g × °C)]
Tcc
(°C)
ΔHcc
(J/g)
Tm
(°C)
ΔHm
(J/g)
Tc
(°C)
ΔHc
(J/g)
CFc
(%)
PLA_in situ170.732.354.50.511102.636.3169.839.0102.934.837.5
PLA_melt mixing172.042.659.70.480105.432.2172.636.399.75.25.5
PLA/0.5%Cu_melt mixing171.834.060.20.343106.034.6171.835.999.910.18.1
PLA/1.0%Cu_melt mixing172.538.760.00.609106.035.6172.239.199.37.78.4
PLA/0.5%Ag_melt mixing173.240.659.30.551108.835.5172.937.099.02.78.1
PLA/1.0%Ag_melt mixing171.844.760.40.551107.433.8172.836.798.311.49.2
PLA/0.5%Ag_in situ160.67.135.20.356105.621.6160.95.296.28.714.6
PLA/1.0%Ag_in situ149.12.234.90.25297.430.3164.315.1102.38.815.4
Table 3. Tensile data of PLA samples and PLA nanocomposites.
SampleTensile Stress at Break
(MPa)
Tensile Stress at Yield
(MPa)
Elongation
(%)
Young’s Modulus (MPa)
PLA_in situ35.5 ± 4.930.7 ± 2.21.3 ± 0.13660.7 ± 78.9
PLA_melt mixing53.7 ± 2.152.1 ± 3.72.2 ± 0.33788.1 ± 94.7
PLA/0.5%Cu_melt mixing29.0 ± 5.030.2 ± 4.71.8 ± 0.53149.9 ± 680.8
PLA/1.0%Cu_melt mixing42.5 ± 4.743.7 ± 4.81.9 ± 0.64003.7 ± 523.7
PLA/0.5%Ag_melt mixing47.9 ± 3.450.4 ± 1.72.4 ± 0.93727.9 ± 172.7
PLA/1.0%Ag_melt mixing45.1 ± 2.148.0 ± 2.62.3 ± 0.43687.7 ± 87.1
PLA/0.5%Ag_in situ15.5 ± 1.517.7 ± 6.922.2 ± 0.51772.3 ± 378.6
PLA/1.0%Ag_in situ7.1 ± 1.410.9 ± 5.0136.9 ± 17.21484.7 ± 360.8
Table 4. Flexural data for PLA samples and PLA nanocomposites.
SamplesFlexural Strength
(MPa)
Flexural Modulus (MPa)
PLA_in situ18.8 ± 4.61126.9 ± 230.2
PLA_melt mixing40.1 ± 9.61658.3 ± 162.9
PLA/0.5%Cu_melt mixing35.1 ± 7.91223.3 ± 213.4
PLA/1.0%Cu_melt mixing49.2 ± 12.11726.0 ± 198.7
PLA/0.5%Ag_melt mixing41.1 ± 2.41817.1 ± 285.3
PLA/1.0%Ag_melt mixing43.0 ± 11.51986.5 ± 325.6
PLA/0.5%Ag_in situ0.9 ± 0.4 856.9 ± 180.6
PLA/1.0%Ag_in situ20.2 ± 2.9268.6 ± 153.7
Disclaimer/Publisher’s Note: The statements, opinions and data contained in all publications are solely those of the individual author(s) and contributor(s) and not of MDPI and/or the editor(s). MDPI and/or the editor(s) disclaim responsibility for any injury to people or property resulting from any ideas, methods, instructions or products referred to in the content.