Article

The Role of Cement–Water Interaction on Chloride Ingress in Sustainable Cement-Based Systems

by
Ahmed A. Ahmed
1,*,
Mahmoud Shakouri
2 and
Naga Pavan Vaddey
3
1
Department of Civil Engineering, College of Engineering, Mustansiriyah University, Baghdad 10047, Iraq
2
Department of Construction Management, Boise State University, Boise, ID 83725, USA
3
CTLGroup, Skokie, IL 60077, USA
*
Author to whom correspondence should be addressed.
J. Compos. Sci. 2026, 10(9), 479; https://doi.org/10.3390/jcs10090479
Submission received: 29 June 2026 / Revised: 31 July 2026 / Accepted: 2 August 2026 / Published: 5 September 2026
(This article belongs to the Special Issue Sustainable Composite Construction Materials, 3rd Edition)

Abstract

The durability of concrete structures exposed to chlorides is critically governed by chloride ingress, which induces reinforcement corrosion. While ordinary Portland cement (OPC) has been extensively studied, alternative binders such as calcium aluminate cement (CAC) and calcium sulfoaluminate (CSA) cement offer distinct microstructures that may enhance chloride resistance. Understanding how cement type and the water-to-cementitious material ratio (w/cm) influence the apparent chloride diffusion coefficient (Da) is paramount for designing durable infrastructure. This study systematically quantifies the influence of cement type (OPC, CAC, CSA) and w/cm ratio (0.45, 0.55, 0.65) on Da using a full-factorial experimental design and bulk diffusion testing. The results reveal a significant interaction between cement type and w/cm (p < 0.001). OPC exhibits predictable porosity-driven degradation, with Da increasing exponentially from 8.42 × 10⁻¹² to 1.46 × 10⁻¹⁰ m2/s as w/cm increases from 0.45 to 0.65. CAC shows a non-linear response, with optimal performance at w/cm = 0.55 (Da = 2.90 × 10⁻¹¹ m2/s) due to microstructural refinement from hydrate conversion but suffers severe degradation at w/cm = 0.65. CSA cement is extremely water-sensitive, with Da increasing by an order of magnitude (from ~4 × 10⁻¹¹ to 3.37 × 10⁻¹⁰ m2/s) at w/cm = 0.65, marking a critical failure threshold. Model fit quality (R2) serves as a leading indicator of microstructural instability, which is corroborated by XRD phase analysis. This study concludes that CSA presents a high risk for field applications with poor w/cm control, while OPC offers more predictable performance, advocating for cement-specific, performance-based specifications beyond traditional OPC-centric limits.

1. Introduction

The quantification of chloride ingress in concrete has evolved significantly, driven by the need for standardized, reliable durability indicators. Early approaches, such as the ponding test, AASHTO T259-80 [1], provided fundamental insights but were time-consuming. Accelerated methods like the Rapid Chloride Permeability Test (ASTM C1202) emerged [2], though they are influenced by ionic composition beyond chlorides. Breakthroughs in theoretical modeling led to standardized bulk diffusion tests like ASTM C1556, which derives the apparent chloride diffusion coefficient (Da) from steady-state Fick’s second law and remains the benchmark for fundamental transport characterization [3,4].
While ASTM C1556 provides a rigorous framework, contemporary research leverages multi-technique approaches to gain deeper mechanistic insights, where chloride concentration profiles are measured following ASTM C1152/C1152M-20 [5] via auto-titration [6,7] to elucidate the governing mechanisms, particularly for novel sustainable binders like calcium aluminate cement (CAC) and calcium sulfoaluminate (CSA) cement. These binders are increasingly promoted for their rapid strength and potentially enhanced durability, but a fundamental, comparative understanding of their chloride resistance mechanisms relative to ordinary Portland cement (OPC) is essential. Crucially, chloride transport is not merely a function of bulk chemistry but is governed by the intricate pore structure of the hydrated cement paste, which acts as the primary transport network. The pore system’s total porosity, connectivity, and pore size distribution are established by cement chemistry and the water-to-cementitious materials ratio (w/cm) and directly regulate ionic movement [8]. Therefore, a logical chain from cement chemistry to microstructure (pore structure) to chloride transport forms the critical basis for comparing binder performance.
Cement chemistry fundamentally dictates microstructural development. OPC hydrates to form calcium-silicate-hydrate (C-S-H) and portlandite, creating a pore structure where chloride transport is influenced by binding into Friedel’s salt and physical obstruction [9]. In contrast, CAC undergoes conversion from metastable hexagonal hydrates (CAH10, C2AH8) to the dense, stable cubic phase hydrogarnet (C3AH6) and gibbsite (AH3). This process can refine the pore structure if controlled but may increase porosity if conversion leads to cracking, especially at a higher w/cm or under carbonation attack [10]. CSA cement, rich in ye’elimite, forms ettringite rapidly, leading to a dense microstructure with fine porosity and potential for physical chloride binding within its crystalline structure [11,12]. The distinct hydrate assemblages of these cements directly create divergent pore networks, which, in turn, control the dominant chloride ingress pathways.
The pore structure is the principal regulator of chloride transport. A refined pore network with low connectivity and a high proportion of fine pores increases diffusion path tortuosity, directly reducing the apparent diffusion coefficient, Da [13]. Microstructural techniques, including X-ray diffraction, correlate Da with pore connectivity and phase evolution in sustainable cement systems [14]. Furthermore, the connectivity of capillary pores, more than total porosity alone, dictates whether chlorides can percolate through the matrix. CAC and CSA systems, through their unique hydration products, can achieve finer pore size distributions and lower connectivity compared to OPC at an equivalent w/cm, explaining their often-reported superior resistance.
CAC concretes, characterized by rapid strength development via CAH10 and C2AH8 formation, transition to denser, stable C3AH6 over time, reducing porosity and yielding Da values by 20–50% lower than OPC at an equivalent w/c [15]. However, carbonation-induced phase changes can increase permeability if not mitigated [9]. CSA cements, rich in ye’elimite, form ettringite and monosulfate, which physically bind chlorides and refine the pore network; reported Da values are 30–70% lower than OPC due to reduced critical pore diameters and increased tortuosity [12,16]. Unlike OPC, CSA exhibits minimal Friedel’s salt formation but relies on ettringite’s anion-sorption capacity [17]. Many studies confirm that CAC and CSA microstructures resist chloride ingress more effectively than OPC, particularly in early exposure stages [18,19]. This cement-dependent behavior underscores the necessity to evaluate the w/cm ratio effects within each system, as hydration kinetics and pore structure respond uniquely to water content. However, this advantage is highly sensitive to mixture design and curing, highlighting the need to study their performance under non-ideal practical conditions.
Despite recognized trends, a critical knowledge gap persists. The existing literature often documents the optimal performance of CAC and CSA at a low w/cm, but a systematic, comparative investigation quantifying their degradation pathways and identifying their failure thresholds under practical higher w/cm conditions is lacking. Understanding how these alternative binders behave when mixture proportions are less than ideal is crucial for assessing their robustness and tolerance for real-world construction variability.
To address this gap, the present study employs a rigorous, full-factorial experimental design to systematically quantify the influence of cement type (OPC, CAC, CSA) and w/cm ratio on the apparent chloride diffusion coefficient (Da). A w/cm range of 0.45 to 0.65 was strategically selected not to study peak performance, but to probe the sensitivity and degradation thresholds of these materials. This approach serves as a “stress test” to elucidate how deviations from ideal mix proportions disrupt the cement chemistry–microstructure–transport chain, leading to increased chloride ingress. By correlating Da with pore structure analysis, this study aims to provide a forensic comparison of chloride transport behavior, establishing clear cement-specific guidelines for designing durable concrete with sustainable binders.

2. Materials and Methods

2.1. Materials and Mixture Proportions

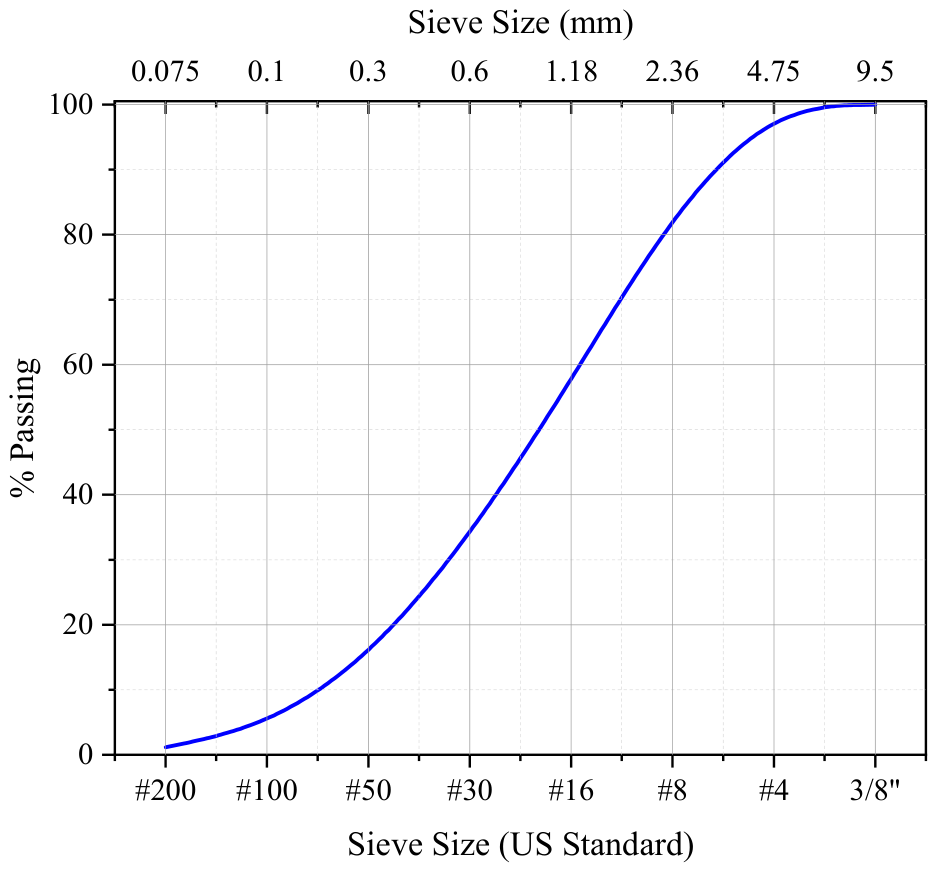
This study utilized commercially available cementitious binders and standardized materials to ensure comparability. The primary binders evaluated were ordinary Portland cement (OPC) meeting ASTM C150 [20] specifications, calcium aluminate cement (CAC) conforming to EN 14647-05 [21], and calcium sulfoaluminate (CSA) cement conforming to ASTM C1600 [22]. Knife River standard sand (complying with ASTM C778 [23]), with a bulk specific gravity of 2.53 and a gradation conforming to ASTM C136 [24], shown in Figure 1, was used as the fine aggregate for all mortar mixtures. Mixing water conformed to the specifications for Type 3 reagent water, as defined in ASTM C1602 [25], ensuring controlled ion content to prevent confounding influences on chloride diffusion measurements. The mixture proportions for the mortars were designed to isolate the effect of the water-to-cement ratio (w/cm) for each binder type. The specific w/cm under investigation are 0.45, 0.55, and 0.65. The sand-to-cement ratio of 2.6 is fixed for all mortar mixtures. X-ray fluorescence (XRF) analyses of OPC, CAC, and CSA cement were conducted following ASTM E1621 [26]. Table 1 presents the oxide composition (% mass) for each cement system used in this study.
The w/cm of 0.45, 0.55, and 0.65 were selected to systematically evaluate the sensitivity and degradation thresholds of the cementitious systems beyond the low-porosity regime typically studied for high-performance applications. While optimal durability for all systems is achieved at a w/cm ≤ 0.40, this study intentionally probed a higher, more practical range to achieve two critical objectives. (1) To elucidate distinct degradation pathways: at a low w/cm, the dense microstructures of OPC, CAC, and CSA can yield similarly low diffusion coefficients, obscuring fundamental differences in their chemical stability. The selected range amplifies these differences, forcing microstructural changes—such as conversion porosity in CAC and the collapse of the ettringite network in CSA—that are less pronounced at a lower w/cm. This approach allows for a forensic comparison of failure mechanisms rather than just a comparison of peak performance. (2) To quantify practical robustness and tolerance: The range was chosen to simulate potential scenarios of mixture proportion variability or less-than-ideal field control. The data generated provide a quantitative measure of the “forgiveness” of each system, defining the critical w/cm thresholds beyond which catastrophic loss of chloride resistance occurs. This is paramount for risk assessment and for establishing performance-based specification limits that account for real-world construction tolerances. Thus, the w/cm spectrum from 0.45 to 0.65 serves as a strategic stress test, revealing the intrinsic material responses and providing engineers with critical data on the consequences of deviations from idealized mix proportions.
While a w/cm of 0.65 is higher than the values typically specified for concrete in marine environments (often targeted below 0.45), its inclusion in this study is strategically designed to serve as an accelerated “stress test” for these novel binders. In practice, achieving extremely low w/cm ratios in the field is challenging due to factors like aggregate moisture variations, batching errors, and the need for adequate workability. The 0.65 w/cm ratio represents a realistic upper bound that can occur due to poor quality control or when mixtures are designed for non-structural applications. Furthermore, evaluating performance at a high w/cm ratio is a cost-effective method for amplifying microstructural degradation mechanisms, allowing for a forensic and accelerated comparison of how different cement systems respond to deviations from an ideal mix design. This approach directly informs the robustness and sensitivity of each binder system to construction variability. By identifying the failure threshold under exaggerated conditions, this study provides a conservative and practical guideline for field applications, demonstrating that, while all systems perform well under ideal proportions, CSA and CAC lose their durability advantage and become highly susceptible to degradation when the water content is not tightly controlled.

2.2. Mixing, Molding, and Curing Procedures

The mixing procedure for all mortar specimens (50 mm cubes for the compressive strength test [27] and 75 mm × 150 mm cylinders for the diffusion test [3]) rigorously followed the standard practice outlined in ASTM C305 [28], which governs the mechanical mixing of hydraulic cement pastes and mortars of plastic consistency. This ensured a homogeneous mixture and minimized entrained air. Immediately after mixing, the fresh mortar was placed into plastic molds in two layers, with each layer compacted using a standard tamping rod as prescribed by the relevant specimen preparation standard (i.e., ASTM C192 for prisms or cylinders [29]). The molded specimens were subsequently stored at 23 ± 1.0 °C for 24 h prior to demolding. Table 2 demonstrates the mixing proportions used in this study.
Curing protocols were critically selected to align with the hydration kinetics of each specific cement system and to comply with relevant ASTM standards. OPC and CSA specimens were moist-cured at 23 ± 1.0 °C following ASTM C192 until testing, typically for 28 days to ensure a mature microstructure. Given the known conversion processes in CAC systems, a two-stage curing regime was employed: an initial 24 h curing period at 23 ± 1.0 °C and >95% RH was employed to promote initial setting and strength gain, followed by a controlled, prolonged curing at 5 ± 1.0 °C and >95% RH for 38 days to manage the conversion reaction and achieve a stable phase assemblage, as recommended in EN 14647-05 [21]. The different curing ages were selected to accommodate the distinct hydration kinetics of each cement system. OPC and CSA achieve a mature microstructure within 28 days of standard moist curing [20,22]. Conversely, CAC is known for its rapid initial hydration but slower conversion kinetics, which can continue for weeks or months [10]. The extended 38-day curing period, following the recommendation in EN 14647-05 [21], was designed to allow the conversion process to progress significantly and approach a more stable phase assemblage. This ensures that the measured Da values reflect the transport properties of the mature, or near-mature, CAC system.

2.3. Preconditioning for Chloride Diffusion Testing

Prior to testing for chloride diffusion, all specimens were subjected to a rigorous preconditioning regimen to achieve a consistent and saturated state, as mandated by test methods like ASTM C1556 [3]. This typically involved ponding the mortar specimens in a saturated calcium hydroxide solution (3 g/L) for 48 h to maintain a high pH and calcium concentration externally, creating an equilibrium that stops calcium from dissolving out of the mortar. This was followed by air-drying all specimens at room temperature to a constant mass to remove evaporable water without decomposing the hydration products. This process ensures that the transport mechanism during the test is dominated by diffusion rather than absorption.

2.4. Chloride Diffusion Testing

2.4.1. Test Method and Specimen Preparation

The apparent chloride diffusion coefficient (Da) for mortar specimens with water-to-cementitious materials ratios (w/cm) of 0.45, 0.55, and 0.65 was determined in accordance with the standard test method for determining the apparent chloride diffusion coefficient of cementitious mixtures by bulk diffusion. Following the curing and preconditioning protocols outlined earlier, cylindrical specimens (75 mm × 150 mm) were prepared for testing. The curved circumference and one face of each specimen were sealed with Sikadur 32 Hi-Mod high-performance epoxy to ensure unidirectional chloride penetration parallel to the direction of casting. The opposing, uncoated face was exposed to the chloride solution. This rigorous sealing is critical for validating the assumption of the one-dimensional diffusion required for the subsequent mathematical analysis.

2.4.2. Exposure Conditions and Duration

The prepared specimens were immersed in a controlled-temperature bath maintained at 23.0 ± 1.0 °C. The exposure solution consisted of a 2.8 M sodium chloride (NaCl) solution, equivalent to 165 g/L, prepared with reagent-grade chemicals and Type 3 water to prevent ionic contamination. The solution was replaced periodically to maintain a constant concentration throughout the exposure period. To capture the influence of w/cm on diffusion kinetics, the exposure duration was scaled accordingly; specimens with a lower w/cm (0.45) were exposed for a longer duration (e.g., 45 days) to allow a sufficient penetration depth, while those with a higher w/cm (0.65) required a shorter period (e.g., 38 days) to avoid complete saturation beyond the characteristic penetration depth. This approach ensured measurable chloride profiles for all mixtures.
The exposure duration was scaled with the w/cm to ensure compliance with the standard guidance provided in ASTM C1556 [3] and to obtain usable and reliable chloride profiles for all mixtures. According to the standard, the exposure period must be sufficient to allow chloride penetration to a minimum depth of 15 mm from the exposed surface for the error-function solution to be valid. For lower w/cm mixtures, which inherently have a lower Da, a longer exposure time (45 days) is required to achieve this minimum penetration depth. Conversely, for high w/cm mixtures, chloride ingress is much faster (as the Da is exponentially higher), and a shorter exposure time (38 days) prevents the chloride front from reaching the sealed boundary and invalidating the one-dimensional diffusion assumption.
It is important to note that the calculated Da is a material property derived from the shape of the chloride concentration–depth profile and is theoretically independent of the exposure duration, provided the diffusion process is Fickian and the surface concentration remains constant. The scaling of exposure time is a common and standard practice in bulk diffusion testing to ensure the quality and reliability of the profile data. While the different durations introduce a minor practical variation, the rigorous regression analysis used to determine Da accounts for the time variable (t) explicitly. The results will be comparable across mixtures because Da is extracted from the model fit, which is a measure of the intrinsic transport rate of the material, not the total chloride ingress.

2.4.3. Chloride Profiling and Da Calculation

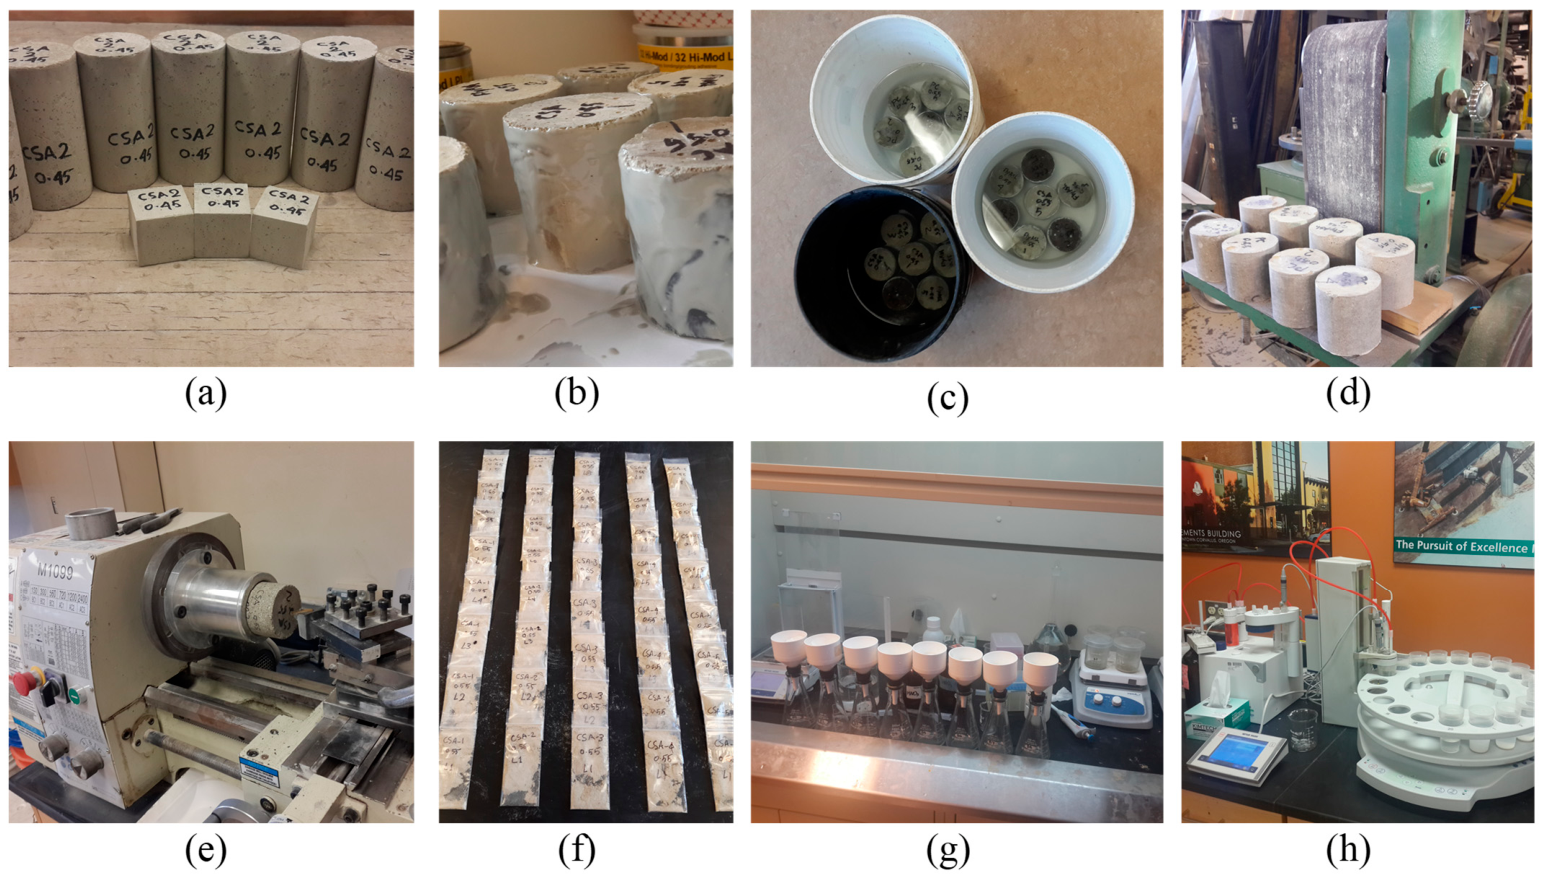
Upon completion of the exposure period, the epoxy coating was sanded, and the specimens were axially ground, starting from the exposed surface, using a bench lathe grinding apparatus. Incremental layers were milled to a depth of at least 20 mm at resolutions of 0.5 mm for the first 1 mm, 1.0 mm for the next 8 mm, and 2.0 mm for the remaining depth. The depth of the grinding for each layer is specified in ASTM C1556 [3] based on the w/cm. The powder from each depth increment was collected and analyzed for acid-soluble chloride content as per ASTM C1152 [5]. The test setup of ASTM C1556 is shown in Figure 2. The resulting chloride concentration profile (concentration vs. depth) was then fitted to the error-function solution of Fick’s second law of diffusion Equation:
C ( x , t ) = C s ( C s C 0 )   erf   ( x 2 D a t )
where C(x,t) is the chloride concentration at depth x and time t, Cs is the surface concentration, C0 is the initial background concentration, and (erf) is the error function. The apparent chloride diffusion coefficient (Da) was obtained through non-linear regression analysis, providing a direct quantitative measure of the resistance to chloride ingress for each w/cm ratio and cement type.

2.5. Experimental Design and Statistical Analysis

The experimental design consisted of a full two-factor, three-level factorial design with five replications. The two controlled factors were (1) the cement system with three levels: OPC, Calcium CAC, and CSA; and (2) the water-to-cementitious materials ratio (w/cm), with three levels: 0.45, 0.55, and 0.65. This 3 × 3 design resulted in nine unique treatment combinations. Each combination was replicated five times (n = 5), yielding a total of N = 3 (cement types) × 3 (w/cm ratios) × 5 (replicates) = 45 mortar specimens. Each of the 45 specimens was subjected to precision profile grinding. A total of eight incremental powder samples were obtained from each specimen at defined depth intervals, resulting in a comprehensive dataset of 45 specimens × 8 layers/specimen = 360 individual powder samples. The acid-soluble chloride content (% by mass of cement) for each of these 360 samples was determined in strict accordance with ASTM C1152 [5]. The generated chloride concentration–depth profile for each of the 45 specimens served as the primary data for the subsequent inverse analysis. This robust design provides sufficient degrees of freedom for analyzing the main and potential interaction effects between the factors on the response variable, the apparent chloride diffusion coefficient (Da).
For each specimen, the apparent diffusion coefficient (Da) and surface chloride concentration (Cs) were estimated via non-linear regression by fitting the experimental chloride profile to the error-function solution of Fick’s second law (mentioned in Section 2.4.3).
The regression was performed by minimizing the sum of squared errors (SSE) between the measured chloride concentrations and the model-predicted values. This least-squares optimization was executed using the Generalized Reduced Gradient (GRG) non-linear algorithm, a solver methodology designed for non-linear problems. The GRG algorithm operates by iteratively calculating the gradient of the objective function (SSE) with respect to the parameters (Da, Cs) to locate the optimum where the partial derivatives approach zero. The inverse error function required for the model calculation was implemented within the optimization routine using the NORM.S. INVERSE function in Microsoft Excel, which provides an accurate numerical approximation. This methodology is explicitly endorsed and detailed in ASTM C1556 [3] for the interpretation of bulk diffusion test results.
The outcome of the regression for each specimen was a set of fitted parameters (Da). For each of the nine treatment combinations, the five replicate values of Da were treated as a sample population. A two-factor Analysis of Variance (ANOVA) was employed to statistically quantify the significance of the main effects (cement type, w/cm ratio) and their interaction effect on the mean log (Da) values, a transformation often applied to normalize the distribution of diffusion coefficients. Post hoc pairwise comparisons (e.g., Tukey’s Honest Significant Difference test) were subsequently conducted to identify which specific means within the cement systems and w/cm ratios were statistically significantly different from each other at a confidence level of α = 0.05. This rigorous statistical framework ensures that the reported differences in performance between systems are objectively validated and not due to random experimental variations.

3. Results and Discussion

3.1. Chloride Diffusion Model-Fitting Analysis

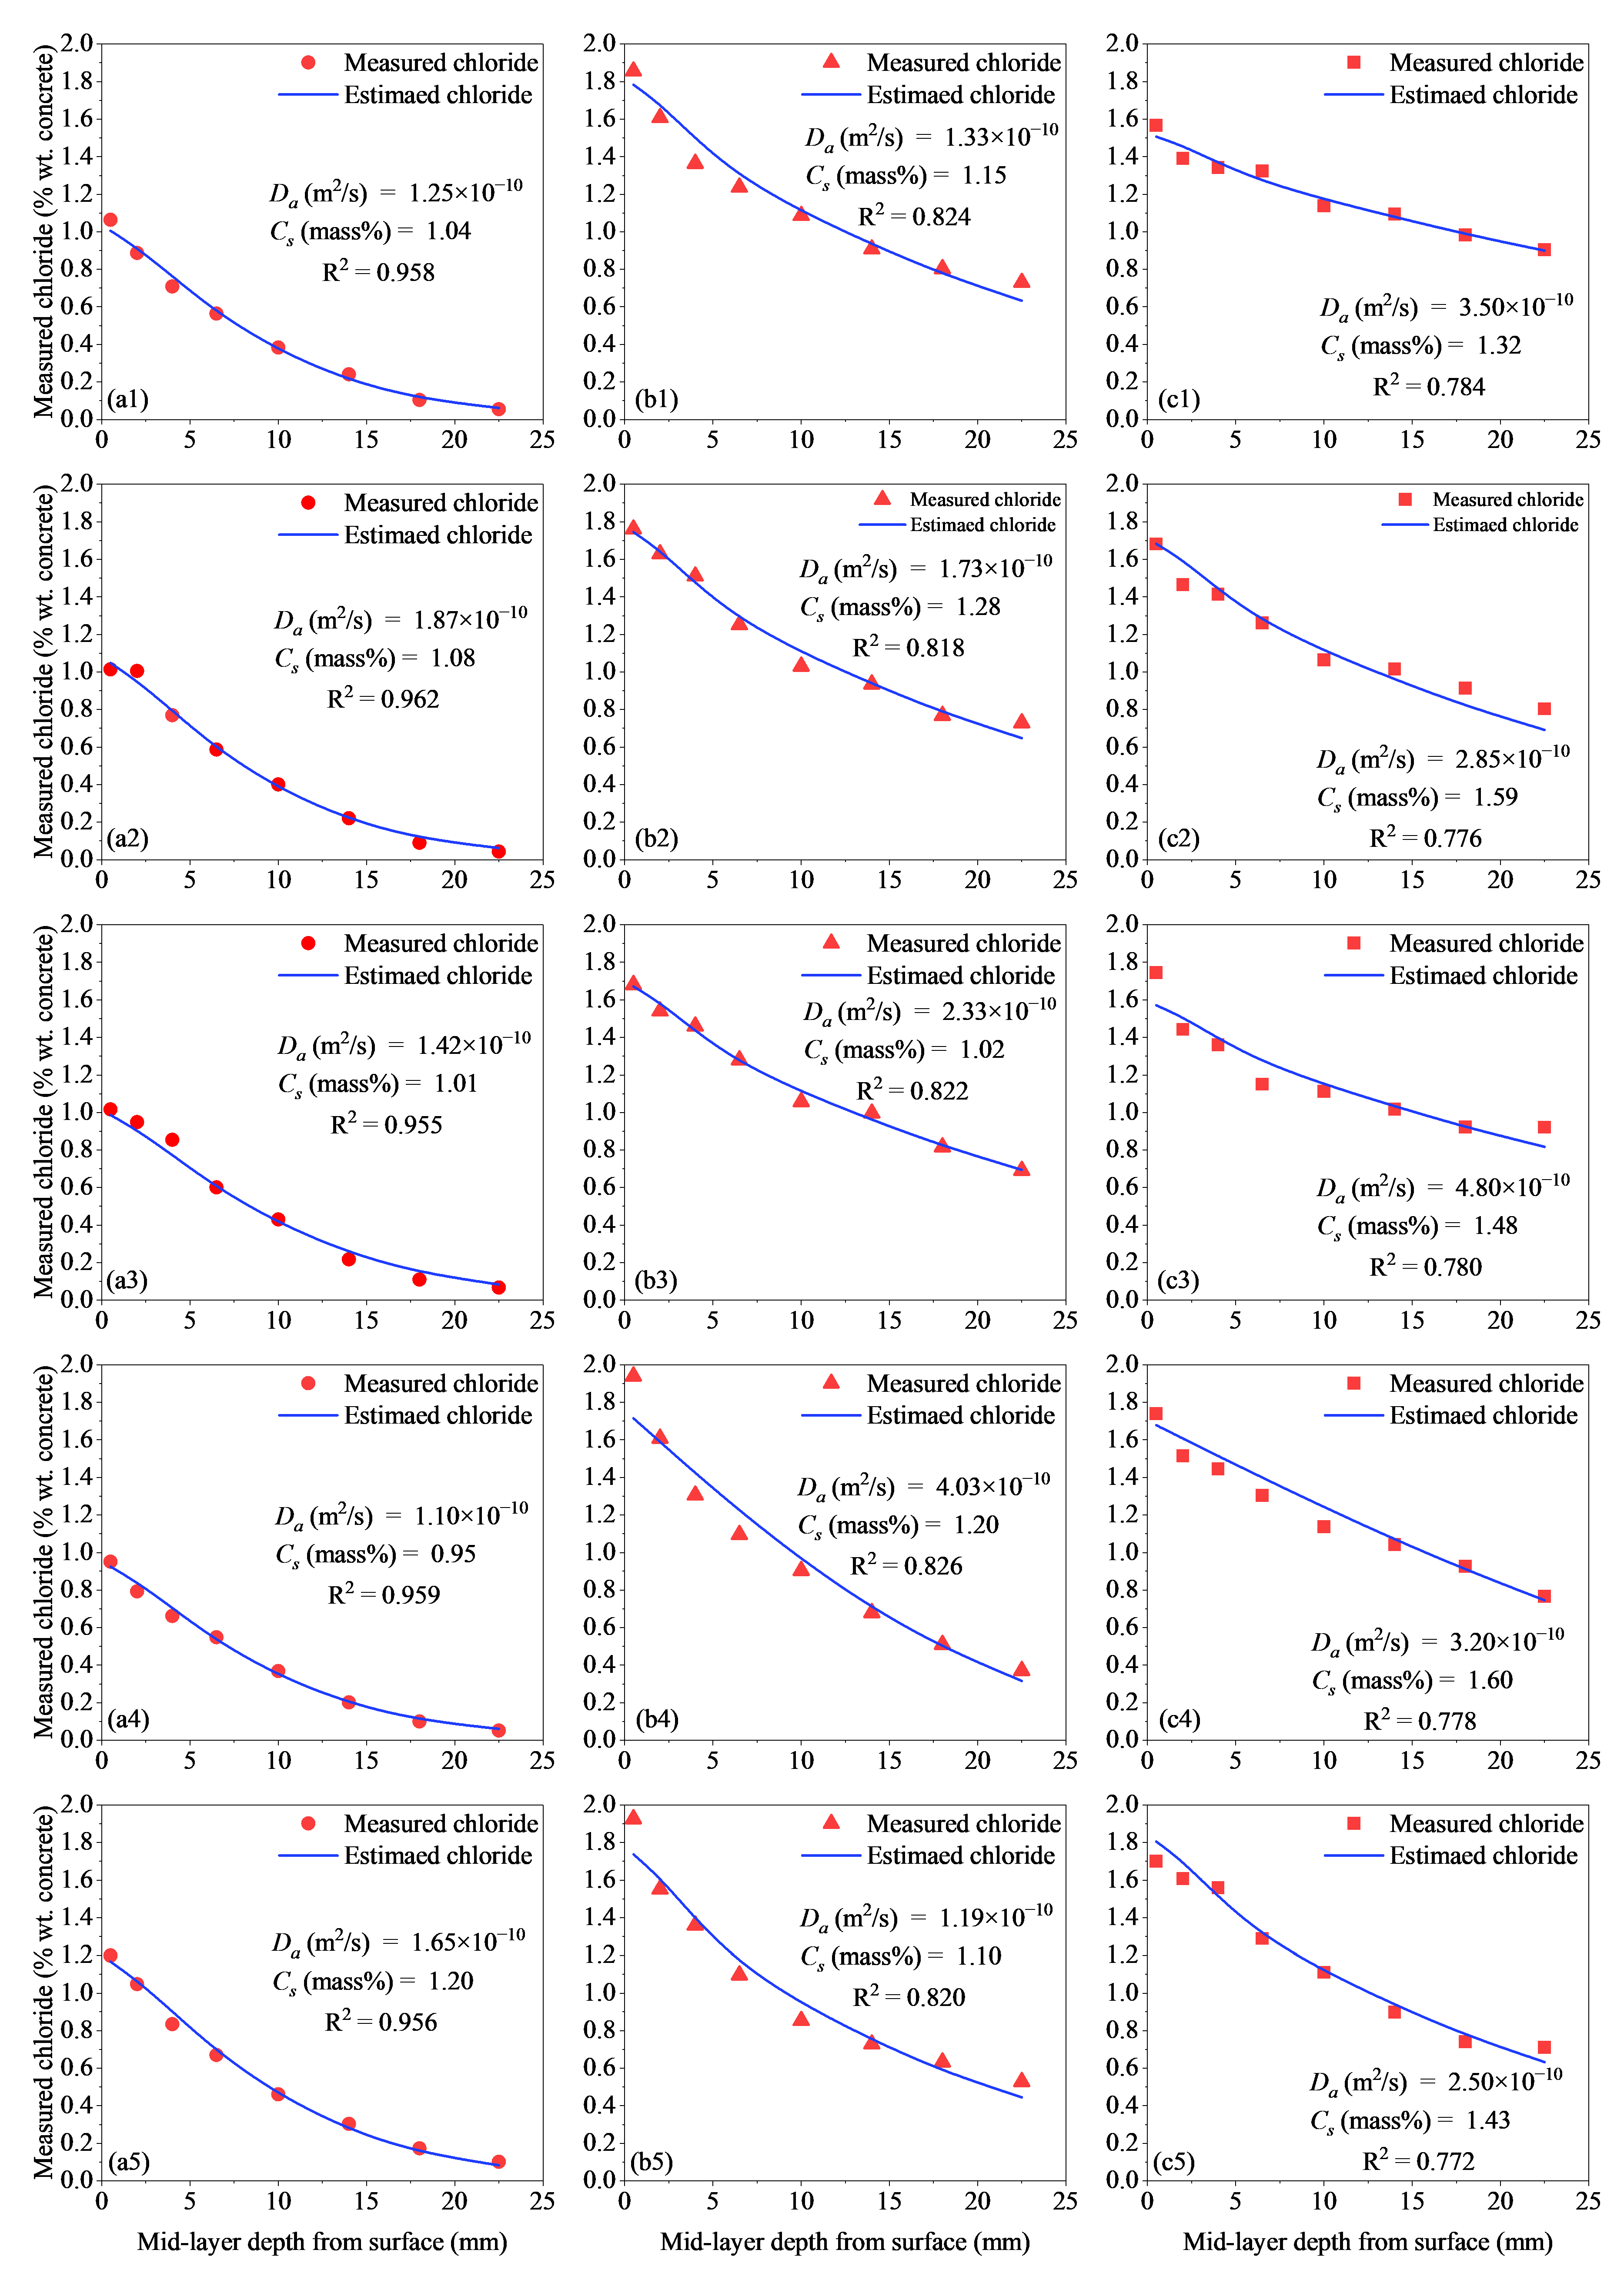
The chloride diffusion behavior was characterized by fitting the measured concentration profiles to Fick’s second law solution, enabling determination of the apparent chloride diffusion coefficient (Da) and surface chloride concentration (Cs). The quality of the model fit serves as a diagnostic indicator of whether chloride transport follows ideal Fickian behavior or is modified by non-steady-state phenomena such as ongoing hydration, phase instability, or non-linear binding. For clarity and brevity, the chloride concentration profiles presented in Figure 3, Figure 4 and Figure 5 are representative fits selected from one replicate specimen per treatment combination. The full statistical analysis presented in Section 3.2 is based on the complete dataset of 45 specimens (n = 5 per treatment), and the mean log Da values are reported in Figure 6.

3.1.1. Model-Fitting Quality as a Diagnostic Indicator

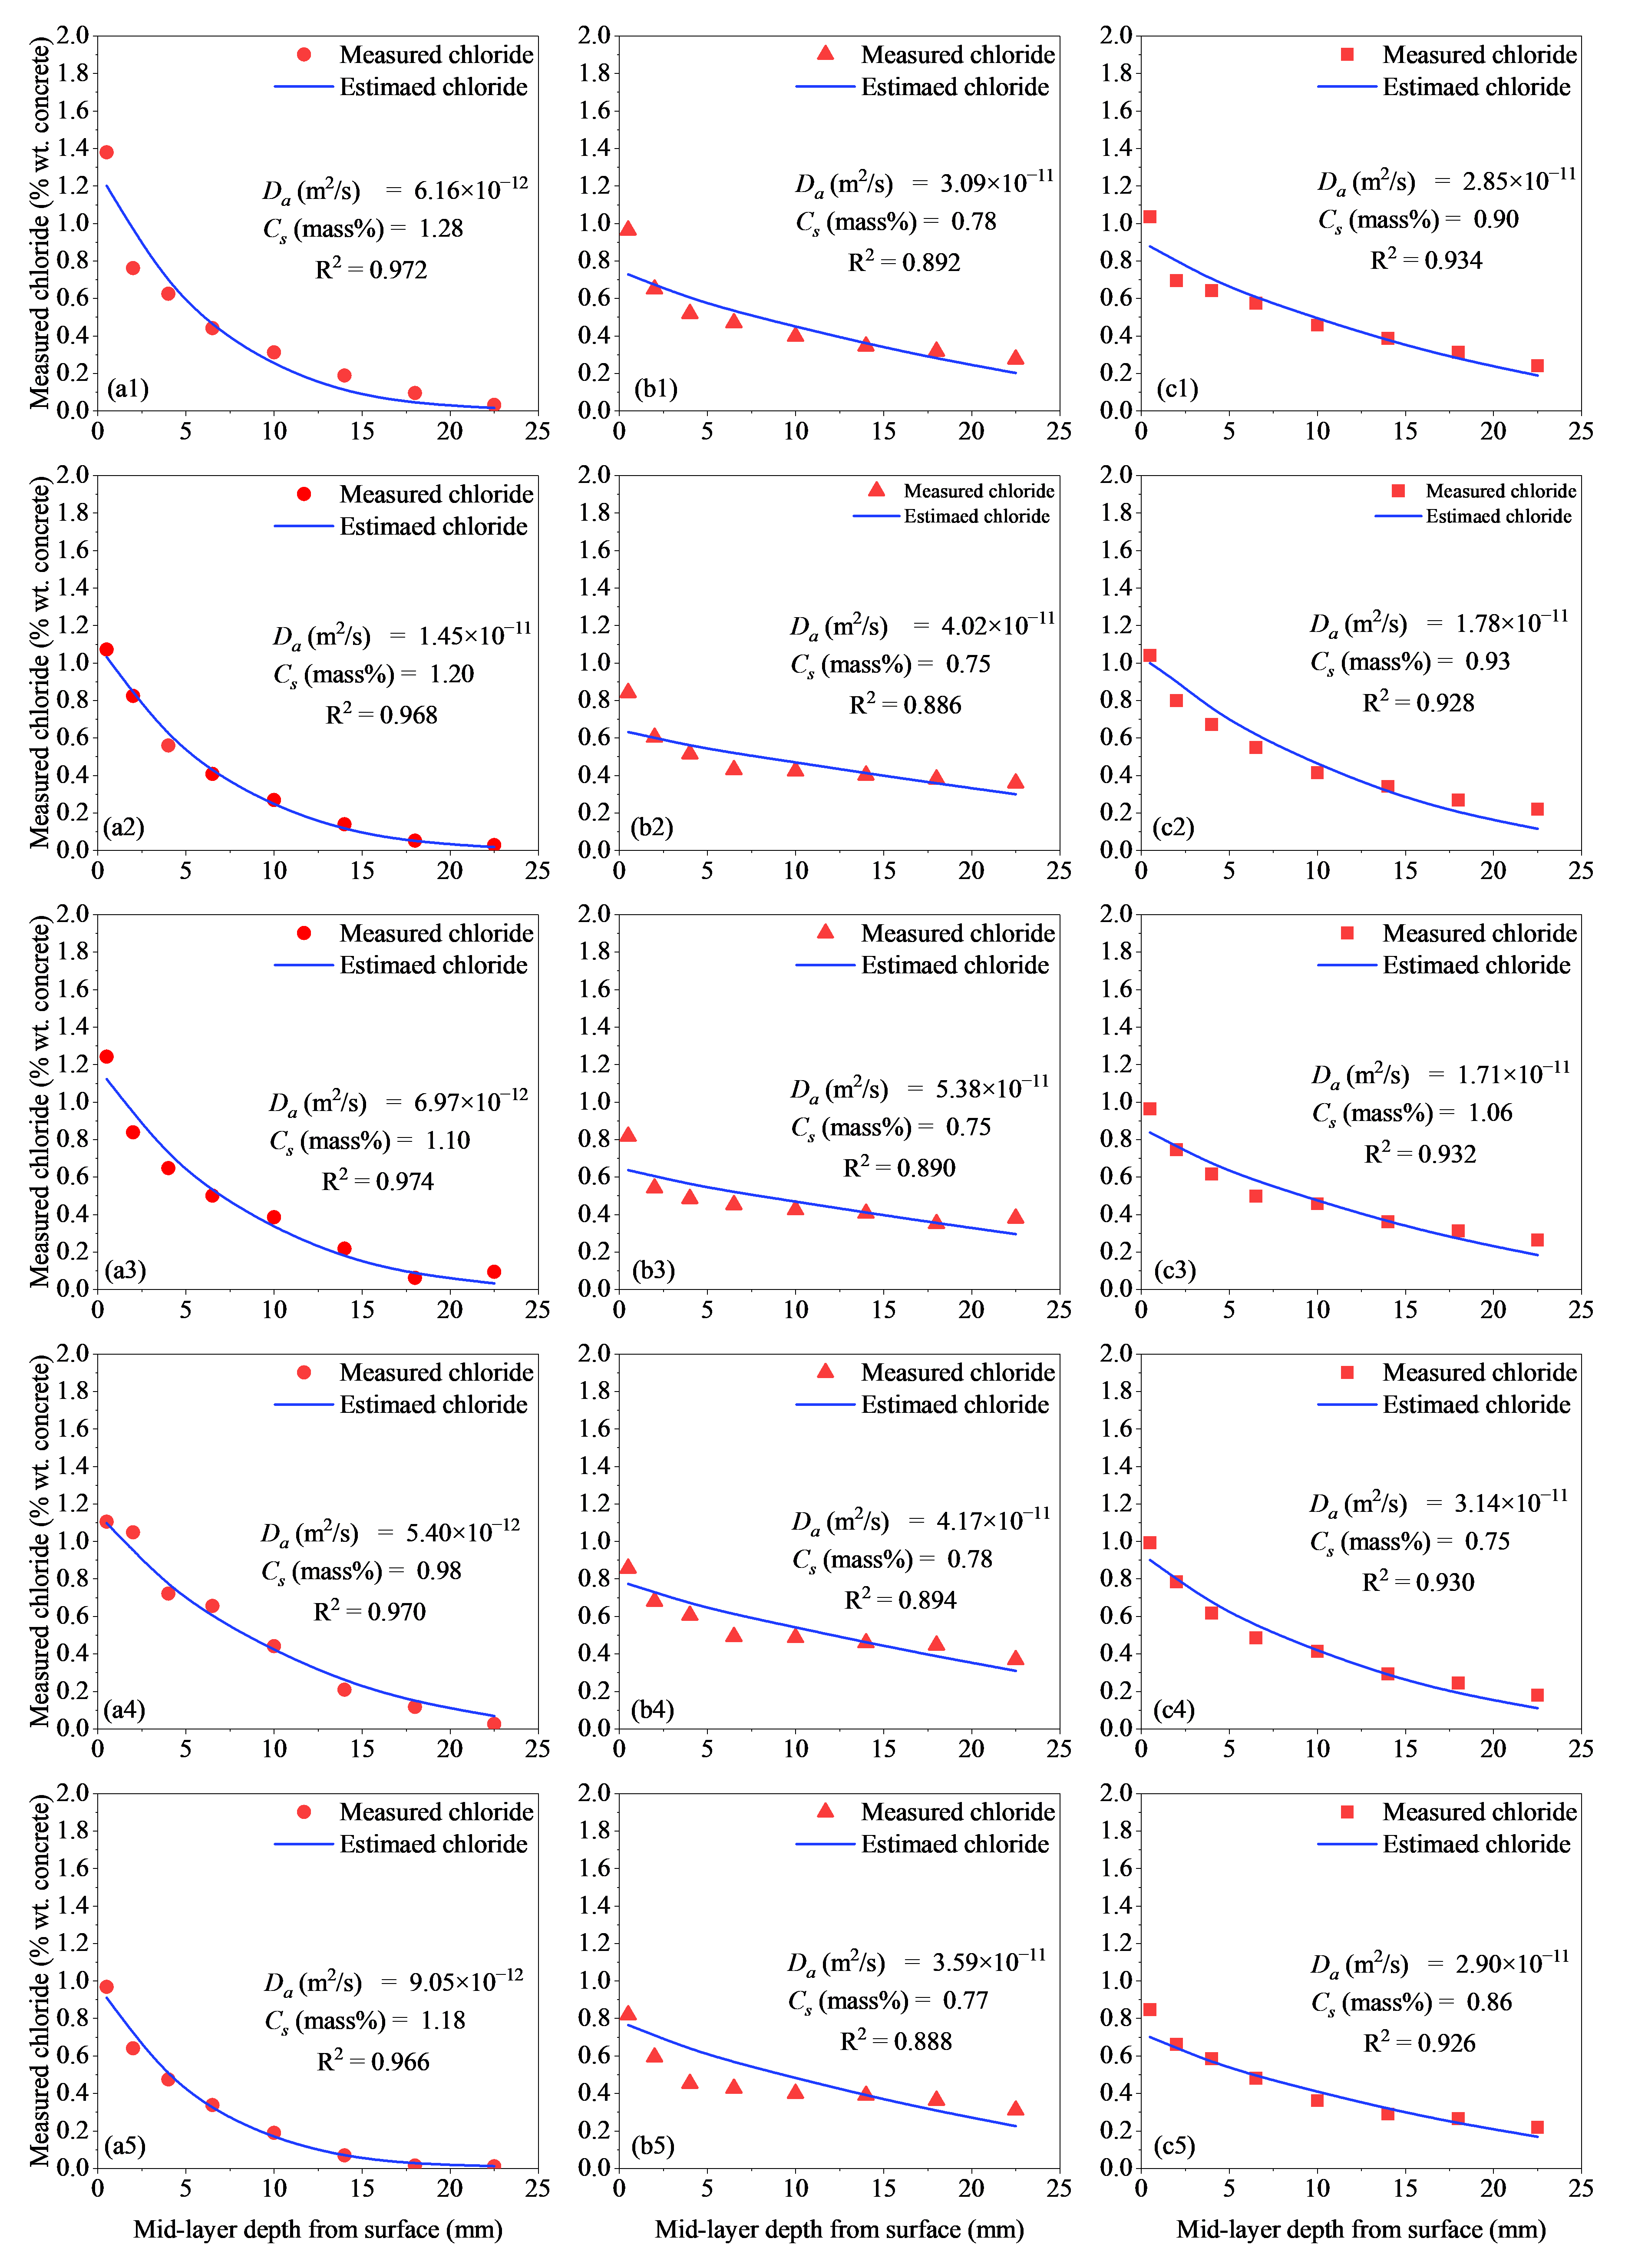
The goodness-of-fit for the Fickian diffusion model varied systematically with both cement type and w/cm ratio, revealing distinct mechanistic regimes. At the lowest w/cm ratio of 0.45, as shown in Figure 3, all three systems exhibited relatively low Da values, but the quality of the model fit revealed fundamental differences in their transport mechanisms. OPC demonstrated excellent agreement between the measured and estimated chloride profiles, indicating that transport in well-hydrated, low-porosity OPC paste is predominantly Fickian diffusion [4,6]. CAC exhibited increased scatter around the fitted curve, probably attributable to its time-dependent microstructure undergoing conversion from metastable hydrates (CAH10, C2AH8) to stable C3AH6 [10]. This ongoing evolution violates the constant-Da assumption inherent to the steady-state Fickian model. CSA displayed a distinct systematic deviation where the model overestimated surface chlorides and underestimated the deeper penetration pattern, a characteristic of strong non-linear chloride binding, where high binding capacity at the surface reduces free chloride concentrations while deeper penetration proceeds through binding-saturated regions [12,30].
As the w/cm increased to 0.55, as shown in Figure 4, the diagnostic value of the fit quality became more pronounced. OPC maintained reasonable fit quality but developed systematic overestimation at intermediate depths, reflecting increased microstructural heterogeneity from expanded capillary porosity [31]. CAC unexpectedly showed an improved fit quality compared to its 0.45 counterpart, suggesting that conversion may have progressed to a more stable phase assemblage at this specific water content, creating a less time-dependent microstructure. CSA, conversely, exhibited severely deteriorated fit quality with pronounced systematic deviation, probably indicating that the ettringite matrix was becoming unstable at higher water contents [30,32].
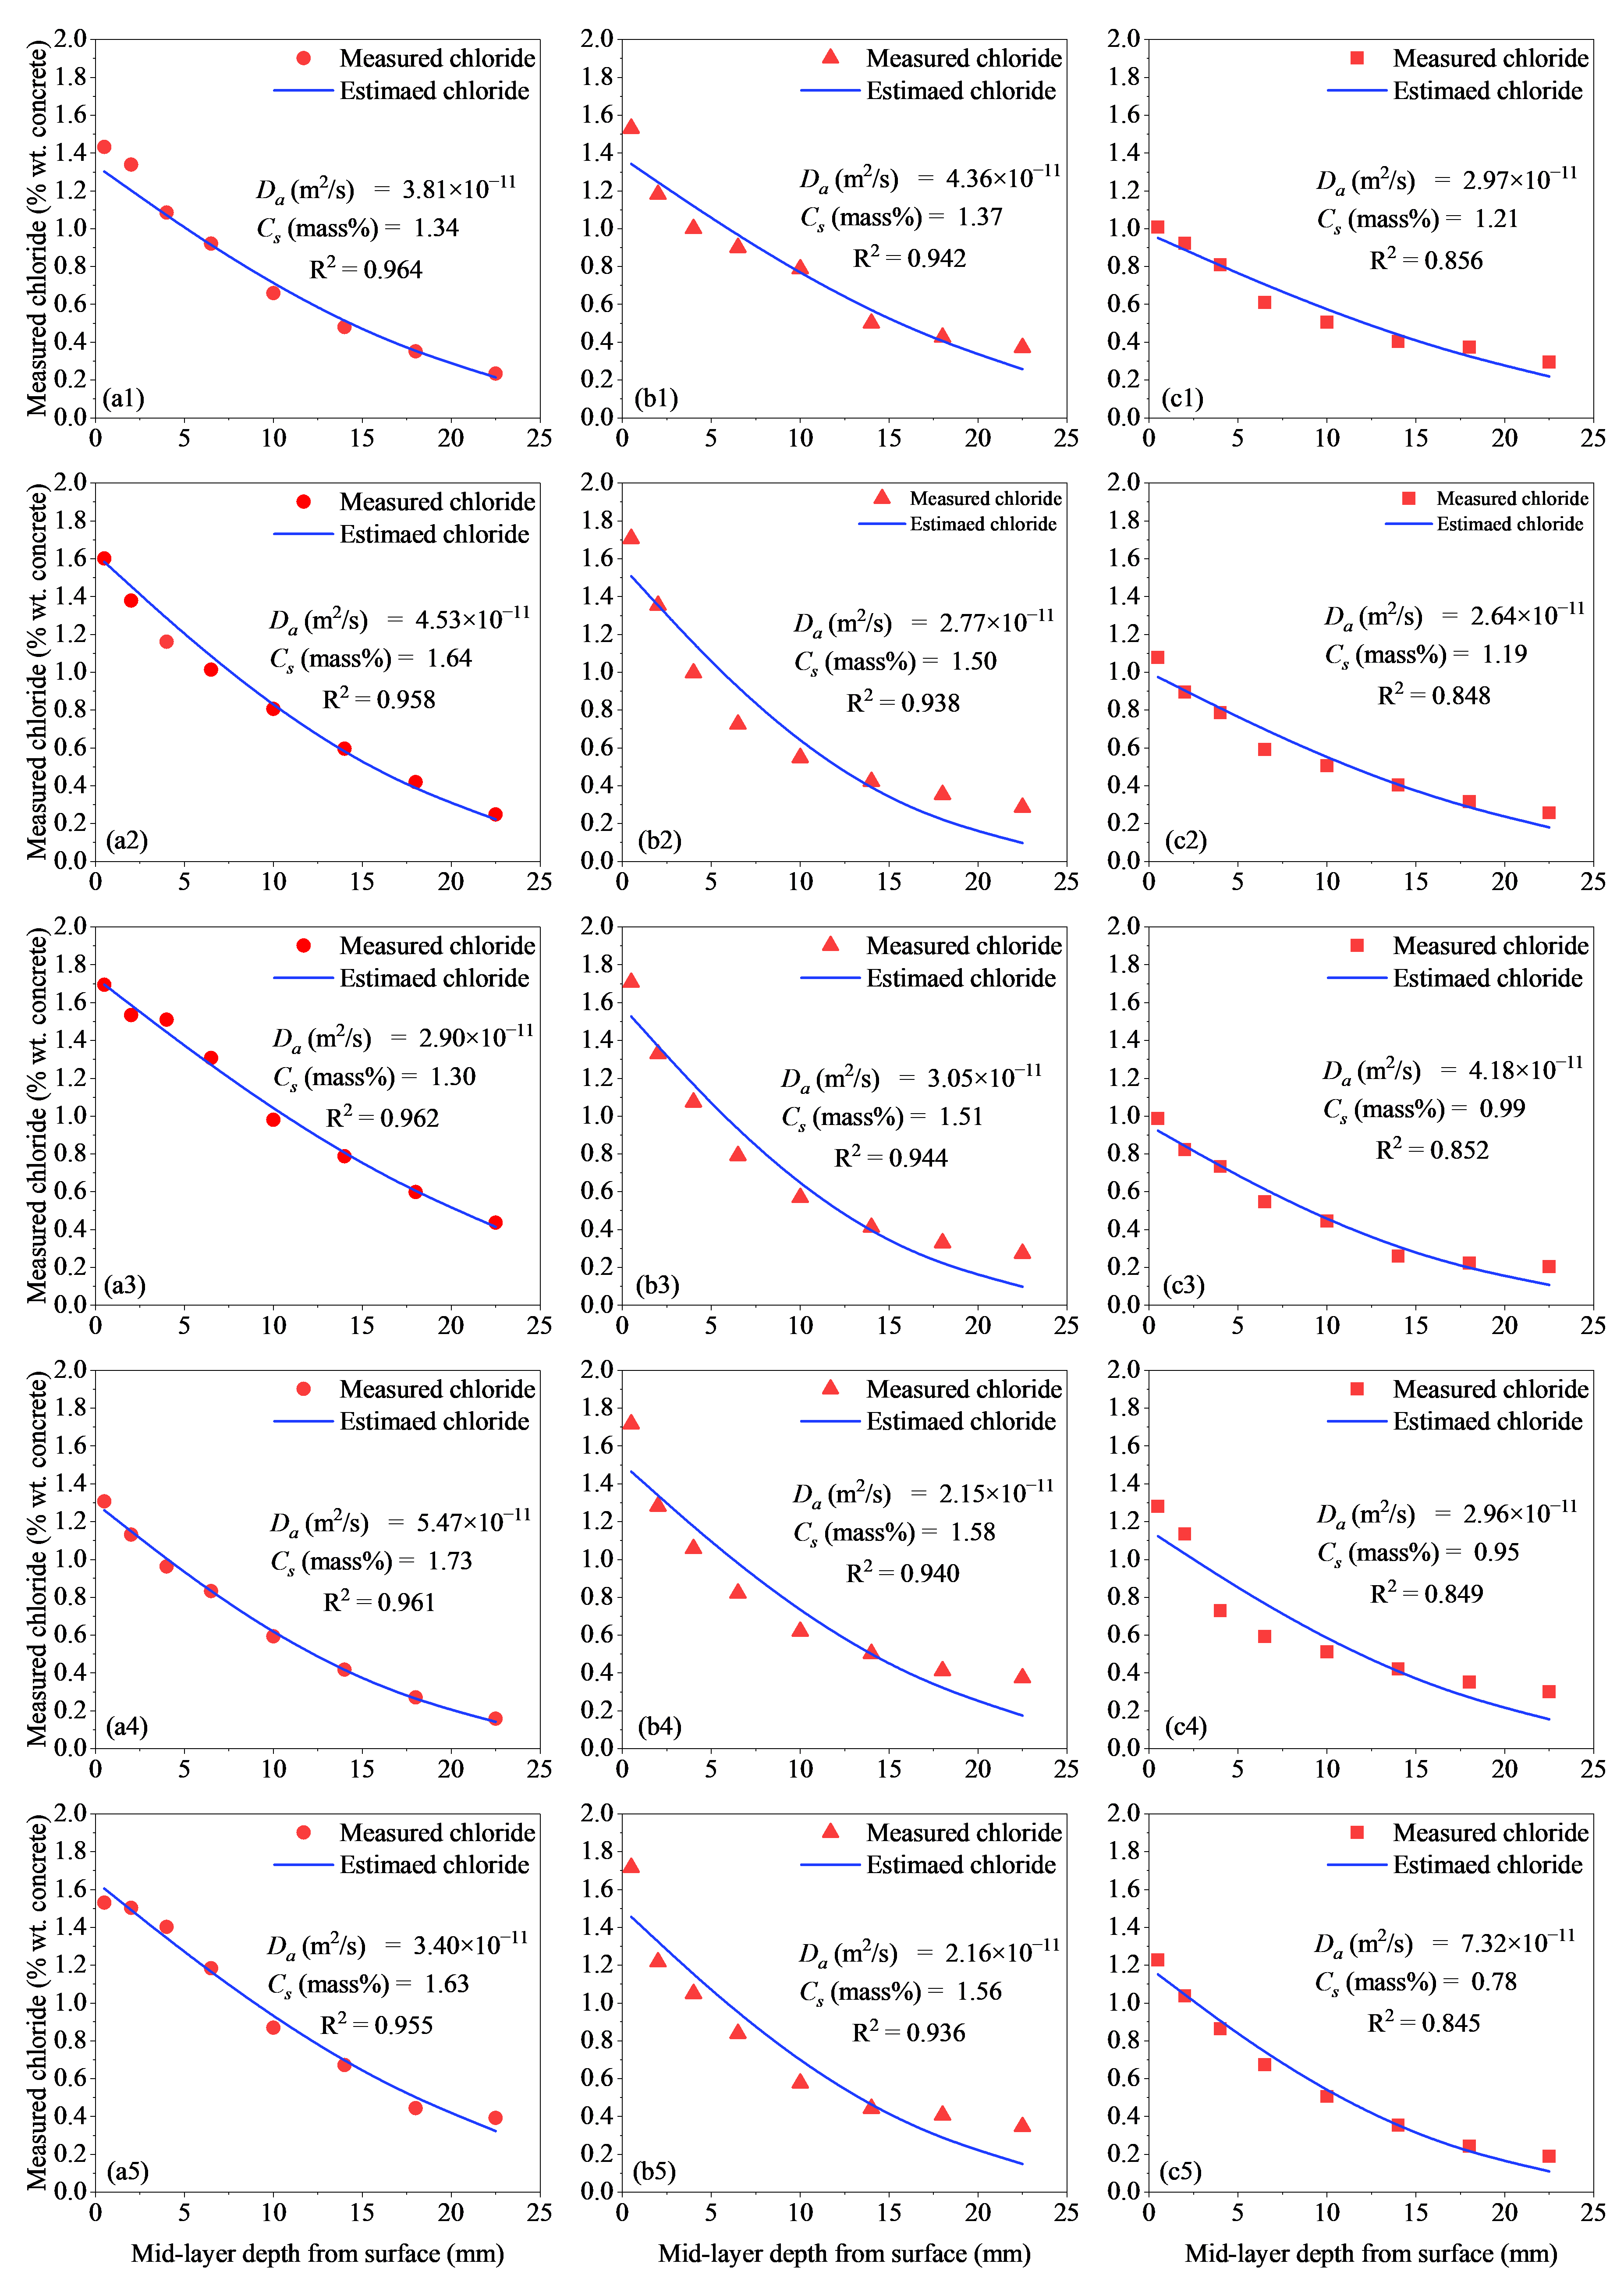
At w/cm = 0.65, the fit quality delineated distinct failure thresholds, as shown in Figure 5. OPC retained moderate fit quality despite increasing deviations, confirming predictable porosity-driven degradation. CAC fit quality collapsed completely, with significant scatter and systematic deviations marking a critical failure point where predictable conversion-induced porosity overwhelmed microstructural stability. CSA exhibited severe fit failure; the model estimation became completely disconnected from measured data, signifying a predictable total breakdown of the ettringite matrix and invalidating the Fickian diffusion framework entirely.
The progression of fit quality across w/cm ratios establishes that for CSA, deterioration in model fit is a leading indicator of microstructural instability that precedes dramatic increases in Da. This finding has critical implications: standard diffusion testing protocols that rely solely on Da values without assessing fit quality may underestimate the vulnerability of sensitive binder systems.
To systematically assess the validity of the Fickian diffusion model, the coefficient of determination (R2) for each profile fit was analyzed (Table 3). A high R2 (close to 1.0) indicates that chloride transport is well-described by steady-state diffusion with a constant surface concentration and a constant Da. The R2 values provide a quantitative basis to evaluate the severity of non-Fickian behavior.
For OPC, the R2 values remained consistently high (>0.96) across all w/cm ratios, with minimal variation between replicates (SD = 0.003), confirming that capillary porosity is the dominant and stable transport mechanism. In contrast, CSA exhibited a systematic decrease in R2 with increasing w/cm. At w/cm = 0.45, the R2 value ranged from 0.926 to 0.934 (mean = 0.930), indicating good fit quality. However, at w/cm = 0.65, the R2 dropped dramatically to a range of 0.772 to 0.784 (mean = 0.778), reflecting significant microstructural instability and a breakdown of the protective ettringite matrix. The R2 was statistically correlated with w/cm for CSA (Pearson r = −0.72, p < 0.05), indicating that model fit deterioration is a leading indicator of degradation, with a statistically significant negative correlation between R2 and w/cm.
Similarly, CAC showed a non-monotonic trend, with the highest fit quality at w/cm = 0.55 (R2 range: 0.936–0.944, mean = 0.940), coinciding with its optimal performance and suggesting a temporary stabilization of the hydrate phases. At w/cm = 0.45, the R2 values were moderate (mean = 0.890), while at w/cm = 0.65, they decreased substantially (mean = 0.822), reflecting the disruptive effects of conversion-induced porosity. The consistency of R2 across replicates (SD = 0.003–0.004) demonstrates the reproducibility of the observed trends.
This quantitative analysis provides strong statistical evidence that the shape of the chloride profile is a sensitive indicator of the underlying phase transformations. The R2 values representing the coefficient of determination for the error-function fit of Fick’s second law to the experimental chloride concentration profiles for each individual replicate specimen serve as a diagnostic tool that can detect microstructural instability before dramatic increases in Da are observed.

3.2. Statistical Analysis of Chloride Diffusion Parameters

3.2.1. Two-Way Analysis of Variance (ANOVA)

A full-factorial two-way Analysis of Variance (ANOVA) was conducted on log-transformed Da values to evaluate the effects of the cement type and w/cm ratio. The analysis revealed statistically significant main effects for both cement types (F [2, 36] = 118.45, p < 0.001) and the w/cm ratio (F [2, 36] = 380.18, p < 0.001), along with a highly significant interaction effect (F [4, 36] = 44.47, p < 0.001). The significant interaction confirms that the influence of w/cm on chloride diffusivity is not uniform across cement systems but depends fundamentally on cement chemistry, a central tenet of the cement chemistry–microstructure–transport logic [8,12].

3.2.2. Performance Hierarchies from Post Hoc Analysis

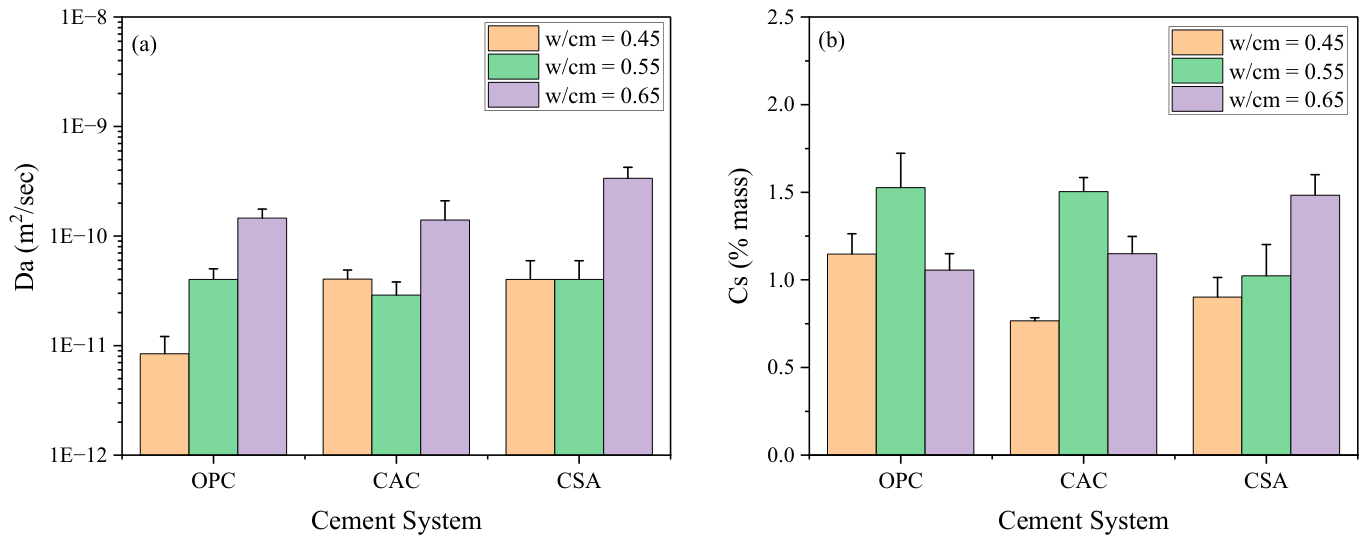
Post hoc pairwise comparisons using Tukey’s HSD test (α = 0.05) revealed distinct performance hierarchies that reorganized systematically with w/cm (Table 1, Figure 6a). At w/cm = 0.45, OPC demonstrated superior chloride resistance with the lowest mean log Da (−11.15), followed by CSA (−10.51) and CAC (−10.40). This hierarchy reflects the dense, well-hydrated OPC microstructure at a low water content, CSA’s rapid ettringite formation creating a fine pore network [12], and CAC’s conversion-induced porosity already beginning to affect transport [10].
At w/cm = 0.55, the performance of OPC and CAC converged into statistically equivalent groups (log Da = −10.28 and −10.26, respectively), while CSA (log Da = −10.35) showed initial signs of degradation but remained statistically distinct from the degraded group. At w/cm = 0.65, CSA exhibited catastrophic performance loss, forming its own statistical group with the highest mean log Da (−9.48), which was significantly worse than all other cement–w/cm combinations.

3.2.3. Surface Chloride Concentration

The surface chloride concentration (Cs) exhibited distinct trends across cement systems (Figure 6b). OPC displayed a non-monotonic trend, peaking at w/cm = 0.55 (1.53 mass%) before declining to 1.06 mass% at w/cm = 0.65, suggesting optimal chloride binding at moderate water contents through Friedel’s salt formation [33,34]. CAC showed a steady increase in Cs from 0.77 to 1.15 mass% across the w/cm range, indicating evolving binding capacity that is potentially related to phase transformation processes [10]. CSA exhibited the most dramatic Cs increase, from 0.90 to 1.48 mass% with increasing w/cm, suggesting that a deteriorating microstructure transitions from chemical binding dominance at a low w/cm to physical entrapment mechanisms as the protective ettringite matrix breaks down [8,30]. This shift explains the paradoxical combination of increasing Cs and Da at the highest w/cm: as chemical binding capacity declines, physical trapping in the porous network becomes the dominant chloride retention mechanism.

3.3. Microstructural Mechanisms Governing Transport

3.3.1. Pore Structure Evolution and Diffusivity

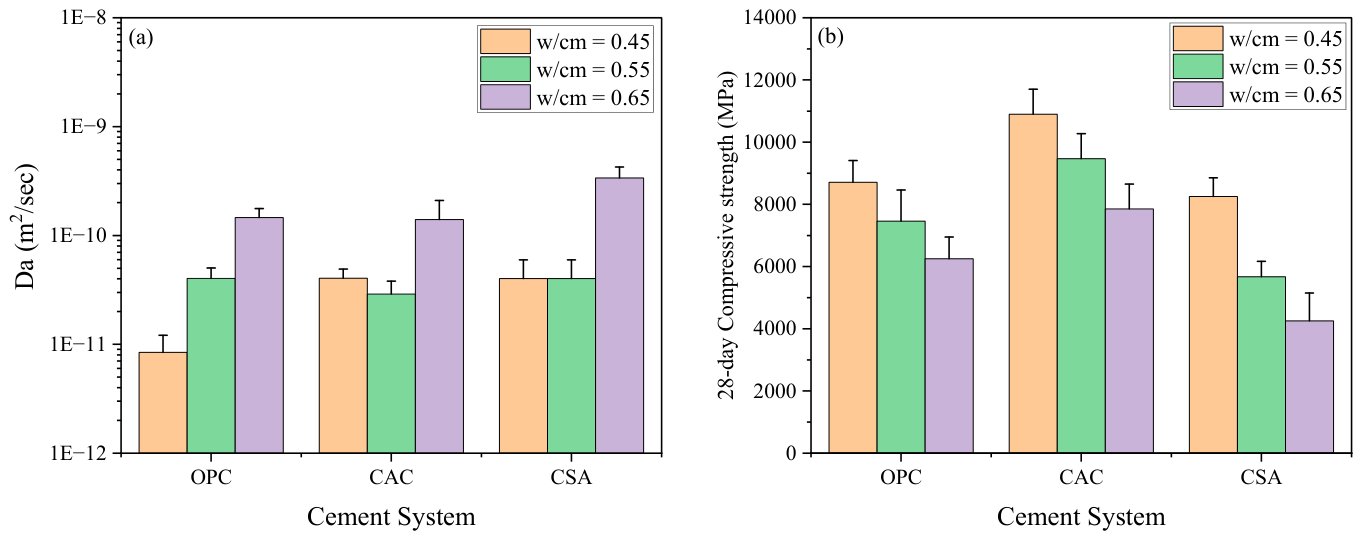
The observed Da trends find mechanistic explanation in the distinct pore structure evolution pathways of each binder system. For OPC, the exponential increase in Da with w/cm (8.42 × 10⁻¹² to 1.46 × 10⁻¹⁰ m2/s from w/cm 0.45 to 0.65) follows classical porosity–diffusivity relationships [13,31]. The capillary pore network, whose volume and connectivity are primarily functions of initial water-filled space, provides the dominant transport pathway [32]. The well-established inverse correlation between strength and diffusivity in OPC (Figure 7) reflects this porosity-driven mechanism.
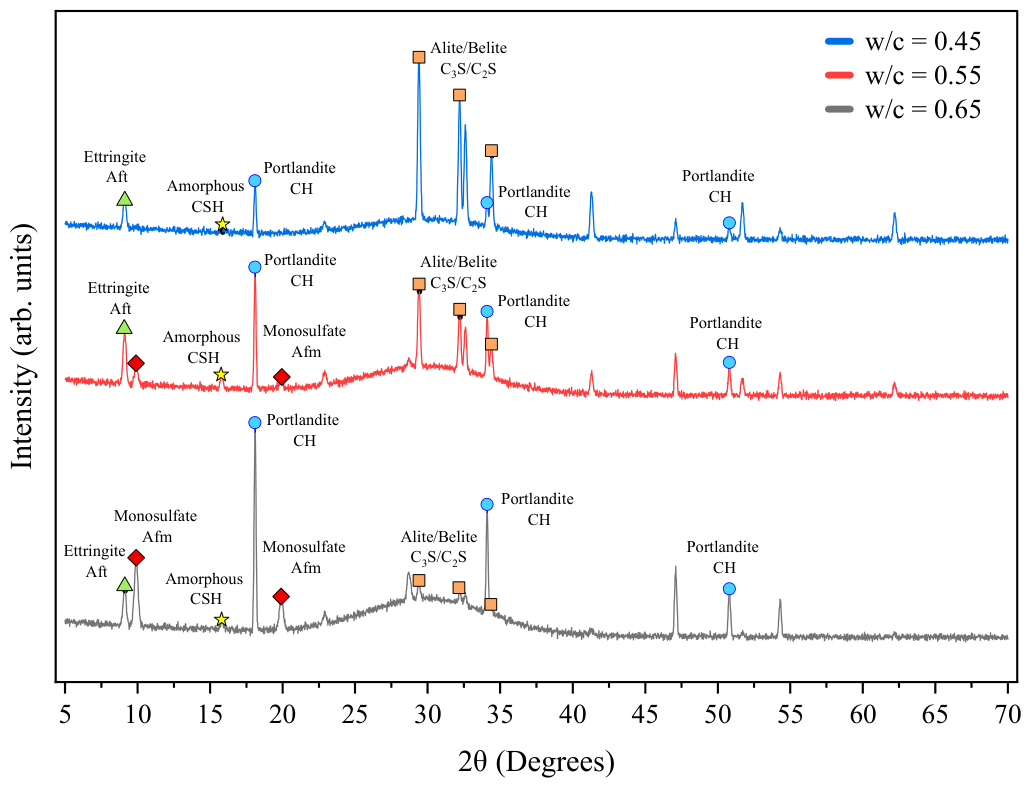
Increasing the water-to-cementitious material (w/cm) ratio from 0.45 to 0.65 significantly alters the physical environment inside cement pastes, affecting the degree of hydration, phase morphology, and capillary porosity that influences the chloride diffusion rate. X-ray diffraction (XRD) is used to provide definitive evidence of how the w/cm directly governs the hydration degree, phase assemblage, and transport mechanisms in different cement systems by tracking the consumption of unhydrated clinker phases and the formation of crystalline hydrates [35,36].
Figure 8 shows a comparison of three XRD patterns for ordinary Portland cement (OPC) paste at different w/cm ratios. The w/cm ratio has a pronounced effect on hydration; as the ratio increases, the unhydrated clinker peaks (C3S, C2S) diminish while the peaks for portlandite (Ca(OH)2) and ettringite (AFt) intensify, as the excess water enables a greater degree of clinker reaction and crystalline hydration product formation [35,37].
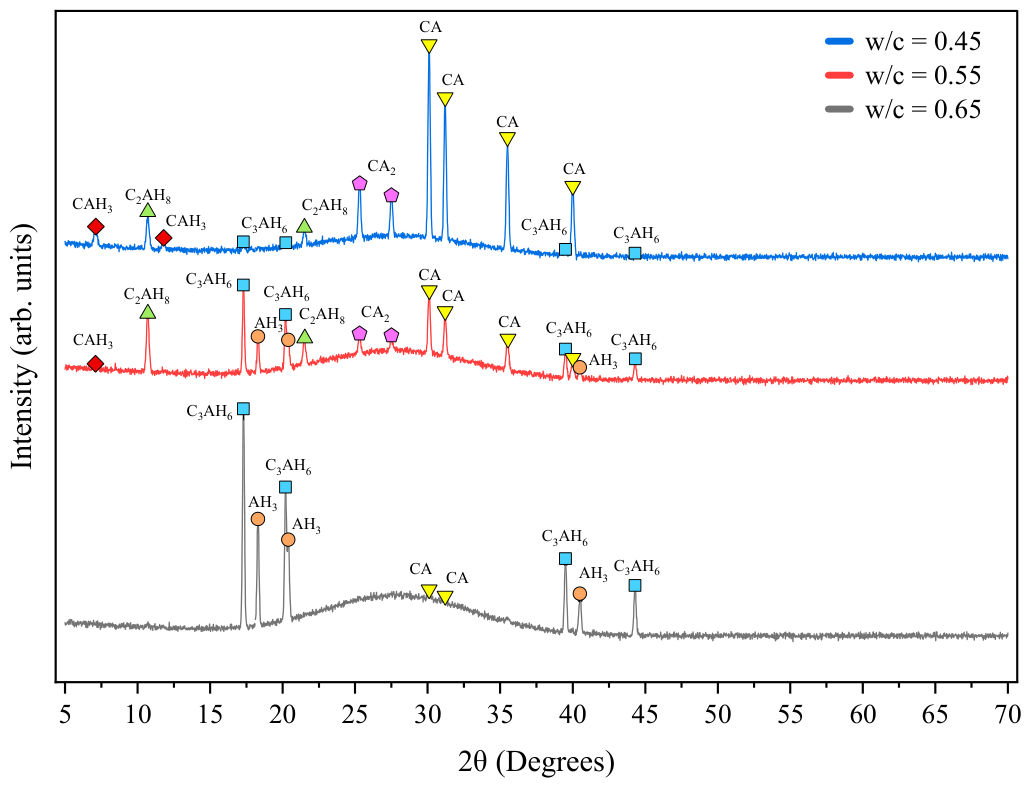
CAC’s non-monotonic Da response—decreasing from 4.05 × 10⁻¹¹ to 2.90 × 10⁻¹¹ m2/s as w/cm increased from 0.45 to 0.55 and then surging to 1.40 × 10⁻¹⁰ m2/s at w/cm 0.65—reflects the complex conversion characteristics of calcium aluminate hydrates [10]. The metastable hexagonal phases (CAH10, C2AH8) formed at early ages convert to cubic hydrogarnet (C3AH6) and aluminum hydroxide (AH3) over time. At a low w/cm (0.45), this conversion creates additional porosity from released water, increasing permeability relative to the initial dense microstructure. At an intermediate w/cm (0.55), the conversion may reach a more stable phase assemblage with refined pore structure, temporarily decoupling the typically strong diffusion–strength relationship observed in OPC. At a high w/cm (0.65), conversion-induced porosity dominates, and the system converges with OPC’s highly porous state.
For calcium aluminate cement (CAC), a higher w/cm ratio not only increases clinker consumption (CA, CA2) but also significantly accelerates the thermodynamically driven “conversion” process, whereby water-rich, metastable hydrates (CAH10, C2AH8) dissolve and reprecipitate as dense, stable hydrates (C3AH6, AH3) [38,39,40]. This conversion, exacerbated by high w/cm ratios, is a key durability concern as it increases porosity [41,42]. It is important to note that CAC is highly sensitive to moisture loss during curing. While the second-stage curing at >95% RH was intended to facilitate proper conversion, any localized drying could potentially induce microcracking. This sensitivity underscores the practical challenges of using CAC in field applications where strict moisture control during curing is difficult to achieve. Figure 9 presents a comparison of three X-ray diffraction (XRD) patterns for calcium aluminate cement (CAC) paste at different w/cm ratios.
CSA’s severe failure at w/cm = 0.65 with Da increasing from ~4 × 10⁻¹¹ to 3.37 × 10⁻¹⁰ m2/s confirms the extreme water sensitivity of ettringite-based systems [30,31]. At a low w/cm, the voluminous formation of needle-like ettringite crystals creates a fine, dense, and disconnected pore structure with high tortuosity [8,12]. However, excess water at higher w/cm ratios is not consumed by hydration and leads to the formation of larger, more oriented, and potentially weaker ettringite crystals within a water-filled space, resulting in a coarser, more interconnected capillary network [43]. The delicate, protective ettringite matrix is effectively “diluted,” and the system transitions from a regime dominated by chemical binding to one governed by physical entrapment within a porous, degraded matrix [32,44]. This structural collapse fundamentally changes the material’s transport properties, validating literature warnings about CSA’s sensitivity to water content [17,45,46].
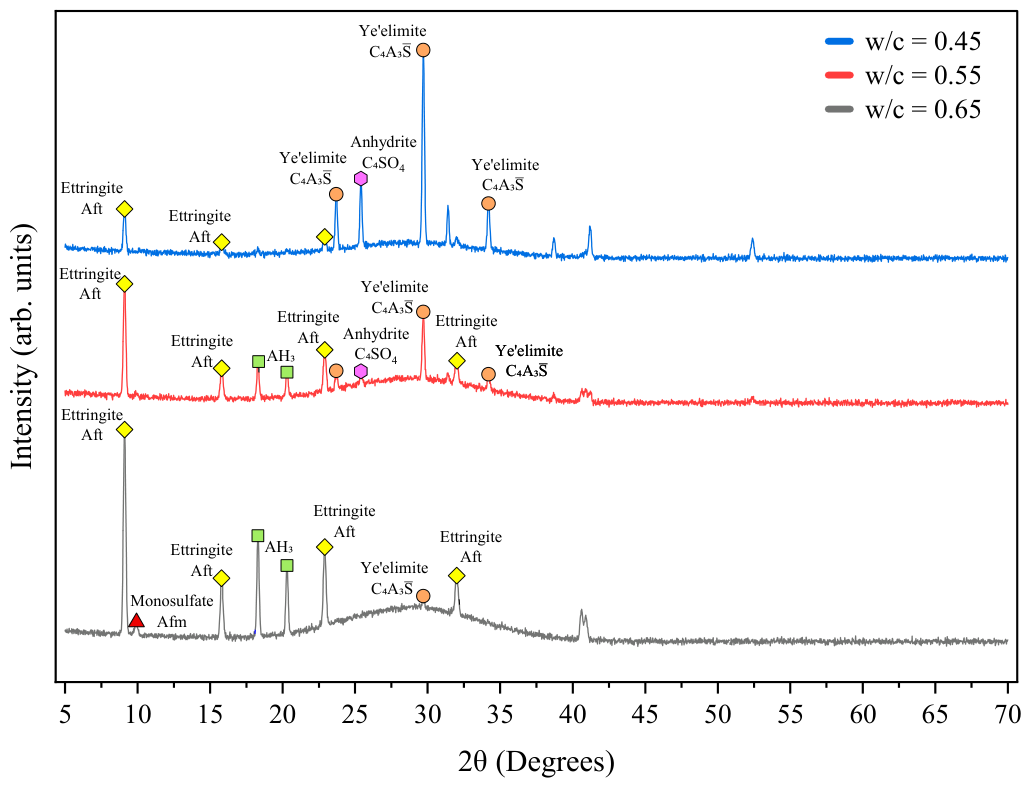
Just as with OPC and CAC, XRD tracks the consumption of raw clinker minerals and the growth of crystalline hydration products that govern transport. Because CSA cement has a unique chemistry designed to produce massive amounts of ettringite, its XRD progression looks distinctly different from the others, primarily driven by its extremely high water demand. Figure 10 shows a comparison of three X-ray diffraction (XRD) patterns for calcium sulfoaluminate (CSA) cement paste at varying water-to-cement (w/cm) ratios: 0.45, 0.55, and 0.65.
CSA cement exhibits the highest stoichiometric water demand, with approximately 32 moles of water required per mole of ettringite formed [47]. Consequently, at low w/cm ratios (0.45), hydration is incomplete, with significant residual ye’elimite (C4A3S) peaks, whereas at a w/cm of 0.65, ye’elimite is almost entirely consumed, resulting in maximum ettringite (AFt) and amorphous AH3 formation [45,48,49].
These diffractograms demonstrate that quantitative XRD analysis provides a robust, phase-specific understanding of how the w/cm ratio drives hydration and phase evolution that influence chloride transport in OPC, CAC, and CSA systems.
While the microstructural analysis in this study is primarily based on X-ray diffraction (XRD) to identify and quantify phase changes, it is important to acknowledge that chloride transport is ultimately governed by the physical pore network, including its total porosity, connectivity, and tortuosity. XRD is a powerful tool for tracking the formation of hydration products like ettringite, portlandite, or hydrogenate, and the consumption of clinker phases. These phase changes are the chemical drivers that indirectly define the pore structure. For instance, the conversion of metastable hydrates in CAC to denser cubic phases releases water and increases the overall volume, thereby increasing capillary porosity [10]. Similarly, excessive ettringite formation in CSA at high w/cm expands the solid volume but, if unconstrained, can lead to a weaker, more porous matrix [43]. Therefore, we use XRD to confirm the occurrence of these critical phase transformations and as a proxy to infer the resulting microstructural evolution. We acknowledge that XRD alone cannot provide a direct measurement of pore connectivity. Future work is intended to complement this study with direct pore structure characterization techniques such as Mercury Intrusion Porosimetry (MIP) and Scanning Electron Microscopy (SEM) to establish a direct quantitative link between pore characteristics and the measured D a . The use of XRD in this study serves to validate the hypothesized mechanistic pathways of degradation, not to provide a complete physical description of the transport network.

3.3.2. Decoupling of Transport and Mechanical Properties

The relationship between Da and compressive strength (Figure 7) further elucidates the distinct microstructural drivers in each system. OPC displays the expected inverse correlation: as w/cm increases, strength decreases and Da increases, reflecting coarsening capillary porosity [32]. CAC at w/cm = 0.55 demonstrates anomalous behavior, exhibiting a lower Da than the 0.45 mixture despite lower strength. This decoupling, justified by the XRD results, suggests that the formation of different hydrate phases can lead to pore structure refinements that do not monotonically correlate with w/cm, thereby breaking the typical diffusion–strength relationship observed in OPC [10]. CSA at w/cm = 0.65 exhibits the most extreme decoupling: an exceptionally high Da coupled with low strength, also justified by the XRD results, indicates a microstructure highly vulnerable to an increased water content, where the ettringite-based matrix lacks sufficient hydration product volume to bind water effectively and densify the system [12].
These findings demonstrate that high compressive strength does not automatically guarantee low chloride diffusivity, particularly for non-OPC systems. This has critical implications for durability-based designs: performance-based specifications must account for the unique permeability–strength relationship of the specific cementitious system employed, moving beyond prescriptive w/cm limits derived from OPC-centric models.

3.4. Summary of Key Findings

The results establish three distinct degradation regimes:
  • OPC: Predictable Porosity-Driven Degradation—Da increases exponentially with w/cm, following classical capillary porosity models. Transport is dominated by the connectivity of the capillary pore network, with fit quality remaining acceptable across all w/cm ratios.
  • CAC: Non-Linear Conversion-Mediated Response—An intermediate w/cm (0.55) unexpectedly improves Da due to stable phase assemblage formation, followed by severe degradation at w/cm 0.65 when conversion-induced porosity dominates. The diffusion–strength relationship decouples at an intermediate w/cm.
  • CSA: Severe Water-Sensitive Breakdown—Superior performance at a low w/cm (0.45) gives way to severe failure at w/cm 0.65, with Da increasing by an order of magnitude. Fit quality deterioration serves as a leading indicator of microstructural instability, preceding severe Da increases.
The significant interaction effect between cement type and w/cm confirms that durability performance emerges from the interplay between chemical composition and mixture proportioning, not from either factor alone. This necessitates cement-specific performance thresholds rather than universal w/cm limits.

4. Conclusions

This systematic study on mortars under controlled laboratory conditions provides critical quantitative data on how the cement type and w/cm ratio interact to influence chloride diffusion. While the findings are robust within the scope of this experimental program, the following limitations must be acknowledged before extrapolating directly to field concrete: First, it is important to note that this study employed different curing durations (28 days for OPC and CSA, and 38 days for CAC) to account for their distinct hydration and conversion kinetics. While this approach was necessary to achieve comparable maturity states, it introduces a methodological difference that may affect the absolute values of Da. Furthermore, this study was conducted on mortar specimens under controlled laboratory conditions, which may not fully replicate the complexities of field concrete. Future research should consider long-term exposure tests and full-scale concrete specimens to validate these findings. Second, this study employed a pure chloride solution under ideal isothermal curing, whereas field concrete is exposed to complex environmental conditions (e.g., wetting–drying cycles, carbonation, temperature variations). Third, while XRD provided critical insights into phase evolution, direct pore structure characterization (e.g., MIP, SEM) was not performed. Future work should combine these techniques to establish a direct quantitative link between pore characteristics and Da. With these limitations in mind, the following conclusions are drawn specifically for the controlled conditions investigated:
  • Cement type and w/cm exhibited significant interactions (p < 0.001), confirming that the effect of water content on chloride transport is fundamentally governed by cement-specific hydration chemistry and microstructural evolution pathways.
  • OPC demonstrated predictable porosity-driven degradation, with Da increasing exponentially with w/cm (8.42 × 10⁻¹² to 1.46 × 10⁻¹⁰ m2/s). Fickian model fit quality remains acceptable across all w/cm ratios, confirming transport dominated by capillary pore connectivity.
  • CAC exhibited a non-linear response with optimal performance at an intermediate w/cm 0.55 (Da = 2.90 × 10⁻¹¹ m2/s), where conversion processes achieve temporary microstructural refinement, followed by severe degradation at w/cm 0.65 (Da = 1.40 × 10⁻¹⁰ m2/s).
  • CSA underwent severe breakdown at w/cm 0.65, with Da increasing by an order of magnitude (from ~4 × 10⁻¹¹ to 3.37 × 10⁻¹⁰ m2/s). The quality of Fickian model fit deteriorates progressively with increasing w/cm, serving as a leading indicator of microstructural instability preceding dramatic Da increases.
  • The diffusion–strength relationship is cement-specific, decoupling in CAC at an intermediate w/cm and in CSA at a high w/cm. High compressive strength does not guarantee low chloride diffusivity for non-OPC systems.
For practical field applications with standard construction tolerances, this study indicates that CSA presents a higher potential risk of chloride-induced degradation if the water content is not tightly controlled, whereas OPC provides more predictable and reliable performance across a wider range of w/cm ratios. These findings advocate for cement-specific, performance-based specifications that account for the distinct chemistry and sensitivities of alternative cementitious materials. Further research is recommended to validate these findings on full-scale concrete specimens under real-world exposure conditions.

Author Contributions

Conceptualization, methodology, software, validation, investigation, resources, data curation, writing—original draft preparation, writing—review and editing, visualization, and supervision.Conceptualization, A.A.A.; methodology, A.A.A.; M.S. and N.P.V.; validation, M.S. and N.P.V.; formal analysis, A.A.A.; investigation, A.A.A.; resources, M.S.; data curation, A.A.A.; writing—original draft preparation, A.A.A.; writing—review and editing, N.P.V.; visualization, A.A.A.; supervision, A.A.A.; project administration, A.A.A.; funding acquisition, A.A.A. All authors have read and agreed to the published version of the manuscript.

Funding

This research received no external funding.

Data Availability Statement

The raw data supporting the conclusions of this article will be made available by the authors on request.

Conflicts of Interest

Author Naga Pavan Vaddey was employed by the company CTL Group. The remaining authors declare that the research was conducted in the absence of any commercial or financial relationships that could be construed as a potential conflict of interest.

References

  1. AASHTO T 259-80; Standard Method of Test for Resistance of Concrete to Chloride Ion Penetration. American Association of State Highway and Transportation Officials: Washington, DC, USA, 1980.
  2. ASTM C1202-19; Standard Test Method for Electrical Indication of Concrete’s Ability to Resist Chloride Ion Penetration. ASTM International: Philadelphia, PA, USA, 2022.
  3. ASTM C1556-23; Standard Test Method for Determining the Apparent Chloride Diffusion Coefficient of Cementitious Mixtures by Bulk Diffusion. ASTM International: Philadelphia, PA, USA, 2023.
  4. Xu, Z.; Ye, G. Understanding Chloride Diffusion Coefficient in Cementitious Materials. Materials 2023, 16, 3464. [Google Scholar] [CrossRef] [Scilit] [PubMed]
  5. ASTM C1152-20; Standard Test Method for Acid-Soluble Chloride in Mortar and Concrete. ASTM International: Philadelphia, PA, USA, 2020.
  6. Ranger, M.; Hasholt, M.T.; Jensen, O.M. Chloride ingress parameters derived from migration and diffusion tests for systems with calcined smectitic clay and limestone. Cem. Concr. Res. 2025, 194, 107893. [Google Scholar] [CrossRef] [Scilit]
  7. Trejo, D.; Ahmed, A.A. Adopting auto-titration to assess chlorides in concrete. ACI Mater. J. 2019, 116, 43–52. [Google Scholar] [CrossRef] [Scilit]
  8. Scrivener, K.; Snellings, R.; Lothenbach, B. A Practical Guide to Microstructural Analysis of Cementitious Materials; CRC Press: Boca Raton, FL, USA, 2016; Volume 540. [Google Scholar]
  9. Trauchessec, R.; Mechling, J.M.; Lecomte, A.; Roux, A.; Le Rolland, B. Hydration of ordinary Portland cement and calcium sulfoaluminate cement blends. Cem. Concr. Compos. 2015, 56, 106–114. [Google Scholar] [CrossRef] [Scilit]
  10. Ann, K.Y.; Cho, C.-G. Corrosion Resistance of Calcium Aluminate Cement Concrete Exposed to a Chloride Environment. Materials 2022, 7, 887–898. [Google Scholar]
  11. Ahmed, A.A.; Trejo, D. Assessing standard tests for admixtured chlorides in calcium aluminate cement and calcium sulfoaluminate cement systems. ACI Mater. J. 2020, 117, 71–82. [Google Scholar] [CrossRef] [Scilit]
  12. Winnefeld, F.; Lothenbach, B. Hydration of calcium sulfoaluminate cements—Experimental findings and thermodynamic modelling. Cem. Concr. Res. 2010, 40, 1239–1247. [Google Scholar] [CrossRef] [Scilit]
  13. Fenaux, M.; Reyes, E.; Gálvez, J.C.; Moragues, A. Modelling the transport of chloride and other ions in cement-based materials. Cem. Concr. Compos. 2019, 97, 33–42. [Google Scholar] [CrossRef] [Scilit]
  14. Zhang, T.; Gjørv, O.E. Diffusion behavior of chloride ions in concrete. Cem. Concr. Res. 1996, 26, 907–917. [Google Scholar] [CrossRef] [Scilit]
  15. Yang, H.; Ann, K.; Hwang, W. Corrosion of steel in chloride-contaminated calcium aluminate cement (CAC) mortar depending on its hydration. Constr. Build. Mater. 2023, 409, 134088. [Google Scholar] [CrossRef] [Scilit]
  16. Bernal, S.A.; Provis, J.L.; Walkley, B.; Nicolas, R.S.; Gehman, J.D.; Brice, D.G.; Kilcullen, A.R.; Duxson, P.; van Deventer, J.S.J. Gel nanostructure in alkali-activated binders based on slag and fly ash, and effects of accelerated carbonation. Cem. Concr. Res. 2013, 53, 127–144. [Google Scholar] [CrossRef] [Scilit]
  17. ACI 225R-19; Guide to the Selection and Use of Hydraulic Cements. American Concrete Institute: Farmington Hills, MI, USA, 2019.
  18. Ma, J.; Wang, H.; Yu, Z.; Shi, H.; Wu, Q.; Shen, X. A systematic review on durability of calcium sulfoaluminate cement-based materials in chloride environment. J. Sustain. Cem. -Based Mater. 2023, 12, 687–698. [Google Scholar]
  19. Wang, Y.; Jiang, X.; Zhong, Z.; Liu, Z.; Li, W.; Long, W.; Xing, F. Binding mechanism of CSA cement on premixed Cl and its governing parameters. J. Mater. Civ. Eng. 2022, 34, 04021429. [Google Scholar] [CrossRef] [Scilit]
  20. ASTM C150-22; Standard Specification for Portland Cement. ASTM International: West Conshohocken, PA, USA, 2022.
  21. EN 14647-05; European Standard Specification for Calcium Aluminate Cement—Composition, Specifications and Conformity Criteria. European Committee for Standardization (CEN): Brussels, Belgium, 2005.
  22. ASTM C1600-19; Standard Specification for Rapid Hardening Hydraulic Cement. ASTM International: West Conshohocken, PA, USA, 2019.
  23. ASTM C778-21; Standard Specification for Standard Sand. ASTM International: West Conshohocken, PA, USA, 2021.
  24. ASTM C136-19; Standard Test Method for Sieve Analysis of Fine and Coarse Aggregates. ASTM International: West Conshohocken, PA, USA, 2019.
  25. ASTM C1602-22; Standard Specification for Mixing Water Used in the Production of Hydraulic Cement Concrete. ASTM International: West Conshohocken, PA, USA, 2022.
  26. ASTM E1621-21; Standard Guide for Elemental Analysis by Wavelength Dispersive X-Ray Fluorescence Spectrometry. ASTM International: West Conshohocken, PA, USA, 2021.
  27. ASTM C109-20; Standard Test Method for Compressive Strength of Hydraulic Cement Mortars (Using 2-in. or [50-mm] Cube Specimens). ASTM International: West Conshohocken, PA, USA, 2020.
  28. ASTM C305-20; Standard Practice for Mechanical Mixing of Hydraulic Cement Pastes and Mortars of Plastic Consistency. ASTM International: West Conshohocken, PA, USA, 2020.
  29. ASTM C192-19; Standard Practice for Making and Curing Concrete Test Specimens in the Laboratory. ASTM International: West Conshohocken, PA, USA, 2019.
  30. Geng, Z.; Bi, X.; Shi, J. Insights into improved chloride resistance of carbon steel in Portland cement blended with belitic calcium sulfoaluminate cement. Cem. Concr. Compos. 2026, 165, 106327. [Google Scholar] [CrossRef] [Scilit]
  31. Guo, Y.; Zhang, T.; Du, J.; Wang, C.; Wei, J.; Yu, Q. Evaluating the chloride diffusion coefficient of cement mortars based on the tortuosity of pore structurally-designed cement pastes. Microporous Mesoporous Mater. 2013, 137, 111018. [Google Scholar]
  32. Mehta, P.K.; Monteiro, P.J.M. Concrete: Microstructure, Properties, and Materials, 4th ed.; McGraw-Hill: New York, NY, USA, 2014. [Google Scholar]
  33. Wang, Y.; Shui, Z.; Gao, X.; Huang, Y.; Yu, R.; Song, Q. Chloride binding capacity and phase modification of alumina compound blended cement paste under chloride attack. Cem. Concr. Compos. 2020, 108, 103537. [Google Scholar] [CrossRef] [Scilit]
  34. Xue, J.; Li, S.; Liu, S.; Guan, X. Effect of ferrite phase content on hydration reaction, mechanical properties, and chloride-binding behavior of ordinary Portland cement. J. Mater. Civ. Eng. 2025, 37, 04024527. [Google Scholar] [CrossRef] [Scilit]
  35. Ewuzie, U.; Halder, R.R.; Yusuf, A.O.; Saka, A.A.; Ogbuehi, G.I.; Egbosiuba, T.C.; Daramola, D.A.; Okoronkwo, M.U. Performance and mechanistic insights into cement systems modified with wastewater-recovered struvite. Cem. Concr. Compos. 2026, 166, 106406. [Google Scholar] [CrossRef] [Scilit]
  36. Kasaniya, M.; Thomas, M.D.; Moffatt, T.; Hossack, A. Microstructure and microanalysis of Portland cement pastes with high w/c ratios. Cem. Concr. Res. 2024, 183, 107575. [Google Scholar] [CrossRef] [Scilit]
  37. Nodehi, M.; Gencel, O.; Erdogmus, E.; Karagöz, M.E.; Shi, J.; Mo, K.H.; Gholampour, A. Effect of cement type and water-to-cement (w/c) ratio on characteristics of lightweight mortars produced with pumice: A comparative study on calcium aluminate (rapid hardening) and ordinary Portland cements. Innov. Infrastruct. Solut. 2024, 9, 48. [Google Scholar] [CrossRef] [Scilit]
  38. Bašić, A.-D.; Serdar, M. Substituting slag with calcined clay to mitigate conversion in calcium aluminate cement. J. Mater. Civ. Eng. 2026, 38, 04025554. [Google Scholar] [CrossRef] [Scilit]
  39. Kalinowska-Wichrowska, K.; Kosior-Kazberuk, M.; Granatyr, K.; Hammersley, C.; Cadsoch, H.; Chai, H.K. The influence of water–cement ratio on the mechanical properties of cement mortars with the addition of sewage sludge biochar. Int. J. Concr. Struct. Mater. 2026, 20, 37. [Google Scholar] [CrossRef] [Scilit]
  40. Goergens, J.; Belli, R.; Schulbert, C.; Goetz-Neunhoeffer, F. Influence of different CA2/CA-ratios on hydration degree, AH3 content and flexural strength investigated for a binder formulation of calcium aluminate cement with calcite. Cem. Concr. Res. 2024, 165, 107090. [Google Scholar] [CrossRef] [Scilit]
  41. Ahmed, A.A.; Shakouri, M.; Trejo, D.; Vaddey, N.P. Effect of curing temperature and water-to-cement ratio on corrosion of steel in calcium aluminate cement concrete. Constr. Build. Mater. 2022, 350, 128875. [Google Scholar] [CrossRef] [Scilit]
  42. Win, T.; Weng, Y.; Prasittisopin, L. Effect of steel and polypropylene fiber reinforcement on mitigating conversion effects in calcium aluminate cement at varying curing temperatures. Ain Shams Eng. J. 2025, 16, 103680. [Google Scholar] [CrossRef] [Scilit]
  43. Chen, I.A.; Hargis, C.W.; Juenger, M.C.G. Understanding expansion in calcium sulfoaluminate–belite cements. Cem. Concr. Res. 2012, 42, 51–60. [Google Scholar] [CrossRef] [Scilit]
  44. Tian, L.; Liu, T.; Fu, H.; Wang, P.; Taqi, M.; Li, W.; Cui, L.; Wang, Y. Electrochemical extraction of chloride in OPC-CSA composite conductive mortar with nano-Al2O3. J. Build. Eng. 2025, 105, 112432. [Google Scholar] [CrossRef] [Scilit]
  45. Gołaszewska, M.; Gołaszewski, J.; Chmiela, B. Effect of water to cement ratio on properties of calcium sulfoaluminate cement mortars. Materials 2024, 17, 2806. [Google Scholar] [CrossRef] [Scilit] [PubMed]
  46. Cai Jun, S.; De Hua, D.; Jun, X.Y. Pore Structure and Chloride Ion Transport Mechanisms in Concrete. Key Eng. Mater. 2006, 302, 528–535. [Google Scholar] [CrossRef] [Scilit]
  47. Gastaldi, D.; Canonico, F.; Boccaleri, E. Ettringite and calcium sulfoaluminate cement: Investigation of water content by near-infrared spectroscopy. J. Mater. Sci. 2009, 44, 5788–5794. [Google Scholar] [CrossRef] [Scilit]
  48. Li, S.; Tang, Q.; Meng, X.; Du, Z.; Wang, M.; Zhang, Y.; Wang, P.; Hou, D.; Zhang, Y. Interfacial and nanoconfinement effects on electric field-driven chloride migration in C-(A)-S-H nanopores. Case Stud. Constr. Mater. 2025, 23, e05344. [Google Scholar] [CrossRef] [Scilit]
  49. Pérez-Bravo, R.; Koufany, I.; Cuesta, A.; Bescher, E.P.; Aranda, M.A.; Santacruz, I.; De la Torre, A.G. Reactivity of belite in calcium sulfoaluminate-based cements. J. Therm. Anal. Calorim. 2025, 150, 1533–1544. [Google Scholar] [CrossRef] [Scilit]
Figure 1. Particle size cumulative distribution curve for sand.
Jcs 10 00479 g001
Figure 2. Schematic of ASTM C1556 test setup showing (a) test specimen; (b) epoxy coating of cut specimens; (c) chloride solution reservoir; (d) sanding the epoxy coating prior to grinding; (e) grinding; (f) powder sample zones for chloride profiling post-test; (g) acid-soluble chloride extraction; (h) titration of acid-soluble chlorides.
Jcs 10 00479 g002
Figure 3. Representative chloride diffusion fit curves for (a) OPC, (b) CAC, and (c) CSA at w/cm = 0.45, showing measured chloride concentrations and the fitted error-function solution (Fick’s second law). The reported Da and Cs values are representative examples from one of the five replicate specimens.
Jcs 10 00479 g003
Figure 4. Representative chloride diffusion fit curves for (a) OPC, (b) CAC, and (c) CSA at w/cm = 0.55, showing measured chloride concentrations and the fitted error-function solution. The reported Da and Cs values are representative examples from one of the five replicate specimens.
Jcs 10 00479 g004
Figure 5. Representative chloride diffusion fit curves for (a) OPC, (b) CAC, and (c) CSA at w/cm = 0.65, showing measured chloride concentrations and the fitted error-function solution. The reported Da and Cs values are representative examples from one of the five replicate specimens.
Jcs 10 00479 g005
Figure 6. Mean Da and Cs for OPC, CAC, and CSA at different w/cm levels.
Jcs 10 00479 g006
Figure 7. Compressive strength and diffusion coefficient for all cement systems at different w/cm.
Jcs 10 00479 g007
Figure 8. XRD diffractogram of OPC paste at varying w/cm ratios.
Jcs 10 00479 g008
Figure 9. XRD diffractogram of CAC paste at varying w/cm ratios.
Jcs 10 00479 g009
Figure 10. XRD diffractogram of CSA paste at varying w/cm ratios.
Jcs 10 00479 g010
Table 1. Oxide compositions of OPC, CAC, and CSA cement (% mass).
Cement TypeCaOSiO2Al2O3Fe2O3MgOSO3Na2OK2O* LoI
OPC64.4821.014.643.641.843.310.220.583.53
CAC38.116.7349.3711.050.590.250.180.260.51
CSA43.399.5732.211.162.1215.510.410.432.44
* LoI = Loss on Ignition.
Table 2. Mix design proportions of mortar specimens.
Cement SystemMaterialw/cm
0.450.550.65
Mass (kg)Volume (%)Mass (kg)Volume (%)Mass (kg)Volume (%)
OPCCement2.460182.472172.43516
Sand6.435586.467556.37152
Water1.067241.072281.05632
CACCement2.330172.341162.30816
Sand6.095586.124556.03852
Water1.244241.250281.23232
CSACement2.213192.223182.19317
Sand5.790575.816545.73852
Water1.403241.409281.39032
Table 3. Coefficient of determination (R2) for Fickian diffusion model fits.
Cement Systemw/cmMean R2SDTrend
OPC0.450.9700.003Stable (R2 > 0.96)
Fickian diffusion dominates
0.550.9600.003
0.650.9580.003
CAC0.450.8900.003Non-monotonic
Peak at 0.55
0.550.9400.003
0.650.8220.003
CSA0.450.9300.003Decreasing with w/cm
(r = 0.72, p < 0.05)
0.550.8500.004
0.650.7780.004
Disclaimer/Publisher’s Note: The statements, opinions and data contained in all publications are solely those of the individual author(s) and contributor(s) and not of MDPI and/or the editor(s). MDPI and/or the editor(s) disclaim responsibility for any injury to people or property resulting from any ideas, methods, instructions or products referred to in the content.