Article

Core Monitoring of Thermoset Polymer Composites’ Curing with Embedded Nanocomposite Sensors: A Key Step Towards Process 4.0

by
Antoine Lemartinel
1,2,
Mickaël Castro
1 and
Jean-Francois Feller
1,*
1
Smart Plastics Group, University of South Brittany (UBS), IRDL CNRS 6027, 56321 Lorient, France
2
IRT Jules Verne, 44340 Bouguenais, France
*
Author to whom correspondence should be addressed.
J. Compos. Sci. 2025, 9(8), 435; https://doi.org/10.3390/jcs9080435
Submission received: 23 June 2025 / Revised: 14 July 2025 / Accepted: 6 August 2025 / Published: 13 August 2025
(This article belongs to the Section Composites Manufacturing and Processing)

Abstract

Structural composite materials are being used more than ever in aeronautics, automotive and naval, or in renewable energies fields. To reconcile the contradictory needs for higher performances and lower costs, it is crucial to ensure the real-time monitoring of as many features as possible during the manufacturing process to feed a digital twin able to minimise post-fabrication controls. For thermoset composites, little information is available regarding the evolution of the polymer’s core properties during infusion and curing. The local kinetics of reticulation, in several areas of interest across the thickness of a structural composite part, are valuable data to record and analyse to guarantee the materials’ performances. This paper investigates a novel strategy curing in the core of an epoxy matrix with crosslinkable quantum-resistive nanocomposite sensors (xQRS). First, the electrical behaviour of the sensor during isothermal curing is considered. Then, the influence of the dynamic percolation and the epoxy crosslinking reaction on the resistance is examined. The evidence of a relationship between the curing state of the resin and the evolution of the xQRS resistance makes its use in the process monitoring of thermoset composites promising, especially in cases involving large and thick parts.

1. Introduction

1.1. Brief Overview of Polymer Composites’ Monitoring

Over the last decade, the need for fibre-reinforced polymers (FRP) has more than doubled, and this growth is expected to continue, particularly in the automotive, aeronautics, naval, defence, or renewable energies fields. Additionally, the weight of carbon fibre-reinforced polymers has increased from 101 to 175 × 106 kg during the past decade [1,2,3] due to the better mechanical properties/weight ratio of composites compared to other materials, such as metals for instance, which has enabled the construction of lighter structures.
To complete this transformation without compromising safety, the structure’s integrity, or global mechanical performance, it is necessary to develop real-time core monitoring solutions. Structural health monitoring (SHM) tools can help to optimise both the design and use of the composite structures, avoiding catastrophic failures and decreasing downtime [4,5,6,7,8,9,10].
However, to date, the development of sensors for monitoring the health of composites has mainly focused on the detection of strain and damage for in service structures [7,8]. Another approach is to consider that the alteration of structural properties may find their origin in the defects generated during the fabrication steps of the structure, as illustrated in Figure 1, but usually, monitoring is restricted to the operation and eventually end-of-life steps thanks to the use of the strain and damage sensors [11]. Although the manufacturing process has a key role in the development of materials characteristics, defect control is generally achieved using ultrasounds or X-rays post-fabrication, which makes feedback almost impossible [12,13]. This step is also costly and time consuming; therefore, it is worthwhile to try to substitute it with the collection of data thanks to IIoT (Industrial Internet of Things) [14] during fabrication to feed a digital twin able to control and optimise processing and to detect anomalies in real time [15,16,17,18]. This strategy is also part of the Factory 4.0 concept [19,20].
Data collection is obviously conditioned by the choice of the pertinent sensors able to transduce environmental parameters into interpretable signals. Nowadays, the in situ real-time monitoring of composites processing is mainly limited to time and temperature measurements [21,22], although indirect measurement can provide a useful insight. Quantum-resistive sensors (QRS ®) [23] have opened up opportunities for the additional tracking of environmental parameters throughout the life of composites, as explained in Figure 1. Operation monitoring can benefit from embedded piezo-resistive sensors that can monitor deformation, and thus the direct strain on a composite under complex solicitations (sQRS) or pressure (pQRS) [24,25,26], as well as damage resulting from overloading, fatigue, or shocks (dQRS) [8,27,28]. Meanwhile, chemo-resistive sensors (vQRS) can detect volatile organic compounds, including water (moisture) in the atmosphere when integrated in electronic noses (e-noses) [29,30]. More recently, pQRS have been developed for automatic fibre placement (AFP) process monitoring to map the pressure applied by the robot and prevent defect generation [31]. fQRS also proved to be effective in detecting the resin flows during infusion through composite preforms [32]. fQRS present several advantages, one of which is the ability to be integrated into the core of composite preforms in a non-intrusive way to analyse the resin-filling process and the beginning of its curing at points of interest in the mould. They can also eventually detect outlets opening when they trigger air pressure variation at a reasonable distance from the sensors [33]. However, this system cannot completely follow the crosslinking of the resin until its final step. To reach this objective, it is necessary to develop a new kind of sensor able to crosslink accordingly to the matrix to monitor the kinetics of this chemical reaction, i.e., a xQRS, which is the focus of this study.
In the case of a thermoset resin such as epoxy, the resin crosslinking degree determines most of the mechanical properties of the material [34]. The crosslinking degree is currently estimated based on the time and temperature monitoring without any direct measurement in the core of the resin. The ideal curing monitoring system for thermoset resins is expected to provide an evolution of the curing degree, with time and indications of residual stresses, as well as product quality [35,36]. In addition, for the in situ detection of curing, the system should be non-intrusive and not interfere with the process.

1.2. Strategies for Polymer Crosslinking Monitoring

The crosslinking of diglycidyl ether bisphenol A (DGBA) with an amine hardener is an exothermic chemical reaction that forms a 3D network of epoxy that can be characterised classically by different techniques, which are described here. Differential scanning calorimetry (DSC) is a technique particularly suitable to precisely follow the kinetics of the reticulation of epoxy by measuring the enthalpy produced during a reaction [37,38,39,40]. Additionally, the determination of the glass transition temperature (Tg) gives another indication of the resin’s state of curing, as Tg is proportional to the crosslinking density. Fourier transform infrared spectrometer (FTIR) [41,42,43] enables us to monitor the evolution of the curing degree based on the change in intensity of functional groups involved in the crosslinking reaction of a DGBA resin with an amine hardener, as shown in Figure 2.
Rotational shear rheometry can measure the increase in resin’s viscosity with a chain’s entanglement and network formation [44,45,46]. Nevertheless, none of these techniques enable making in situ continuous measurements of the curing state of a structure. Dielectric analysis (DEA) enables a continuous evaluation of the ions’ mobility inside a resin during structural changes under an oscillating electrical field [47,48,49,50]. The amplitude change and phase shift lead to the calculation of the dielectric properties such as the permittivity ε′ and loss factor ε″. As the curing progresses, ions’ mobility and dipoles’ rotation decrease, and the curing degree can be assessed by knowing the initial and final values of these parameters [49]. DEA is used to follow curing with surface electrodes, eventually placed in the mould, to optimise the kinetic parameters of the process. Because of the temperature gradient existing in the part, the reticulation degree can evolve from the surface to the core, and thus the internal curing can only be estimated from surface measurements [51]. Recently, embedding small DEA sensors with a thickness below 30 µm has made core measurements possible [52,53]. The sensors dimensions (~1 cm2) have been reduced to lower the sensor’s intrusiveness, but the two studies did not present any result on the sensor’s impact on the mechanical performance of the structure to verify this point. Raman spectroscopy has also been used to provide the internal curing state of a resin [21,49]. The curing degree is determined by the proportional decrease in intensity of peaks characteristic of the epoxide function, for example the 1275 cm−1 band, normalised by an unaffected function, such as the phenyl group at 1160 cm−1. Although Raman spectroscopy is a non-intrusive curing measurement, its penetration depth is limited by the sample dimensions. In situ cure monitoring is therefore not possible on thick structures. A comparison of some of the former monitoring techniques, DEA, Raman and DSC was made for isothermal curing on an epoxy resin by Hardis et al. [49]. The authors found that the three techniques produced similar results. For isothermal curing at 60 °C, a maximum disparity close to a 10% crosslinking degree was found, while at 100 °C, this gap was near 2%, showing better agreement at higher temperatures. Those variations can be attributed to the different curing variables measured for each technique and their different localisation.
The introduction of optical fibres such as Bragg gratings (FBGs) in the core of an epoxy resin has also led to in situ measurements during curing with the objective of determining its advancement. The FBG, sensitive to strain and temperature, can be used as a sensor able to detect residual strains developing in the structure [54,55,56,57,58]. Similarly, when the gel point is reached, an approximately threefold increase in the FBG slope sensitivity to temperature has been observed [54,59]. Nevertheless, the individual measurement of each parameter implies the presence of an additional thermocouple or a strain-free additional FBG [56,58]. However, it is found that the epoxy curing degree cannot be directly measured by an FBG. Yet, the crosslinking process may tend to reduce the space among the molecules and increase the density of the material and thus ultimately the resin’s refractive index n [60]. The refractive index can be deduced at the tip of an optical fibre using Fresnel’s equation. Cusano et al. [60] have found a correlation of R2 = 0.998 with DSC measurements using this method. To avoid the incorporation of intrusive materials in the composite that could introduce unexpected defects such as eyes [61], Wang et al. [62] used water-sized reinforcement glass fibres as wave spectroscopy sensors for estimating the crosslinking degree. The authors found a good correlation between the fibre’s estimation and the theoretical crosslinking advancement. The change in the fibres’ coating may modify their interaction with the resin, but they provided local and quantitative information on the resin’s cure advancement. The use of optical fibres is therefore promising for in situ monitoring the curing state of a thermoset resin with little interference with the environment.
Sensors enable intelligent decision making in composite manufacturing via IIoT connectivity for resin infusion and cure monitoring [14]. Advise is a solution based on capacitive interdigital dielectric electrodes mounted on the process tooling, which allows cure monitoring, viscosity change detection and glass transition determination during the processing of thermoset polymers up to 220 °C. The technology is robust but provides surface information only, as the dielectric sensors are not embedded in the core of the composite parts [63]. An alternative is proposed by Synthesites, which commercialises direct current (DC) sensors giving information on the arrival of the resin inside a pipe (i.e., near or at an outlet gate) or through the thickness by a flexible sensor placed on the bag side of the laminate. By measuring the electrical resistance, it can evaluate the glass transition temperature (Tg) and the change in viscosity to visualize the gel point [64].
Even if most of these techniques are successful to monitoring the curing of epoxy resins, they are not suitable to achieve the complete life monitoring of a composite structure from manufacturing to failure. FBG sensors could measure temperature, strain and gel point but not the resin’s current curing state and an intrusiveness which is questionable. Thus, to our knowledge, the development of a unique system providing both the curing state of a composite and the monitoring of strain and damage in the structure has not yet been invented. Trying to fill this gap is the focus of the work presented in this paper.

1.3. Using Dynamic Percolation for Living Monitoring of Reticulation

Carbon nanotubes (CNT) can be used to create a conductive network inside an insulating epoxy resin, and they have attracted some interest for structural health monitoring (SHM) systems [10,65,66]. During the manufacturing process, the resin chains’ rearrangement and the temperature effect on chains’ mobility may also affect the conductive network. The addition of CNT to a resin may also modify the crosslinking behaviour. According to Puglia et al. [67,68,69], at high weight percentage (>5 wt.%), this results in an acceleration of the curing, especially at high temperatures. The authors observed a reduction of 25% in the time of maximum rate with the addition of 5 wt.% of single-walled CNT without any noticeable effect on the total heat flow released during the isothermal curing. For a lower 3 wt.% of CNT, Choi et al. [70] did not notice any change in the curing behaviour for pristine multi-walled CNT, unlike amine-functionalised CNT that favoured the curing reaction. At 1 wt.% MWCNT, similar results showing the absence of effect on the curing behaviour have also been reported [71]. An increase in the isothermal curing temperature has also shown a better agreement of the crosslinking degree between the neat and filled resin [71,72,73]. For low CNT concentration (<3 wt.%) in an epoxy matrix, one could therefore consider that the curing is the same as that of the pristine resin.
This paper investigates the potential of CNT-epoxy-based sensors (named Quantum Resistive Sensors, or QRS) for monitoring composite curing during manufacturing. Firstly, we have characterised the epoxy resin curing process in isothermal conditions, and secondly, we have characterised the evolution of the resistance of the same resin filled with CNT in the same conditions. Two cases are studied: with and without the crosslinking reaction. The aims of the first two parts are to link the sensor’s change in resistance with its curing degree during isothermal treatments and to estimate the contribution of the different mechanisms to the sensor’s change in resistance. The use of the sensor for process monitoring during a complex curing cycle and with unexpected events is then investigated. Finally, the sensor’s use for SHM is presented to illustrate its potential as a possible complete monitoring solution from manufacturing through final failure.

2. Materials and Methods

2.1. Materials

Multi-walled carbon nanotubes (NC-7000 MWCNT) were kindly provided by Nanocyl (Sambreville, Belgium). This grade corresponds to MWCNT with an average diameter of 9.5 nm and a mean length 1.5 µm. The Epolam 2020 epoxy resin and amine hardener were purchased from Axson, France. Chloroform (99%) was purchased from Sigma-Aldrich (Evry, France) and Taffetas E-glass fibre (0°/90°, 165 gm·m−2) from Gazechim (Bézier, France).

2.2. Fabrication of Samples

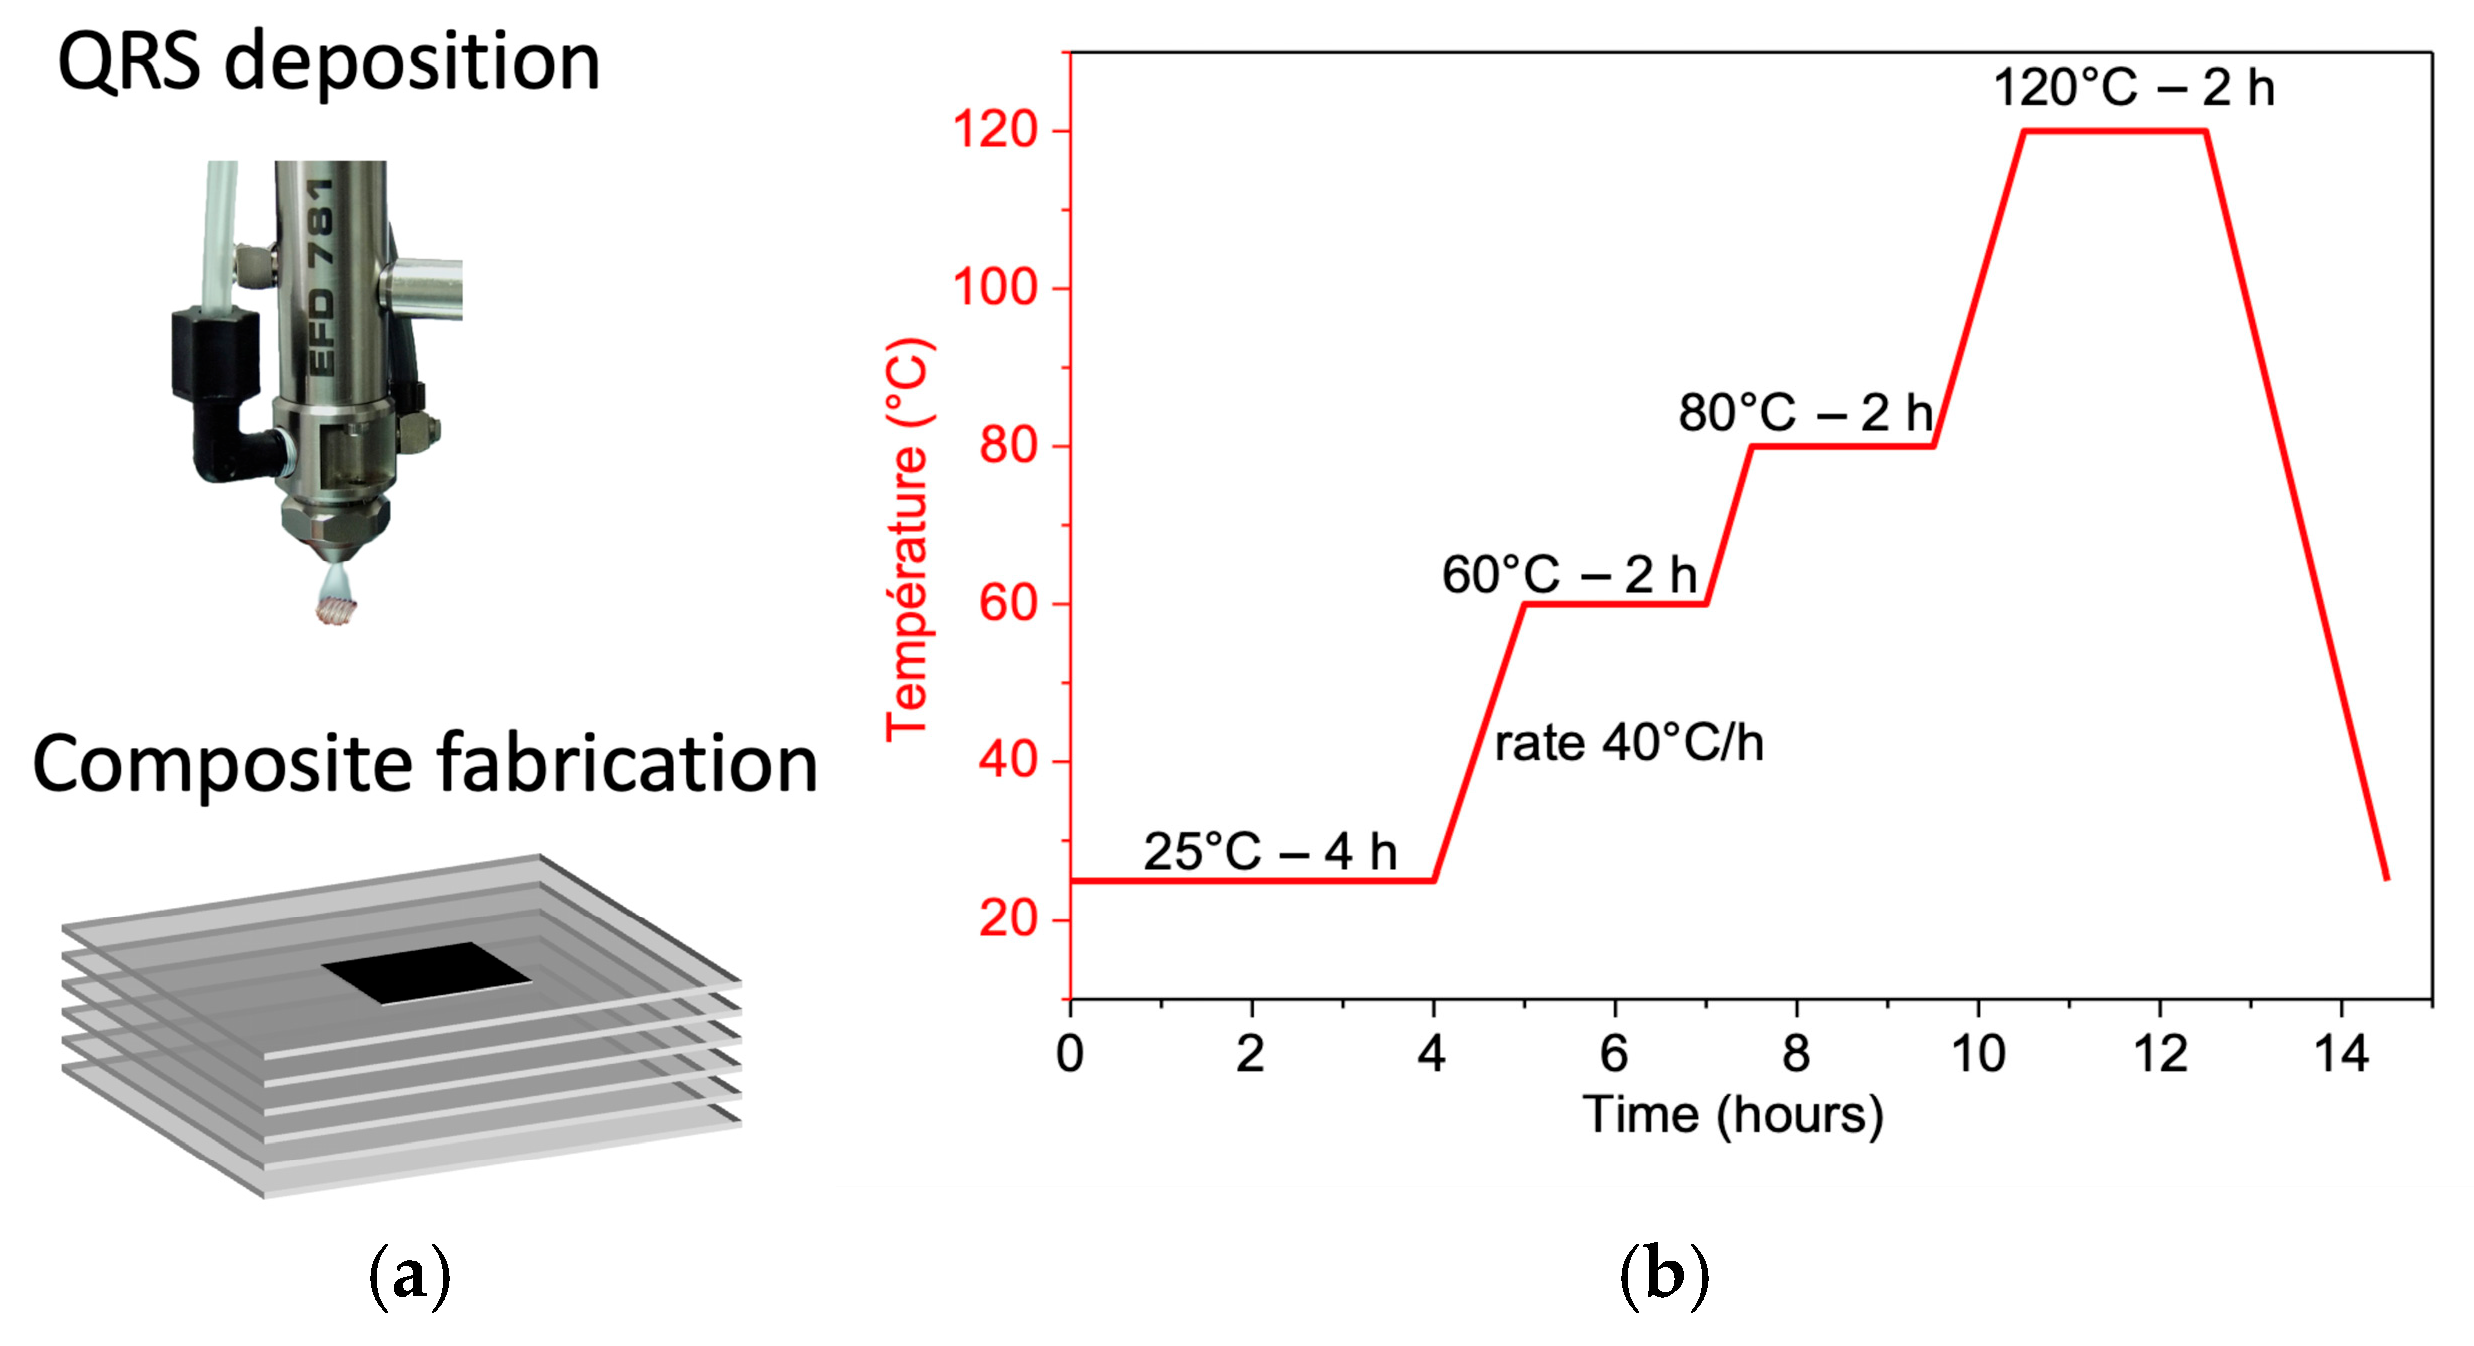
First, 4 mg of CNT and 150 mg of epoxy resin were homogenised in chloroform by ultra-sonication with a Branson 3510 sonicator for 6 h at 25 °C, and then degassed for 5 min. After the dispersion of CNT in epoxy resin, 50 mg of amine hardener was added and the mixture was further sonicated for 5 min. Thin film transducers of 1 cm × 0.5 cm were obtained by a spray layer-by-layer (sLbL) deposition technique (Figure 3a). The solutions were sprayed with our homemade device, allowing precise control of the nozzle scanning speed (10 cm·s−1), solution flow rate (50 mm3·s−1), stream pressure (0.20 MPa), and target-to-nozzle distance (10 cm). The QRS could be sprayed on the sample or the supported film. The QRS were then subjected to the curing cycle of the Epolam 2020: 4 h at 25 °C, 2 h at 60 °C, 2 h at 80 °C and 2 h at 120 °C with a 40 °C·h−1 temperature heating rate (Figure 3b).
The integration of the supported QRS film was then carried out during the stacking sequence of the composite followed by the curing cycle of the laminate. For the curing monitoring experiments, samples were placed in a temperature-controlled oven at 4 different temperatures (40, 60, 80 and 120 °C) for at least 3 h. When we prevented crosslinking, the hardener was replaced by the same amount of epoxy.
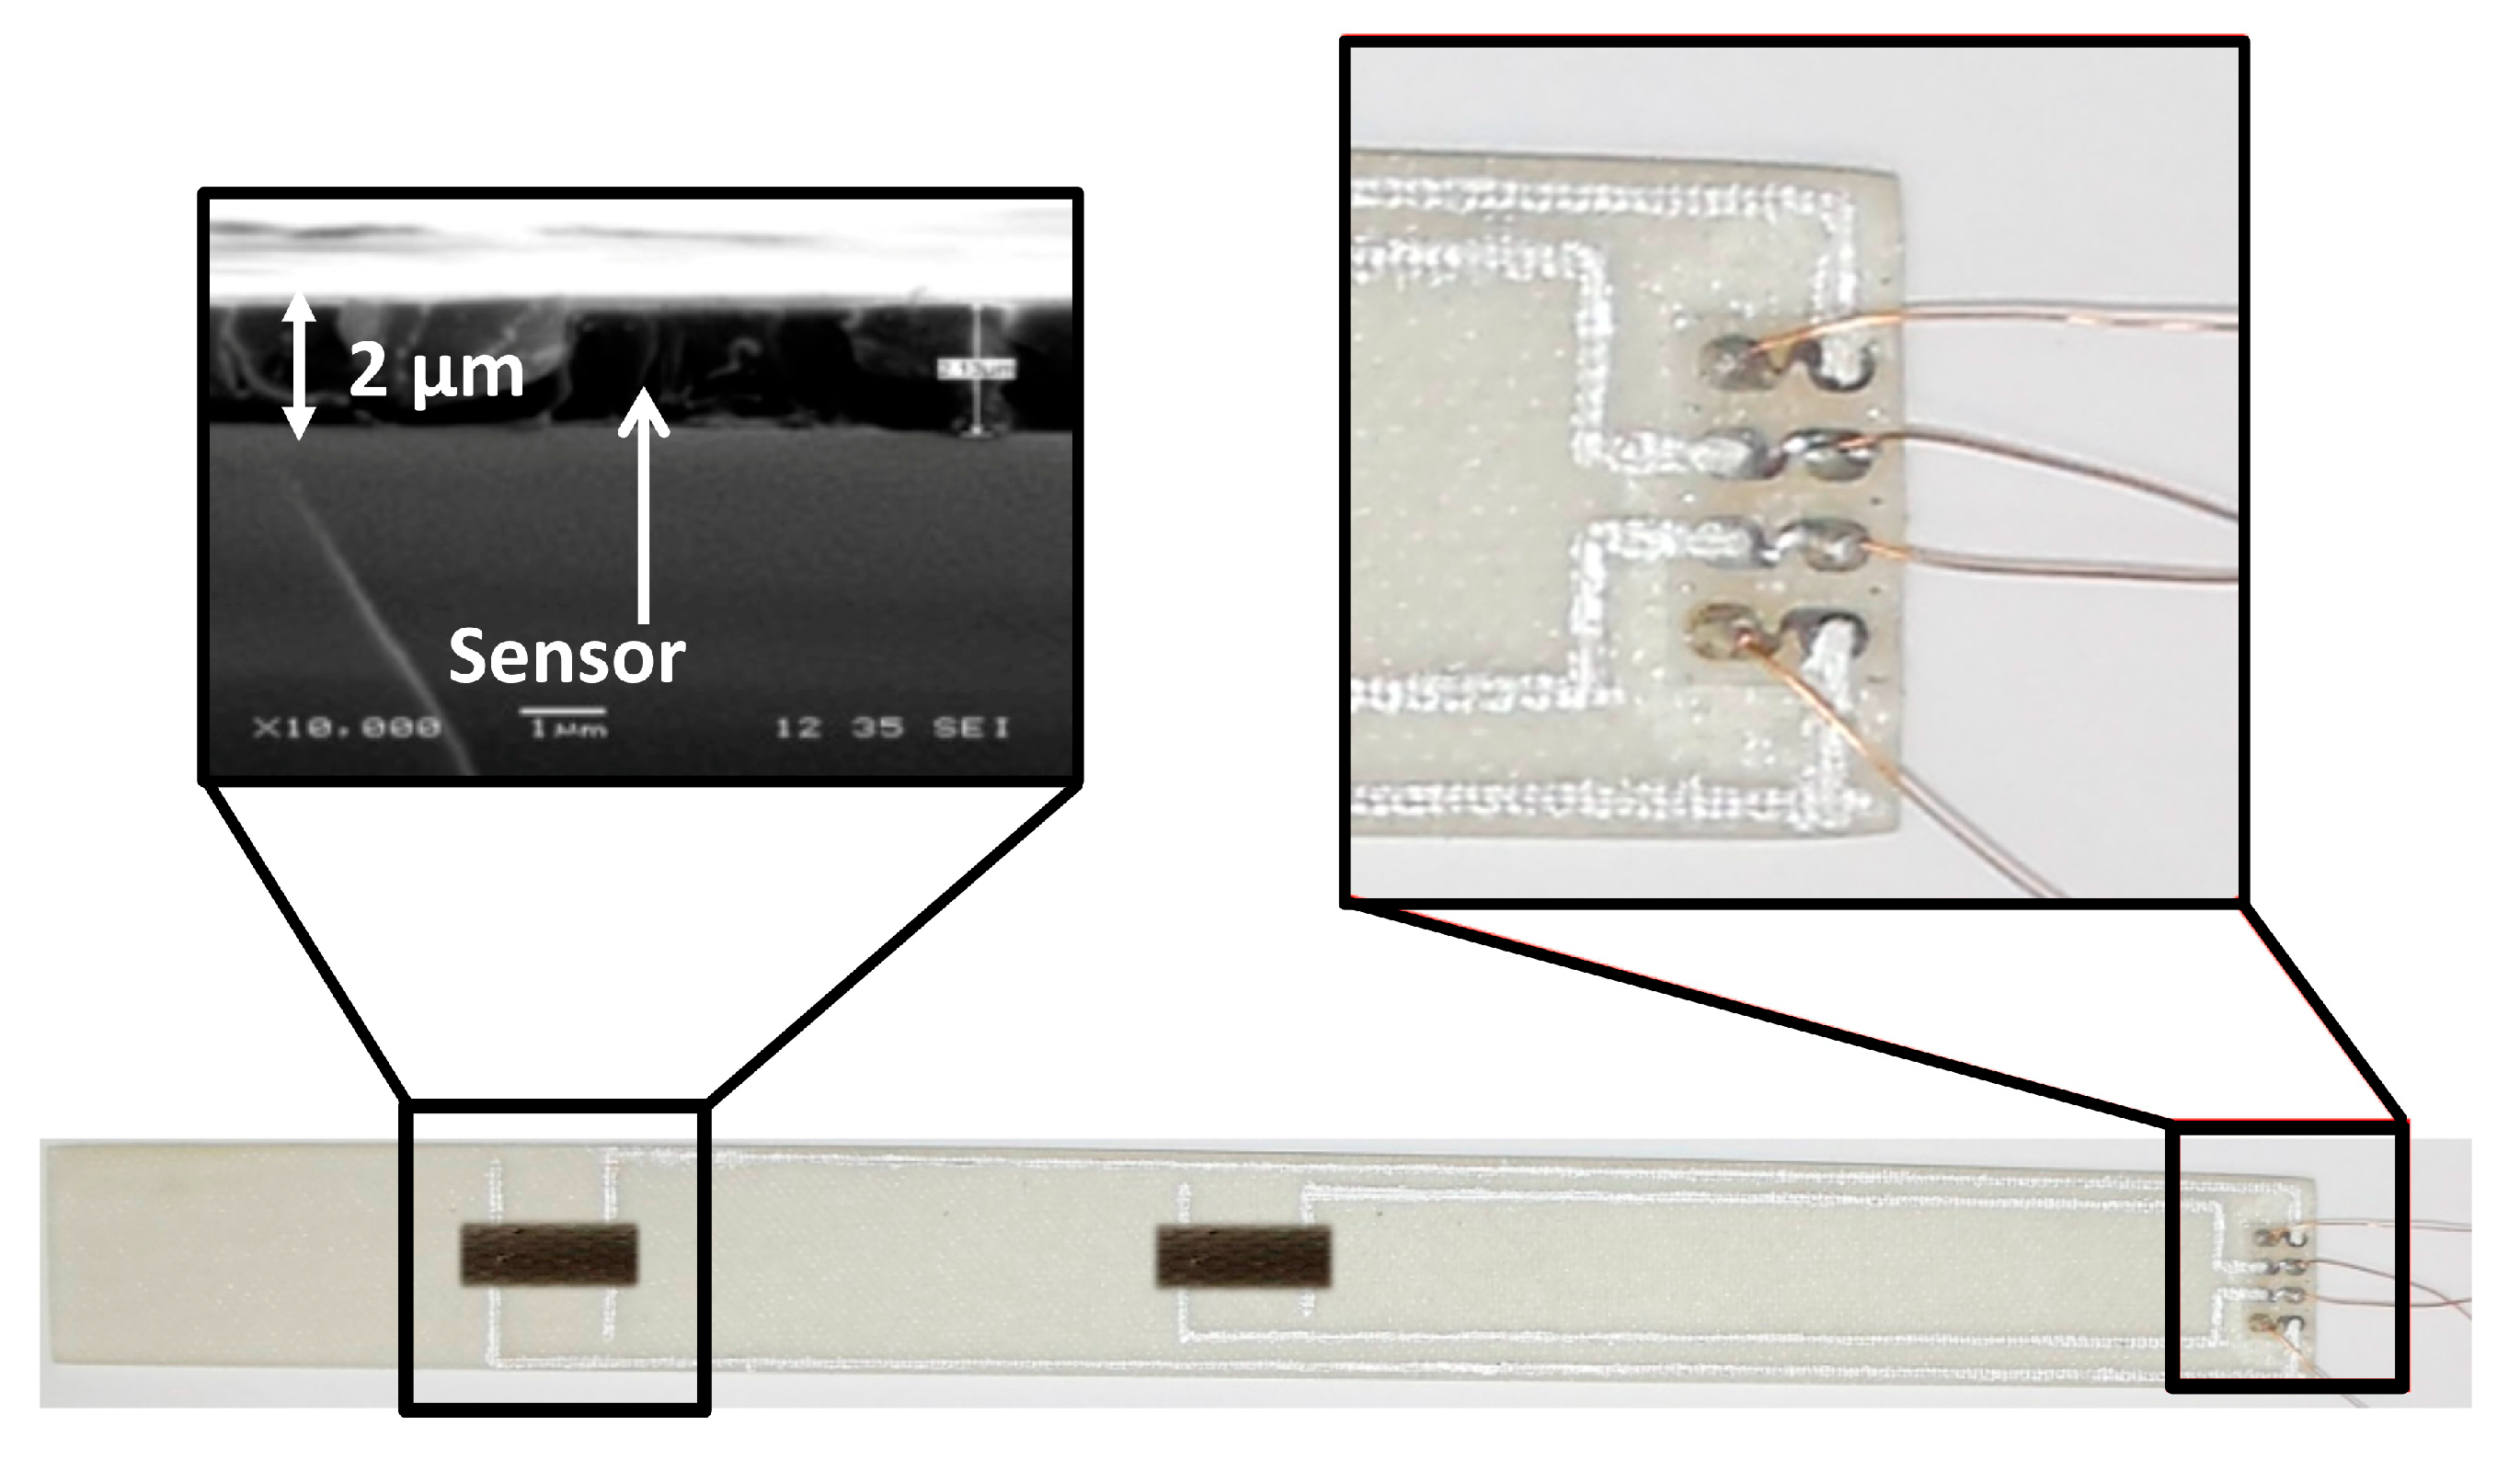
The connections to the xQRS were made with silver ink added prior to the spray coating, as shown in Figure 4. The left inlet shows that the typical thickness of the cross-linkable transducer is about 2 µm, and the right inlet illustrates the way the screen-printed silvers electrodes are connected to the multimetre.

2.3. Characterisation Techniques

The DSC device was a Netzsch DSC 204 F1 Phoenix. Measurements were performed under nitrogen flow (40 cm3·min−1) from room temperature to the isothermal temperature at 10 °C·min−1. After the isothermal curing, samples were subjected to a ramp from −20 to 250 °C at 10 °C·min−1 to confirm the samples’ crosslinking degree. The degree of cure is expressed by Equation (1):
α ( t ) = Δ H ( t ) Δ H T
where α is the degree of crosslinking, ΔHT is the total enthalpy released by a reference sample and ΔH(t) is the enthalpy of the reaction released up to time t.
The reference sample was subjected to an isothermal curing followed by a second ramp from −20 to 250 °C. For the determination of the crosslinking degree during the complex curing cycle, a measurement was performed at each start and end of the isothermal temperature step of the cycle.
The resistance measurements during the curing of epoxy were performed by a Keithley 6517 multimetre with a 1 V voltage, and each measurement was made every 5 to 60 s. The multimetre was controlled with a Lab-View® 2018 software program. For the mechanical experiments, an HBM’s QuantumX MX 840A was used, and the sampling frequency was 10 Hz.
A servo-hydraulic Inströn 5566A (Elancourt, France) was used to perform static tensile experiments. Deformations were measured using a 25 mm extensometer at a crosshead speed of 1 mm·min−1. Experiments were performed at controlled ambient temperature (23 °C) and relative humidity (48%RH).
Dynamic rotational shear rheological (RSR) measurements were performed on an Anton Paar MCR301 rheometer (Les Ulis, France), operating in low-amplitude shear mode using a parallel-plate geometry, with a diameter of 25 mm and a gap of 1 mm. Viscosity measurements were performed at constant curing temperatures of 40, 60, 80 and 110 °C at the constant shear speed of 10 rad·s−1.

3. Results and Discussion

3.1. Isothermal Curing in the Neat Resin

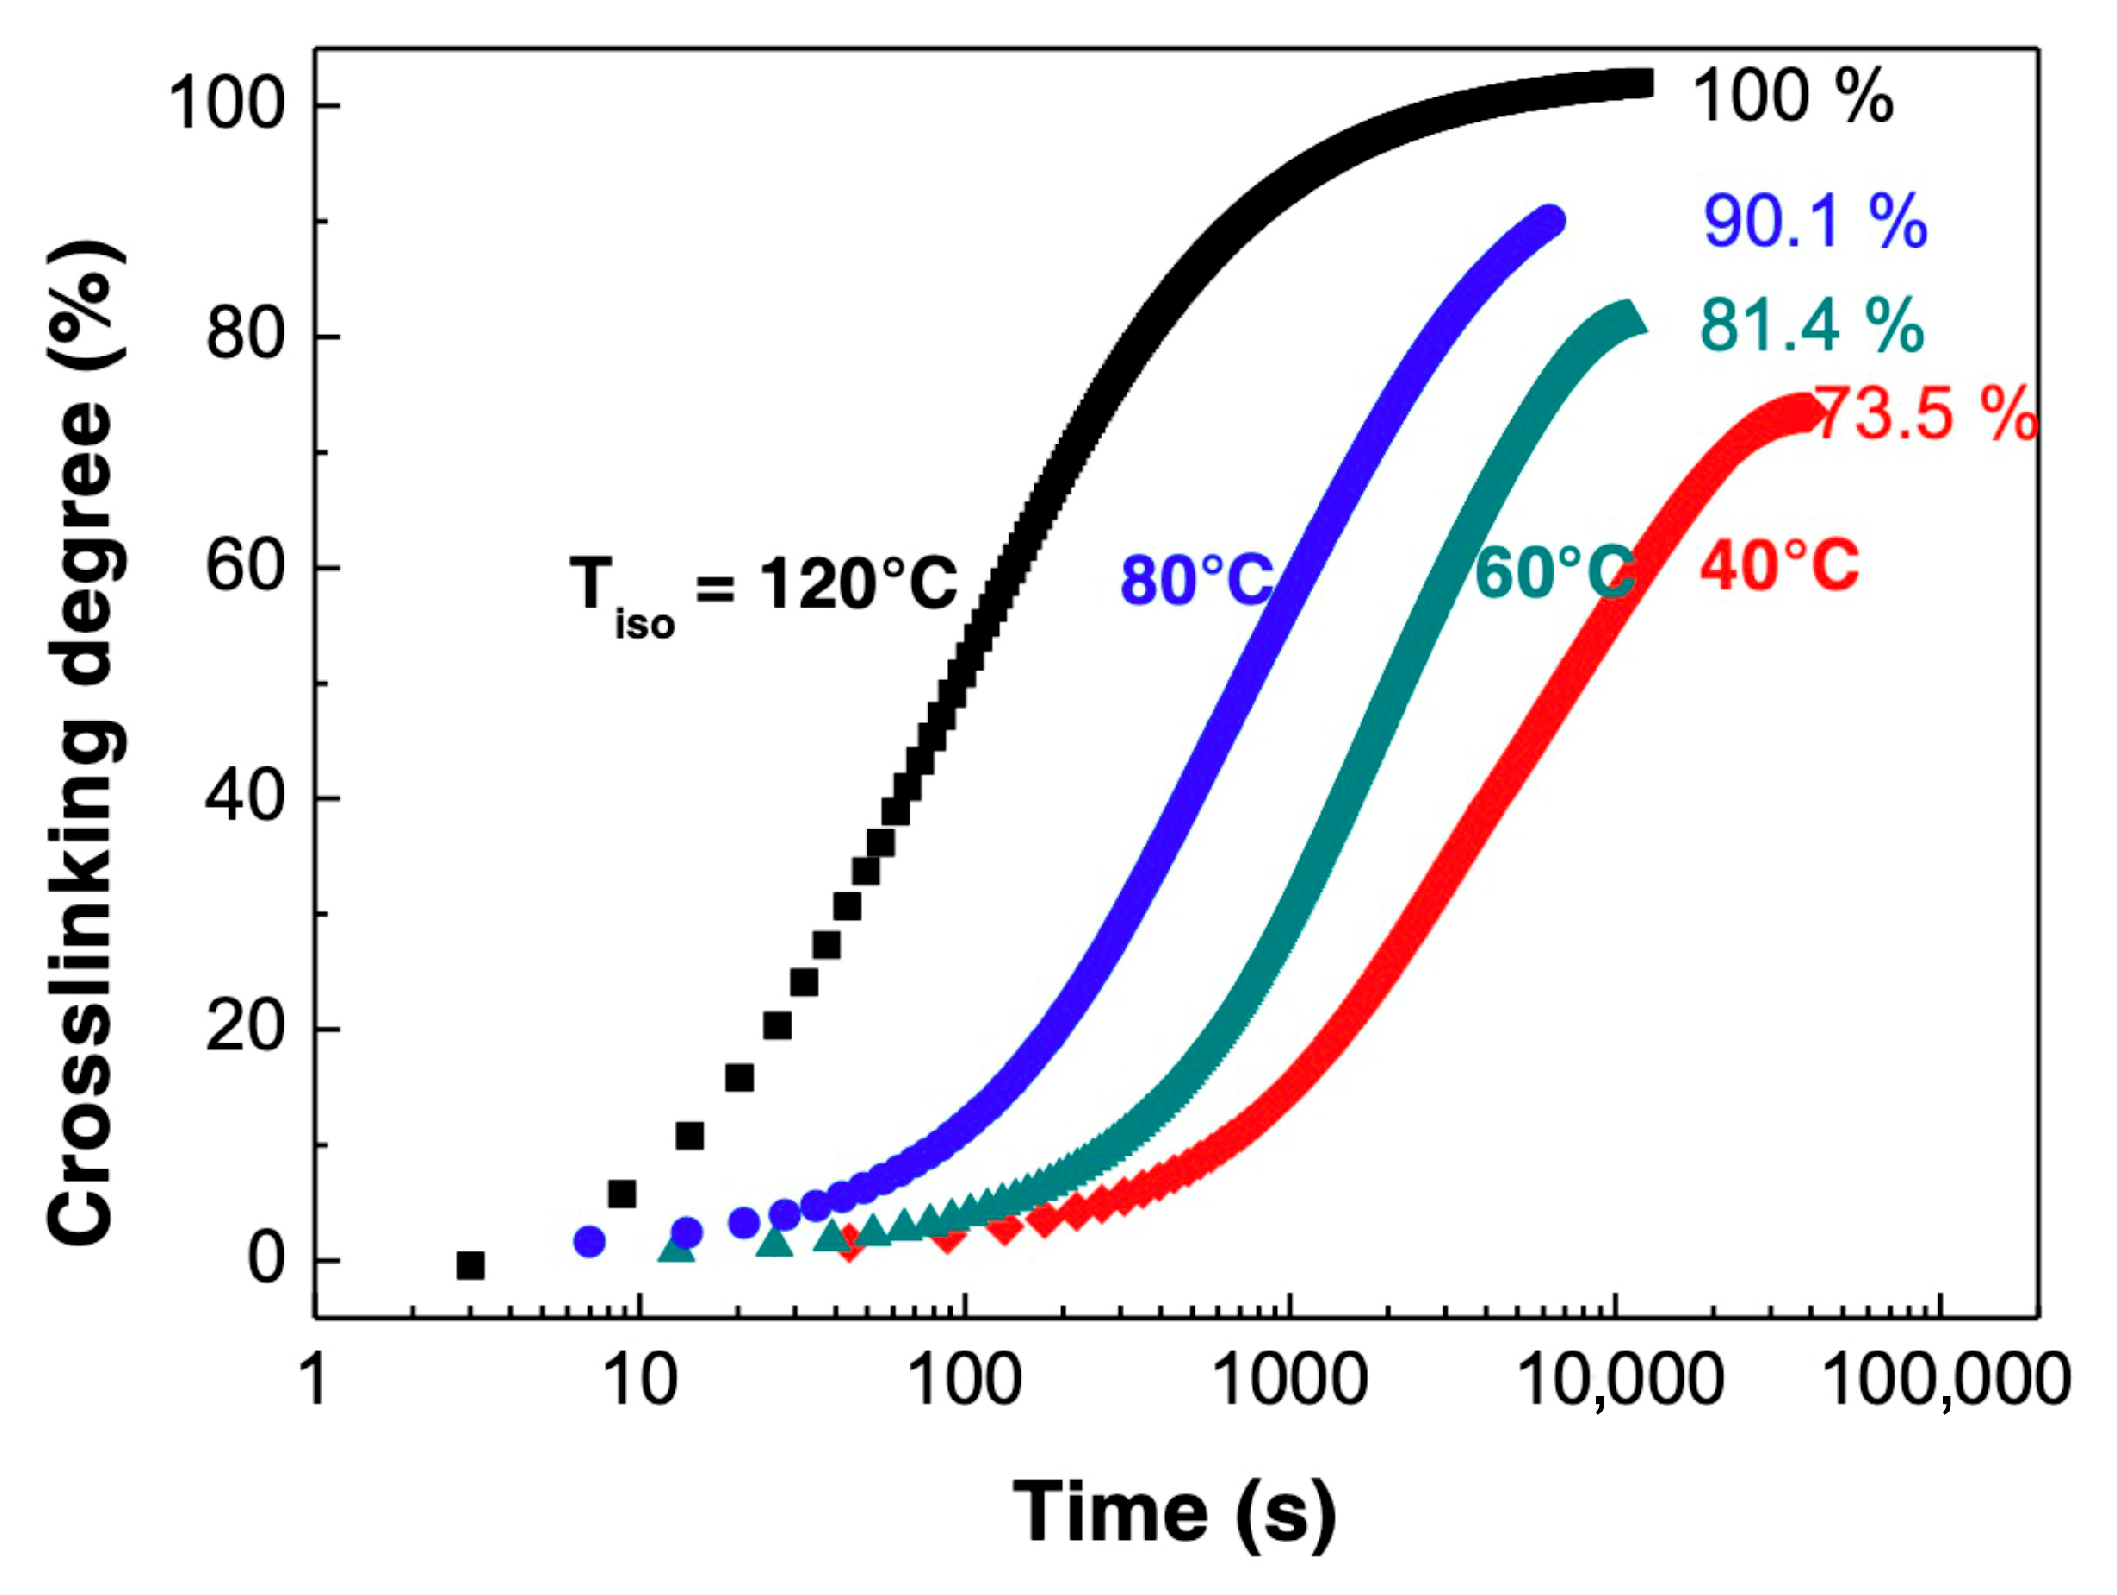
To describe the crosslinking behaviour of epoxy resins, isothermal curing is often used in the literature [37,38,39,74,75]. This is why we have also chosen such experimental protocol, which has also the advantage of facilitating the correlations of data obtained with different techniques. Figure 5 shows the evolution of the crosslinking degree of the neat epoxy resin as a function of time at four different isothermal curing temperatures obtained with DSC measurements under a 40 cm3·min−1 nitrogen flow.
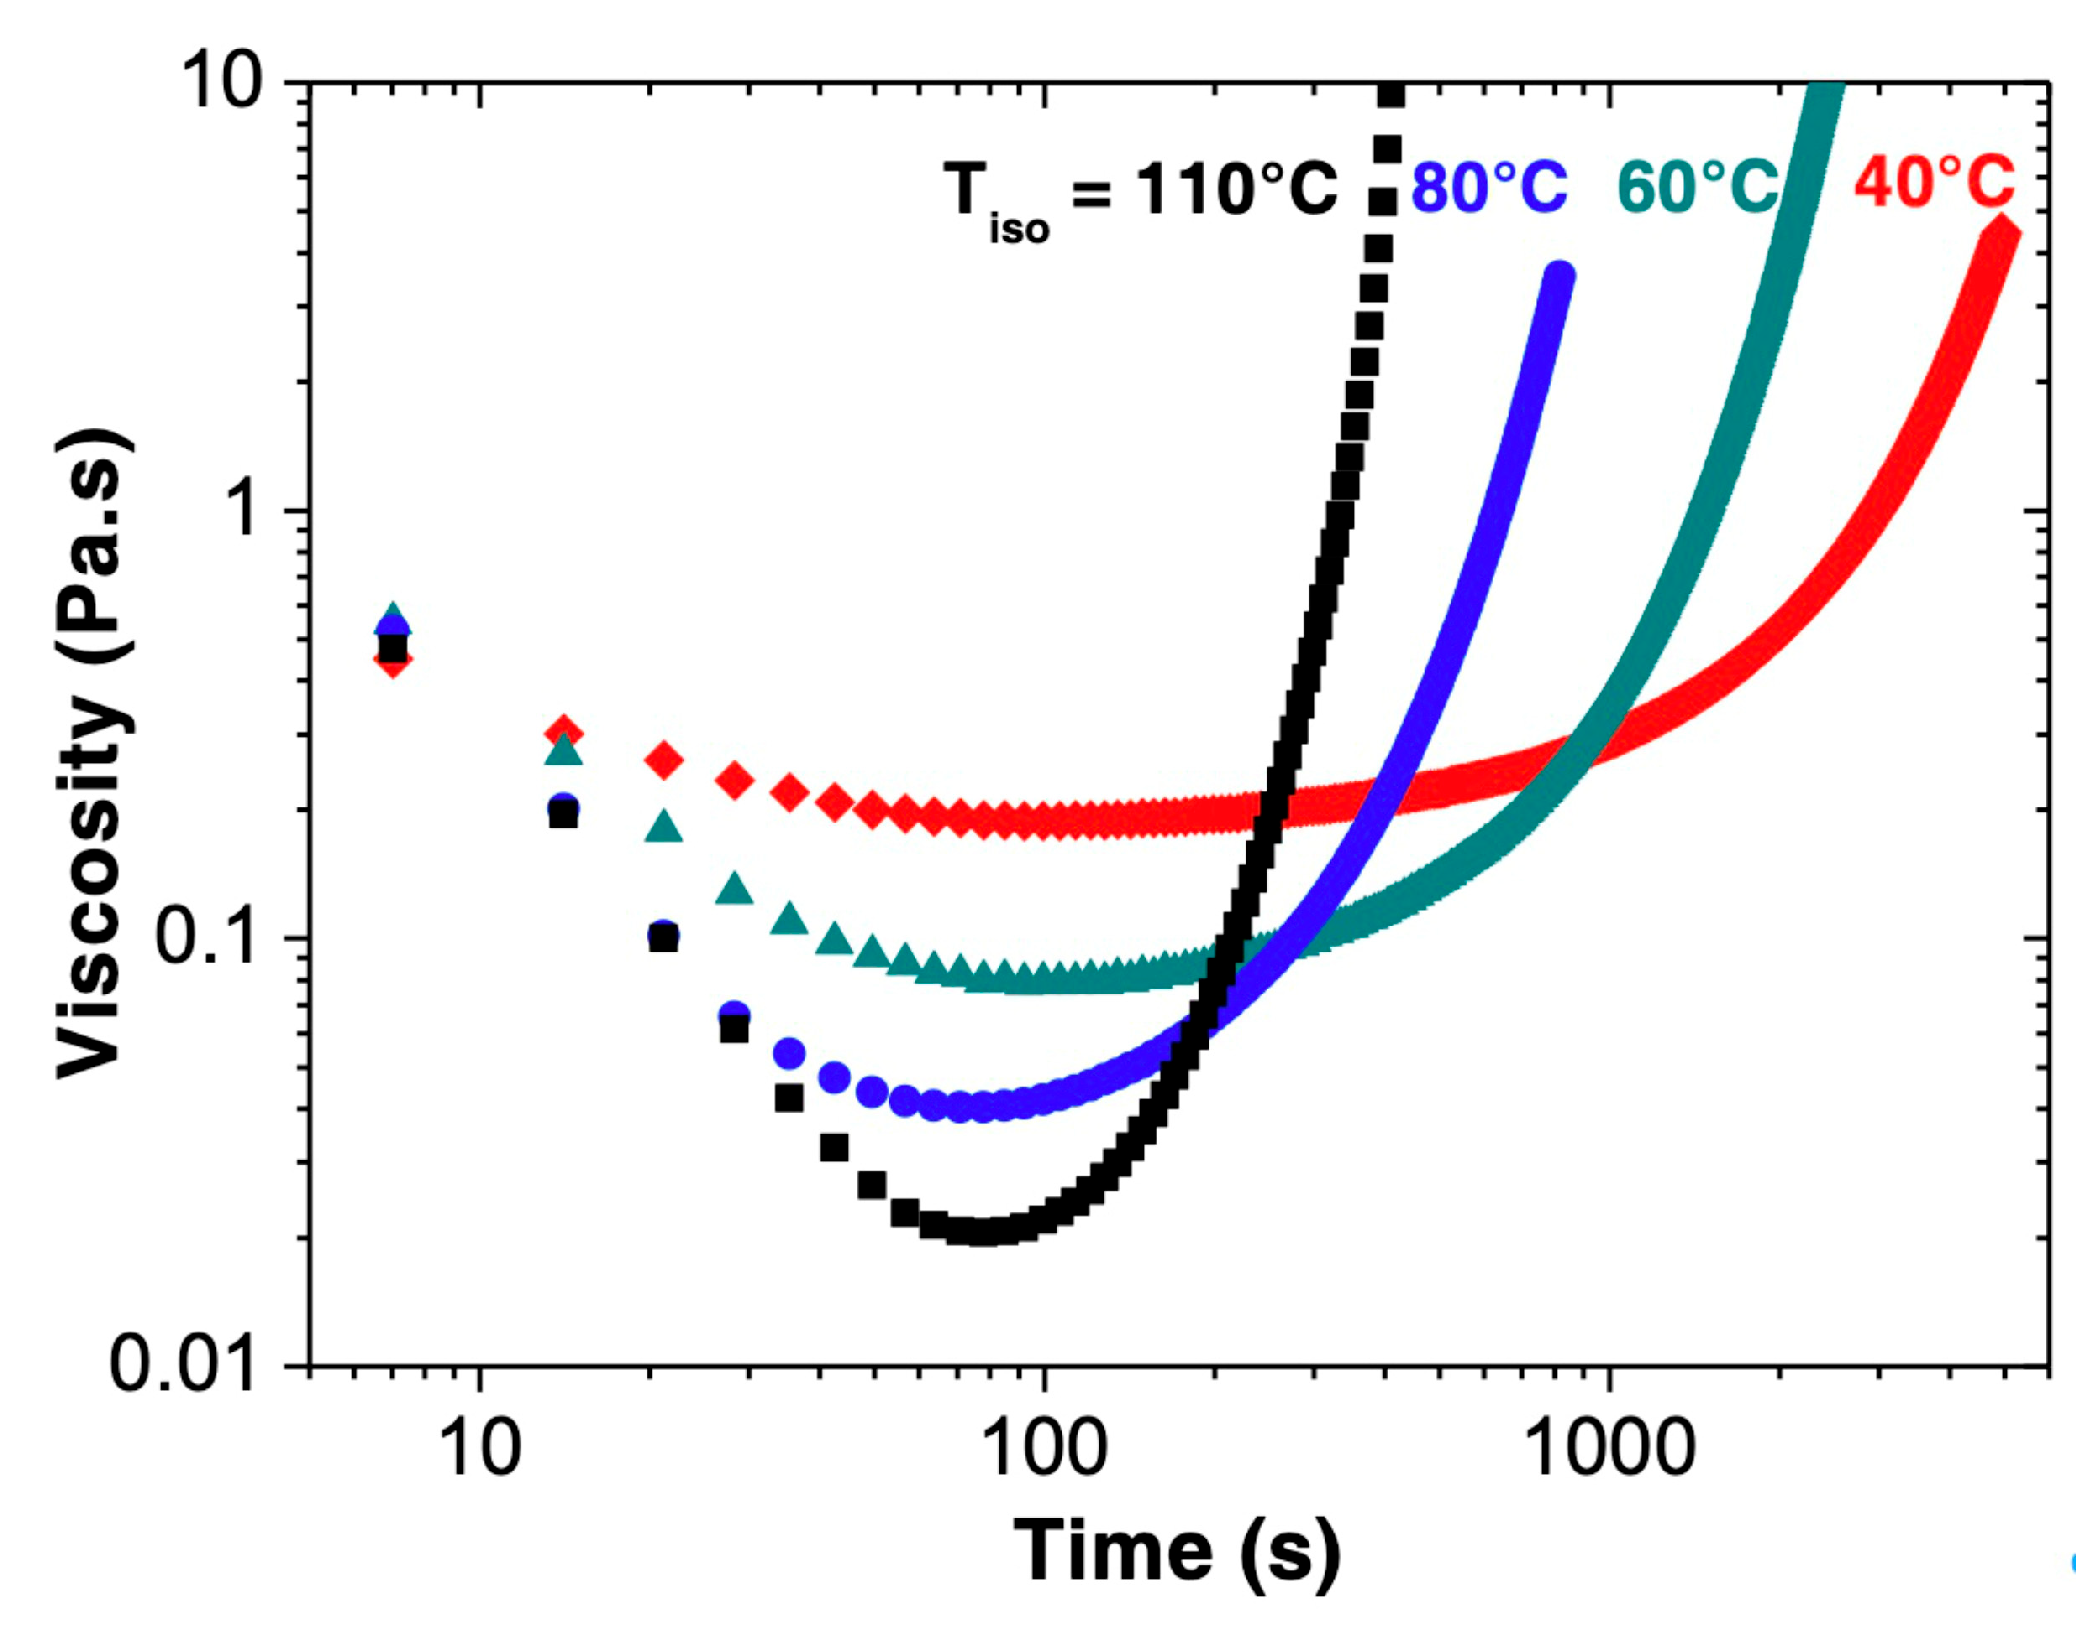
The crosslinking curves’ evolution is similar for all four temperatures. They all exhibit a sigmoidal shape with an increase in the crosslinking degree with time. An increase in the temperature accelerates the start of the crosslinking rise, occurring respectively after 2, 70, 300, and 600 s for 120, 80, 60, and 40 °C. The crosslinking degree of the final plateau also increases with temperature, respectively, at 100, 90, 80, and 70% for 120, 80, 60, and 40 °C. This behaviour during isothermal curing is consistent with previous works [37,71,72,74,75,76,77]. Firstly, the epoxy and amine groups are free to react with one another, leading to a sharp increase in the crosslinking degree. Simultaneously, both the viscosity and glass transition temperature (Tg) increase because of the reduced chains’ mobility. Once the Tg is above the isothermal temperature, the resin is in a glassy state, and the curing rate strongly decreases, leading to a nearly constant crosslinking degree. Figure 6 presents the evolution of the resin’s viscosity as a function of time during isothermal curing.
A first decrease in the viscosity is visible during the first 100 s. This decrease is larger at higher temperatures. It corresponds to the resin’s softening during the heating ramp similar to non-isothermal curing [44]. The following sharp increase in viscosity indicates the resin’s crosslinking reaction, which is enhanced at higher temperatures. Roller [78] used the following empirical model, shown in Equation (2), to describe the viscosity evolution during isothermal treatment:
ln ( η ) = ln ( η 0 ) + k · t
where η is the viscosity, η0 is the initial viscosity, t is the time, and k is an apparent kinetic factor sensitive to temperature with an Arrhenius law k  = A   e x p   ( E a R · T ) [79]. A is a constant, Ea is the activation energy, T is the temperature (K) and R is the perfect gas constant.
In Figure 6, once the viscosity reaches its minimum around 100 s, the following behaviour is coherent with the empirical model described. For the first 100 s, the softening of the resin with temperature is therefore predominant over the crosslinking reaction in terms of the resin’s viscosity.
To describe the evolution of the curing rate of the resin with time, Kamal and Sourour [74] proposed a model described by Equation (3):
d α d t = ( k 1 + k 2 α m ) ( 1 α ) n
where /dt is the curing rate, and α is the crosslinking degree. k1 is the parameter describing the rate constant of the reaction with the partial order n and k2 is the parameter corresponding to the autocatalytic reaction with the partial order m. n and m are independent of the temperature, contrary to k1 and k2, which follows an Arrhenius relation k 1   =   A 1 e x p   ( E 1 R · T ) and k 2   =   A 2 e x p ( E 2 R · T ) [76].
A least-squares algorithm with Kamal and Sourour’s equation was used to find the resin’s curing parameters. The partial orders m and n are independent of temperature, being 0.5 and 2.0–2.3, respectively. In contrast, k1 and k2 are highly affected by the temperature (E1 = 3.8 × 101 and E2 = 8.8 × 101 kJ·mol−1), and k2 is several orders of magnitude higher than k1 (A1 = 2.9 × 10² and A2 = 9.7 × 10⁹ s−1), suggesting that the autocatalytic reaction is predominant over the constant rate of reaction. These values agree with previous studies [71,80], as shown in Table 1. To find a relation between the change in resistance of a resin filled with CNT and the state of cure, this evaluation of the resin-curing characteristics will allow estimation of the resin’s crosslinking degree during the characterisation of the resin filled with CNT electrical behaviour with an isothermal curing.

3.2. Resistance Behaviour of an Epoxy–Carbon Nanotubes Nanocomposite Sensor During an Isothermal Treatment

To investigate the electrical behaviour of a QRS made of epoxy resin filled with 2 wt.% CNT (EP-2CNT) during isothermal treatments, two cases are studied. In the first case, the sensor is subjected to different isothermal curing without adding the hardener. No crosslinking reaction proceeds, so only the effect of temperature on the sensor’s resistance is seen. In the second case, the hardener is added and the effects of both the temperature and the crosslinking reaction (exothermic) on the resistance are observed. Comparing the two behaviours allows us to investigate the correlation between the resin’s crosslinking degree and the change in resistance. Figure 7 presents the evolution of the normalised electrical resistance of the sensor without crosslinking under different isothermal treatments.
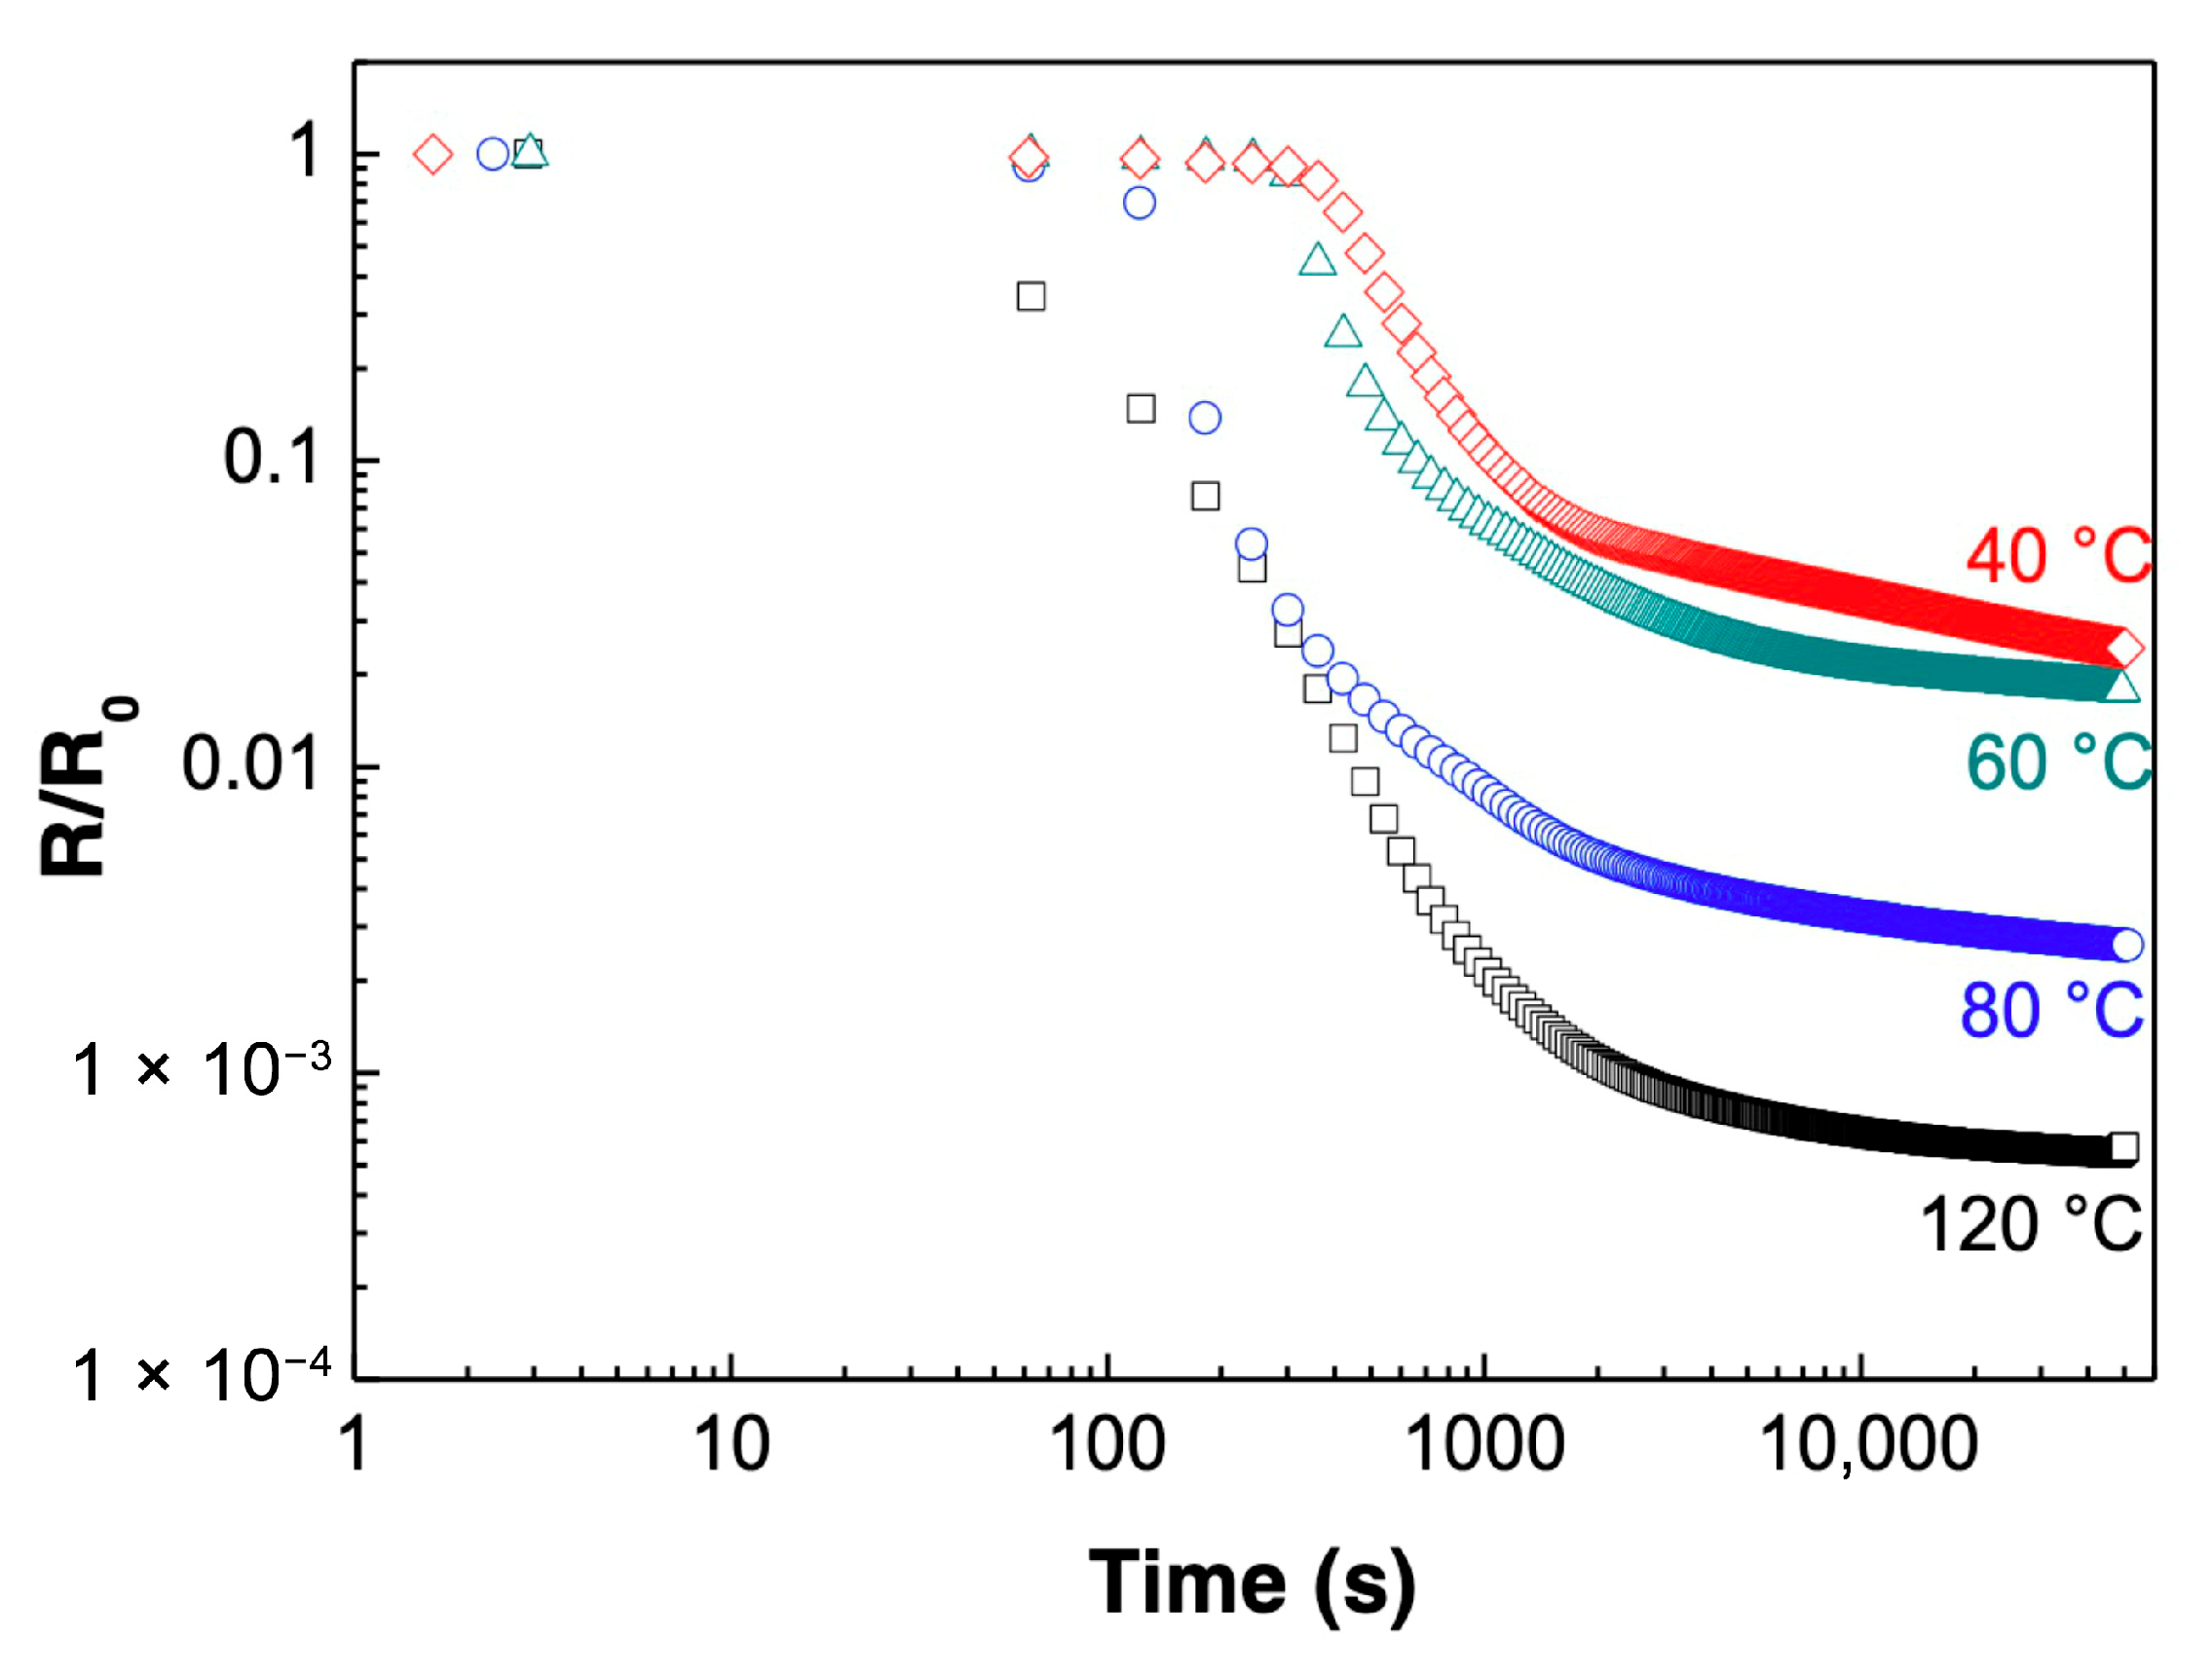
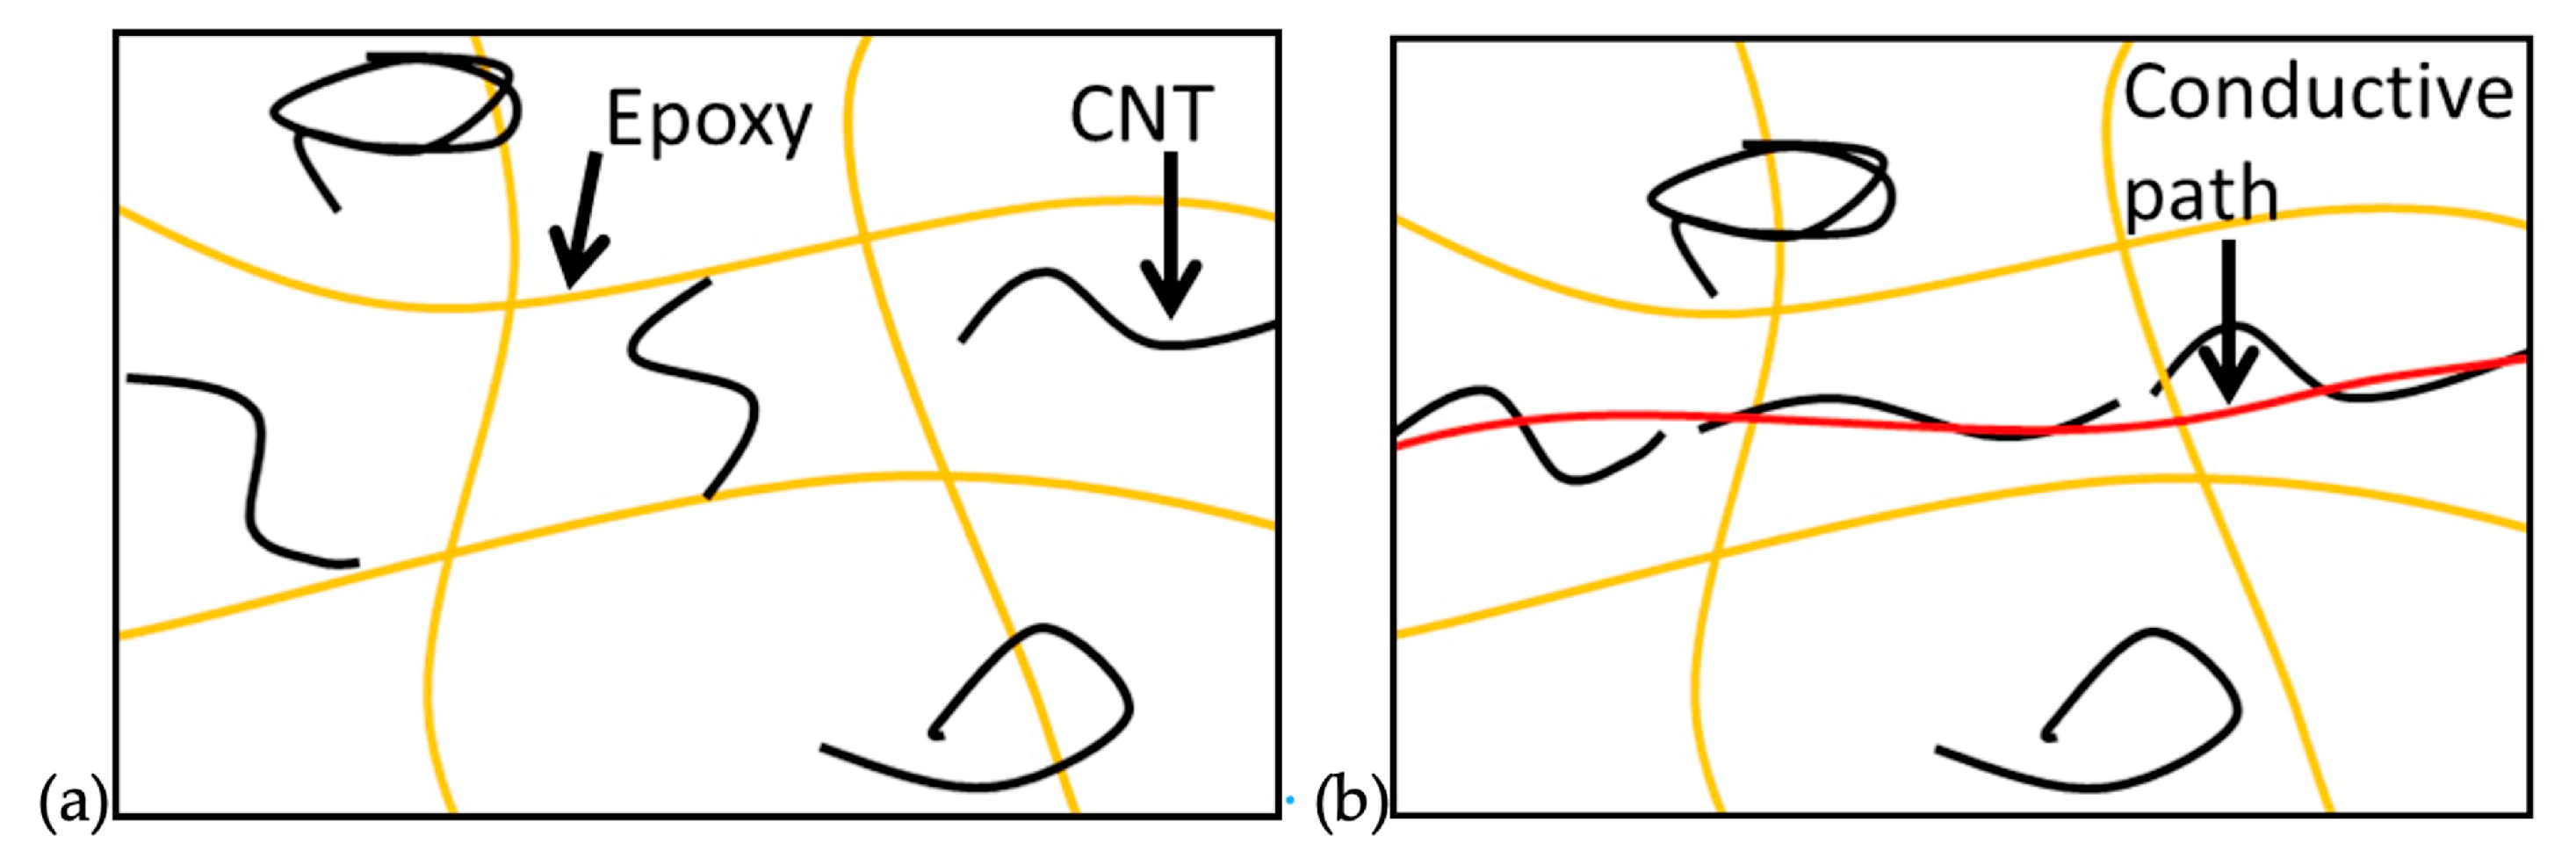
For all temperatures, the resistance is first stable for a short time, which is followed by a sharp decrease. This drop occurs earlier with an increase in the isothermal temperature (after 30, 100, 260, and 400 s for 120, 80, 60, and 40 °C, respectively). Finally, the resistance becomes stable. The decrease in the final resistance significantly increases with higher isothermal temperatures (ratio Rt = 4000/Rt = 0s of 7.9 × 10⁻⁴, 4.0 × 10⁻³, 2.7 × 10⁻², and 4.6 × 10⁻² for 120, 80, 60, and 40 °C, respectively). This behaviour is in good agreement with that observed in 2002 by Wu et al. [81] with various thermoplastics matrices filled with carbon nanoparticles (CNP) and with a temperature range between 160 and 220 °C. The authors studied the effect of time and temperature on the resin’s resistivity. They observed that the final decrease could be larger than six orders of magnitude. They reported that the increase in the temperature also reduced the initial stable time, the value of the final plateau, and the transition period between the two parts. The authors called this phenomenon “dynamic percolation”. As for the static percolation, the conductivity of the matrix increases by several orders of magnitude with the formation of the conductive network made of percolated particles. However, this transition is not induced by the addition of fillers as for the static percolation but simply by the self-agglomeration of the nanofillers due to the increase in Brownian movement without any additional mechanical solicitation, as depicted in Figure 8. Dynamic percolation is powered by the movement of macromolecules activated by temperature in the liquid state thanks to a decrease in viscosity well monitored by rheological measurements. Although viscosity is slightly altered by the presence of a nanotubes network, CNT are more likely to come in contact with each other and as they come closer to each other; they can interact by Van der Waals interaction of pi–pi stacking creating new contacts or hopping possibilities for electrons. In quantum tunnelling, transducers made of random networks of carbon nanotubes do not need to be completely in contact to allow the circulation of electrons and make the composite conductive. What is described in Figure 8 is the beginning of the conduction process due to the jump of electrons by hopping through gaps between nanotubes becoming small enough.
Zhang et al. proposed a model for the dynamic percolation in thermoplastics matrices, which is described by Equation (4) [82]:
P t =   P P P 0 e x p ( t τ )
where P(t), P and P0 are the percolation’s levels at time t, infinite time and time t = 0, and τ is the relaxation time τ = c η k B T , with η representing the viscosity of the resin, kB the Boltzmann constant, T the temperature, and c a constant linked to matrix entanglement, molar mass, and its interaction with the filler.
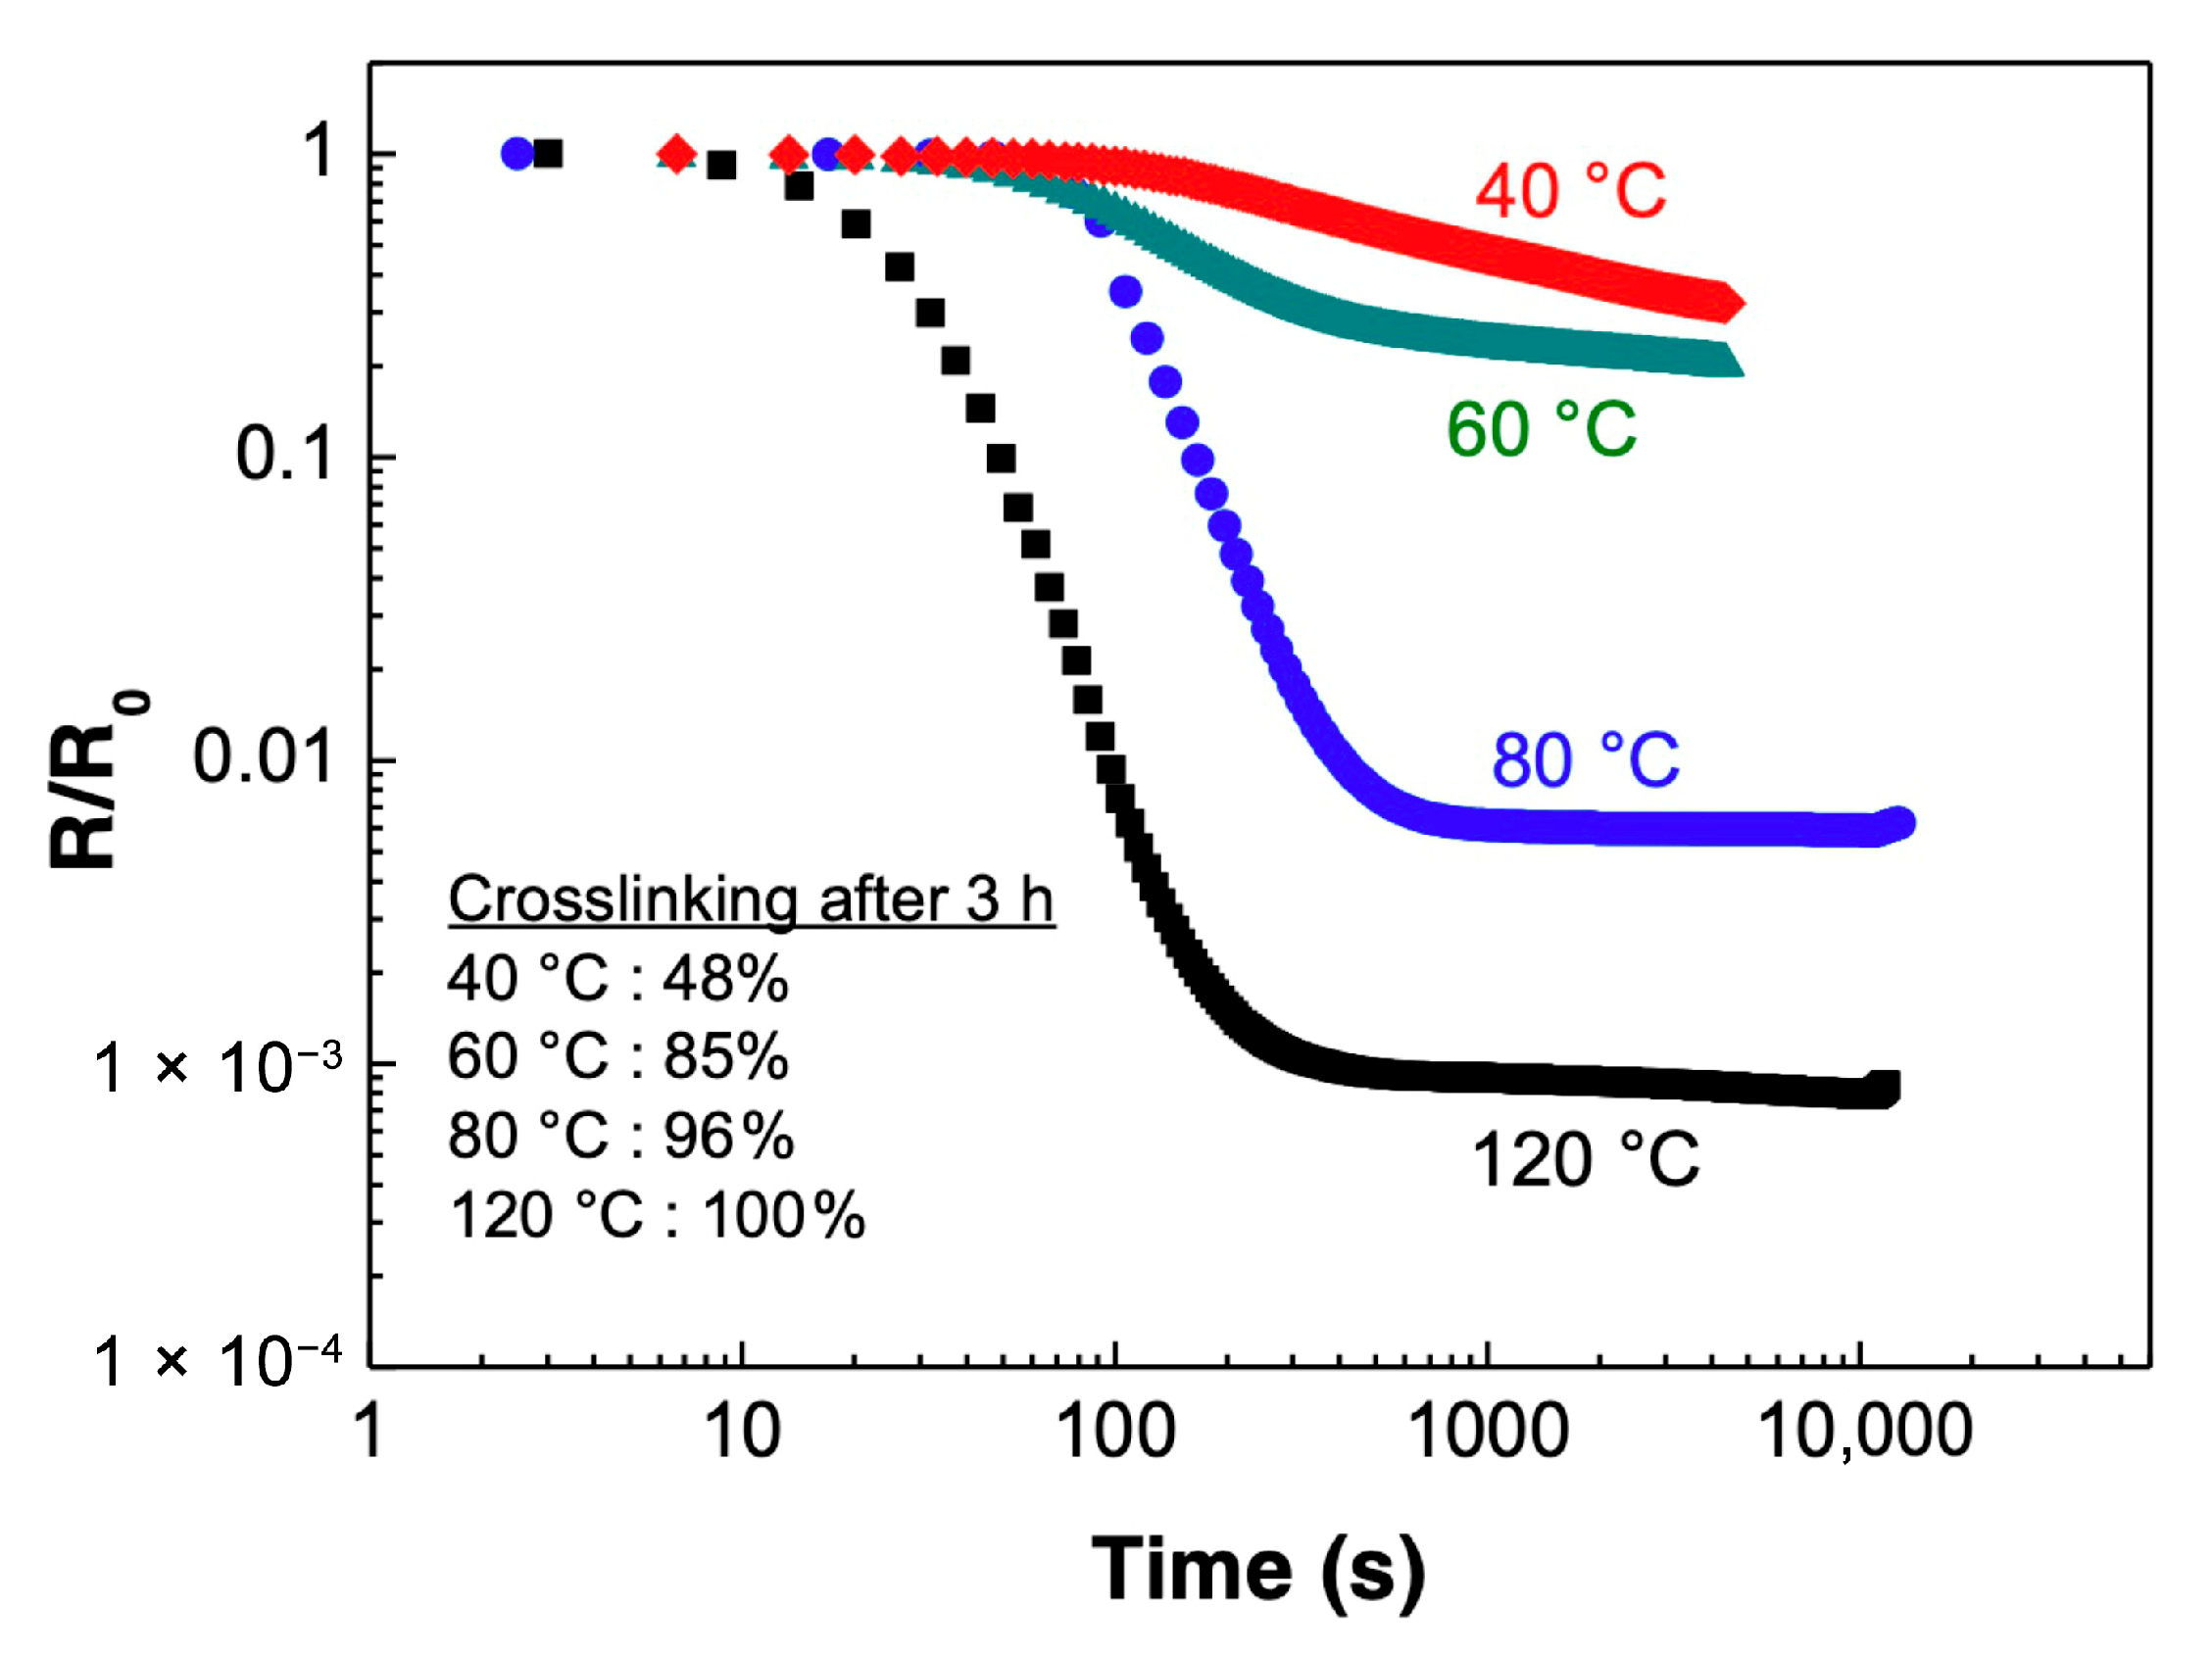
The dynamic percolation was therefore assumed to be a temperature-activated mechanism via an Arrhenius law [83,84]. These authors found that the self-assembly velocity of carbon fillers in a thermoplastic matrix increased with annealing temperature, and that the conductive pathways formed in the matrix after annealing increased the activation energy compared to that of the pure polymer. Dynamic percolation also enabled a reduction in the static percolation threshold [85]. Bilotti et al. [86,87] used a thermoplastic poly(urethane) matrix filled with CNT up to 3 wt.%. They have shown that the dynamic percolation was controlled by the resin’s viscosity. An increase in temperature led to the decrease in the resin’s viscosity and therefore favoured the dynamic percolation. Zhang et al. [88] have observed similar results with CNT fillers in a phenoxy matrix with a weight percentage from 0.5 to 1.5 wt.%. They observed that the change in the matrix to a more fluid state, and therefore a diminution of the viscosity, enhanced the dynamic percolation of CNT. A similar decrease in the resin’s viscosity with temperature is visible in Figure 6 during the first 100 s. A higher decrease of 1 order of magnitude is noticeable at 110 °C compared to 40 °C. In the presence of CNT in the resin, a similar viscosity behaviour can be expected. In addition to temperature, the amount of fillers reduces the distance between all the nanoparticles and favours the formation of the conductive network [81]. Moreover, for thermoplastic matrices, Alig et al. [89] have studied the possible recovery of a percolated network after a transient shear. They observed that after the destruction of the network, the dynamic percolation allowed the recovery of an equivalent final conductivity. The initial network state had therefore little influence on the final conductivity, contrarily to the thermal treatment. Consequently, the conductivity of a thermoplastic matrix filled with conductive fillers during a thermal treatment depends on the filler and the matrix nature, the amount of filler, and the time and temperature of the thermal treatment. Hence, in the absence of crosslinking, the dynamic percolation of CNT in a thermoset epoxy resin can be considered similarly to the one in a thermoplastic matrix (Figure 7). To estimate the influence of crosslinking on the QRS electrical behaviour, the evolution of the sensor’s resistance during isothermal treatment with crosslinking is shown in Figure 9. Although both curves have the same shape, crosslinking is speeding up the drop of resistance.
For all temperatures, the electrical resistance behaviour has a sigmoidal shape. A first stable part is visible for a short time, which is followed by a decrease. This drop happens earlier with an increase in the isothermal temperature (after 15, 70, 100, and 160 s for 120, 80, 60, and 40 °C, respectively). Finally, the resistance reaches a plateau with little variation except for 40 °C. For this temperature, the plateau is expected to last more than 3 h of isothermal curing. The decrease in the final resistance increases with higher isothermal temperatures (ratio Rt = 4000/Rt = 0s of 8.4 × 10⁻⁴, 5.9 × 10⁻³, 2.0 × 10⁻¹, and 3.3 × 10⁻¹ for 120, 80, 60, and 40 °C respectively). Davis et al. [90] reported a similar disparity of the final resistance of an epoxy–CNT composite after two isothermal curing rounds. They observed an average one-decade decrease from 25 to 80 °C with DC measurements, while no noticeable effect was visible on AC measurements. Furthermore, this phenomenon is not limited to CNT particles. Prasse et al. [91] investigated the influence of the temperature on the resistance of 0.6 wt.% of CNP in epoxy during the resin crosslinking. As for CNT, the increase in temperature favours the agglomeration of the particles with a decrease in nearly three decades of resistivity for 28 °C (107 Ω cm) and 38 °C (104 Ω cm).
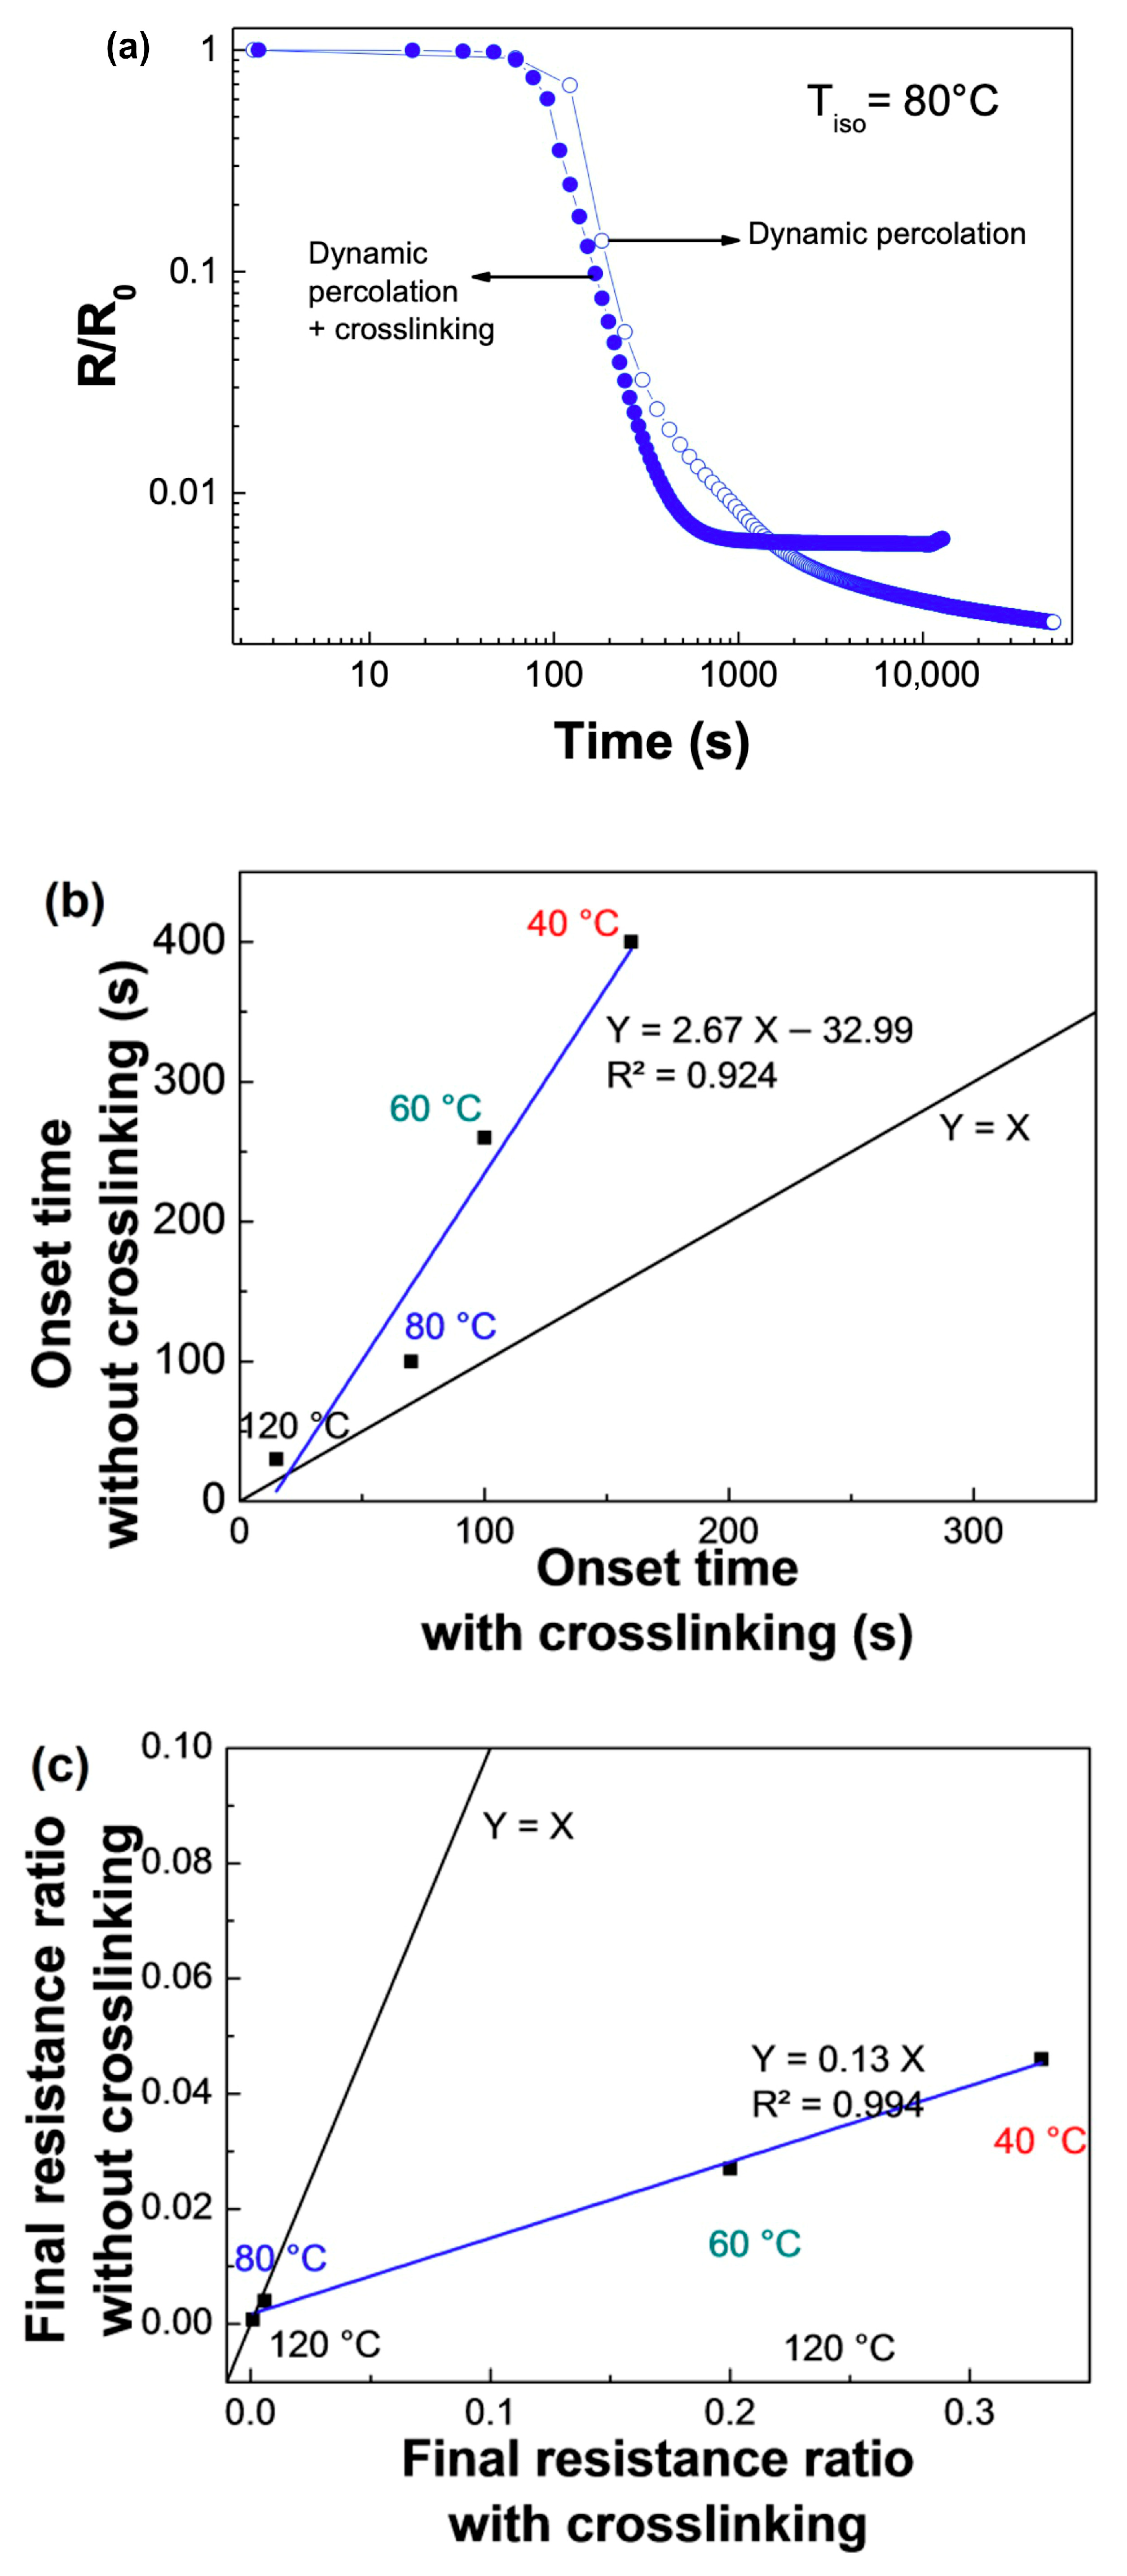
Table 2 summarises the onset time of percolation and the sensor’s resistance variation ratio after 4000 s for the different temperatures in the presence or not of crosslinking. As illustrated in Figure 10a, for the temperature of 80 °C, the onset time of the dynamic percolation and the final conductance are reduced in the presence of crosslinking. For the four temperatures, the onset time decreases with an average of 2.67, as shown in Figure 10b.
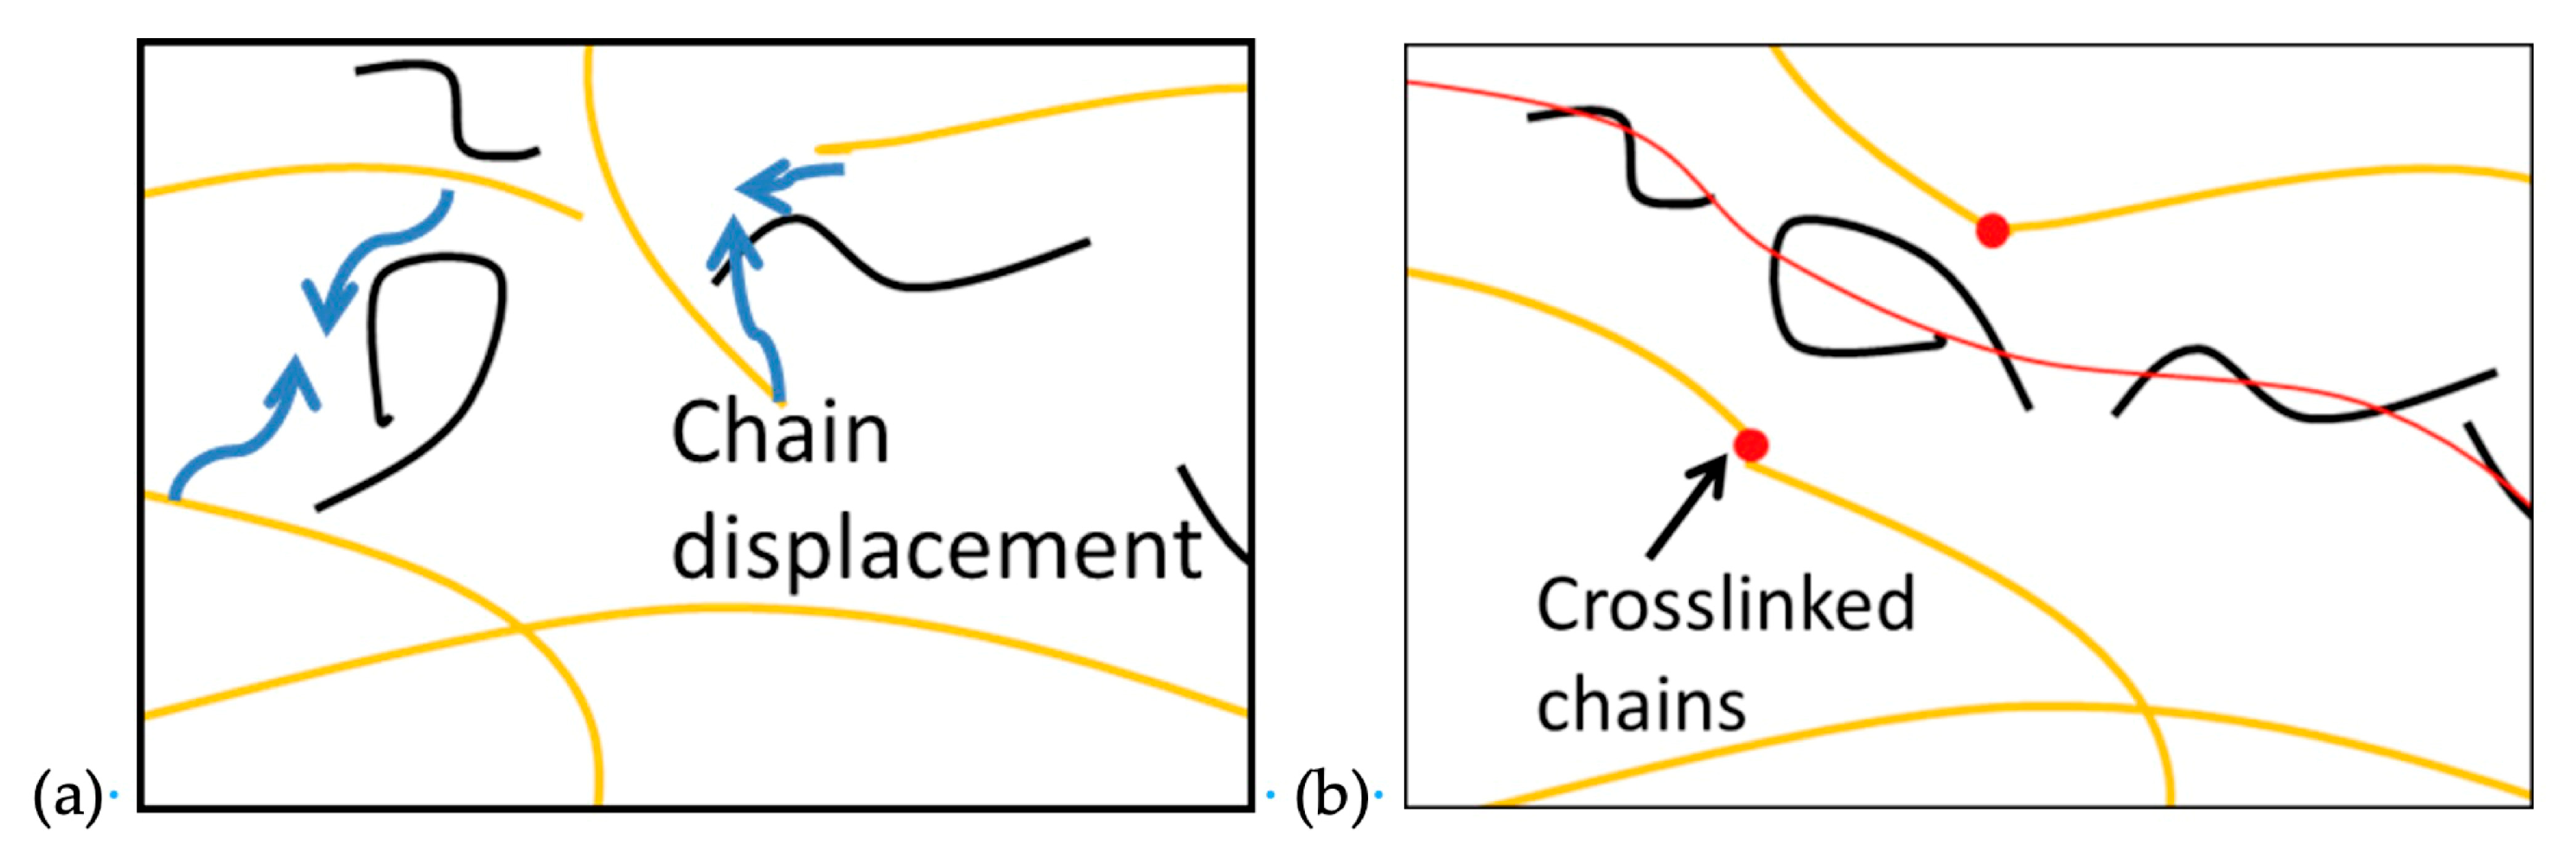
The initial acceleration of the resistance drop in the presence of crosslinking can be explained by the improvement of chains’ mobility thanks to the viscosity decrease and the enhancement of CNT/CNT interactions, as illustrated in Figure 11. In a second step, crosslinking is resulting in volume exclusion that tends to segregate CNT and favours their dynamic percolation.
Also shown in Figure 8a, crosslinking results in a sharper resistance change, around 700 s for 80 °C, compared to simple thermally activated dynamic percolation. Without crosslinking, the decrease in the resistance’s slope is more progressive. The increase in the crosslinking degree leads to an exponential rise of the resin’s viscosity (Equation (2)) [92], as illustrated also in Figure 4 after 100 s. Therefore, the CNT mobility and their agglomeration are reduced [86,87]. A competition occurs between the viscosity’s increase, which reduces the CNT mobility, and the volume exclusion of CNT, which favours their agglomeration. As it can be seen in Figure 7, after a stop time of ts = 300, 1000, and 2000 s for 120, 80 and 60 °C, respectively, the resistance’s variation can be considered negligible, whereas for 40 °C, no stable state is reached, suggesting that crosslinking and dynamic percolation are still proceeding. This indicates the time when the viscosity is too high to allow the CNT movement in the matrix. Therefore, increasing the temperature reduces the percolation’s time of CNT with crosslinking in accordance with the viscosity behaviour. Moreover, at the time ts, the crosslinking degree is 77%, 58%, and 49% for 120, 80 and 60 °C, respectively. The increase in the temperature allows the resin to be in a more rubber state until a higher crosslinking degree, and therefore the dynamic percolation happens on a higher range of crosslinking degree. In the absence of crosslinking, the resistance’s decrease is less substantial. In the two cases, the resistances are equal after a time of 3060, 1630 and 420 s for 120, 80 and 60 °C, respectively. This increase in the convergence time suggests that regarding time, volume exclusion is more effective at high temperature. After 4000 s, the resistance is ten times lower on average without crosslinking, as shown in Figure 10c. It depicts the fact that without crosslinking, the dynamic percolation is not affected by a viscosity increase.
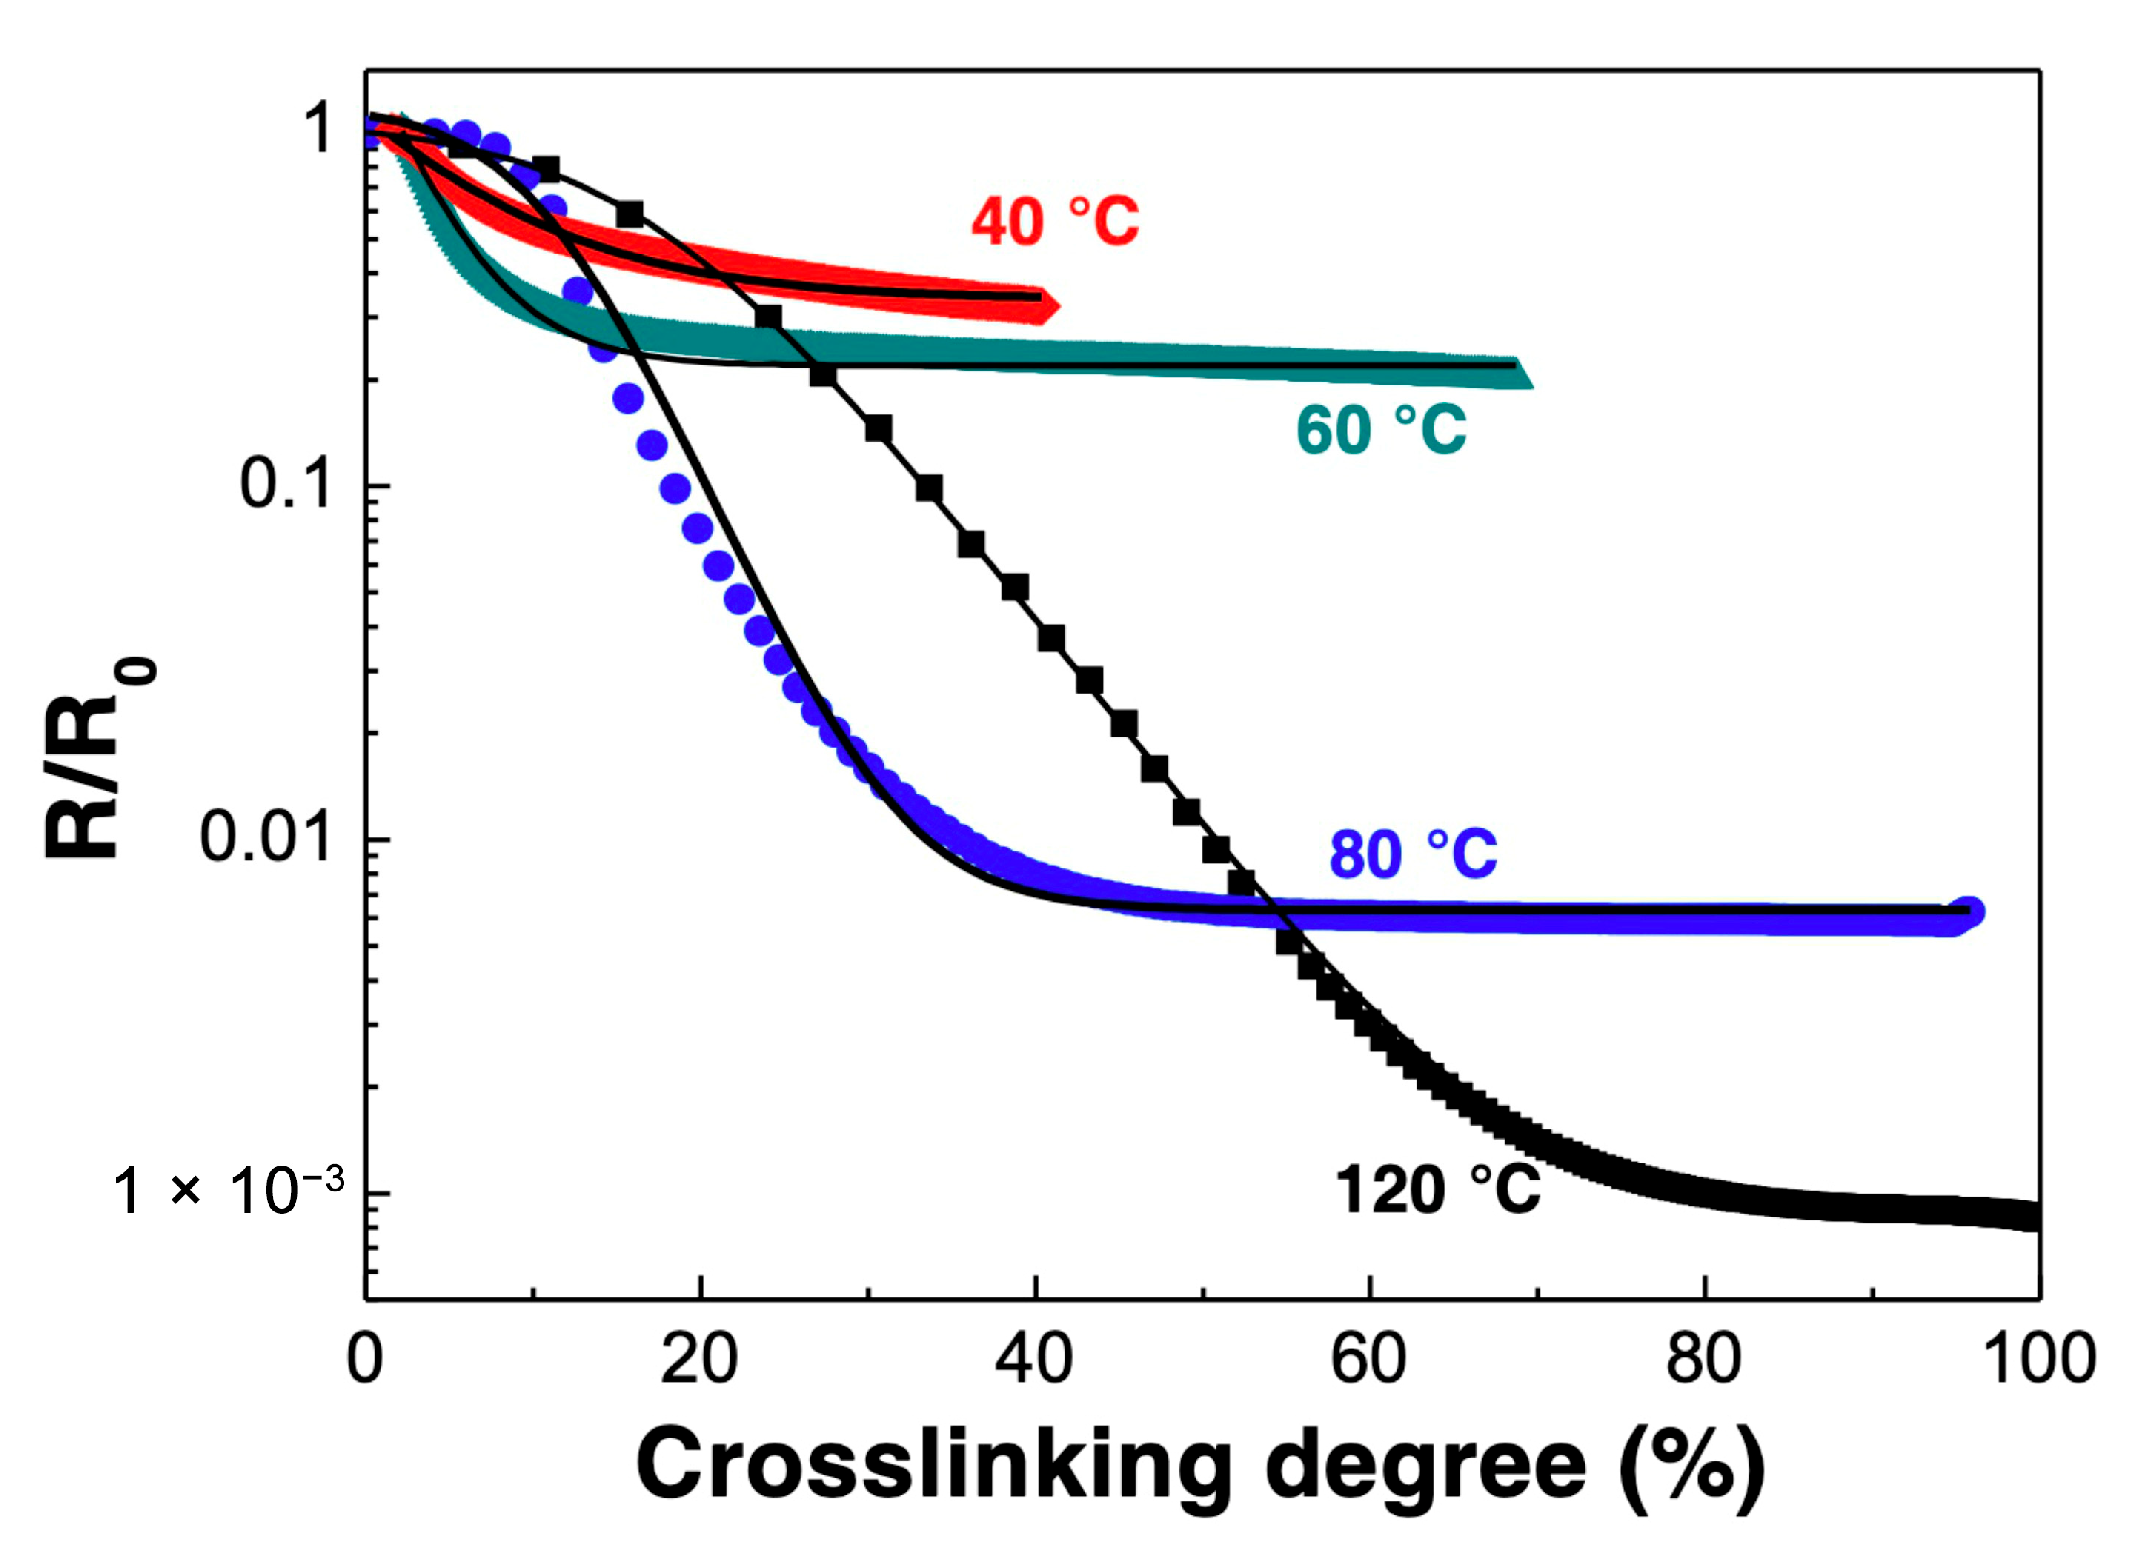
Addition of a crosslinking behaviour to the matrix filled with CNT, during isothermal curing, leads to a first dynamic percolation’s enhancement with the volume exclusion, which is followed by a sharp decrease due to the viscosity increase. To correlate the change in resistance with the crosslinking degree, the assumption that CNT do not significantly affect the crosslinking degree has to be made in a first approximation [70,71]. Based on the evolution of crosslinking versus time for neat epoxy shown in Figure 6 and on the evolution of the QRS resistance with crosslinking versus time illustrated in Figure 9, the evolution of the QRS resistance during the crosslinking is represented in Figure 12.
For all temperatures, the resistance behaviour exhibits a sigmoidal shape. A first constant part is visible, which is followed by a decrease. The drop happens at a lower crosslinking degree with a decrease in the isothermal temperature (after 15%, 10%, nearly 0%, and 0% for 120, 80, 60, and 40 °C, respectively). Finally, the resistance reaches a plateau with little variation except for at 40 °C. It is coherent with Figure 9 where the resistance was not stable after 3 h. The range of decrease is larger as the resistance increases. It is about 20, 20, 40, and 80% for 40, 60, 80 and 120 °C, respectively. At low temperatures, even though the CNT mobility is reduced, the crosslinking advancement lasts longer than for high temperature, as shown in Figure 6. This enables more time for the CNT to agglomerate than at higher temperatures, but they have also less energy to do so. Nevertheless, if the viscosity is too high, whatever the reason, the resistance keeps constant with the crosslinking advancement, which occurs over a critical crosslinking degree and/or under a critical temperature. At higher temperatures, the CNT mobility can still occur until a higher crosslinking degree, which leads to a final lower resistance. It results that the sensor’s electrical behaviour during the epoxy isothermal crosslinking is affected by the chemical reaction and the resin’s viscosity, which are both depending on temperature. At a low crosslinking degree, the change in resistance can be considered mainly due to the crosslinking behaviour. At a high crosslinking degree, the temperature can be considered as the main factor of the resistance decrease. For each temperature, the sensor’s electrical behaviour is unique and can be linked to the crosslinking degree. A fitting has therefore been made on Figure 12 with the Boltzmann model shown in Equation (5) and the fitting parameters shown in Table 3. The fitting is in accordance with the experimental results thanks to the R2 included between 0.98 and 0.99.
R R 0 = A + ( B A ) 1 + e x p ( α C D )
where A, B, C and D are the independent parameters and α is the crosslinking degree.

3.3. Case Study: Composite Part Curing Monitoring

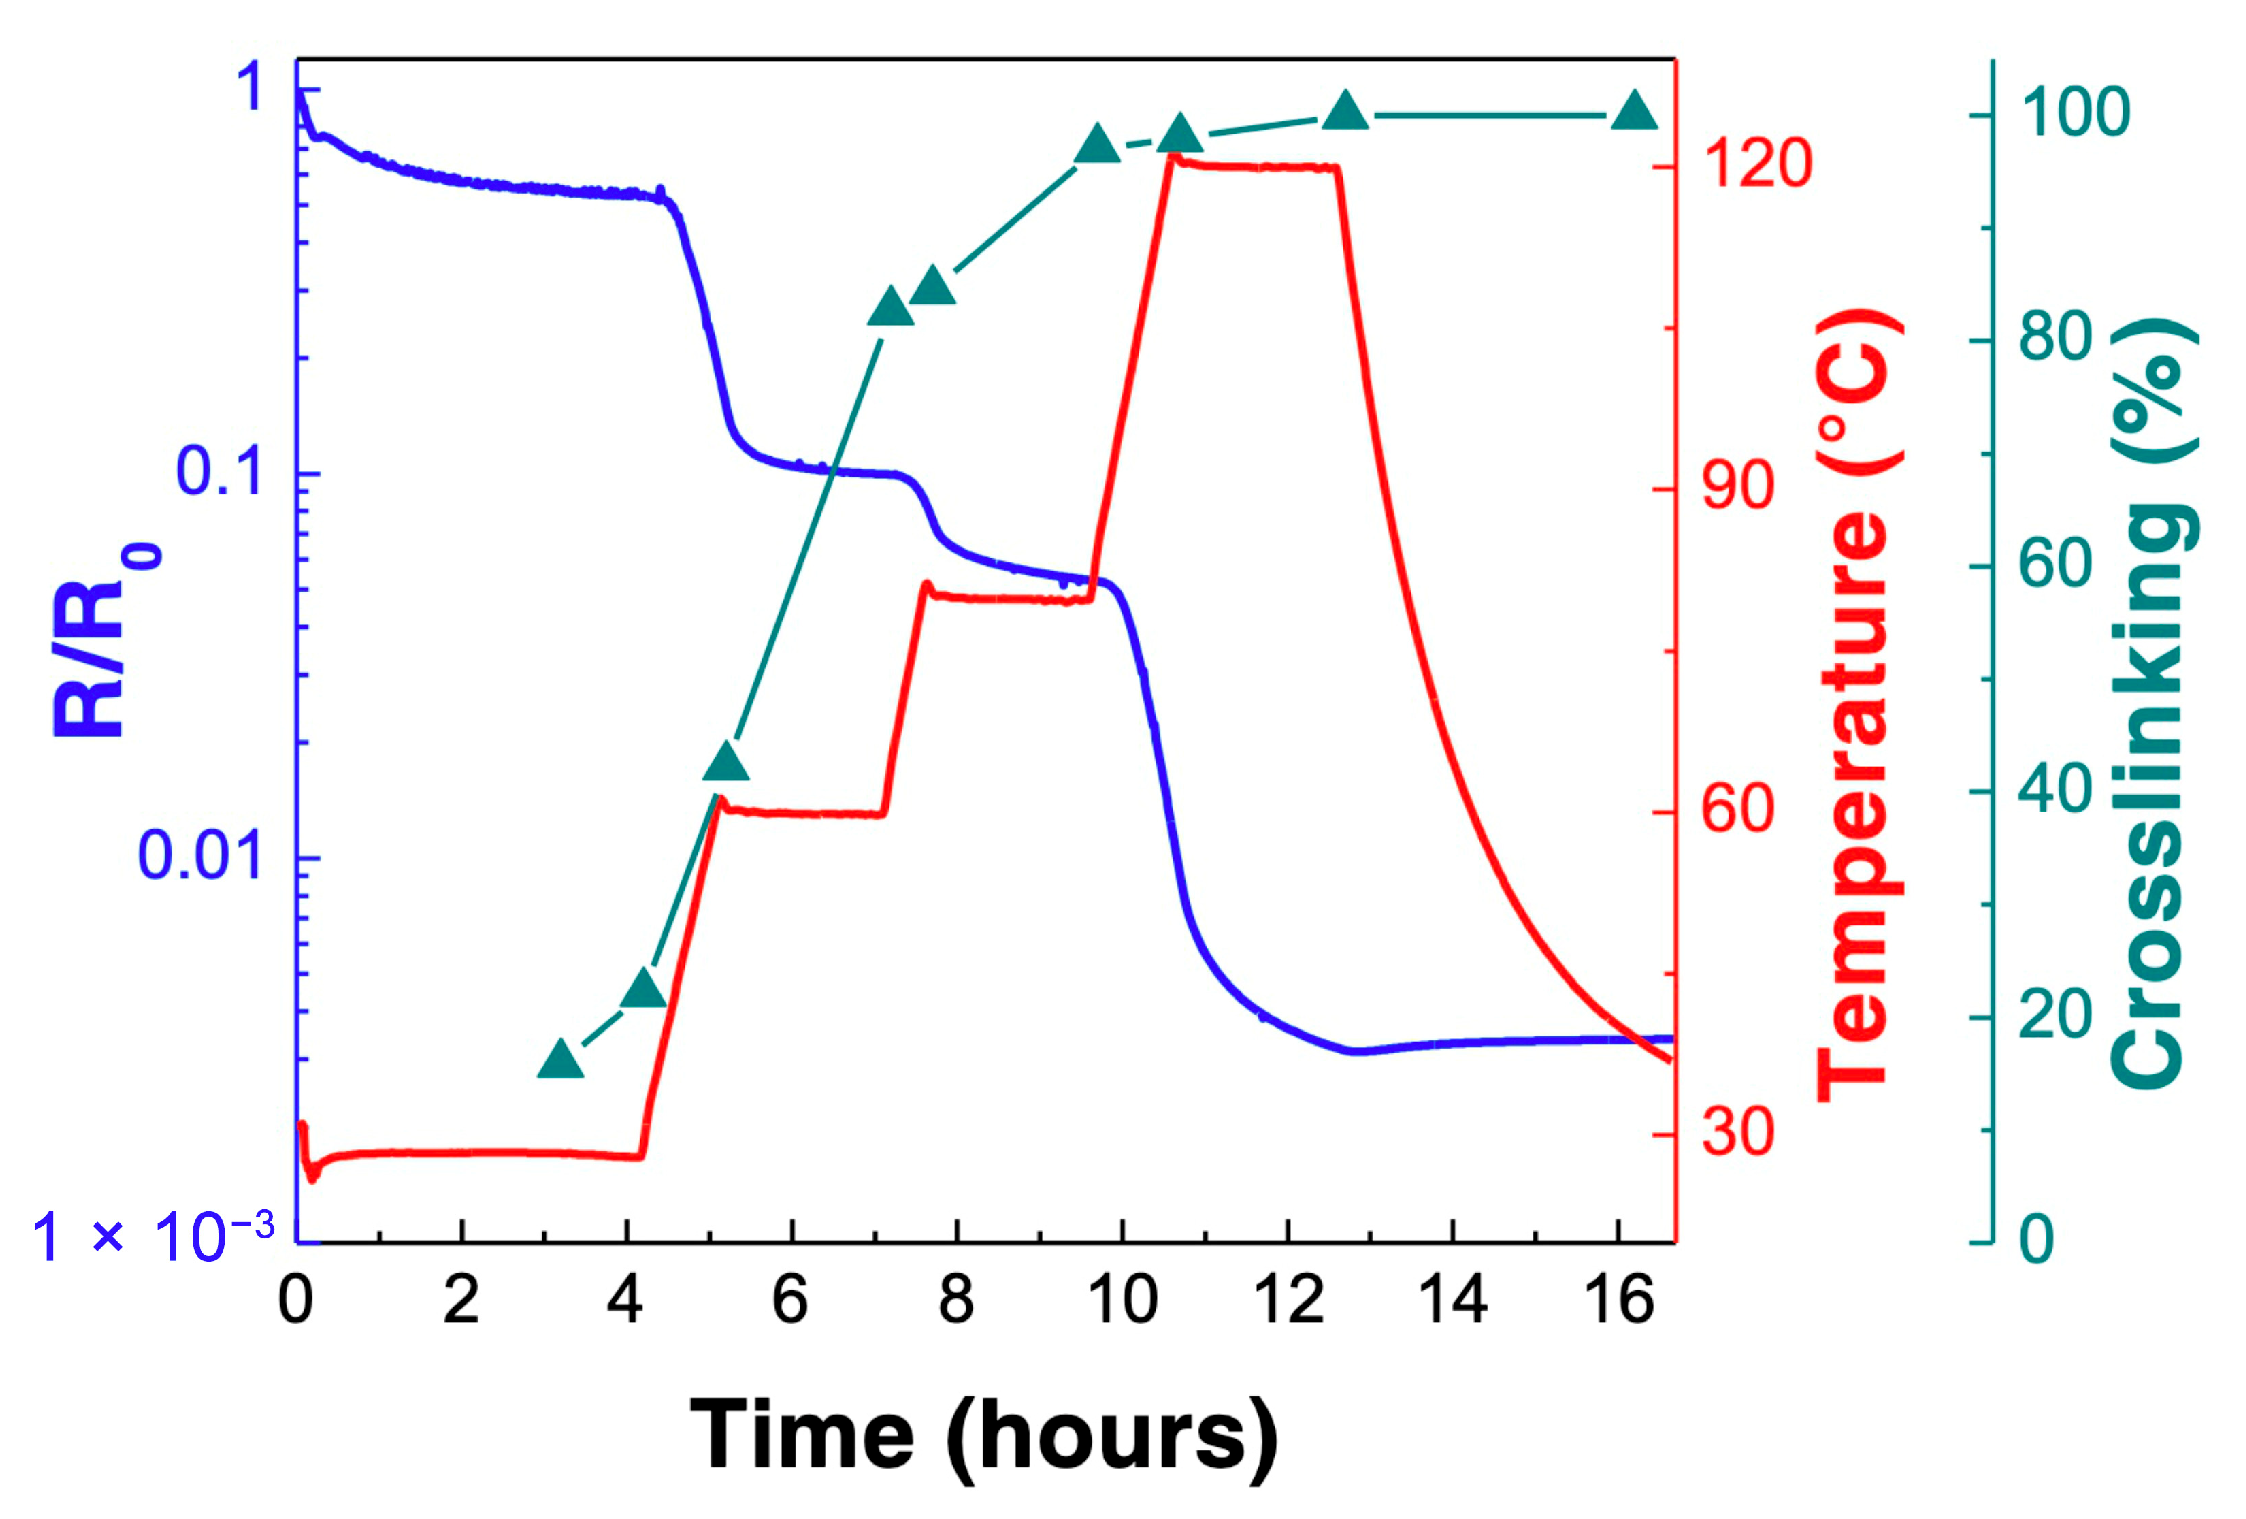
The use of CNT for an in situ process monitoring has been investigated in the case of an epoxy infusion process by Gnidakouong et al. [93]. The authors have coated glass fibres with CNT before their embedding between glass fibre plies. During the infusion step, the arrival of the resin flow front close to CNT was well evidenced by an increase in the resistance larger than 100%. The monitoring of the crosslinking reaction together with the temperature rise were characterised by a 20 to 40% decrease in resistance at the end of the process. Similar results were found by Lu et al. with a Bucky paper (BP) embedded in a glass fibre epoxy prepreg [94]. Because of the high viscosity of the resin initially at room temperature, the rise of temperature first decreased the CNT network’s resistance due to a negative temperature coefficient (NTC) effect. The authors observed a drop in resistance of about 2.9% within a 17 °C increase. Then, the following decrease in viscosity with temperature is caused by the resin penetration into the BP. The Bucky paper’s resistance is found to rise by 225% due to the CNT disconnection. The authors further observed a slight decrease in resistance (10%) due to the matrix shrinkage with crosslinking. They finally noticed a slight increase in resistance with the cooling of the composite. Luo et al. [95] reported a similar electrical behaviour with CNT-coated glass fibres braided in the glass fibre–epoxy composite. Thanks to the use of a network of the fibres in the composite, the authors observed, with the resistance variation, local modifications of the matrix state. No similar effect was observed on the capacitance during crosslinking of the CNT–epoxy system [96]. The influence of multiple temperature steps can also be observed in Figure 13, which represents the evolution of the QRS resistance, the sample’s temperature and the epoxy crosslinking degree during a complex curing cycle.
The successive temperature ramps and isothermal steps are synchronised with the drops and plateaus of resistance. Each increase in temperature momentarily increases the mobility of the free chains of resin and the volume exclusion, thus favouring CNT dynamic percolation. Once an isothermal step is reached, the sensor’s electrical behaviour reaches equilibrium similar to that described in Figure 9 when approaching the final plateau. The final increase in viscosity during an isothermal stage results in a reduction in the resistance decrease. De la Vega et al. [97] observed a similar electrical behaviour during a curing process featuring multiple steps with an epoxy resin filled with 0.2 wt% SWCNT. They have estimated that each temperature increase favours the CNT network’s formation. Once the temperature is cooling down, a slight increase in resistance is noticed that matches with the NTC observed by Shen et al. [98] for epoxy–CNT composites. On the other hand, the crosslinking degree advancement presents a continuous increase during the curing.
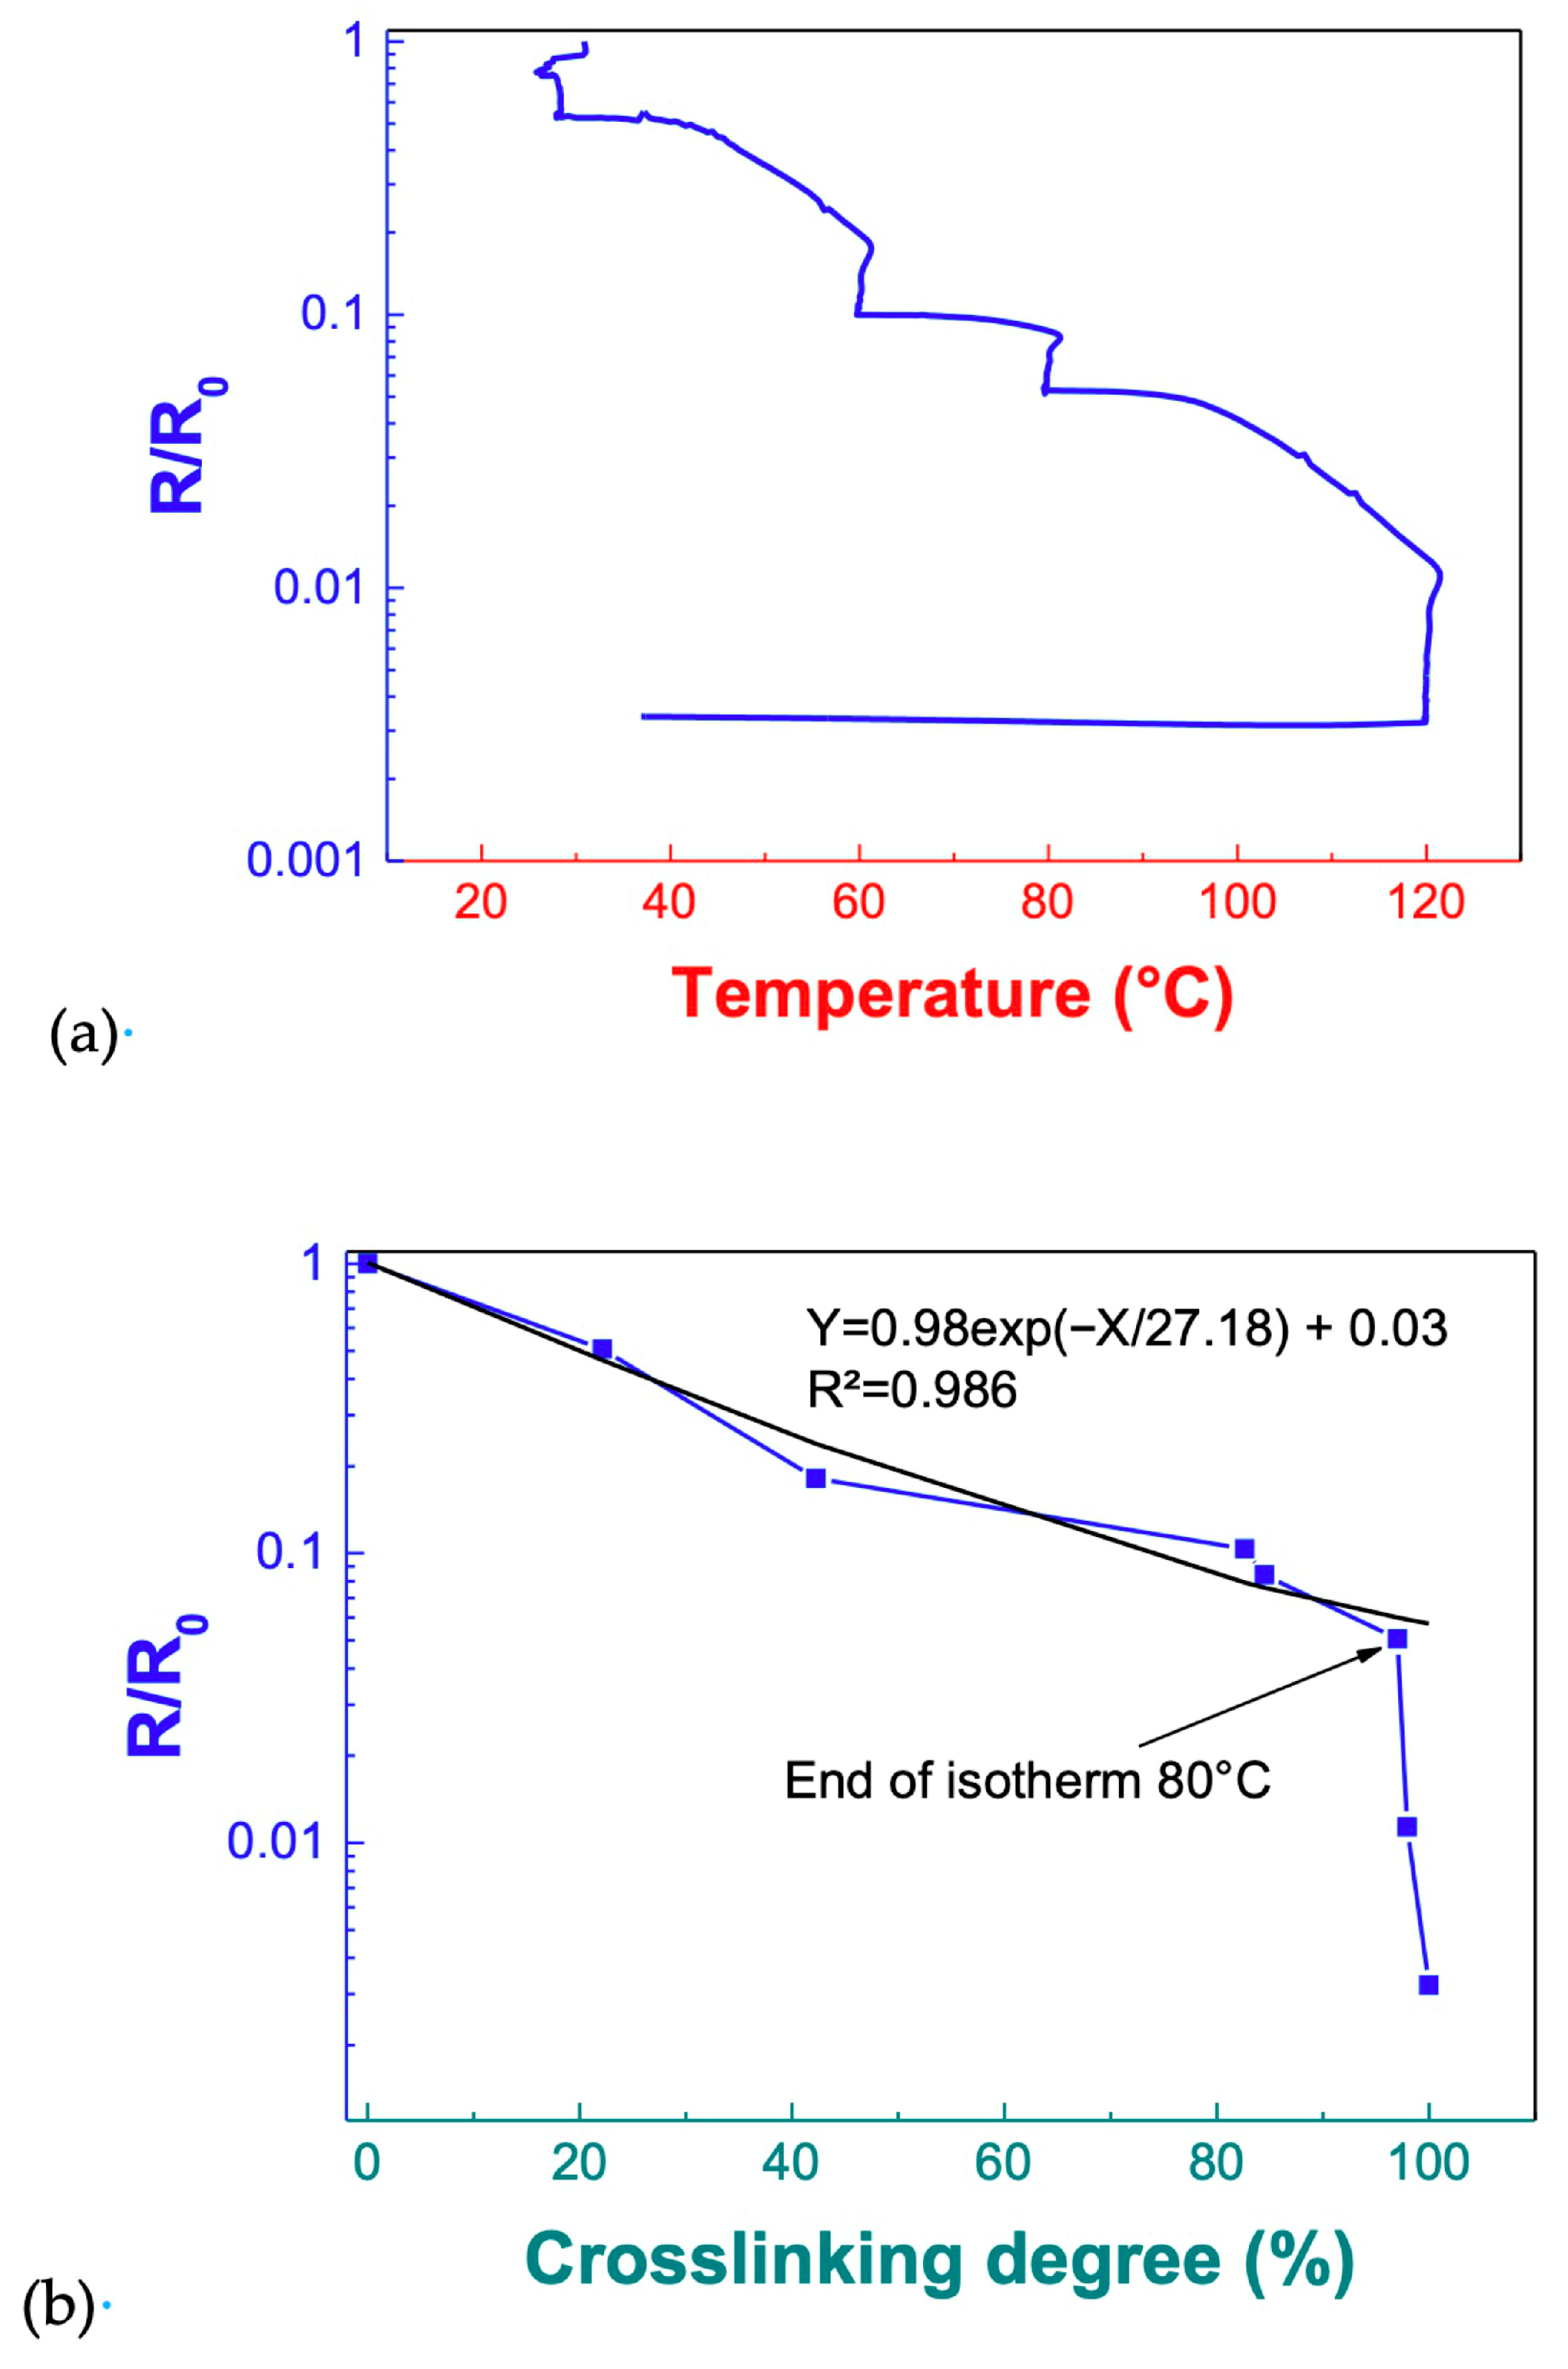
To estimate the influence of both the temperature ramps and the crosslinking degree on the QRS electrical behaviour during the curing cycle, based on the data shown in Figure 13, the resistance has been plotted as the function of the temperature in Figure 14a and as a function of the crosslinking degree in Figure 14b.
Figure 14a shows that during this complex curing cycle, the resistance exhibits a decrease in the isothermal steps, while two parts can be seen in the increasing ramps. First, the resistance slightly decreases with the temperature. The high viscosity avoids the dynamic percolation of the CNT network. Then, after a 10 °C increase, the resistance is continuously decreasing with temperature, enabling the dynamic percolation to occur regularly. It can be noticed that a nearly exponential decrease in resistance with the crosslinking degree is observed until the end of the 80 °C isotherm, which can be associated with both the crosslinking reaction and the dynamic percolation. From the 80 °C to 120 °C ramp until the end of the curing, little increase in the crosslinking degree occurs, while the resistance drops by nearly 10. Few crosslinking events can happen, and the final Tg is measured at 89.7 °C; however, this drop in resistance could be attributed to a higher level of structuring of CNT in a rubbery state and to the higher mobility of carriers activated by temperature. Thus, it can be assumed that until the end of the 80 °C isotherm, the crosslinking degree can be directly estimated by the resistance change via an exponential correlation. In addition, the sensor’s electrical behaviour and the final resistance are controlled by the curing cycle.
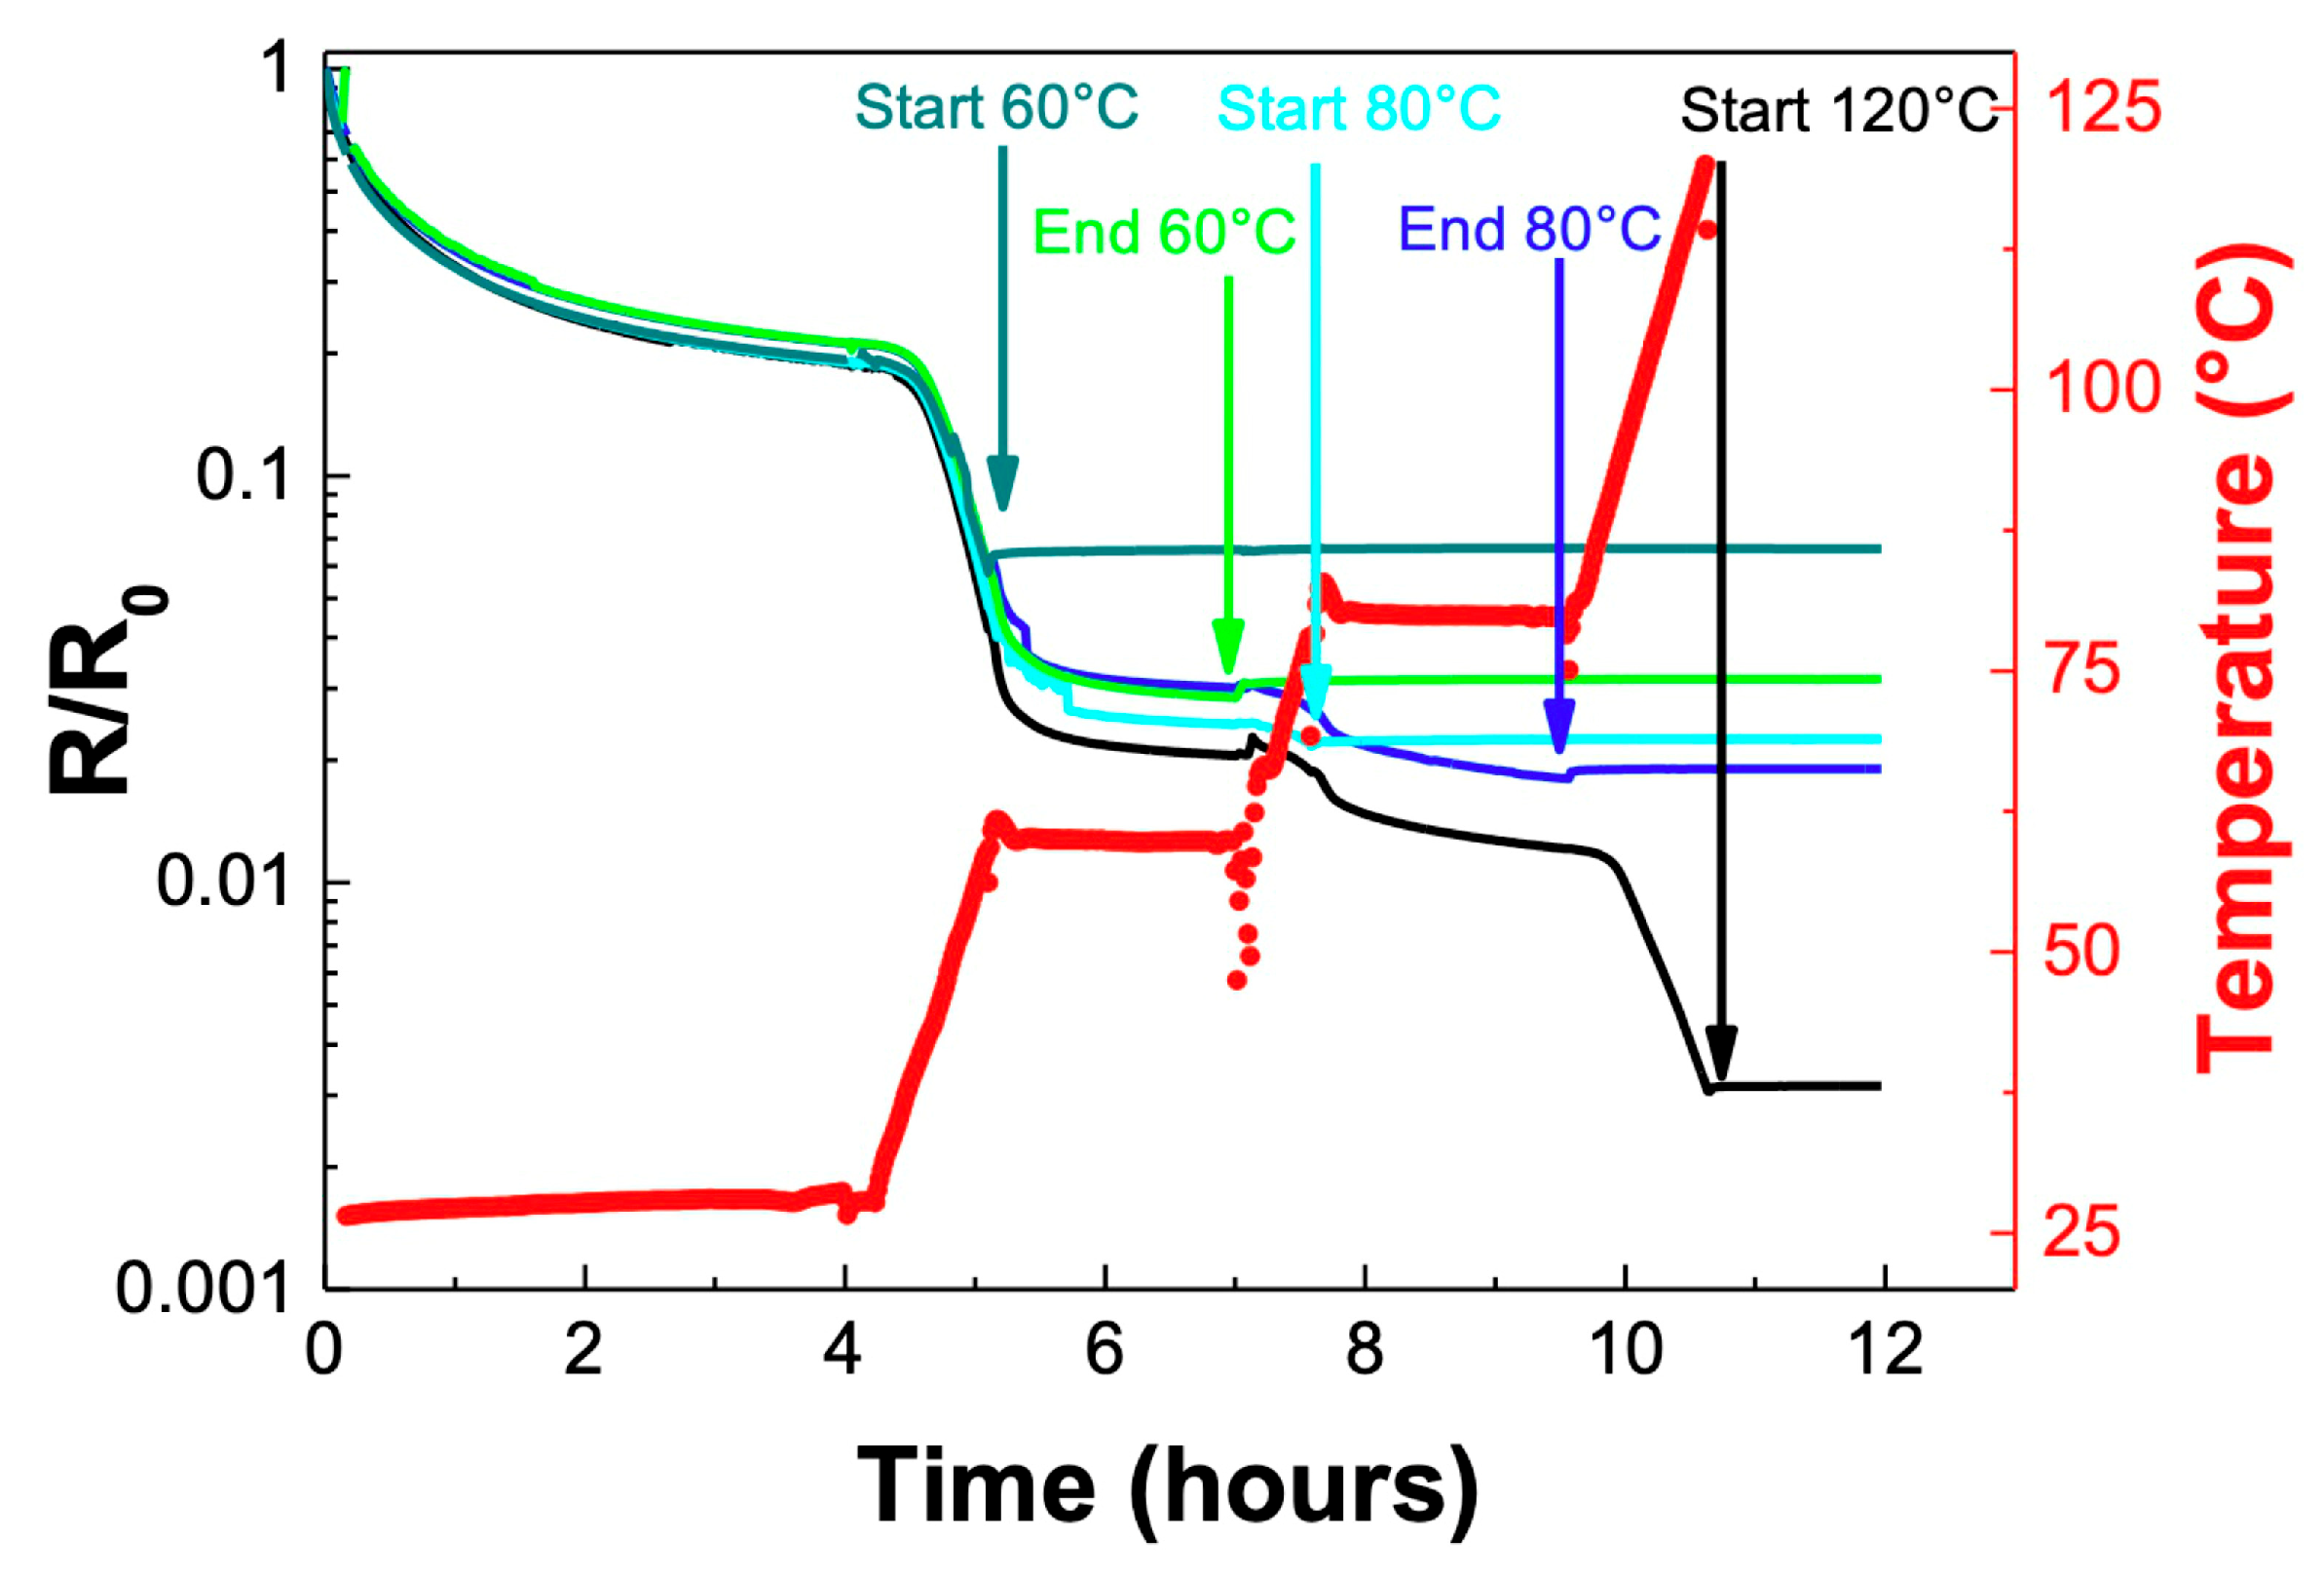
Based on a specific curing cycle with a specific sensor, the final resistance can therefore be estimated and controlled. To investigate the QRS capability to detect unexpected events during the curing cycles, sensors were quenched at 25 °C at each step of the curing cycle, as shown in Figure 15.
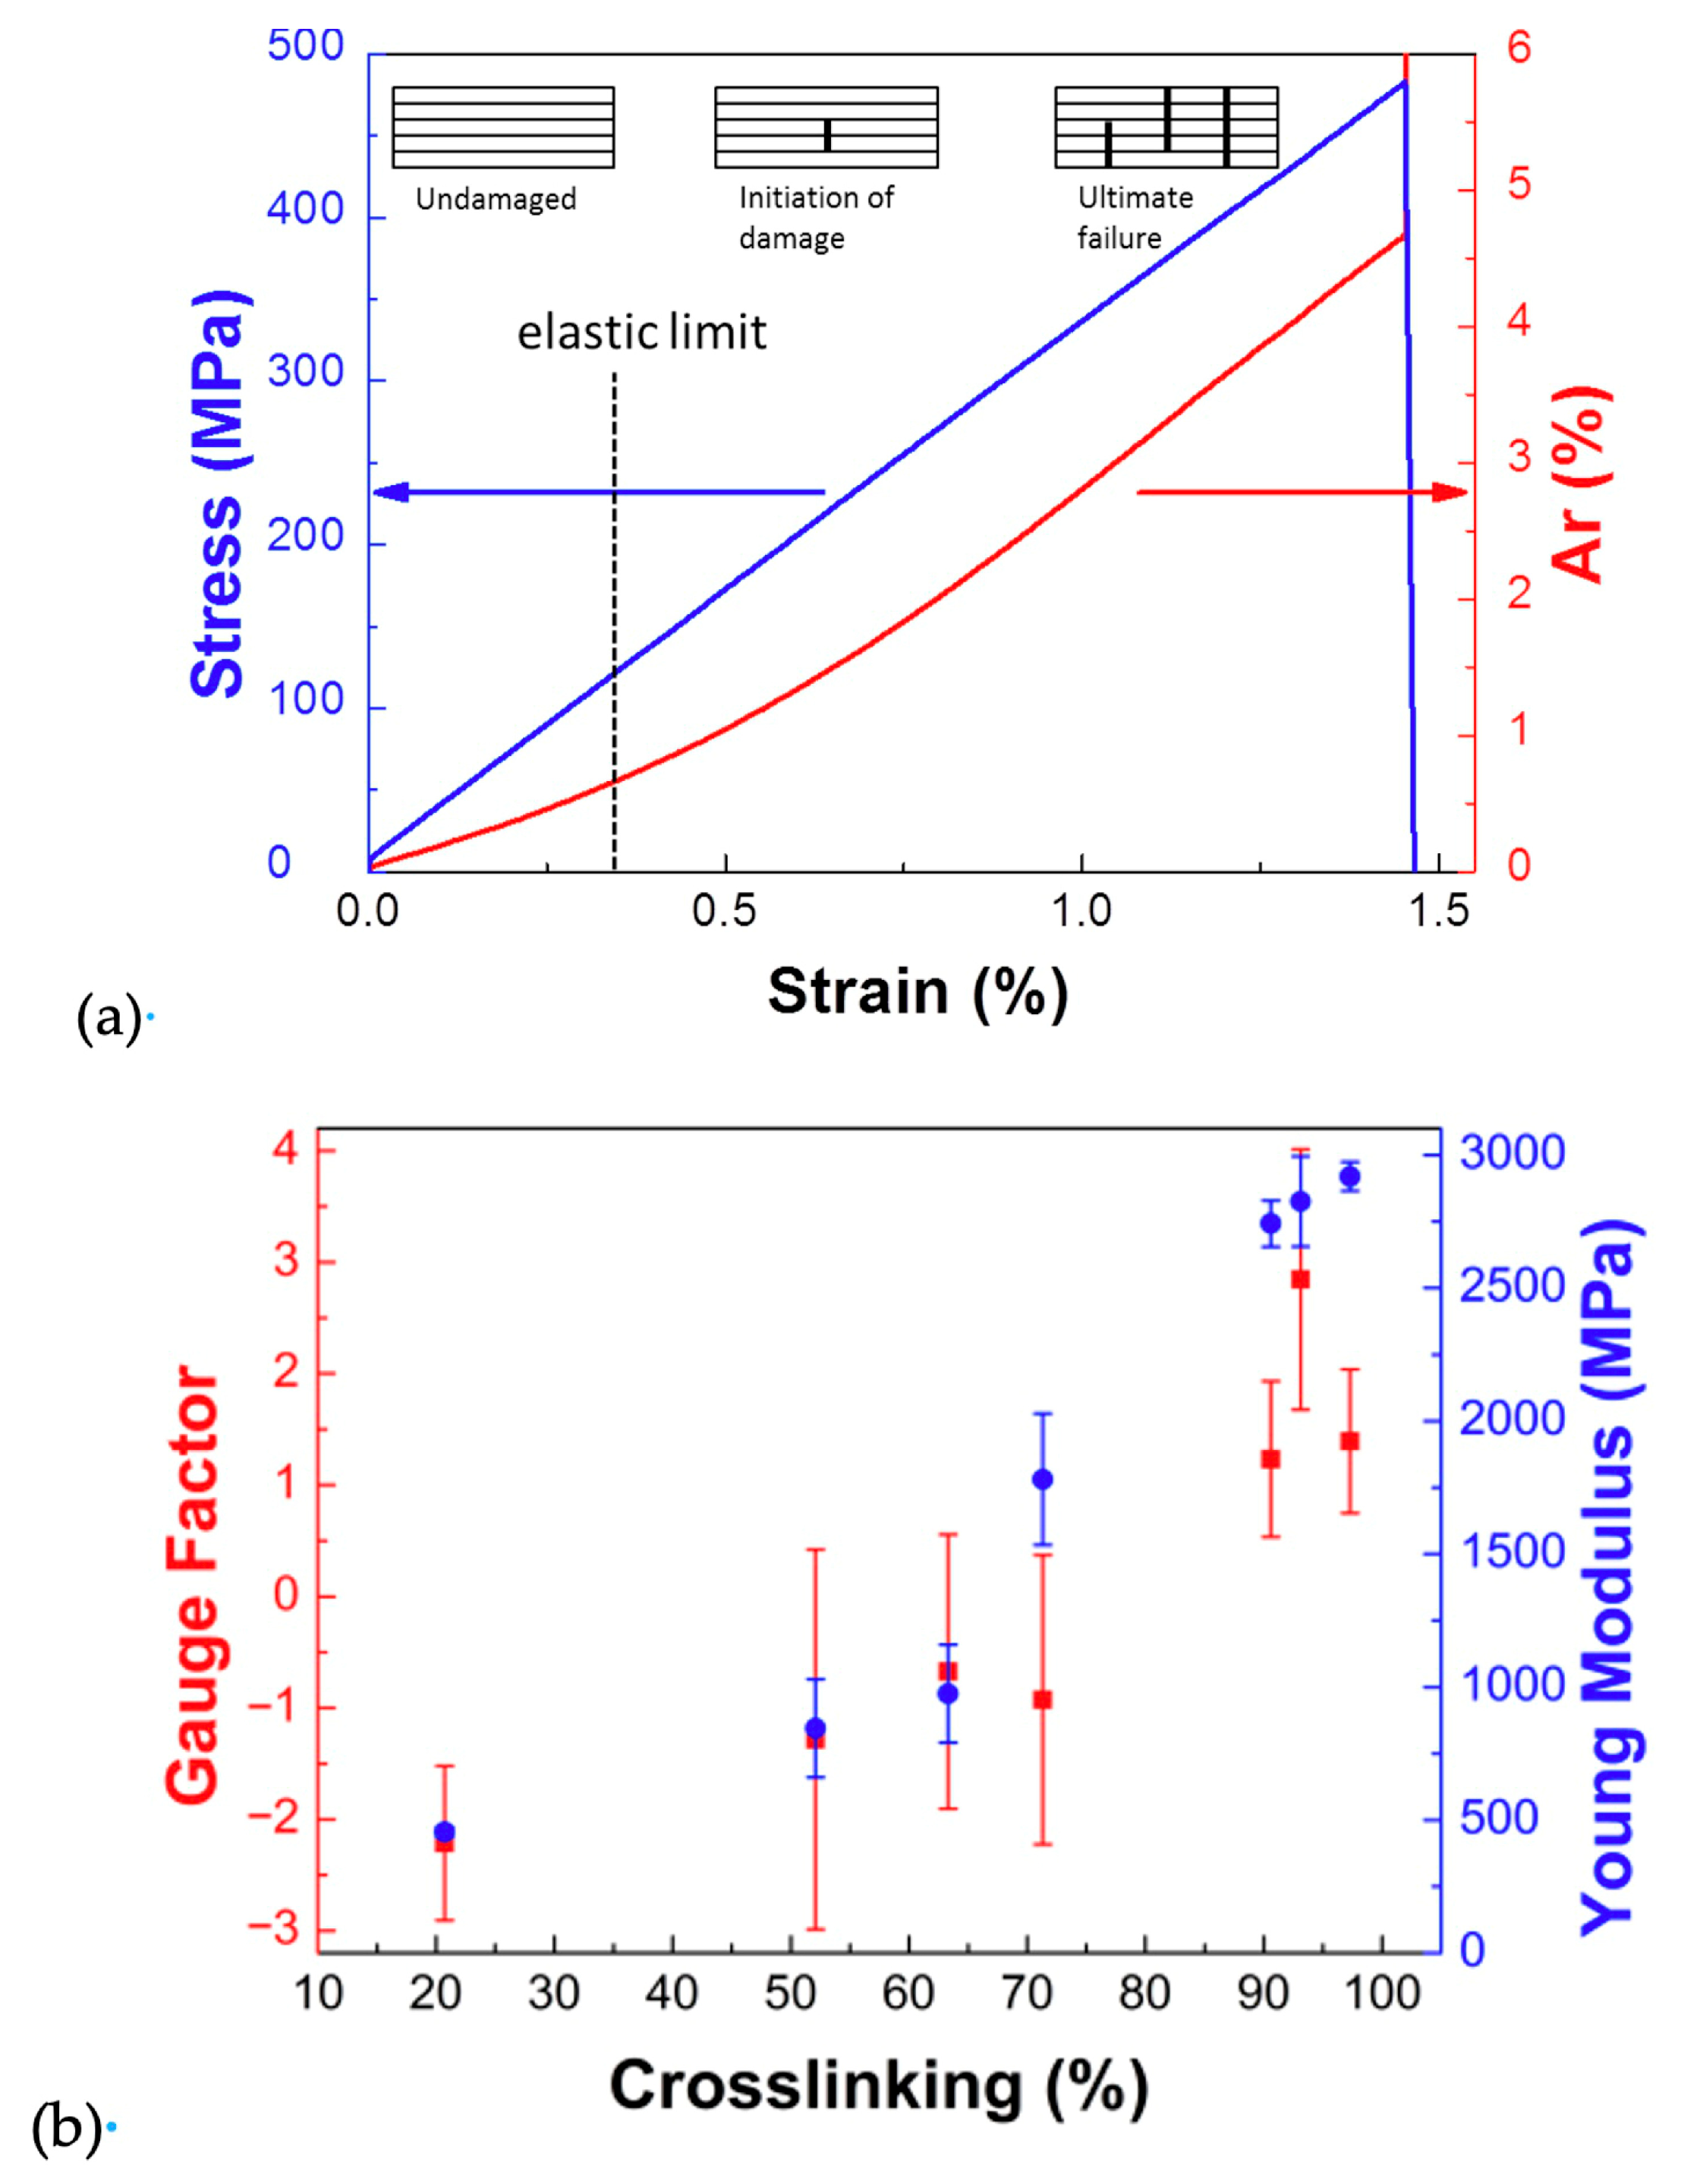
Upon quenching, the evolution of resistance displayed a slight increase before remaining constant. This increase corresponds to the NTC (negative temperature coefficient) effect of the epoxy–CNT composite. The decrease in temperature inhibits the crosslinking reaction, as well as the dynamic percolation, which results in constant resistance. For each sensor, the electrical behaviour indicates the time when the quench happened. Therefore, to use the sensor as a probe of the curing process, the sensor’s electrical behaviour can be used to track unexpected curing events. Any lack of crosslinking degree is expected to have an impact on the matrix’s mechanical properties. To evaluate the sensor’s electrical performance with the matrix crosslinking degree, static tensile tests were conducted with various crosslinking degrees of the epoxy matrix, as illustrated in Figure 16.
Figure 14a depicts a typical tensile test of a fully cured 0° UD glass fibre–epoxy laminate monitored by an sQRS. The sample displays a fragile mechanical behaviour with a linear increase in stress until the final fracture and a Young’s modulus of 30 GPa. The sQRS electrical response can be separated into two parts. First, in the elastic domain of the epoxy matrix (ε < 0.4%), a linear increase in the resistance occurs. Then, the appearance of microcracks in the matrix modifies the slopes of the resistance. At the sample breakage, the resistance reaches infinity. Thostenson and Chou [65] previously observed that matrix microcracks were responsible for disconnections in the CNT network, inducing changes in the electrical response with the deformation. The slope of resistance versus strain called the gauge factor is expressed by Equation (6):
G F = R R 0 R 0 1 ε = A R ε
where ε is the strain, R0 and R are the initial resistance and resistance at the strain ε, respectively, and AR is the change in resistance.
In the elastic domain, i.e., below 0.6%, the sensitivity of the sQRS with strain is GF = 1.84, whereas beyond this transition, it increases up to 2.97. The propagation of cracks in the CNT network at the failure is believed to cause the infinite resistance increase. Therefore, as it has been shown previously [10,65,99,100,101], sQRS are able to monitor both strain and damage in a composite structure. In Figure 14b, similar tests were conducted with the epoxy samples at various degree of crosslinking with an sQRS. The evolution of both the matrix’s Young modulus and the sensor’s GF are clearly increasing with the crosslinking degree. Below 80% of crosslinking, a negative GF occurs; thus, the resistance is decreasing with strain, which corresponds more to the behaviour of an elastomer. Thus, the CNT network becomes denser with the deformation, which results in a higher Poisson’s coefficient at low crosslinking degrees. Therefore, the sQRS electrical properties once the curing is completed can also reveal the matrix’s local curing state and make possible the prediction of the resulting mechanical properties of the structure.

4. Conclusions

Reviewing the current curing monitoring techniques of epoxy-based structures, one can notice that it is currently limited to the measurement of time and temperature. Furthermore, the most common curing monitoring techniques are destructive or cannot provide in situ information without incorporating inhomogeneous sensors, which could create defects in the structure. Yet, the measurement of the resin’s local curing state with an xQRS should lead to the development of suitable curing cycles able to enhance the mechanical behaviour of the structure and consequently its lifetime. This is also perfectly aligned with the rise of Process 4.0 thanks to IIoT. Further, this work is a good demonstration that the addition of carbon nanotubes in an epoxy matrix allows developing quantum resistive strain sensors (sQRS) for the measurement of strain and damage in a composite structure.
In summary, this paper has investigated the use of xQRS to monitor composite structures’ process. After the characterisation of the neat resin during isothermal curing was complete, the xQRS electrical behaviour during its isothermal curing with or without crosslinking has been analysed. In the absence of crosslinking, an electrical behaviour like that of thermoplastic resins has been evidenced. “Dynamic percolation” was found to promote the agglomeration of CNT to form the conductive network and decrease the percolation threshold. Upon crosslinking, the xQRS exhibited a decrease in resistance with curing. An acceleration of the initial drop of resistance occurred due to the combined effects of volume exclusion resulting from the crosslinking reaction and to the increase in mobility due to temperature. The matrix viscosity increases during the curing led to a faster diminution resistance. Finally, based on the xQRS electrical behaviour and the neat resin crosslinking degree characterisation during isothermal curing, a model relating the change in resistance and the curing degree has been proposed.
The use of QRS to probe the complex curing cycle of epoxy-based composites has been investigated. Following the evolution of the relative electrical resistance (R/R0) with time allowed successfully monitoring the different steps of curing, even when thermal cycles were comprising different successive isotherms. In typical curing conditions, the resistance followed an exponential decrease with the crosslinking until 80 °C. The detection of sharp stops and goes in the curing that could simulate unexpected events also proved to be possible, demonstrating a tracking capability of QRS that is valuable in a quality control configuration, including in case of the recording of a digital twin. The QRS sensitivity to strain after curing was dependent on the crosslinking degree but more than enough for strain sensing and damage monitoring. Therefore, QRS can be used as a probe to estimate the crosslinking degree in the core of an epoxy-based composite, can also help to monitor the smooth running of the curing process, and later can serve as a SHM solution during the composite’s life. Therefore, QRS could monitor almost the entire composite’s life from manufacturing to final damage.

Author Contributions

Conceptualisation, M.C., J.-F.F.; methodology, A.L., M.C., J.-F.F.; validation, A.L., M.C., J.-F.F.; formal analysis, A.L., M.C., J.-F.F.; investigation, A.L., M.C., J.-F.F.; resources M.C., J.-F.F.; writing—original draft preparation, A.L.; writing—review and editing, A.L., M.C., J.-F.F.; visualisation, A.L., M.C., J.-F.F.; supervision, M.C., J.-F.F.; project administration, J.-F.F.; funding acquisition, J.-F.F. All authors have read and agreed to the published version of the manuscript.

Funding

This research was funded by the EVEREST research program, grant number CED 2014/011.

Data Availability Statement

Not available.

Acknowledgments

The authors thank Hervé Bellégou, Isabelle Pillin, the University of South Brittany (UBS), and the Jules Verne Technological Research Institute (IRT) for their contribution to this work.

Conflicts of Interest

The authors declare no conflicts of interest. The funders had no role in the design of the study; in the collection, analyses, or interpretation of data; in the writing of the manuscript; or in the decision to publish the results.

References

  1. JEC Group. Overview of the Global Composite Market 2018–2023; JEC Group: Paris, France, 2023. [Google Scholar]
  2. Das, S.; Warren, J.; West, D.; Schexnayder, S.M. Global Carbon Fiber Composites Supply Chain Competitiveness Analysis; CEMAC: Golden, CO, USA, 2016. [Google Scholar]
  3. Witten, E.; Mathes, V.; Sauer, M.; Kühnel, M. Composites’ Market: Developments, Trends, Outlooks and Challenges; AVK Federation of Reinforced Plastics: Frankfurt am Main, Germany, 2018. [Google Scholar]
  4. Balageas, D.; Fritzen, C.-P.; Güemes, A. Structural Health Monitoring; Wiley: Hoboken, NJ, USA, 2006; ISBN 978-1-905209-01-9. [Google Scholar]
  5. Huston, D. Structural Sensing, Health Monitoring, and Performance Evaluation; Series in Sensors; CRC Press: Boca Raton, FL, USA, 2011; ISBN 9781420012354. [Google Scholar]
  6. Farrar, C.R.; Worden, K. An Introduction to Structural Health Monitoring. Philos. Trans. R. Soc. A Math. Phys. Eng. Sci. 2007, 365, 303–315. [Google Scholar] [CrossRef] [PubMed]
  7. Lemartinel, A.; Castro, M.; Fouché, O.; De Luca, J.C.; Feller, J.F. A Review of Nanocarbon-Based Solutions for the Structural Health Monitoring of Composite Parts Used in Renewable Energies. J. Compos. Sci. 2022, 6, 32. [Google Scholar] [CrossRef]
  8. Lemartinel, A.; Castro, M.; Fouché, O.; De Luca, J.C.; Feller, J.F. Strain Mapping and Damage Tracking in Carbon Fiber Reinforced Epoxy Composites during Dynamic Bending until Fracture with Quantum Resistive Sensors in Array. J. Compos. Sci. 2021, 5, 60. [Google Scholar] [CrossRef]
  9. Wang, Q.; Tian, Y.; Duongthipthewa, A.; Zhang, J.; Liu, M.; Su, Z.; Zhou, L. An Embedded Non-Intrusive Graphene/Epoxy Broadband Nanocomposite Sensor Co-Cured with GFRP for in Situ Structural Health Monitoring. Compos. Sci. Technol. 2023, 236, 109995. [Google Scholar] [CrossRef]
  10. Nag-Chowdhury, S.; Bellégou, H.; Pillin, I.; Castro, M.; Longrais, P.; Feller, J.F. Non-Intrusive Health Monitoring of Infused Composites with Embedded Carbon Quantum Piezo-Resistive Sensors. Compos. Sci. Technol. 2016, 123, 286–294. [Google Scholar] [CrossRef]
  11. MARE-WINT; Ostachowicz, W., McGugan, M., Schröder-Hinrichs, J.U., Luczak, M., Eds.; Springer International Publishing: Cham, Switzerland, 2016; ISBN 978-3-319-39094-9. [Google Scholar]
  12. de Villoria, R.G.; Miravete, A.; Cuartero, J.; Chiminelli, A.; Tolosana, N. Mechanical Properties of SWNT/Epoxy Composites Using Two Different Curing Cycles. Compos. B Eng. 2006, 37, 273–277. [Google Scholar] [CrossRef]
  13. Davies, L.; Day, R.; Bond, D.; Nesbitt, A.; Ellis, J.; Gardon, E. Effect of Cure Cycle Heat Transfer Rates on the Physical and Mechanical Properties of an Epoxy Matrix Composite. Compos. Sci. Technol. 2007, 67, 1892–1899. [Google Scholar] [CrossRef]
  14. Choi, K.; Chung, S.H. Enhanced Time-Slotted Channel Hopping Scheduling with Quick Setup Time for Industrial Internet of Things Networks. Int. J. Distrib. Sens. Netw. 2017, 13, 155014771771362. [Google Scholar] [CrossRef]
  15. Huang, H.; Xu, H.; Liu, Z. Multi-Task Deep Learning-Empowered Digital Twin for Functional Composite Materials Fabricated by Laser Additive Remanufacturing. CIRP Ann. Manuf. Technol. 2024, 73, 125–128. [Google Scholar] [CrossRef]
  16. Baalbergen, E.H.; de Marchi, J.A.; Offringa, A.; Hengeveld, S.; Troost, B.; He, K.; Koppert, R.J.; Boikon, B.V.; van den Eijnde, W.A.J. Applying Digital Twin Technology in Thermoplastic Composites Production. In Proceedings of the ITHEC—5th International Conference & Exhibition on Thermoplastic Composites, Bremen, Germany, 13 October 2020. [Google Scholar]
  17. Polini, W.; Corrado, A. Digital Twin of Composite Assembly Manufacturing Process. Int. J. Prod. Res. 2020, 58, 5238–5252. [Google Scholar] [CrossRef]
  18. Xu, X.; Wang, G.; Yan, H.; Zhang, L.; Yao, X. Deep-Learning-Enhanced Digital Twinning of Complex Composite Structures and Real-Time Mechanical Interaction. Compos. Sci. Technol. 2023, 241, 110139. [Google Scholar] [CrossRef]
  19. Marr, B. What Everyone Must Know About Industry 4.0. Forbes, 20 June 2016. Available online: https://www.forbes.com/sites/bernardmarr/2016/06/20/what-everyone-must-know-about-industry-4-0/ (accessed on 11 August 2025).
  20. Stojkovic, M.; Butt, J. Industry 4.0 Implementation Framework for the Composite Manufacturing Industry. J. Compos. Sci. 2022, 6, 258. [Google Scholar] [CrossRef]
  21. Merad, L.; Cochez, M.; Margueron, S.; Jauchem, F.; Ferriol, M.; Benyoucef, B.; Bourson, P. In-Situ Monitoring of the Curing of Epoxy Resins by Raman Spectroscopy. Polym. Test. 2009, 28, 42–45. [Google Scholar] [CrossRef]
  22. Schubel, P.J.; Crossley, R.J.; Boateng, E.K.G.; Hutchinson, J.R. Review of Structural Health and Cure Monitoring Techniques for Large Wind Turbine Blades. Renew. Energy 2013, 51, 113–123. [Google Scholar] [CrossRef]
  23. Feller, J.F.; Paradis, G.; Lenain, J.C. SENSE in: Enhanse Your Materials. Available online: https://sense-in.fr/en/ (accessed on 11 August 2025).
  24. Tung, T.T.; Robert, C.; Castro, M.; Feller, J.F.; Kim, T.Y.; Suh, K.S. Enhancing the Sensitivity of Graphene/Polyurethane Nanocomposite Flexible Piezo-Resistive Pressure Sensors with Magnetite Nano-Spacers. Carbon 2016, 108, 450–460. [Google Scholar] [CrossRef]
  25. Tran, M.T.; Tung, T.T.; Sachan, A.; Losic, D.; Castro, M.; Feller, J.F. 3D Sprayed Polyurethane Functionalized Graphene/Carbon Nanotubes Hybrid Architectures to Enhance the Piezo-Resistive Response of Quantum Resistive Pressure Sensors. Carbon 2020, 168, 564–579. [Google Scholar] [CrossRef]
  26. Feller, J.F.; Castro, M.; Tran, M.T.; Allègre, W. Pressure Ulcers Monitoring with Combined Piezo- and Chemo-Resistive Nanocomposite Sensors’ Arrays. In Proceedings of the International Conference on Advances in Signal Processing & Artificial Intelligence (ASPAI), Funchal, Portugal, 17–19 April 2024. [Google Scholar]
  27. Nag-Chowdhury, S.; Bellégou, H.; Pillin, I.; Castro, M.; Longrais, P.; Feller, J.F. Crossed Investigation of Damage in Composites with Embedded Quantum Resistive Strain Sensors (SQRS), Acoustic Emission (AE) and Digital Image Correlation (DIC). Compos. Sci. Technol. 2018, 160, 79–85. [Google Scholar] [CrossRef]
  28. Lemartinel, A.; Castro, M.; Fouche, O.; De Luca, J.C.; Feller, J.F. Impact and Strain Monitoring in Glass Fiber Reinforced Epoxy Laminates with Embedded Quantum Resistive Sensors (QRS). Compos. Sci. Technol. 2022, 221, 109352. [Google Scholar] [CrossRef]
  29. Kumar, B.; Castro, M.; Feller, J.F. Controlled Conductive Junction Gap for Chitosan-Carbon Nanotube Quantum Resistive Vapour Sensors. J. Mater. Chem. 2012, 22, 10656–10664. [Google Scholar] [CrossRef]
  30. Sachan, A.; Castro, M.; Feller, J.F. Volatolomics for Anticipated Diagnosis of Cancers with Chemoresistive Vapour Sensors: A Review. ChemoSensors 2025, 13, 15. [Google Scholar] [CrossRef]
  31. Beutier, C.; Feller, J.F. Smart Nanocomposites Sensors QRS (Quantum Resistive Sensor) to Develop Process Monitoring. In Proceedings of the JNC 23—Journée Nationale sur les Composites, Besançon, France, 30 June–2 July 2023. [Google Scholar]
  32. Siddig, N.; Le Bot, P.; Fouché, O.; Denis, Y. Simulation and Monitoring of the Infusion of Thick Composites with Thermoplastic Acrylic Resin. In Proceedings of the 27th ESAFORM International Conference on Material Forming, Toulouse, France, 25 May 2024; pp. 576–585. [Google Scholar]
  33. Georgelin, L.; Leroy, C.; Paradis, G.; Feller, J.F. Procédé de Suivi de Fabrication d’une Pièce Par Infusion/Injection de Résine Dans Une Préforme Patent. FR2314656, 20 December 2023. [Google Scholar]
  34. Lapique, F.; Redford, K. Curing Effects on Viscosity and Mechanical Properties of a Commercial Epoxy Resin Adhesive. Int. J. Adhes. Adhes. 2002, 22, 337–346. [Google Scholar] [CrossRef]
  35. Fernando, G.F. Fibre Optic Sensor Systems for Monitoring Composite Structures. Reinf. Plast. 2005, 49, 41–49. [Google Scholar] [CrossRef]
  36. Jang, B.Z.; Shih, W.K. Techniques for Cure Monitoring of Thermoset Resins and Composites—A Review. Mater. Manuf. Process. 1990, 5, 301–331. [Google Scholar] [CrossRef]
  37. Olcese, T.; Spelta, O.; Vargiu, S. Curing Kinetics of Epoxy Resins. J. Polym. Sci. Polym. Symp. 1975, 53, 113–126. [Google Scholar] [CrossRef]
  38. Kamal, M.R.; Sourour, S. Kinetics and Thermal Characterization of Thermoset Cure. Polym. Eng. Sci. 1973, 13, 59–64. [Google Scholar] [CrossRef]
  39. Barton, J.M. Monitoring the Cross-Linking of Epoxide Resins by Thermoanalytical Techniques. J. Macromol. Sci. Part A—Chem. 1974, 8, 25–32. [Google Scholar] [CrossRef]
  40. Vyazovkin, S.; Sbirrazzuoli, N. Mechanism and Kinetics of Epoxy−Amine Cure Studied by Differential Scanning Calorimetry. Macromolecules 1996, 29, 1867–1873. [Google Scholar] [CrossRef]
  41. Bhargava, R.; Wang, S.Q.; Koenig, J.L. Studying Polymer-Dispersed Liquid-Crystal Formation by FTIR Spectroscopy. 1. Monitoring Curing Reactions. Macromolecules 1999, 32, 8982–8988. [Google Scholar] [CrossRef]
  42. González-González, M.; Cabanelas, J.C.; Baselga, J. Infrared Spectroscopy—Materials Science, Engineering and Technology; Theophile, T., Ed.; InTech: London, UK, 2012; Volume 2, ISBN 978-953-51-0537-4. [Google Scholar]
  43. Sanchez Soto, M.; Pages, P.; Lacorte, T.; Briceno, K.; Carrasco, F. Curing FTIR Study and Mechanical Characterization of Glass Bead Filled Trifunctional Epoxy Composites. Compos. Sci. Technol. 2007, 67, 1974–1985. [Google Scholar] [CrossRef]
  44. Roller, M.B. Rheology of Curing Thermosets: A Review. Polym. Eng. Sci. 1986, 26, 432–440. [Google Scholar] [CrossRef]
  45. Sbirrazzuoli, N.; Vyazovkin, S.; Mititelu, A.; Sladic, C.; Vincent, L. A Study of Epoxy-Amine Cure Kinetics by Combining Isoconversional Analysis with Temperature Modulated DSC and Dynamic Rheometry. Macromol. Chem. Phys. 2003, 204, 1815–1821. [Google Scholar] [CrossRef]
  46. Winter, H.H. Can the Gel Point of a Cross-linking Polymer Be Detected by the G′–G″ Crossover? Polym. Eng. Sci. 1987, 27, 1698–1702. [Google Scholar] [CrossRef]
  47. Nass, K.A.; Seferis, J.C. Analysis of the Dielectric Response of Thermosets During Isothermal and Nonisothermal Cure. Polym. Eng. Sci. 1989, 29, 315–324. [Google Scholar] [CrossRef]
  48. Bidstrup, S.A.; Sheppard, N.F.; Senturia, S.D. Dielectric Analysis of the Cure of Thermosetting Epoxy/Amine Systems. Polym. Eng. Sci. 1989, 29, 325–328. [Google Scholar] [CrossRef]
  49. Hardis, R.; Jessop, J.L.P.; Peters, F.E.; Kessler, M.R. Cure Kinetics Characterization and Monitoring of an Epoxy Resin Using DSC, Raman Spectroscopy, and DEA. Compos. Part A Appl. Sci. Manuf. 2013, 49, 100–108. [Google Scholar] [CrossRef]
  50. Boiteux, G.; Dublineau, P.; Feve, M.; Mathieu, C.; Seytre, G.; Ulanski, J. Dielectric and Viscoelastic Studies of Curing Epoxy-Amine Model Systems. Polym. Bull. 1993, 30, 441–447. [Google Scholar] [CrossRef]
  51. Sampath, U.; Kim, H.; Kim, D.; Kim, Y.; Song, M. In-Situ Cure Monitoring of Wind Turbine Blades by Using Fiber Bragg Grating Sensors and Fresnel Reflection Measurement. Sensors 2015, 15, 18229–18238. [Google Scholar] [CrossRef]
  52. Moghaddam, M.K.; Breede, A.; Chaloupka, A.; Bödecker, A.; Habben, C.; Meyer, E.-M.; Brauner, C.; Lang, W. Design, Fabrication and Embedding of Microscale Interdigital Sensors for Real-Time Cure Monitoring during Composite Manufacturing. Sens. Actuators A Phys. 2016, 243, 123–133. [Google Scholar] [CrossRef]
  53. Yang, Y.; Chiesura, G.; Vervust, T.; Bossuyt, F.; Luyckx, G.; Degrieck, J.; Vanfleteren, J. Design and Fabrication of a Flexible Dielectric Sensor System for in Situ and Real-Time Production Monitoring of Glass Fibre Reinforced Composites. Sens. Actuators A Phys. 2016, 243, 103–110. [Google Scholar] [CrossRef]
  54. Harsch, M.; Karger-Kocsis, J.; Herzog, F. Influence of Cure Regime on the Strain Development in an Epoxy Resin as Monitored by a Fiber Bragg Grating Sensor. Macromol. Mater. Eng. 2007, 292, 474–483. [Google Scholar] [CrossRef]
  55. Waris, M.; Tortech, B.; Marin, E.; Vautrin, A. Suivi Par Capteur à Fibre Optique Du Procédé Resin Transfer Moulding (RTM). In Proceedings of the 17èmes Journées Nationales sur les Composites (JNC17), Poitiers, France, 15–17 June 2011; pp. 1–10. [Google Scholar]
  56. Dewynter-Marty, V.; Ferdinand, P.; Bocherens, E.; Carbone, R.; Beranger, H.; Bourasseau, S.; Dupont, M.; Balageas, D. Embedded Fiber Bragg Grating Sensors for Industrial Composite Cure Monitoring. J. Intell. Mater. Syst. Struct. 1998, 9, 785–787. [Google Scholar] [CrossRef]
  57. Leng, J.; Asundi, A. Structural Health Monitoring of Smart Composite Materials by Using EFPI and FBG Sensors. Sens. Actuators A Phys. 2003, 103, 330–340. [Google Scholar] [CrossRef]
  58. Parlevliet, P.P.; Bersee, H.E.N.; Beukers, A. Measurement of (Post-)Curing Strain Development with Fibre Bragg Gratings. Polym. Test. 2010, 29, 291–301. [Google Scholar] [CrossRef]
  59. Antonucci, V.; Giordano, M.; Cusano, A.; Nasser, J.; Nicolais, L. Real Time Monitoring of Cure and Gelification of a Thermoset Matrix. Compos. Sci. Technol. 2006, 66, 3273–3280. [Google Scholar] [CrossRef]
  60. Cusano, A.; Breglio, G.; Giordano, M.; Calabrò, A.; Cutolo, A.; Nicolais, L. Optoelectronic Sensor for Cure Monitoring in Thermoset-Based Composites. Sens. Actuators A Phys. 2000, 84, 270–275. [Google Scholar] [CrossRef]
  61. Drissi-Habti, M.; Raman, V. Fatigue Behavior of Smart Composites with Distributed Fiber Optic Sensors for Offshore Applications. J. Compos. Sci. 2021, 6, 2. [Google Scholar] [CrossRef]
  62. Wang, L.; Tomlin, A.; Pandita, S.D.; Gupta, B.D.; Malik, S.A.; Hudson, M.; Curtis, P.T.; Fernando, G.F. In-Situ Monitoring of Cross-Linking Reactions Using E-Glass Fibres and Evanescent Wave Spectroscopy. Sens. Actuators B Chem. 2016, 236, 358–366. [Google Scholar] [CrossRef]
  63. Advise, Cure Performance Monitoring System (CPMS): The Intelligent Way to Optimise and Assure Quality of the Processing of Composites. Available online: https://advise-deta.com/en/pages/products (accessed on 11 August 2025).
  64. Synthesites, OptiFlow System Is Fully Optimised for Composites Processing Providing Resin Arrival Indication and Temperature Measurements at 4 Channels. Available online: https://www.synthesites.com/application-sector/general/optiflow (accessed on 11 August 2025).
  65. Thostenson, E.T.; Chou, T.-W. Real-Time in Situ Sensing of Damage Evolution in Advanced Fiber Composites Using Carbon Nanotube Networks. Nanotechnology 2008, 19, 215713. [Google Scholar] [CrossRef]
  66. Viets, C.; Kaysser, S.; Schulte, K. Damage Mapping of GFRP via Electrical Resistance Measurements Using Nanocomposite Epoxy Matrix Systems. Compos. B Eng. 2014, 65, 80–88. [Google Scholar] [CrossRef]
  67. Puglia, D.; Valentini, L.; Armentano, I.; Kenny, J.M. Effects of Single-Walled Carbon Nanotube Incorporation on the Cure Reaction of Epoxy Resin and Its Detection by Raman Spectroscopy. Diam. Relat. Mater. 2003, 12, 827–832. [Google Scholar] [CrossRef]
  68. Valentini, L.; Puglia, D.; Frulloni, E.; Armentano, I.; Kenny, J.M.; Santucci, S. Dielectric Behavior of Epoxy Matrix/Single-Walled Carbon Nanotube Composites. Compos. Sci. Technol. 2004, 64, 23–33. [Google Scholar] [CrossRef]
  69. Puglia, D.; Valentini, L.; Kenny, J.M. Analysis of the Cure Reaction of Carbon Nanotubes/Epoxy Resin Composites through Thermal Analysis and Raman Spectroscopy. J. Appl. Polym. Sci. 2003, 88, 452–458. [Google Scholar] [CrossRef]
  70. Choi, W.J.; Powell, R.L.; Kim, D.S. Curing Behavior and Properties of Epoxy Nanocomposites with Amine Functionalized Multiwall Carbon Nanotubes. Polym. Compos. 2009, 30, 415–421. [Google Scholar] [CrossRef]
  71. Xie, H.; Liu, B.; Yuan, Z.; Shen, J.; Cheng, R. Cure Kinetics of Carbon Nanotube/Tetrafunctional Epoxy Nanocomposites by Isothermal Differential Scanning Calorimetry. J. Polym. Sci. B Polym. Phys. 2004, 42, 3701–3712. [Google Scholar] [CrossRef]
  72. Fogel, M.; Parlevliet, P.; Geistbeck, M.; Olivier, P.; Dantras, É. Thermal, Rheological and Electrical Analysis of MWCNT/Epoxy Matrices. Compos. Sci. Technol. 2015, 110, 118–125. [Google Scholar] [CrossRef]
  73. Tao, K.; Yang, S.; Grunlan, J.C.; Kim, Y.-S.; Dang, B.; Deng, Y.; Thomas, R.L.; Wilson, B.L.; Wei, X. Effects of Carbon Nanotube Fillers on the Curing Processes of Epoxy Resin-Based Composites. J. Appl. Polym. Sci. 2006, 102, 5248–5254. [Google Scholar] [CrossRef]
  74. Sourour, S.; Kamal, M.R. Differential Scanning Calorimetry of Epoxy Cure: Isothermal Cure Kinetics. Thermochim. Acta 1976, 14, 41–59. [Google Scholar] [CrossRef]
  75. Ryan, M.E.; Dutta, A. Kinetics of Epoxy Cure: A Rapid Technique for Kinetic Parameter Estimation. Polymer 1979, 20, 203–206. [Google Scholar] [CrossRef]
  76. Rohr, D.F.; Klein, M.T. Modeling Diffusion and Reaction in Crosslinking Epoxy-amine Cure Kinetics: A Dynamic Percolation Approach. Indus. Eng. Chem. Res. 1990, 29, 1210–1218. [Google Scholar] [CrossRef]
  77. Moroni, A.; Mijovic, J.; Pearce, E.M.; Foun, C.C. Cure Kinetics of Epoxy Resins and Aromatic Diamines. J. Appl. Polym. Sci. 1986, 32, 3761–3773. [Google Scholar] [CrossRef]
  78. Roller, M.B. Characterization of the Time-Temperature-Viscosity Behavior of Curing B-Staged Epoxy Resin. Polym. Eng. Sci. 1975, 15, 406–414. [Google Scholar] [CrossRef]
  79. Feller, J.F. Conductive polymer composites: Influence of extrusion conditions on positive temperature coefficient effect of poly(butylene terephthalate)/poly(olefin)-carbon black blends. J. Appl. Polym. Sci. 2004, 91, 2151–2157. [Google Scholar] [CrossRef]
  80. Rabearison, N.; Jochum, C.; Grandidier, J.C. A Cure Kinetics, Diffusion Controlled and Temperature Dependent, Identification of the Araldite LY556 Epoxy. J. Mater. Sci. 2011, 46, 787–796. [Google Scholar] [CrossRef]
  81. Wu, G.; Asai, S.; Sumita, M. Carbon Black as a Self-Diagnosing Probe To Trace Polymer Dynamics in Highly Filled Compositions. Macromolecules 2002, 35, 1708–1713. [Google Scholar] [CrossRef]
  82. Zhang, C.; Wang, P.; Ma, C.; Wu, G.; Sumita, M. Temperature and Time Dependence of Conductive Network Formation: Dynamic Percolation and Percolation Time. Polymer 2006, 47, 466–473. [Google Scholar] [CrossRef]
  83. Zhang, C.; Wang, L.; Wang, J.; Ma, C. Self-Assembly and Conductive Network Formation of Vapor-Grown Carbon Fiber in a Poly(Vinylidene Fluoride) Melt. Carbon 2008, 46, 2053–2058. [Google Scholar] [CrossRef]
  84. Wu, G.; Miura, T.; Asai, S.; Sumita, M. Carbon Black-Loading Induced Phase Fluctuations in PVDF/PMMA Miscible Blends: Dynamic Percolation Measurements. Polymer 2001, 42, 3271–3279. [Google Scholar] [CrossRef]
  85. Cipriano, B.H.; Kota, A.K.; Gershon, A.L.; Laskowski, C.J.; Kashiwagi, T.; Bruck, H.A.; Raghavan, S.R. Conductivity Enhancement of Carbon Nanotube and Nanofiber-Based Polymer Nanocomposites by Melt Annealing. Polymer 2008, 49, 4846–4851. [Google Scholar] [CrossRef]
  86. Bilotti, E.; Zhang, H.; Deng, H.; Zhang, R.; Fu, Q.; Peijs, T. Controlling the Dynamic Percolation of Carbon Nanotube Based Conductive Polymer Composites by Addition of Secondary Nanofillers: The Effect on Electrical Conductivity and Tuneable Sensing Behaviour. Compos. Sci. Technol. 2013, 74, 85–90. [Google Scholar] [CrossRef]
  87. Bilotti, E.; Zhang, R.; Deng, H.; Baxendale, M.; Peijs, T. Fabrication and Property Prediction of Conductive and Strain Sensing TPU/CNT Nanocomposite Fibres. J. Mater. Chem. 2010, 20, 9449. [Google Scholar] [CrossRef]
  88. Zhang, H.; Bilotti, E.; Tu, W.; Lew, C.Y.; Peijs, T. Static and Dynamic Percolation of Phenoxy/Carbon Nanotube Nanocomposites. Eur. Polym. J. 2015, 68, 128–138. [Google Scholar] [CrossRef]
  89. Alig, I.; Skipa, T.; Engel, M.; Lellinger, D.; Pegel, S.; Pötschke, P. Electrical Conductivity Recovery in Carbon Nanotube–Polymer Composites after Transient Shear. Phys. Status Solidi (B) 2007, 244, 4223–4226. [Google Scholar] [CrossRef]
  90. Davis, C.S.; Orloff, N.D.; Woodcock, J.W.; Long, C.J.; Twedt, K.A.; Natarajan, B.; Seppala, J.E.; McClelland, J.J.; Obrzut, J.; Liddle, J.A.; et al. Cure Temperature Influences Composite Electrical Properties by Carbon Nanotube-Rich Domain Formation. Compos. Sci. Technol. 2016, 133, 23–32. [Google Scholar] [CrossRef]
  91. Prasse, T.; Flandin, L.; Schulte, K.; Bauhofer, W. In Situ Observation of Electric Field Induced Agglomeration of Carbon Black in Epoxy Resin. Appl. Phys. Lett. 1998, 72, 2903–2905. [Google Scholar] [CrossRef]
  92. Garschke, C.; Parlevliet, P.P.; Weimer, C.; Fox, B.L. Cure kinetics and viscosity modelling of a high-performance epoxy resin film. Polym. Test. 2013, 32, 150–157. [Google Scholar] [CrossRef]
  93. Gnidakouong, J.R.N.; Roh, H.D.; Kim, J.; Park, Y.-B. In Situ Process Monitoring of Hierarchical Micro-/Nano-Composites Using Percolated Carbon Nanotube Networks. Compos. Part A Appl. Sci. Manuf. 2016, 84, 281–291. [Google Scholar] [CrossRef]
  94. Lu, S.; Chen, D.; Wang, X.; Xiong, X.; Ma, K.; Zhang, L.; Meng, Q. Monitoring the Manufacturing Process of Glass Fiber Reinforced Composites with Carbon Nanotube Buckypaper Sensor. Polym. Test. 2016, 52, 79–84. [Google Scholar] [CrossRef]
  95. Luo, S.; Wang, Y.; Wang, G.; Wang, K.; Wang, Z.; Zhang, C.; Wang, B.; Luo, Y.; Li, L.; Liu, T. CNT Enabled Co-Braided Smart Fabrics: A New Route for Non-Invasive, Highly Sensitive & Large-Area Monitoring of Composites. Sci. Rep. 2017, 7, 44056. [Google Scholar] [CrossRef]
  96. Battisti, A.; Skordos, A.A.; Partridge, I.K. Dielectric Monitoring of Carbon Nanotube Network Formation in Curing Thermosetting Nanocomposites. J. Phys. D Appl. Phys. 2009, 42, 155402. [Google Scholar] [CrossRef]
  97. de la Vega, A.; Kovacs, J.Z.; Bauhofer, W.; Schulte, K. Combined Raman and Dielectric Spectroscopy on the Curing Behaviour and Stress Build up of Carbon Nanotube–Epoxy Composites. Compos. Sci. Technol. 2009, 69, 1540–1546. [Google Scholar] [CrossRef]
  98. Shen, J.T.; Buschhorn, S.T.; De Hosson, J.T.M.; Schulte, K.; Fiedler, B. Pressure and Temperature Induced Electrical Resistance Change in Nano-Carbon/Epoxy Composites. Compos. Sci. Technol. 2015, 115, 1–8. [Google Scholar] [CrossRef]
  99. Gao, L.; Chou, T.-W.; Thostenson, E.T.; Zhang, Z. A Comparative Study of Damage Sensing in Fiber Composites Using Uniformly and Non-Uniformly Dispersed Carbon Nanotubes. Carbon 2010, 48, 3788–3794. [Google Scholar] [CrossRef]
  100. Gojny, F.H.; Wichmann, M.H.G.; Fiedler, B.; Kinloch, I.A.; Bauhofer, W.; Windle, A.H.; Schulte, K. Evaluation and Identification of Electrical and Thermal Conduction Mechanisms in Carbon Nanotube/Epoxy Composites. Polymer 2006, 47, 2036–2045. [Google Scholar] [CrossRef]
  101. Pillin, I.; Castro, M.; Nag-Chowdhury, S.; Feller, J.F. Robustness of Carbon Nanotube-Based Sensor to Probe Composites’ Interfacial Damage in Situ. J. Compos. Mater. 2015, 50, 109–113. [Google Scholar] [CrossRef]
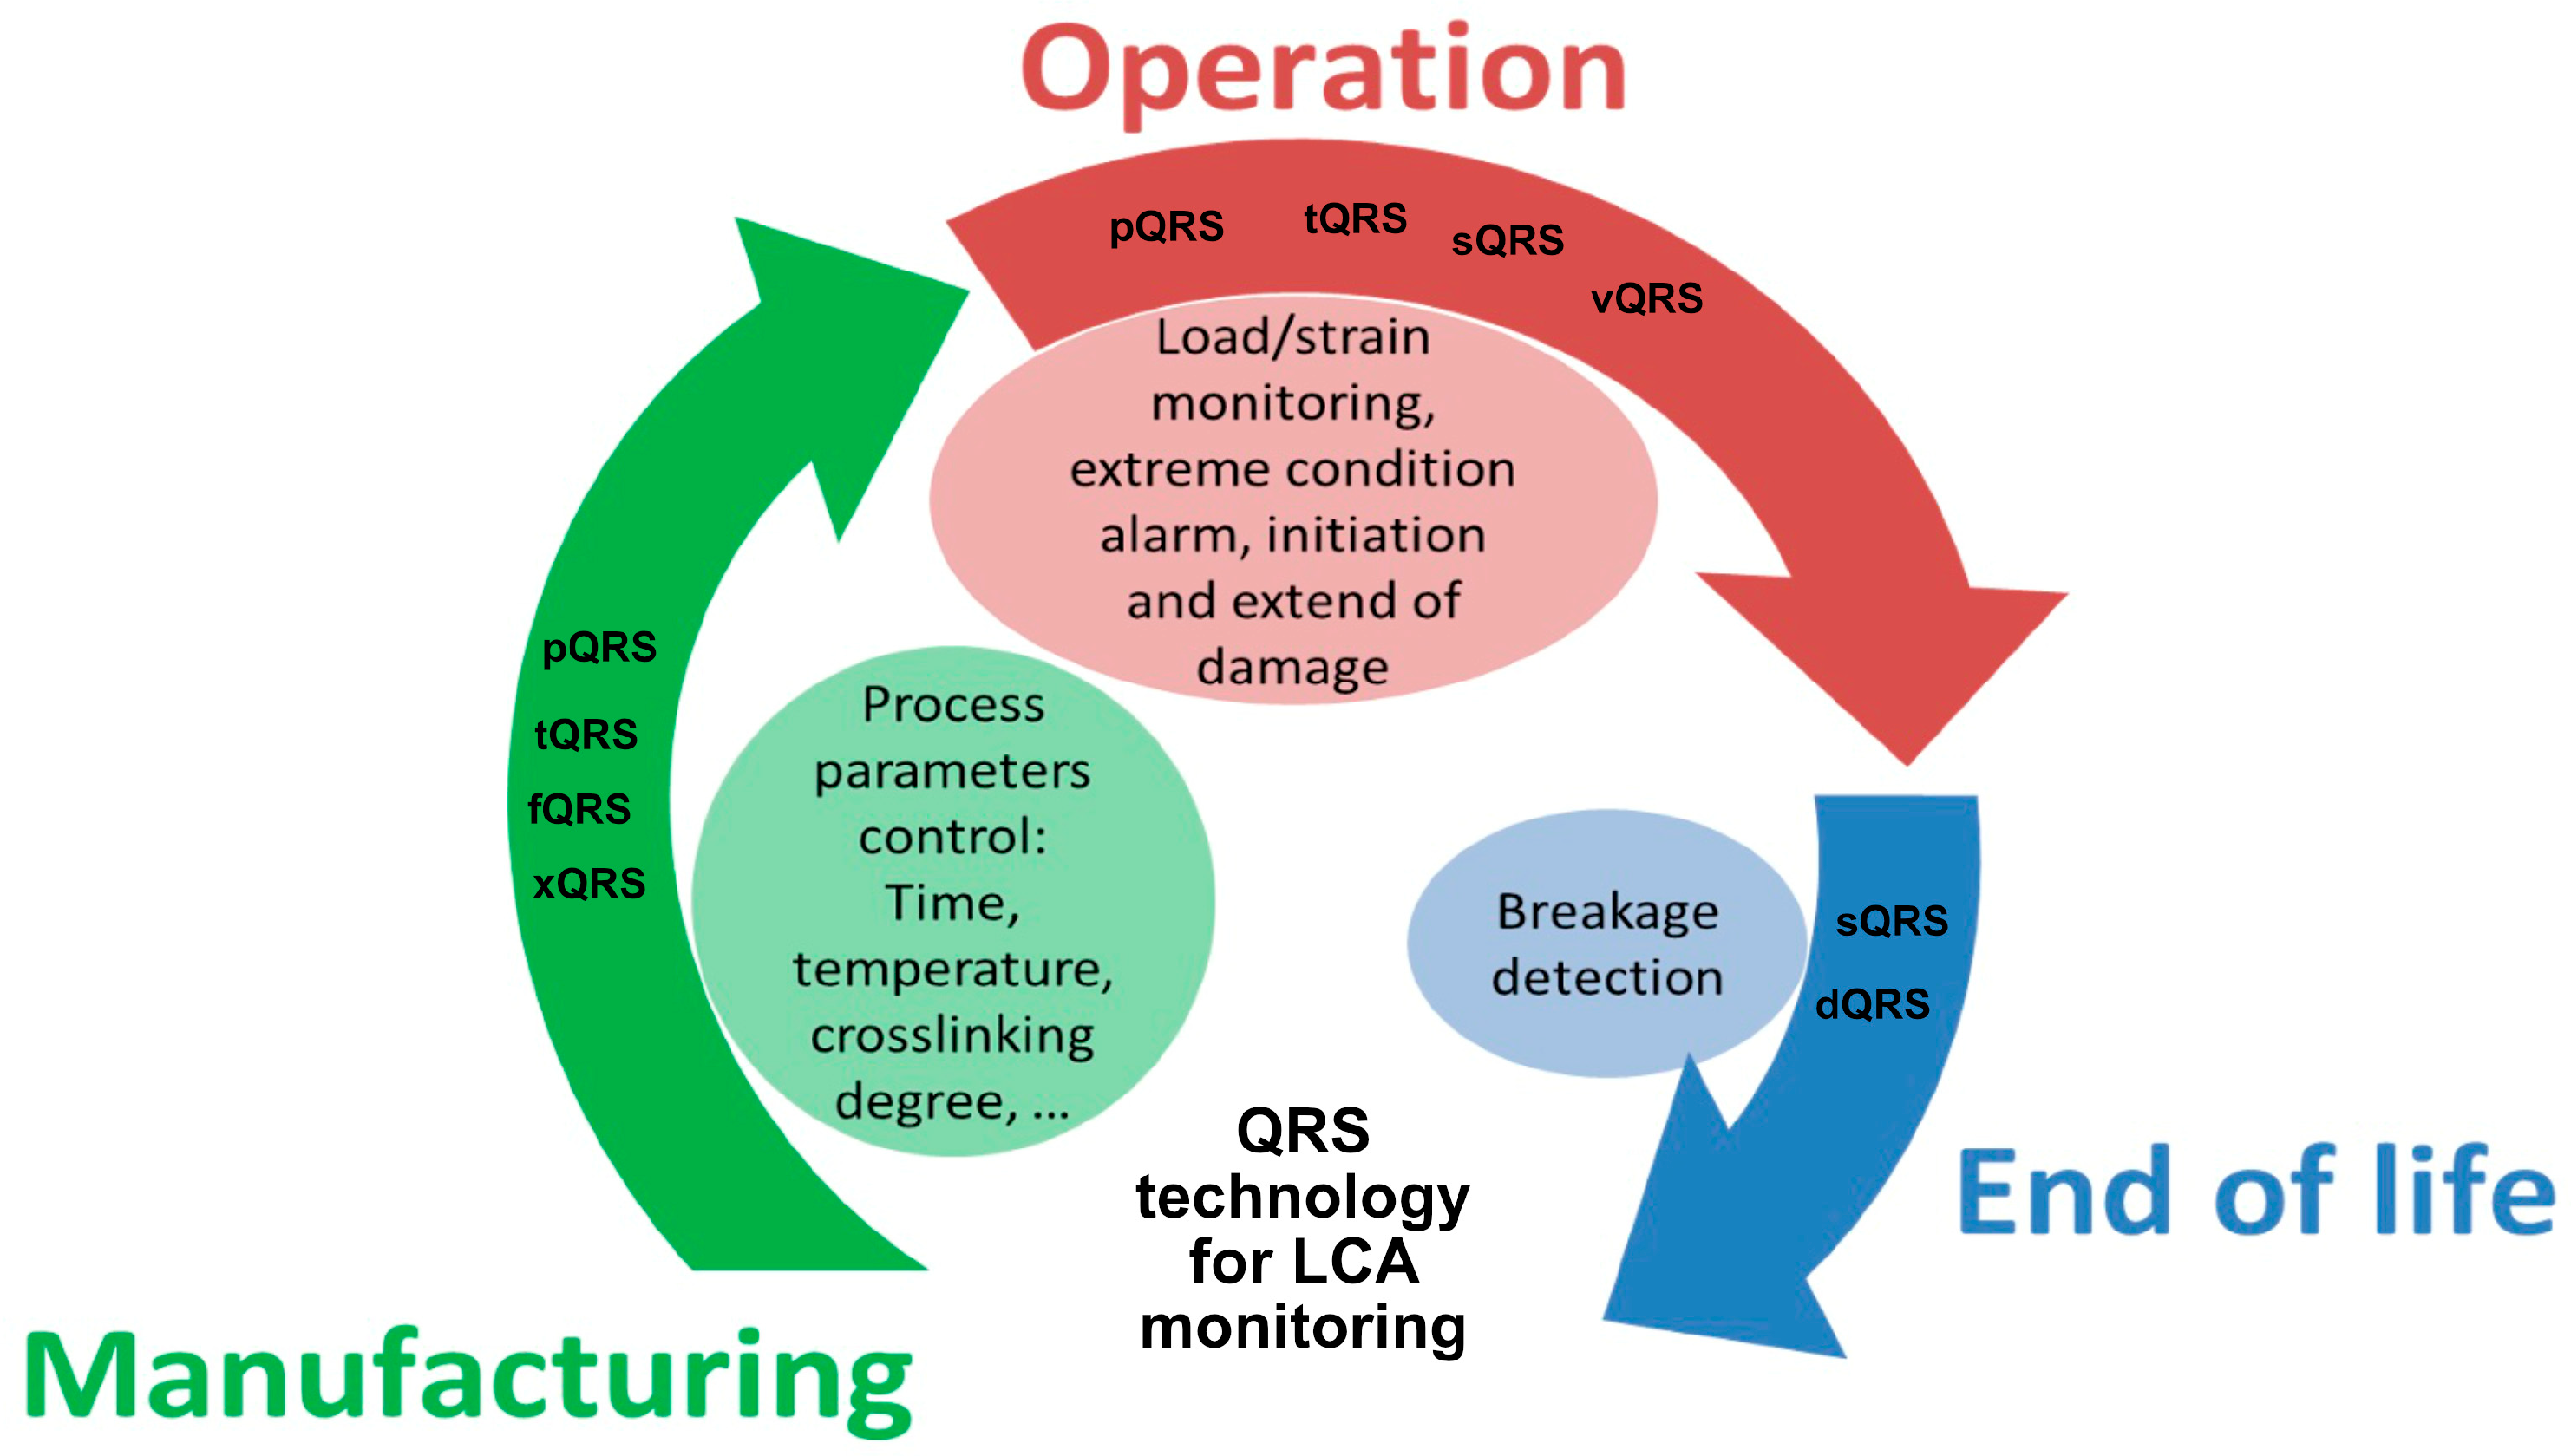
Figure 1. Monitoring the full life stages of composite parts with QRS ®.
Jcs 09 00435 g001
Figure 2. Crosslinking reaction of a DGBA resin with an amine hardener.
Jcs 09 00435 g002
Figure 3. Typical fabrication by sLbL and integration of the xQRS transducer between composite plies (a) and corresponding curing cycle (b).
Jcs 09 00435 g003
Figure 4. Typical design of an xQRS sprayed layer by layer onto a glass fibre taffeta–epoxy composite.
Jcs 09 00435 g004
Figure 5. Crosslinking degree versus time of a neat epoxy resin during isothermal curing at 120, 80, 60, and 40 °C with DSC measurements under a 40 cm3·min−1 nitrogen flow.
Jcs 09 00435 g005
Figure 6. Viscosity variation as a function of time of a neat epoxy resin during 40, 60, 80 and 110 °C curing isotherms obtained with an Anton Paar MCR301 RSR under 40 cm3·min−1 nitrogen flow.
Jcs 09 00435 g006
Figure 7. Normalised resistance R/R0 evolution versus time of an EP-2CNT (poly(epoxide) resin with 2 wt.% CNT) sensor without crosslinking during isothermal curing at 40, 60, 80, and 120 °C. R0 is the initial resistance of the sensor.
Jcs 09 00435 g007
Figure 8. Schematic illustration of a conductive path’s formation in a CNT–epoxy resin nanocomposite with dynamic percolation and without crosslinking. (a) Initial state and (b) after dynamic percolation.
Jcs 09 00435 g008
Figure 9. Resistance evolution versus time of an EP-2CNT sensor with crosslinking during an isothermal curing at 40, 60, 80, and 120 °C. R0 is the initial resistance of the sensor.
Jcs 09 00435 g009
Figure 10. (a) Comparison of the resistance evolution versus time of an EP-2CNT sensor with and without crosslinking during an isothermal curing at 80 °C. R0 is the initial resistance of the sensor. (b) Comparison of the sensor’s onset time of percolation in the absence or presence of crosslinking. (c) Comparison of the sensor’s resistance after 4000 s in the absence or presence of crosslinking.
Jcs 09 00435 g010
Figure 11. Schematic illustration of a conductive path’s formation in a CNT–epoxy resin nanocomposite by volume exclusion with the chain’s crosslinking reaction. (a) Initial state and (b) after the chains’ crosslinking.
Jcs 09 00435 g011
Figure 12. Evolution of the normalised resistance R/R0 of a QRS with the crosslinking of the resin during an isothermal curing at 40, 60, 80, and 120 °C. The lines correspond to a Boltzmann fitting. R0 is the initial resistance of the sensor.
Jcs 09 00435 g012
Figure 13. Evolution during a curing cycle of the QRS resistance, of the oven’s temperature, and of the resin’s crosslinking. The vertical lines indicate the separation between the different parts of the curing cycle. R0 is the initial resistance of the sensor.
Jcs 09 00435 g013
Figure 14. Evolution of the QRS resistance during a curing cycle versus (a) the temperature and (b) the crosslinking degree. R0 is the initial resistance of the sensor.
Jcs 09 00435 g014
Figure 15. Evolution of the QRS resistance during the curing with sharp stops. Each sample was quenched to 25 °C at different steps of the curing cycle, corresponding to the start or the end of a temperature plateau. The arrows correspond to the quenching time. R0 is the initial resistance of the sensor.
Jcs 09 00435 g015
Figure 16. (a) Evolution of stress and QRS change in resistance (AR) with strain during a static tensile test until fracture of a 0° UD glass fibre epoxy composite. (b) Evolution of the sensor’s gauge factor in the elastic domain and the epoxy resin Young’s modulus with the resin crosslinking degree.
Jcs 09 00435 g016
Table 1. Comparison of the curing parameters with the literature.
ReferencenmE1 (kJ·mol−1)E2 (kJ·mol−1)A1 (s−1)A2 (s−1)
Present study2.0–2.30.53.8 × 1018.8 × 1012.9 × 1029.7 × 109
[71]1.5–1.90.6–0.81.6 × 1026.3 × 1011.3 × 10143.0 × 104
[80]216.9 × 1017.3 × 1011.3 × 1052.1 × 107
Table 2. Evolution of the onset time for the start of resistance decrease and the resistance loss at 4000 s of the EP-2CNT sensor with and without crosslinking.
Isothermal Curing Temperature (°C)406080120
Onset time of percolation (s)Without crosslinking40026010030
With crosslinking1601007015
Ratio Rt = 4000s/Rt = 0sWithout crosslinking4.6 × 10−22.7 × 10−24.0 × 10−37.9 × 10⁻⁴
With crosslinking3.3 × 10−12.0 × 10−15.9 × 10−38.4 × 10⁻⁴
Table 3. Fitting parameters of the resistance evolution with the crosslinking degree for the four isothermal curing rounds.
Boltzmann Parameters406080120
A0.33770.21900.00630.0008
B2328233211
C−64.5−27.111.717.1
D8.063.673.937.06
R20.9860.9830.9970.999
Disclaimer/Publisher’s Note: The statements, opinions and data contained in all publications are solely those of the individual author(s) and contributor(s) and not of MDPI and/or the editor(s). MDPI and/or the editor(s) disclaim responsibility for any injury to people or property resulting from any ideas, methods, instructions or products referred to in the content.