Article

Improving Durability and Mechanical Properties of Silty Sand Stabilized with Geopolymer and Nanosilica Composites

by
Mojtaba Jafari Kermanipour
1,
Mohammad Hossein Bagheripour
1 and
Ehsan Yaghoubi
2,*
1
Department of Civil Engineering, Shahid Bahonar University, Kerman 76169-14111, Iran
2
College of Sport, Health and Engineering, Victoria University, Melbourne, VIC 3011, Australia
*
Author to whom correspondence should be addressed.
J. Compos. Sci. 2025, 9(8), 397; https://doi.org/10.3390/jcs9080397
Submission received: 16 June 2025 / Revised: 27 July 2025 / Accepted: 28 July 2025 / Published: 30 July 2025

Abstract

This study investigates the effectiveness of geopolymer-based binders for the stabilization of silty sand, aiming to improve its strength and durability under cyclic environmental conditions. A composite binder consisting of Ground Granulated Blast-furnace Slag (GGBS) and Recycled Glass Powder (RGP), modified with nano poly aluminum silicate (PAS), was used to treat the soil. The long-term performance of the stabilized soil was evaluated under cyclic wetting–drying (W–D) conditions. The influence of PAS content on the mechanical strength, environmental safety, and durability of the stabilized soil was assessed through a series of laboratory tests. Key parameters, including unconfined compressive strength (UCS), mass retention, pH variation, ion leaching, and microstructural development, were analyzed using field emission scanning electron microscopy (FE-SEM) and energy-dispersive X-ray spectroscopy (EDS). Results revealed that GGBS-stabilized specimens maintained over 90% of their original strength and mass after eight W–D cycles, indicating excellent durability. In contrast, RGP-stabilized samples exhibited early strength degradation, with up to an 80% reduction in UCS and 10% mass loss. Environmental evaluations confirmed that leachate concentrations remained within acceptable toxicity limits. Microstructural analysis further highlighted the critical role of PAS in enhancing the chemical stability and long-term performance of the stabilized soil matrix.

1. Introduction

Stabilizing problematic soils is a common engineering practice and a sustainable, environmentally friendly process for road subgrades and building foundations [1]. Conventional stabilizers like Portland cement and lime, despite their efficacy, pose significant environmental challenges due to energy-intensive production and greenhouse gas emissions [2,3]. Furthermore, their production process consumes excessive energy and resources, which is another problem associated with their use. In contrast, industrial byproducts like recycled RGP and GGBS offer sustainable alternatives for geotechnical applications. RGP is a recycled product derived from glass and GGBS is a byproduct of iron production processes [4,5].
According to a number of studies conducted in recent decades, geopolymers may serve as an appropriate replacement for cement and cut manufacturing-related CO2 gas output by over 75% [6,7]. In addition, the studies show the ability of the geopolymers to appropriate thermal and chemical stability as well as minimal use of resources in production [8]. Geopolymers are known for their weakness in moist conditions. Recent advances in nanotechnology further enable the integration of nanomaterials (e.g., nanosilica, nanoclay) into geopolymer matrices, enhancing their resistance to moisture and chemical degradation. [9,10,11]. Consequently, recent studies have extensively explored the optimization of nano-modified cement formulations tailored for high-efficiency construction applications [12,13,14]. A wide range of nanomaterials have been studied, including graphene-based nanomaterials [15], nanosilica [16,17], nanoaluminum [18,19], nanotitanium oxide [20], nanokaolin [21], and nanoclay and carbon nanotubes [22,23] utilized in cement composites.
It has become increasingly popular in recent years to use glass in civil applications [24,25], in particular to produce geopolymers from glass waste [26,27]. This is an emerging innovation that has gained traction due to its transformative potential within the infrastructure sector. In contrast to typical geopolymers, glass powder can be used to produce geopolymers without requiring a high synthesis temperature, which resolves a significant drawback [28]. Due to the silicate content in glass powder, it is suitable both as an alkaline solution and as a precursor [29]. Actually, the RGP includes approximately 13 percent sodium oxide (Na2O). Since RGP contains a high quantity of sodium, the sodium hydroxide concentration in the activator solution (NaOH) could be reduced [30,31].
In contrast to its extensive use as a soil stabilizer, GGBS is seldom utilized in research focused on advancing nano-tailored cement blends. Bhojaraju et al. [9] applied GGBS to enhance the initial performance of cement products exposed to treatment with graphene and graphene oxide. They additionally tested the impact of GGBS on the durability properties of these improved samples and determined that GGBS increased the durability of treated specimens. The application of 40% GGBS and 8 mol NaOH resulted in a greater UCS for treated Black Cotton, a highly sensitive soil, and only a 9.2% reduction in UCS was observed after 12 W–D cycles [32]. Utilizing GGBS is also a useful method for improving the initial properties of sedimentary soils. It increases the strength, reduces the alkalinity of the sediment, and improves the ability to immobilize iron (Fe), nickel (Ni), and zinc (Zn). However, the release of metals such as aluminum (Al), manganese (Mn), copper (Cu), arsenic (As), barium (Ba), and lead (Pb) is strongly influenced by the dynamic relationship of physical–chemical parameters, as metallic components exhibit distinct responses to variations in curing conditions (temperature, duration) and pH levels [33].
The subsoil in arid regions is typically subjected to extreme weather conditions. Therefore, many researchers use wet–dry cycles that simulate harsh conditions to evaluate the durability of stabilized foundations. Horpibulsuk et al. [34] investigated the application of two industrial byproducts, water treatment sludge (WTS) and fly ash (FA), to assess their efficacy in improving the mechanical properties and long-term resilience of stabilized soil subjected to cyclic wetting and drying conditions. The study found that optimal ratios and curing conditions for producing durable, load-bearing masonry units were a liquid alkaline activator (L) to FA ratio of 1:6, Na2SiO3/NaOH of 90:10, and an optimal heat of 85 °C for 72 h [34]. Bin-Shafique et al. (2011) studied the performance of high and low-plasticity clays enhanced with Class C FA, evaluating their resilience under repeated moisture fluctuations (W–D cycles) and temperature-induced phase changes (freeze–thaw cycles). The tested specimens exhibited negligible degradation under W–D cycles. In contrast, exposure to freeze–thaw conditions resulted in compressive strength losses of up to 40% [35].
This study bridges a critical research gap by evaluating PAS-modified GGBS/RGP geopolymers under simulated arid climate conditions, combining mechanical, environmental, and microstructural analyses. An assessment of the influence of PAS on cement paste strength is examined, as well as the impact of nanomaterials on the durability of stabilized soil with RGP or GGBS. Through a comprehensive laboratory test program, this study explores critical factors such as durability under saturated conditions, various curing times, and the effects of W–D cycles on stabilized samples. By incorporating both mechanical and microstructural testing, along with leaching ion assessments for environmental safety, this research offers a novel and comprehensive approach to understanding the long-term performance and environmental impact of soil composites containing PAS. It fills a significant gap in the literature by providing new insights into the durability and sustainability of nanomaterial-stabilized geostructural materials.

2. Materials and Methods

Silty sand, sourced from southern Iran and classified via the USCS, served as the principal material [36]. Parameters related to soil particle characteristics according to ASTM-D422 [36] are demonstrated in Figure 1. Since the soil contained a significant proportion of fines, the wet sieving method was adopted for the particle size distribution (PSD) test to ensure accurate separation and measurement of fine particles. During sample preparation, all sand was passed through a No. 40 sieve (0.420 mm) to eliminate impurities and coarse particles (<1%). Table 1 summarizes the soil’s properties including Maximum Dry Density (MDD) and Optimum Moisture Content (OMC), derived from the standard Proctor compaction test [37], classification, and Specific Gravity. All values reported in Table 1 were obtained from experimental tests conducted as part of this study. Moisture content was determined using the oven-drying method by weighing each soil sample before and after drying. The moisture content corresponding to the sample with the highest dry density was recorded as the OMC. It is worth noting that MDD and OMC are known not to undergo significant changes when geopolymer-based additives are used for soil stabilization [38]. Consequently, all samples, whether stabilized or unstabilized soil, were compacted with similar OMC.
RGP and GGBS were used as geopolymer precursors in this investigation, where GGBS provided calcium for the formation of C(N)-A-S-H gel and RGP contributed reactive silica to support the development of the aluminosilicate network during geopolymerization. The PSD of these materials was determined using the Zetasizer laser analyzer device, Malvern Panalytical, England, as shown in Figure 1. Prior to mixing, the RGP was passed through a No. 200 sieve to ensure its purity. Furthermore, the X-ray fluorescence spectrometry (XRF) test was conducted by Zetium, Malvern Panalytical, England, on the glass powder in order to determine its chemical composition. The results are shown in Table 1. The RGP has a high silica content (SiO2 = 73.77%), as shown in Table 1, suggesting that its constituents have a significant capability of creating geopolymer gel [40].
Table 2 presents the results of the XRF test, which was used to analyze the chemical composition of the GGBS [41]. The GGBS tends to react with pozzolanic materials to form a cementitious substance, as evidenced by the high percentage of calcium oxide (CaO = 38.9%). GGBS is also an effective silica source (SiO2 = 36.5%), which qualifies it for the creation of geopolymers [42]. It should be noted that to determine the Loss on Ignition (LOI), the samples were heated at 1000 °C for one hour.
For the geopolymer preparation process, laboratory sodium hydroxide (NaOH) powder, a commonly used material, purchased from Merck company, Germany, with 99% purity and pH of 14, was used as an alkaline activator. To produce sodium hydroxide solution, sodium hydroxide powder was dissolved in 1 L of water based on the molar mass of sodium hydroxide (40 gr/lit) and the required molarity. As an example, to produce a 7 molar solution, 280 g of sodium hydroxide should be dissolved in 1000 cc of water (tap water was used in this study). Of course, since this dissolution was an exothermic reaction accompanied by water evaporation, the addition of water was carried out in two phases with an interval of about 24 h.
The nano aluminum polysilicate powder (PAS) used as a precursor in this study had a bulk density of 0.5 g/cm3 and an average particle size of 60 nm. In addition, SiO2 and Al2O3 make up the majority of the PAS components, comprising approximately 54% and 15%, respectively.

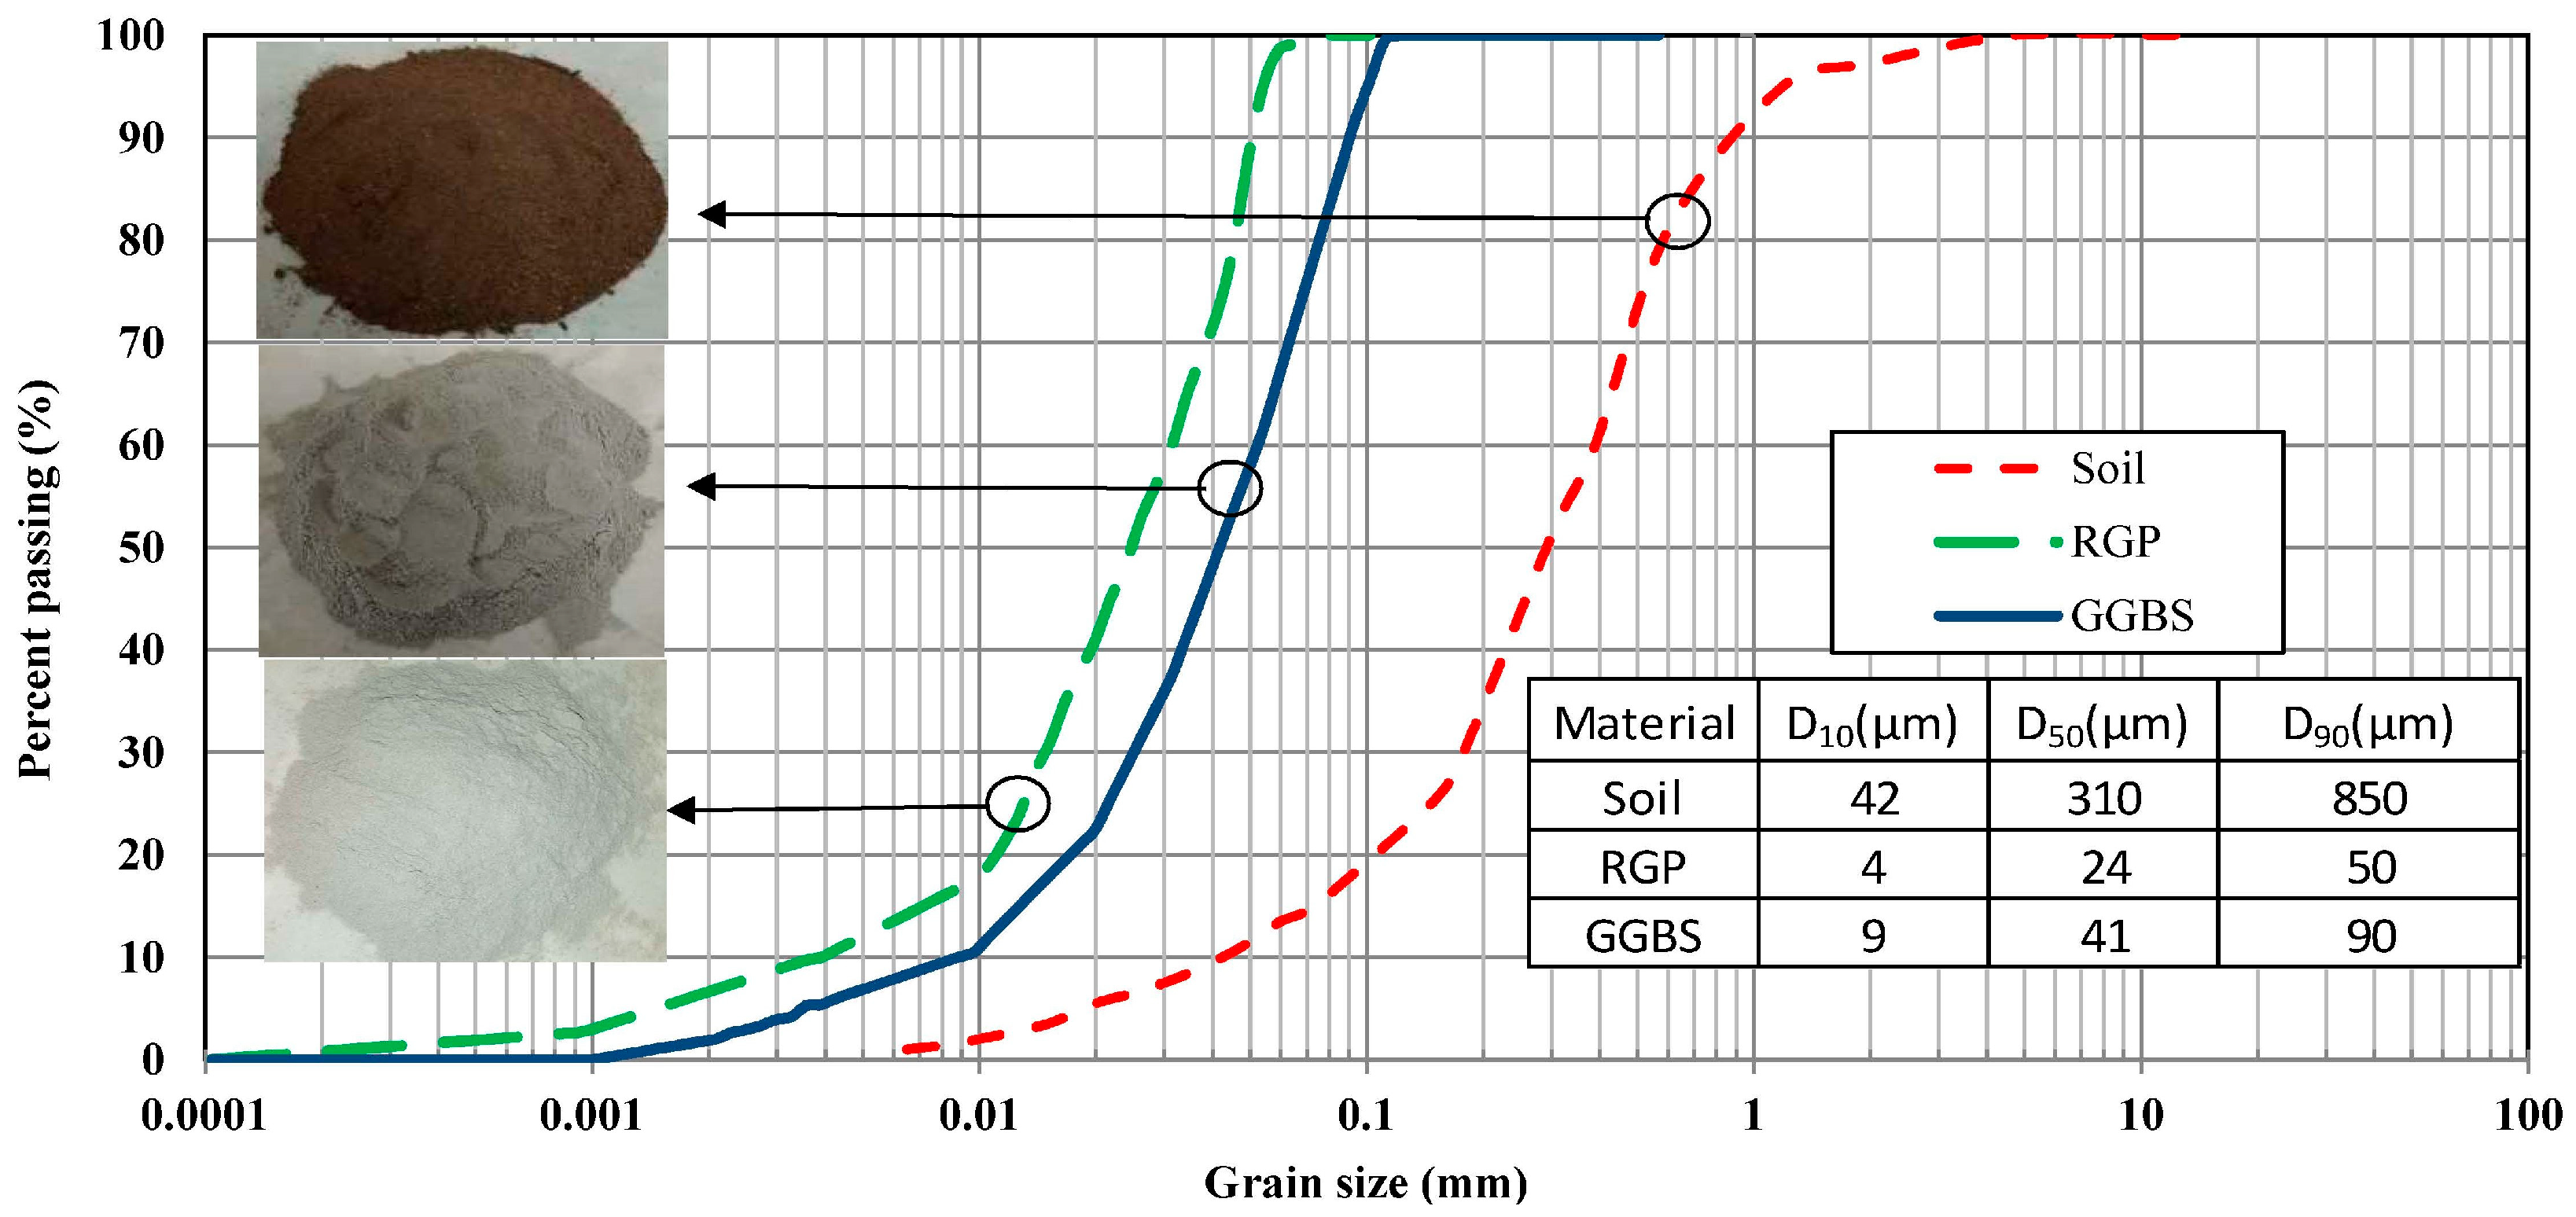
2.1. Sample Preparation

A split cylindrical steel mold with a 37 mm diameter and a 75 mm height was used to create the UCS samples [5]. Initially, the soil was dried for three days at 60 °C in an industrial oven. To achieve a homogeneous mixture, the dried soil and precursor materials, i.e., GGBS and RGP, were first weighed and then dry mixed for five minutes. The alkaline solution was introduced to the dry components to achieve the target optimum moisture content of 13%, followed by thorough mixing to ensure homogeneity of the blend. The concentration of the alkaline solution was the optimal value of 7 M, which was determined in the previous study [43]. To minimize the risk of nanoparticle agglomeration, the 2% PAS (as specified in Table 2, by total mixture weight) was incorporated into an optimized dosage of alkaline activator solution. The prepared solution was subsequently poured into the dry precursor mixture and stirred for ten minutes [44]. In order to compact the samples into three layers, the under-compaction method was used [45]. The under-compaction method increases the density of the underlying layers by compacting successive sand layers to a predetermined density. This approach takes advantage of the compaction process to generate a homogeneously dense sand-based sample through controlled densification. Each layer was compacted with a steel rod matching the sample’s diameter, which corresponds to the mold’s inner diameter. Before filling the mold with material, a thin polymer sheet was applied to minimize vapor emissions. After that, the samples were enclosed in sealable plastic wraps with two zips. The samples were kept in an oven set at 35 ± 1 °C for 7, 14, and 45 days. The setting of 35 ± 1 °C was chosen to simulate typical environmental conditions in warm, arid regions.
In accordance with ASTM D2166-87, the UCS test was conducted on specimens [46]. During the tests, the samples’ stress–strain behavior was monitored, with the compression apparatus operating at a displacement rate of 1 mm/min. Unconfined compressive strength (UCS) refers to the maximum axial stress that a cylindrical soil or stabilized material specimen can withstand under axial loading without any lateral confinement. It is commonly used to evaluate the strength of cohesive and stabilized soils, particularly in geotechnical and pavement engineering. UCS differs from conventional compressive strength, which is typically used for materials such as concrete or rock specimens that are tested under confined or supported conditions. In contrast, UCS, in which the confining stress is zero, is a simpler and quicker test, and is particularly suitable for assessing the mechanical behavior of stabilized soils and geomaterials [47,48].
Table 3 shows the material proportions, alkali activator types, and nanomaterial ratios in various composites in this investigation. The values presented in Table 3 represent the optimized parameters established based on findings from prior research [43].

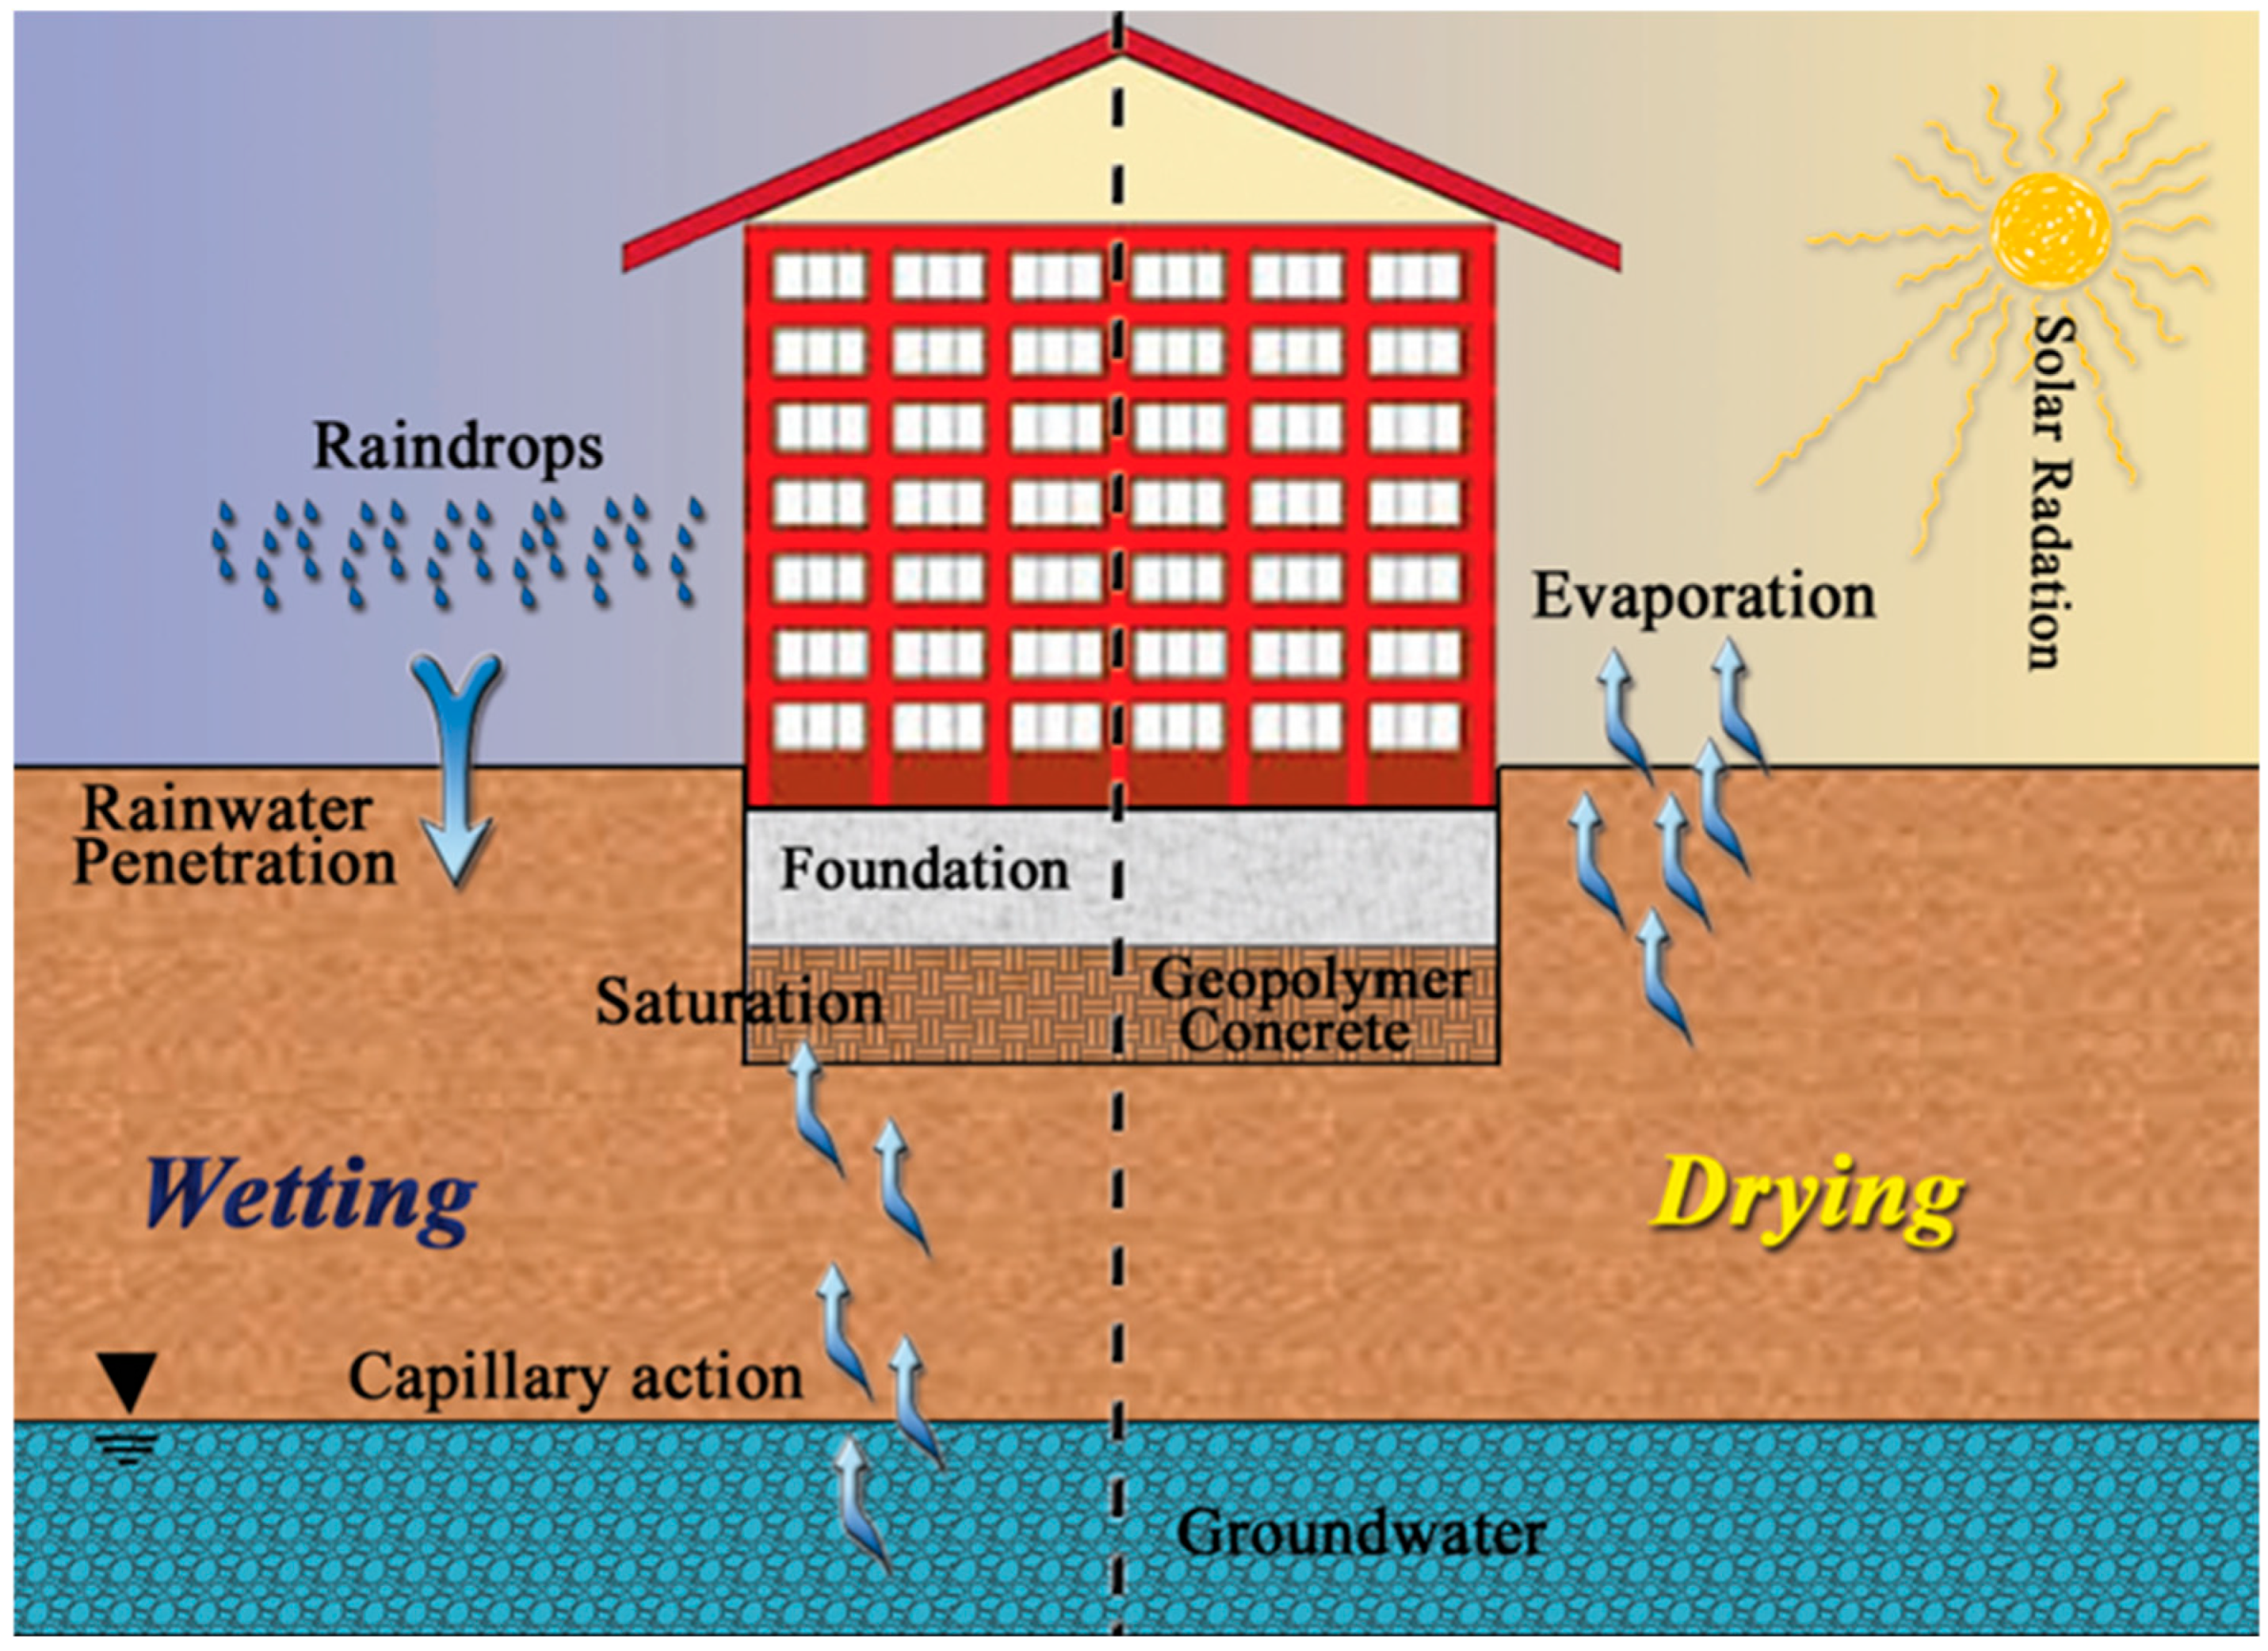
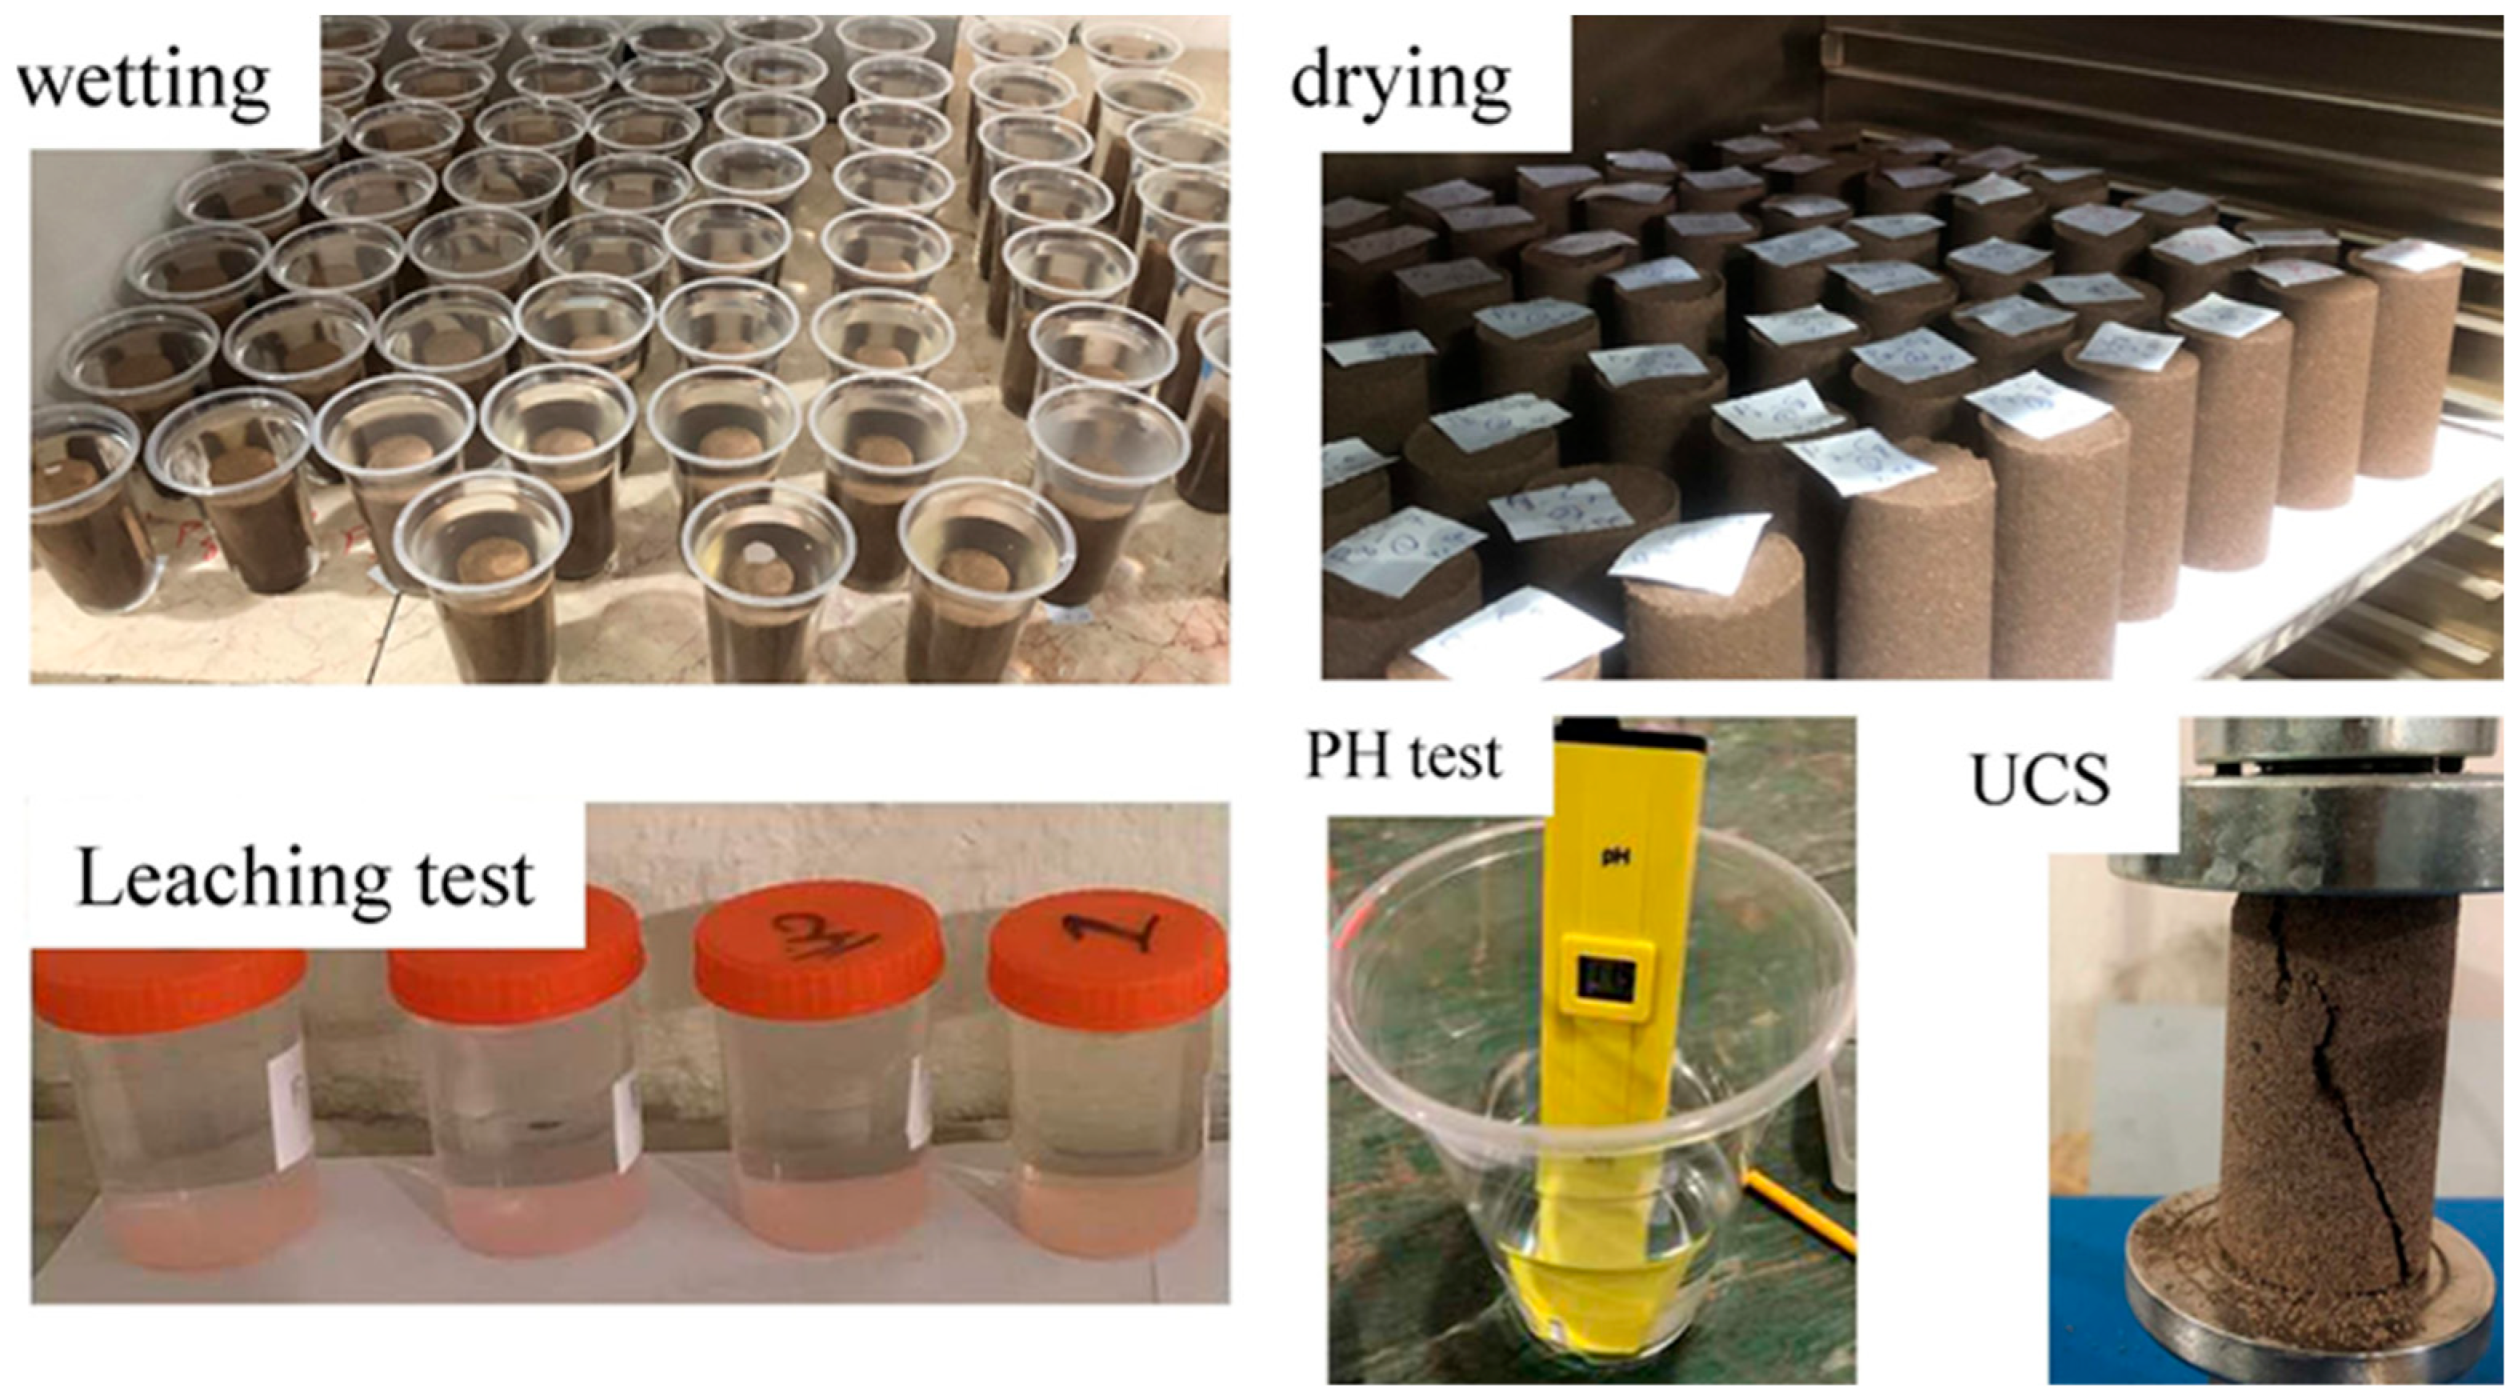
2.2. Wetting–Drying Cycle Test

The W–D tests were conducted using ASTM D559 (2015) [49] to replicate the samples’ weathering in the field as a result of seasonal variations. As demonstrated in Figure 2, soils are expected to lose moisture on warm, sunny days (dry cycle) and absorb moisture on rainy days (wet cycle). Also, capillary action can lead to a rise in the level of saturation of the soils. The UCS samples, which were cured for 14 and 45 days, experienced a total of eight wet–dry cycles. The W–D experiment began with five hours of immersion in water at 25 ± 2 °C (ambient conditions) and 100% saturation. The samples were then carefully removed from the water and, after one hour, dried in an oven at 70 ± 2 °C for 43 h, to conclude one W–D cycle. The weight and dimensions of each specimen were recorded after both immersion and drying phases. Each W–D cycle spanned a total duration of 48 h [50]. The UCS test was performed on samples following the completion of each wet/dry cycle phase; that is, two UCS tests were performed for each cycle. As demonstrated in Figure 3, 192 cylindrical geopolymer specimens were made for the W–D cycles test. Three replicates of each group of specimens were made to ensure the reliability of the results and the mean values were presented.

2.3. Leaching Test

Leaching tests were carried out following a batch immersion method similar to that described by Pasupathy et al. [51], involving immersion of specimens in deionized water. The leachate concentrations of heavy metals were then compared with the permissible limits established by the U.S. Environmental Protection Agency (USEPA) for safe release into soil and water systems. Leachate concentrations are expressed in mg/L, representing the mass of dissolved ions per liter of solution, consistent with established practice in geopolymer leaching studies [51].
Using Inductively Coupled Plasma (ICP) analysis, the leaching of alkali ions (Na+, K+, Si+, Al+, and Ca+) in the solutions was quantified after five hours [51]. Trace and total elemental concentrations, including heavy metals, were quantified using an ICP-OES system (PerkinElmer Optima 8000, Waltham, MA USA). Approximately 0.2 g of each dried and powdered sample was digested in a microwave digestion system (Anton Paar Multiwave PRO Hanover County, Virginia, USA) using a mixture of concentrated HNO3 and HCl (aqua regia method). Digestion was performed at 180 °C for 30 min. The digested solution was filtered and diluted to 50 mL with deionized water prior to analysis. The instrument operated at a plasma power of 1500 W, with a nebulizer flow rate of 0.9 L/min and axial view configuration. Since higher levels of free-alkali result in a greater tendency for alkali leaching on the sample surface [30], a pH electrode was used to track the pH of the leaching solution during the wetting phases of the first, third, fifth, and eighth cycles.

2.4. FE-SEM and EDX Tests

Energy dispersive spectroscopy (EDX) and field emission scanning electron microscopy (FE-SEM) analyses were carried out to evaluate the underlying mechanisms of the effects of additives and W–D cycles on the stabilized soil. It should be noted that EDS provides only semi-quantitative surface composition data, and therefore, the calculated molar ratios are approximate. While useful for identifying elemental trends at the microstructural level, more accurate bulk chemical analysis (e.g., XRF) is recommended for precise molar ratio determination [52,53]. MIRATESCAN, a field emission scanning electron microscope, was used to magnify images of both stabilized and unstabilized soils up to 5000 times. SEM and EDX analyses were conducted on dried soil fragments from UCS-tested samples, with a gold coating applied for FE-SEM conductivity [41].

3. Results and Discussion

Throughout this part, the implications of the nanoparticle additive, PAS, for two groups of mix designs in terms of the strength and characteristics of geopolymer-stabilized soils are discussed. The two groups are based on different primary aluminosilicate sources: one group utilizes RGP, while the other incorporates GGBS. Furthermore, the effect of W–D cycles on the mechanical and microstructural properties of samples is evaluated. It should be noted that the current study builds on a previous study by the authors with a focus on the mechanical properties of the mixtures [43]. Following the previous study, the weight proportion of the additives was 20 percent (18% geopolymer with 2% nanoparticles), aligning with optimal water content of 13% [43]. A 7 M alkaline sodium hydroxide solution was also introduced to the samples.

3.1. Investigation of the Saturation Conditions

When using geopolymers to stabilize the building soil foundation, a key challenge is how the stabilized soil performs under damp or waterlogged environments, especially in regions where groundwater levels are near the surface [50,54]. To select suitable samples for the W–D cycle test, the strength of the samples listed in Table 2 was first evaluated under saturated conditions. The specimens were made according to the procedures mentioned in Section 2.1. After curing for 7 days, the samples were submerged in water for 48 h. UCS tests were then conducted on the specimens in an entirely saturated condition. The outcomes illustrated in Figure 4 indicate that three samples of RGP, GGBS, and RGP-N demonstrated a reduction in strength after 48 h of saturation. Notably, after five hours of saturation, the untreated sand sample collapsed. Interestingly, GGBS-N specimens containing nanoparticles and GGBS exhibited a significant increment in UCS after being saturated for 48 h. The findings indicated that the mixing technique applied to treat sandy soils could overcome the primary challenge of geopolymer stabilization, which is its inadequate durability in saturated conditions. The UCS values of the RGP- and GGBS-treated soil samples decreased dramatically with moisture, and PAS could not reverse the degradation of the RGP-based samples. In contrast, adding nanoparticles to GGBS improved the durability of the stabilized samples when exposed to saturated conditions. This could be attributed to the stronger persistence of chemical reactions after seven-day curing in the GGBS-N samples.

3.2. Effect of Curing Time

Figure 5 shows the UCS results of specimens cured for various durations prior to being subjected to the W–D cycles. Although the curing process generally increases the strength of all soil samples, the UCS values of samples containing GGBS were higher than those with RGP, except for the 45-day samples. The RGP-N samples showed minimal strength gain after 7 days, but they reached 7 and 12 times their initial strength after 14 and 45 days of curing, respectively. This can be attributed to the faster initial setting rate of GGBS-based samples compared to RGP-based samples. This shows the significant influence of curing time on the strength of RGP-based samples.
The strength of seven-day GGBS-based samples is approximately six times higher than the strength of RGP-based samples of the same age. However, the UCS difference reached its minimum value at 14 days of age. After 14 days, the trend changed, with the strength of the RGP-based samples being much higher than that of the GGBS-based samples after 45 days. This change in strength gain during the curing process can be due to the mobilization of CaO in the GGBS-based samples, leading to earlier strength gain [55,56].

3.3. Wetting–Drying Cycle Test (W–D)

Fourteen-day and forty-five-day nano-stabilized samples based on RGP and GGBS were prepared to assess their durability under wet–dry cycles. Figure 6a illustrates that RGP-N samples cured for 14 days exhibited a progressive decline in strength as the number of cycles increased. The most significant reduction in UCS occurred immediately after the first cycle for specimens tested in a saturated state, with the gradual weakening continuing until the eighth cycle, where minimal values were observed. Notably, samples tested in a dry condition consistently displayed higher UCS values than their wet counterparts, though both states experienced degradation over successive cycles. These findings underscore the critical influence of nanomaterial content on the long-term durability of RGP-based composites under cyclic moisture exposure.
Figure 6b highlights similar trends for RGP-N samples cured for 45 days, though with a steeper decline rate in UCS values compared to shorter curing periods. Conversely, GGBS-modified soil samples cured for 14 days showed only marginal UCS reductions as W–D cycles progressed. Interestingly, the most pronounced decrease for these specimens occurred after the third cycle in saturated conditions, with initial cycles yielding the lowest strength measurements. The divergent behavior between RGP-N and GGBS-based samples emphasizes the role of material composition in resisting mechanical deterioration under repeated environmental stress. Unexpectedly, as shown in Figure 6b, the UCS of GGBS-based soil samples cured for 45 days increased with the increasing number of W–D cycles until the sixth cycle. This unexpected behavior is due to the drying temperature of 70 °C, which resulted in an acceleration of the geopolymerization process. Pourabbas et al. demonstrated that elevating the synthesis temperature during the initial preparation phase from 25 °C to 70 °C significantly enhanced the load-bearing capacity of geopolymer-treated soil specimens. Based on visual evidence from the surface appearance of the specimens, small surface cracks were observed to develop on the RGP-based samples during the fourth cycle and became more pronounced by the eighth cycle. In contrast, the GGBS-based samples exhibited no significant visual deterioration, although a reduction in apparent cohesion was noticeable by the end of the eighth cycle.

3.3.1. Mass Loss

As shown in Figure 7, the cumulative mass reduction increased proportionally with the number of cycles. As mentioned earlier, the sample with a higher UCS (GGBS-N) exhibited minimal mass reduction, which aligns with the UCS test results. Initial testing phases (cycles 1–2) revealed significant material attrition across all tested groups. Each W–D cycle generates cracks on the surface and interior of the samples, resulting in leaching of the stabilizing materials and mass loss. From cycles two to eight, a reorganization of the geopolymer matrix occurred and mass loss nearly stopped.

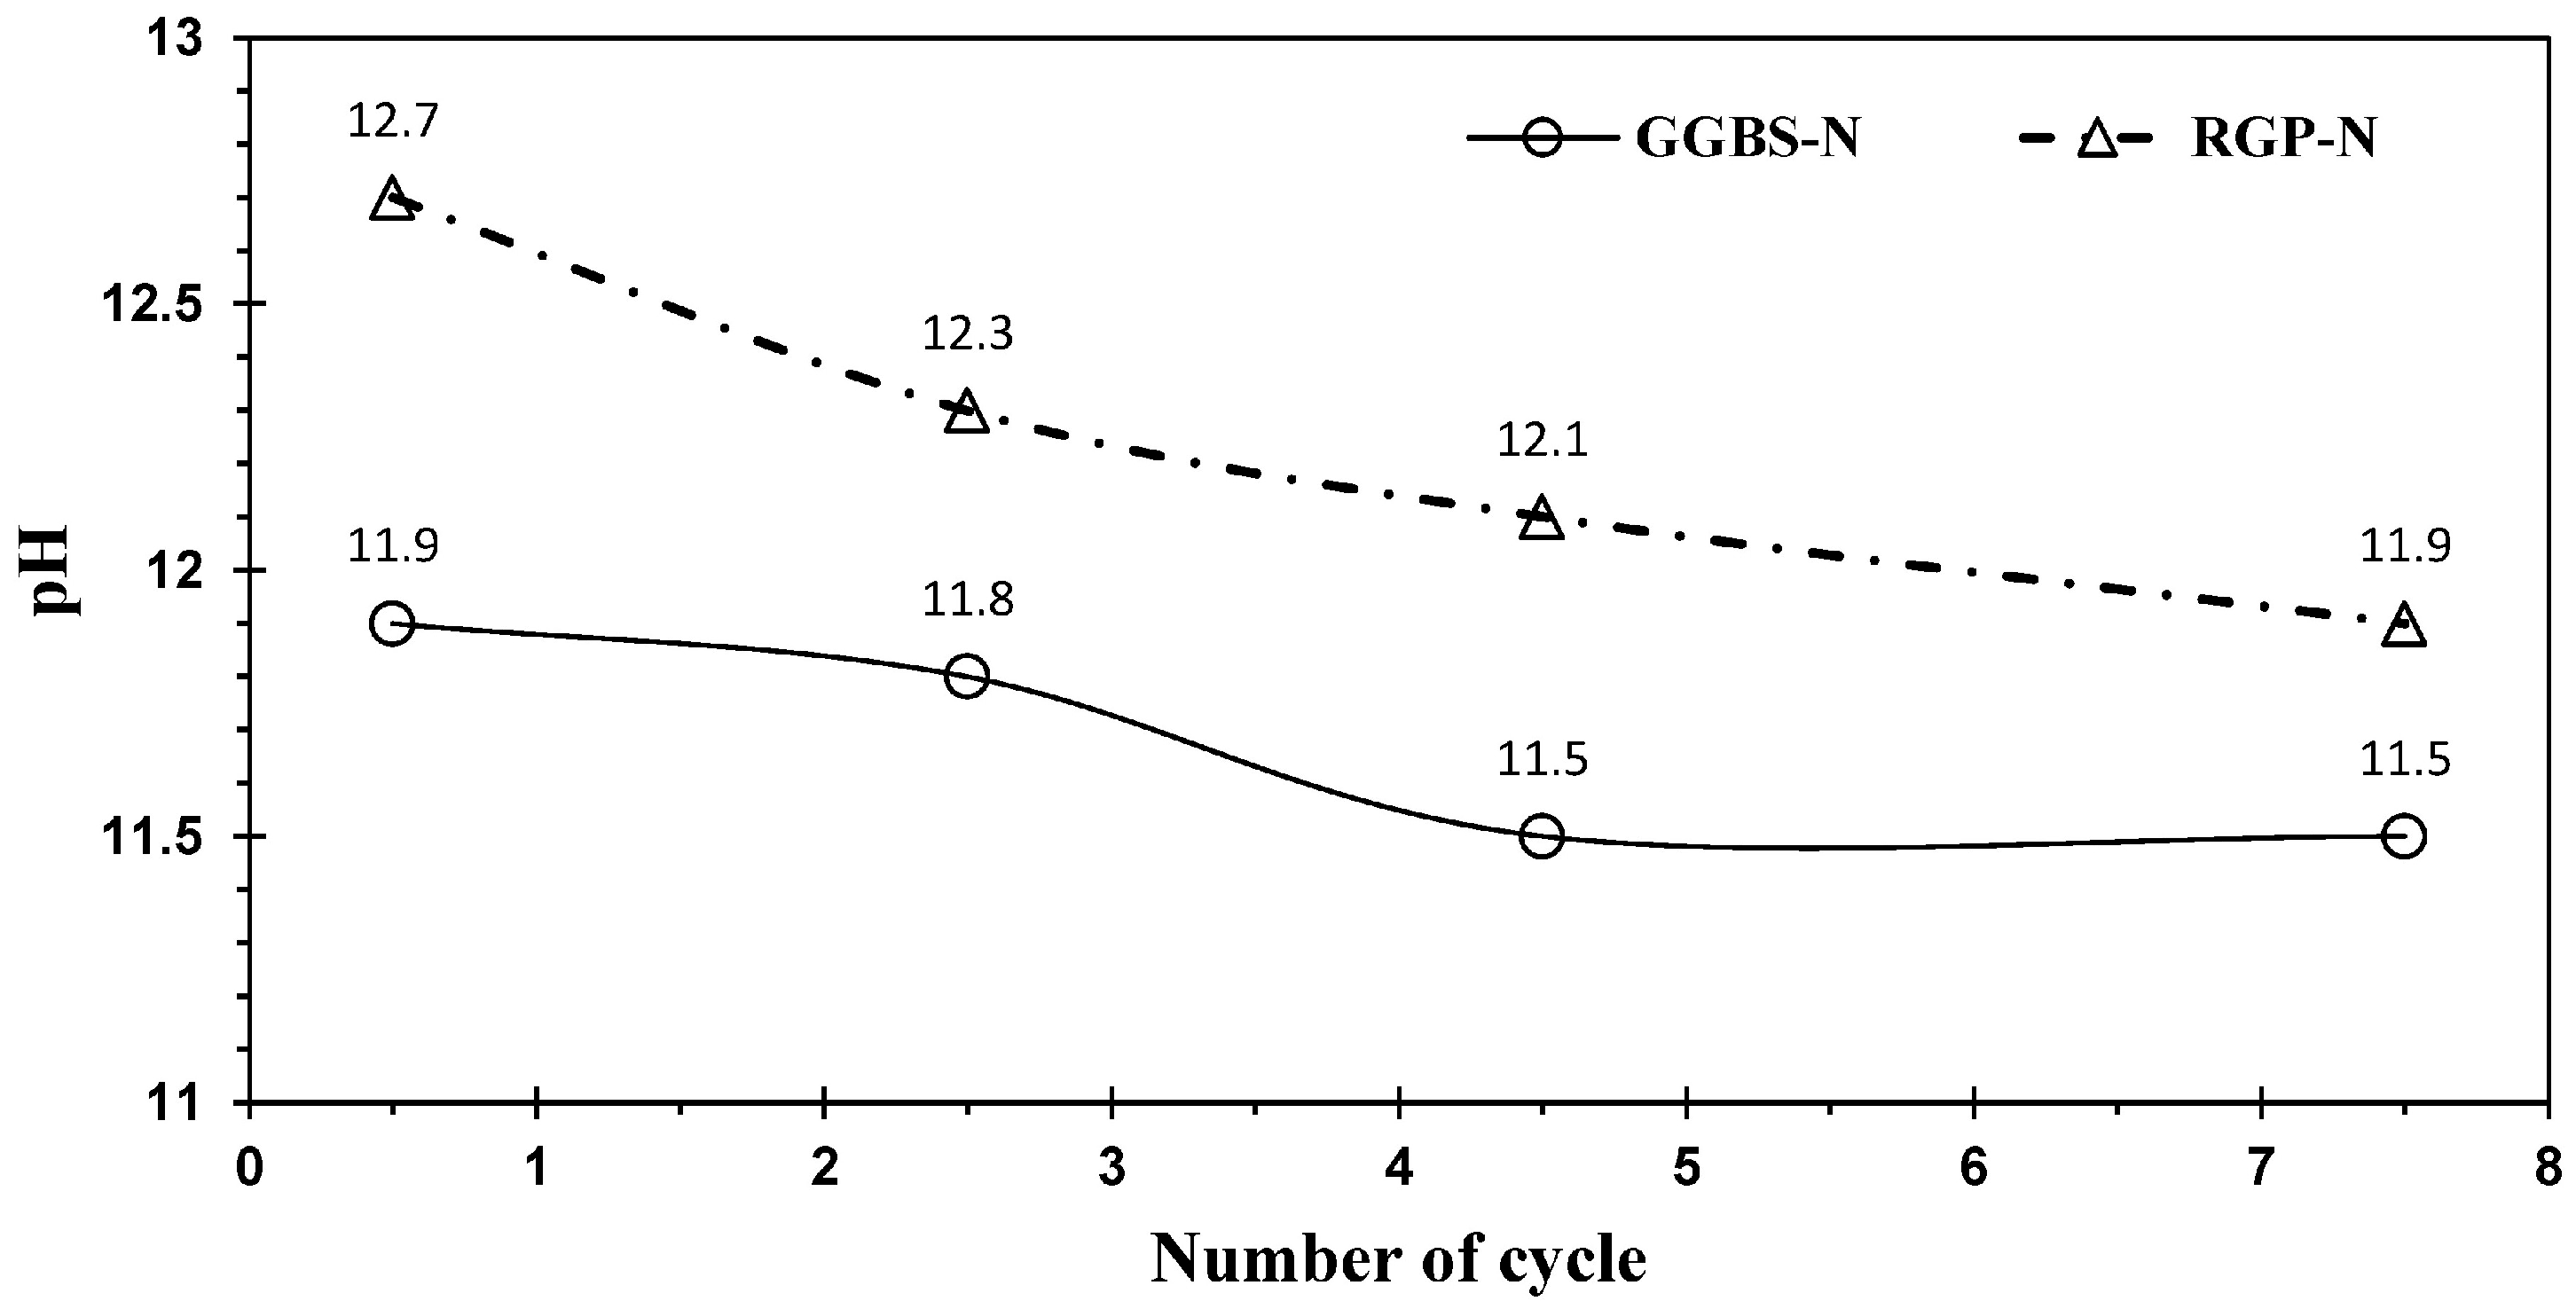
3.3.2. Leaching and pH Test Results

As outlined in Table 4, the highest concentration of leached metal ions is associated with Na+ ions, which result from NaOH dissolution. Potassium ions (K+) were also identified in the immersed solution, even though no potassium-based activator was employed in the study. The occurrence of K+ ions in the solution can be linked to the presence of K2O in GGBS and RGP. Additionally, the release of Si4+ and Al3+ from the treated samples is described in Table 4. Notably, a greater quantity of Si4+ was released from RGP-N samples due to the higher Si4+ concentration (73.77%) in RGP relative to GGBS. The significant leaching of Si4+ is likely influenced by the hydrophilic nature of silica in the RGP-N composite.
Furthermore, as indicated in Table 4, the release of Al3+ and Ca2+ from GPC showed minimal variation across the different mixtures. It is crucial to highlight that silicon and aluminum cations play a dominant role in the N-A-S (H) and C-A-S-H polymer networks, which are formed through the geopolymerization process. However, their leaching presents a challenge to the long-term stability of the geopolymer colloid in aqueous environments. [57].
A TCLP test was performed on the stabilized samples and cured for 45 days, according to USEPA Method 1311, listed in Table 5; the levels of arsenic (As), bismuth (Bi), cadmium (Cd), chromium (Cr), copper (Cu), nickel (Ni), lead (Pb), selenium (Se) and zinc (Zn) were also examined. Levels of leached heavy metals in the stabilized samples following TCLP tests were found to be well below Environmental Protection Agency (EPA)-regulated ranges, indicating no threat to the environment [58,59].
The pH measurements provide insights into the potential impact of soil stabilization on groundwater quality. Elevated pH levels in leachates may indicate the release of alkaline constituents, which can pose risks to aquatic ecosystems and soil biota if not managed properly. In this study, pH values of the leachate were monitored using a pH meter during the first, third, fifth, and eighth wetting–drying (W–D) cycles to assess temporal changes. The observed decrease in pH over time, as shown in Figure 8, is likely attributable to the gradual dissolution and depletion of residual NaOH in the mixture. As W–D cycles progressed, hydroxide (OH) and sodium (Na+) ions were increasingly consumed in ongoing geopolymerization reactions. However, the primary mechanism behind the pH reduction under W–D conditions appears to be the leaching of geopolymer matrix components. Although the initial pH values were high, which can accelerate the degradation of surrounding ecosystems, the declining trend suggests a stabilization process. Comparing these two samples shows that “RGP-N” has a higher pH value than “GGBS-N” due to the more leached alkali metals (Na+). Nevertheless, the pH in both mixtures converges in the 8th cycle, indicating long-term stability of the soil with geopolymers [60,61]. Nonetheless, to mitigate potential environmental hazards associated with high leachate pH, strategies such as pre-conditioning of stabilized materials, optimization of alkali content, or inclusion of buffering agents should be considered in future applications.

3.3.3. The Effects of W–D Cycles on Stress–Strain Behavior

Figure 9 shows the stress–strain diagram for the 45-day cured, stabilized soil samples subjected to wet–dry cycles. Axial stress is the internal force per unit area that develops within a material when a load is applied along its longitudinal axis. It is calculated by dividing the applied axial load by the cross-sectional area of the specimen. In UCS testing, axial stress increases as the specimen is compressed until failure, and the peak axial stress represents the UCS value. Axial stress is a key parameter for understanding the deformation and strength behavior of geomaterials under loading conditions [62]. The analysis of Figure 9b shows a clear decrease in the area under the curves for RGP-N samples, which indicates a reduction in the absorbed energy as the number of wet–dry (W–D) cycles increases. Furthermore, as the number of cycles increased, the peak stress values shifted to the right, leading to a corresponding increase in the failure strain of both groups. As shown in Figure 9a, the brittle behavior of the samples changed to ductile behavior after the W–D cycle (C4, C8). This change could be due to the increase in voids caused by an increase in the number of cycles, which in turn led to an increase in the failure strain. It is worth noting that the variation in ductility during the W–D cycle test was more pronounced in the RGP-N samples, as illustrated in Figure 9b [63].

4. FE-SEM and EDX Analysis

Microstructural analysis of selected samples of RGP-N and GGBS-N was carried out at 5000× magnification. The FE-SEM images for 45-day stabilized samples before and after wet–dry cycles are shown in Figure 10a,b. After the UCS test, images were taken of the fracture surface of all samples. FE-SEM images show the formation of geopolymer gel in the stabilized samples. Furthermore, the analysis of the images in Figure 10a shows that the stabilized samples are denser and have a more homogeneous structure with lower porosity due to the increasing number of cycles. As shown in Figure 10a, nanoparticles contribute to the formation of the geopolymer product (C(N)-A-S-H), which leads to the formation of a thick layer on the surface of the soil particles, which plays an effective role in the durability of the samples. The improvement in UCS can be primarily attributed to the formation of a compact and cohesive binder matrix dominated by C(N)-A-S-H gel, which arises from the interaction between calcium-bearing components (GGBS) and sodium-based alkaline activators. This sodium-induced variant of the traditional C-A-S-H gel contributes significantly to early strength development and pore refinement. Similar observations have been reported in sodium-activated systems using supplementary cementitious or agricultural waste materials [64,65]. Given the high calcium content of the GGBS precursor and the aluminosilicate-rich nature of the binder system, the formation of sodium-modified calcium–aluminosilicate–hydrate (C(N)-A-S-H) gels is likely. This interpretation aligns with findings from similar alkali-activated systems with comparable chemical compositions [51,66,67]. Although direct identification techniques such as XRD or FTIR were not employed in this study, the observed improvements in strength, durability, and the dense morphology in FE-SEM images are consistent with the formation of C(N)-A-S-H gels reported in similar geopolymer systems [51,66,67]. On the other hand, the RGP-N samples lose their homogeneous structure after being exposed to W–D test conditions, as shown in Figure 10b.
Figure 11a,b illustrate the Energy Dispersive X-ray (EDX) results, showing that the predominant elements in the geopolymer samples were silicon (Si), aluminum (Al), sodium (Na), oxygen (O), and carbon (C). It is worth noting that EDX is less sensitive to light elements such as sodium (Na) due to detector limitations. Therefore, in this study, EDX results are primarily used to assess the presence and distribution of mid- to heavy-weight elements (e.g., Si, Al, Ca, Fe) in the geopolymer matrix. The quantification of lighter elements, particularly Na+, was carried out using ICP-OES to ensure more accurate and reliable results. The ratios of silicon to aluminum (Si/Al) and sodium to aluminum (Na/Al) play a crucial role in determining the strength and permeability of the geopolymer samples [68]. In a previous investigation using an alkali leaching test, it was found that molar ratios of 3.5–4 for silicon to aluminum showed the highest compressive strength. This finding indicates that these particular molar ratios are the most efficient in improving the strength of the material [69]. The increase in Si/Al value from 3.27 to 3.97 in Figure 11a before and after W–D cycles is a sign of the continuation of the geopolymerization process during the test in GGBS-N samples, and a decrease in the Si/Al ratio from 3.29 to 1.46 and 0 is an indication of weakening of mechanical properties of RGP-N samples, as shown in Figure 11b. Furthermore, a decrease in the Na/Al value from 3.29 to 1.46 in Figure 11b shows a deterioration in UCS values from cycle zero to eight. The influence of the Si/Al and Na/Al molar ratios on UCS of 45-day cured samples before and after W–D cycles is summarized in Table 6, highlighting the chemical differences between GGBS-N and RGP-N mixtures and their effect on UCS performance.

5. Conclusions

This research investigated and compared the effect of nanoparticles, particularly nanoaluminosilicate, on the compressive strength of sandy soil stabilized by geopolymers such as RGP and GGBS. In addition, the durability of treated soils was investigated under wet–dry cycle conditions. The following results emerge from the present study:
  • Following saturation for 48 h, nearly all analyzed specimens showed a decline in strength as a result of saturation. However, they exhibited satisfactory stability and strength in contrast to unstabilized soil, which broke down after 5 h of saturation. Regarding the compressive strength of sample GGBS-N, it was observed that after 48 h of saturation, the UCS increased by 20%. This resulted from the ongoing chemical reactions following the seven-day curing, which resulted in the increased strength.
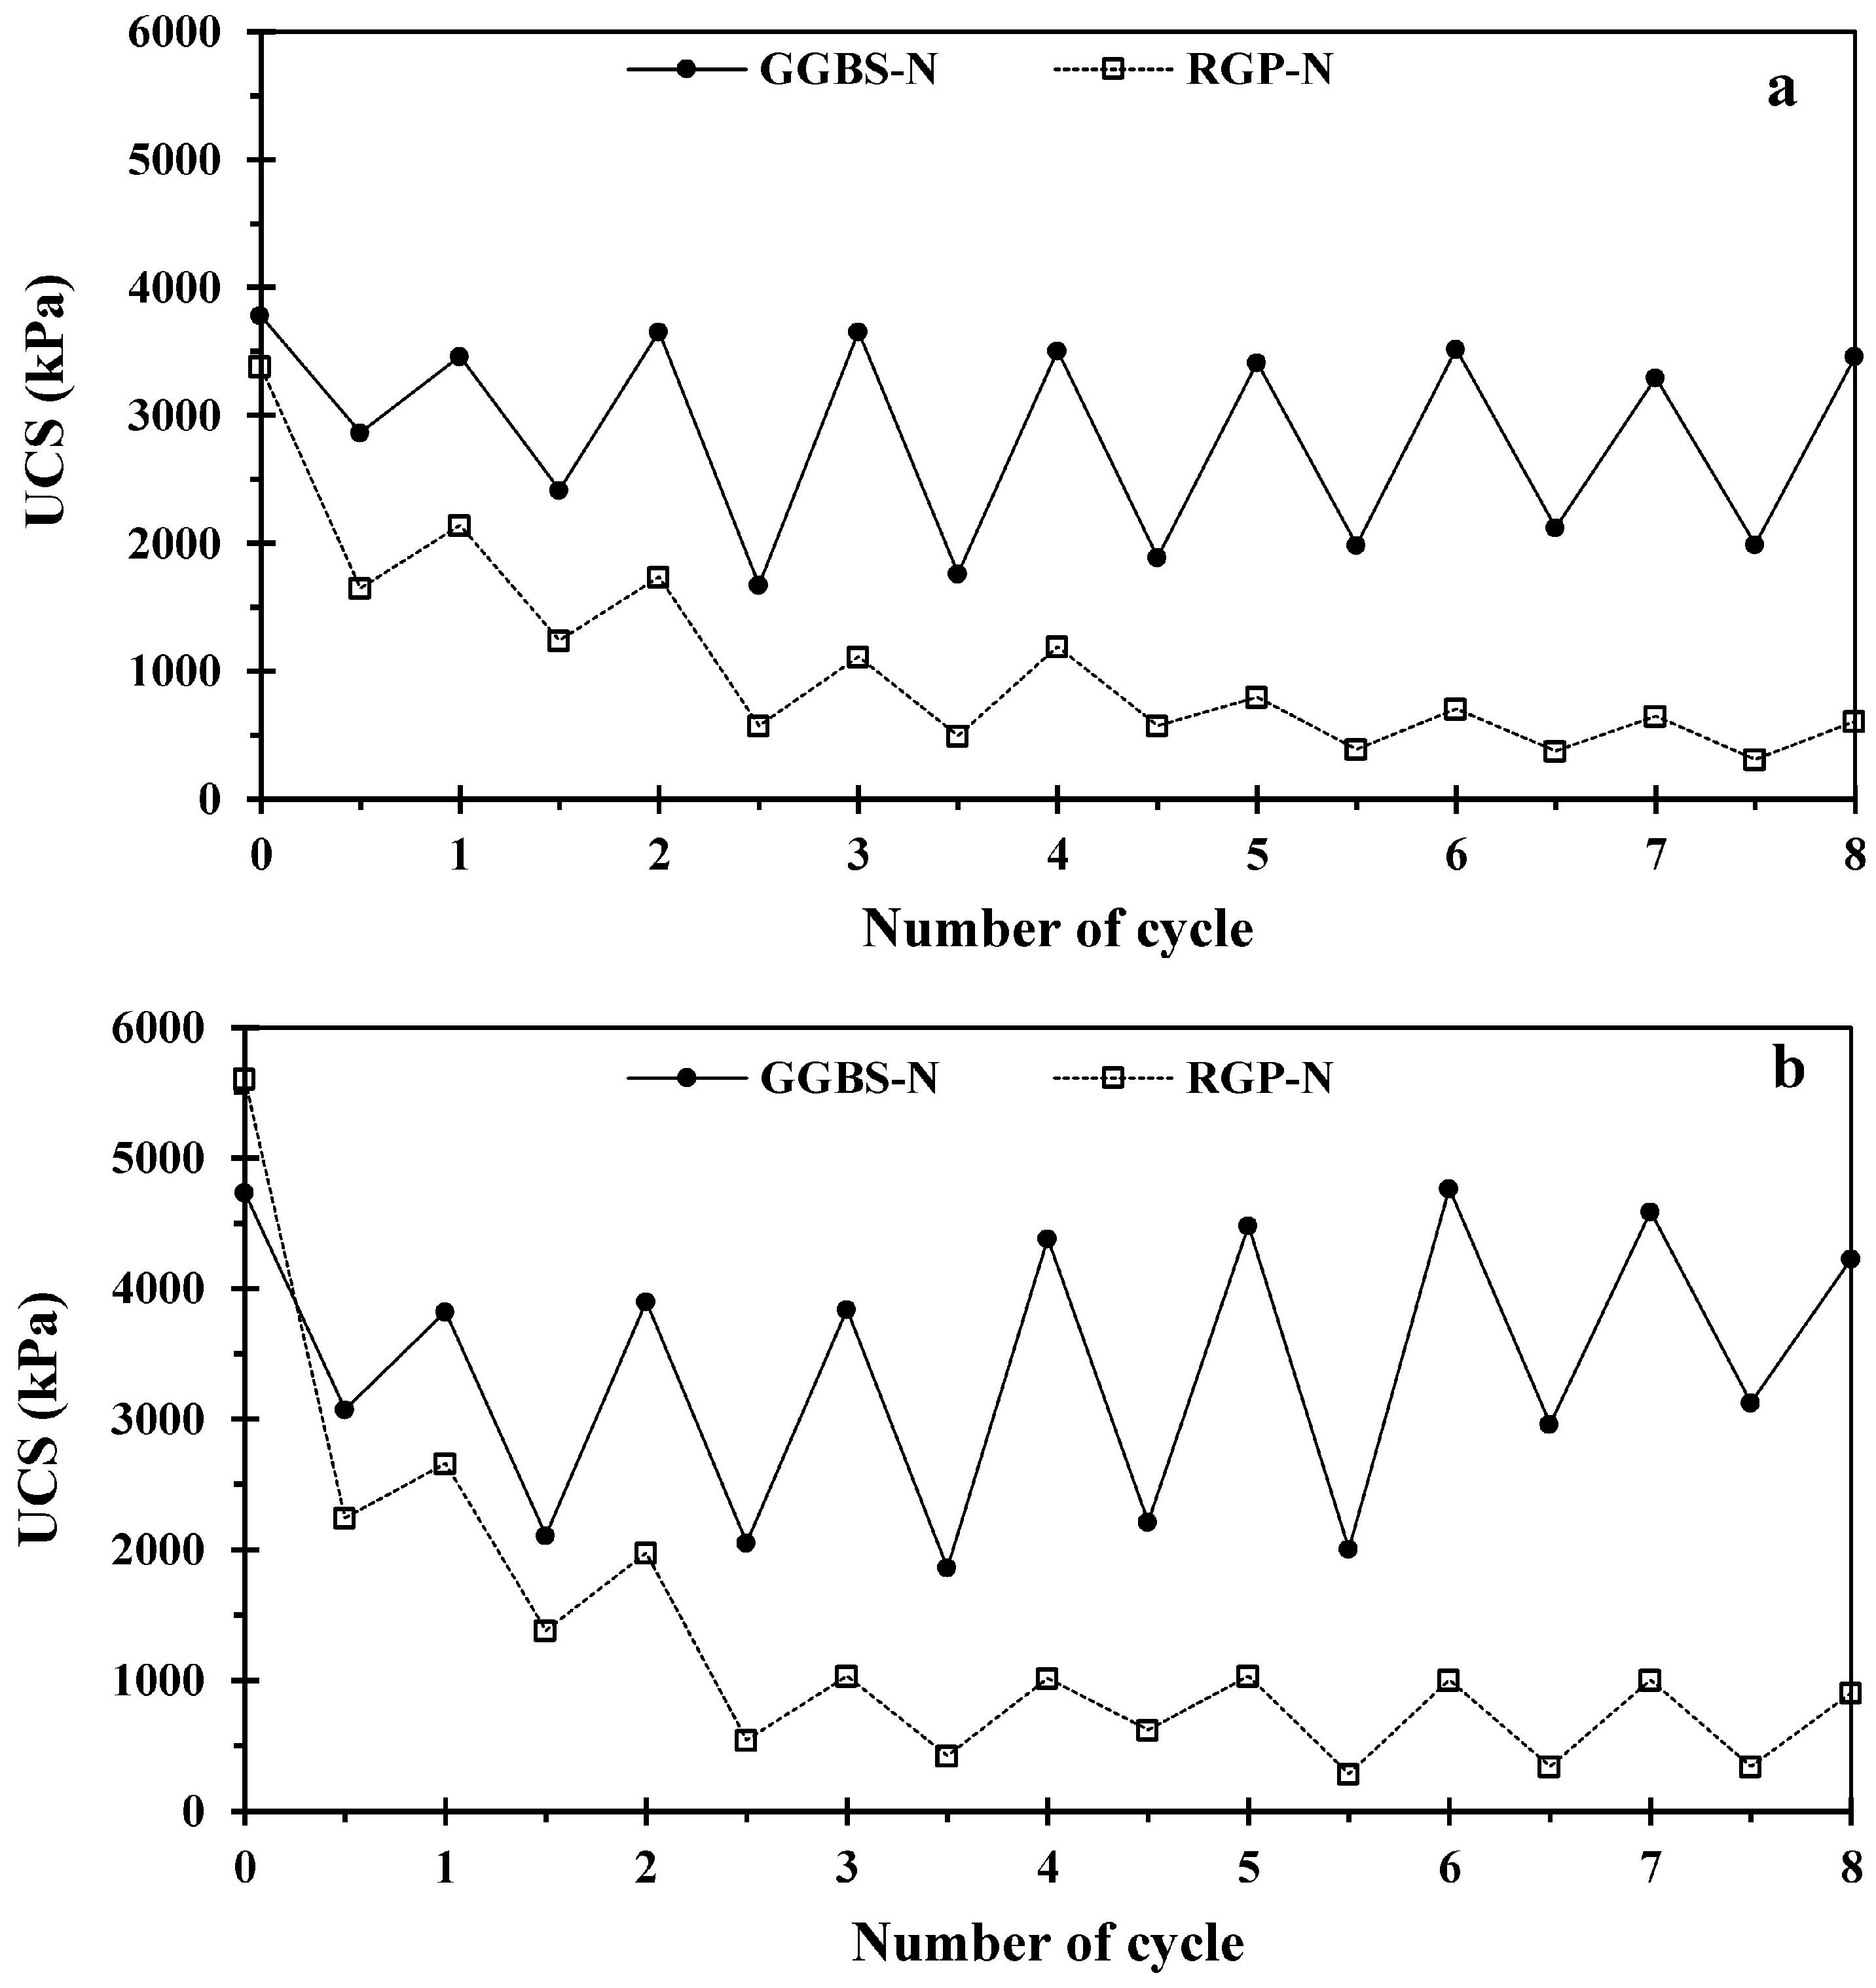
  • The UCS of 14- and 45-day cured samples during W–D cycles illustrated the considerable drop after cycle one for RGP-based samples and remained constant after cycle three to the end (eighth cycle). However, the GGBS-based samples retained their initial strength even after 8 days of W–D cycles. Furthermore, the absorbed energy and elongation at break are inversely and directly related to the increase in cycle number in both group samples.
  • The results of the durability test were indicated by the mass loss of the samples. For GGBS-N and RGP-N samples, a significant reduction in mass loss of 7% and 10%, respectively, was measured after cycle two, which was related to the leaching of the geopolymerization products after the W–D cycles.
  • Leaching and pH tests indicated that the toxicity of all leached solutions was below the permissible limit. However, the high pH of the leached solution can pose a problem for the environment.
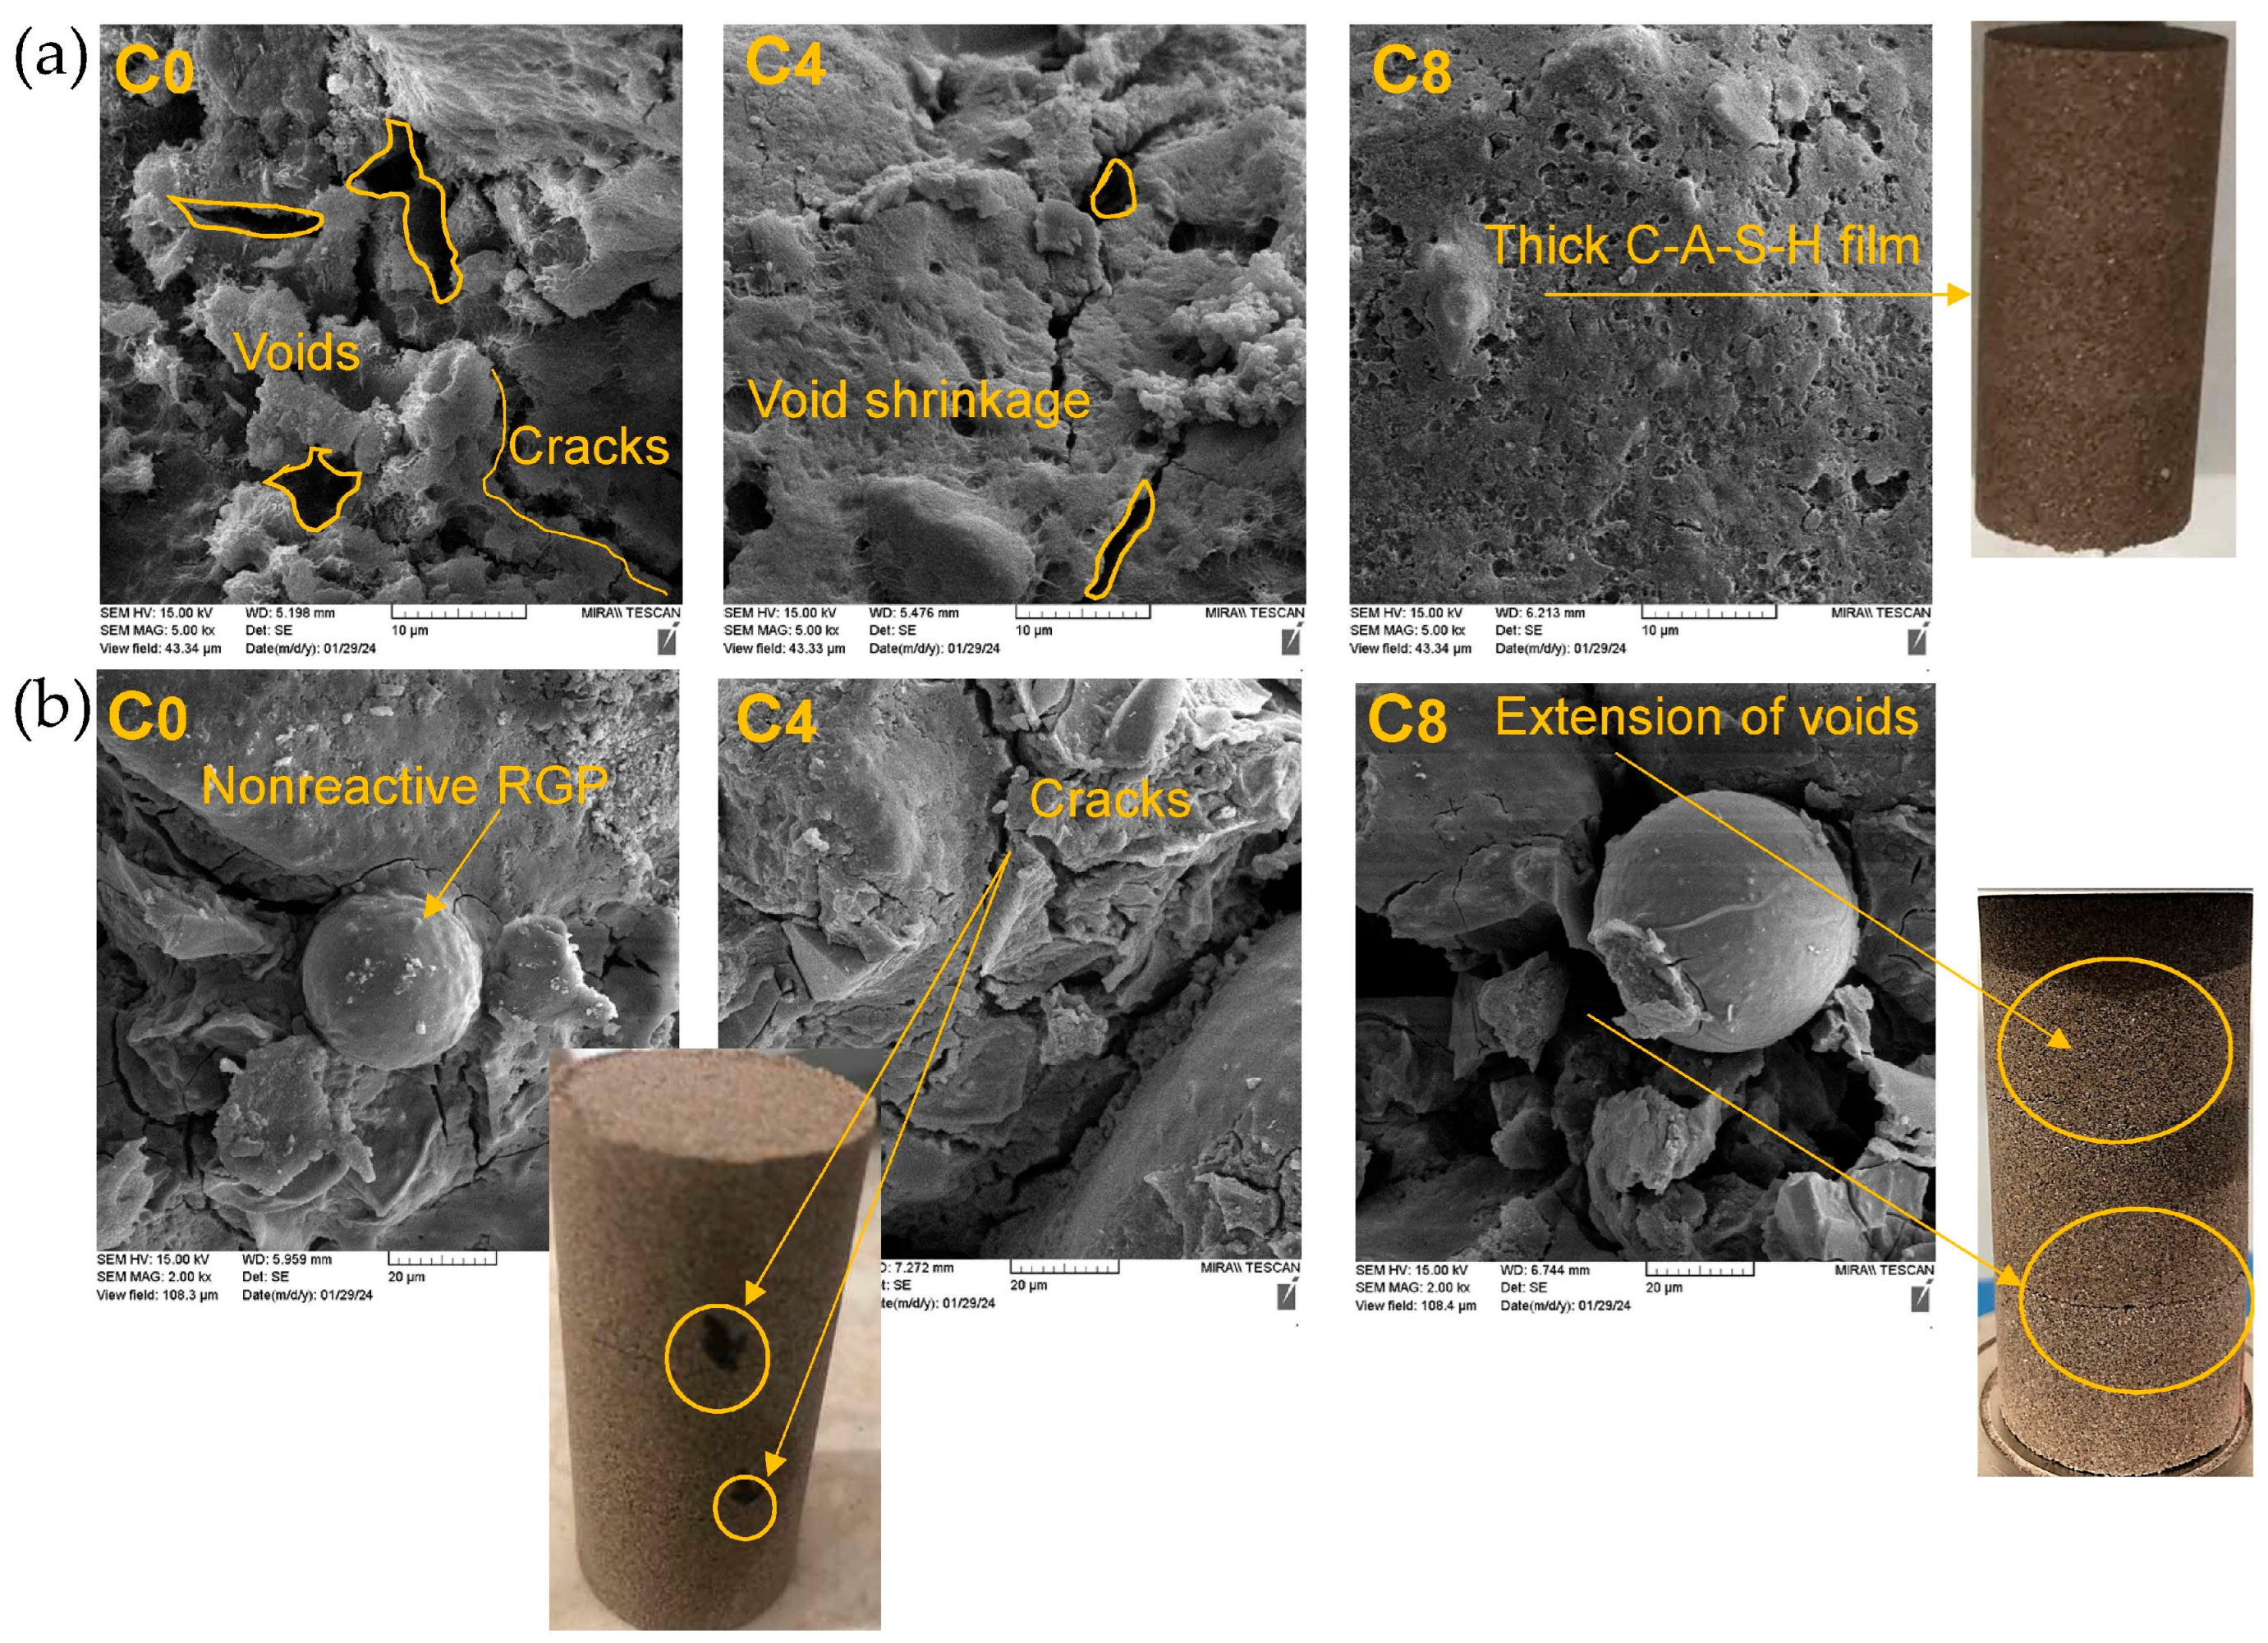
  • SEM and EDS analysis showed that as the number of W–D cycles increased, the number of cracks and voids increased in RGP-N samples, which was reversed in GGBS-N samples.
  • From the UCS and mass loss results, “GGBS-N” can be selected as a suitable blend for durability to W–D cycles. Ultimately, stabilizing silty sand with GGBS-based geopolymer is a suitable and durable method for geotechnical applications in harsh climates.
  • The improvement in the mechanical performance of the stabilized soil, particularly UCS, can be attributed to the formation of geopolymer gels resulting from the alkali activation of aluminosilicate precursors. This process involves the dissolution of reactive silica and alumina species, followed by polycondensation reactions that generate a binding matrix, predominantly in the form of C(N)-A-S-H gels in sodium-activated, calcium-rich (GGBS) systems. These gels create a dense microstructure that enhances particle bonding, reduces porosity, and increases load-bearing capacity. In addition to strength gains, the formation of geopolymer gels may also contribute to improved soil durability, moisture resistance, and overall stability, highlighting their potential for sustainable soil improvement applications.
The results of this study have the potential to benefit the building, geotechnical, and construction industries by offering eco-friendlier strategies for stabilizing soils and enhancing their strength and durability in response to varying climatic conditions.

Author Contributions

Conceptualization, M.H.B. and E.Y.; Methodology, E.Y.; Formal analysis, M.J.K. and E.Y.; Investigation, M.J.K.; Resources, M.H.B.; Writing—original draft, M.J.K.; Writing—review & editing, M.H.B. and E.Y.; Visualization, M.J.K.; Supervision, M.H.B. and E.Y. All authors have read and agreed to the published version of the manuscript.

Funding

This research received no external funding.

Data Availability Statement

The original contributions presented in this study are included in the article. Further inquiries can be directed to the corresponding author.

Conflicts of Interest

The authors declare no conflicts of interest.

References

  1. Namjoo, A.M.; Toufigh, M.M.; Toufigh, V. Experimental Investigation of Interface Behaviour between Different Types of Sand and Carbon Fibre Polymer. Eur. J. Environ. Civ. Eng. 2021, 25, 2317–2336. [Google Scholar] [CrossRef]
  2. Al-Taie, A.; Yaghoubi, E.; Wasantha, P.L.P.; Van Staden, R.; Guerrieri, M.; Fragomeni, S. Mechanical and Physical Properties and Cyclic Swell-Shrink Behaviour of Expansive Clay Improved by Recycled Glass. Int. J. Pavement Eng. 2023, 24, 2204436. [Google Scholar] [CrossRef]
  3. Yaghoubi, E.; Azadegan, O.; Li, J. Effect of Surface Layer Thickness on the Performance of Lime and Cement Treated Aggregate Surfaced Roads. Electron. J. Geotech. Eng. 2013, 18 F, 1081–1094. [Google Scholar]
  4. Abushama, W.J.; Tamimi, A.K.; Tabsh, S.W.; El-Emam, M.M.; Ibrahim, A.; Mohammed Ali, T.K. Influence of Optimum Particle Packing on the Macro and Micro Properties of Sustainable Concrete. Sustainability 2023, 15, 14331. [Google Scholar] [CrossRef]
  5. Pourabbas Bilondi, M.; Toufigh, M.M.; Toufigh, V. Experimental Investigation of Using a Recycled Glass Powder-Based Geopolymer to Improve the Mechanical Behavior of Clay Soils. Constr. Build. Mater. 2018, 170, 302–313. [Google Scholar] [CrossRef]
  6. Hossain, S.S.; Akhtar, F. Recent Progress of Geopolymers for Carbon Dioxide Capture, Storage and Conversion. J. CO2 Util. 2023, 78, 102631. [Google Scholar] [CrossRef]
  7. Singh, N.B.; Middendorf, B. Geopolymers as an Alternative to Portland Cement: An Overview. Constr. Build. Mater. 2020, 237, 117455. [Google Scholar] [CrossRef]
  8. Nabizadeh Mashizi, M.; Bagheripour, M.H.; Jafari, M.M.; Yaghoubi, E. Mechanical and Microstructural Properties of a Stabilized Sand Using Geopolymer Made of Wastes and a Natural Pozzolan. Sustainability 2023, 15, 2966. [Google Scholar] [CrossRef]
  9. Bhojaraju, C.; Mousavi, S.S.; Brial, V.; DiMare, M.; Ouellet-Plamondon, C.M. Fresh and Hardened Properties of GGBS-Contained Cementitious Composites Using Graphene and Graphene Oxide. Constr. Build. Mater. 2021, 300, 123902. [Google Scholar] [CrossRef]
  10. Mousavi, S.S.; Mousavi Ajarostaghi, S.S.; Bhojaraju, C. A Critical Review of the Effect of Concrete Composition on Rebar–Concrete Interface (RCI) Bond Strength: A Case Study of Nanoparticles. SN Appl. Sci. 2020, 2, 893. [Google Scholar] [CrossRef]
  11. Díaz-López, J.L.; Cabrera, M.; Agrela, F.; Rosales, J. Geotechnical and Engineering Properties of Expansive Clayey Soil Stabilized with Biomass Ash and Nanomaterials for Its Application in Structural Road Layers. Geomech. Energy Environ. 2023, 36, 100496. [Google Scholar] [CrossRef]
  12. Tong, T.; Fan, Z.; Liu, Q.; Wang, S.; Tan, S.; Yu, Q. Investigation of the Effects of Graphene and Graphene Oxide Nanoplatelets on the Micro- and Macro-Properties of Cementitious Materials. Constr. Build. Mater. 2016, 106, 102–114. [Google Scholar] [CrossRef]
  13. Ghazizadeh, S.; Duffour, P.; Skipper, N.T.; Bai, Y. Understanding the Behaviour of Graphene Oxide in Portland Cement Paste. Cem. Concr. Res. 2018, 111, 169–182. [Google Scholar] [CrossRef]
  14. Devi, S.C.; Khan, R.A. Effect of Graphene Oxide on Mechanical and Durability Performance of Concrete. J. Build. Eng. 2020, 27, 101007. [Google Scholar] [CrossRef]
  15. Gholampour, A.; Valizadeh Kiamahalleh, M.; Tran, D.N.H.; Ozbakkaloglu, T.; Losic, D. From Graphene Oxide to Reduced Graphene Oxide: Impact on the Physiochemical and Mechanical Properties of Graphene-Cement Composites. ACS Appl. Mater. Interfaces 2017, 9, 43275–43286. [Google Scholar] [CrossRef]
  16. Indumathi, P.; Shabhudeen, S.P.; Saraswathy, C.P. Synthesis and Characterization of Nano Silica from the Pods of Delonix Regia Ash. Int. J. Adv. Eng. Technol. 2011, 264–265, 1370–1375. [Google Scholar]
  17. Qing, Y.; Zenan, Z.; Deyu, K.; Rongshen, C. Influence of Nano-SiO2 Addition on Properties of Hardened Cement Paste as Compared with Silica Fume. Constr. Build. Mater. 2007, 21, 539–545. [Google Scholar] [CrossRef]
  18. Nazari, A.; Riahi, S. Improvement Compressive Strength of Concrete in Different Curing Media by Al2O3 Nanoparticles. Mater. Sci. Eng. A 2011, 528, 1183–1191. [Google Scholar] [CrossRef]
  19. Hosseini, P.; Hosseinpourpia, R.; Pajum, A.; Khodavirdi, M.M.; Izadi, H.; Vaezi, A. Effect of Nano-Particles and Aminosilane Interaction on the Performances of Cement-Based Composites: An Experimental Study. Constr. Build. Mater. 2014, 66, 113–124. [Google Scholar] [CrossRef]
  20. Wongkornchaowalit, N.; Lertchirakarn, V. Setting Time and Flowability of Accelerated Portland Cement Mixed with Polycarboxylate Superplasticizer. J. Endod. 2011, 37, 387–389. [Google Scholar] [CrossRef] [PubMed]
  21. Kong, X.; Zhang, Y.; Hou, S. Study on the Rheological Properties of Portland Cement Pastes with Polycarboxylate Superplasticizers. Rheol. Acta 2013, 52, 707–718. [Google Scholar] [CrossRef]
  22. Meng, T.; Yu, Y.; Qian, X.; Zhan, S.; Qian, K. Effect of Nano-TiO 2 on the Mechanical Properties of Cement Mortar. Constr. Build. Mater. 2012, 29, 241–245. [Google Scholar] [CrossRef]
  23. Morsy, M.S.; Alsayed, S.H.; Aqel, M. Hybrid Effect of Carbon Nanotube and Nano-Clay on Physico-Mechanical Properties of Cement Mortar. Constr. Build. Mater. 2011, 25, 145–149. [Google Scholar] [CrossRef]
  24. Al-Taie, A.; Yaghoubi, E.; Tahmoorian, F.; Li, J.; Ahmed, B.A. Pavement Performance over Deep Trenches Backfilled with Recycled Aggregates under Different Compaction Efforts. Can. Geotech. J. 2024, 62, 1–26. [Google Scholar] [CrossRef]
  25. Perera, S.T.A.M.; Saberian, M.; Zhu, J.; Roychand, R.; Li, J. Effect of Crushed Glass on the Mechanical and Microstructural Behavior of Highly Expansive Clay Subgrade. Case Stud. Constr. Mater. 2022, 17, e01244. [Google Scholar] [CrossRef]
  26. Luhar, S.; Cheng, T.-W.; Nicolaides, D.; Luhar, I.; Panias, D.; Sakkas, K. Valorisation of Glass Wastes for the Development of Geopolymer Composites–Durability, Thermal and Microstructural Properties: A Review. Constr. Build. Mater. 2019, 222, 673–687. [Google Scholar] [CrossRef]
  27. Manikandan, P.; Vasugi, V. Potential Utilization of Waste Glass Powder as a Precursor Material in Synthesizing Ecofriendly Ternary Blended Geopolymer Matrix. J. Clean. Prod. 2022, 355, 131860. [Google Scholar] [CrossRef]
  28. Pascual, A.B.; Tognonvi, M.T.; Tagnit-Hamou, A. Waste Glass Powder-Based Alkali-Activated Mortar. Int. J. Res. Eng. Technol 2014, 3, 32–36. [Google Scholar]
  29. Çelik, A.İ.; Tunç, U.; Bahrami, A.; Karalar, M.; Mydin, M.A.O.; Alomayri, T.; Özkılıç, Y.O. Use of Waste Glass Powder toward More Sustainable Geopolymer Concrete. J. Mater. Res. Technol. 2023, 24, 8533–8546. [Google Scholar] [CrossRef]
  30. Vafaei, M.; Allahverdi, A. High Strength Geopolymer Binder Based on Waste-Glass Powder. Adv. Powder Technol. 2017, 28, 215–222. [Google Scholar] [CrossRef]
  31. Cyr, M.; Idir, R.; Poinot, T. Properties of Inorganic Polymer (Geopolymer) Mortars Made of Glass Cullet. J. Mater. Sci. 2012, 47, 2782–2797. [Google Scholar] [CrossRef]
  32. Noolu, V.; Mallikarjuna Rao, G.; Sudheer Kumar Reddy, B.; Chavali, R.V.P. Strength and Durability Characteristics of GGBS Geopolymer Stabilized Black Cotton Soil. Mater. Today Proc. 2020, 43, 2373–2376. [Google Scholar] [CrossRef]
  33. AASHTO-T307; Standard Method of Test for Determining the Resilient Modulus of Soils and Aggregate Materials. American Association of State Highway and Transportation Officials: Washington, DC, USA, 2007.
  34. Horpibulsuk, S.; Suksiripattanapong, C.; Samingthong, W.; Rachan, R.; Arulrajah, A. Durability against Wetting–Drying Cycles of Water Treatment Sludge–Fly Ash Geopolymer and Water Treatment Sludge–Cement and Silty Clay–Cement Systems. J. Mater. Civ. Eng. 2016, 28, 4015078. [Google Scholar] [CrossRef]
  35. Bin-Shafique, S.; Rahman, K.; Azfar, I. The Effect of Freezing-Thawing Cycles on Performance of Fly Ash Stabilized Expansive Soil Subbases. In Proceedings of the Geo-Frontiers 2011: Advances in Geotechnical Engineering, Dallas, TX, USA, 13–16 March 2011; pp. 697–706, ISBN 9780784411650. [Google Scholar]
  36. ASTM D422; Standard Test Method for Particle-Size Analysis of Soils. ASTM: West Conshohocken, PA, USA, 2007; pp. 1–8.
  37. ASTM D698-07; Standard Test Methods for Laboratory Compaction Characteristics of Soil Using Standard Effort. ASTM International: West Conshohocken, PA, USA, 2007; Volume 12, pp. 1–13.
  38. Zhang, M.; Guo, H.; El-Korchi, T.; Zhang, G.; Tao, M. Experimental Feasibility Study of Geopolymer as the Next-Generation Soil Stabilizer. Constr. Build. Mater. 2013, 47, 1468–1478. [Google Scholar] [CrossRef]
  39. ASTM D 854 D854; Standard Test Methods for Specific Gravity of Soil Solids by Water Pycnometer. ASTM International: West Conshohocken, PA, USA, 2010; Volume 2458000, pp. 1–7.
  40. Burciaga-Díaz, O.; Durón-Sifuentes, M.; Díaz-Guillén, J.A.; Escalante-García, J.I. Effect of Waste Glass Incorporation on the Properties of Geopolymers Formulated with Low Purity Metakaolin. Cem. Concr. Compos. 2020, 107, 103492. [Google Scholar] [CrossRef]
  41. Tripathi, A.K.; Das, S.K.; Mustakim, S.M.; Kandi, S.K.; Rajput, P. Integrated Management of Ferrochrome Slag: Metal Recovery, Cr (VI) Stabilization, and Sustainable Reuse in Construction Materials. J. Environ. Manag. 2025, 390, 126268. [Google Scholar] [CrossRef] [PubMed]
  42. Kampala, A.; Horpibulsuk, S.; Prongmanee, N.; Chinkulkijniwat, A. Influence of Wet-Dry Cycles on Compressive Strength of Calcium Carbide Residue–Fly Ash Stabilized Clay. J. Mater. Civ. Eng. 2014, 26, 633–643. [Google Scholar] [CrossRef]
  43. Jafari Kermanipour, M.; Bagheripour, M.H.; Yaghoubi, E. Mechanical and Microstructural Characterization of a Nano-Stabilized Sandy Soil. Geotech. Geol. Eng. 2024, 42, 6131–6146. [Google Scholar] [CrossRef]
  44. Rios, S.; Cristelo, N.; Viana da Fonseca, A.; Ferreira, C. Structural Performance of Alkali-Activated Soil Ash versus Soil Cement. J. Mater. Civ. Eng. 2016, 28, 4015125. [Google Scholar] [CrossRef]
  45. Ladd, R. Preparing Test Specimens Using Undercompaction. Geotech. Test. J. 1978, 1, 16–23. [Google Scholar] [CrossRef]
  46. ASTM D 2166; Standard Test Method for Unconfined Compressive Strength of Cohesive Soil. ASTM International: West Conshohocken, PA, USA, 2013; pp. 1–7.
  47. Blight, G.E. Unsaturated Soil Mechanics in Geotechnical Practice; CRC Press: Boca Raton, FL, USA, 2013; ISBN 1315882930. [Google Scholar]
  48. Head, K.H.; Epps, R. Manual of Soil Laboratory Testing; Pentech Press: London, UK, 1980; Volume 1. [Google Scholar]
  49. ASTM D559/D559M-15; Standard Test Methods for Wetting and Drying Compacted Soil-Cement Mixtures. ASTM International: West Conshohocken, PA, USA, 2015; pp. 1–6.
  50. Mohammadzadeh, M.A.; Toufigh, M.M.; Toufigh, V. Durability and Strength of Geopolymer with Recycled Glass Powder Base for Clay Stabilization. KSCE J. Civ. Eng. 2023, 27, 156–168. [Google Scholar] [CrossRef]
  51. Pasupathy, K.; Ramakrishnan, S.; Sanjayan, J. Effect of Hydrophobic Surface-Modified Fine Aggregates on Efflorescence Control in Geopolymer. Cem. Concr. Compos. 2022, 126, 104337. [Google Scholar] [CrossRef]
  52. Alyamani, A.; Lemine, O.M. FE-SEM Characterization of Some Nanomaterial. In Scanning Electron Microscopy; IntechOpen: London, UK, 2012; ISBN 9535100920. [Google Scholar]
  53. Garrido-García, L.F.; Pérez-Martínez, A.L.; Reyes-Gasga, J.; Aguilar-Del-Valle, M.d.P.; Wong, Y.H.; Rodríguez-Gómez, A. A Simple Methodology to Gain Insights into the Physical and Compositional Features of Ternary and Quaternary Compounds Based on the Weight Percentages of Their Constituent Elements: A Proof of Principle Using Conventional EDX Characterizations. Ceramics 2024, 7, 1275–1300. [Google Scholar] [CrossRef]
  54. Roshan, K.; Choobbasti, A.J.; Kutanaei, S.S. Evaluation of the Impact of Fiber Reinforcement on the Durability of Lignosulfonate Stabilized Clayey Sand under Wet-Dry Condition. Transp. Geotech. 2020, 23, 100359. [Google Scholar] [CrossRef]
  55. Abdila, S.R.; Abdullah, M.M.A.B.; Ahmad, R.; Rahim, S.Z.A.; Rychta, M.; Wnuk, I.; Nabiałek, M.; Muskalski, K.; Tahir, M.F.M. Syafwandi Evaluation on the Mechanical Properties of Ground Granulated Blast Slag (GGBS) and Fly Ash Stabilized Soil via Geopolymer Process. Materials 2021, 14, 2833. [Google Scholar] [CrossRef]
  56. Moazami, D.; Bilondi, M.P.; Rahnama, A.; Zaresefat, M.; Moretti, L. Recycled Glass Powder and Calcium Carbide Residue Geopolymer to Stabilise Silty Sand Soil: Mechanical Performances and Statistical Analysis. Heliyon 2025, 11, e41738. [Google Scholar] [CrossRef] [PubMed]
  57. Sun, Z.; Vollpracht, A. Leaching of Monolithic Geopolymer Mortars. Cem. Concr. Res. 2020, 136, 106161. [Google Scholar] [CrossRef]
  58. Xu, H.; Gong, W.; Syltebo, L.; Izzo, K.; Lutze, W.; Pegg, I.L. Effect of Blast Furnace Slag Grades on Fly Ash Based Geopolymer Waste Forms. Fuel 2014, 133, 332–340. [Google Scholar] [CrossRef]
  59. Tome, S.; Etoh, M.A.; Etame, J.; Sanjay, K. Characterization and Leachability Behaviour of Geopolymer Cement Synthesised from Municipal Solid Waste Incinerator Fly Ash and Volcanic Ash Blends. Recycling 2018, 3, 50. [Google Scholar] [CrossRef]
  60. Saride, S.; Puppala, A.J.; Chikyala, S.R. Swell-Shrink and Strength Behaviors of Lime and Cement Stabilized Expansive Organic Clays. Appl. Clay Sci. 2013, 85, 39–45. [Google Scholar] [CrossRef]
  61. Aldaood, A.; Bouasker, M.; Al-Mukhtar, M. Impact of Wetting-Drying Cycles on the Microstructure and Mechanical Properties of Lime-Stabilized Gypseous Soils. Eng. Geol. 2014, 174, 11–21. [Google Scholar] [CrossRef]
  62. Das, B.M.; Sobhan, K. Principles of Geotechnical Engineering; CL Engineering: Don Hua Lo, Thailand, 1990. [Google Scholar]
  63. Fakhrabadi, A.; Ghadakpour, M.; Choobbasti, A.J.; Kutanaei, S.S. Evaluating the Durability, Microstructure and Mechanical Properties of a Clayey-Sandy Soil Stabilized with Copper Slag-Based Geopolymer against Wetting-Drying Cycles. Bull. Eng. Geol. Environ. 2021, 80, 5031–5051. [Google Scholar] [CrossRef]
  64. Das, S.K.; Nayak, M.K.; Patro, S.K.; Suda, Y. Durability Properties of Ambient Cured Geopolymer Mortar Made from Rice Husk Ash–Based Alkali Activator: A Comparative Study with Conventional Alkali Activator. Adv. Civ. Eng. Mater. 2023, 12, 314–328. [Google Scholar] [CrossRef]
  65. Nguyễn, H.H.; Nguyễn, P.H.; Lương, Q.-H.; Meng, W.; Lee, B.Y. Mechanical and Autogenous Healing Properties of High-Strength and Ultra-Ductility Engineered Geopolymer Composites Reinforced by PE-PVA Hybrid Fibers. Cem. Concr. Compos. 2023, 142, 105155. [Google Scholar] [CrossRef]
  66. Furtos, G.; Prodan, D.; Sarosi, C.; Moldovan, M.; Łach, M.; Melnychuk, M.; Korniejenko, K. Advanced Geopolymer-Based Composites for Antimicrobial Application. Materials 2023, 16, 7414. [Google Scholar] [CrossRef] [PubMed]
  67. Barbarey, M.S.; Seleman, M.M.E.-S.; El Kheshen, A.A.; Zawrah, M. Processing and Characterization of Geopolymer Based on Ladle Furnace Slag and Fly Ash: The Impact of Chemical Composition on the Biodiesel Production. J. Pet. Min. Eng. 2024, 26, 54–63. [Google Scholar] [CrossRef]
  68. Lingyu, T.; Dongpo, H.; Jianing, Z.; Hongguang, W. Durability of Geopolymers and Geopolymer Concretes: A Review. Rev. Adv. Mater. Sci. 2021, 60, 1–14. [Google Scholar] [CrossRef]
  69. Dinh, H.L.; Liu, J.; Doh, J.H.; Ong, D.E.L. Influence of Si/Al Molar Ratio and ca Content on the Performance of Fly Ash-Based Geopolymer Incorporating Waste Glass and GGBFS. Constr. Build. Mater. 2024, 411, 134741. [Google Scholar] [CrossRef]
Figure 1. PSD of the soil, RGP, and GGBS used in this study.
Jcs 09 00397 g001
Figure 2. Schematic view of wet–dry conditions subjected to the building soil foundation.
Jcs 09 00397 g002
Figure 3. Wetting and drying test procedures.
Jcs 09 00397 g003
Figure 4. Comparison of UCS of seven-day cured samples with respect to two different moisture conditions.
Jcs 09 00397 g004
Figure 5. UCS development of two composites after various curing times.
Jcs 09 00397 g005
Figure 6. The impact of W–D cycles on the UCS of the two nano-stabilized samples (a) after 14 days of curing and (b) after 45 days of curing.
Jcs 09 00397 g006
Figure 7. Comparison of accumulated mass loss of all samples after every W–D cycle.
Jcs 09 00397 g007
Figure 8. Variations in pH values of samples cured for 45 days after undergoing W–D cycles.
Jcs 09 00397 g008
Figure 9. The influence of the number of W–D cycles on the stress–strain behavior of 45-day samples: (a) GGBS-N and (b) RGP-N.
Jcs 09 00397 g009
Figure 10. FE-SEM images of 45-day cured specimens after zero, four, and eight cycles: (a) GGBS-N and (b) RGP-N.
Jcs 09 00397 g010
Figure 11. EDX results of 45-day cured specimens after zero, four, and eight cycles: (a) GGBS-N and (b) RGP-N.
Jcs 09 00397 g011
Table 1. Classification and physical and compaction properties of the soil.
PropertyResult
Soil classification (USCS)Silty Sand (SM)
Coefficient of uniformity (Cu)9.262
Coefficient of curvature (Cc)1.939
OMC [37]13%
MDD [37]1.57 gr/cm3
Specific gravity (Gs) [39]2.64
Table 2. Oxide composition of the materials in %.
Component Oxides (%)GGBSRGP
SiO236.5073.77
Al2O313.041.91
Fe2O30.360.03
CaO38.948.87
MgO8.722.14
Na2O0.1111.55
K2O0.310.28
P2O50.110
SO31.760.78
TiO20.010
Mn2O30.320
LoI1.030.22
Table 3. Composition of the materials and composites used in this study.
Sample TypeWater Content (%)Sand (%)GGBS (%)RGP (%)Nanomaterials (%)Alkali Activator
(NaOH)
NS1310000013%
(7MOL)
GGBS13802000
RGP13800200
GGBS-N13801802
RGP-N13800182
Table 4. Leaching test results of 45-day cured samples after the first and eighth wetting (mg/L).
SamplesK+Na+Ca2+Si4+Al3+
C1C8C1C8C1C8C1C8C1C8
GGBS-N34.262.5528801750.470.1552.713.610.31<0.1
RGP-N26.144.3139024960.60.26226648.57.44<0.1
Table 5. TCLP test results of 45-day cured samples after the eighth wetting.
MetalGGBS-N (mg/L)RGP-N (mg/L)USEPA Limit (mg/L)
As1.070.935
Bi<0.05<0.05N/A
Cd<0.05<0.051
Cr<0.05<0.055
Cu0.12<0.05N/A
Ni<0.05<0.05N/A
Pb<0.05<0.055
Se0.050.07N/A
Zn<0.05<0.05100
N/A: not available.
Table 6. Molar ratios and UCS of 45-day cured GGBS-N and RGP-N mixes at C0 and C8 cycles.
Mix IDSi/AlNA/AlUCS (MPa)
C0C8C0C8C0C8
GGBS-N3.273.950.860.544.74.2
RGP-N7.27.333.2905.60.9
Disclaimer/Publisher’s Note: The statements, opinions and data contained in all publications are solely those of the individual author(s) and contributor(s) and not of MDPI and/or the editor(s). MDPI and/or the editor(s) disclaim responsibility for any injury to people or property resulting from any ideas, methods, instructions or products referred to in the content.

