Article

Three-Dimensional Distribution of Titanium Hydrides After Degradation of Magnesium/Titanium Hybrid Implant Material—A Study by X-Ray Diffraction Contrast Tomography

by
Vasil M. Garamus
1,*,
D. C. Florian Wieland
1,
Julian P. Moosmann
1,
Felix Beckmann
1,
Lars Lottermoser
1,
Maria Serdechnova
1,
Carsten Blawert
1,
Mohammad Fazel
1,2,
Eshwara P. S. Nidadavolu
1,
Wolfgang Limberg
1,
Thomas Ebel
1,
Rregine Willumeit-Römer
1 and
Berit Zeller-Plumhoff
1,3
1
Helmholtz-Zentrum Hereon, Max-Planck-Str. 1, 21502 Geesthacht, Germany
2
Institute for Metal and Composite Structures, Hamburg University of Technology, Denickestr. 17, 21073 Hamburg, Germany
3
Faculty Mechanical Engineering & Marine Technology, University of Rostock, Albert-Einstein-Straße 2, 18059 Rostock, Germany
*
Author to whom correspondence should be addressed.
J. Compos. Sci. 2025, 9(8), 396; https://doi.org/10.3390/jcs9080396
Submission received: 19 June 2025 / Revised: 20 July 2025 / Accepted: 23 July 2025 / Published: 26 July 2025

Abstract

Hybrid implants composed of magnesium and titanium are a promising direction in orthopaedics, as these implants combine the stability of titanium with the biological activity of magnesium. These partly soluble implants require careful investigation, as the degradation of magnesium releases hydrogen, which can enter the Ti matrix and thus alter the mechanical properties. To investigate this scenario and quantify the hydrogen uptake along with its structural impacts, we employed inert gas fusion, scanning electron microscopy, X-ray diffraction, and a combination of synchrotron absorption and X-ray diffraction tomography. These techniques enabled us to investigate the concentration and distribution of hydrogen and the formation of hydrides in the samples. Titanium hydride formation was observed in a region approximately 120 µm away from the titanium surface and correlates with the amount of absorbed hydrogen. We speculate that the degradation of magnesium at the magnesium/titanium implant interface leads to the penetration of hydrogen due to a combination of electrochemical and gaseous charging.

1. Introduction

Titanium (Ti) and magnesium (Mg) are well-known metallic implant materials [1] with a wide application range. Titanium is almost the gold standard of permanent implants with predictable behaviour. Due to their high strength, low density, high corrosion resistance, and biocompatibility, titanium and titanium alloys are used in hip and wrist surgery and as bone fixation materials [2]. Magnesium shows high potential as a temporary implant material with bone growth stimulation and antibacterial abilities, which require tailoring of the degradation rate of magnesium [3].
Besides the visible advantages of Ti and Mg as implant materials, there are some limitations, such as the stress shielding effect [4] and high susceptibility to inflammation in the case of Ti and insufficient mechanical properties of Mg during degradation [5]. Manufacturing of Ti/Mg hybrid implants is a promising avenue to overcome the abovementioned difficulties of single materials, with the aim of achieving synergy from the Ti/Mg interaction, i.e., the biocompatibility of the Ti part is further improved, and the load-bearing capacity of the Mg implant increases.
One possible application found in the literature is a set of Mg and Ti screws as a hybrid modification of a plate fixation system [6,7]. The studies show promising results; for example, bone regeneration and blood vessel formation, together with an antibacterial effect, were enhanced. An animal (rabbit) model shows that the failure load is increased by 30% by the application of Mg and Ti screws in comparison to only Ti ones. Investigations into the degradation behaviour of such hybrid systems in in vitro and in vivo studies show that the distance of 5 mm between Mg and Ti is the critical distance at which the accelerated degradation of Mg screws is observed [8].
Other popular examples are Ti/Mg composites [9], which can be prepared using infiltration casting, powder metallurgy, hot rotary swaging, and 3D printing methods [10]. Intensive studies of different groups have shown that it is possible to properly modify the mechanical properties of the composite materials, such as the elastic modulus. However, many investigations are still necessary to thoroughly understand and control the degradation behaviour and mechanics of such composite materials.
A new class of implants that can change shape and size during implantation is desirable when different geometrical and mechanical properties are required for positioning of the implant in the body and for further application. They could be achieved by producing hybrid Ti/Mg implants containing separated parts of Mg and Ti, which are strongly connected.
To combine the advantages of Ti and Mg in a joint specimen, one must overcome the problem of the connection between dissimilar metals [11]. One problem is the inability to form a tight connection, as Ti and Mg have low solubility in each other [12]. Another substantial complication is the large difference in the electrochemical potential between Mg and Ti, leading to accelerated Mg degradation.
In our previous studies, we successfully applied powder metallurgy technologies based on sintering, like metal injection moulding (MIM), to produce hybrid implants consisting of parts of Ti or Ti6Al4V(T64) and Mg-0.6Ca [13]. The connection between the single parts was enhanced by increasing the roughness of the Ti/Mg interface, which should also stimulate future cell ingrowth after Mg degradation. Tensile tests showed that the strength of the Ti/Mg connection was the same as that of the Mg part. Further investigations were performed to investigate the degradation behaviour of such a hybrid system, with attention to the properties of the titanium part after the degradation of magnesium [14]. The degradation of Mg leads to hydrogen release, which the Ti part can absorb. As a result, microstructural changes in the Ti matrix could impact the mechanical properties, like affecting a decrease in ductility. Furthermore, the high amount of adsorbed hydrogen showed its non-uniform distribution on the macroscopical scale, thus also changing the mechanical properties heterogeneously. A laboratory surface X-ray diffraction study pointed to the formation of titanium hydrides [14].
The sensitivity of Ti to hydrogen uptake is a well-known phenomenon that usually requires high pressure and temperature or some electrochemical treatment [15]. In our aforementioned studies, we detected that significant hydrogen absorption was achieved under atmospheric pressure and room temperature conditions without any external electrical source. The mechanism of hydrogen uptake and penetration is not fully understood up to now; it is assumed that the degradation of Mg leads to changes in the protecting titanium oxide layer. The second question is the kind of hydrogen localisation, which can be as solved atoms, in defects, or by titanium hydride formation. Answering these questions is crucial for predicting the mechanical and biocompatibility properties of titanium in such hybrid materials.
As discussed above, hydrogen adsorption by Ti after degradation of Mg is observed, leading to the formation of titanium hydrides. To obtain information on the hydride distribution and its connection to the degradation process of magnesium, in this study, the advanced methods of X-ray diffraction and absorption contrast tomography were applied to determine the 3D distribution of titanium hydrides. It is speculated that by the absorption of hydrogen released during the degradation of Mg, a prominent hydride formation can be observed at the Mg-Ti interface. Diffraction contrast tomography is the optimal tool here, as it allows us to reconstruct the spatial distribution of titanium hydrides on a microscopic scale length and correlate it with the macroscopic hydrogen profile.

2. Materials and Methods

2.1. Sample Preparation

The sample preparation was performed similarly to our previous work [14], where Ti64 powder was used for the sintering procedure. However, in the present study, pure Ti was utilised. Dog-bone-shaped samples were manufactured via MIM and sintered (see Supporting Information (SI)). The middle part of the obtained Ti dog-bone samples was covered with Mg-0.6Ca (Figure 1), applying MIM and sintering (see SI).
The titanium heads of the dog bone-shaped tensile specimens were cut 5 mm from the end of the Mg part, where the maximum hydrogen adsorption occurred, according to our previous results [14]. This kept the cylindrical symmetrical shape required for synchrotron experiments.

2.2. Characterisation

Corrosion experiments were performed in 0.9 wt.% NaCl solution at room temperature, which is a harsher condition than in the human body. This condition was selected to increase the interaction between Mg and Ti and to better observe the changes in Mg and Ti parts. Corrosion products of Mg were removed from the Ti part by washing them in a 200 g·L−1 solution of chromic acid for 10 min. The high-performance micro-X-ray fluorescence spectrometer (M4 TORNADO, Bruker Nano, Berlin, Germany) was used to verify the full removal of Mg products from the Ti surface.
The chemical composition (contents of O, N, and H) in the titanium part before and after degradation of Mg was determined via an inert gas fusion technique using a LECO apparatus (ONH836, LECO, St. Joseph, MI, USA). For this, the middle parts of the Ti dog-bone-shaped samples were first cut into pieces of approximately 50 mg each, using a diamond saw, and then cleaned.
Phase identification from the surface of the Ti part was performed by grazing incidence X-ray diffraction (GIXRD) (see SI) using a Bruker D8 Advance X-ray diffractometer (Karlsruhe, Germany).
Ti cross-section images were recorded using a scanning electron microscope (VEGA3 TESCAN-15kV, TESCAN, Kohoutovice, Czech Republic).

2.3. Absorption Microtomography

Experiments using absorption contrast tomography were performed at the EH4 of HEMS P07 beamline at PETRA3 (DESY, Hamburg, Germany) [16,17]. The photon energy was 80 keV with a field of view of 1.9 × 3 mm2 (V × H). The measurements were conducted using 8 layers from the edge to the middle and two steps in each layer. It took 8000 projections and approximately 6 h per sample. By this procedure, half of the sample length was covered, which should be sufficient, as the sample is expected to be symmetrical with respect to the middle plane. The obtained pixel size is 0.411 µm with a spatial resolution of 5.3 µm determined by the modulation transfer function (MTF). Before tomographic reconstruction, the different height steps were stitched, followed by the reconstruction based on a Matlab2024a script using Astra [18] applying a binning factor of six, thus, resulting in a pixel size of 2.469 µm. The analysis was performed using the software Fiji (20221004-1117). In the first step, the data were binned 2 times. Segmentation was performed using Moments-Open-Dilate operators to separate the pores, the background, and the sample. Then, the 3D particle analyser from Fiji was applied to determine the pore size and distribution. The analysis of the pore distribution, e.g., the number of pores and their size as a function of the orientation in the sample, meaning either the distribution along the length of the sample or as a function of the radius, was conducted using Matlab2024a tools.

2.4. X-Ray Diffraction Tomography

Diffraction tomography measurements were performed at the EH4 of the HEMS P07 beamline at PETRA3 (DESY, Hamburg, Germany) [19]. Samples were aligned, and the beam size (photon energy 80 keV) on the sample was 30 × 40 µm2 (V × H). At distinct positions, line scans from −2.5 to 2.5 mm (with respect to the centre of the sample) horizontally with 40 µm step size were taken to measure the full width of the sample. At each position, 1000 projections in an angular range from 0° to 180° were taken; this corresponds to an angular step size of 0.018°. The measurement time for one line was approximately 2 h [20]. Due to this, we were not able to measure the full sample but rather concentrated on specific positions. For the sample, after the complete degradation of Mg, 7 lines were measured starting from the edge of the rod with a distance of 2.5 mm between the different positions. This means that half of the sample was examined.
The XRD data were first calibrated and integrated using the PyFAI Python library (version 3.6) [21]. The calibration was based on Lab6 measured during the experiment. The obtained diffractograms were then 3D-reconstructed using the MATLAB pipeline [18]. The reconstructed XRD tomograms were analysed using a custom MATLAB script. In the first step, the different diffraction peaks were analysed with respect to the phase composition. In the next step, the respective TiH2 peaks were fitted by a Gaussian distribution in order to determine the full width of half maximum (FWHM), intensity, and position. Based on the FWHM, the crystal size was determined using the Scherrer equation [22], and the relative mass was based on the intensity.

3. Results

3.1. Macroscopic Sample Characterisation

Firstly, the titanium part was shaped in dog-bone form, debound, and sintered. The next step was the formation of the Mg-0.6Ca part (Figure 1a). After sintering of the magnesium part (Figure 1b), the samples were put into a saline solution (0.9% NaCl) for degradation. After 48 h, they were completely degraded (Figure 1c). Finally, for the synchrotron experiments, the heads of the dog bone were cut off, and only the middle part was examined (Figure 1d). The length of the middle part is 33 mm, which covers the whole region of the original Mg part (23 mm) and the neighbouring regions, where a maximum of H adsorption is expected, according to our previous studies [14].

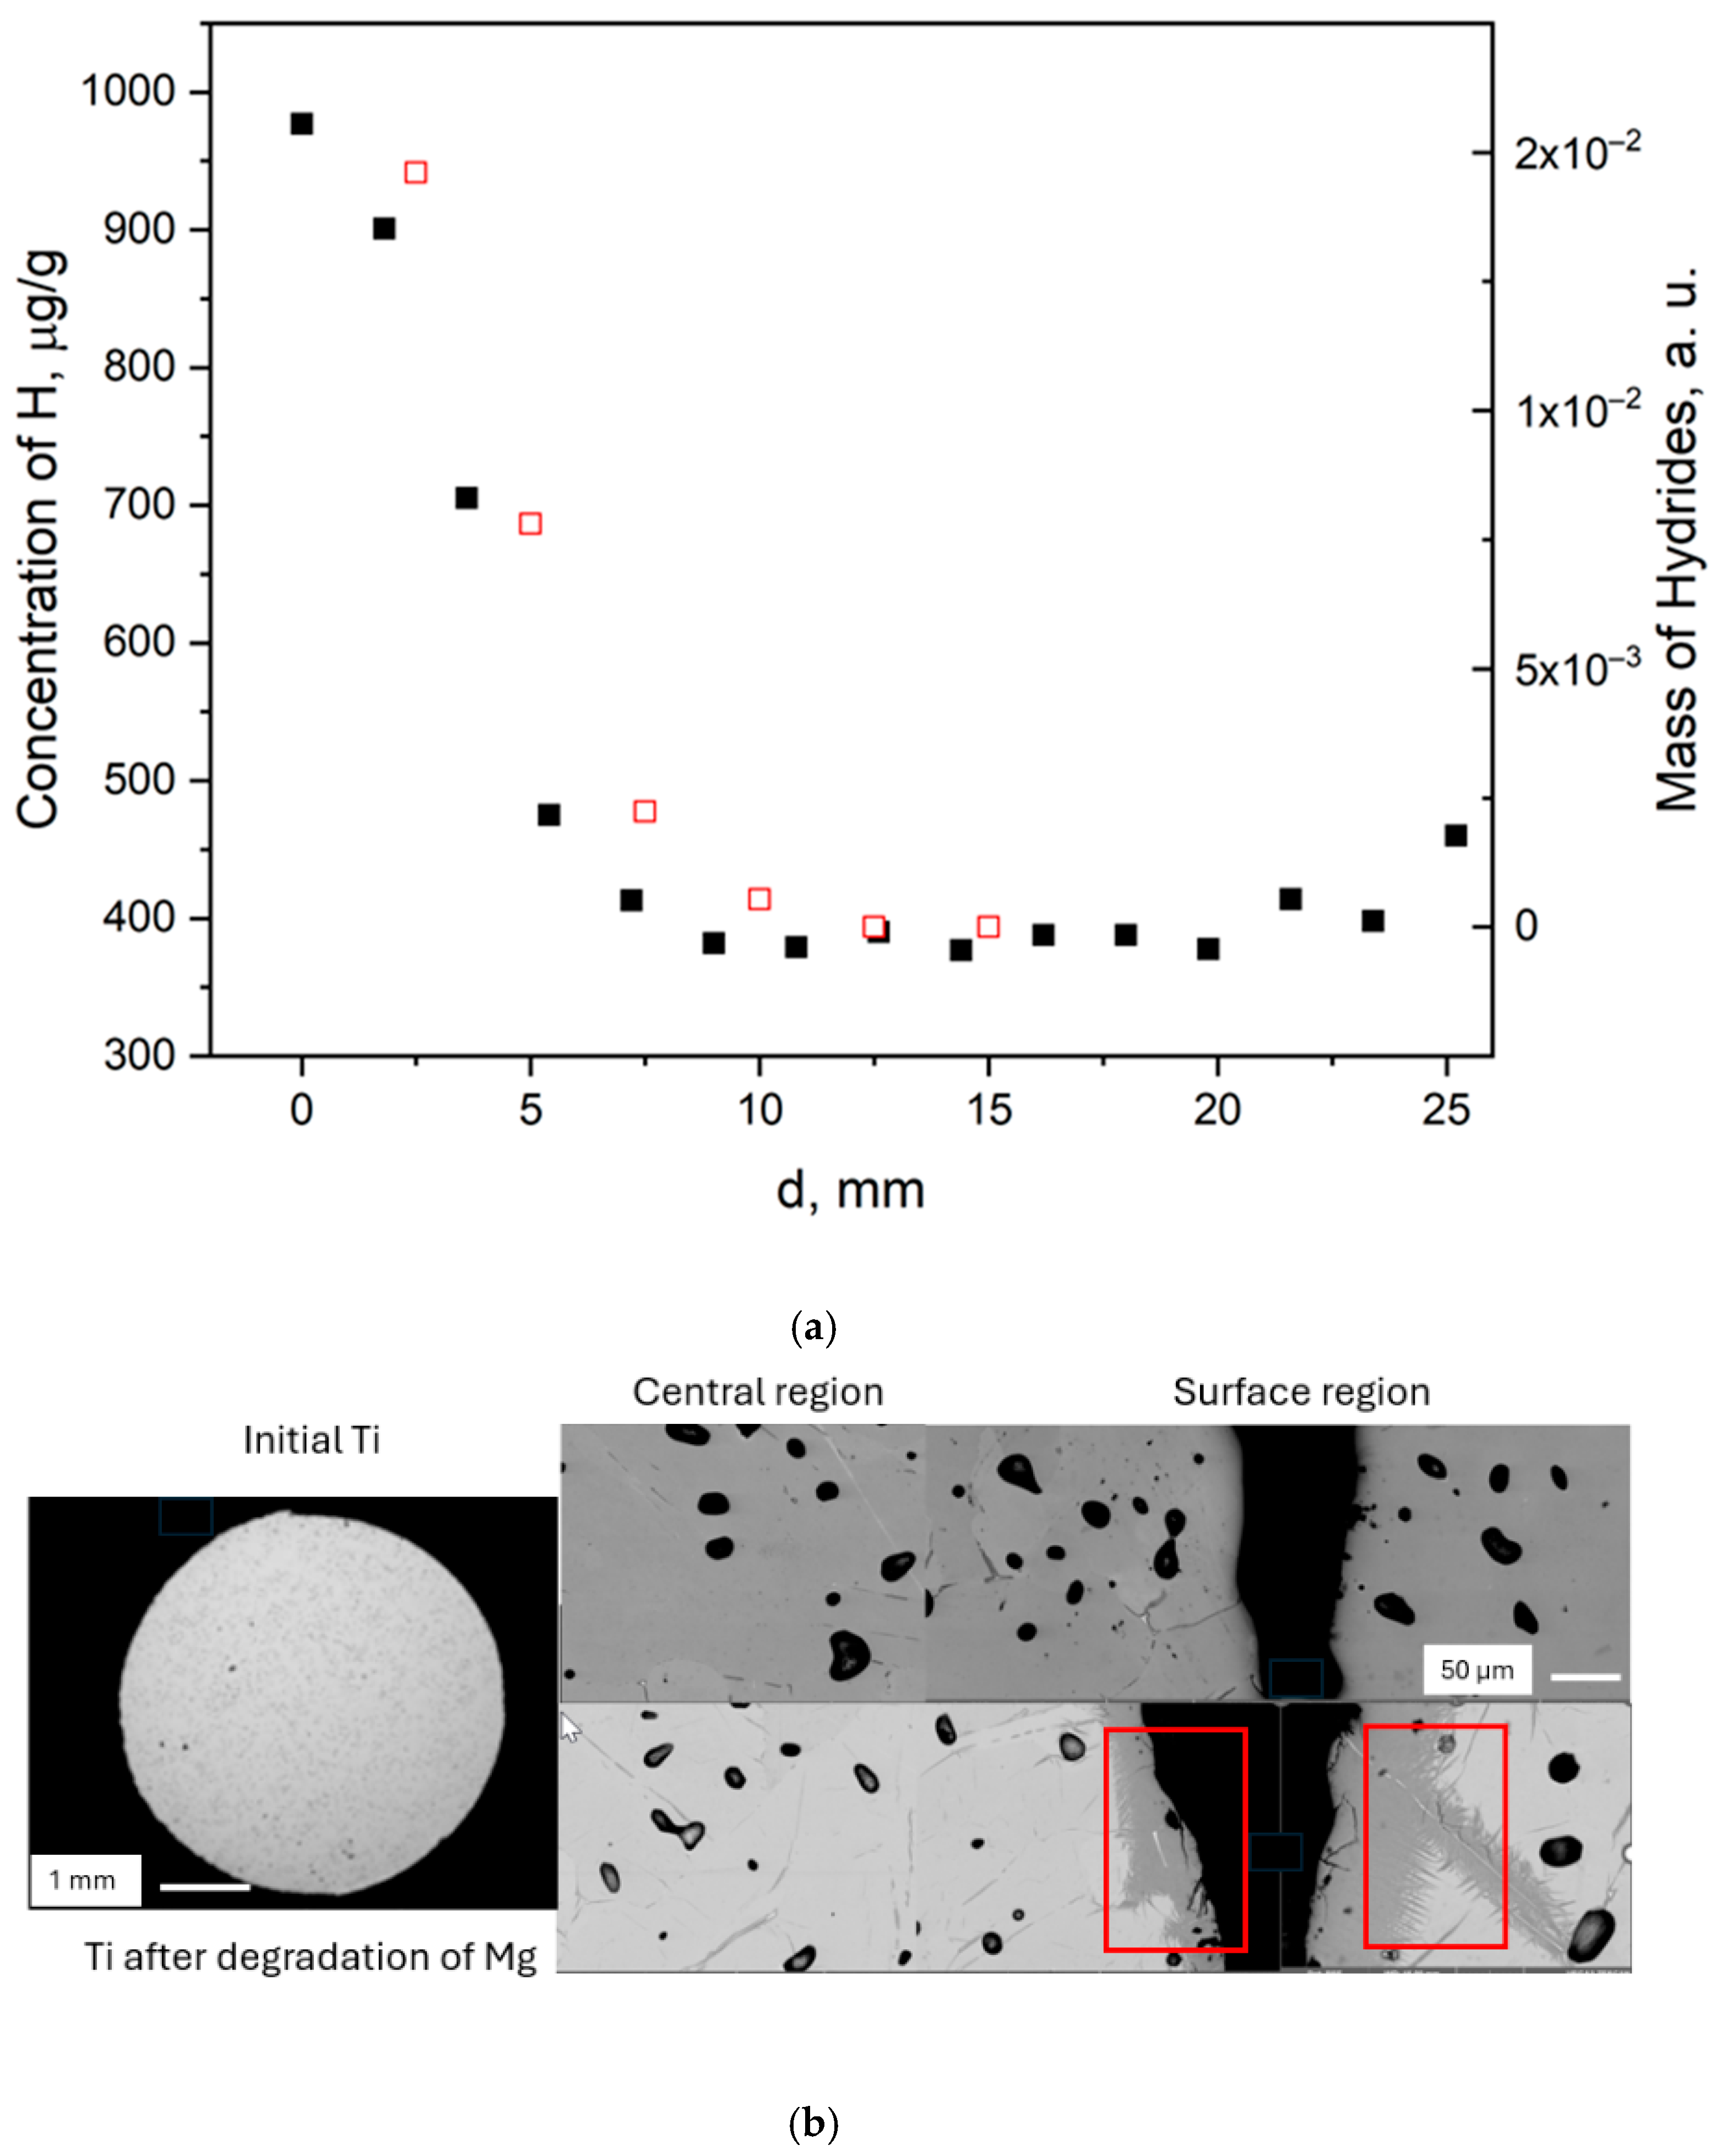
3.2. Hydrogen Distribution by Chemical Composition and SEM

The determination of the hydrogen content along the length of the titanium part performed by the LECO device shows the same trend as for the Ti6Al4V in our previous studies [14]. In Figure 2a, inhomogeneous adsorption of H is observed with an increase in the hydrogen concentration in the region near the former Ti-Mg interface in a similar manner to that observed previously [14]. The concentration of hydrogen in the Ti part decreases from 1000 µg/g to 400 µg/g, which is 50% lower in comparison to the hydrogen concentration in Ti6Al4V and points to a lower affinity of H to pure Ti in comparison to a Ti6Al4V alloy. Ti6Al4V is an α-β alloy with a two-phase crystal structure consisting of an α-phase (hcp, stabilised by Al) and a β-phase (bcc, stabilised by V). The diffusion rate and solubility of hydrogen differ significantly in the α- and β-phases, leading to a variation in the hydrogen concentrations in the two phases [23,24]. The solubility of hydrogen is significantly higher in the β-phase than in the α-phase [24,25], and hydrogen is particularly concentrated at the α-β interfaces [26], which is why a fully lamellar Ti6Al4V with a high amount of an α-β interface has a significantly higher affinity to hydrogen than a Ti6Al4V with a globular or bimodal microstructure [27]. In contrast to Ti6Al4V, pure Ti consists almost only of an α-phase and contains only a very small amount of a β-phase, which explains the detected higher affinity of H to Ti6Al4V in comparison to pure Ti.
The formation of titanium hydrides on the surface of the Ti sample after degradation of Mg-0.6Ca was confirmed by GIXRD with an X-ray beam of a few square mm. The comparison of the GIXRD patterns of initial Ti and Ti after degradation of Mg0.6Ca shows the presence of additional peaks (Figure S1), which can be identified as titanium hydride: TiH2 face-centred cubic phase a = 4.42 Å (PDF 00-003-0859, Data 2015) [28] on the surface of Ti. These peaks were used by synchrotron XRD tomography to obtain the 3D distribution of titanium hydrides.
SEM images (Figure 2b) show some remaining porosity of ~3% (dark points on overview images). Comparison of the Ti part before and after degradation of Mg0.6Ca (with and without adsorbed hydrogen) points to some visual differences, as the interface region shows a variation in grey levels after degradation as compared to the initial state, where the grey level in the image is homogenous. This indicates some impact on the electron density of the interface and thus some compositional changes after degradation of magnesium. The interface between the dark and light regions is rough; one can call it needle-like. A similar effect was observed for wrought Ti after degradation of Mg0.6Ca [14]. Most probably this change in grey level could be connected to titanium hydrides, and it seems that their formation takes place at the surface of Ti and along the grain interface. According to the SEM images, the thickness of this region is around 50 µm with penetration along grain boundaries into material of up to 150 µm.

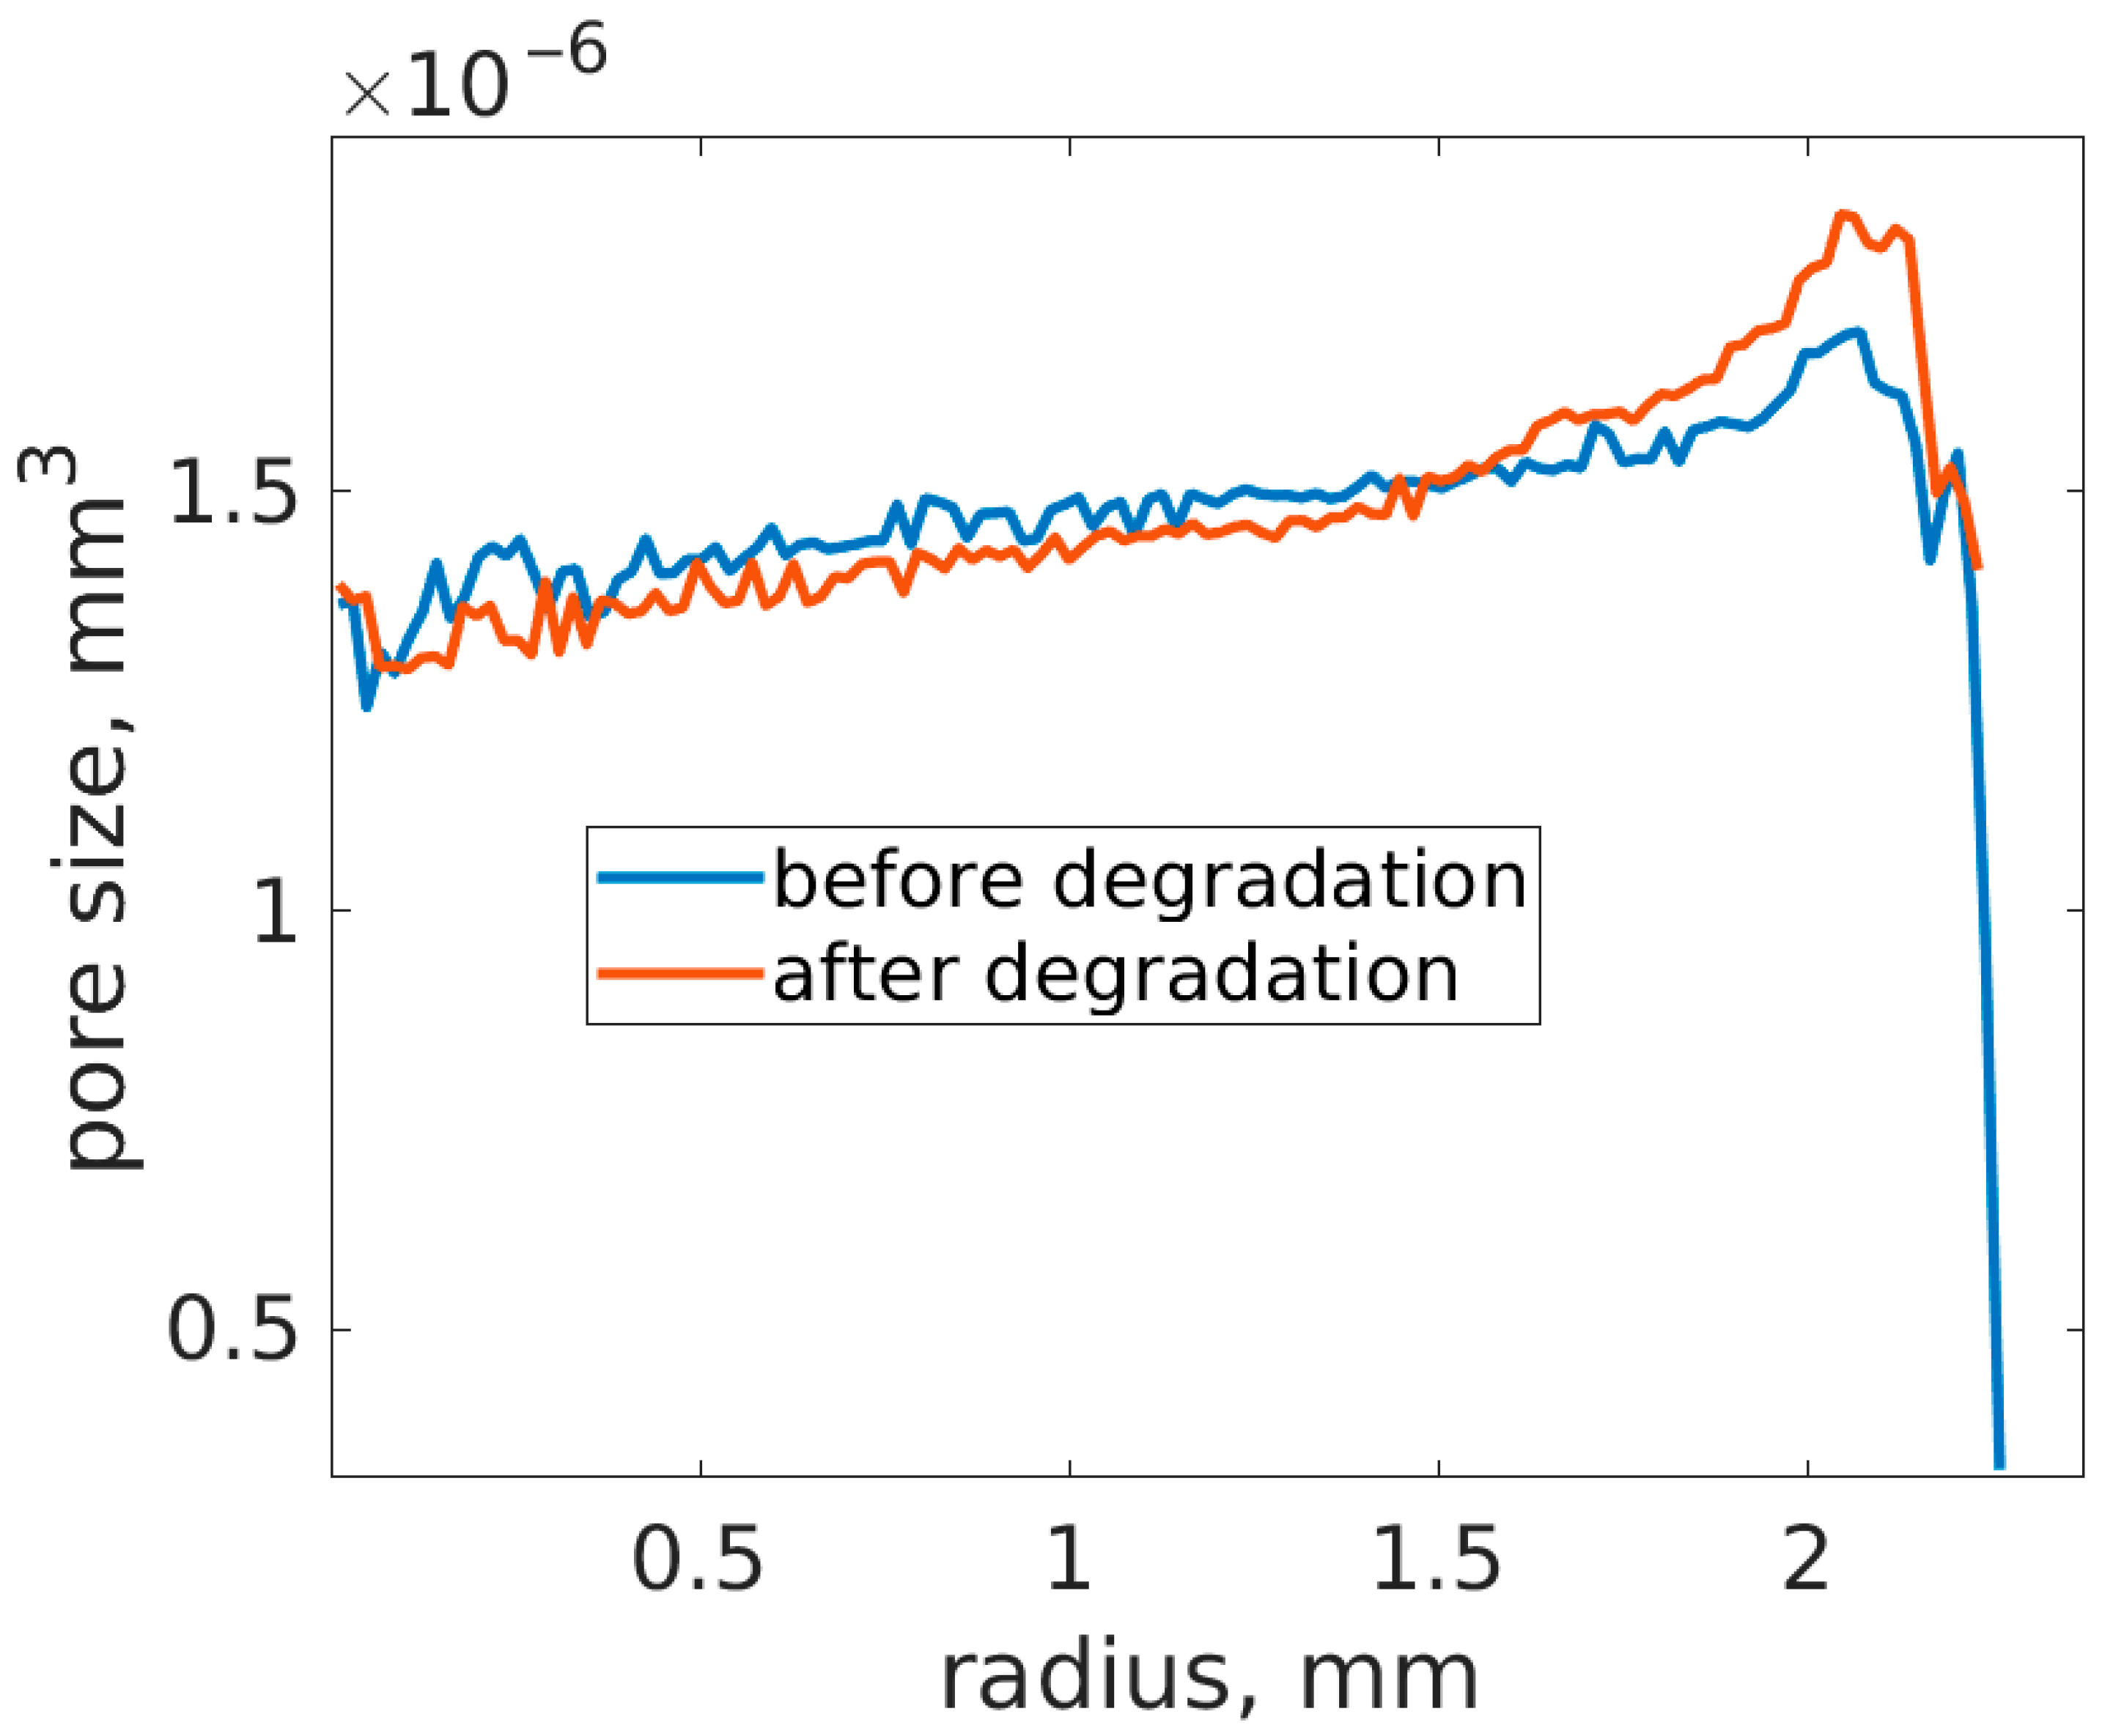
3.3. Distribution of Pores Within the Ti Part Before and After Degradation of Mg0.6Ca by Absorption Synchrotron Tomography

The absorption tomography measurements show a remaining porosity of the Ti part in the order of 3.3 ± 0.2%, which is a common value for the sintering of Ti in such conditions and consistent with Archimedes’ measurements (3.2 ± 0.1%) [29].
The size distribution of the pores was approximated as a lognormal distribution, and the values of mean pore volume (averaged for half of the sample) versus distance from the centre of the Ti rod before and after degradation of Mg0.6Ca are shown in Figure 3. The increase in the pore size moving away from the centre of the rod is observed in both cases, which is linked to the shrinkage of powder particles by sintering. The pore volume varies from 1300 to 1700 µm3, corresponding to a pore diameter of spherical approximation of ca. 10–15 µm. It is also visible that the increase in the pore size near the surface of the sample is smaller for the sample after degradation of Mg, i.e., after hydrogen absorption.
The dependence of the pore size vs. radius for different points along the length of the specimen is shown in the SI (Figure S2) and demonstrates the same trend.

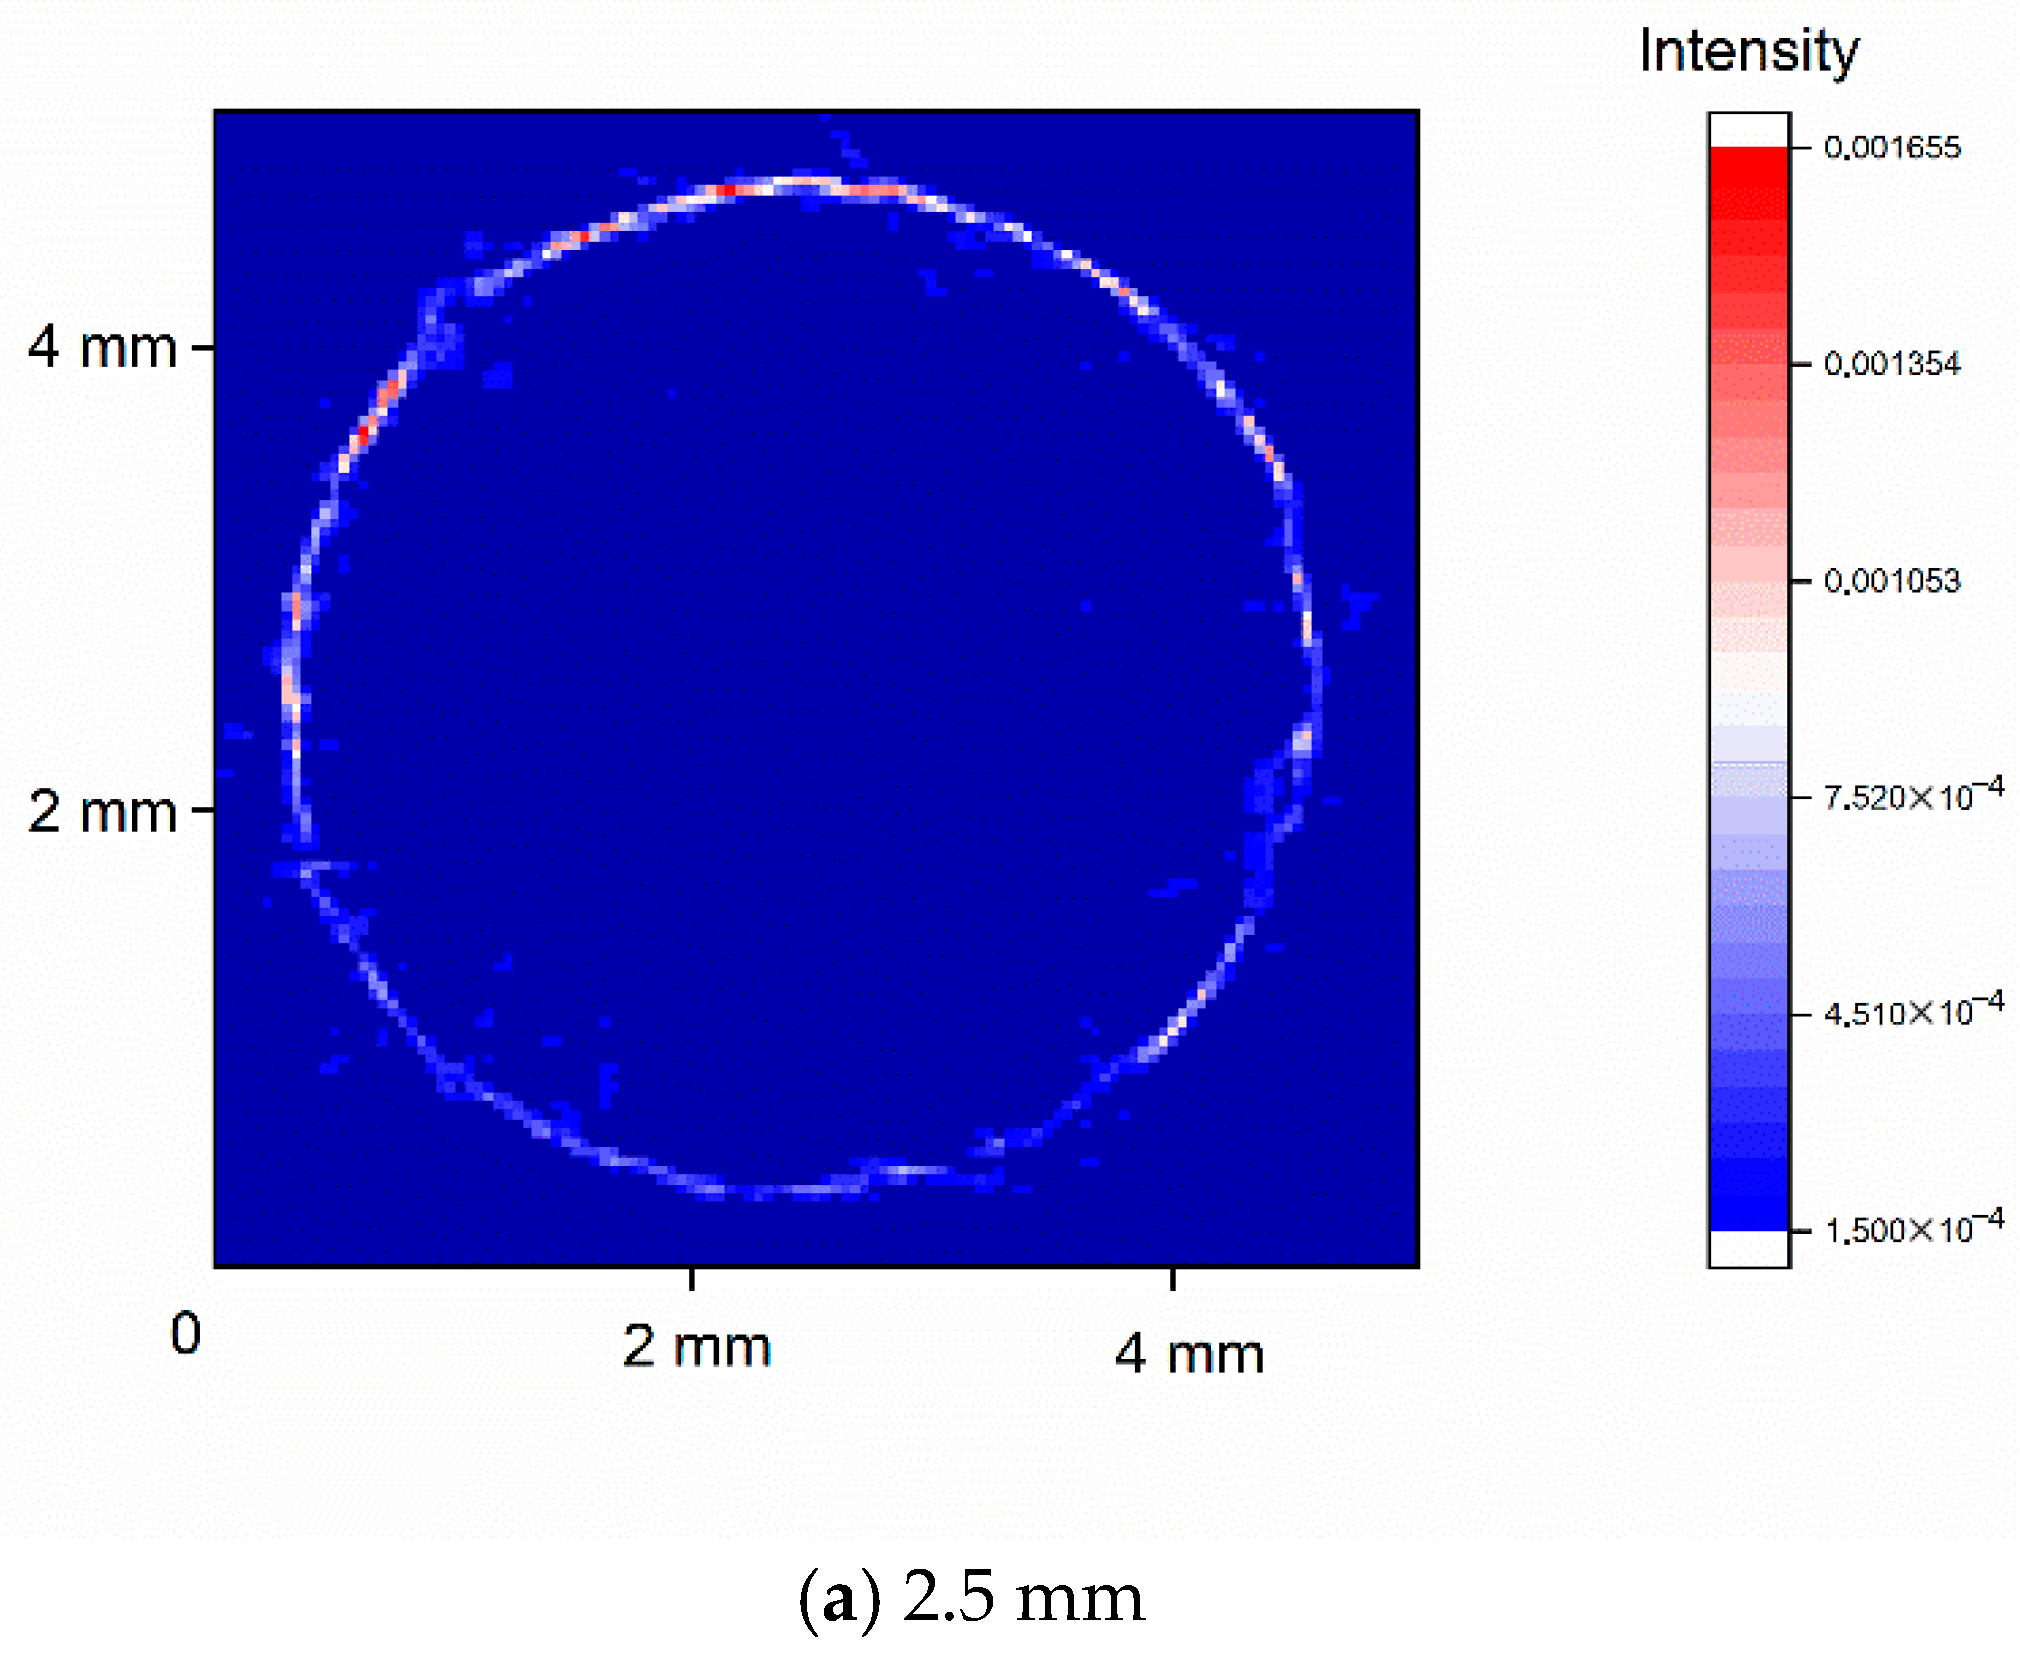
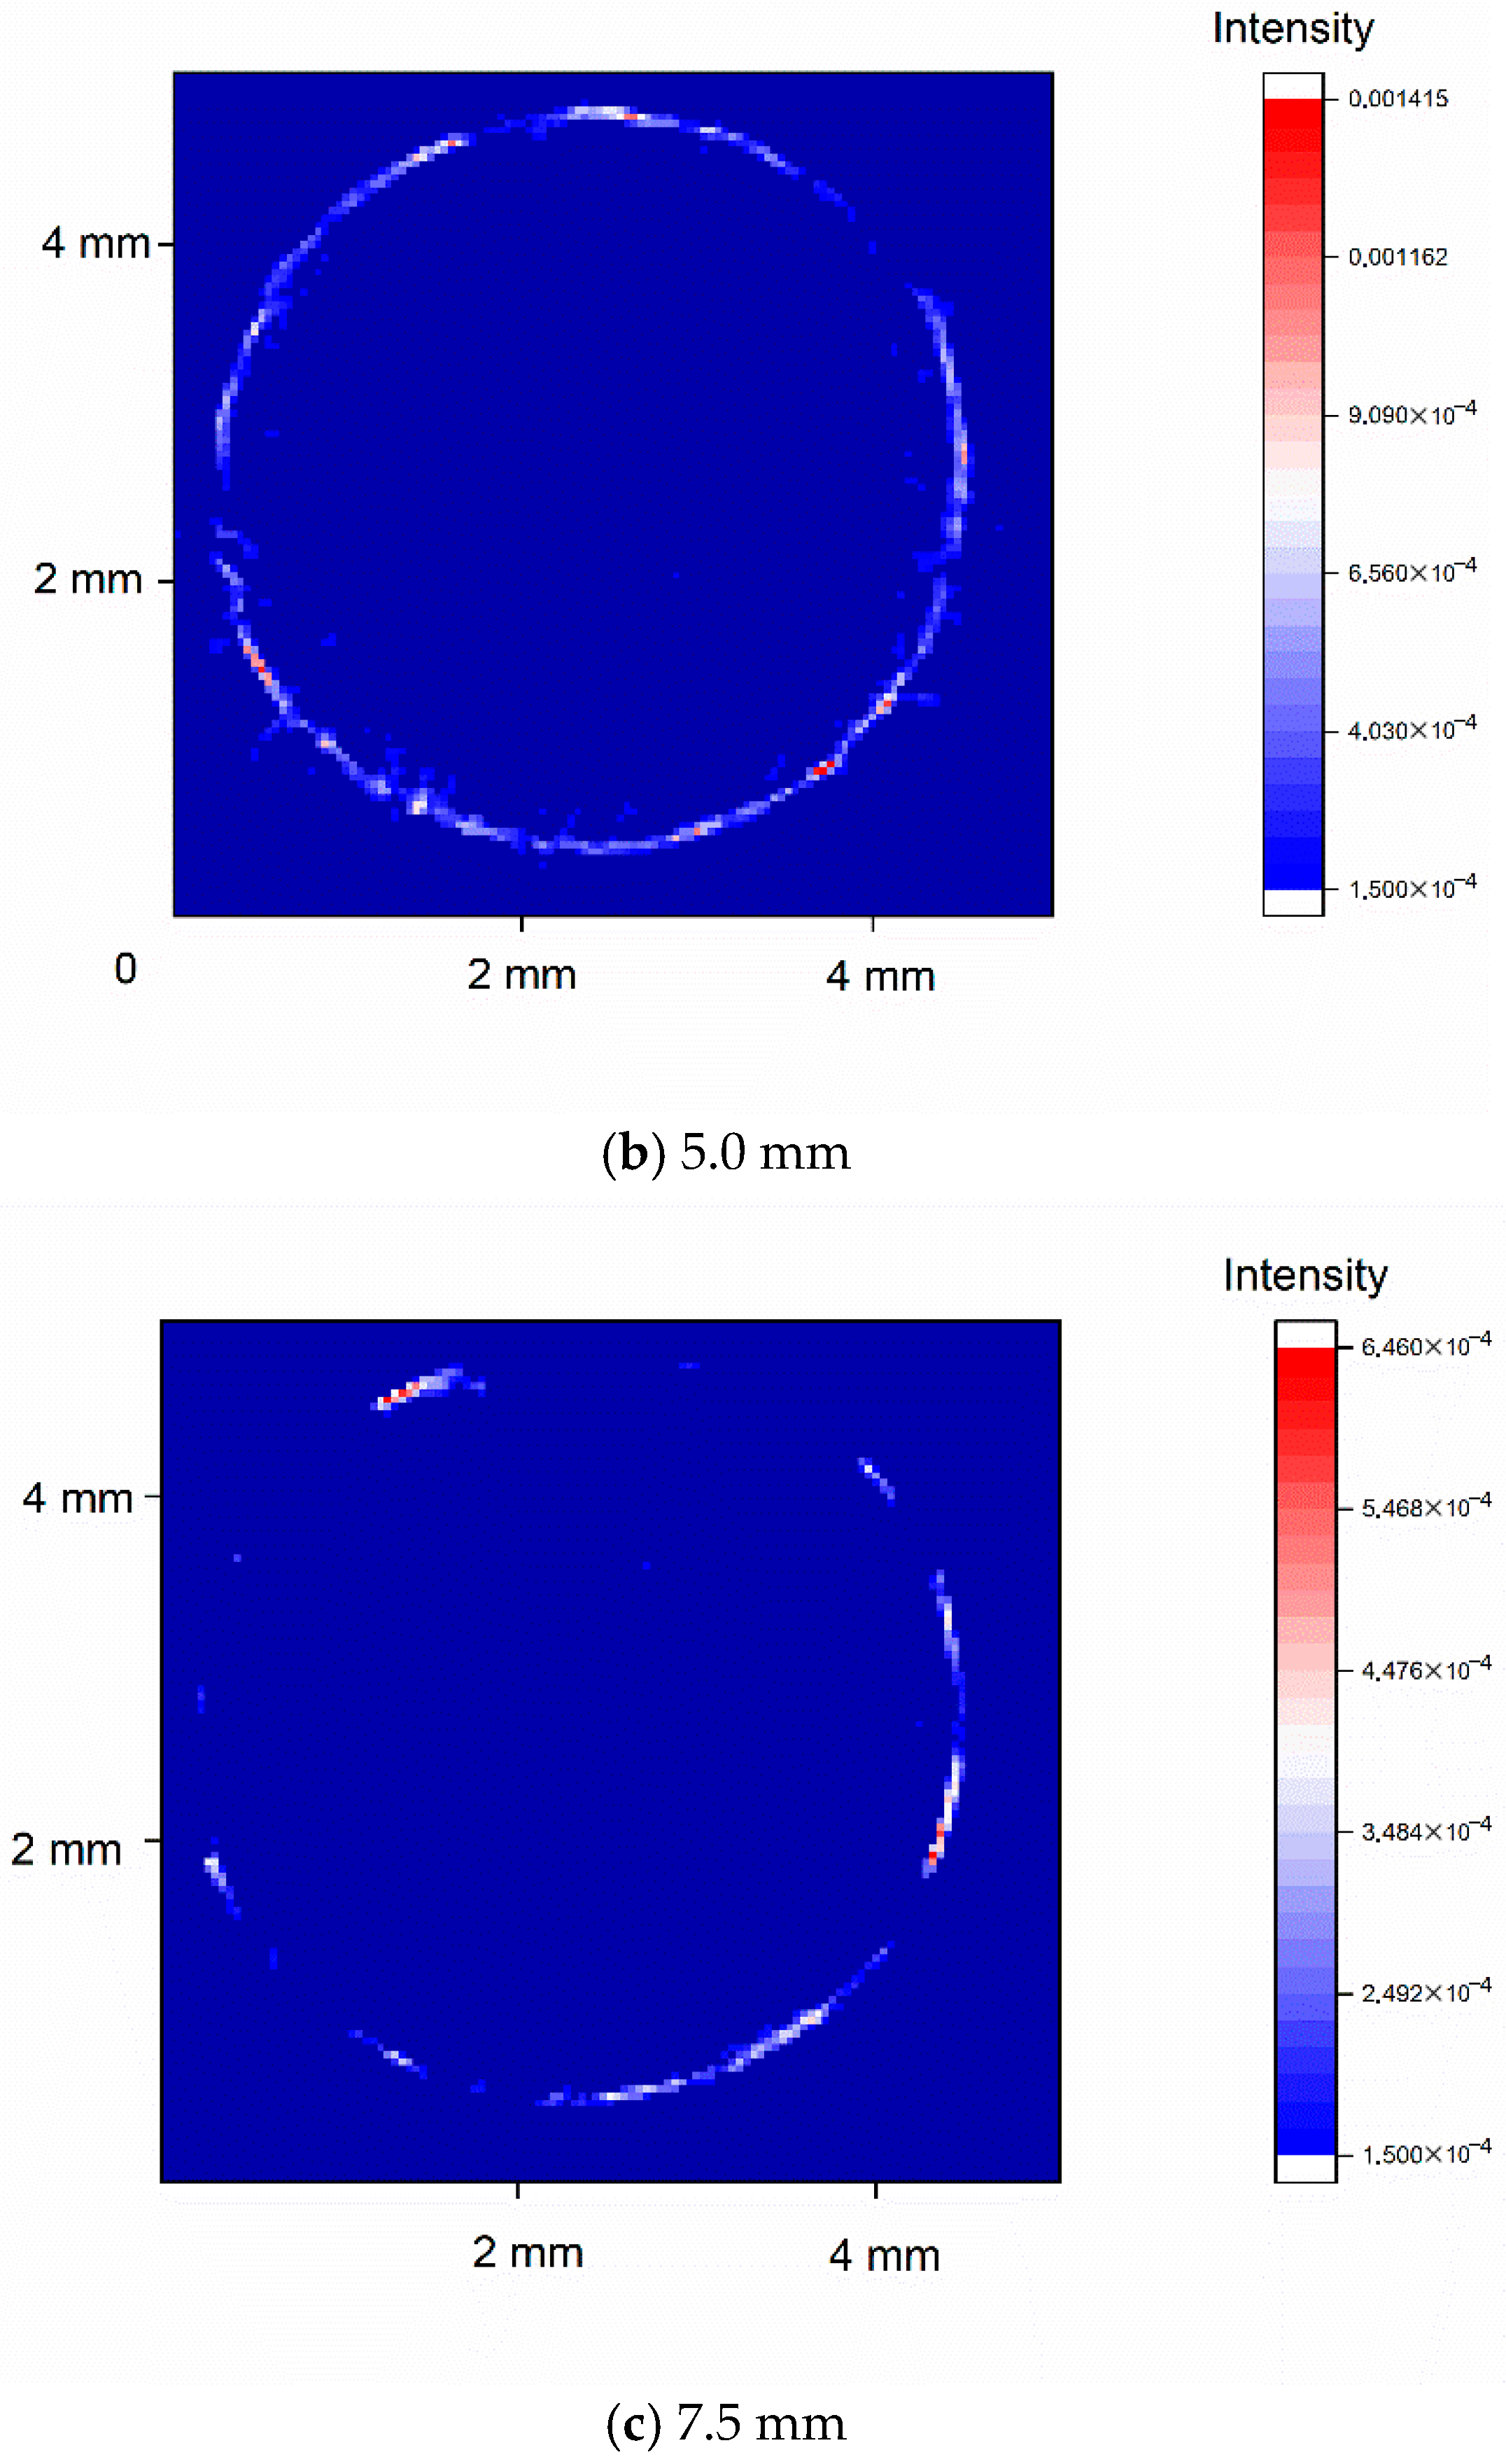
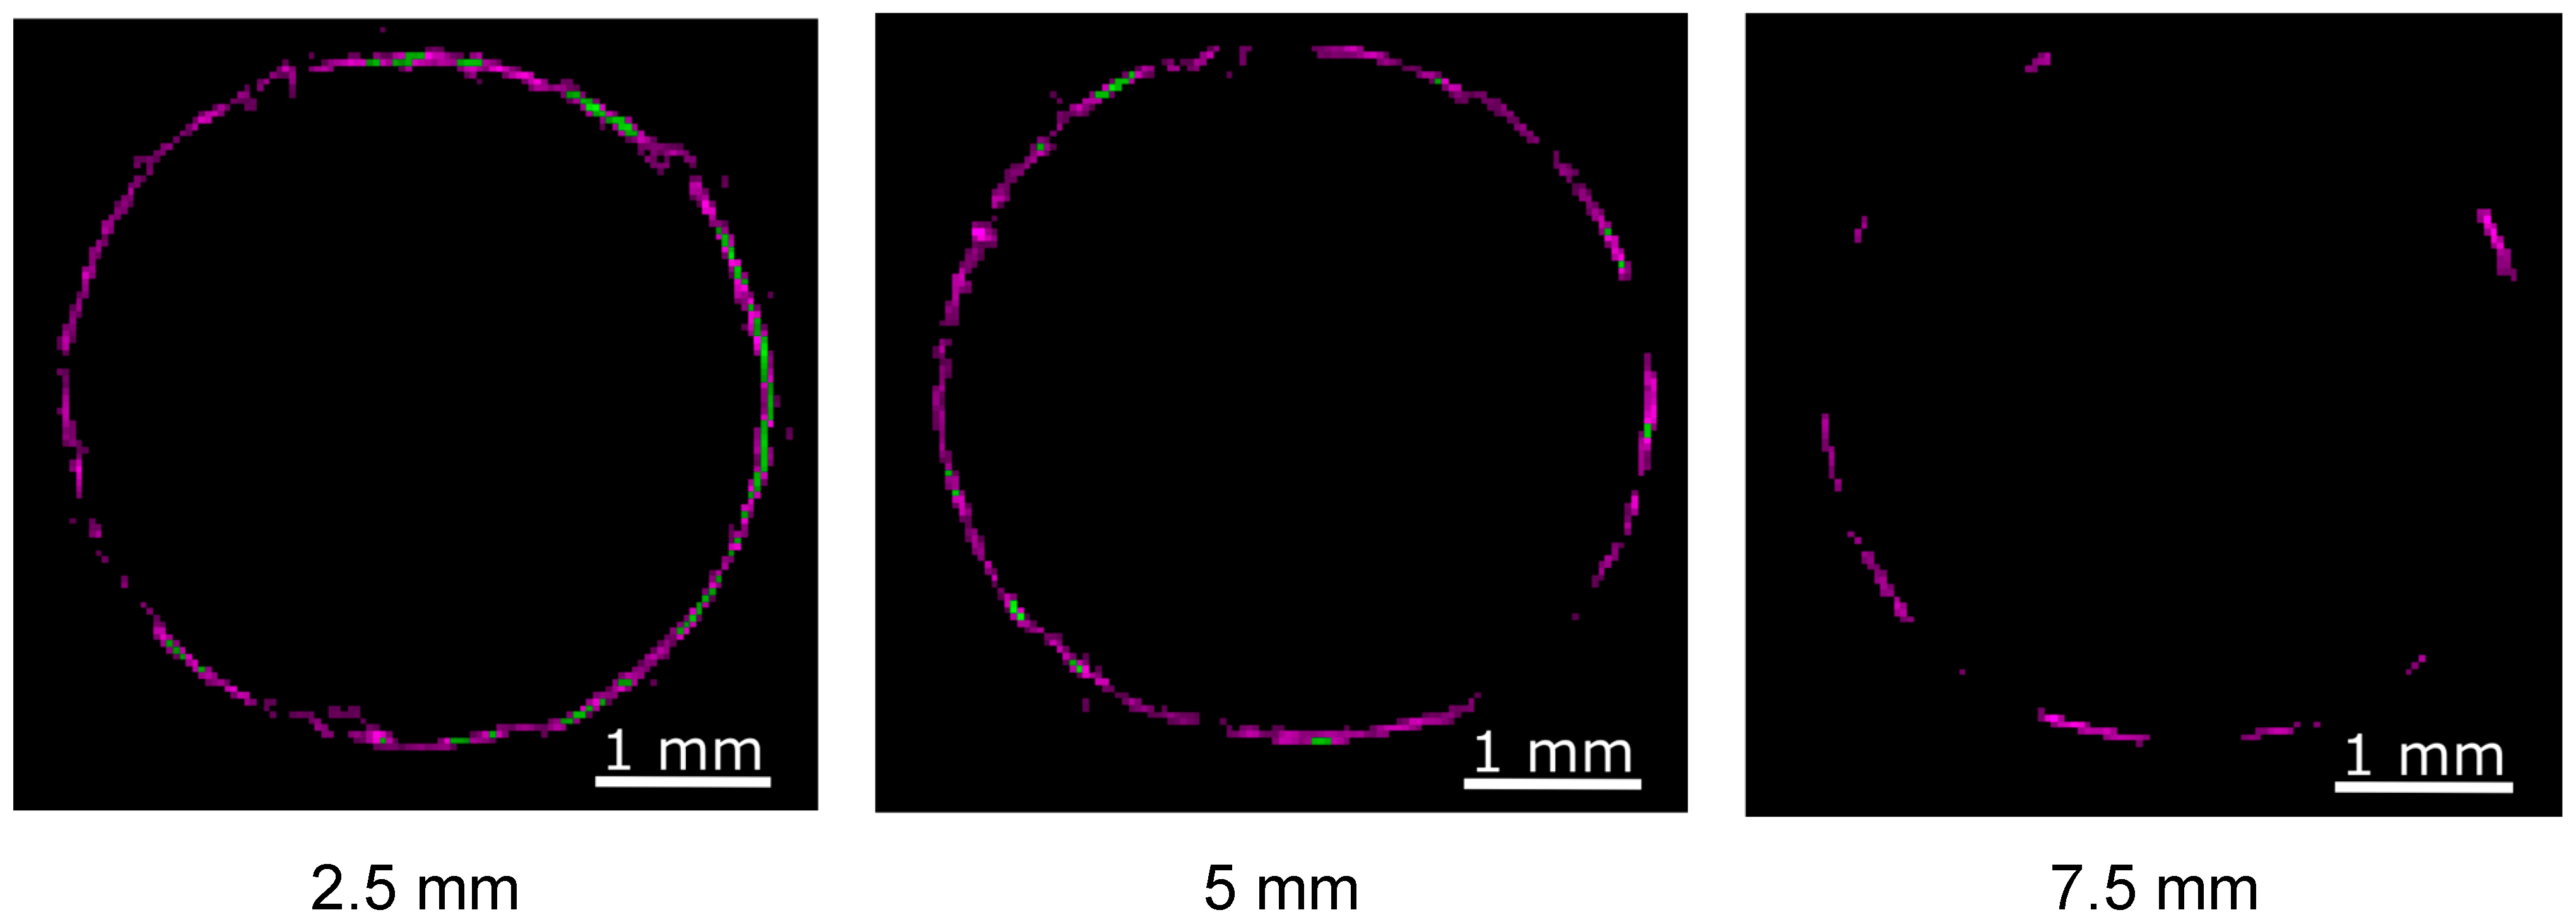
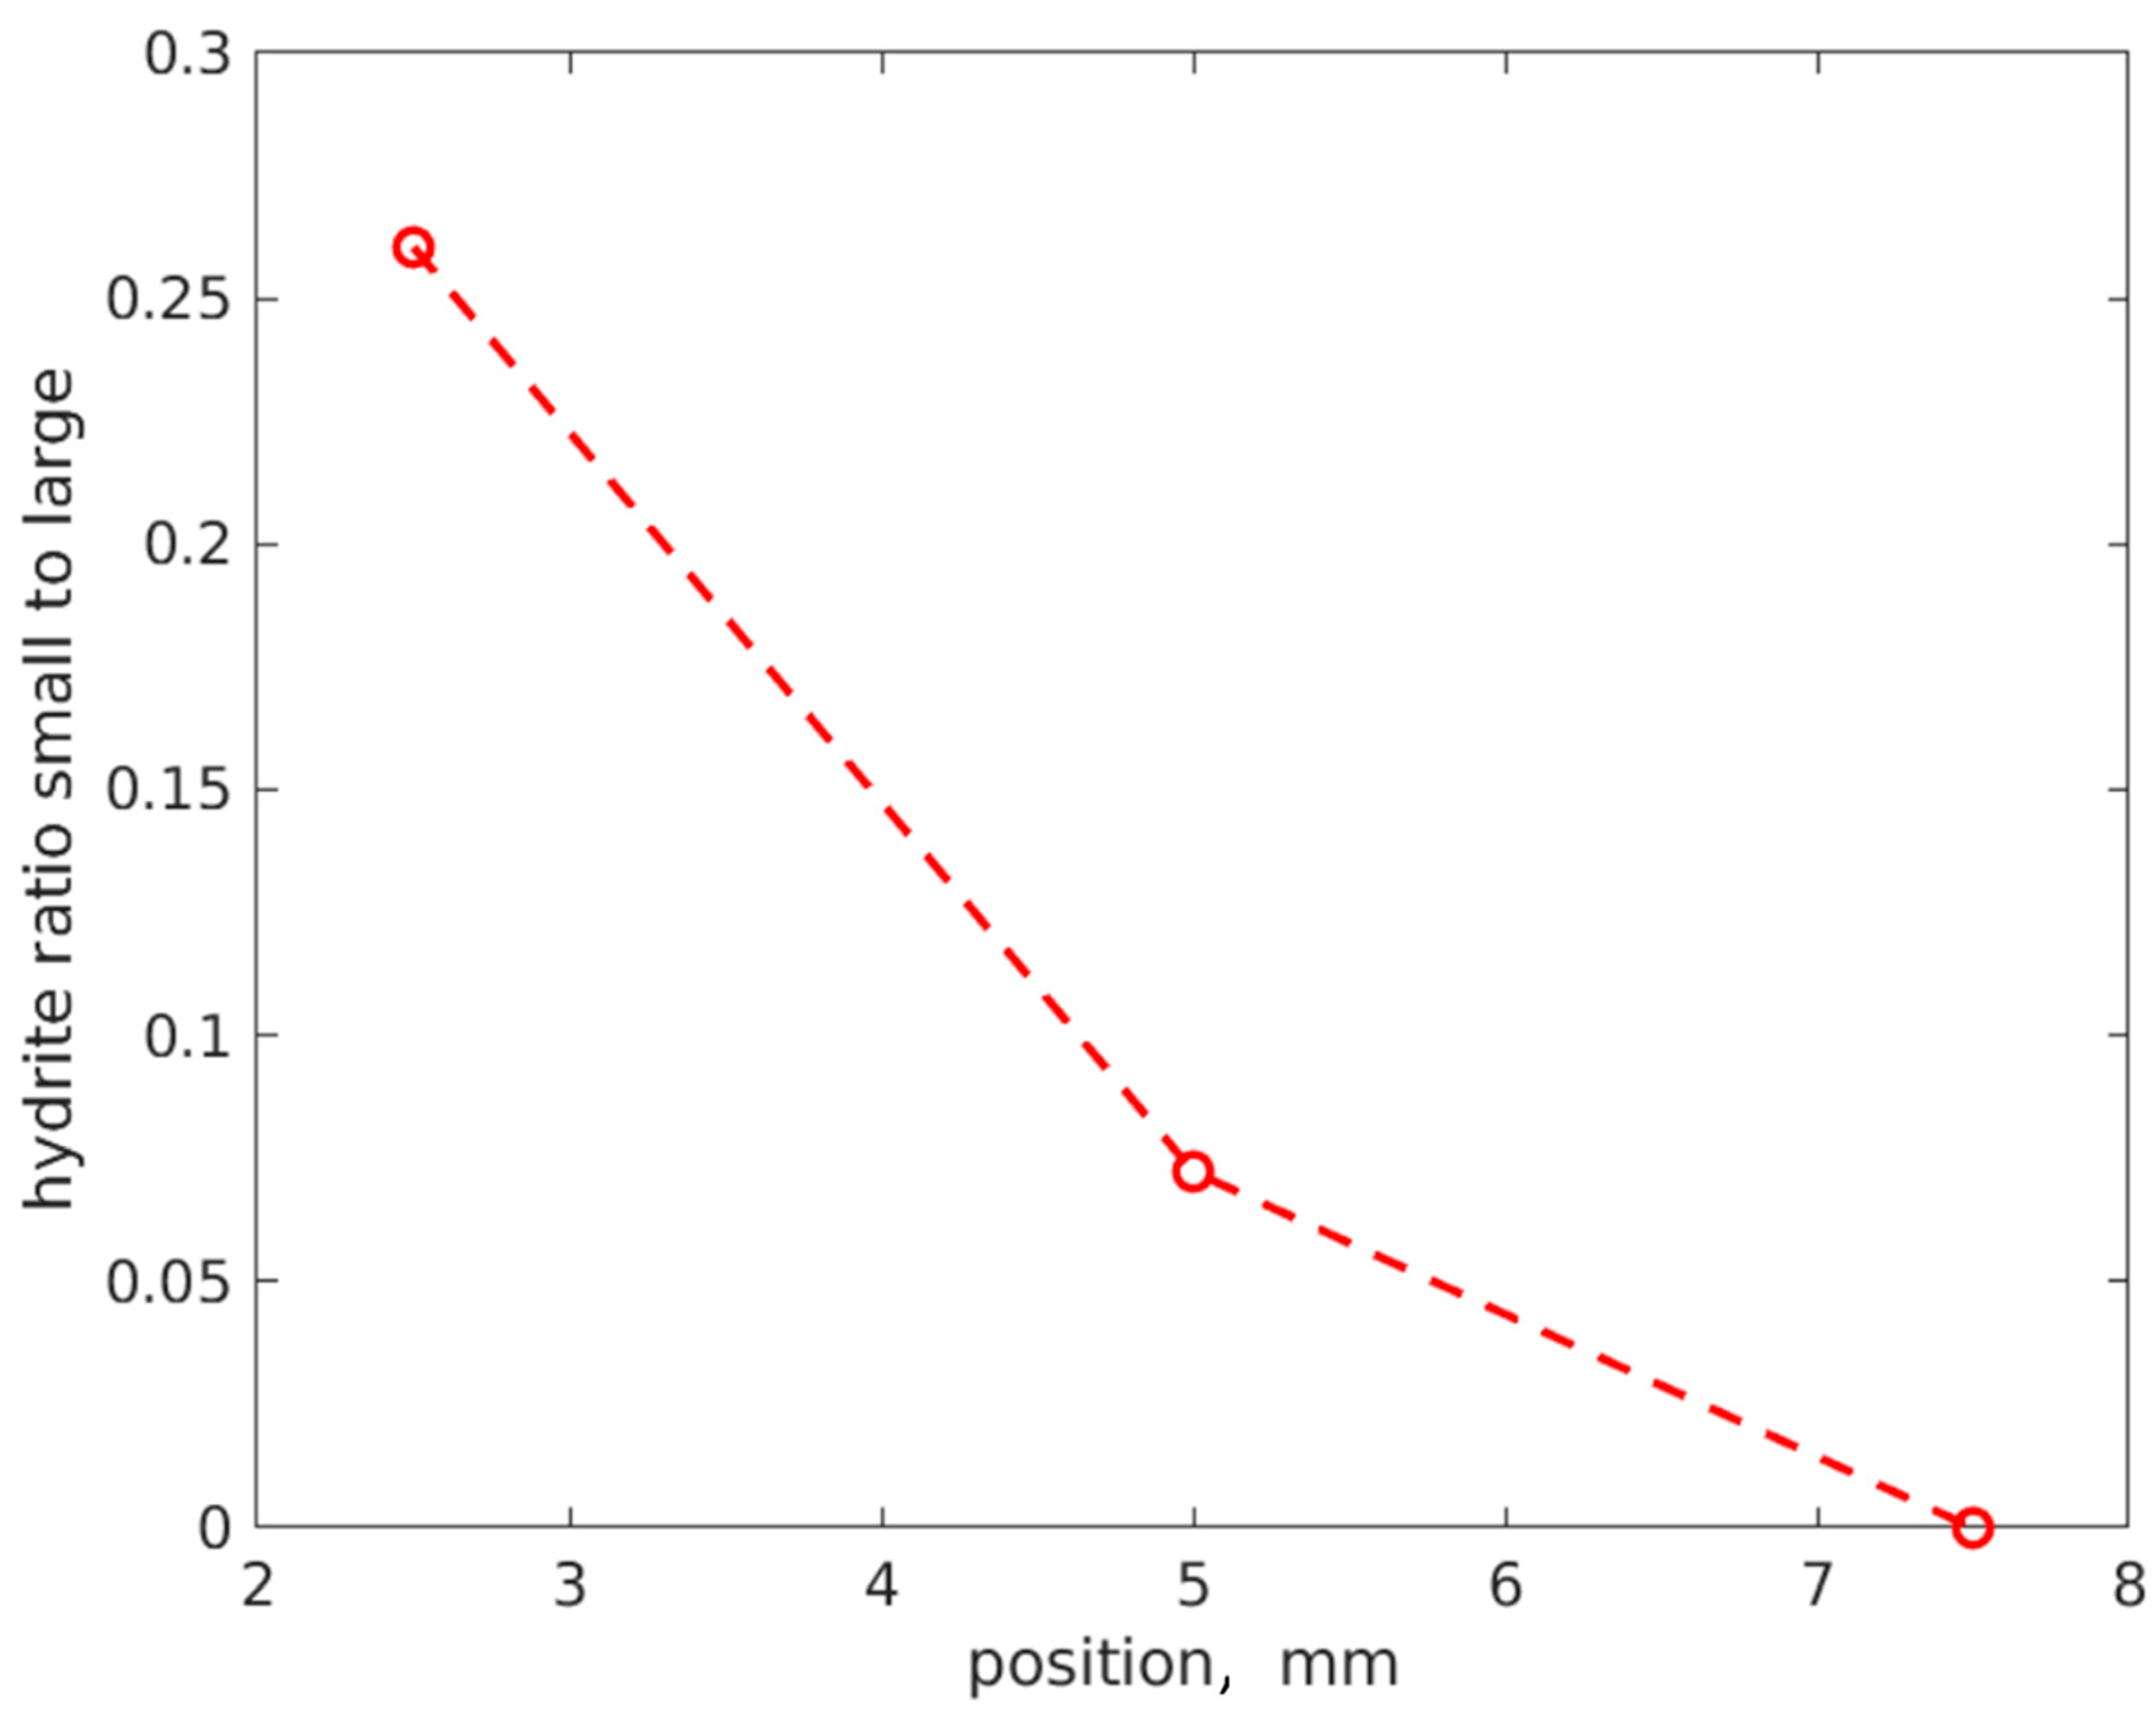
3.4. Three-Dimensional Distribution of TiH2 via XRD Tomography

The (200) Bragg reflection of the TiH2 crystals was used to obtain their spatial distribution, and detectable intensities were obtained at three positions (distances 2.5, 5.0, and 7.5 mm from the top of the sample). For the other positions at 10, 12.5, and 15 mm, no XRD signal of TiH2 could be detected. Intensity maps of the XRD tomography for the distances of 2.5, 5.0, and 7.5 mm are shown in Figure 4. The correlations between the total concentration of H and the intensities of the TiH2 signal are clear (Figure 2a).
The maps of the intensity for the TiH2 reflection show an almost continuous layer near the edge of sample, which becomes fragmented for a distance of 7.5 mm away from the edge (region of magnesium/titanium/NaCl solution interface) and disappears at a larger distance from the edge: 10, 12.5, and 15 mm (See SI, Figure S3). Reflections of TiH2 or TiH2-x are not observed in the inner part of samples.
Negative control measurements on a sample without H absorption were also performed. Here, no detectable signal (see SI, Figure S4) is observed. The estimated thickness of the TiH2 layer is 100–120 µm. However, it must be considered that the X-ray beam had a size of 40 µm, thus inducing a smearing in the same order of magnitude for the spatial resolution.
The FWHM of the TiH2 reflections was used to determine the size of the titanium hydride crystals, and a bimodal distribution of the crystal size is observed (Figure 5) with diameters of 130 nm and 210 nm. The small fraction of 130 nm is detected at a larger depth in the sample. Furthermore, the peak position was checked to clarify whether the structure of the Ti hydrides was the same along the sample. Figure 6 shows this distribution with no sign of any structural change, indicating the same structure forming. Regarding the central position around 40.35° ± 0.03°, we assume mostly the presence of the TiH2 face-centred cubic phase.
It was noticed that the peak centred around 40.35°. Due to the narrow width of the peak, we can mainly rationalise that just one phase is present, as the width should be in the range of 0.4°. We want to note that changes in the position can occur due to a slightly improper sample placement, which is even more severe for high-energy experiments, as performed here. In this experiment, a sample displacement of 0.3 mm could change the recalculated angular scale in 8 keV by 0.2°. Thus, typically more than one XRD peak is needed for an unambiguous phase determination. However, by considering the information from the lab experiment, these data would mostly show the formation of TiH2 in the face-centred cubic phase (SI).

4. Discussion

Due to the high affinity of hydrogen to interact with Ti, more than six different kinds of hydrides can be formed [30]. The forming phase strongly depends on the way hydrogen is introduced into titanium, and here, three possibilities are the most important: electrochemical charging, gaseous charging, and H+ ion irradiation [31]. In the case of hybrid Ti-Mg degradation, a combination of two of them can be considered to explain our observations: contact of Ti with more galvanically active metal (electrochemical charging) and formation of H2 due to degradation of Mg (gaseous charging). The significant difference in electrochemical potential between Ti and Mg of about 1.5 V is sufficient for hydrogen absorption [32], which typically is applied for electrochemical hydrogen charging of titanium [30]. Additionally, a metallic reduction reaction takes place, where titanium oxide is reduced to Ti by Mg, which oxidises to MgO or Mg(OH)2 and most probably enhances hydrogen penetration [33], even at room temperature [34].
The formation of TiH2 is an important factor for the biocompatibility of Ti implants, as it improves bone healing and attachment to bone [35]. In the case of a hybrid Ti-Mg implant, a gradient of hydrogen loading along the length of the specimen was achieved. The XRD diffraction contrast tomography measurements allow us to follow the hydride formation depending on the position within the specimen, either along the sample or perpendicular to its longitudinal axis. The data in Figure 2a show the hydrogen concentration as well as the hydride amount, based on the XRD-CT data, proving a strong correlation between the concentration of absorbed hydrogen and the amplitude of the TiH2 signal and allowing us to correlate both. If the concentration of absorbed hydrogen decreases to 400 µg/g (1.8 at.-%), the signal of titanium hydrides decreases below the detection limit. The 400 µg/g (1.8% at.-%) of hydrogen is already above the solubility of hydrogen in titanium at room temperature (0.12 at.-%) [36], and the mixture of titanium hydrides and the α solution should exist up to 57 at.-% [31]. Obviously, the sensitivity of the XRD-CT method is responsible for this disagreement with the results of the electrical resistivity method used in [36,37].
Based on the XRD-CT analysis, it can be suggested that the needle-like structure observed on the SEM images at the position with the highest amount of hydrogen absorption (Figure 2b) should be interpreted as hydrides located at the surface of Ti. They are similar to hydrides introduced by the electrochemical charging method [38], where this needle structure exhibits a size of about 1 µm thickness and up to 10 µm length. On the other hand, the complete change in colour to dark grey (full transformation into titanium hydrides) is observed at the surface of the specimen at maximum hydrogen adsorption. It is not observed by hydrogen loading via electrochemical methods [38,39], which could be associated with the effect of Mg degradation and the distortion of the titanium oxide.
Absorption X-ray tomography detects the residual porosity of sintered Ti with some gradient from centre to periphery (increase of pore volume), and it allows us to observe changes in the porosity after absorption of hydrogen due to the degradation of Mg0.6Ca. The data indicate detectable changes (porosity decrease) at the edge of the specimen, which is an indirect sign of the location of titanium hydrides at the edge of the sample, while the volume swelling is expected to be up to 24% by the formation of hydrides [30].
The SEM data show a thickness of the hydride layer from 50 µm up to 150 µm via grain boundaries’ extension up to 150 µm, which agrees with an average value of XRD CT of about 100–120 µm. The presented results demonstrate similar values to those obtained via electrochemical charging and determined by electron back-scattered diffraction (EBSD) and microhardness methods [38,39]. Other authors also observed and mapped the different types of hydrides such as ε-TiH2 and δ-TiH2−x. With the current capability of our laboratory XRD machine and XRD diffraction tomography, it was not possible to obtain such separation, but two populations of crystals of different sizes (130 and 210 nm) were observed. Most possibly, it is a hint to the formation of different kinds of titanium hydrides (TiH2−x) in addition to TiH2. The different crystal sizes were mapped by XRD tomography (Figure 6).
The fraction of smaller crystals decreases much faster when moving along the samples (Figure 7), similar to ε-TiH2 by electrochemical hydrogen loading [39]. The formation of larger δ-TiH2−x hydrides requires a lower hydrogen concentration in comparison with ε-TiH2.
In the present study, the titanium hydrides formed due to the degradation of Mg in comparison with the cathodic polarisation in buffers of tartaric and acetic acids at 37 °C [35]. Further, the titanium hydrides formed a thicker layer, which could be an advantage for the biocompatibility of the titanium part and further accelerate bone healing [35].

5. Conclusions

The degradation of Mg in a hybrid Mg-Ti implant material leads to the penetration of hydrogen into titanium due to a combined effect of electrochemical and gaseous charging. Titanium hydride formation, mapped with synchrotron X-ray diffraction contrast tomography, takes place in a region of 100 µm to 120 µm away from the titanium surface and correlates with the amount of absorbed hydrogen. The porosity value of sintered titanium decreases at the sites of hydride formation due to the volume expansion of hydrides. Titanium hydride crystals show a bimodal size distribution. The formation of a quite thick layer of titanium hydrides is potentially beneficial for further enhancing the biocompatibility of titanium in hybrid materials.

Supplementary Materials

The following supporting information can be downloaded at https://www.mdpi.com/article/10.3390/jcs9080396/s1, Figure S1: GIXRD pattern of initial Ti and after degradation of Mg-0.6Ca. Dashed line peak positions of Ti and solid lines TiH2.; Figure S2: Distribution of mean pore volume vs. distance from centre of rod at different points along length of rod (from edge to middle). Sample before and after degradation of Mg0.6Ca.; Figure S3: Maps of intensity distribution of TiH2 reflections depending on position within the length of the titanium rod after degradation of Mg0.6Ca.; Figure S4: Maps of intensity distribution of TiH2 reflection of the titanium rod [29,40].

Author Contributions

T.E.: design of experiment, reviewing of manuscript; R.W.-R.: interpretation of data, reviewing of manuscript; B.Z.-P.: interpretation of data, reviewing of manuscript; D.C.F.W.: conceptualisation; J.P.M.: methodology; V.M.G., W.L., E.P.S.N. and M.F.: investigation; F.B., L.L., M.S. and C.B.: data curation; V.M.G.: writing—original draft preparation; T.E.: design of experiment, reviewing of manuscript; R.W.-R. and B.Z.-P.: interpretation of data, reviewing of manuscript. All authors have read and agreed to the published version of the manuscript.

Funding

This research received no external funding.

Data Availability Statement

Data are available on request to corresponding author.

Acknowledgments

The authors thank Deutsches Elektronen-Synchrotron PETRA III (DESY, Hamburg, Germany) for granting the proposal I-20220799 (P07 end-station).

Conflicts of Interest

The authors declare no conflicts of interest.

References

  1. Chen, Q.; Thouas, G.A. Metallic implant biomaterials. Mater. Sci. Eng. R Rep. 2015, 87, 1–57. [Google Scholar] [CrossRef]
  2. Geetha, M.; Singh, A.K.; Asokamani, R.; Gogia, A.K. Ti based biomaterials, the ultimate choice for orthopaedic implants—A review. Prog. Mater. Sci. 2009, 54, 397–425. [Google Scholar] [CrossRef]
  3. Zheng, Y.F.; Gu, X.N.; Witte, F. Biodegradable metals. Mater. Sci. Eng. R Rep. 2014, 77, 1–34. [Google Scholar] [CrossRef]
  4. Niinomi, M.; Nakai, M. Titanium-Based Biomaterials for Preventing Stress Shielding between Implant Devices and Bone. Int. J. Biomater. 2011, 2011, 836587. [Google Scholar] [CrossRef]
  5. Tsakiris, V.; Tardei, C.; Clicinschi, F.M. Biodegradable Mg alloys for orthopedic implants—A review. J. Magnes. Alloys 2021, 9, 1884–1905. [Google Scholar] [CrossRef]
  6. Tian, L.; Tang, N.; Ngai, T.; Wu, C.; Ruan, Y.; Huang, L.; Qin, L. Hybrid fracture fixation systems developed for orthopaedic applications: A general review. J. Orthop. Translat. 2019, 16, 1–13. [Google Scholar] [CrossRef]
  7. Tian, L.; Sheng, Y.; Huang, L.; Chow, D.H.; Chau, W.H.; Tang, N.; Ngai, T.; Wu, C.; Lu, J.; Qin, L. An innovative Mg/Ti hybrid fixation system developed for fracture fixation and healing enhancement at load-bearing skeletal site. Biomaterials 2018, 180, 173–183. [Google Scholar] [CrossRef]
  8. Hou, P.; Han, P.; Zhao, C.; Wu, H.; Ni, J.; Zhang, S.; Liu, J.; Zhang, Y.; Xu, H.; Cheng, P.; et al. Accelerating Corrosion of Pure Magnesium Co-implanted with Titanium in Vivo. Sci. Rep. 2017, 7, 41924. [Google Scholar] [CrossRef]
  9. Wang, J.; Bao, Z.; Wu, C.; Zhang, S.; Wang, N.; Wang, Q.; Yi, Z. Progress in partially degradable titanium-magnesium composites used as biomedical implants. Front. Bioeng. Biotechnol. 2022, 10, 996195. [Google Scholar] [CrossRef]
  10. Yang, X.; Huang, W.; Zhan, D.; Ren, D.; Ji, H.; Liu, Z.; Wang, Q.; Zhang, N.; Zhang, Z. Biodegradability and Cytocompatibility of 3D-Printed Mg-Ti Interpenetrating Phase Composites. Front. Bioeng. Biotechnol. 2022, 10, 891632. [Google Scholar] [CrossRef]
  11. Ren, D.; Zhao, K.; Pan, M.; Chang, Y.; Gang, S.; Zhao, D. Ultrasonic spot welding of magnesium alloy to titanium alloy. Scr. Mater. 2017, 126, 58–62. [Google Scholar] [CrossRef]
  12. Murray, J.L. (Ed.) Mg-Ti (Magnesium-Titanium), 2nd ed.; ASM International: Novelty, OH, USA, 1990; Volume 3, pp. 2559–2560. [Google Scholar]
  13. Haramus, V.; Ebel, T.; Ramakrishnegowda, N.; Bußacker, S.; Schaper, J. Method for Producing a Metallic Implant. EP18156257.0, 12 December 2018. [Google Scholar]
  14. Garamus, V.M.; Limberg, W.; Serdechnova, M.; Mei, D.; Lamaka, S.V.; Ebel, T.; Willumeit-Römer, R. Degradation of Titanium Sintered with Magnesium: Effect of Hydrogen Uptake. Metals 2021, 11, 527. [Google Scholar] [CrossRef]
  15. Froes, F.H.; Senkov, O.N.; Qazi, J.I. Hydrogen as a temporary alloying element in titanium alloys: Thermohydrogen processing. Int. Mater. Rev. 2013, 49, 227–245. [Google Scholar] [CrossRef]
  16. Thiry, M.; Moosmann, J.; Hammel, J.; Wilde, F.; Bidola, P.; Beckmann, F. Brilliant Light for Materials Science: Industrial Applications of Synchrotron Radiation Based Microtomography at the Tomography Instruments by GEMS at PETRA III; SPIE: Bellingham, WA, USA, 2021; Volume 11840. [Google Scholar]
  17. Schell, N.; King, A.; Beckmann, F.; Fischer, T.; Müller, M.; Schreyer, A. The High Energy Materials Science Beamline (HEMS) at PETRA III. Mater. Sci. Forum 2013, 772, 57–61. [Google Scholar] [CrossRef]
  18. Moosmann, J.; Ershov, A.; Weinhardt, V.; Baumbach, T.; Prasad, M.S.; LaBonne, C.; Xiao, X.H.; Kashef, J.; Hofmann, R. Time-lapse X-ray phase-contrast microtomography for in vivo imaging and analysis of morphogenesis. Nat. Protoc. 2014, 9, 294–304. [Google Scholar] [CrossRef]
  19. King, A.; Schell, N.; Martins, R.V.; Beckmann, F.; Ruhnau, H.U.; Kiehn, R.; Marrow, T.J.; Ludwig, W.; Schreyer, A. Grain Tracking at the High Energy Materials Science Beamline of the Petra III Synchrotron Radiation Source. Mater. Sci. Forum 2010, 652, 70–73. [Google Scholar] [CrossRef]
  20. Lottermoser, L.; Beckmann, F.; Moosmann, J.; Garamus, V.; Iskhakova, K.; Zeller-Plumhoff, B.; Wieland, F. Parallel Usage of X-Ray Diffraction Contrast Tomography and Micro-Computed Tomography for Multi-Modal Characterization at the HEMS P07 Beamline; SPIE: Bellingham, WA, USA, 2024; Volume 13152. [Google Scholar]
  21. Kieffer, J.; Valls, V.; Blanc, N.; Hennig, C. New tools for calibrating diffraction setups. J. Synchrotron Radiat. 2020, 27, 558–566. [Google Scholar] [CrossRef]
  22. Patterson, A.L. The Scherrer Formula for X-Ray Particle Size Determination. Phys. Rev. 1939, 56, 978–982. [Google Scholar] [CrossRef]
  23. Zhu, T.; Li, M. Lattice variations of Ti-6Al-4V alloy with hydrogen content. Mater. Charact. 2011, 62, 724–729. [Google Scholar] [CrossRef]
  24. Schmidt, P. Optimierung Der Mechanischen Eigenschaften von Beta-Titanlegierungen Durch Die Verwendung von Wasserstoff Als Temporäres Legierungselement; Lehrstuhl für Materialkunde und Werkstoffprüfung, Universität Siegen: Siegen, Germany, 2020. [Google Scholar]
  25. Nelson, H.G.; Williams, D.P.; Stein, J.E. Environmental hydrogen embrittlement of an α-β titanium alloy: Effect of microstructure. Metall. Trans. 1972, 3, 473–479. [Google Scholar] [CrossRef]
  26. Kim, J.; Plancher, E.; Tasan, C.C. Hydrogenation-induced lattice expansion and its effects on hydrogen diffusion and damage in Ti–6Al–4V. Acta Mater. 2020, 188, 686–696. [Google Scholar] [CrossRef]
  27. Tal-Gutelmacher, E.; Eliezer, D. High fugacity hydrogen effects at room temperature in titanium based alloys. J. Alloys Compd. 2005, 404, 613–616. [Google Scholar] [CrossRef]
  28. Liu, Y.; Xiang, W.; Zhang, G.; Wang, B. Surface and phase transformation characteristics of titanium hydride film under irradiation of pulsed ion beam. Appl. Surf. Sci. 2013, 285, 557–563. [Google Scholar] [CrossRef]
  29. Ebel, T.; Ferri, O.M.; Limberg, W.; Oehring, M.; Pyczak, F.; Schimansky, F.P. Metal injection moulding of titanium and titanium-aluminides. In Proceedings of the 1st International Conference on Powder Processing, Consolidation and Metallurgy of Titanium, Brisbane, Australia, 4–7 December 2011; pp. 153–160. [Google Scholar]
  30. Wang, T.; Eichhorn, F.; Grambole, D.; Grötzschel, R.; Herrmann, F.; Kreissig, U.; Möller, W. A new Ti/H phase transformation in the H2+ titanium alloy studied by x-ray diffraction, nuclear reaction analysis, elastic recoil detection analysis and scanning electron microscopy. J. Phys. Condens. Matter. 2002, 14, 11605–11614. [Google Scholar] [CrossRef]
  31. Zhu, Y.; Wook Heo, T.; Rodriguez, J.N.; Weber, P.K.; Shi, R.; Baer, B.J.; Morgado, F.F.; Antonov, S.; Kweon, K.E.; Watkins, E.B.; et al. Hydriding of titanium: Recent trends and perspectives in advanced characterization and multiscale modeling. Curr. Opin. Solid State Mater. Sci. 2022, 26, 101020. [Google Scholar] [CrossRef]
  32. Yan, S.; Song, G.-L.; Li, Z.; Wang, H.; Zheng, D.; Cao, F.; Horynova, M.; Dargusch, M.S.; Zhou, L. A state-of-the-art review on passivation and biofouling of Ti and its alloys in marine environments. J. Mater. Sci. Technol. 2018, 34, 421–435. [Google Scholar] [CrossRef]
  33. Zhang, J.; He, H.; Tang, Y.; Ji, X.; Wang, H. Advanced Materials Prepared via Metallic Reduction Reactions for Electrochemical Energy Storage. Small Methods 2020, 4, 2000613. [Google Scholar] [CrossRef]
  34. Zu, D.; Xu, Z.; Zhang, A.; Wang, H.; Wei, H.; Ou, G.; Huang, K.; Zhang, R.; Li, L.; Hu, S.; et al. Room temperature Mg reduction of TiO2: Formation mechanism and application in photocatalysis. Chem. Commun. 2019, 55, 7675–7678. [Google Scholar] [CrossRef]
  35. Videm, K.; Lamolle, S.; Monjo, M.; Ellingsen, J.E.; Lyngstadaas, S.P.; Haugen, H.J. Hydride formation on titanium surfaces by cathodic polarization. Appl. Surf. Sci. 2008, 255, 3011–3015. [Google Scholar] [CrossRef]
  36. Ariyaratnam, S.V.; Surplice, N.A.; Adem, E.H. Solubility of hydrogen in titanium wires and films at 300-k. J. Mater. Sci. Lett. 1987, 6, 1349–1350. [Google Scholar] [CrossRef]
  37. Lewkowicz, I. Titanium-Hydrogen. Solid State Phenom. 1996, 49–50, 239–280. [Google Scholar] [CrossRef]
  38. Wen, J.; Allain, N.; Fleury, E. Hydrogen evolution and its effects on cold rolling behavior in commercial pure titanium. Mater. Charact. 2016, 121, 139–148. [Google Scholar] [CrossRef]
  39. Liu, S.; Zhang, Z.; Xia, J.; Chen, Y. Effect of Hydrogen Precharging on Mechanical and Electrochemical Properties of Pure Titanium. Adv. Eng. Mater. 2020, 22, 1901182. [Google Scholar] [CrossRef]
  40. Wolff, M.; Schaper, J.; Suckert, M.; Dahms, M.; Feyerabend, F.; Ebel, T.; Willumeit-Römer, R.; Klassen, T. Metal Injection Molding (MIM) of Magnesium and Its Alloys. Metals 2016, 6, 118. [Google Scholar] [CrossRef]
Figure 1. Photos of the Ti-Mg0.6Ca sample after the formation of the Mg-0.6Ca part (a), after sintering of Mg-0.6Ca (b), after degradation of Mg-0.6Ca (c), and the middle parts of Ti in rotation holders (without degradation of Mg0.6Ca—left, and after Mg0.6Ca degradation—right) for the synchrotron experiments (d).
Jcs 09 00396 g001
Figure 2. (a) Concentration of H along the length of the Ti part determined by inert gas fusion (black filled symbol) and deduced from the amount of titanium hydrides as determined by XRD tomography (red empty symbols). The zero point is the edge of the sample. (b) SEM images (back-scattered electron mode) with different magnification for just the sintered Ti part and also after degradation of Mg0.6Ca at the maximum concentration of hydrogen, both for the central region of Ti and at the surface of Ti. The red boxes are the positions of possible TiH2 localisation.
Jcs 09 00396 g002
Figure 3. Mean pore volume vs. distance from centre of Ti rod before and after degradation of Mg0.6Ca.
Jcs 09 00396 g003
Figure 4. Two-dimensional intensity distribution of TiH2 around 40° (200).
Jcs 09 00396 g004aJcs 09 00396 g004b
Figure 5. (Right) Distribution of size TiH2 crystals at different positions within the sample. (Left) Distribution of the peak position of the TiH2 crystals at the different positions along the sample.
Jcs 09 00396 g005
Figure 6. Mapping of large crystals (210 nm, violet) and small crystals (130 nm, green), depending on their position within the length of the samples.
Jcs 09 00396 g006
Figure 7. Ratio between small hydride and large hydride along sample length.
Jcs 09 00396 g007
Disclaimer/Publisher’s Note: The statements, opinions and data contained in all publications are solely those of the individual author(s) and contributor(s) and not of MDPI and/or the editor(s). MDPI and/or the editor(s) disclaim responsibility for any injury to people or property resulting from any ideas, methods, instructions or products referred to in the content.

