Article

Advancing Sustainability in Aerospace: Evaluating the Performance of Recycled Carbon Fibre Composites in Aircraft Wing Spar Design

by
Naomi Bouman
1,2,
Sofia Salles Lantyer Marques
1,
Naiara Poli Veneziani Sebbe
3,
Antoine Gerritse
2,
Heide Heloise Bernardi
1,
William Marcos Muniz Menezes
1,
Francisco José Gomes da Silva
3,4,
Jorge Tadao Matsushima
1,
Lucas Giovanetti
1 and
Rita de Cássia Mendonça Sales-Contini
1,3,*
1
Technologycal College, São José dos Campos Professor Jessen Vidal Centro Paula Souza, Av Cesare Mansueto Giulio Lattes, 1350 Distrito Eugênio de Melo, São José dos Campos 12247-014, SP, Brazil
2
Inholland University of Applied Science, Rotterdamseweg 141, 2628 AL Delft, The Netherlands
3
CIDEM-ISEP, School of Engineering Polytechnic of Porto, Rua Dr António Bernardino de Almeida 431, 4249-015 Porto, Portugal
4
INEGI Instituto de Ciência e Inovação em Engenharia Mecânica e Engenharia Industrial, Rua Dr. Roberto Frias, 400, 4200-465 Porto, Portugal
*
Author to whom correspondence should be addressed.
J. Compos. Sci. 2025, 9(8), 384; https://doi.org/10.3390/jcs9080384
Submission received: 19 April 2025 / Revised: 12 July 2025 / Accepted: 14 July 2025 / Published: 22 July 2025

Abstract

The aerospace industry is increasingly turning to composite materials due to their exceptional strength, stiffness, and beneficial physical properties. However, increased reliance on carbon fibre composites has substantial environmental implications, particularly concerning waste management. Recycling these materials is a potential solution to these sustainability issues, provided the recycled fibres retain adequate mechanical strength and durability. This study evaluates the mechanical capabilities of recycled carbon fibres in a scaled-down aircraft spar model (AMT-600 GURI), contrasting them with the capabilities of conventional spars. The primary objective is to ascertain whether recycled composites can fulfil the stringent structural requirements of aerospace applications, employing both simulation and experimental validation methods. The recycled carbon fibre composites were manufactured using hand lay-up and vacuum bagging techniques, and their properties were validated through rigorous tensile and compressive strength testing. These validated results were then used to inform a finite element model developed in HyperWorks software. Simulations revealed that the recycled spar achieved maximum stress values of 3.87 MPa under lift forces, a slight increase of +8.95% compared to the original spar, and 55.05 MPa under drag forces, a significant improvement of +36%. Aerodynamic evaluations further confirmed the structural resilience of the recycled spar, with displacement measurements of 141.4 mm for lift and 504.8 mm for drag, closely aligning with the original spar’s performance. In summary, this study demonstrates that recycled carbon fibre composites can serve as effective substitutes for traditional aerospace materials, thereby supporting sustainability initiatives without compromising performance. The outlined approach provides a reliable framework for incorporating recycled materials.

1. Introduction

The aerospace industry is always looking for ways to improve and enhance the performance of commercial and military aircraft [1]. This urge for improvement has led to a desire for the development of improved high-performance structural materials, such as composite materials [2]. Composite materials are still an area that requires significant study and development; however, the advantages of using these materials have already been observed and analysed due to their exceptional resistance, specific stiffness–density relationships, and superior physical properties [3].
In this aspect, carbon fibre is increasingly used [4,5]. However, using this material also causes an increase in the amount of waste eliminated, making it not sustainable from this point of view [6]. Therefore, the use of recycled carbon fibre can be advantageous when it comes to costs and benefits to the environment, in other words, sustainability [7]. Recycling generally reduces waste and prevents materials from ending up in landfills, aligning with sustainability goals. However, the use of composite materials in the aeronautical sector presents several challenges, including structural performance, material lifecycle, and economic viability.
Pakdel et al. [8] observed that recycling CFRCs (Carbon Fibre-Reinforced Composites) can significantly lower the overall environmental impacts compared to producing virgin materials. They observed that methods like pyrolysis and microwave pyrolysis, despite higher initial costs, can yield better quality fibres and materials, which can be more economically beneficial in the long run, being a significant factor in their economic viability. The recycling of carbon fibre products is crucial for establishing a circular economy. It not only helps in managing waste but also promotes the reuse of materials, thereby reducing the demand for virgin resources. This is particularly important as the industry moves towards more sustainable practices.
Some authors have used different processes to recycle carbon fibre, such as mechanical, chemical, and thermal. The right choice of recycling process can offer economic and environmental benefits as well as positive implications for sustainability.
Vogiantzi et al. [9] analysed the Life Cycle Assessment and Environmental Life Cycle Costing analysis of four key recycling techniques: mechanical recycling, pyrolysis, solvolysis, and high-voltage fragmentation (HVF). They observed that the recycling of carbon fibres offers economic and environmental benefits as well as positive implications for sustainability. In their studies, they found that mechanical recycling is the most cost-effective option, with an operational cost of 0.106 EUR/kg for CFRP waste. However, to recover high-quality fibres suitable for more valuable applications, the best recycling methods are solvolysis and pyrolysis, which entail higher costs (50.9 EUR/kg and 4.66 EUR/kg, respectively), but the investment is justifiable if the mechanical properties of the recycled fibres meet specific needs. In the end, they observed that mechanical recycling and high-voltage fragmentation exhibit the lowest cumulative energy demand (CED) and global warming potential (GWP), making them the more sustainable options. Recycling carbon fibres and reusing them contribute to a circular economy, reducing reliance on virgin materials and minimising environmental impact. Improving the scalability and efficiency of these techniques could further enhance their economic and environmental viability.
Yu [10] indicated that solvent-assisted chemical recycling has a low capital investment and low operational costs. By optimising processing conditions, such as reducing catalyst content and lowering temperatures, costs can be substantially reduced, improving the benefit–cost ratio. This method contributes to higher recovery rates of valuable components like carbon fibres and resin, leading to significant net environmental savings. The integration of life cycle analysis and cost analysis in assessing recycling methods ensures a comprehensive understanding of their impacts, enabling better decision-making aligned with the sustainable development principle.
Using mechanical processes, Bao et al. [11] recycled prepreg cut-offs being discarded during cutting processes. They used to prepare carbon tape (CT) mechanical process (cutting) combined with ultrasonic vibrations to prepare the new composite by adding thermoplastic resin. The layers of recycled CT-reinforced composite with a thermoplastic were moulded in a spherical dome to prove its usability.
Ireza et al. [12] used cured waste carbon fibre prepregs and recycled polypropylene to produce a new carbon fibre composite using 3D manufacturing. This new composite was developed for use in automotive structures with impact resistance characteristics. From mechanical characterisations, the new recycled composite was more impact-resistant than the neat matrix.
Altay et al. [13] used a high-speed thermo-kinetic mixer to chop the carbon fibre/PP composites, ultrasonic, pulsed laser, and others. Cheng et al. used a thermal-activated oxide semiconductor process to oxidise the resin macromolecular chains, collapse into small molecular chains resulting in H2O and CO2 production, and free the carbon fibre to be used in another application. Using an extrusion process followed by additive manufacturing, a new composite was produced and tested. They observed that the mechanical properties of PP added with recycled carbon fibre increased, but the results were not compared with those without being subjected to the recycling process.
Li et al. [14] used the nanosecond pulsed laser to recycle a carbon fibre/epoxy resin prepreg. They observed that the process can cause micro-damage to the carbon fibres during the oxidation stage, such as etching, micro-cracks, and micropores.
One of the most popular processes used to recycle carbon fibre is ‘pyrolysis’ [15,16]. During the pyrolysis, the fibres are recovered [17]. Pyrolysis is a relatively easy process, making recycling cost-efficient. In pyrolysis, the composite is heated to temperatures ranging from 400 °C to 500 °C in the absence of oxygen, producing a clean carbon fibre that retains 90% to 95% of its original properties. Furthermore, recycled carbon fibres maintain the benefits of their weight, strength, and durability [18]. Another aspect that should be highlighted is that the carbon fibre recycling process has lower costs compared to the manufacturing process of carbon fibre [19,20]. The difficulties that arise when using recycled carbon fibres are that it is more difficult to handle than carbon fibres, there is a variety in fibre lengths, and the material’s variable nature [21]. In summary, the performance of recycled composite materials is highly influenced by the chosen recycling method, since each technique alters the properties of the recovered fibres and impacts the overall cost of the final product.
Some authors focused their studies on the manufacturing parts in the aeronautical industry; however, there is a gap in the literature regarding the use of recycled carbon fibres. In the work of Fleuret et al. [22], a methodology was presented to design a spar with complex geometry and varying thicknesses for the E-FAN 1.0 aircraft. Numerical simulations were developed to correlate with experimental data, with the complete sizing of the spar being validated by quasi-static tensile tests. In turn, Yokozeki et al. [23] developed the prototype of a variable geometry morphing airfoil using corrugated structures, made of plastics reinforced with carbon fibre. The authors verified that the successful performance of the prototype wing occurs at air speeds of up to 30 m/s, where there is an increase in lift of the variable corrugated wing compared to the traditional wing when increasing the aileron angle.
On the other hand, when considering polymer sandwich structures reinforced with carbon fibre, used in several components of modern aircraft, Sugiyama et al. [24], using a continuous 3D carbon fibre printer to manufacture these structures with honeycomb shapes, rhombus, rectangle, and circular cores, verified the production viability through 3D printing with flexibility and satisfying the desired strength and stiffness.
In previous studies, Sales-Contini et al. [25] used the pyrolysis process to obtain recycled carbon fibre from cured prepregs wasted by the aeronautical industry. The results showed that the parameters chosen for the pyrolysis process preserved the integrity of the fibre, enabling its use in new applications. Following this line, this work aims to apply the recycled carbon fibres obtained by the pyrolysis process to test the feasibility of building a wing spar for a reduced-size remotely controlled aircraft based on the AMT-600 Guri aircraft design using recycled carbon fibre. In the first stage of the process, the data from the original AMT-600 Guri composite spar was used to simulate the force acting on the original wing. The results were used to create a model as realistic as possible. After this, test specimens and the spar prototype were obtained by additive manufacturing using ABS filament (Acrylonitrile–Butadiene–Styrene), a common thermoplastic material. The specimens and the spar were mechanically tested, and the results were used to feed the model developed using the HyperWorks software (version 2022). After all the checks and the model validation, the recycled carbon fibre spar was produced using the hand lay-up and vacuum bag technique. The recycled carbon fibre composite spar was tested, and the results were compared with those simulated for the original composite spar from AMT-600 Guri.
This article outlines the complete development process of a product crafted from recycled fibre, which has achieved a Technology Readiness Level of 4, indicating the validation of components and/or breadboards in a laboratory setting. Initially, the concept for the wing spar project was formulated, followed by the creation of a simulation model that was informed by the outcomes of experimental tests on specimens for model validation. Subsequently, a prototype was designed, produced, and evaluated, with the results serving as critical input for further model validation. Lastly, a prototype utilising recycled fibre was developed, manufactured, and put through experimental testing. The data from these recycled fibre prototype tests were then used to refine the simulation model, enabling the validation of the product and facilitating a comparison of its performance with the original composite spar. Although the focus of this work is on validating structural performance through simulations and experimental tests, future studies are required to assess material fatigue, resistance to environmental exposure, and conduct a cost–benefit analysis for large-scale manufacturing applications.

2. Materials and Methods

The following section describes the methodology employed to detail the development of a recycled carbon fibre spar based on the AMT-600 Guri spar. Data from the original composite spar were used to simulate the pressure distribution obtained on the AMT-600 GURI wing, creating a model as realistic as possible in HyperWorks software (version 2022). Then, the ABS spar and the ABS specimens were manufactured using 3D printing. The spar and specimens were then utilised to test and validate the model developed in HyperMesh. Following this, the pyrolysis process of the F593 prepreg is carried out. A sheet of the recycled carbon fibre fabric was characterised by SEM (Scanning Electron Microscopy) using a VEGA3 XMU TESCAN microscope (Brno–Kohoutovice, Czech Republic) to verify that the fibre’s surface was free from degradation and to perform the necessary measurements of the woven plain weave unit cell dimension to inform the model. Upon validating the model, the recycled composite spar was manufactured using recycled carbon fibre through a combined process: hand layup and vacuum bag technique. Both spars, ABS and recycled carbon fibre, were mechanically tested to collect information about stress, strain, and Young’s modulus for drag and lift, which was then compared with those obtained from the original composite spar. This section presents the materials and methods employed to develop this project.

2.1. Wind Tunnel Simulation to Predict the Forces on the Original Composite Spar

The AMT-600 Guri is a single-engine, low-wing cantilever aircraft that is manufactured in Brazil. Developed by Aeromot, a Brazilian manufacturer based in Rio Grande do Sul, it is used for training and primary pilot instruction. The cabin has two side-by-side seats and a longitudinal ‘canopy’ that opens from front to back. It also features a ‘T’ empennage and fixed tricycle landing gear. It is equipped with a Lycoming O-235 N2C or O-235 NBR (Brazilian version) single-aspiration reciprocating engine and fixed-pitch propeller [26].
In order to understand the deformation, tensile and stress values on the wing structure of the AMT-600 Guri during flight, a wind tunnel simulation was carried out on the wing. This structure has an NACA 64(3)-618 wing profile. The wind tunnel simulation was performed using data from the manufacturer, Aeromot [26], shown in Table 1.
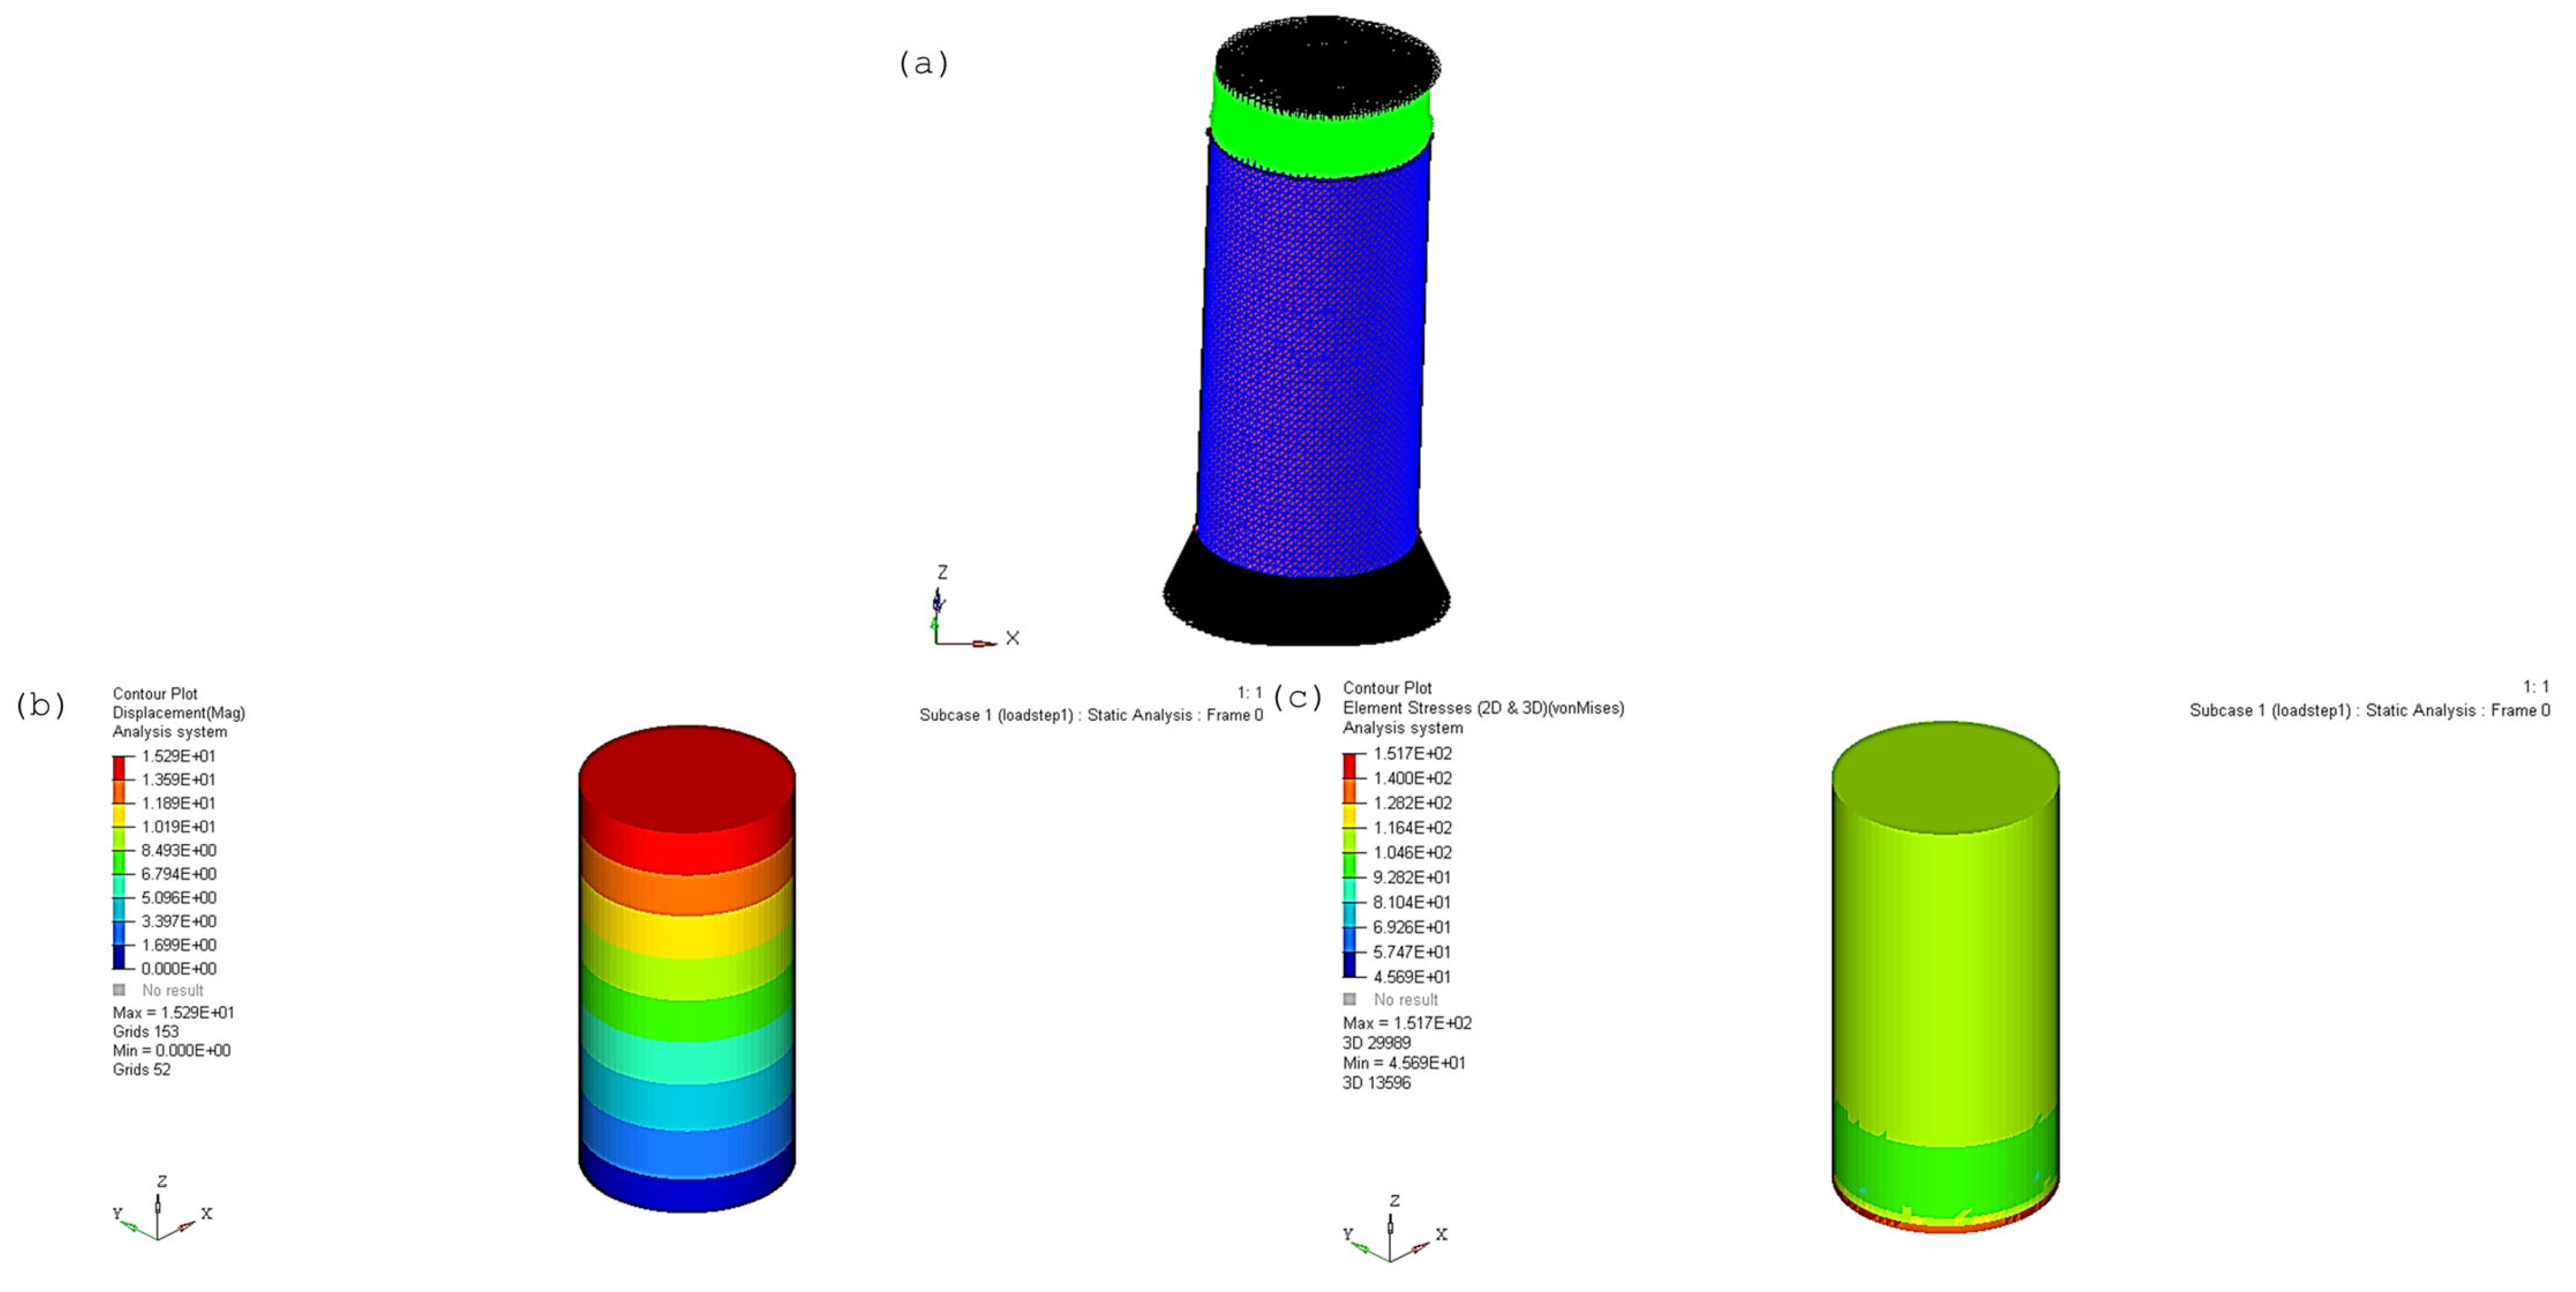
To assess the structural behaviour of the original composite spar under aerodynamic loads, the pressure distribution obtained from the wind tunnel simulation was used as input in Altair HyperWorks software (version 2022). Initially, a finite element (FE) model of the AMT-600 GURI wing was developed using HyperMesh, the pre-processing tool within the HyperWorks software (version 2022). This involved importing the wing geometry and generating a refined mesh (as shown in Figure 1), ensuring adequate resolution in critical areas, such as the spar region.
Since the results from the wind tunnel simulation indicated an approximately uniform pressure distribution over the wing surface (Figure 1b,c), a simplified loading condition was adopted for the structural analysis. This simplification enabled the application of a uniform pressure load over the wing skin elements, replicating the aerodynamic forces obtained under the flight condition defined in Table 2, which included a temperature of 298.15 K, pressure of 101,325 Pa, air density of 1.184 kg/m3, a total airspeed of 69.444 m/s, and an angle of attack of 12°.
The mesh was then exported to OptiStruct, the solver used in HyperWorks software (version 2022) for linear quasi-static analysis. In the simulation setup, the OptiStruct solver was configured to perform a linear quasi-static analysis using a material model corresponding to an orthotropic laminated composite, representative of the spar material. The model employed 2D shell elements to represent both the wing skin and the spar, with an average element size of 10 mm. Refinement was applied in regions of high stress concentration, particularly near the wing root.
The aerodynamic load was applied as a uniform surface pressure of approximately 5500 Pa, acting perpendicularly on the wing skin elements. Boundary conditions were applied based on experimental data and prior virtual wind tunnel simulations. The simulated forces on the aircraft wing (AMT-600 GURI) were realistically distributed over the spar structure using force cards (FORCE) and pressure cards (PLOAD4), in accordance with the expected behaviour for drag and lift force scenarios. The boundary conditions replicated a cantilevered wing configuration, with all degrees of freedom fixed at the wing root and the wingtip left free.
In the early stages of aerospace design, quasi-static analysis is typically employed as an initial validation strategy. This was crucial in the study of the mechanical capabilities of recycled carbon fibres within a scaled-down aircraft spar model. This analysis enabled a clear and direct evaluation of the structural integrity under expected loads, which is essential for preliminary design approval.
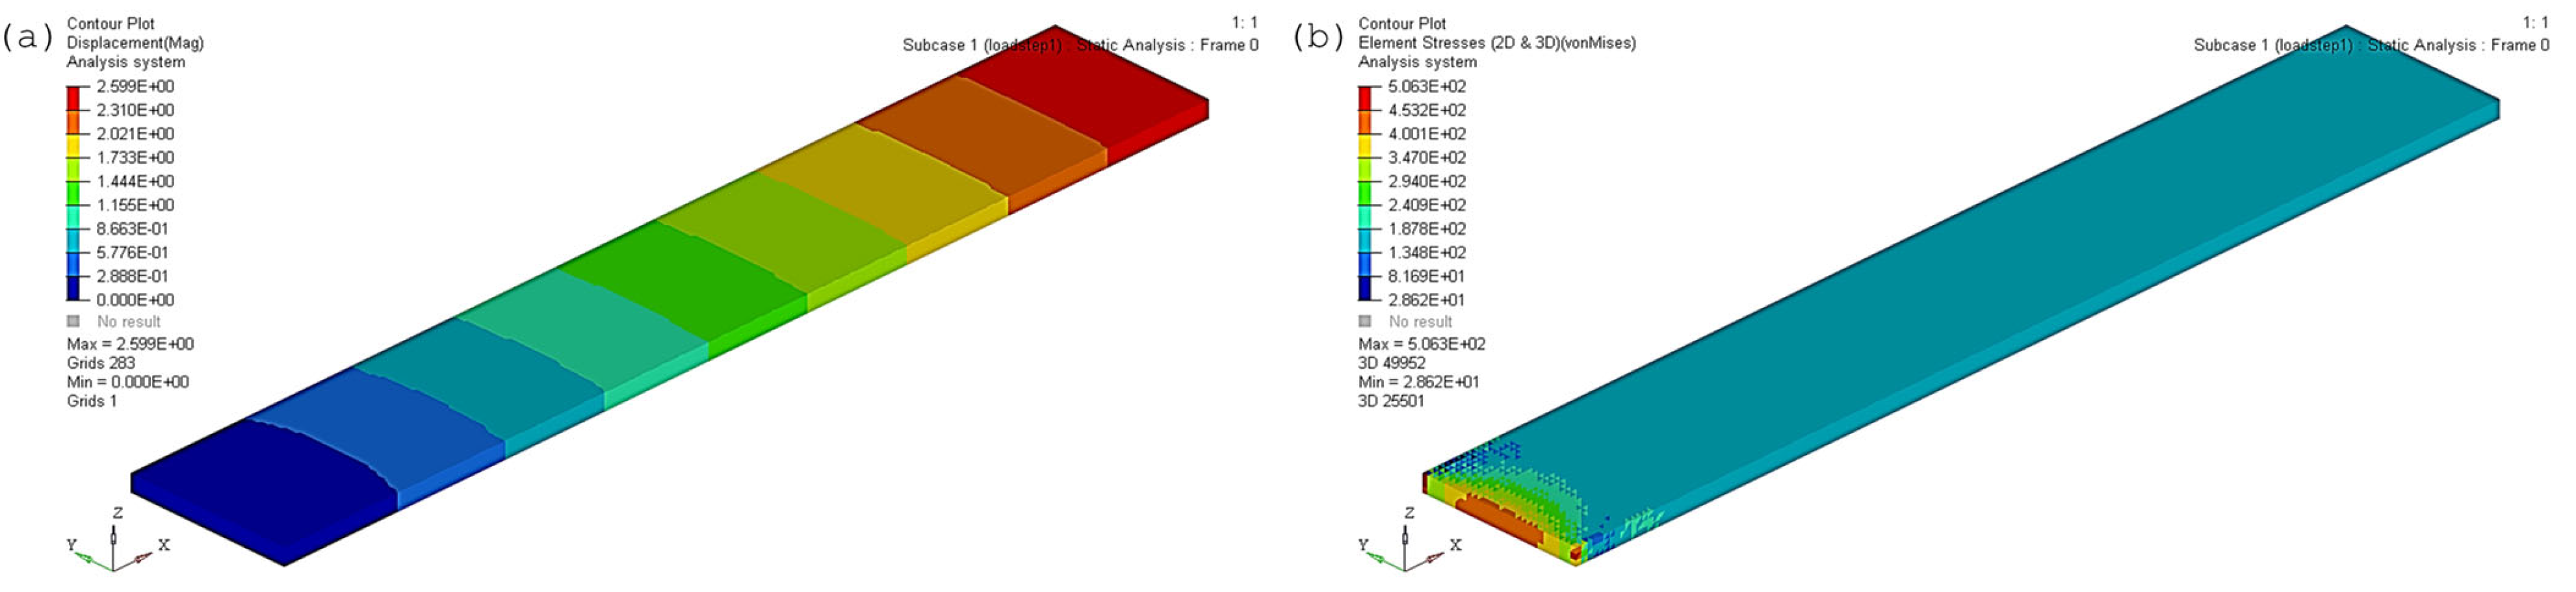
In this simulation, quasi-static structural analysis was employed, yielding outputs such as von Mises stress, displacements, strain energy, and reaction forces at the fixed nodes. The main purpose of the analysis was to examine the stress distribution and deformation of the spar under load, with a particular focus on its structural integrity and load-bearing capacity. As the spar is a key structural component of the wing, the analysis aimed to confirm that it could withstand aerodynamic forces without exceeding the material’s strength limits or displaying any signs of failure.

2.2. Preparation of Specimens and ABS Spar Using Additive Manufacturing

In this work, the 3D printing process was only used to produce the samples and the wing spar prototype in a short time and at a low cost. The 3D printing process is not the usual manufacturing process used to produce the wing spar of the AMT-600 Guri aircraft. Typically, the manufacturing process of an aircraft is a combination of two or more composite manufacturing processes: prepreg technology, hand laminating, vacuum bagging, and autoclaving. The AMT-600 Guri is a fixed-wing aerobatic aircraft, so most of its structure is made of composite materials (Figure 2).
Therefore, the 3D printing process was chosen to simplify and reduce costs and to quickly produce the test specimens and develop the prototypes for this project. To validate the simulation model of the spar in the HyperMesh software, the results of the mechanical tests on the samples and the prototype would be required. As time is a critical factor in technological development, additive manufacturing (FDM—Fusion Deposition Modelling) was chosen to produce the ABS samples and the ABS spar.
The filament used for 3D printing was Acrylonitrile–Butadiene–Styrene (ABS) from Filaments 3D, Novo Hamburgo, Rio Grande do Sul, Brazil. ABS is an amorphous polymer, economically viable, and easy to handle. It possesses specific properties, including good resistance to impact, traction, and abrasion, as well as excellent heat resistance and flexibility, making it widely used in industrial applications and mechanical parts. Table 3 presents the physical and mechanical properties of the filament used, while Table 4 displays the printing parameters as specified by the manufacturer.
The 3D printer that was used was the Sethi3D AiP (Campinas, São Paulo, Brazil), and the designs were made in CATIA-V5. Initially, all specimens were printed in ABS, a total of fifteen specimens, five specimens for each test: tensile, compression, and flexural, following the ASTM standards: D638-14 [28], D695-15 [29], and D790-10 [30], respectively. In addition, nine spars were developed, also in ABS, and the exact dimensions of the parts were created in CATIA software (version V5-6R2022, Dassault Systèmes, Paris, France). A thickness of 0.2 mm was used for the layers and rectilinear geometry, with a total density of 100%.
Furthermore, the 3D printer needs G-codes to be able to create a part, such as layer height, retraction speed, printer speed, and nozzle temperature. The information entered in the G codes used for the flexural, tensile, and compression specimens is presented in Table 5.
Since the spar has a larger dimension than the specimens and a larger dimension than the base of the 3D printer (220 mm × 210 mm × 200 mm), the spar had to be divided into three parts. After the three parts have been printed, they are glued together by a small chemical process using acetone (Figure 3). When acetone was added to ABS, it caused some of the bonds of the molecule of ABS to break and reform. This process allowed two parts of ABS to form new bonds, while their bonds were broken down first. Since there was almost nothing known about using the technique of ‘gluing’ parts made from ABS together using acetone, it was necessary to validate this technique. As reported by Dizo [31], chemical reagents’ vapour can dissolve the secondary bonds of the 3D printing specimens’ surface, because ABS is soluble in many compounds: esters, chloroform, ethylene dichloride, and certain ketones, including acetone. When ABS is exposed to acetone vapours, it softens and melts slightly, forming a thin liquid layer on the surface, allowing the specimen parts to be bonded together.
For the validation of the junction, a mechanical shear test was set up based on the standard ASTM D5868-01 [32]. This test was performed on specimens that were ‘glued’ together using acetone and specimens that were printed together right away. In this way, a comparison between a 3D-printed connection and an acetone-formed connection could be made. To carry out the test, it was necessary to follow all the parameters demanded by the ASTM standard, shown in Table 6. Six specimens of each type were manufactured: printed junction and glued junction.

2.3. Mechanical Tests of Specimens

Mechanical tests for tensile, compression, and flexural for ABS specimens were performed following the standards ASTM D638-14 [27], ASTM D695-15 [28], and ASTM D790-10 [29], respectively. The tensile and compressive mechanical tests on Recycled Carbon Fibre-Reinforced Composite (rCFRC) specimens were prepared following the standards outlined in ASTM D3039 [33] and ASTM D3410 [34]. The outcomes of these tests, which have been utilised in the present study, were published by Sales-Contini et al. [25]. For mechanical testing, five specimens of each configuration were tested using a universal mechanical testing machine and a load cell of 100 kN (Time Group, Beijing, China). The test is performed at a speed of 1 mm/min.

2.4. Simulation Using HyperMesh Software

The processing workflow in HyperMesh followed a structured sequence of steps. First, the three-dimensional geometries of the spars, originally developed in CATIA software (version V5-6R2022, Dassault Systèmes, Paris, France), were imported into HyperMesh in a compatible format (STEP) and underwent a geometry cleanup process to correct imperfections such as loose edges, open surfaces, and duplications. This step ensured model integrity before mesh generation.
Regarding mesh definition, the 2D mesh primarily consisted of quadrilateral elements (quads), with quadrilateral shell elements of the CQUAD4 type mainly used for the polymer (ABS) structures. These meshes were progressively refined in critical regions to accurately capture stress concentrations and localised deformations. The 3D mesh employed a mixed element type combining pyramids and quadrilaterals, with a mesh size of 1.2 mm. Additionally, depending on the setup, triangular shell elements (CTRIA3) and tetrahedral solid elements (CTETRA) were used as needed to better represent geometric details and structural behaviour.
For composite models, a detailed ply-based modelling approach was adopted. Layers (plies) were defined using the PCOMPP, STACK, and PLY cards, enabling precise incorporation of orthotropic material properties (using MAT8), thickness, fibre orientation, and stacking sequence, closely aligned with the manufacturing process.
Mesh generation was performed with strict element quality control, using metrics such as aspect ratio, skewness, and Jacobian, focusing on ensuring stable and reliable simulation results. Wherever possible, a structured (mapped) mesh was applied, especially in flat and regular regions, while a free mesh with local refinement was used in more complex geometries.
Once the model definition was completed, it was exported to the OptiStruct solver, part of the same HyperWorks software (version 2022) suite, where the analyses were performed. Simulation results—displacements, stresses, and strains—were then evaluated using the HyperView post-processor. For composite models, the Hill failure criterion, suitable for orthotropic materials, was employed to more accurately assess strength and failure mode under multiaxial stresses. The Hill criterion is notable for requiring fewer parameters and for adopting a more conservative approach under certain types of loading. This makes it a practical and reliable choice for this stage of the analysis.

2.5. Composite Recycling Process and Recycled Composite Spar Manufacturing Process

A study was carried out to produce the recycled composite spar. There are multiple reasons to choose the use of recycled carbon fibres. The two main reasons for this decision are the environment and costs. With the increased use of carbon fibre composites in the aircraft industry, there has also been an increase in the amount of waste carbon fibre generated, which is not sustainable. The fibre direction was analysed for better performance.
The carbon fibres used were from HexPly® F593 prepreg (Hexcel®, Stamford, CT, USA) (epoxy resin reinforced with carbon fibre woven plain weave Toray T300/3 k) (38–46% resin content) [35]. The pyrolysis process used was the same as that described by Sales-Contini et al. [25]. The prepreg was thermally treated at 500 ± 10 °C for 4 h in an argon atmosphere (99.999% purity, White Martins, Rio De Janeiro, Brazil) using an INFORGEL Mod. GTI 13.000W oven (São José dos Campos, São Paulo, Brazil) (maximum temperature 1200 °C).
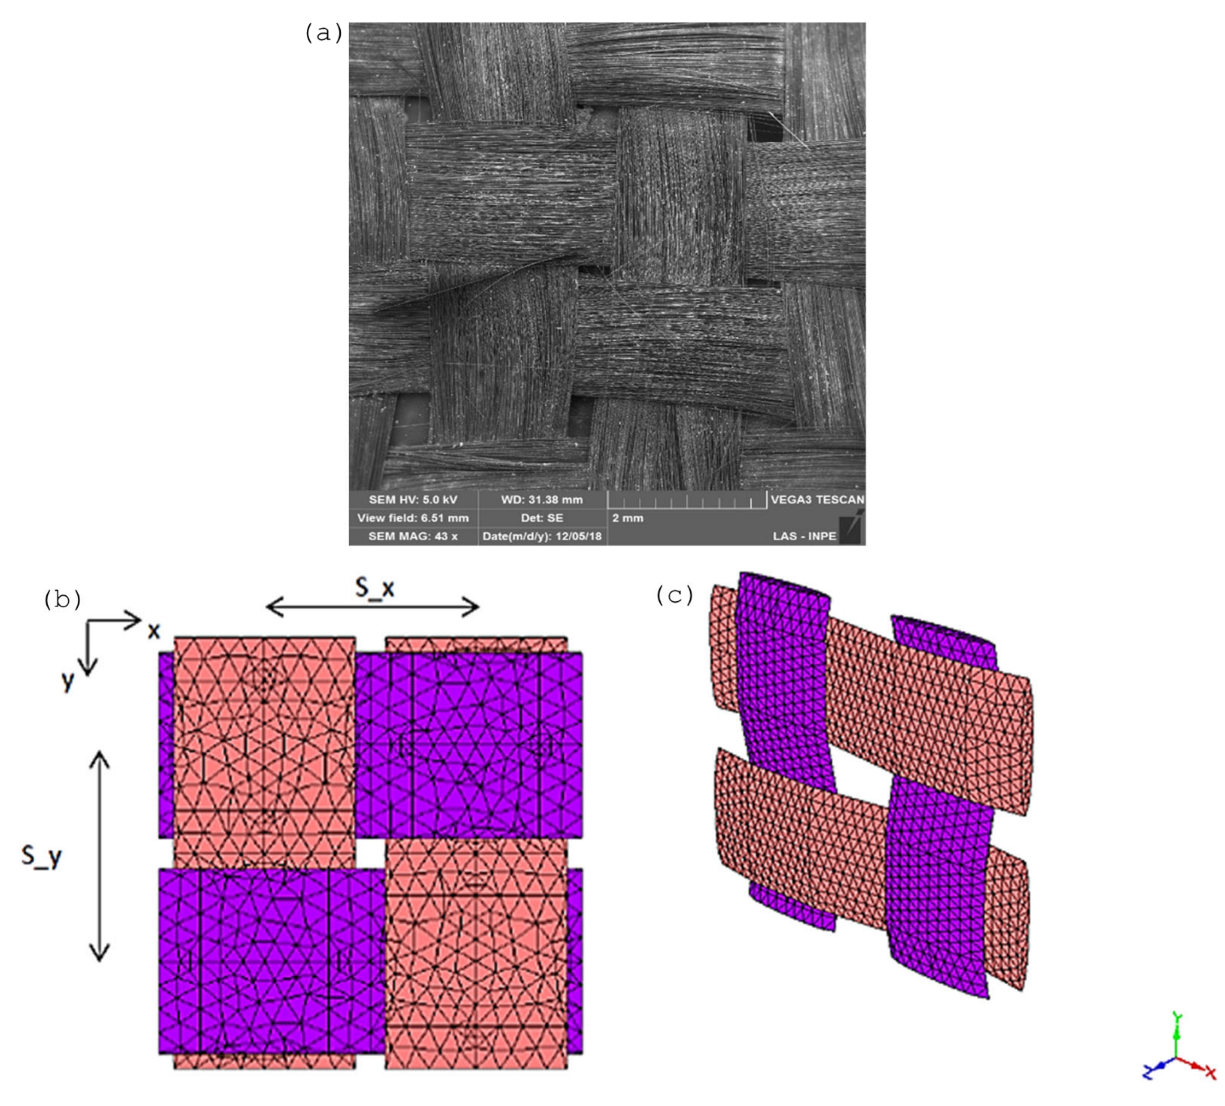
A piece of this recycled carbon fibre was measured by SEM (Scanning Electron Microscopy) using a VEGA3 XMU TESCAN microscope (Brno–Kohoutovice, Czech Republic). The images were obtained by fractographic analysis of secondary electrons, with acceleration energy between 5 and 10 keV, beam intensity of 9–10, and working distance of 14–16 mm, using secondary electrons. This way, it was possible to define the geometric attributes, as seen in Table 7. Figure 4a illustrates the recycled carbon fibre used.
Before the recycled composite spar manufacturing process, it was necessary to know and define its micromechanical structure. To create an image of the micromechanical structure of recycled carbon fibres, the Multiscale Designer programme was used.
Thus, the material that was used could be defined as a woven, but more specifically, a plain weave. In the woven plain weave unit cell model in Multiscale Designer, five parameters were required to be defined. The cross-section of each was considered an ellipse. The xy plane was the plane of the weave, with the z direction as the thickness direction. Different spacing values between two in each of the two directions in the plane were specified.
Figure 4b illustrates the geometric attributes of the Multiscale Designer, and Figure 4c illustrates the Multiscale Designer programme according to the attributes obtained. The model shows relatively small fibres and a relatively large spacing. This can be explained since the process of pyrolysis can result in a matrix and sizing degradation that affect the volume and material performance [25]. According to Fernandez et al. [36], the pyrolysed prepreg F593 presents a decrease of 10% in its elastic modulus and 30% in its tensile strength and a relative reduction in fibre diameter of 12%, indicating that heat treatment affects the fibre diameter attributed to the removal of the amorphous carbon layer resulting from the thermal treatment.
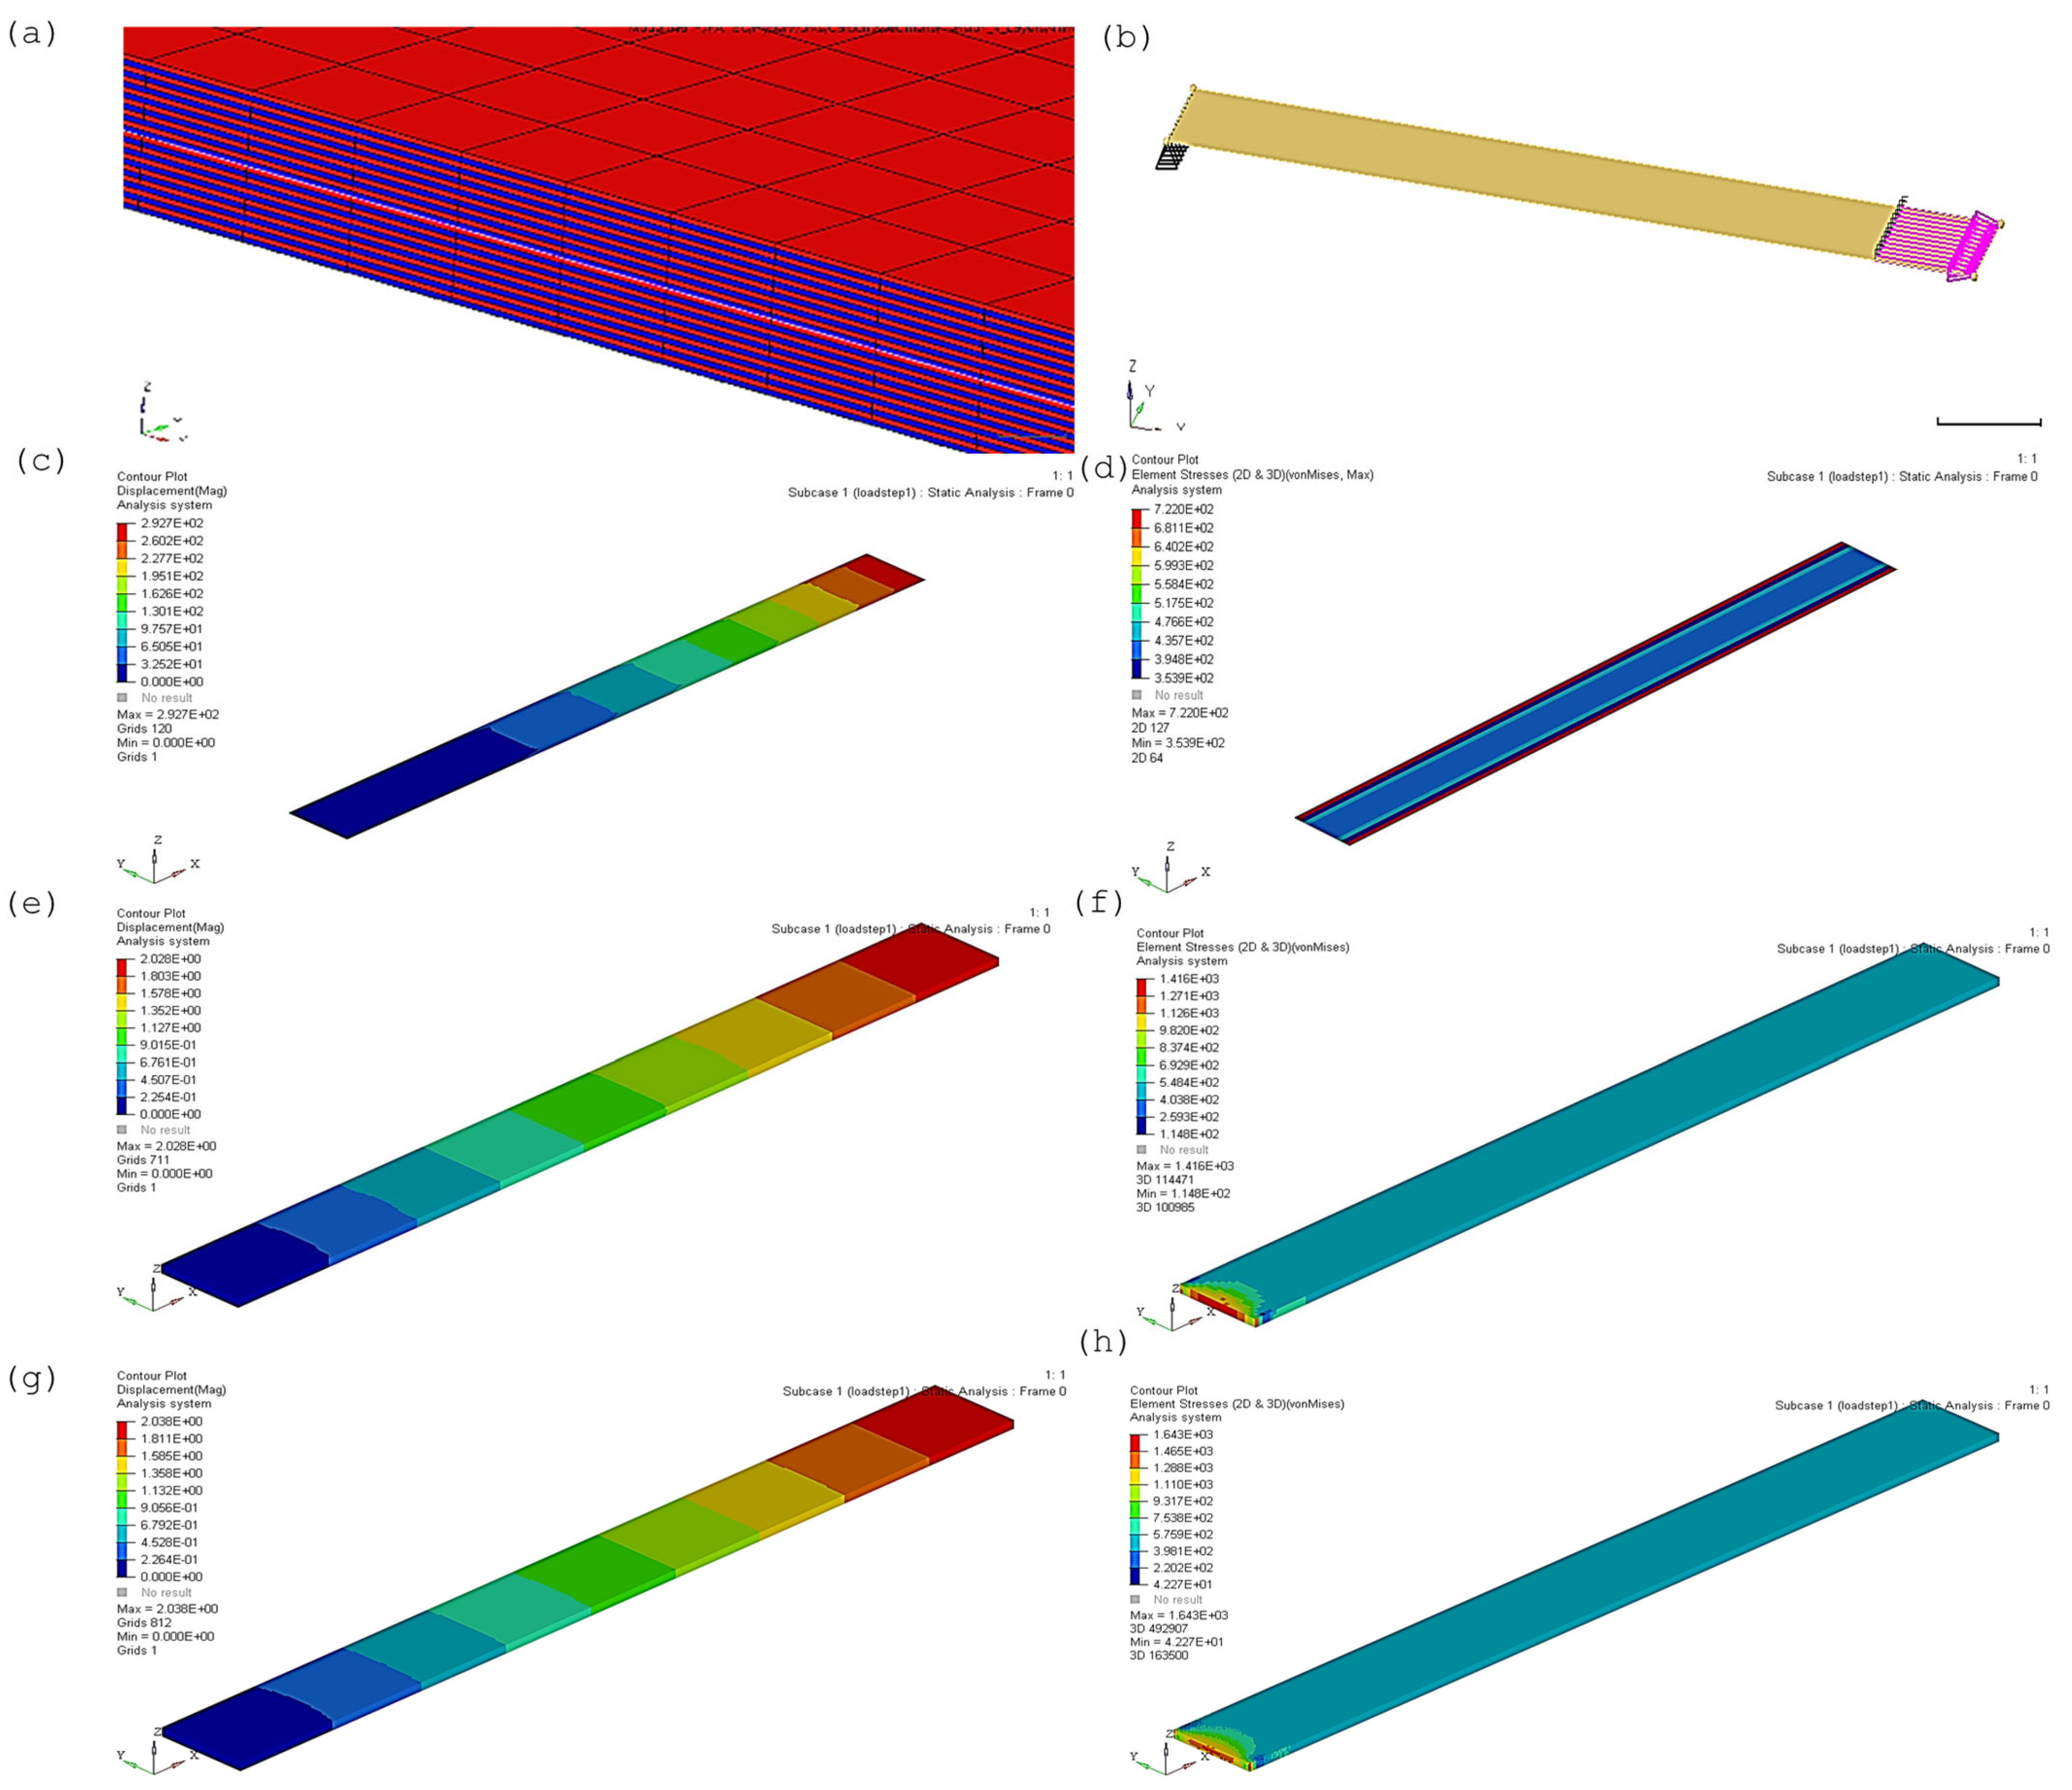
The production of the spar using composite material, which consists of recycled carbon fibre and epoxy resin, was carried out via a hand layup process with a multi-layered approach. The spar’s form was achieved using hand layup and vacuum bagging methods. Every layer of recycled carbon fibre, combined with the Araldite LY 5052 resin system and Aradur 5052 hardener (both from HuntsmanTM, Basel, Switzerland), mixed in a weight ratio of 100:38 parts, had a thickness of 0.190 mm.
The layers’ lamination followed the stacking sequences in the sets of symmetrical laminates that make up the product matrix, as it was possible to manufacture the composite using different directions of recycled carbon fibre, it was necessary to use HyperWorks software (version 2022) to simulate the forces on the spar and decide which would be the best fibre direction. From the analysis, it was possible to observe two directions with excellent results using the HyperWorks software (version 2022). Therefore, a more detailed analysis of these two directions had to be carried out to decide which one has the best quality and ideal results. From this, it was verified that when the fibre was placed in the 45°/−45° direction selected for the spar manufacture. The motivation for choosing this fibre direction is that the fibre direction of the original composite spar is 45°/−45°.

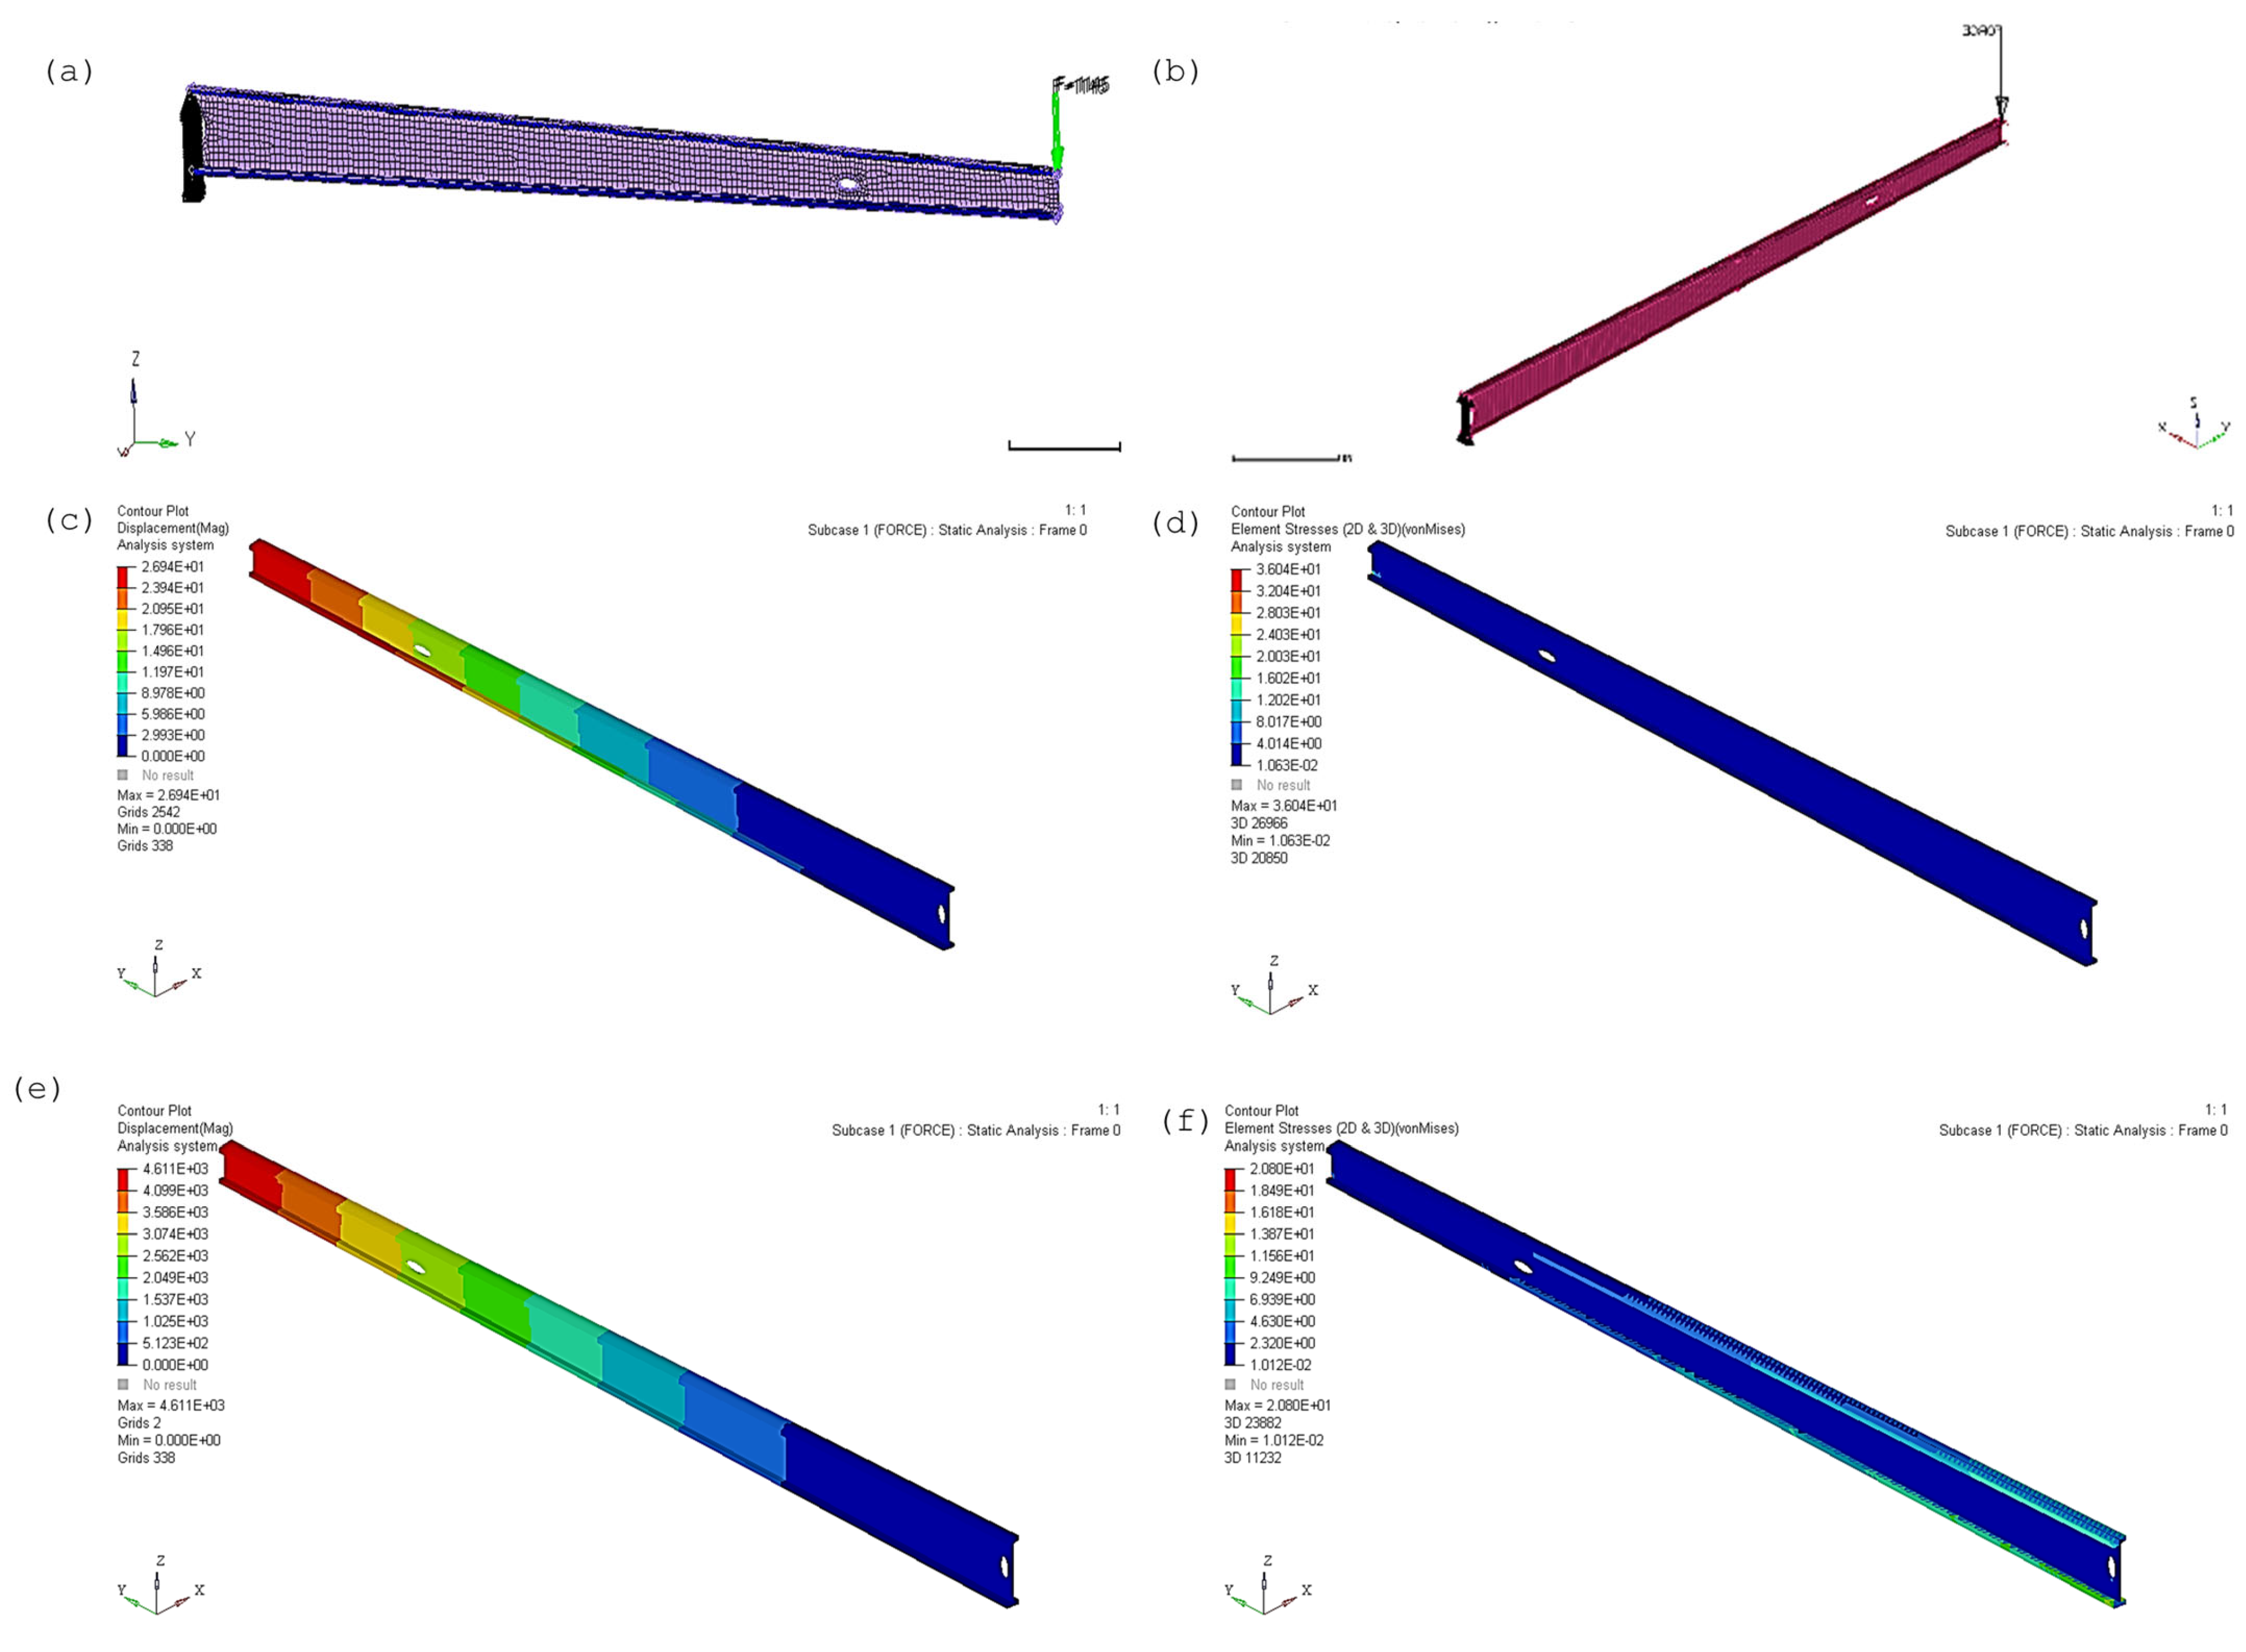
2.6. Spar Mechanical Test

The method used was the same for both spars. A support was developed for this model, as illustrated in Figure 5.
The method used a fixed clamp at one end of the spar, supported by counterweights to keep the clamp in its position. A steel rope and a hook were attached to the other end of the spar. In this hook, weights were connected to create a force acting on the spar. Sandbags weighing 0.25 kg, 0.5 kg, 1 kg, and 5 kg were made. These sandbags created enough force on the spar for the test to be effective. A rope with a loop was attached to the sandbags, which allowed them to be hung on the hook. The total weight of the steel hook, clamp, and rope was 160 g.
The results from the mechanical testing were instrumental in determining the stress, strain, and Young’s modulus for both the ABS spar and the recycled composite spar when subjected to drag and lift forces. These results were derived from mechanical tests detailed in Section 2.3. To perform these calculations accurately, it was crucial to consider the geometry of the spar. Consequently, the moment of inertia of the spar about the x-axis and y-axis, according to Equations (1) and (2), respectively.
I x x = b · H 3 12 ( b a ) · ( H h ) 3 12
I y y = ( H h ) · b 3 12 + a 3 · h 12
where H = full height [mm], h = middle height [mm], a = middle width [mm], b = full width [mm], Ixx = area moment of inertia around x-axis [mm4], and Iyy = area moment of inertia around y-axis [mm4].
It is noteworthy that the formulas of the Euler–Bernoulli beam theory needed to be taken into account for calculating the Maximum displacement of the beam (Equation (3)) and Young’s modulus (Equation (4)).
w m a x = P · L 3 3 · E · I
E = P · L 3 3 · w m a x · I
where wmax = maximum displacement of the beam [mm], P = load on end of the beam [N], L = beam length [mm], E = Young’s modulus [MPa], and I = area moment of inertia [mm4].

3. Results and Discussion

3.1. Mechanical Testing on ABS Specimens Produced by 3D Printing

Mechanical tests for tensile, compression, and flexural were performed, which followed the standards ASTM D638-14 [28], ASTM D695-15 [29], and ASTM D790-10 [30]. The results were used to validate the HyperWorks software (version 2022) and, consequently, to compare the manufactured spars with the different materials.

3.1.1. Tensile Test

The initial simulation conducted in HyperWorks software (version 2022) utilised a stratified building technique, mirroring the sequential layering inherent to ABS specimens manufactured by 3D printing processes. Within this setup, the model was meticulously constructed from 16 individual layers, each measuring a height of 0.2 mm, with an overall thickness of 3.2 mm.
To facilitate a comprehensive comparison of the mechanical test outcomes, a series of simulations were executed using the HyperWorks software (version 2022), exploring seven distinct configurations of the model, mesh, and force application. A mesh size of 0.2 mm was employed, with the same single force of 1318.48 N, as determined from the experimental tensile testing, applied to the structure. Figure 6a illustrates the layering process, detailing the placement and orientation of the force applied to the specimen. For the second configuration, an alternative method of force application was implemented to enhance the accuracy of the results. While the model was constructed similarly to the first setup, this time, a distributed force was applied instead of a singular force. This involved a total of 19 individual forces, each exerting 69.39 N across the surface of the specimen, as depicted in Figure 6b.
The third analysis diverged from the layered approach, opting instead for a monolithic design constructed from a single solid block. This necessitated the creation of two types of mesh: a 2D triangular mesh and a 3D tetrahedral mesh, both with a mesh size of 1 mm. In this configuration, a pressure of 21.69 MPa was applied at the end of the specimen, as shown in Figure 6c. The fourth analysis mirrored the third in terms of model construction, utilising a solid block. However, the force application differed; a singular force of 1318.48 N was applied at the end of the specimen rather than pressure. This configuration is illustrated in Figure 6d.
In the fifth setup, the model was again constructed as a single part but featured a different mesh configuration. Here, the 2D mesh was composed of quadrilaterals, while the 3D mesh was a mixed type, incorporating pyramids atop quadrilaterals, with a mesh size of 1 mm. Consistent with Setup 3, a pressure of 21.69 MPa was applied at the end of the model, as detailed in Figure 6e.
The sixth analysis employed a 2D R-trias mesh type and a 3D tetrahedral mesh, both with a mesh size of 1 mm. In this case, the pressure applied at the end of the specimen was set at 21.69 MPa, as shown in Figure 6f. The seventh and final analysis aimed to closely replicate the mechanical test results. This model was constructed as a single part, utilising a 2D R-trias mesh type and a 3D tetrahedral mesh. Notably, this setup utilised a finer mesh size of 0.5 mm, while maintaining an applied pressure of 21.69 MPa at the end of the part, as depicted in Figure 6g.
To summarise and facilitate comparison, Table 8 consolidates the maximum stress, displacement results, mesh type, and mesh size across all setups, juxtaposed with the outcomes from the mechanical tests. This comprehensive analysis provides valuable insights into the mechanical behaviour of the material under various simulated conditions. Furthermore, the results indicate a strong correlation between the simulated and experimental data, highlighting the accuracy of the modelling approach employed in this study.
In Table 8, it can be seen that setups 1, 2, 4, 5, and 6 presented values far from those obtained by mechanical tests; therefore, these were disregarded.
A detailed comparison shows that the results obtained from the HyperWorks model for Setup 3 and Setup 7 are notably close to the values documented through mechanical testing (Table 8). The discrepancies observed are minimal, typically within the millimetre range, which can be attributed to slight inaccuracies that often occur during the execution of mechanical tests and the subsequent measurement processes. This suggests that the analytical models developed are fairly accurate representations of the actual physical behaviours, indicating that they closely align with ideal conditions.
The displacement value derived from the mechanical testing is measured at 2.29 ± 0.05 mm, whereas the displacement value obtained through HyperWorks analysis indicates an average of 1.94 ± 0.002 mm. This discrepancy results in a 15% difference between the two measurements. Regarding stress, the mechanical test yields a figure of 31.69 ± 0.45 MPa, in contrast to the HyperWorks analysis, which presents an average stress value of 30.91 ± 0.15 MPa, showing a variance of 2% between the two sets of results (Figure 7).
Among these setups, Setup 7 yielded the most precise results, aligning most closely with the mechanical test values. To substantiate this assertion, consider the findings presented in the research conducted by Perez et al. [37], where a stress measurement of 28.4 MPa was recorded, reflecting a mere 11.6% deviation from the expected results. Similarly, the study by Dwiyati et al. [38] reported a tensile strength of 30.60 MPa, which is also closely aligned with the values obtained in our analysis. These correlations lend credence to the validity of the simulations, reinforcing the reliability of the models employed.
Conversely, the results from Setup 6 were analogous to those from Setup 5, suggesting that while there is still a minor error present within the model, its magnitude has been reduced. This indicates a progressive improvement in the accuracy of the simulations. However, it is important to note that the other setups produced results that deviated significantly from the actual mechanical test outcomes. The discrepancies in these cases were substantial, rendering them unsatisfactory and indicating that they do not represent the ideal configurations for achieving reliable results.

3.1.2. Compression Test

For the computational analysis, a two-dimensional mesh was employed, utilising R-trias elements, while the 3D mesh comprised tetrahedral elements with a specified mesh size of 0.5 mm. The model was subjected to a pressure of 110.55 MPa, as illustrated in Figure 8a. The outcomes from this simulation closely align with the empirical values obtained from mechanical testing, reinforcing the reliability and accuracy of the simulation software utilised.
In detail, the mechanical testing yielded a displacement measurement of 15.53 mm, whereas the simulation predicted a displacement of 15.29 mm. This discrepancy represents a mere 2% variation, indicating a high degree between the two methodologies. Conversely, the stress results exhibited a more pronounced divergence; the mechanical test recorded a stress of 110.55 MPa, while the simulation indicated a higher value of 151.7 MPa, resulting in a difference of approximately 27%. This variance in stress values may warrant further investigation to understand the underlying factors contributing to this discrepancy. The analysis yielded significant results, indicating a force of 14,004.65 ± 200.08 N and a displacement of 15.53 ± 0.22 mm. This resulted in a calculated stress of 110.55 ± 1.67 MPa and a deformation ratio of 0.61, while the value from the analysis is 98.71 MPa. The difference between these values is bigger, namely, 12%. Following the successful validation of the tensile model, it is established that the same modelling approach can be effectively applied to the compression model, ensuring consistency in methodology across different stress scenarios.
Notably, a study conducted by Abbot et al. [39] on the compression testing of 3D printed ABS with a 50% infill ratio reported a maximum force of 12,200 N, which is near the force measured during the mechanical testing phase. This correlation underscores the relevance of the current findings within the broader context of material performance analysis and validation. The results of these analyses are comprehensively displayed in Figure 8b,c, providing a clear visual representation of the data obtained. Additionally, the observed trends suggest that variations in printing parameters, such as layer height and print speed, could significantly influence the mechanical properties of the final product.

3.1.3. Flexural Test

In the simulation analysis of the flexural test, the parameters from HyperWorks Setup 7, which were previously utilised in the tensile and compression analyses, were applied once more. Specifically, a 2D mesh type of R-trias and a 3D mesh type of tetras were constructed, each with a mesh size of 0.5 mm, as detailed in Section 3.1.1 and Section 3.1.2. To simulate the force on the specimen, 176 individual forces, each measuring 0.49 N, were applied.
The results obtained were 86.99 ± 1.24 N and a displacement of 3.79 ± 0.05 mm, which resulted in a stress of 116.4 ± 1.65 MPa. The results formed in the analysis are shown in Figure 9. For the stress, the number from the mechanical test was 116.40 MPa, while the value from the analysis was 93.07 MPa. The difference between these values is significant, namely, 20%. This states that the programme HyperWorks probably has some difficulty in performing an accurate analysis of the stress for the flexure of ABS. Figure 9c shows the deformation that occurred. Furthermore, according to the manufacturer, the flexural strength of ABS would be 67.67 MPa, and in the work of Zisopol et al. [40], when considering a layer height of 0.2 mm and infill of 100%, the maximum flexural strength obtained was 78.47 MPa. This somehow shows a discrepancy in the results compared to what was obtained here and is therefore not the most reliable test from this point of view.

3.1.4. ABS Spar: Model, Validation, and Simulation

The validation of the technique employing acetone as an adhesive for joining spar components was deemed essential. To rigorously assess its effectiveness, a series of tests were conducted involving ten specimens in total: five specimens were bonded using acetone, while the remaining five were directly printed as a single unit. A detailed stereoscopic analysis was subsequently performed, allowing for a comprehensive examination of the bonding quality. This analysis revealed that the acetone bond formed a new layer on the surface of the specimens, which exhibited minimal differences when compared to the specimens that were printed as a cohesive whole. This finding underscores the effectiveness of the acetone bonding technique, confirming its viability as an alternative to traditional printing methods (refer to Figure 10 for visual evidence).
To ensure the reliability of the results, a shear test was performed. The data collected from this test included the maximum force on each specimen, as well as the maximum and minimum force values, the average force, and the standard deviation of these measurements.
These results are meticulously compiled in Table 9. The analysis indicated that the adhesion achieved through acetone was not only efficient but also outperformed the specimens that featured a printed joint, thereby validating the use of acetone as a bonding agent in the fabrication of the spar components. A total of eight ABS spars were subjected to mechanical testing, and each of these spars failed under the applied force. The spars were secured in a clamp, measuring approximately 5 cm in length. With only four spars remaining for testing, a strategic shift was implemented. Rather than incrementally adding weight, the combined weight of the steel hook, clamp, and rope was utilised as the sole load acting on the spar. The results of this approach are detailed in Table 10.
The spar model was constructed as a single unit, employing a two-dimensional mesh type of R-trias and a three-dimensional mesh type of tetras, with the smallest achievable mesh size set at 1.2 mm. Two distinct scenarios were developed for each material: one representing lift forces acting on the spar and the other depicting drag forces.
Figure 11a illustrates the model, complete with its mesh, constraints, and a demonstration of the force that could be applied to the spar. To facilitate the mechanical testing of the spar, a specialised coupling support was fabricated for attachment to the universal testing machine. This support was critical, as the spar needed to endure a force applied specifically at its distal end, as depicted in Figure 9b. The results from the mechanical tests for lift forces acting on the spar are presented in Figure 11c, showing the displacement, while Figure 11d illustrates the corresponding stress values. The mechanical test indicated a displacement of 10 mm, in contrast to the HyperWorks analysis, which estimated a displacement of approximately 12 mm at the same location. This discrepancy reveals a difference of 20%.
The stress recorded during the mechanical test was 0.0277 MPa, whereas the HyperWorks analysis yielded a lower stress value of 0.0106 MPa. Further results regarding the drag forces are depicted in Figure 11e,f. The mechanical test revealed a displacement of 110 mm under drag conditions, while the analysis indicated a significantly higher displacement of 256.15 mm. This substantial variation can be attributed to potential measurement errors or the possibility that the mesh configuration was not optimal for this scenario.
Conversely, the stress values exhibited a smaller difference of 36%, indicating a more consistent performance between the mechanical test and the HyperWorks analysis. The values obtained were used as input in HyperWorks. The parameters used in the ABS spar model are presented in Table 11.

3.2. Mechanical Testing and HyperWorks Simulation on rCFRP Specimens

In this section, the results obtained from mechanical tests for tensile (ASTM D 3039 [33]) and compression (ASTM D3410 [34]) were performed and validated using the HyperWorks software, compared, and finally discussed.

3.2.1. Validation of rCFRP Tensile Test in HyperWorks

The conducted tests yielded crucial data points, specifically concerning Young’s modulus, displacement, and maximum force. These values were subsequently input into the HyperWorks software for further analysis, where they were meticulously compared against the outcomes of the physical tests that had been executed. It is important to note that during the simulation process, the input parameters utilised within HyperWorks were identical to those used for the ABS specimens. However, due to the inherent differences in material properties, it is anticipated that the results may exhibit some variation. To ensure a comprehensive validation process, these results were cross-referenced with existing literature on the subject. For validation, particular attention was given to the minimum stress experienced by the composite material, while the maximum stress was juxtaposed with findings documented in the literature.
The initial analysis carried out in HyperWorks for the Recycled Carbon Fibre-Reinforced Composite (rCFRC) involved a sophisticated modelling approach, wherein the model was constructed layer by layer. This methodology resulted in the creation of 28 distinct layers with a 90°/0° direction, each meticulously designed to enhance the accuracy of the simulation. The Quad mesh size for this model was set to a precise 0.5 mm, allowing for a detailed representation of the composite structure. Figure 12a,b provide a visual representation of this modelling process; Figure 12a illustrates the sequential construction of the layers, while Figure 12b delineates both the location and the direction of the force applied (473.38 N) to the model. This detailed approach not only facilitates a better understanding of the composite’s behaviour under stress but also reinforces the reliability of the simulation outcomes when compared to empirical data.
Figure 12c,d show the results from this setup. It shows that the generated values differ greatly from the actual results obtained from the performed mechanical test, with a displacement of 2.93 × 102 mm (Table 12), which is not expected for a composite, as it has greater rigidity compared to ABS, for example.
The second setup, modelled on HyperWorks and presented in Figure 12e,f, was created differently. The used 2D mesh type was quads, and 3D mesh type was mixed (pyramid on quad) with a mesh size of 1.2 mm, and an applied force of 473.38 N was used. The retrieved results from this analysis were not yet optimal, as the values differed from those obtained from the mechanical test, with a maximum stress of 34.04 MPa observed in a single specific region of the specimen, which was also evident throughout the specimen. The displacement, in this case, had an acceptable value of 2.03 mm.
The third setup had the most optimal results. The specimen was created from one part, the 2D mesh type was R-trias, and the 3D mesh type was tetras. A mesh size of 0.5 mm and an applied force of 473.38 N were used. The results gained from the analysis are shown in Figure 12g,h. It can be observed that the values obtained are very close to the values obtained in the mechanical test. Millimetric differences are due to small errors in carrying out the mechanical test and measurement. The displacement value obtained in the mechanical test is 2.29 mm, while the displacement in HyperWorks presents a value of 2.04 mm. The difference between the two values is 12%. As for the stress, the value from the mechanical test is 31.69 MPa, while the value from the analysis is 39.50 MPa. The difference between these values is bigger, approximately 20%. This difference can be explained by errors in measuring and performing the mechanical test.
In this work, for stress, the maximum found was 1416 ± 89 MPa (Setup 2) and 1643 ± 89 MPa (Setup 3). In the work of Paiva et al. [41], when comparing different carbon fabric-reinforced epoxy composites concerning tensile strength, these were manufactured in plain weave; they found values of 1185.4 MPa and 950.5 MPa for carbon fibres F584 and F155, respectively.

3.2.2. Validation rCFRP Compression Test in HyperWorks

Since the best way of creating the model in HyperWorks was determined in the tensile model (Setup 3), the same way will be used in the compression model, that is, 2D mesh type R-trias, 3D mesh type tetras, mesh size of 0.9 mm, and applied force of 146.45 N. The results obtained from this analysis were very close to the values obtained from the mechanical test. The value for the displacement obtained from the mechanical test is 15.53 mm, while the displacement in HyperWorks shows a value of 14.44 ± 1.45 mm. The difference between the values is 8%. As for the stress, the value from the mechanical test is 110.55 MPa, while the value from the analysis is 108.25 MPa. Figure 13a,b illustrate the results.

3.2.3. Recycled Composite Spar: Model, Validation, and Simulation

The methods’ results for the spars mechanical test were used to obtain the values of the displacement with the corresponding force. For this test, only two spars were available. One spar was used to perform the test in the direction of lift, and the other spar was used for the force in the direction of drag (Figure 14). During the test, the clamp turned out to be failing if too much force was added. The spar did not show any failure. For this reason, the obtained numbers of the corresponding force were used in the calculations and not the numbers corresponding to the maximum calculated force acting on the spar. Table 13 presents the results obtained.
In the same way as for the ABS spar, Equations (1)–(4) were used to contribute to calculating the stress, strain, and Young’s modulus of the recycled composite spar for drag and lift. The values were used as input in HyperWorks. The parameters used in the model of the composite spar are presented in Table 14.
The results obtained for the lift force acting on the recycled composite spar are shown in Figure 14b for the displacement and Figure 13b for the stress. The result obtained for displacement was 141.4 mm and for stress, 3.873 MPa.
The results obtained for the drag force acting on the recycled composite spar are shown in Figure 14d for the displacement and Figure 14e for the stress. The value obtained for displacement was 504.8 mm, and for stress, 55.05 MPa.
As noted, it was possible to develop the spar from recycled carbon fibres; however, the results obtained from the combination of the simulation in HyperWorks with the results of the mechanical test must be considered, since some discrepancies were found.
When comparing the recycled carbon fibre spar performance with the ABS spar, the forces acting on the recycled one are better than the forces acting on the ABS one, which was already expected.
Although it is important to prove that it is even possible to create the shape of the spar out of recycled carbon fibres, the real test is the simulation in HyperWorks combined with the results of the mechanical test. The results of these analyses are shown in Table 15.
The performance of the recycled carbon fibre spar is slightly better than the original composite spar when a lift force is acting on the spar. On the other hand, the original composite spar shows better results than the recycled carbon fibre spar when a drag force is applied. The stress for the drag force is eventually the factor that makes the recycled carbon fibre spar a little bit worse than the original spar; however, with the simulation, this effect was not noticed. Suppose some errors are eliminated and processes are improved. In that case, it should be possible to obtain values that could be better, but to be sure of this, other, more extensive research needs to be carried out, such as analysing the original composite spar regarding its mechanical properties. However, it can be said that the spar made from recycled carbon fibres has characteristics close to the original composite spar of the AMT-600 GURI, which makes it possible its apply. For this reason, the conclusion can be made that the recycled carbon fibre spar has almost equal characteristics to the original composite spar of the AMT-600 GURI.
Regarding the geometry and the manufacturing process, it is possible to manufacture the spar of the AMT-600 GURI using recycled carbon fibres. This process also showed some advantages over using glass fibres, such as weight, strength, and durability. However, one very big benefit of using recycled carbon fibres is that if the process is carried out in the right way, money can be saved on manufacturing products.
The project successfully demonstrated the feasibility of utilising recycled carbon fibres in the manufacturing of aircraft components, specifically in the design of the AMT-600 GURI wing spar.

4. Conclusions

This paper presents an evaluation of the mechanical behaviour and feasibility of manufacturing the AMT 600-GURI spar made of recycled carbon fibre composite. To develop a model to validate the recycled carbon fibre spar, the additive manufacturing process was chosen as a tool to develop an ABS prototype and specimens to perform mechanical tests to provide critical data on stress, strain, and Young’s modulus, being used only to validate the model, facilitating a comparative analysis with the recycled and original spars.
The ABS spar, because of the dimensions, had to be divided into three parts to be printed; the technique used to glue the parts together was acetone vaporising. So, this junction had to be validated using the Shear test, and the results showed that the method was satisfactory and which assured the use of its results for model validation.
The recycled carbon fibre spar was manufactured using a process combination: hand layup and vacuum bagging. The mechanical resistance tests were simulated with the software HyperWorks, and the results were confirmed with tensile and compression tests. Data from the original composite spar were also used to compare the results.
Integration of simulation results with experimental data allowed for a comprehensive understanding of the performance characteristics, revealing that the recycled carbon fibre spar exhibited slightly better performance compared to the original counterpart under specific conditions. In the Lift force, the recycled spar had + 8.95% on maximum stress when compared with the original and in the drag force on maximum stress, the recycled spar had +36%, which proved its use is feasible. After gathering all the information, it is possible to use recycled composites to manufacture the main spar of model aircraft or UAV (unmanned aircraft vehicle) based on the AMT-600 GURI spar so that it has properties close to those of the original spar. This project successfully demonstrated the feasibility of utilising recycled carbon fibres in the manufacturing of aircraft components, specifically in the design of the AMT-600 GURI wing spar.
This work contributes significantly to sustainability practices in the aerospace industry by addressing the environmental impact of carbon fibre waste and promoting the use of recycled materials in various applications. However, depending on the intended application of recycled carbon fibre, a thorough assessment of the material’s lifecycle and economic viability is essential.
For future contributions and to understand how this technology can be integrated into mass production, it is necessary to analyse whether the product will perform well in fatigue and durability tests, as it did for the simulated model and the prototype in the quasi-static mechanical results. Tests assessing the behaviour of these materials under environmental conditions are also necessary to evaluate their performance in real-world applications. It will also be necessary to carry out a more in-depth study to provide quantitative estimates of the production costs and economic benefits of manufacturing a spar from recycled materials. Once the good mechanical resistance of the recycled material under fatigue, environmental resilience, and the low production cost are proven, mass production will be feasible.

Author Contributions

Conceptualization: R.d.C.M.S.-C. and W.M.M.M., Methodology: S.S.L.M. and N.B.; Validation: A.G. and L.G., Software: N.B., S.S.L.M. and L.G.; Formal analysis, J.T.M.; Investigation: N.B., S.S.L.M., R.d.C.M.S.-C. and W.M.M.M.; Resources: H.H.B., R.d.C.M.S.-C. and W.M.M.M., Data curation: N.B., S.S.L.M.; Writing—original draft preparation: N.B., S.S.L.M., N.P.V.S. and R.d.C.M.S.-C., Writing—review and editing: S.S.L.M., H.H.B., J.T.M., F.J.G.d.S. and R.d.C.M.S.-C.; visualization, F.J.G.d.S.; Supervision: A.G., R.d.C.M.S.-C. and W.M.M.M.; Project administration: R.d.C.M.S.-C. and W.M.M.M.; Funding acquisition: H.H.B., W.M.M.M. and R.d.C.M.S.-C. All authors have read and agreed to the published version of the manuscript.

Funding

This research received no external funding.

Data Availability Statement

Data is contained within the article.

Acknowledgments

The authors also acknowledge the Laboratory of Materials and Processes at ITA and the Associated Laboratory of Sensors and Materials (LAS) at INPE for providing the infrastructure and equipment needed for the development of this work.

Conflicts of Interest

The authors declare no conflict of interest.

References

  1. Mrázová, M. Advanced composite materials of the future in the aerospace industry. INCAS Bull. 2013, 5, 139–150. [Google Scholar] [CrossRef]
  2. Sreejith, M.; Rajeev, R.S. 25—Fibre reinforced composites for aerospace and sports applications. In Fibre Reinforced Composites; Joseph, K., Oksman, K., George, G., Wilson, R., Appukuttan, S., Eds.; Woodhead Publishing Series in Composites Science and Engineering; Woodhead Publishing: Cambridge, UK, 2021; pp. 821–859. [Google Scholar] [CrossRef]
  3. Santiuste, C.; Soldani, X.; Miguélez, M.H. Machining FEM model of long fibre composites for aeronautical components. Compos. Struct. 2010, 92, 691–698. [Google Scholar] [CrossRef]
  4. de Paiva, J.M.F.; dos Santos, A.D.N.; Rezende, M.C. Mechanical and morphological characterisations of carbon fibre fabric reinforced epoxy composites used in aeronautical field. Mater. Res. 2009, 12, 367–374. [Google Scholar] [CrossRef]
  5. Samuel, J.J.J.; Ramadoss, R.; Gunasekaran, K.N.; Logesh, K.; Gnanaraj, S.J.P.; Munaf, A.A. Studies on mechanical properties and characterisation of carbon fibre reinforced hybrid composite for aerospace application. Mater Today Proc. 2021, 47, 4438–4443. [Google Scholar] [CrossRef]
  6. Rani, M.; Choudhary, P.; Krishnan, V.; Zafar, S. A review on recycling and reuse methods for carbon fibre/glass fibre composites waste from wind turbine blades. Compos. B Eng. 2021, 215, 108768. [Google Scholar] [CrossRef]
  7. Ateeq, M.; Shafique, M.; Azam, A.; Rafiq, M. A review of 3D printing of the recycled carbon fibre reinforced polymer composites: Processing, potential, and perspectives. J. Mater. Res. Technol. 2023, 26, 2291–2309. [Google Scholar] [CrossRef]
  8. Pakdel, E.; Kashi, S.; Varley, R.L.; Wang, X. Recent progress in recycling carbon fibre reinforced composites and dry carbon fibre wastes. Resour., Conserv. Recycl. 2021, 166, 105340. [Google Scholar] [CrossRef]
  9. Vogiantzi, C.; Tserpes, K. A Comparative Environmental and Economic Analysis of Carbon Fiber-Reinforced Polymer Recycling Processes Using Life Cycle Assessment and Life Cycle Costing. J. Compos. Sci. 2025, 9, 39. [Google Scholar] [CrossRef]
  10. Yu, K. An environmental and economic study on the chemical recycling of plastic composites using an engineering constitutive model. J. Environ. Manag. 2025, 381, 125271. [Google Scholar] [CrossRef]
  11. Bao, L.; Sun, Y.; Ruan, F.; Yu, Y. Development of a method for recycling factory waste carbon fiber prepregs and increasing the added value of the collected material. Polym. Compos. 2023, 44, 2071. [Google Scholar] [CrossRef]
  12. Irez, A.B.; Yakar, H. Transformation of waste carbon fiber prepreg into sustainable composites: Application in the automotive industry components. Polym. Compos. 2024, 45, 9471–9486. [Google Scholar] [CrossRef]
  13. Altay, L.; Atagur, M.; Akyuz, O.; Seki, Y.; Sen, I.; Sarikanat, M.; Sever, K. Manufacturing of recycled carbon fiber reinforced polypropylene composites by high-speed thermo-kinetic mixing for lightweight applications. Polym. Compos. 2018, 39, 3656–3665. [Google Scholar] [CrossRef]
  14. Li, Z.; Yang, Y.; Teng, Z.; Zhang, C.; Yang, W.; Cao, Y.; Li, S. Eco-efficient recycling of carbon fibers from CFRP waste: A two-step strategy by nanosecond pulsed laser. Polym. Compos. 2024, 46, 3122–3138. [Google Scholar] [CrossRef]
  15. Lopez-Urionabarrenechea, A.; Gastelu, N.; Acha, E.; Caballero, B.M.; Orue, A.; Jiménez-Suárez, A.; Prolongo, S.G.; de Marco, I. Reclamation of carbon fibres and added-value gases in a pyrolysis-based composites recycling process. J. Clean. Prod. 2020, 273, 123173. [Google Scholar] [CrossRef]
  16. Yatim, N.M.; Shamsudin, Z.; Shaaban, A.; Ghafar, J.A.; Khan, M.J.H. Recovery of carbon fibre from carbon fibre reinforced polymer waste via pyrolysis. J. Adv. Manuf. Technol. 2020, 14, 37–47. Available online: https://jamt.utem.edu.my/jamt/article/view/5860 (accessed on 4 November 2024).
  17. Xu, M.-X.; Meng, X.-X.; Ji, H.-W.; Yang, J.; Di, J.-Y.; Wu, Y.-C.; Lu, Q. Evolution of pyrolysis char during the recovery of carbon fibre reinforced polymer composite and its effects on the recovered carbon fibre. J. Environ. Chem. Eng. 2024, 12, 112214. [Google Scholar] [CrossRef]
  18. Yu, K.; Shi, Q.; Dunn, M.L.; Wang, T.; Qi, H.J. Carbon Fibre Reinforced Thermoset Composite with Near 100% Recyclability. Adv. Funct. Mater. 2016, 26, 6098–6106. [Google Scholar] [CrossRef]
  19. Zhang, J.; Chevali, V.S.; Wang, H.; Wang, C.-H. Current status of carbon fibre and carbon fibre composites recycling. Compos. B Eng. 2020, 193, 108053. [Google Scholar] [CrossRef]
  20. Butenegro, J.A.; Bahrami, M.; Abenojar, J.; Martínez, M.Á. Recent Progress in Carbon Fibre Reinforced Polymers Recycling: A Review of Recycling Methods and Reuse of Carbon Fibres. Materials 2021, 14, 6401. [Google Scholar] [CrossRef]
  21. Meng, F.; McKechnie, J.; Turner, T.; Wong, K.H.; Pickering, S.J. Environmental Aspects of Use of Recycled Carbon Fibre Composites in Automotive Applications. Environ. Sci. Technol. 2017, 51, 12727–12736. [Google Scholar] [CrossRef]
  22. Clément, F.; Anne-Sophie, A.; Éric, L.; Jean-Claude, G.; Sylvain, L.; Anne-Laure, G. Complex wing spar design in carbon fibre reinforced composite for a light aerobatic aircraft. Mech. Ind. 2016, 17, 614. [Google Scholar] [CrossRef]
  23. Yokozeki, T.; Sugiura, A.; Hirano, Y. Development of Variable Camber Morphing Airfoil Using Corrugated Structure. J. Aircr. 2014, 51, 1023–1029. [Google Scholar] [CrossRef]
  24. Sugiyama, K.; Matsuzaki, R.; Ueda, M.; Todoroki, A.; Hirano, Y. 3D printing of composite sandwich structures using continuous carbon fibre and fibre tension. Compos. Part A Appl. Sci. Manuf. 2018, 113, 114–121. [Google Scholar] [CrossRef]
  25. Sales-Contini, R.C.M.; Costa, H.M.S.; Bernardi, H.H.; Menezes, W.M.M.; Silva, F.J.G. Mechanical Strength and Surface Analysis of a Composite Made from Recycled Carbon Fibre Obtained via the Pyrolysis Process for Reuse in the Manufacture of New Composites. Materials 2024, 17, 423. [Google Scholar] [CrossRef]
  26. AEROMOT. AMT-600 Guri Manual; AEROMOT: Rio Grande do Sul, Brazil, 2006. [Google Scholar]
  27. Filamentos 3D Brasil. Filamento ABS Premium Branco. Available online: www.filamentos3dbrasil.com.br/produtos/filamento-abs-premium-branco/?variant=376033963 (accessed on 8 April 2024).
  28. ASTM D638; Standard Test Method for Tensile Properties of Plastics. American Society for Testing and Materials: West Conshohocken, PA, USA, 2014.
  29. ASTM D695; Standard Test Method for Compressive Properties of Rigid Plastics. American Society for Testing and Materials: West Conshohocken, PA, USA, 2015.
  30. ASTM D790; Standard Test Methods for Flexural Properties of Unreinforced and Reinforced Plastics and Electrical Insulating Materials. American Society for Testing and Materials: West Conshohocken, PA, USA, 2010.
  31. Dizon, J.R.C.; Gache, C.C.L.; Cascolan, H.M.S.; Cancino, L.T.; Advincula, R.C. Post-Processing of 3D-Printed Polymers. Technologies 2021, 9, 61. [Google Scholar] [CrossRef]
  32. ASTM D5868; Standard Test Method for Lap Shear Adhesion for Fibre Reinforced Plastic (FRP) Bonding. American Society for Testing and Materials: West Conshohocken, PA, USA, 2014.
  33. ASTM D3039; Tensile Properties of Polymer Matrix Composite Materials. American Society for Testing and Materials: West Conshohocken, PA, USA, 2009.
  34. ASTM D3410; Standard Test Method for Compressive Properties of Polymer Matrix Composite Materials with Unsupported Gage Section by Shear Loading. American Society for Testing and Materials: West Conshohocken, PA, USA, 2008.
  35. HEXCEL Hexply® F593—Product Data Sheet—EU Version. [s. 1.]. 2020, pp. 1–6. Available online: https://www.hexcel.com/user_area/content_media/raw/HexPly_F593_us_DataSheet.pdf (accessed on 10 March 2025).
  36. Fernández, A.; Lopes, C.S.; González, C.; López, F.A. Characterization of Carbon Fibers Recovered by Pyrolysis of Cured Prepregs and Their Reuse in New Composites. In Recent Developments in the Field of Carbon Fibers; Intech Open: London, UK, 2018. [Google Scholar] [CrossRef]
  37. Perez, A.R.T.; Roberson, D.A.; Wicker, R.B. Fracture Surface Analysis of 3D-Printed Tensile Specimens of Novel ABS-Based Materials. J. Fail. Anal. Prev. 2014, 14, 343–353. [Google Scholar] [CrossRef]
  38. Dwiyati, S.T.; Kholil, A.; Riyadi, R.; Putra, S.E. Influence of layer thickness and 3D printing direction on tensile properties of ABS material. J. Phys. Conf. Ser. 2019, 1402, 66014. [Google Scholar] [CrossRef]
  39. Abbot, D.W.; Kallon, D.V.V.; Anghel, C.; Dube, P. Finite Element Analysis of 3D Printed Model via Compression Tests. Procedia Manuf. 2019, 35, 164–173. [Google Scholar] [CrossRef]
  40. Zisopol, D.G.; Nae, I.; Portoaca, A.I.; Ramadan, I. A Statistical Approach of the Flexural Strength of PLA and ABS 3D Printed Parts. Eng. Technol. Appl. Sci. Res. 2022, 12, 8248–8252. [Google Scholar] [CrossRef]
  41. de Paiva, J.M.F.; Mayer, S.; Rezende, M.C. Comparison of tensile strength of different carbon fabric reinforced epoxy composites. Mater. Res. 2006, 9, 83–90. [Google Scholar] [CrossRef]
Figure 1. Mesh of the AMT-600 GURI wing and pressure distribution on the wing of the AMT-600 GURI.
Jcs 09 00384 g001
Figure 2. Part of the spar outside of the wing of the AMT-600 GURI.
Jcs 09 00384 g002
Figure 3. Results of glueing the three spare parts together: (a) first part spar’s dimension: 167 × 28 × 4 mm, (b) second part spar’s dimension: 167 × 28 × 4 mm, (c) third part spar’s dimension: 167 × 21 × 4 mm, and (d) final spar’s dimensions: 500 × (28/14) × 4 mm.
Jcs 09 00384 g003
Figure 4. (a) SEM image of recycled carbon fibre from HexPly® F593 prepreg, (b) geometric attributes of Multiscale designer for recycled carbon fibre (Tow Centre Spacing in X axis (S_x) and Tow Centre Spacing in Y axis (S_y)), and (c) micromechanical structure of recycled carbon fibre from HexPly® F593 prepreg HexPly® F593.
Jcs 09 00384 g004
Figure 5. Illustration of the support on the universal mechanical test machine: (a) front view and (b) side view.
Jcs 09 00384 g005
Figure 6. ABS tensile specimens model: (a) Setup 1: Mesh type Quad, mesh size 0.2 mm, single applied force of 1318.48 N, (b) Setup 2: Mesh type Quad, mesh size 0.2 mm, and 19 distributed forces of 69.39 N, (c) Setup 3: 2D mesh type: Trias and 3D mesh type: Tetra, mesh size 1.0 mm, pressure of 21.69 MPa, (d) Setup 4: 2D mesh type: Trias and 3D mesh type: Tetra, mesh size 1.0 mm, single applied force of 1318.48 N, (e) Setup 5: 2D mesh type: Quads and 3D mesh mixed type: Pyramid on quads, mesh size 1.0 mm, pressure of 21.69 MPa, (f) Setup 6: 2D mesh type: R-trias and 3D mesh type: Tetras, mesh size 1.0 mm, pressure of 21.69 MPa, and (g) Setup 7: 2D mesh type: R-trias and 3D mesh type: Tetras, mesh size 0.5 mm, and applied pressure of 21.69 MPa.
Jcs 09 00384 g006
Figure 7. ABS tensile test from HyperWorks: (a) displacement (in mm) and (b) stress (in MPa).
Jcs 09 00384 g007
Figure 8. ABS compression test from HyperWorks: (a) Mesh type: 2D mesh type R-trias and 3D mesh type Tetras with a mesh size of 0.5 mm Trias and Tetra mesh size 0.5 mm, applied force of of 110.55 Nmm−2, (b) displacement (in mm), and (c) stress (in MPa).
Jcs 09 00384 g008
Figure 9. ABS flexural test results from HyperWorks: (a) displacement (in mm) and (b) deformation (in MPa) and (c) deformation of the flexural ABS specimen.
Jcs 09 00384 g009
Figure 10. Images obtained by the stereoscope showing the bonds with an acetone junction (A,B) and with a printed junction (C,D).
Jcs 09 00384 g010
Figure 11. (a) Full model showing the mesh, constraints, and an example of the force. (b) The location of the force applied to the spar. ABS spar, lift results from HyperWorks for (c) displacement (in mm) and (d) the stress (in MPa). ABS spar, drag results from HyperWorks for (e) displacement (in mm) and (f) the stress (in MPa).
Jcs 09 00384 g011
Figure 12. rCFRP (Setup 1) results from HyperWorks: (a) Setup 1 model showing its layers, (b) the location and direction of the applied force, (c) Setup 1 displacement (in mm), and (d) Setup 1 stress (in MPa). rCFRP (Setup 2) results from HyperWorks: (e) displacement (in mm) and (f) stress (in MPa). rCFRP (Setup 3) results from HyperWorks: (g) displacement (in mm) and (h) stress (in MPa).
Jcs 09 00384 g012
Figure 13. Compression composite results from HyperWorks: (a) displacement (in mm) and (b) stress (in MPa).
Jcs 09 00384 g013
Figure 14. (a) Recycled composite spar. Lift force results from HyperWorks: (b) displacement (in mm) and (c) stress (in MPa). Drag force results from HyperWorks: (d) displacement (in mm) and (e) stress (in MPa).
Jcs 09 00384 g014
Table 1. Data obtained from the aircraft AMT-600 GURI manual [26].
Characteristic Value
Aeroplane type: AMT-600 GURI
Manufacturer: Aeromot
Length: 8.20 m
Span: 10.50 m
Wing area: 13.79 m2
Height: 2.51 m
Maximum take-off and landing weight: 900 kgf/8829 N
Maximum climb rate: 700 ft/min/12.80 km/h/3.56 m/s
Maximum speed: 135 kts/250 km/h/69.45 m
Absolute ceiling: 17,500 ft/5334 m
Airfoil type: NACA 64-618
Chord length (Tip): 997.258 mm/0.997258 m
Chord length (Root): 1795.081 mm/1.795081 m
SSL density: 1.225 kg/m3
Input:Altitude:5334 m
Temperature offset:20 °C
Output:Temperature:273.479 K/0.329 °C
Pressure:51,652 Pa
Density:0.65796 kg/m3
Speed of sound:1193.46 km/h/331.518 m/s
Dynamic viscosity:0.0000173791 Pa * s
Reynolds number: (Root)7,173,466
Reynolds number: (Tip)3,985,222
Reynolds number: (Average)5,579,344
Input:Altitude:5334 m
Temperature offset:20 °C
Output:Temperature:273.479 K/0.329 °C
Pressure:51,652 Pa
Density:0.65796 kg/m3
Speed of sound:1193.46 km/h/331.518 m/s
Table 2. Input wind tunnel simulation.
PropertyValue
Temperature (K)298.15
Speed (m/s)69.444
Pressure (Pa)101,325
Density (kg/m3)1.184
The angle of attack (°)12
Speed in x-direction (m/s)67.926
Speed in y-direction (m/s)0.000
Speed in z-direction (m/s)14.438
Table 3. Thermal and mechanical properties of ABS, according to the manufacturer [27].
PropertyValue
Density (g/cm3)1.04
Fluidity (g/10 min (220°C—10 kg)>45
Hardness (Rockwell)104
Thermal deflection temperature (°C @ 18.6 kg/cm2)88
Tensile strength (MPa)40.21
Flexural strength (MPa)67.67
Impact resistance (IZOD) (kg.cm/cm)30
Melting point (°C)210–250
Flexural module (MPa)2353.6
Table 4. Printing parameters, according to the ABS manufacturer [27].
ParameterMinimumMaximum
Nozzle temperature (°C)225245
Table temperature (°C)90120
Speed (mm/s)2080
Min time. Layers (s)820
Extrusion multiplier0.951.05
Table 5. The information entered in the G codes was used for the flexural, tensile, and compression specimens.
PropertyFlexuralTensileCompression
Layer height (mm)0.2
Retraction speed (mm/s)10
Printing speed (mm/min)4800
Nozzle temperature (°C)235 °C
Quantity of plastic (mm)2133.43539.21343.0
Fill density (%)98
Extrusion speed (mm/s)1.5
Maximum volume per second (mm3/s)12
Table 6. Parameters according to ASTM D5868-01 [31].
PropertyValue
Total length (mm)177.8
Width (mm)25.4
Joint length (mm)25.4
Minimum tightening (mm)25.4
Load speed (mm/min)13
Minimum number of specimens5
Table 7. Geometric attributes found through SEM measurements.
Geometric AttributeValue (mm)
Tow major radius (r_maj)2.15546
Tow minor radius (r_min)0.45780
Tow centre spacing in the x axis (S_x)2.67049
Tow centre spacing in the y axis (S_y)2.20014
Table 8. Methodology adopted to characterise the ABS tensile specimens: mechanical tests and HyperWorks setup, simulation parameters (mesh type and size), and the results for maximum stress and displacement obtained after simulation.
MethodMesh TypeMesh Size (mm)Stress (Max) (MPa)Displacement (Max) (mm)
Mechanical test--31.692.29
HyperWorks Setup 1Quad0.2964.801.70 × 106
HyperWorks Setup 2Quad0.2789.801.82 × 106
HyperWorks Setup 32D mesh type: Trias and 3D mesh type: Tetra1.032.201.69
HyperWorks Setup 42D mesh type: Trias and 3D mesh type: Tetras 1.0642.6070.89
HyperWorks Setup 52D mesh type: Quads and 3D mesh mixed type: Pyramid on quads1.0106.105.58
HyperWorks Setup 62D mesh type: R-trias and 3D mesh type: Tetras1.0106.105.58
HyperWorks Setup 72D mesh type: R-trias and 3D mesh type: Tetras0.532.341.94
Table 9. Results of the force from the mechanical shear test of the acetone-glued specimens and specimens printed together.
MaterialMax. Force (kN)MaterialMax. Force (kN)
ABS (acetone) 012.15ABS (printer) 011.77
ABS (acetone) 022.13ABS (printer) 021.76
ABS (acetone) 032.12ABS (printer) 031.85
ABS (acetone) 042.07ABS (printer) 041.81
ABS (acetone) 052.10ABS (printer) 051.79
ABS (acetone) 062.09ABS (printer) 061.74
Max. value2.15Max. value1.85
Min. value2.07Min. value1.74
Average and standard deviation (n − 1)2.11 ± 0.03Average and standard deviation (n − 1)1.79 ± 0.04
Table 10. Mechanical test input ABS spars.
Spar NumberWeight (g)Lift or DragDisplacement (mm)
5160Lift5
6Lift10
7Drag90
8Drag130
Table 11. Input the HyperWorks ABS spar model.
ParameterValue
Young’s modulus (Lift) (MPa)546.76
Force (Lift) (N)0.4899
Amount3
Tensile strength (Lift) (MPa)0.0277
Maximum displacement of beam (Lift) (mm)10
Young’s modulus (Drag) (MPa)49.71
Force (Drag) (N)0.3674
Amount4
Tensile strength (Drag) (MPa)0.0277
Maximum displacement of beam (Drag) (mm)110
Table 12. Methodology adopted to characterise the rCFRP tensile specimens: mechanical tests and HyperWorks setup, simulation parameters (mesh type and size), and the results for maximum stress and displacement obtained after simulation.
MethodMesh TypeMesh Size (mm)Stress (Max) (MPa)Displacement (Max) (mm)
Mechanical test--31.692.29
HyperWorks Setup 1Quad0.57.23 × 1022.93 × 102
HyperWorks Setup 22D mesh type: Quads and 3D mesh mixed type: Pyramid on quads1.234.042.03
HyperWorks Setup 32D mesh type: Trias and 3D mesh type: Tetra0.539.502.04
Table 13. Mechanical test input recycled composite spar from the lift and drag mechanical tests.
Spar NumberWeight (kg)Lift or DragDisplacement (mm)
125Lift30
22.41Drag25
Table 14. Input the HyperWorks recycled composite spar model.
ParameterValue
Young’s modulus (Lift) (MPa)30,414.94
Force (Lift) (N)152.72
Tensile strength (Lift) (MPa)4.627
Maximum displacement of beam (Lift) (mm)30
Young’s modulus (Drag) (MPa)3525.53
Force (Drag) (N)5.92
Tensile strength (Drag) (MPa)0.447
Maximum displacement of beam (Drag) (mm)25
Table 15. Comparison results of the HyperWorks simulation of the recycled carbon fibre spar and the original spar.
Type of ForceType of ResultRecycled Carbon Fibre SparOriginal SparDifference (%)
LiftDisplacement (max.)141.4 mm305.8 mm116.27
Stress (max.)3.873 MPa3.555 MPa8.95
DragDisplacement (max.)504.8 mm235.1 mm114.72
Stress (max.)55.05 MPa40.48 MPa36.00
Disclaimer/Publisher’s Note: The statements, opinions and data contained in all publications are solely those of the individual author(s) and contributor(s) and not of MDPI and/or the editor(s). MDPI and/or the editor(s) disclaim responsibility for any injury to people or property resulting from any ideas, methods, instructions or products referred to in the content.

