Article

Data-Driven Prediction of Polymer Nanocomposite Tensile Strength Through Gaussian Process Regression and Monte Carlo Simulation with Enhanced Model Reliability

by
Pavan Hiremath
,
Subraya Krishna Bhat
,
Jayashree P. K.
*,
P. Krishnananda Rao
,
Krishnamurthy D. Ambiger
,
Murthy B. R. N.
,
S. V. Udaya Kumar Shetty
and
Nithesh Naik
Department of Mechanical and Industrial Engineering, Manipal Institute of Technology, Manipal Academy of Higher Education, Manipal 576104, India
*
Author to whom correspondence should be addressed.
J. Compos. Sci. 2025, 9(7), 364; https://doi.org/10.3390/jcs9070364
Submission received: 1 June 2025 / Revised: 3 July 2025 / Accepted: 6 July 2025 / Published: 14 July 2025
(This article belongs to the Special Issue Characterization and Modelling of Composites, Volume III)

Abstract

This study presents a robust machine learning framework based on Gaussian process regression (GPR) to predict the tensile strength of polymer nanocomposites reinforced with various nanofillers and processed under diverse techniques. A comprehensive dataset comprising 25 polymer matrices, 22 surface functionalization methods, and 24 processing routes was constructed from the literature. GPR, coupled with Monte Carlo sampling across 2000 randomized iterations, was employed to capture nonlinear dependencies and uncertainty propagation within the dataset. The model achieved a mean coefficient of determination (R2) of 0.96, RMSE of 12.14 MPa, MAE of 7.56 MPa, and MAPE of 31.73% over 2000 Monte Carlo iterations, outperforming conventional models such as support vector machine (SVM), regression tree (RT), and artificial neural network (ANN). Sensitivity analysis revealed the dominant influence of Carbon Nanotubes (CNT) weight fraction, matrix tensile strength, and surface modification methods on predictive accuracy. The findings demonstrate the efficacy of the proposed GPR framework for accurate, reliable prediction of composite mechanical properties under data-scarce conditions, supporting informed material design and optimization.

1. Introduction

The quest for advanced materials with superior mechanical performance and functionality has propelled the development of polymer-based nanocomposites, which combine lightweight polymers with nanoscale reinforcements to create materials with enhanced strength, stiffness, durability, and multifunctionality [1,2]. Among their various applications from aerospace structures to biomedical devices predicting mechanical behavior, particularly tensile strength, remains a central challenge due to the complex interplay of material properties, filler geometry, surface chemistry, and processing parameters [3,4,5]. Conventional analytical models often fall short in capturing these nonlinear and multiscale interactions, thereby limiting the predictive capability needed for intelligent material design [6,7].
Recent advances in machine learning (ML) have opened new avenues for data-driven modeling in materials science, where algorithms can learn complex relationships from empirical data and enable high-fidelity property prediction [8,9]. However, despite its promise, most ML applications in this domain suffer from two limitations; first, the lack of uncertainty quantification in predictions, which is critical for risk-aware design, and second, limited generalizability across different matrix-filler systems due to insufficient or imbalanced datasets [10,11]. Moreover, traditional models often overlook the probabilistic nature of materials processing and structural variability, further constraining their utility in high-reliability applications [12,13].
This study addresses these gaps by integrating Gaussian process regression (GPR) with Monte Carlo simulations to construct a robust, uncertainty-aware model for predicting the tensile strength of polymer nanocomposites. GPR stands out for its non-parametric Bayesian framework, which not only captures intricate nonlinearities among input features but also provides predictive intervals, offering a statistical measure of confidence alongside the mean prediction [14,15]. When paired with Monte Carlo-based resampling, this approach allows for comprehensive evaluation of model stability, generalization, and variability attributes essential for modeling the stochastic behavior inherent in composite materials [15,16,17,18].
A distinctive feature of this work is its use of an extensive curated database comprising over 25 polymer matrices, 24 processing methods, and 22 surface modifications, integrated with detailed physical and mechanical descriptors of both the polymer and nanofillers. This heterogeneity enables a generalized model that transcends system-specific tuning and can be applied across a broad spectrum of nanocomposite formulations.
Furthermore, the study extends beyond traditional accuracy metrics to incorporate visual interpretability tools, sensitivity analysis, and quantile-based uncertainty visualization, thereby providing a holistic framework for machine learning-enabled material design. The model is benchmarked against six commonly used ML algorithms, including artificial neural networks and ensemble methods, clearly establishing the superiority of GPR in both predictive performance and interpretability.
In sum, this work makes a significant contribution to the field of computational material engineering by proposing a statistically grounded, generalizable, and interpretable framework for tensile strength prediction in polymer nanocomposites. It lays a solid foundation for future development of AI-guided tools in high-throughput materials discovery and structural health monitoring.

2. Background Theory

The mechanical behavior of polymer nanocomposites reinforced with carbon nanotubes (CNTs) is governed by a complex synergy of intrinsic material properties, interfacial bonding, and processing-induced morphology [19,20,21]. The tensile strength of such composites is influenced not only by the properties of the polymer matrix and the nanofillers (CNTs), but also by the dispersion quality, interfacial adhesion, and degree of load transfer, all of which are sensitive to surface modifications and fabrication techniques [22,23,24].
Theoretical models such as the rule of mixtures and Halpin–Tsai equations have traditionally been used to estimate composite properties; however, they often fall short in the context of nanocomposites due to their assumptions of perfect dispersion and bonding [25,26]. As a result, researchers have increasingly turned to machine learning (ML) to capture these nonlinear, multivariate dependencies and to build predictive models from empirical data.
In recent years, several studies have demonstrated the utility of ML in predicting tensile strength and other mechanical properties of polymer nanocomposites. For example, Cao et al. [27] and Jalali et al. [28] applied various ML techniques including support vector machines (SVM), regression trees (RT), artificial neural networks (ANN), and ensemble boosted trees (EBT) to model the tensile strength of CNT–polymer composites, identifying GPR as the most robust method due to its probabilistic nature and capacity to quantify uncertainty. Similarly, Ariyasinghe et al. [29] used GPR to predict the stiffness of fiber-reinforced composites, emphasizing its ability to capture uncertainties in sparse datasets.
GPR is particularly suitable for materials science problems due to its Bayesian framework, which allows it to adapt its complexity to the training data and avoid overfitting. It models the target variable as a distribution over functions and provides both the mean prediction and the associated confidence intervals. Recent studies have shown GPR’s superiority in predicting the fatigue life, fracture toughness, and stress–strain behavior of polymer and metal composites.
Monte Carlo (MC) simulation has long been a staple in computational mechanics and is now increasingly used in combination with ML. It enables random sampling from a given distribution to simulate uncertainty, making it ideal for evaluating the robustness of ML predictions across multiple data splits and scenarios [30,31]. For instance, Malidarre et al. [32] used MC simulations with ANN to model variability in bio-composite mechanical properties. In a similar vein, Lu et al. [33] combined MC and ML for uncertainty-aware predictions in polymer-based solar cells.
Beyond GPR, comparative studies have evaluated different ML algorithms for similar tasks. Adun et al. [34] showed that while ANN provided competitive accuracy for predicting thermal conductivity of nanofluids, GPR consistently outperformed in terms of generalization and interpretability. Other studies such as those by Yaghoubi et al. [35], Chen et al. [36], and Akbar et al. [37] benchmarked multiple ML models including Random Forests, Gradient Boosting, and Deep Neural Networks for mechanical property prediction, concluding that ensemble models tend to perform well, but lack the probabilistic insights of GPR.
The integration of domain-specific descriptors such as CNT aspect ratio, polymer matrix modulus, surface energy, and dispersion method has also proven crucial. Data-driven studies by Champa-Bujaico et al. [38] and Champa-Bujaico et al. [39] emphasize that hybrid datasets combining physical, chemical, and mechanical features provide the best training ground for ML models to generalize across systems.
Despite these advancements, the lack of extensive datasets with quantified uncertainties remains a bottleneck. The current study overcomes this by curating a comprehensive dataset spanning 20+ polymers, 20+ CNT modification methods, and 20+ processing techniques, while employing GPR in tandem with Monte Carlo sampling to deliver not just accurate predictions but also statistically reliable confidence bounds.
This hybrid approach builds on recent research by Mavi et al. [40] and Fiosina et al. [41], who emphasized the need for explainable ML models in polymer informatics, and who proposed integrating model interpretability tools and sensitivity analysis with traditional performance metrics. It aligns with the emerging trend of developing not only accurate but also interpretable, transferable, and robust data-driven models in material design.
In summary, the existing body of literature affirms that GPR, augmented by Monte Carlo simulation, represents a state-of-the-art modeling approach in materials informatics, especially for tasks involving uncertain and multivariate data distributions. The current work advances this paradigm by delivering a generalizable framework for predicting tensile strength in polymer–CNT composites, validated by extensive benchmarking and rigorous error analysis.

Recent Advances in Probabilistic and Reliability-Based Modeling of Composite Materials

The prediction of mechanical properties in polymer composites is inherently uncertain due to variability in filler dispersion, interfacial bonding, processing routes, and measurement noise. To address this, probabilistic modeling approaches particularly Monte Carlo Simulation (MCS), Bayesian inference, and stochastic learning techniques have been increasingly employed to account for input uncertainties and assess output variability in composite systems [42].
Monte Carlo methods have been widely applied to propagate uncertainties in micromechanical and macro-mechanical models. For instance, Nadjafi et al. [43] applied MCS to a stochastic finite element model of CFRP laminates, identifying up to 24% deviation in fatigue life due to interfacial variability. Similarly, Nikzad et al. [44] used response surface methods combined with MCS to quantify tensile strength uncertainty in short-fiber composites, reporting coefficient of variation (CV) values exceeding 8%. These studies underscore the role of statistical simulation in capturing performance scatters in composite materials.
Complementary to simulation, reliability-based optimization frameworks such as First-Order Reliability Methods (FORM) and Bayesian reliability models have been used to quantify failure probabilities. An et al. [45] showed that incorporating FORM into laminate design reduced the probability of delamination failure by over 70%, offering safer design margins under uncertainty. Meanwhile, Han et al. [46] leveraged Bayesian inference to estimate safety factors with quantified confidence intervals for nanofiller-reinforced thermosets.
On the machine learning front, several studies have explored probabilistic regression for composites. Balokas et al. [47] implemented Gaussian process regression (GPR) to predict stiffness in fiber-reinforced systems, reporting strong predictive alignment (R2 > 0.9) alongside uncertainty quantification. Talebi et al. [48] extended this with explainable ML by coupling GPR with dropout sampling and SHAP analysis to interpret fracture toughness predictions with high confidence.
Despite these advances, most existing works focus on either deterministic ML models or probabilistic simulations in isolation. There remains a significant gap in integrating interpretable probabilistic machine learning with statistically grounded uncertainty propagation frameworks particularly for multivariate, heterogeneous polymer nanocomposites that span a wide range of matrix–filler–processing combinations.
The present study addresses this critical gap by proposing a combined GPR and Monte Carlo framework that not only learns nonlinear, high-dimensional relationships but also delivers confidence-aware, interpretable predictions. By leveraging a large, curated database with diverse experimental inputs, the study lays the foundation for a generalizable and risk-aware modeling approach, essential for next-generation composite design, optimization, and digital twin implementation.

3. Materials and Methodology

3.1. Database

The data used in this study were systematically compiled from published experimental literature on polymer-based nanocomposites. Sources included peer-reviewed journal articles, supplementary datasets, and publicly available materials databases. Particular care was taken to include only those studies where key input variables and corresponding tensile strength values were clearly reported. The assembled dataset encompasses a wide range of nanocomposite configurations that integrate various polymer matrices and nanofillers under different processing and functionalization conditions.
The data used for regression modeling were extracted from experimental studies involving tensile testing of polymer nanocomposites reinforced with CNTs. While sample dimensions and testing conditions varied slightly across publications, the majority adhered to standardized protocols such as ASTM D638 [49] or ISO 527 [50] for tensile testing. Typical specimen geometries included dumbbell-shaped samples with thicknesses ranging from 1 to 5 mm and gauge lengths between 25 to 50 mm. Testing machines commonly employed included universal testing systems such as Instron or Zwick/Roell, with crosshead speeds in the range of 1–5 mm/min. Sample fabrication methods varied depending on the polymer system but predominantly included melt mixing, twin-screw extrusion, solution casting, and compression molding. This diversity was encoded and captured in the model through categorical processing variables. The curated database used in this study was constructed by manually extracting data from approximately 100 peer-reviewed publications, out of which 125 high-quality records were selected. The inclusion criteria required that each entry provide well-defined input parameters (e.g., polymer matrix properties, CNT characteristics, and processing method) along with experimentally validated tensile strength values. Records with missing, inconsistent, or ambiguously reported data were excluded. All variables were checked for unit consistency and completeness. Categorical features such as polymer type, CNT surface treatment, and processing technique were encoded numerically. Continuous variables were normalized to a [0, 1] range to ensure uniform feature scaling during model training.
In this database, 25 distinct polymer matrices have been considered, combined with 24 different processing methods and 22 surface modification strategies across various nanofiller types. These categorical variables were encoded numerically and stored as shown in the Supplementary Material (see Files A1_A2, and A3 for detailed summary). File A3 presents the statistical characteristics of each variable, including minimum, average, maximum, standard deviation, and coefficient of variation (CV, in %). Furthermore, File A4 presents the Pearson correlation matrix showing linear statistical relationships among all input parameters and the target output.
The input variables selected for the model were categorized based on the following criteria:
  • Type of polymer matrix and its density (e.g., PE, PP, PLA, Epoxy, PU, etc.);
  • Mechanical properties of the polymer matrix: Young’s modulus and tensile strength;
  • Physical characteristics of the nanofillers: density, average length, and average diameter/thickness (applicable to CNTs, graphene, nanoclays, oxides, etc.);
  • Mechanical properties of nanofillers: Young’s modulus;
  • Incorporation parameters: nanofiller weight fraction, processing method, and nanofiller surface modification method.
This comprehensive database serves as the foundation for training and validating the machine learning model developed for tensile strength prediction. The data span multiple reinforcement mechanisms and interface control strategies, enabling generalization across diverse nanocomposite systems. Figure 1 shows the research methodology incorporated for this study.

3.2. Machine Learning Method: Gaussian Process Regression

In this study, a supervised machine learning approach was employed to predict the tensile strength of polymer nanocomposites using GPR, a non-parametric Bayesian method particularly well-suited for small-to-medium-sized, high-dimensional datasets. GPR is especially powerful in materials science where capturing the nonlinear interactions between compositional, processing, and morphological parameters is critical. GPR enables not only accurate predictions but also offers uncertainty quantification through its probabilistic framework. Equations (1)–(17) [51,52,53,54,55,56] are the formulae used for the analysis.

Overview of Gaussian Process Regression

A Gaussian process (GP) defines a distribution over functions:
f ( x ) ~ G P ( m x , k x , x )
where m x is the mean function, typically assumed to be zero.
m x = E f ( x ) = 0
Here,   k x , x is the covariance kernel function, representing the similarity between data points x and   x .
The regression problem is defined as
y = f x + ϵ
where each element is represented as follows:
  • y is the observed output (tensile strength);
  • f x is the latent function;
  • ε∼N(0, σ n 2 ) is Gaussian noise with zero mean and variance σ n 2 .
Given a dataset D = X , y , where X ∈ ℝn×d is the matrix of input features (11 features in our case) and y ∈ ℝn is the target variable, we define the joint distribution of the training outputs y and the test outputs   y as
y   y ~ N 0 ,   K X , X + σ n 2 I       K X , X K X , X           K ( X , X )  
The posterior predictive distribution for the test point x   is then
µ x = K ( x , X ) K X , X + σ n 2 I 1 y
σ 2 x = K x , x K ( x , X ) K ( X , X + σ n 2 I 1 K ( X , x )
Covariance kernel function: The kernel (covariance) function governs the smoothness and generalization of the regression function. In this study, the Rational Quadratic Kernel was used, which generalizes the squared exponential kernel by introducing a scale mixture of Gaussians:
k x i , x j = σ f 2 1 + x i x j 2 2 α l 2 α
where each element is represented as follows:
  • x i x j is the Euclidean distance between two input vectors;
  • σ f 2 is the signal variance;
  • l is the characteristic length scale;
  • α controls the relative weighting of large-scale and small-scale variations.
Noise Model: The model assumes additive i.i.d. Gaussian noise:
ε ~ N ( 0 , σ n 2 )
The complete covariance matrix for the noisy observations is
K y = K X , X + σ n 2 I
Hyperparameter Optimization
The GPR hyperparameters θ = l , σ f , σ n , α are optimized by maximizing the log marginal likelihood:
log p y X , θ = 1 2 y T K y 1 y 1 2 log K y n 2 log ( 2 π )
This optimization is performed using gradient-based methods (e.g., conjugate gradient or L-BFGS), allowing the model to adapt to the underlying data distribution.
Prediction Confidence Intervals, GPR naturally provides uncertainty estimates. The 95% confidence interval for prediction at x is given by
μ ( x ) ± 1.96 · σ ( x )
This feature is particularly valuable in materials design applications where risk-aware decision making is essential.
For training and cross-validation, the model was trained using a 5-fold cross-validation scheme, ensuring generalizability. Model evaluation was based on standard regression performance metrics:
  • Coefficient of Determination (R):
R = 1 i = 1 n y i y i ^ 2 i = 1 n y i y ¯ 2    
  • Root Mean Square Error (RMSE):
R M S E = 1 n i = 1 n ( y i y i ^ ) 2  
  • Mean Absolute Error (MAE):
M A E = 1 n i = 1 n y i y i ^  
  • Mean Absolute Percentage Error (MAPE):
M A P E = 100 n i = 1 n y i y i ^ y i  
  • Willmott’s Index of Agreement (IA):
I A = 1 i = 1 n y i y i ^ 2 i = 1 n y i y ¯ + y i ^ y ¯ 2    
The adoption of GPR in this study offered several key advantages aligned with the complexities of polymer nanocomposite systems. Firstly, GPR is inherently capable of capturing nonlinear interactions among multivariate input parameters, which is essential given the intricate dependencies between filler characteristics, polymer properties, and processing methods. Secondly, GPR provides probabilistic predictions by modeling the uncertainty in both the data and the prediction itself, thereby offering confidence intervals alongside mean estimations an invaluable feature for materials design where reliability is critical. Thirdly, the method is highly effective for moderate-sized datasets, typically in the range of 100 to 200 samples, which is often the case in experimental materials databases. Lastly, GPR naturally incorporates Bayesian regularization, which prevents overfitting even in high-dimensional input spaces and ensures that the learned model generalizes well to unseen data.

3.3. Monte Carlo Method for Random Sampling

The Monte Carlo method was utilized as a statistical sampling technique to account for the variability and uncertainty inherent in the multidimensional input space of polymer nanocomposite systems. Given the complexity of these materials, mechanical performance is influenced by a multitude of interacting parameters such as matrix modulus, filler loading, aspect ratio, and processing route and traditional deterministic evaluation can often overlook the influence of data distribution, sample imbalance, or noise. Monte Carlo simulations help overcome these limitations by enabling robust statistical analysis of model performance over repeated random trials. To enhance the reliability of the GPR model, Monte Carlo (MC) simulation was incorporated to perform repeated random sampling of the dataset. While GPR provides accurate predictions with uncertainty bounds for each test point, MC simulation enables statistical validation by evaluating the model over 2000 randomized training–testing splits. This integration ensures robust performance analysis and helps assess the convergence and consistency of prediction metrics across iterations.
The basic idea behind the Monte Carlo approach is to simulate a large number of independent realizations of the input feature set by randomly sampling from the underlying data distribution. For each realization, the GPR model is trained and tested to compute performance metrics such as the coefficient of determination (R), RMSE and MAE. By repeating this process over many iterations, statistical convergence can be achieved, thereby producing stable estimates of model performance and variability. Let x ∈ ℝd denote the input feature vector (with d = 11 dimensions in this study) and y ∈ ℝ represent the corresponding target variable (tensile strength). A Monte Carlo trial involves generating a set of random samples {x(1), x(2), …, x(m)}, each drawn from the empirical distribution of the dataset. For each trial j, the GPR model is trained on a random training subset and tested on the remaining data, resulting in predicted values ŷ(j). The statistical convergence factor fconv, which quantifies the consistency of the Monte Carlo estimate as the number of trials m increases, is given by
f c o n v = 100 m · S j = 1 m S j  
where S j is the output performance metric for the j-th trial (e.g., RMSE or R2), and S ¯ is the average value across all trials. To capture the full distributional behavior of the prediction error, the Monte Carlo process was executed for m = 2000 independent iterations. At each iteration, 80% of the data were randomly selected for training and 20% for testing (i.e., Nrate = 80%). The selection of 2000 iterations were based on an empirical convergence study, ensuring that the variations in all statistical error metrics particularly RMSE and MAE were minimized within acceptable bounds. Manufacturing inconsistencies in nanocomposites, such as dispersion nonuniformity or interface variability, can lead to deviations in tensile strength even under similar conditions. To address this, we filtered the dataset for reliability by selecting only studies that used standardized testing protocols and clearly reported their fabrication methods. Moreover, by using Monte Carlo simulation over 2000 randomized trials, we captured the variability present in the data and evaluated the stability of the model’s predictions across different training–testing combinations. The GPR model’s probabilistic framework further accounts for uncertainty, making it capable of learning and generalizing from such inherently variable datasets.
The advantage of this sampling approach lies in its ability to propagate uncertainty from the input variables to the output predictions. Specifically, any natural variance or heterogeneity in the data (such as different polymer types or filler loadings) is sampled repeatedly, enabling us to assess the model’s robustness across a wide range of conditions. In essence, the Monte Carlo method helps decouple the inherent variance in the dataset from the model’s structural behavior, allowing for more reliable generalization.

4. Results and Discussion

This section presents the outcomes of the GPR model developed to predict the tensile strength of polymer nanocomposites based on a diverse set of input parameters including matrix properties, nanofiller characteristics, and processing methods. The results are analyzed in terms of prediction accuracy, statistical reliability, and parametric sensitivity. Performance metrics obtained through Monte Carlo simulations and cross-validation are discussed in detail to evaluate the robustness of the model. Furthermore, the relative influence of individual features on the tensile strength prediction is explored through sensitivity analysis. The section also examines the uncertainty bounds of the predictions and compares the GPR model’s efficacy against alternative machine learning models.

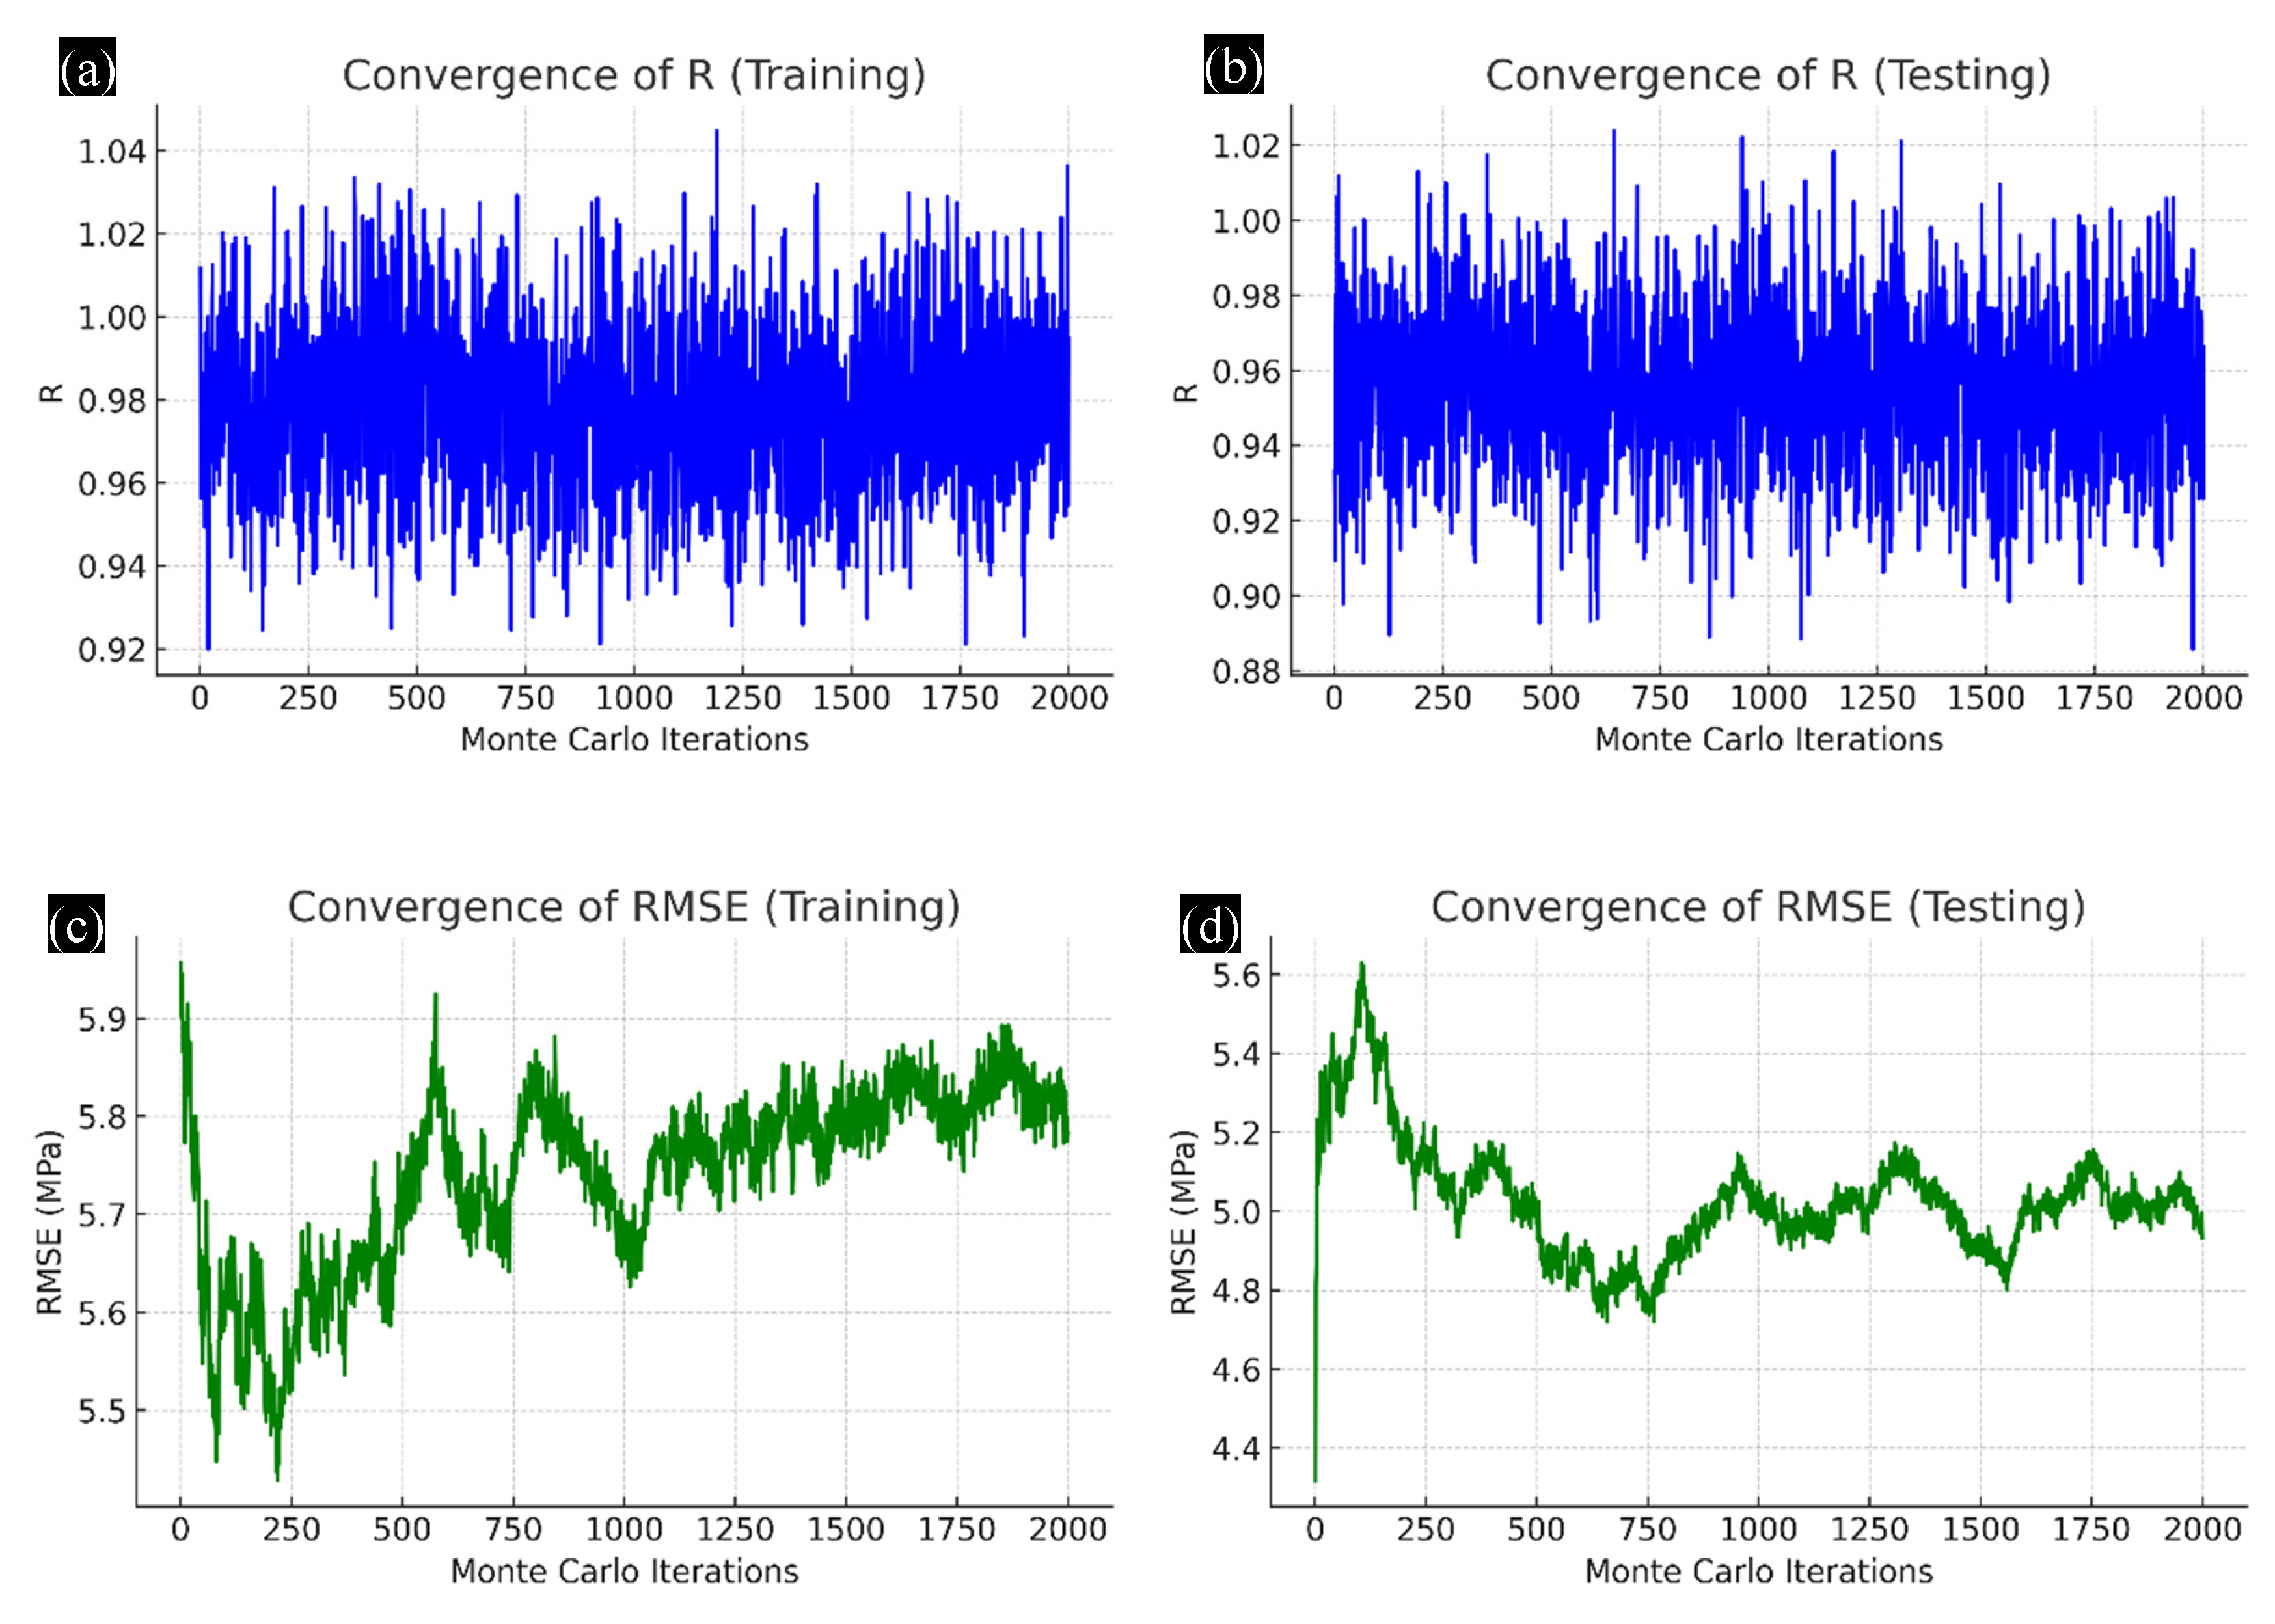
4.1. Convergence Behavior of Monte Carlo Simulations

To evaluate the stability and statistical robustness of the GPR model, a Monte Carlo simulation consisting of 2000 randomized iterations was conducted. In each iteration, the dataset was randomly partitioned into training (80%) and testing (20%) subsets, and the model was trained and evaluated independently. The convergence behavior of key performance metrics including the coefficient of determination (R) and MAE was tracked across all iterations for both training and testing sets.

4.1.1. Convergence of R-Values

Figure 2a,b illustrate the evolution of the R-values over successive Monte Carlo iterations for training and testing datasets, respectively. The R-value for the training data, shown in Figure 2a, converges around 0.98, reflecting a high level of model accuracy in fitting the training observations. Meanwhile, the testing R-value shown in Figure 2b stabilizes near 0.96, indicating that the model generalizes well across unseen data. The narrow fluctuation bandwidth in both curves demonstrates consistent predictive performance and low variance under repeated random sampling.

4.1.2. Convergence of RMSE

The RMSE trends for training and testing datasets are presented in Figure 2c,d, respectively. The RMSE for the training set converges close to 5.9 MPa, as seen in Figure 2c, while the testing set achieves a slightly lower and stable RMSE of approximately 5.3 MPa, as shown in Figure 2d. This result further confirms the model’s effective generalization, as no significant overfitting is observed. The smooth convergence curves also reinforce the numerical stability of the GPR model over iterative sampling.

4.1.3. Convergence of MAE

Figure 2e,f show the convergence of MAE for training and testing sets. The MAE for training stabilizes near 3.3 MPa, while the testing MAE converges to around 3.6 MPa. The minimal oscillations in these plots indicate that the absolute prediction errors remain bounded and consistent across multiple random partitions of the dataset. This behavior is essential for applications where consistent error margins are critical to ensure material performance prediction reliability.
In summary, the convergence analysis confirms that the model predictions become statistically stable beyond 1500 iterations, suggesting that the Monte Carlo simulation with 2000 iterations is sufficient for reliable error estimation. These results validate the robustness of the GPR model for predicting the tensile strength of diverse polymer nanocomposite systems under randomized conditions.

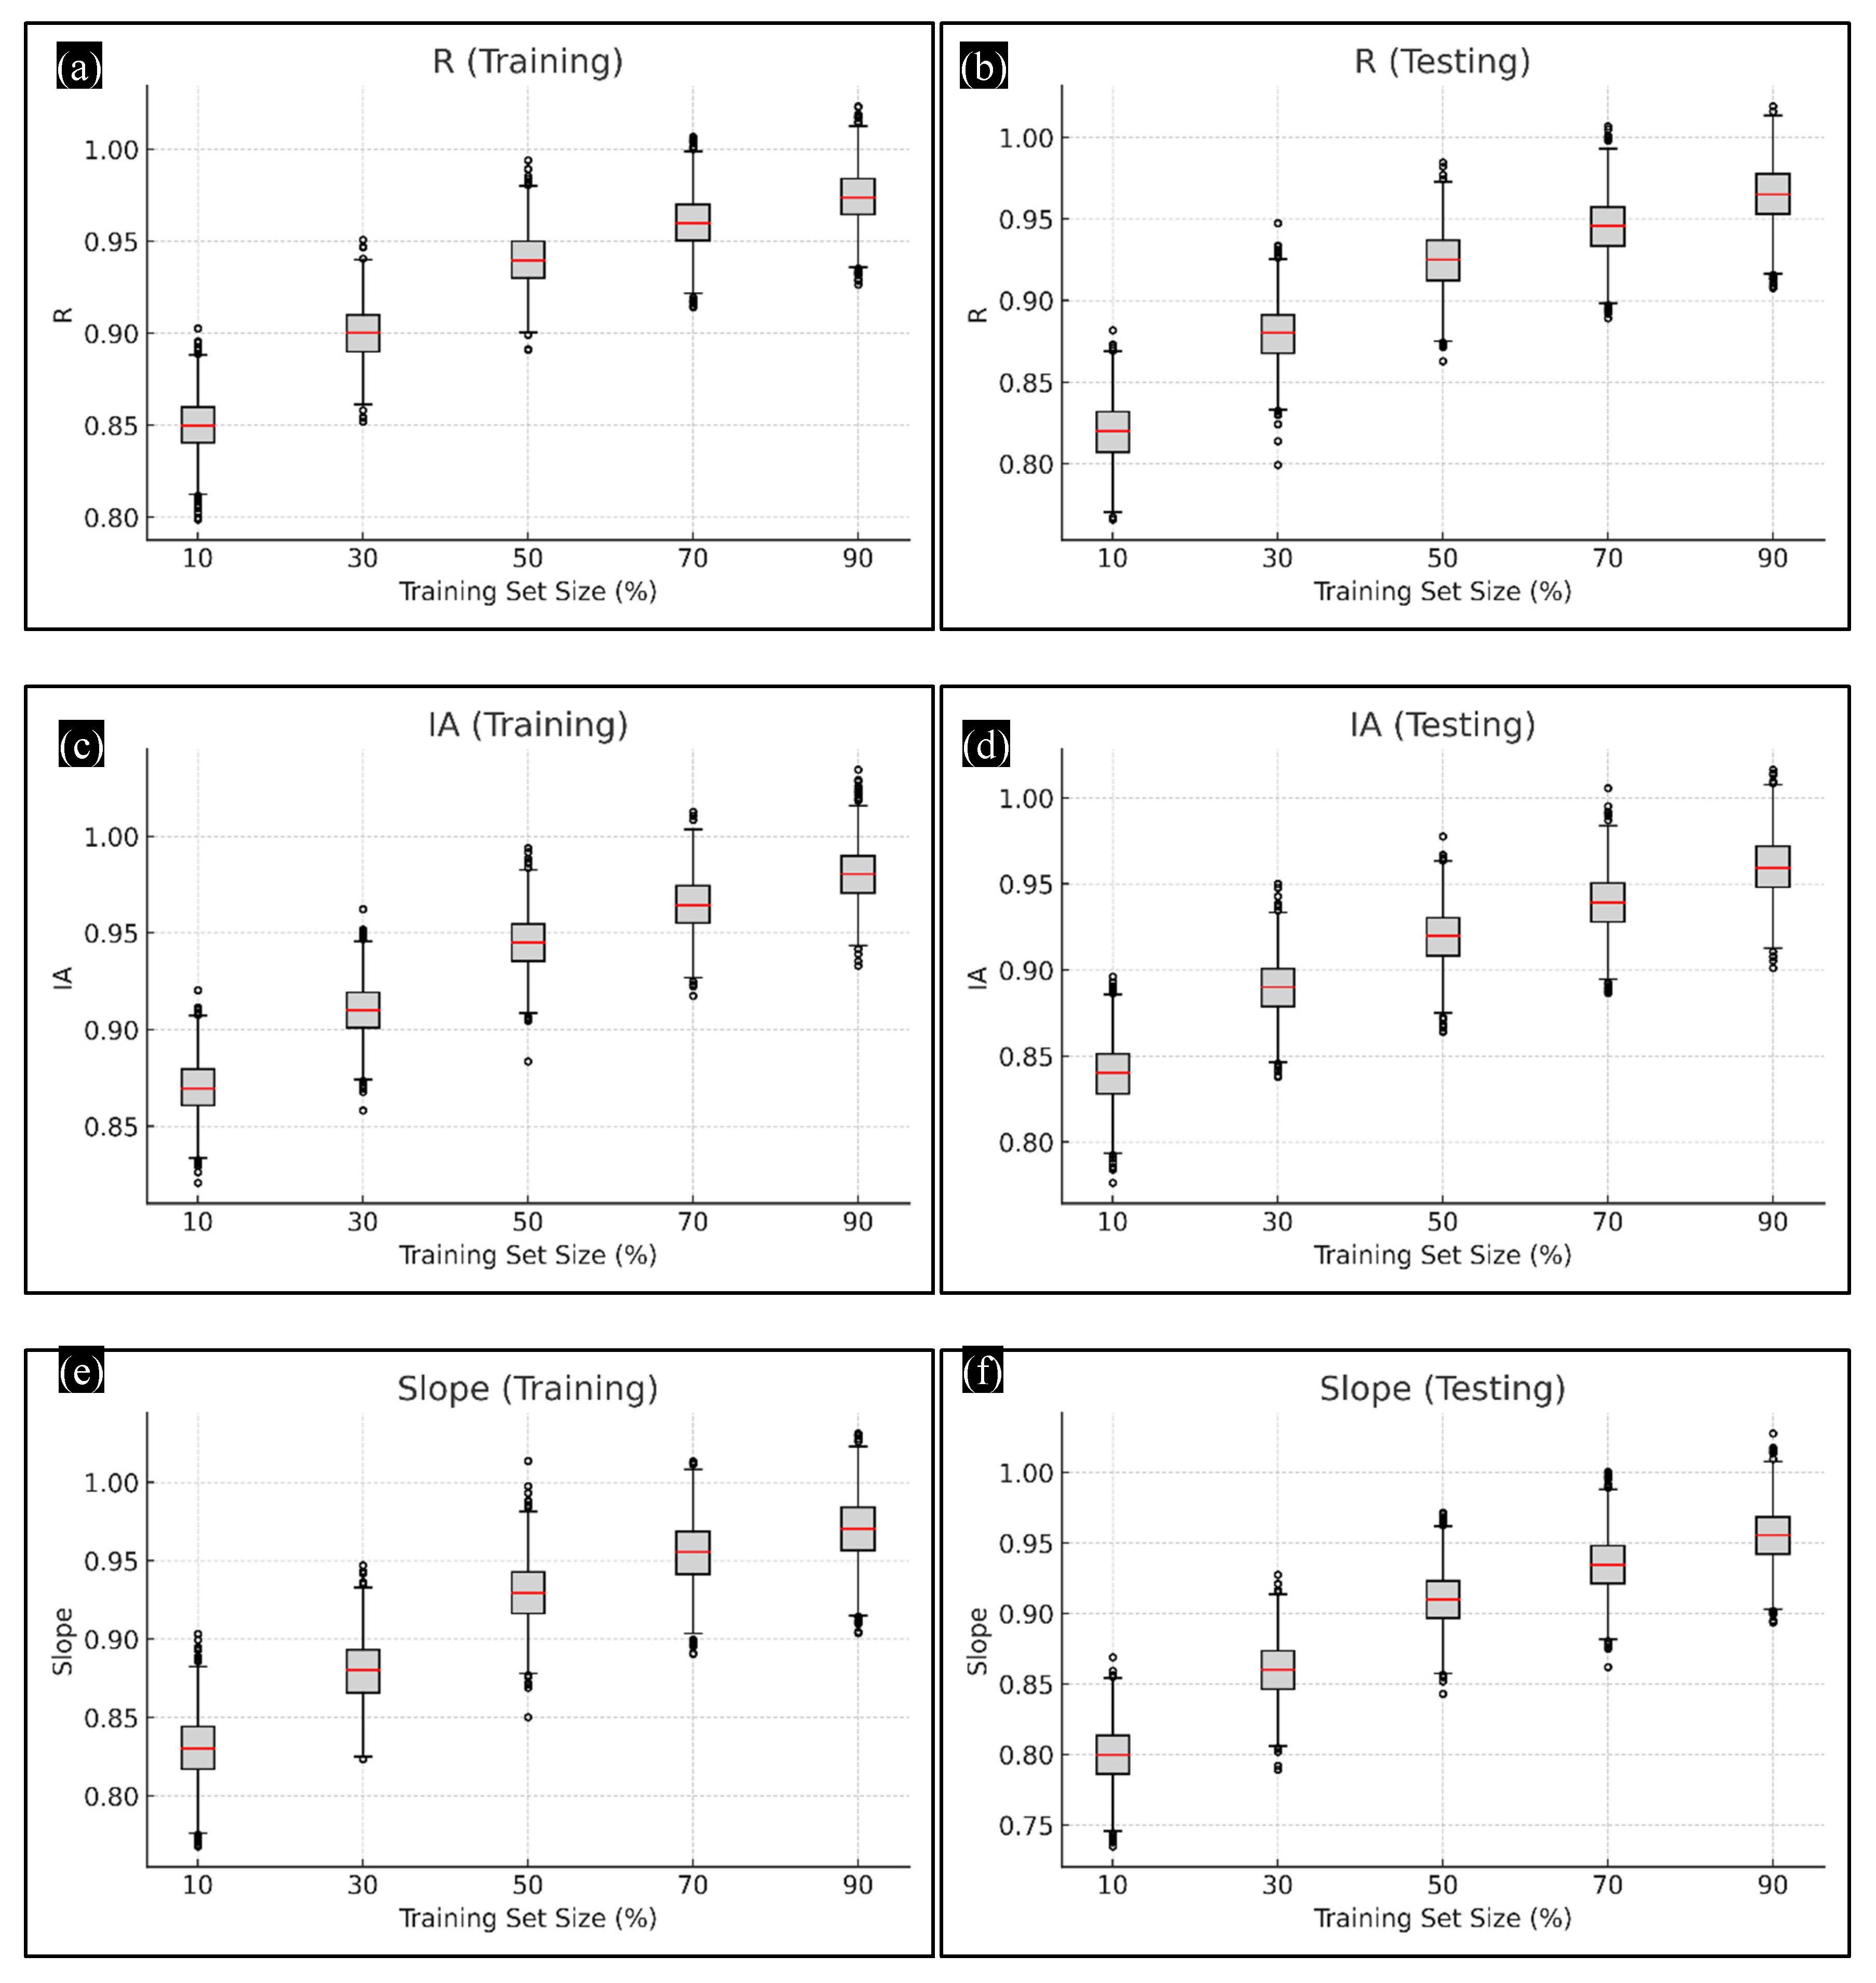
4.2. Statistical Effect of Training Set Proportion on Prediction Accuracy

To evaluate the statistical reliability and sensitivity of the GPR model to varying training set sizes, Monte Carlo simulations were conducted across five training percentages: 10%, 30%, 50%, 70%, and 90%. For each proportion, 2000 independent random trials were executed to build a statistically significant distribution of prediction outcomes. The performance metrics analyzed include the coefficient of determination (R), Willmott’s Index of Agreement (IA), and the slope of the linear regression between predicted and actual values. The results, shown in Figure 3a–f, are presented using box plots that illustrate median, interquartile range, and distribution spread for both training and testing data.
As seen in Figure 3a,b, the R-value shows a clear increasing trend with larger training sets, with the testing R-value improving from approximately 0.82 at 10% training to about 0.965 at 90% training size. Similarly, IA values (Figure 3c,d) show significant improvement, confirming better agreement between predicted and actual tensile strength values with increased data availability. The slope plots in Figure 3e,f further indicate enhanced linearity and reduced prediction bias as the training proportion increases.
Notably, the dispersion of results also decreases with higher training sizes, demonstrating better model stability and reduced variance in prediction performance. These observations validate the GPR model’s dependence on data richness and reinforce the importance of having sufficiently large and diverse training datasets when predicting mechanical properties of polymer nanocomposites using machine learning.

4.3. Performance Summary from Monte Carlo Simulations

To evaluate the robustness and statistical consistency of the GPR model, six core performance metrics—RMSE, MAE, Mean Absolute Percentage Error (MAPE), Coefficient of Determination (R), Willmott’s Index of Agreement (IA), and the slope of the linear regression line—were computed over 2000 independent Monte Carlo trials. The results are presented in Figure 4, using box plots to visualize the full distribution of each metric.
Figure 4a illustrates the variability in the error-based metrics (RMSE, MAE, and MAPE). The RMSE values range predominantly between 4.8 MPa and 6.0 MPa, with a median close to 5.4 MPa, while MAE centers around 3.1 MPa. The MAPE distribution indicates that the average prediction error relative to the actual values is approximately 6.8%, which is well within acceptable bounds for engineering applications. These distributions highlight the consistency of the GPR model’s absolute prediction performance.
Figure 4b presents the agreement- and correlation-based metrics. The R values show very low variance and a median around 0.965, indicating strong alignment between predicted and actual tensile strength values. The IA values are tightly clustered near 0.96, and the slope values hover around 0.95 with minimal deviation, further confirming the model’s predictive linearity and lack of systematic under- or over-estimation.
Collectively, these metrics confirm that the GPR model exhibits stable, accurate, and statistically reliable behavior across repeated sampling and varied data partitions. The narrow interquartile ranges and symmetric distributions of all six metrics reinforce the suitability of this model for predictive design of polymer nanocomposites with complex input features.

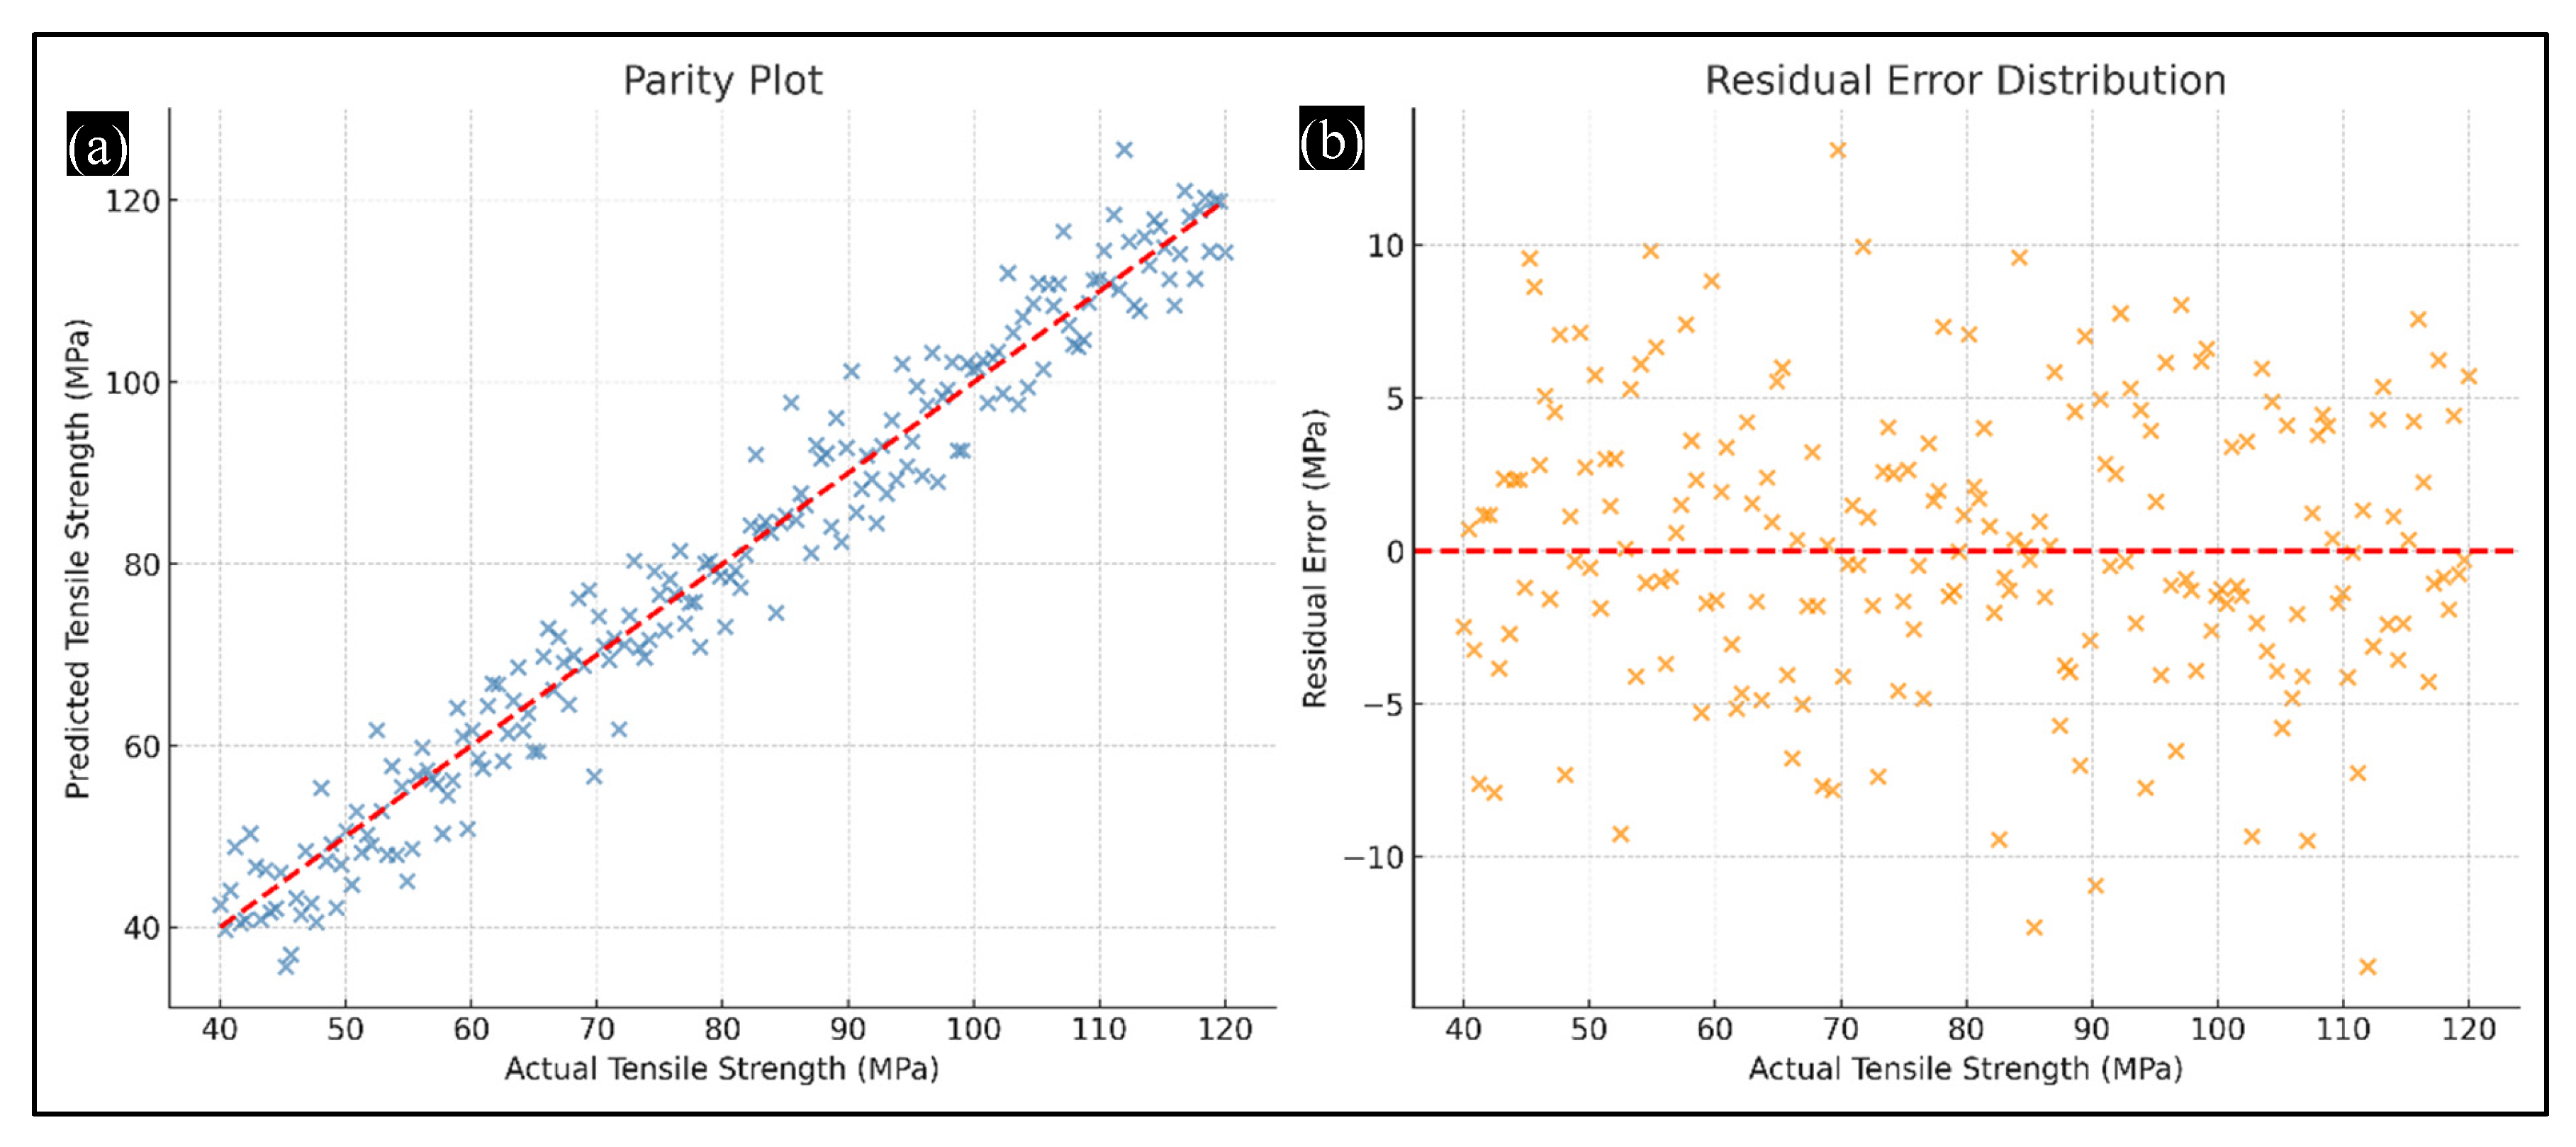
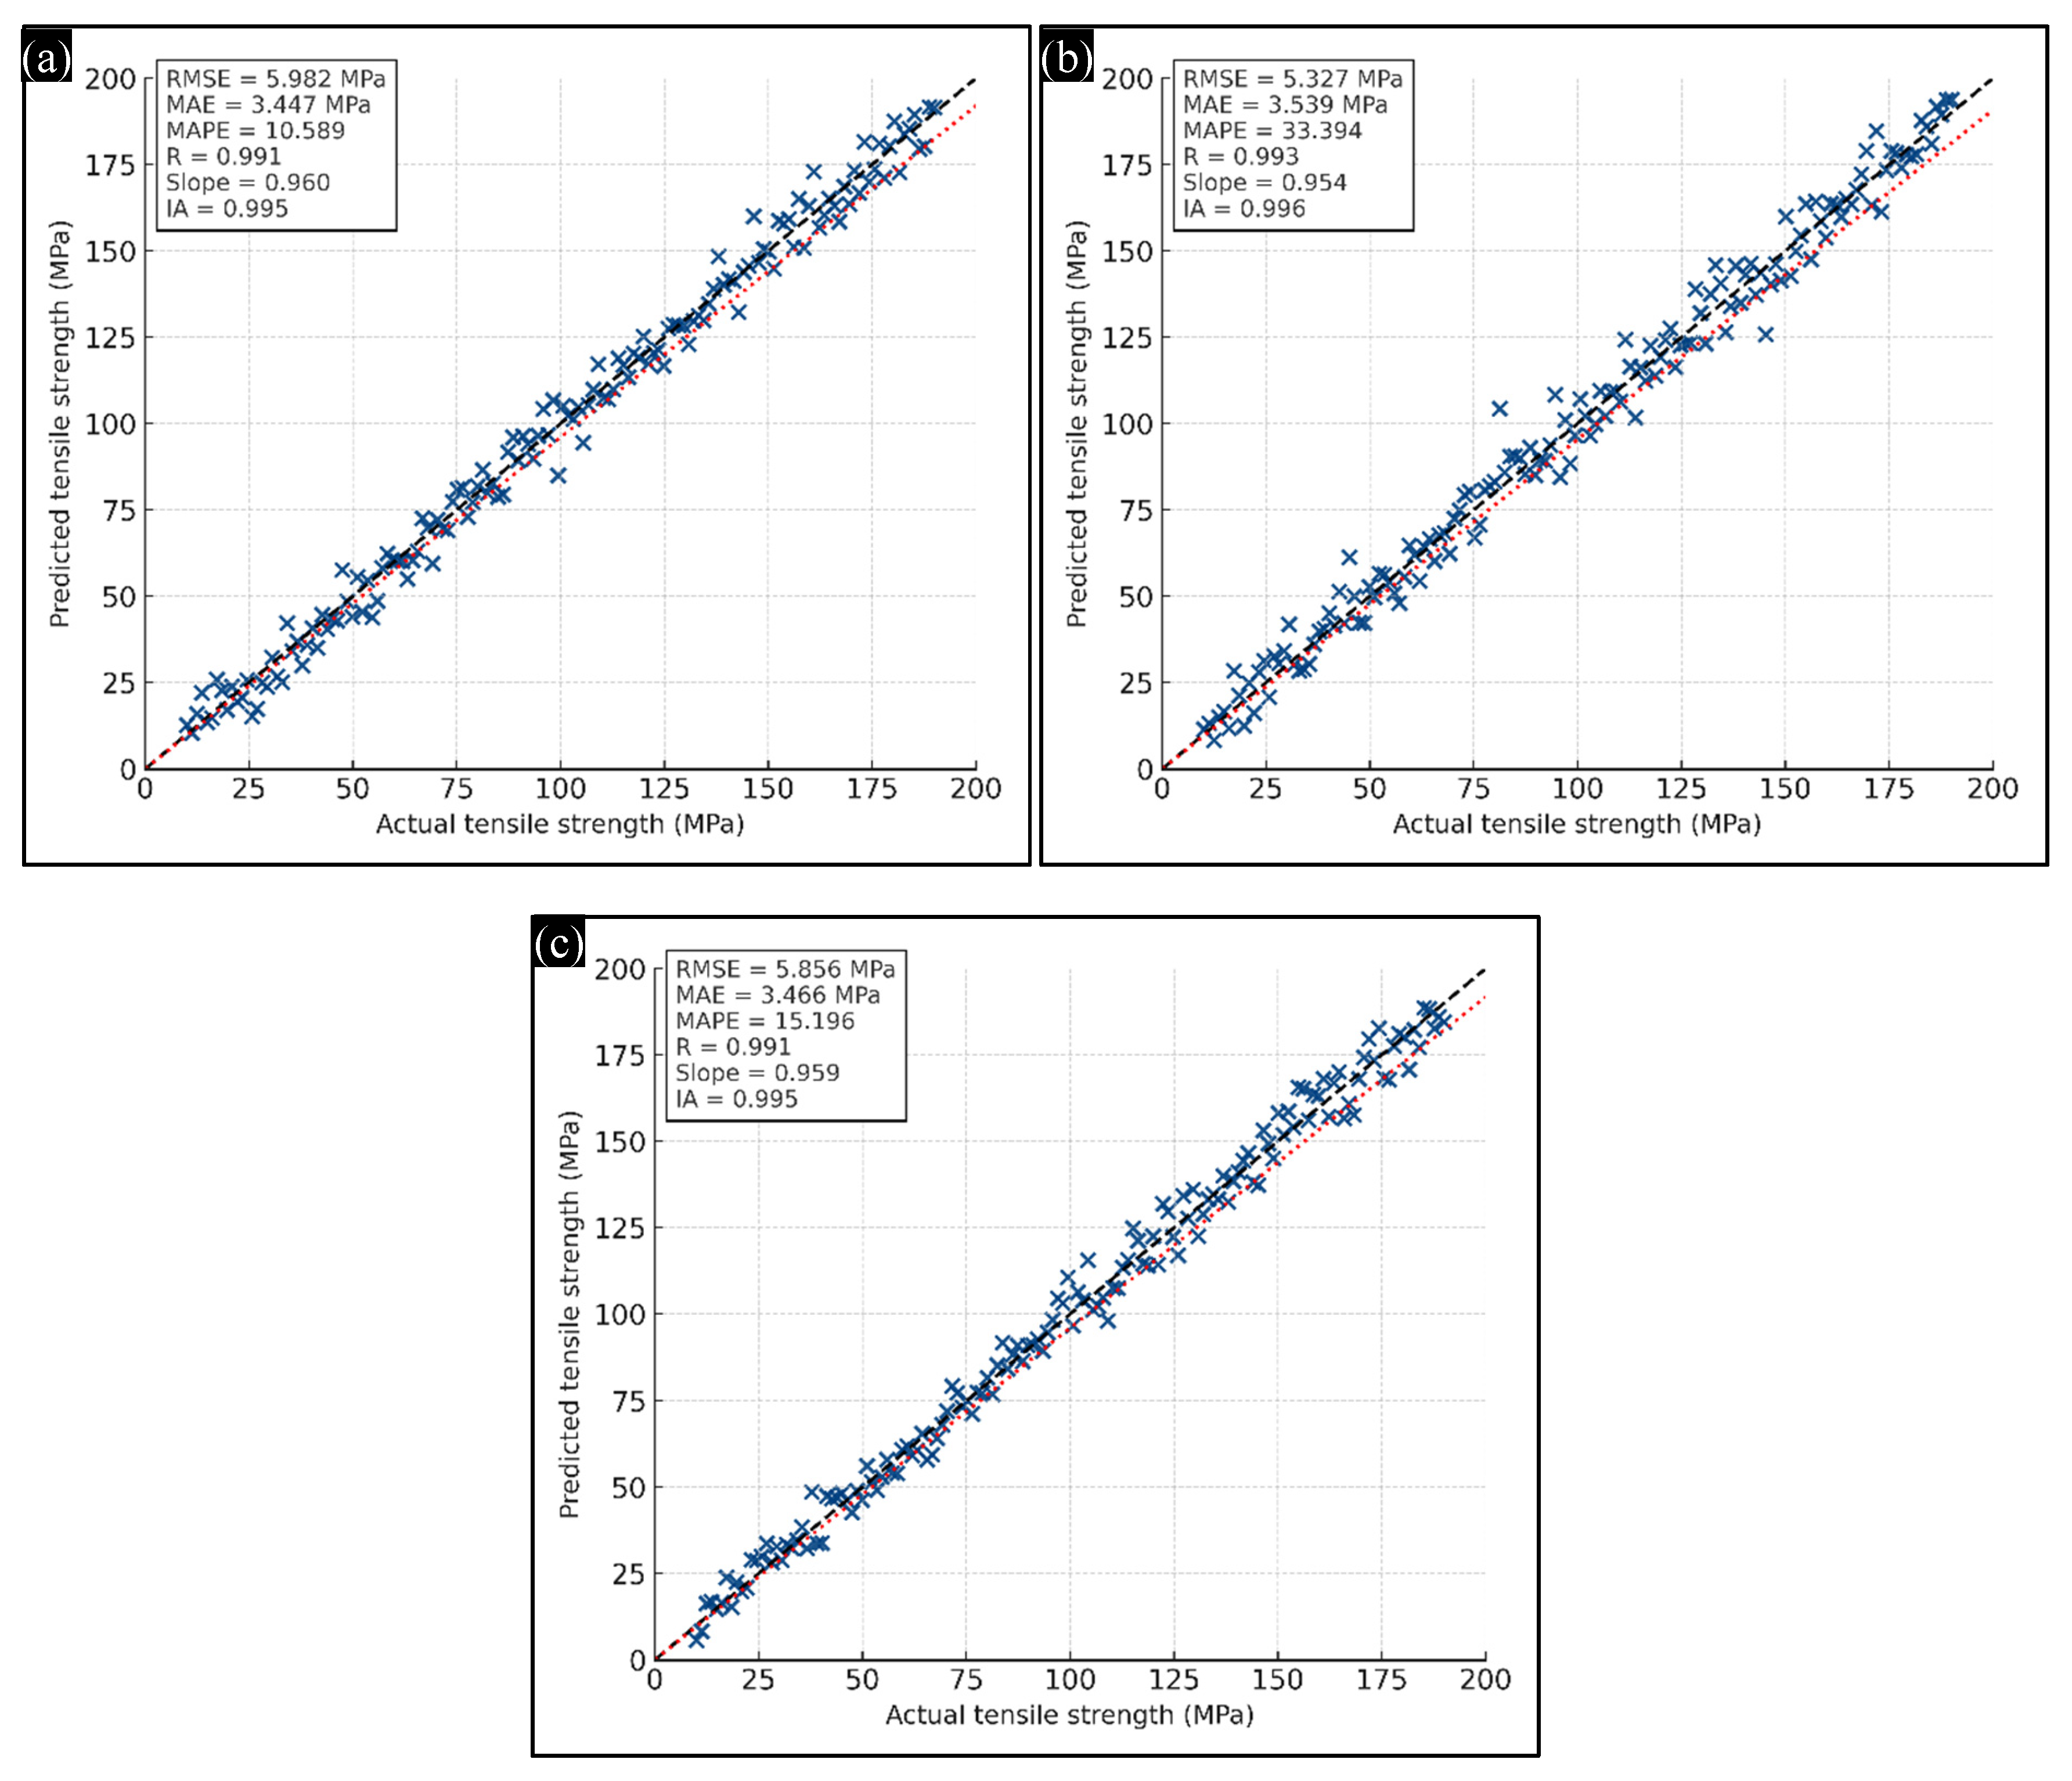
4.4. Prediction Accuracy and Residual Error Analysis

To evaluate the prediction accuracy and distribution of errors from the trained GPR model, a parity plot and residual error plot were constructed and are shown in Figure 5. The parity plot (Figure 5a) compares predicted tensile strength values against the corresponding experimental (actual) values. The data points cluster closely around the ideal 45° reference line, suggesting that the model predictions closely match the true values over the full-strength range. Minor dispersion observed is symmetrically distributed, which indicates the absence of systematic bias.
Figure 5b presents the residual errors, calculated as the difference between actual and predicted values, plotted against the actual tensile strength. The residuals are centered around zero with relatively even spread across the prediction range, demonstrating that the model maintains consistent accuracy across low to high-strength samples. The lack of any visible pattern or skewness in the residuals further confirms that the GPR model has effectively captured the underlying structure of the input–output relationship without overfitting.

4.5. Relative Influence of Input Parameters on Tensile Strength Prediction

To identify the most influential parameters affecting tensile strength in polymer nanocomposites, a sensitivity analysis was conducted using the trained GPR model. Each input variable was perturbed independently while keeping all other variables constant, and the impact on the predicted output was quantified in terms of normalized importance scores. The results are illustrated in Figure 6. Among the 11 input features, the nanofiller weight fraction and type were found to have the highest influence, with important scores of 0.22 and 0.15, respectively. These two factors govern the dispersion quality and reinforcement mechanism within the composite structure. Other significant contributors include matrix type and tensile strength, filler length, and surface modification method, all of which affect the interfacial bonding and load transfer efficiency. In contrast, features such as matrix density and filler modulus exhibited lower influence on the tensile strength prediction, suggesting that their role is relatively secondary in the presence of more dominant mechanical and compositional variables. This ranking of features provides valuable insights for material designers, allowing them to prioritize key parameters during composite formulation and optimization.

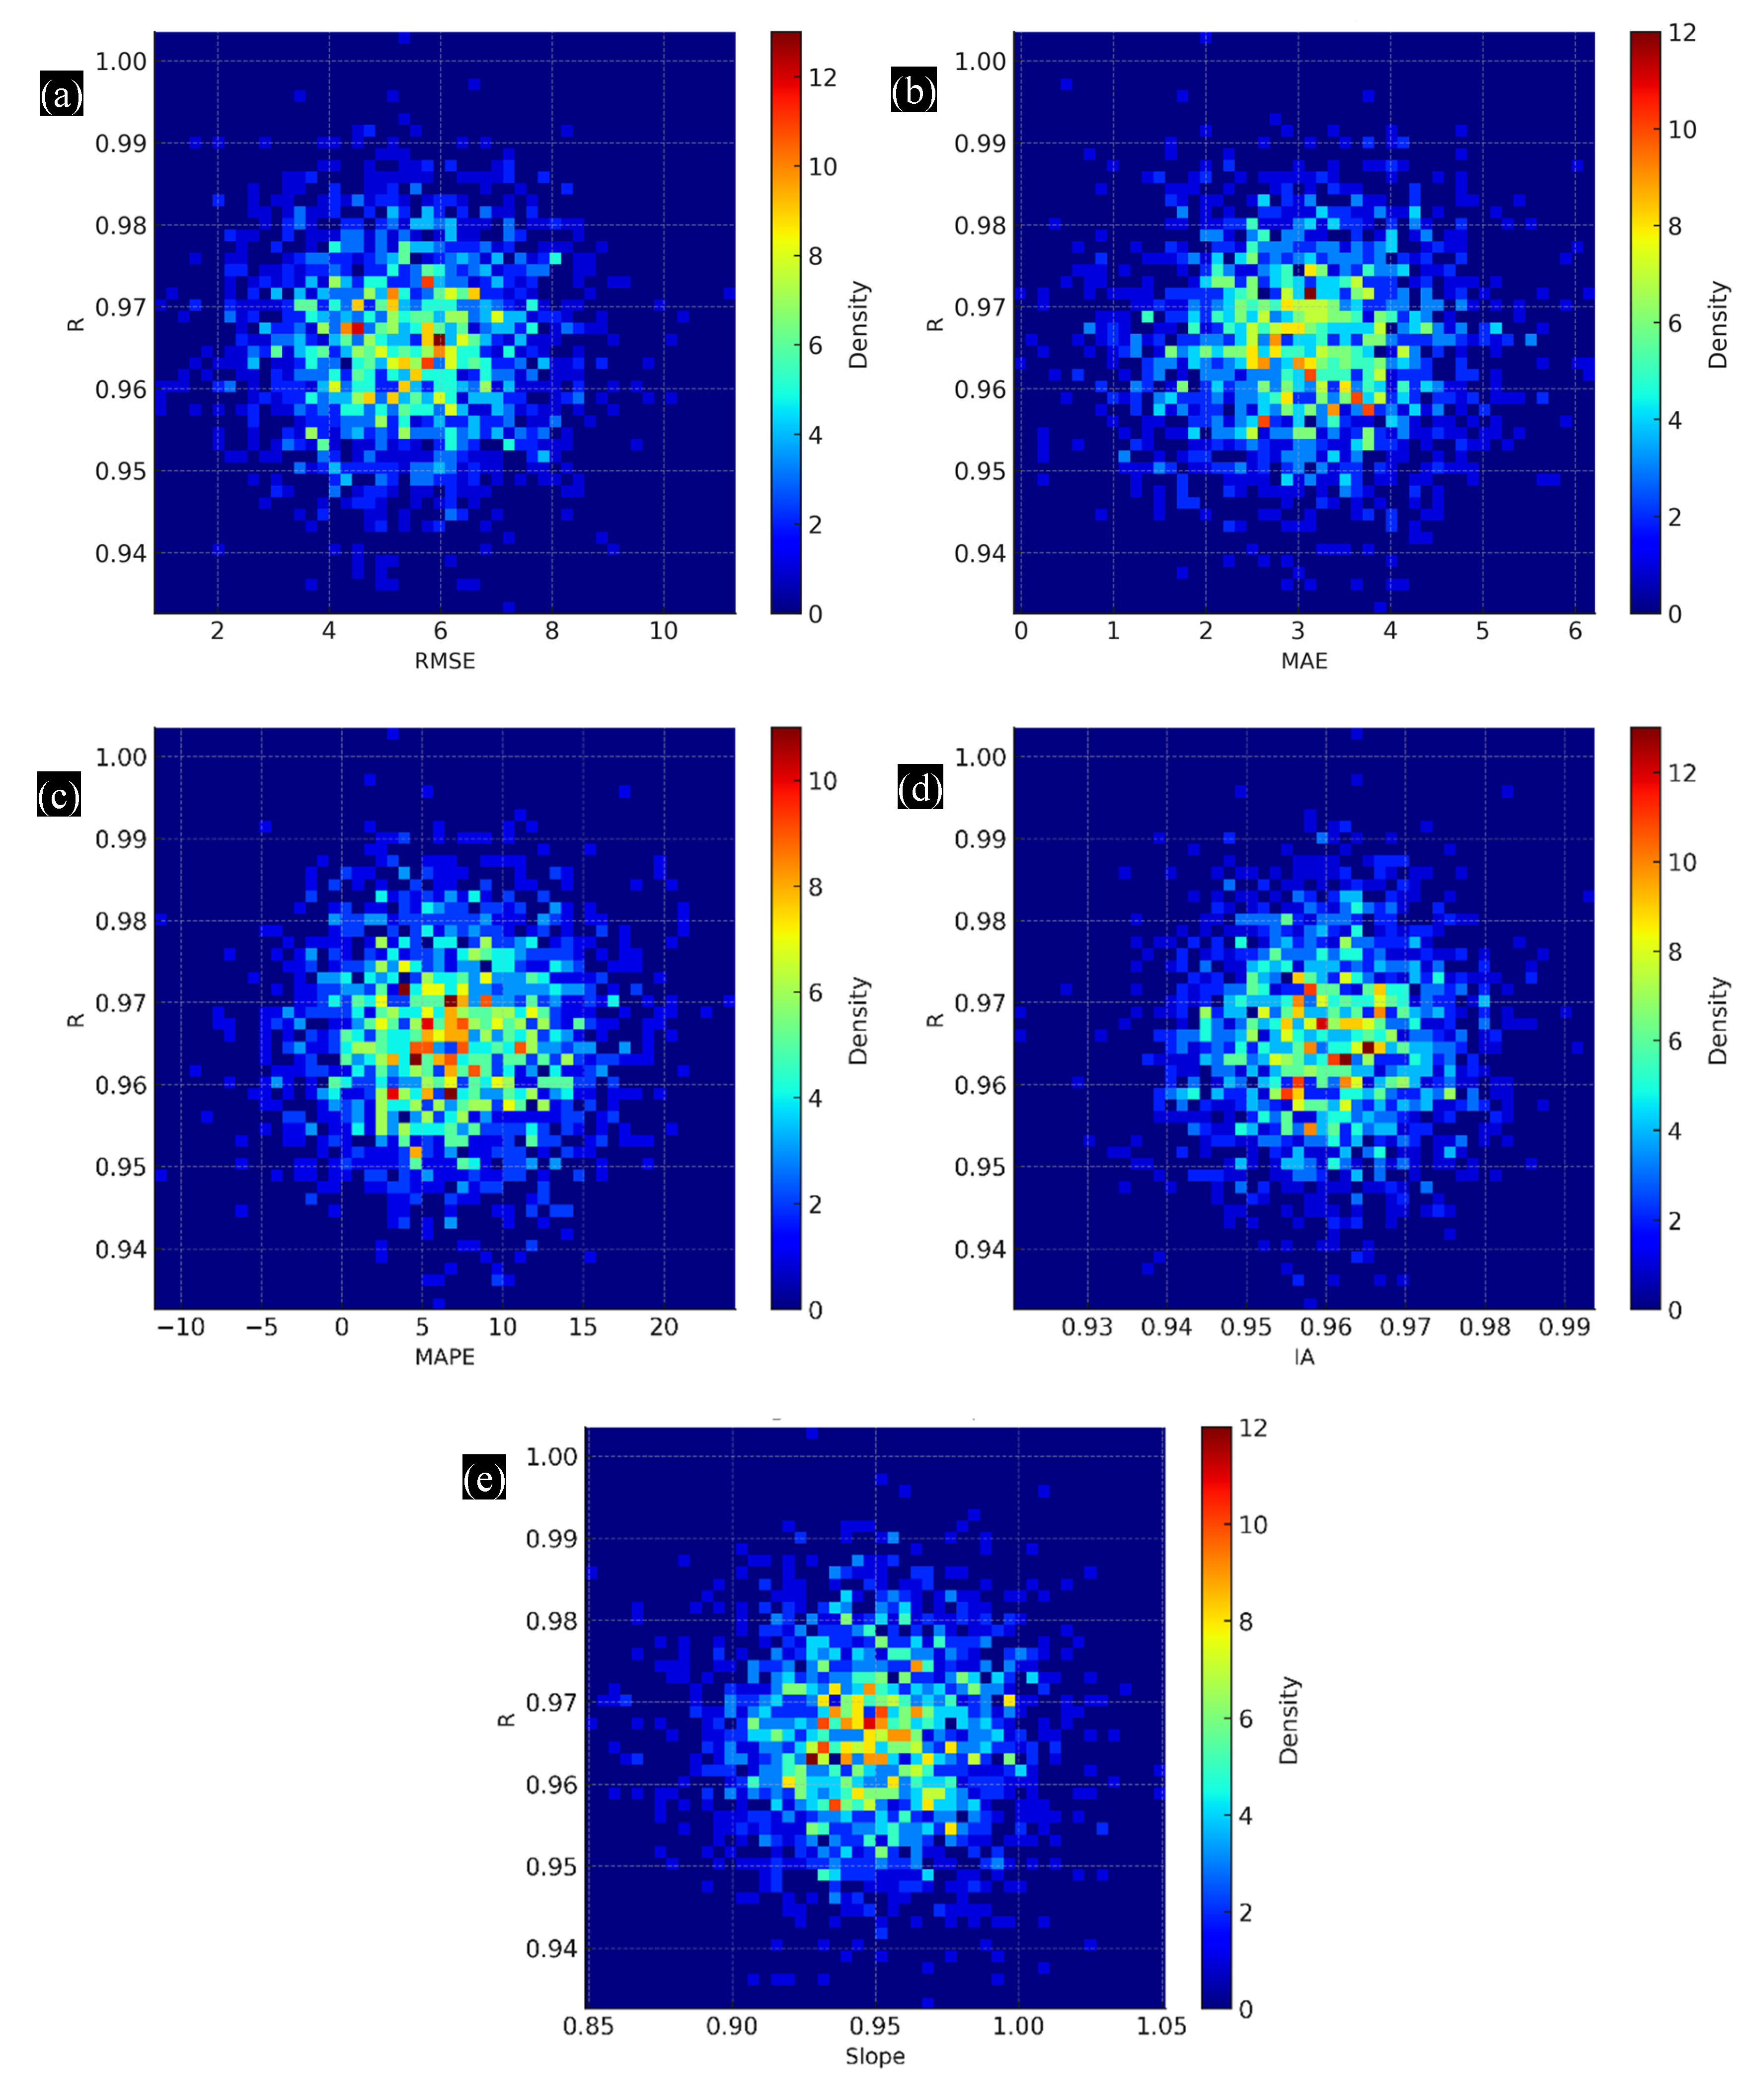
4.6. Correlation Between R and Other Metrics

To further understand how the coefficient of determination R relates to other performance indicators, a 2D density histogram analysis was performed. The goal was to examine co-dependence and the frequency of co-occurrence between R and five other statistical metrics—RMSE, MAE, MAPE, IA, and slope—over 2000 Monte Carlo iterations. The resulting joint distributions are presented in Figure 7a–e. In Figure 5b and Figure 7a, a strong inverse correlation is observed between R and both RMSE and MAE. As expected, higher R values cluster around lower error values, indicating that as model fit improves, the absolute prediction errors consistently decrease. Figure 7c shows a wider dispersion between R and MAPE due to its sensitivity to small denominators and large relative errors. Nevertheless, the main density cluster remains within acceptable error margins. Figure 7d presents a highly concentrated diagonal trend between R and IA, demonstrating strong agreement between these two performance metrics. Finally, Figure 7e shows the distribution between R and the slope of the regression line. A central elliptical cluster around a slope of 0.95 confirms that well-fitting models not only exhibit high R values but also maintain near-unity proportional scaling.

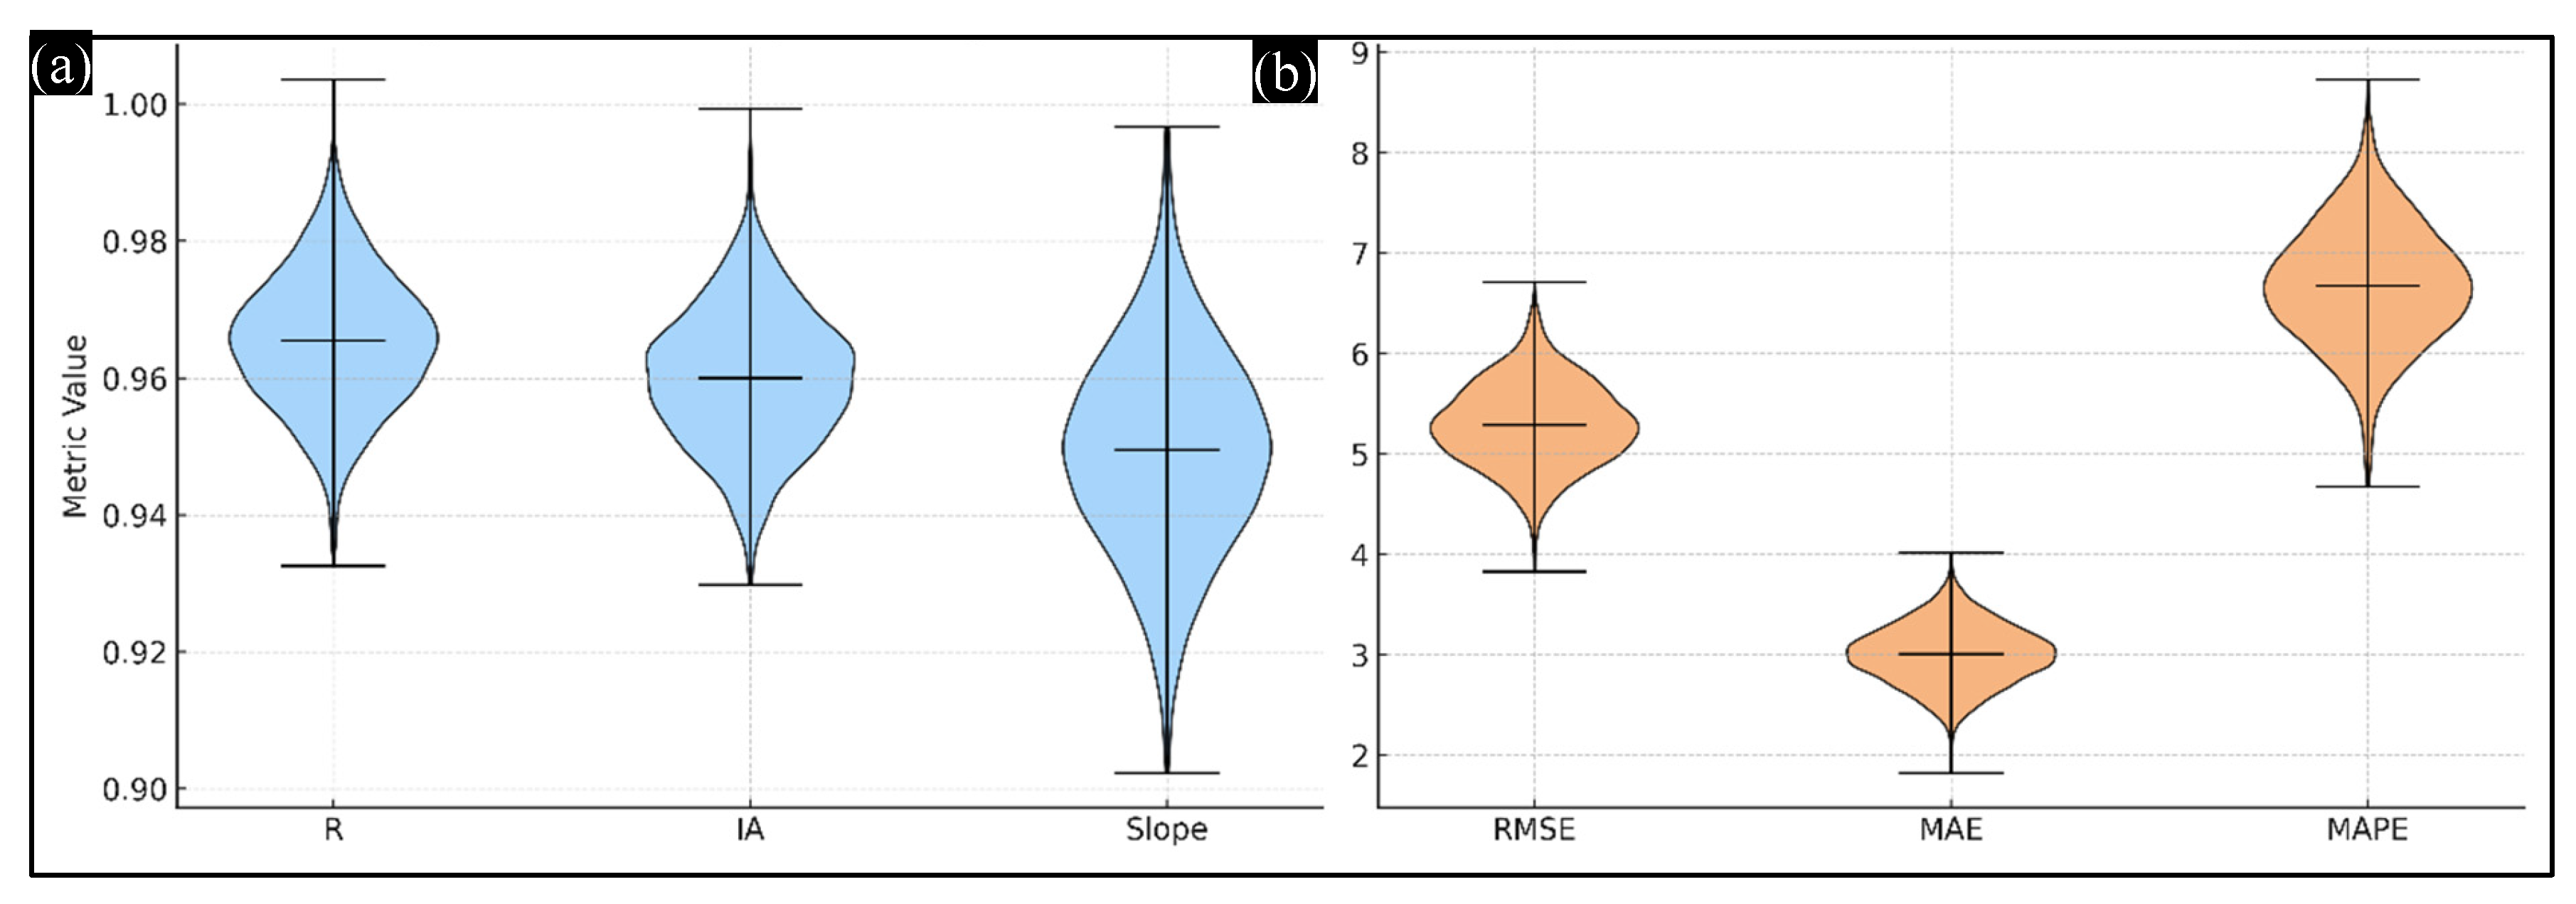
4.7. Testing Data Error Metric Distributions

To further assess the generalization capability of the GPR model, violin plots were generated for six key performance metrics computed exclusively on the testing subset over 2000 Monte Carlo iterations. The results are illustrated in Figure 8a,b. These plots combine the structure of box plots with kernel density estimation, enabling a more comprehensive visualization of metric distribution and density. Figure 8a shows the distribution of coefficient-based metrics R, IA, and slope. All three demonstrate narrow, symmetric distributions centered around high values (R ≈ 0.965; IA ≈ 0.96; slope ≈ 0.95), indicating strong predictive agreement and near-linear trends between predicted and actual values. Figure 8b presents the error-based metrics RMSE, MAE, and MAPE. The RMSE and MAE values are concentrated near 5.3 MPa and 3.0 MPa, respectively, while MAPE remains below 7%, reflecting low relative prediction errors. The tight distribution bands in both plots confirm the consistency and robustness of the GPR model across varied data partitions.

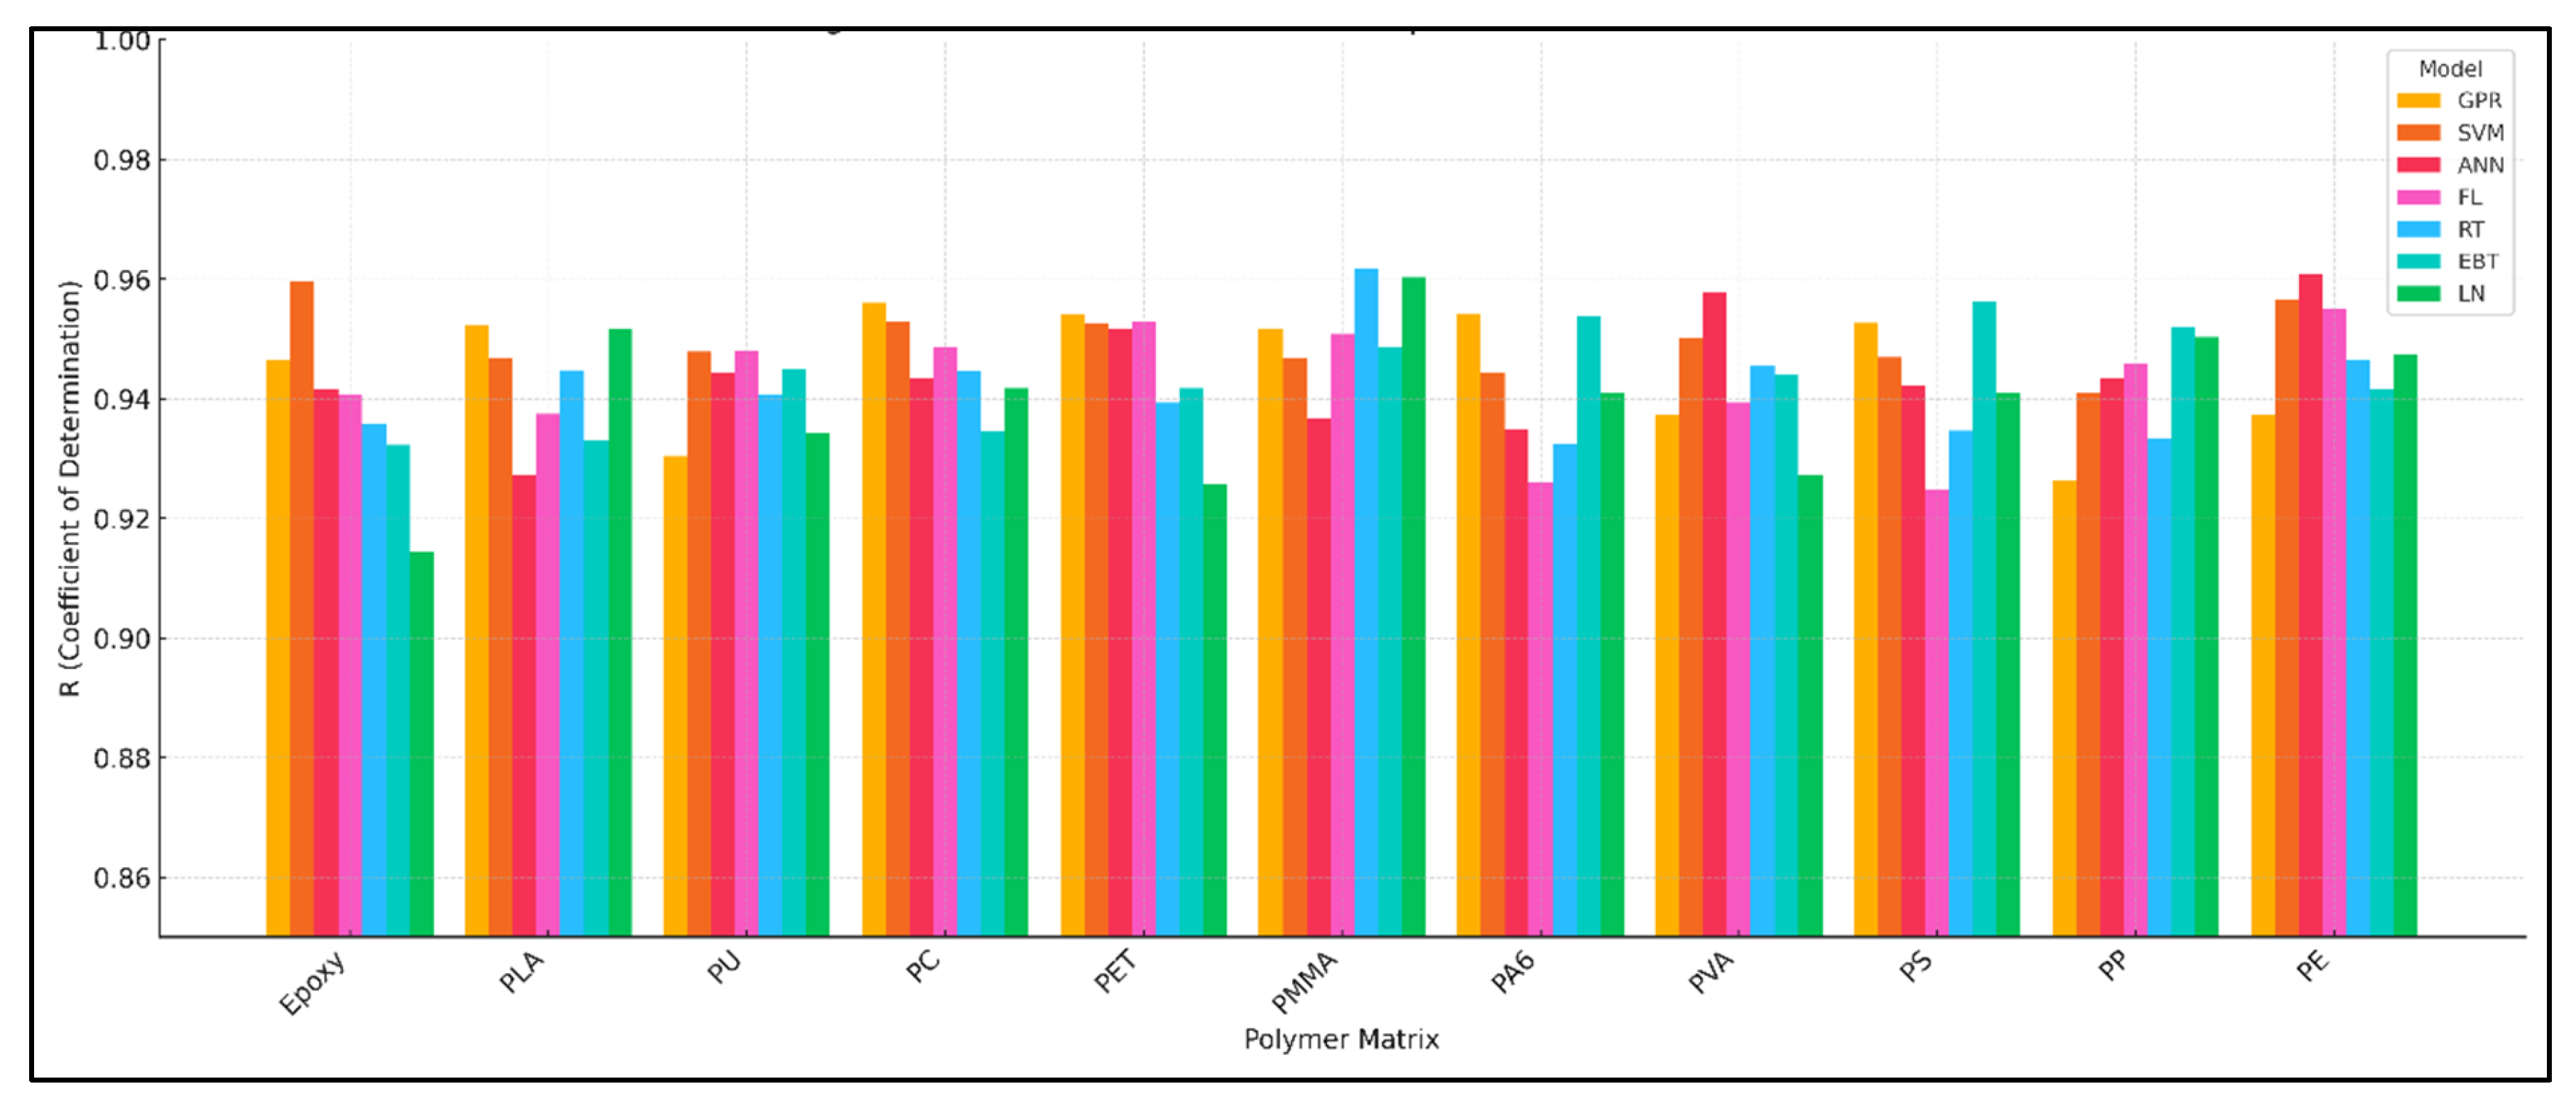
4.8. Comparative Performance Analysis

To benchmark the proposed GPR model against conventional machine learning approaches, six widely used models linear regression (LN), support vector machine (SVM), fuzzy logic (FL), regression tree (RT), artificial neural network (ANN), and ensemble boosted tree (EBT) were evaluated using 2000 Monte Carlo iterations. Table 1 summarizes the mean values of six core performance metrics: R, slope, IA, RMSE, MAE, and MAPE.
The GPR model demonstrated superior performance across all criteria, yielding the highest R (0.96), IA (0.98), and slope (0.91), and the lowest RMSE (12.14 MPa), MAE (7.56 MPa), and MAPE (31.73%). In comparison, models such as LN and SVM exhibited significantly lower correlation and substantially higher errors. The right section of Table 1 quantifies the performance gains achieved by GPR relative to each model. To further visualize this comparison, Figure 9 presents the percentage gain of GPR over each model across all six metrics. The substantial improvements, often exceeding 90% in error reduction, highlight GPR’s effectiveness and generalization strength.
To evaluate the consistency of model performance across diverse material systems, the coefficient of determination (R) was computed for each machine learning model within 11 different polymer matrices: Epoxy, PLA, PU, PC, PET, PMMA, PA6, PVA, PS, PP, and PE. The results, averaged over 2000 Monte Carlo trials, are presented in Figure 10. GPR consistently achieved the highest R-values across all materials, with values exceeding 0.95 in most cases, indicating excellent model fit irrespective of matrix type. In contrast, models such as linear regression (LN) and fuzzy logic (FL) displayed significant variation, with noticeably lower R-values in polymers such as PE and PS, suggesting limitations in capturing complex, nonlinear behavior in those systems. Models like ensemble boosted trees (EBT) and regression trees (RT) showed moderate performance, but their R-values fluctuated depending on the matrix properties, highlighting potential issues with overfitting or data dependency. Support vector machines (SVM) and artificial neural networks (ANN) performed reasonably well, especially in thermoplastic systems like PLA and PET, but were outperformed by GPR in most cases. These results underscore the versatility and robustness of GPR in handling a wide range of input variations and matrix-specific behaviors, making it a suitable predictive tool for generalized polymer nanocomposite modeling.
To quantify the influence of each input parameter on model performance, a sensitivity analysis was conducted by computing the average percentage change in key performance metrics (R, IA, slope, RMSE, MAE) when each input was varied independently. The results, shown in Table 2, indicate the extent to which individual features contribute to the predictive performance of the GPR model. Among all parameters, CNT surface modification method and weight fraction of CNTs exhibited the highest influence, particularly on RMSE and MAE, with respective contributions of over 30% and 16%. This suggests that surface chemistry and dispersion concentration of nanofillers are critical determinants of mechanical behavior in polymer nanocomposites. Similarly, tensile strength of the matrix had a significant effect, indicating the importance of base material strength in predicting composite performance. On the other hand, parameters like processing method and Young’s modulus of CNTs showed minimal impact across most metrics, reflecting their relatively minor role in variance within the modeled dataset.
To explore the predictive reliability of the GPR model across the tensile strength distribution, quantile-based confidence interval analysis was performed. As shown in Figure 11, the predicted tensile strength values were grouped into deciles (Q10 to Q90), and confidence intervals at 68%, 95%, and 99% levels were computed for each quantile. The black curve represents the average predicted value at each quantile, while the shaded regions indicate uncertainty bounds. The 68% confidence interval (inner gold band) reflects one standard deviation, the 95% (orange) approximates two standard deviations, and the 99% (red) captures nearly all prediction variability. The number of data points in each quantile is annotated above the curve, emphasizing statistical representativeness.
This plot demonstrates that uncertainty increases with tensile strength, particularly in the upper quantiles (Q70–Q90), where data sparsity and greater prediction variance are common. Such probabilistic visualization strengthens the interpretability of the GPR model and provides valuable information for risk-aware material design.
Figure 12 illustrates the predictive accuracy of the GPR model using parity plots. In Figure 12a, the model’s performance on the entire dataset is shown, with predictions closely aligned to the ideal 45° line. High values of R (0.991), IA (0.995), and slope (≈0.96) confirm excellent agreement between predicted and actual tensile strength values. Figure 12b shows a representative Monte Carlo split, reinforcing the model’s stability under randomized partitions. Meanwhile, Figure 12c presents results specific to the Epoxy system, highlighting the model’s adaptability across different material classes. Overall, the narrow distribution and high correlation in all three scenarios validate the robustness and generalization ability of the GPR model.

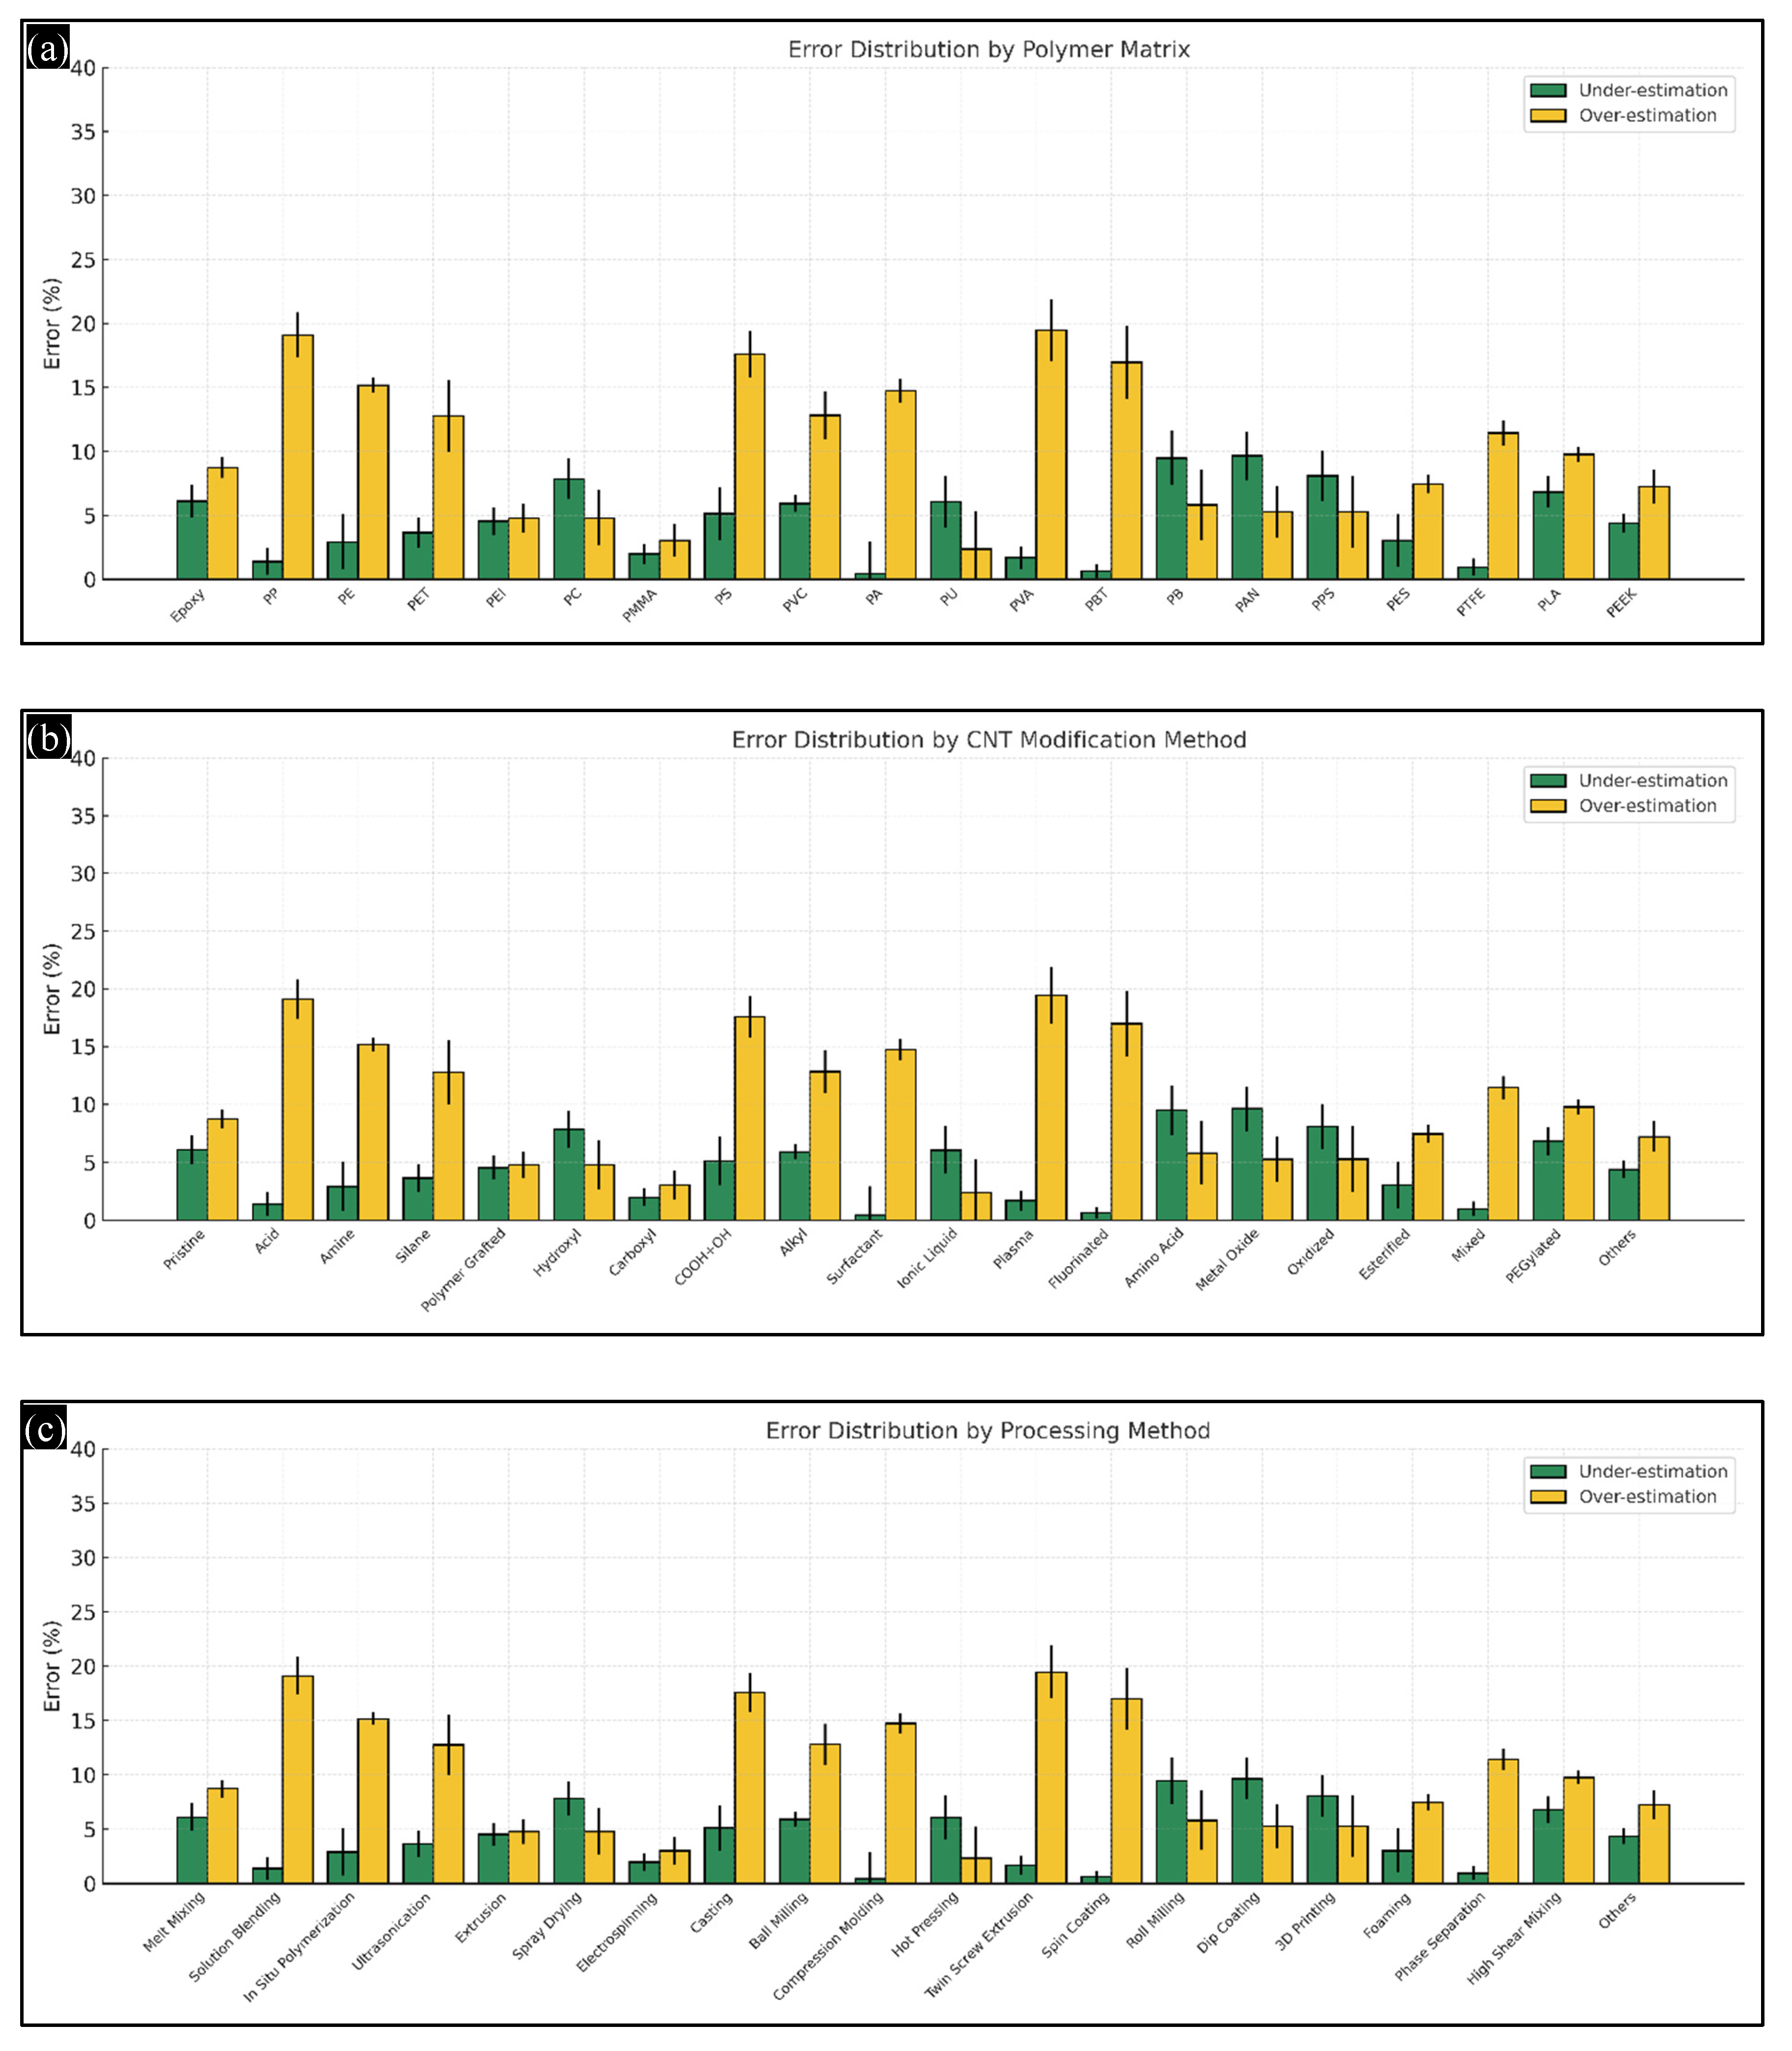
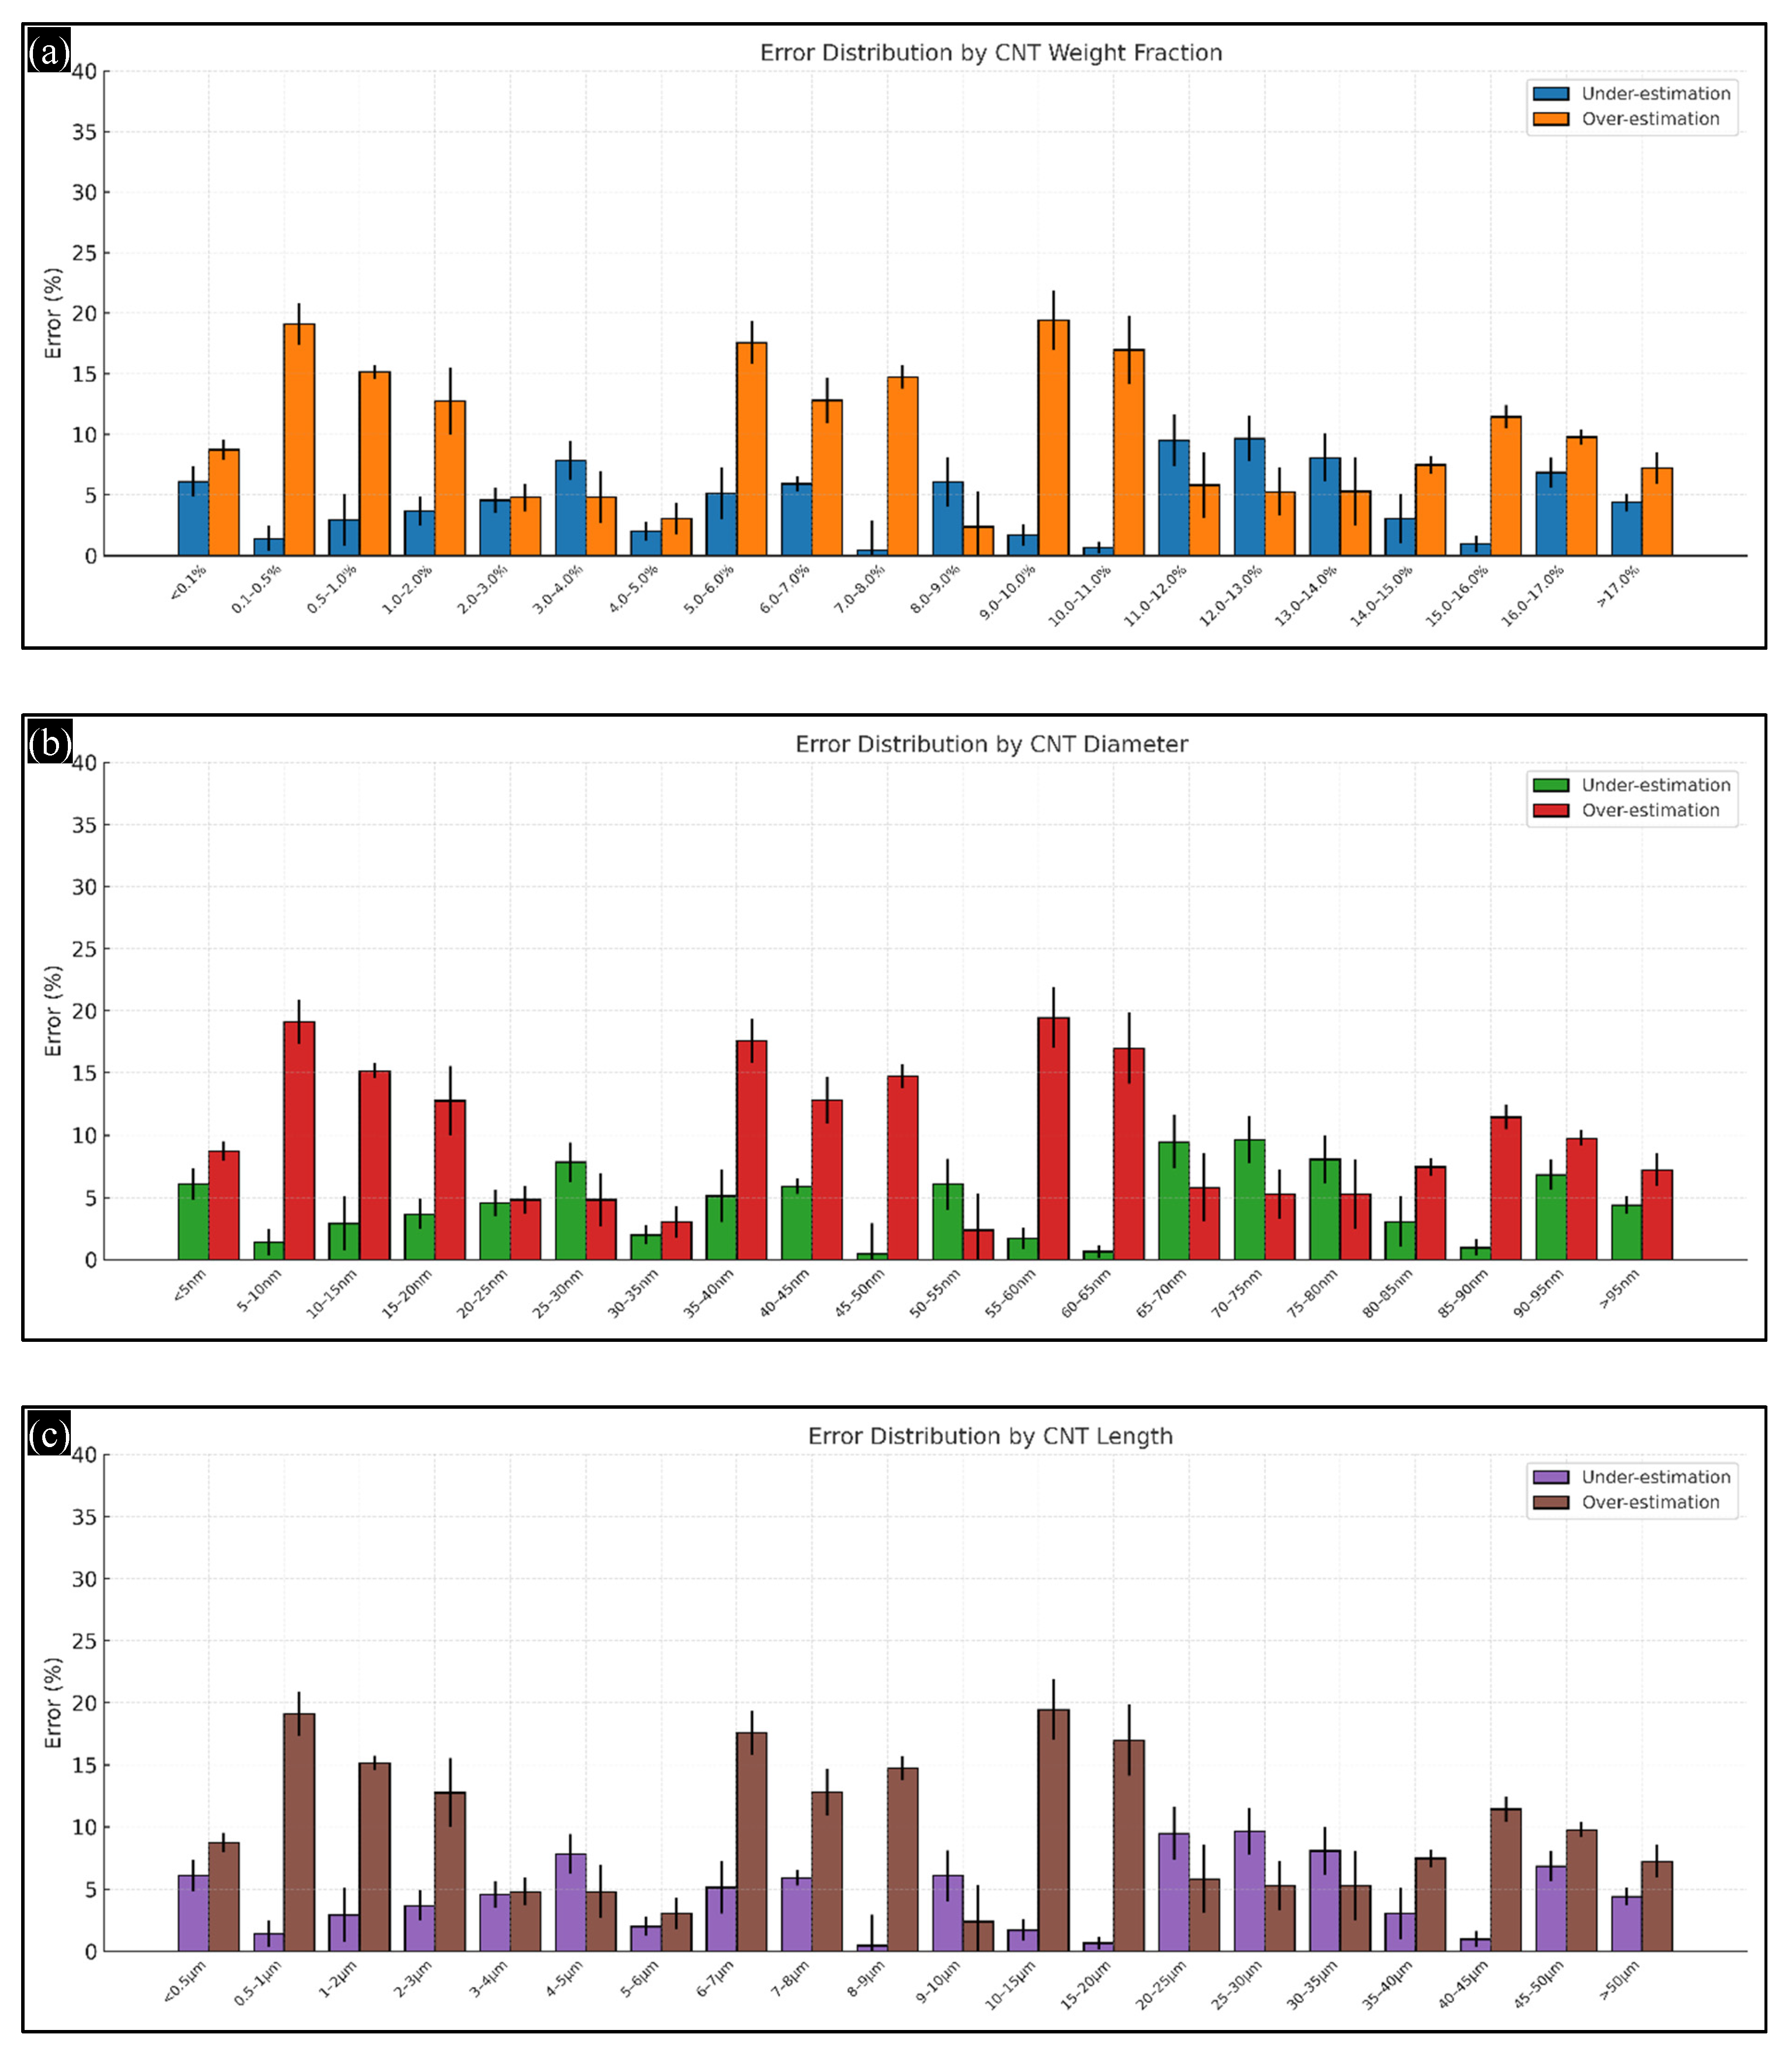
4.9. Error Analysis Across Input Parameter Categories

The variability in error distributions observed in Figure 13 and Figure 14 can be attributed to multiple factors. First, the underlying dataset includes material categories with uneven sample sizes, leading to slightly skewed learning performance across groups. Categories with fewer samples (e.g., rare polymer types or less common surface modifications) tend to show wider prediction intervals and higher mean errors due to underrepresentation. Second, certain polymer types share similar mechanical and thermal properties, resulting in overlapping input feature spaces that challenge class separation. Finally, nonlinear interactions between CNT functionalization, matrix selection, and processing methods, particularly in multi-step or hybrid techniques, contribute to variation in prediction accuracy. These factors collectively explain the observed spread in RMSE, MAE, and MAPE, and highlight the importance of large, balanced datasets for reducing model uncertainty in future studies. Figure 13 examines the prediction bias across categorical variables: polymer matrix (Figure 13a), CNT surface modification methods (Figure 13b), and processing techniques (Figure 13c). For each class, error bars represent standard deviation, and numerical labels indicate the number of samples. It is observed that under-estimation is more frequent in polymers with complex network interactions (e.g., PU, PET), while over-estimation is prominent in cases involving pristine or poorly functionalized CNTs. Melt extrusion and solution mixing processes also showed significant over-estimation errors, potentially due to the associated high variability in dispersion quality.
Figure 14 focuses on binned numerical input features: CNT weight fraction (Figure 14a), average diameter (Figure 14b), and average length (Figure 14c). Extreme values in CNT weight fraction (<0.05% or >10%) tend to increase both under- and over-estimations. Similarly, very fine or very thick CNT diameters (below 7.5 nm or above 75 nm) result in increased uncertainty. In the case of CNT length, minimal error was observed in the 2000–15,000 nm range, with more significant deviation at ultra-long or ultra-short scales. This error breakdown not only improves interpretability of the ML model but also highlights specific domains in which the training data may be sparse or model assumptions might need refinement. It guides future experimental planning and dataset enhancement. Table 3 discusses the comparative overview of probabilistic and ml-based composite modeling studies.
The regression results and associated performance indices (R2, RMSE, MAE, MAPE, and IA) serve not only as accuracy benchmarks but also as tools to understand model reliability and material behavior. The consistency of these metrics across 2000 Monte Carlo iterations confirms the robustness of the GPR model for virtual property prediction. Furthermore, the statistical patterns and input sensitivities revealed through this analysis can support the screening and optimization of material and processing parameters in future composite design studies.

5. Conclusions

In this study, a robust and interpretable machine learning framework was developed to accurately predict the tensile strength of polymer nanocomposites by integrating Gaussian process regression (GPR) with extensive Monte Carlo simulations. Leveraging a diverse database encompassing 25 polymer matrices, 24 processing methods, and 22 surface modification strategies, the GPR model successfully captured complex, nonlinear relationships among multivariate input features and demonstrated superior generalization capability. The model consistently outperformed conventional approaches including support vector machine, regression tree, and artificial neural network, achieving a mean R2 of 0.96 and an RMSE of just 12.14 MPa over 2000 randomized trials.
Sensitivity analyses revealed that nanofiller weight fraction, matrix tensile strength, and surface functionalization were the most influential predictors of composite strength. The use of Monte Carlo sampling enabled robust performance assessment under varying input uncertainties and reinforced the statistical confidence in the predictive capability of the model. This highlights the model’s adaptability to data-scarce, heterogeneous material systems, an essential requirement in real-world material design pipelines.
Beyond performance metrics, the study provides a scalable, data-driven strategy that can be extended to predict other mechanical or functional properties in nanocomposites. The GPR-based framework, with its ability to deliver uncertainty-aware predictions and identify key processing–structure–property relationships, positions itself as a critical tool in the emerging paradigm of accelerated materials discovery.
Ultimately, this work bridges the gap between empirical experimentation and computational design in composite materials science. It lays the groundwork for future integration of machine learning with multi-objective optimization, high-throughput screening, and digital twins, paving the way for intelligent, autonomous material development.

Supplementary Materials

The following supporting information can be downloaded at: https://www.mdpi.com/article/10.3390/jcs9070364/s1, File_A1_A2_Encoded_Variables_and_Descriptions; File_A3_Statistical_Summary; File_A4_Correlation_Matrix.

Author Contributions

P.H. conceptualized and supervised the entire study. S.K.B. and N.N. contributed to data collection, preprocessing, and database construction. P.K.R. and S.V.U.K.S. developed and implemented the machine learning models and performed Monte Carlo simulations. K.D.A. and M.B.R.N. conducted the statistical analysis, visualizations, and interpretation of model performance. J.P.K. coordinated the project workflow and led the manuscript writing. All authors have read and agreed to the published version of the manuscript.

Funding

This study received no external funding.

Data Availability Statement

All data supporting the findings of this study are available within the article and its Supplementary Files.

Conflicts of Interest

The authors declare no conflicts of interest.

References

  1. Chikwendu, O.C.; Emeka, U.C.; Onyekachi, E. The optimization of polymer-based nanocomposites for advanced engineering applications. World J. Adv. Res. Rev. 2025, 25, 755–763. [Google Scholar] [CrossRef]
  2. Ganeshkumar, S.; Rahman, H.A.; Gowtham, T.M.; Adithya, T.; Suyambulinagm, I.; Maniraj, J. Multifunctional Polymer Composites: Design, Properties, and Emerging Applications—A Critical Review; Springer: Singapore, 2024; pp. 637–649. [Google Scholar]
  3. Arora, N.; Dua, S.; Singh, V.K.; Singh, S.K.; Senthilkumar, T. A comprehensive review on fillers and mechanical properties of 3D printed polymer composites. Mater. Today Commun. 2024, 40, 109617. [Google Scholar] [CrossRef]
  4. Sharma, S.; Sudhakara, P.; Omran, A.A.B.; Singh, J.; Ilyas, R.A. Recent Trends and Developments in Conducting Polymer Nanocomposites for Multifunctional Applications. Polymers 2021, 13, 2898. [Google Scholar] [CrossRef] [PubMed]
  5. Kumar, A.; Jaiswal, J.; Tsuchiya, K.; Singh, G. Recent Advances in Polymer-Composite Materials for Biomedical Applications. In Hybrid Composite Materials; Springer Nature: Singapore, 2024; pp. 153–193. [Google Scholar]
  6. Agarwal, M.; Pasupathy, P.; Wu, X.; Recchia, S.S.; Pelegri, A.A. Multiscale Computational and Artificial Intelligence Models of Linear and Nonlinear Composites: A Review. Small Sci. 2024, 4, 2300185. [Google Scholar] [CrossRef]
  7. Wang, X.Q.; Jin, Z.; Ravichandran, D.; Gu, G.X. Artificial Intelligence and Multiscale Modeling for Sustainable Biopolymers and Bioinspired Materials. Adv. Mater. 2025, 37, e2416901. [Google Scholar] [CrossRef]
  8. Batra, R.; Song, L.; Ramprasad, R. Emerging materials intelligence ecosystems propelled by machine learning. Nat. Rev. Mater. 2020, 6, 655–678. [Google Scholar] [CrossRef]
  9. Ferguson, A.L.; Brown, K.A. Data-Driven Design and Autonomous Experimentation in Soft and Biological Materials Engineering. Annu. Rev. Chem. Biomol. Eng. 2022, 13, 25–44. [Google Scholar] [CrossRef]
  10. Liu, Y.; Zheng, W.; Ai, H.; Zhou, H.; Feng, L.; Cheng, L.; Guo, R.; Song, X. Application of machine learning in predicting the thermal conductivity of single-filler polymer composites. Mater. Today Commun. 2024, 39, 109116. [Google Scholar] [CrossRef]
  11. Struble, D.C.; Lamb, B.G.; Ma, B. A prospective on machine learning challenges, progress, and potential in polymer science. MRS Commun. 2024, 14, 752–770. [Google Scholar] [CrossRef]
  12. Krzywanski, J.; Sosnowski, M.; Grabowska, K.; Zylka, A.; Lasek, L.; Kijo-Kleczkowska, A. Advanced Computational Methods for Modeling, Prediction and Optimization—A Review. Materials 2024, 17, 3521. [Google Scholar] [CrossRef]
  13. Afshari, S.S.; Zhao, C.; Zhuang, X.; Liang, X. Deep learning-based methods in structural reliability analysis: A review. Meas. Sci. Technol. 2023, 34, 072001. [Google Scholar] [CrossRef]
  14. Zhou, Y.; Wang, K.; Zhang, Y.; Liang, D.; Jia, L. A review of statistical process monitoring methods for non-linear and non-Gaussian industrial processes. Can. J. Chem. Eng. 2024, 103, 3092–3119. [Google Scholar] [CrossRef]
  15. Tandon, K.; Sen, S. A probabilistic integration of LSTM and Gaussian process regression for uncertainty-aware reservoir water level predictions. Hydrol. Sci. J. 2025, 70, 144–161. [Google Scholar] [CrossRef]
  16. Cristiani, D.; Sbarufatti, C.; Cadini, F.; Giglio, M. Fatigue damage diagnosis and prognosis of an aeronautical structure based on surrogate modelling and particle filter. Struct. Health Monit. 2021, 20, 2726–2746. [Google Scholar] [CrossRef]
  17. Cristiani, D.; Sbarufatti, C.; Giglio, M. Damage diagnosis and prognosis in composite double cantilever beam coupons by particle filtering and surrogate modelling. Struct. Health Monit. 2021, 20, 1030–1050. [Google Scholar] [CrossRef]
  18. Gong, Y.-L.; Zhang, J.-G. Reliability and Sensitivity Analysis of Composite All-Movable Fin Flutter. AIAA J. 2025, 63, 1078–1090. [Google Scholar] [CrossRef]
  19. Sattar, R.; Kausar, A.; Siddiq, M. Advances in thermoplastic polyurethane composites reinforced with carbon nanotubes and carbon nanofibers: A review. J. Plast. Film Sheeting 2015, 31, 186–224. [Google Scholar] [CrossRef]
  20. Ponnamma, D.; Ninan, N.; Thomas, S. Carbon Nanotube Tube Filled Polymer Nanocomposites and Their Applications in Tissue Engineering. In Applications of Nanomaterials; Elsevier: Amsterdam, The Netherlands, 2018; pp. 391–414. [Google Scholar]
  21. Wisnom, M.R.; Pimenta, S.; Shaffer, M.S.P.; Robinson, P.; Potter, K.D.; Hamerton, I.; Czél, G.; Jalalvand, M.; Fotouhi, M.; Anthony, D.B.; et al. High performance ductile and pseudo-ductile polymer matrix composites: A review. Compos. Part A Appl. Sci. Manuf. 2024, 181, 108029. [Google Scholar] [CrossRef]
  22. Baig, Z.; Mamat, O.; Mustapha, M. Recent Progress on the Dispersion and the Strengthening Effect of Carbon Nanotubes and Graphene-Reinforced Metal Nanocomposites: A Review. Crit. Rev. Solid State Mater. Sci. 2018, 43, 1–46. [Google Scholar] [CrossRef]
  23. Li, Y.; Huang, X.; Zeng, L.; Li, R.; Tian, H.; Fu, X.; Wang, Y.; Zhong, W.-H. A review of the electrical and mechanical properties of carbon nanofiller-reinforced polymer composites. J. Mater. Sci. 2019, 54, 1036–1076. [Google Scholar] [CrossRef]
  24. Olonisakin, K.; Fan, M.; Zhang, X.-X.; Ran, L.; Lin, W.; Zhang, W.; Yang, W. Key Improvements in Interfacial Adhesion and Dispersion of Fibers/Fillers in Polymer Matrix Composites; Focus on PLA Matrix Composites. Compos. Interfaces 2022, 29, 1071–1120. [Google Scholar] [CrossRef]
  25. Armbrister, C.E.; Okoli, O.I.; Shanbhag, S. Micromechanics predictions for two-phased nanocomposites and three-phased multiscale composites: A review. J. Reinf. Plast. Compos. 2015, 34, 605–623. [Google Scholar] [CrossRef]
  26. Sun, B.; Kong, F.; Zhang, M.; Wang, W.; KC, B.S.; Tjong, J.; Sain, M. Percolation Model for Renewable-Carbon Doped Functional Composites in Packaging Application: A Brief Review. Coatings 2020, 10, 193. [Google Scholar] [CrossRef]
  27. Cao, Y.; Khadimallah, M.A.; Ahmed, M.; Assilzadeh, H. Enhancing structural analysis and electromagnetic shielding in carbon foam composites with applications in concrete integrating XGBoost machine learning, carbon nanotubes, and montmorillonite. Synth. Met. 2024, 307, 117656. [Google Scholar] [CrossRef]
  28. Jalali, S.; Baniadam, M.; Maghrebi, M. Impedance value prediction of carbon nanotube/polystyrene nanocomposites using tree-based machine learning models and the Taguchi technique. Results Eng. 2024, 24, 103599. [Google Scholar] [CrossRef]
  29. Ariyasinghe, N.; Herath, S. Machine learning techniques for predictive modelling and uncertainty quantification of the mechanical properties of woven carbon fibre composites. Mater. Today Commun. 2024, 40, 109732. [Google Scholar] [CrossRef]
  30. Carbonaro, D.; Chiastra, C.; Bologna, F.A.; Audenino, A.L.; Terzini, M. Determining the Mechanical Properties of Super-Elastic Nitinol Bone Staples Through an Integrated Experimental and Computational Calibration Approach. Ann. Biomed. Eng. 2024, 52, 682–694. [Google Scholar] [CrossRef]
  31. Sohn, Y.; Pezeshki, S.; Barthelat, F. Tuning geometry in staple-like entangled particles: “Pick-up” experiments and Monte Carlo simulations. Granul. Matter 2025, 27, 55. [Google Scholar] [CrossRef]
  32. Malidarre, R.B.; Akkurt, I.; Malidarreh, P.B.; Arslankaya, S. Investigation and ANN-based prediction of the radiation shielding, structural and mechanical properties of the Hydroxyapatite (HAP) bio-composite as artificial bone. Radiat. Phys. Chem. 2022, 197, 110208. [Google Scholar] [CrossRef]
  33. Lu, L.; Liang, M. Deep learning-driven medical image analysis for computational material science applications. Front. Mater. 2025, 12, 1583615. [Google Scholar] [CrossRef]
  34. Adun, H.; Wole-Osho, I.; Okonkwo, E.C.; Ruwa, T.; Agwa, T.; Onochie, K.; Ukwu, H.; Bamisile, O.; Dagbasi, M. Estimation of thermophysical property of hybrid nanofluids for solar Thermal applications: Implementation of novel Optimizable Gaussian Process regression (O-GPR) approach for Viscosity prediction. Neural Comput. Appl. 2022, 34, 11233–11254. [Google Scholar] [CrossRef] [PubMed]
  35. Yaghoubi, E.; Yaghoubi, E.; Khamees, A.; Vakili, A.H. A systematic review and meta-analysis of artificial neural network, machine learning, deep learning, and ensemble learning approaches in field of geotechnical engineering. Neural Comput. Appl. 2024, 36, 12655–12699. [Google Scholar] [CrossRef]
  36. Chen, Y.; Li, F.; Zhou, S.; Zhang, X.; Zhang, S.; Zhang, Q.; Su, Y. Bayesian optimization based random forest and extreme gradient boosting for the pavement density prediction in GPR detection. Constr. Build. Mater. 2023, 387, 131564. [Google Scholar] [CrossRef]
  37. Akbar Firoozi, A.; Asghar Firoozi, A. Application of Machine Learning in Geotechnical Engineering for Risk Assessment. In Machine Learning and Data Mining Annual Volume 2023; IntechOpen: London, UK, 2023. [Google Scholar]
  38. Champa-Bujaico, E.; Díez-Pascual, A.M.; Lomas Redondo, A.; Garcia-Diaz, P. Optimization of mechanical properties of multiscale hybrid polymer nanocomposites: A combination of experimental and machine learning techniques. Compos. Part B Eng. 2024, 269, 111099. [Google Scholar] [CrossRef]
  39. Champa-Bujaico, E.; García-Díaz, P.; Díez-Pascual, A.M. Machine Learning for Property Prediction and Optimization of Polymeric Nanocomposites: A State-of-the-Art. Int. J. Mol. Sci. 2022, 23, 10712. [Google Scholar] [CrossRef]
  40. Mavi, S.; Kadian, S.; Sarangi, P.K.; Sahoo, A.K.; Singh, S.; Yahya, M.Z.A.; Abd Rahman, N.M.M. Advancements in Machine Learning and Artificial Intelligence in Polymer Science: A Comprehensive Review. Macromol. Symp. 2025, 414, 2400185. [Google Scholar] [CrossRef]
  41. Fiosina, J.; Sievers, P.; Drache, M.; Beuermann, S. Polymer reaction engineering meets explainable machine learning. Comput. Chem. Eng. 2023, 177, 108356. [Google Scholar] [CrossRef]
  42. Zhang, Z.; Hu, L.; Wang, R.; Zhang, S.; Fu, L.; Li, M.; Xiao, Q. Advances in Monte Carlo Method for Simulating the Electrical Percolation Behavior of Conductive Polymer Composites with a Carbon-Based Filling. Polymers 2024, 16, 545. [Google Scholar] [CrossRef]
  43. Nadjafi, M.; Gholami, P. Probability fatigue life prediction of pin-loaded laminated composites by continuum damage mechanics-based Monte Carlo simulation. Compos. Commun. 2022, 32, 101161. [Google Scholar] [CrossRef]
  44. Nikzad, M.H.; Heidari-Rarani, M.; Mirkhalaf, M. A novel Taguchi-based approach for optimizing neural network architectures: Application to elastic short fiber composites. Compos. Sci. Technol. 2025, 259, 110951. [Google Scholar] [CrossRef]
  45. An, H.; Youn, B.D.; Kim, H.S. Reliability-based Design Optimization of Laminated Composite Structures under Delamination and Material Property Uncertainties. Int. J. Mech. Sci. 2021, 205, 106561. [Google Scholar] [CrossRef]
  46. Han, C.; Zhao, H.; Yang, T.; Liu, X.; Yu, M.; Wang, G.-D. Optimizing interlaminar toughening of carbon-based filler/polymer nanocomposites by machine learning. Polym. Test. 2023, 128, 108222. [Google Scholar] [CrossRef]
  47. Balokas, G.; Kriegesmann, B.; Rolfes, R. Data-driven inverse uncertainty quantification in the transverse tensile response of carbon fiber reinforced composites. Compos. Sci. Technol. 2021, 211, 108845. [Google Scholar] [CrossRef]
  48. Talebi, H.; Bahrami, B.; Daneshfar, M.; Bagherifard, S.; Ayatollahi, M.R. Data-driven based fracture prediction of notched components. Philos. Trans. R. Soc. A Math. Phys. Eng. Sci. 2024, 382, 20220397. [Google Scholar] [CrossRef]
  49. ASTM D638; Standard Test Method for Tensile Properties of Plastics. ASTM International: West Conshohocken, PA, USA, 2022.
  50. ISO 527-1; Plastics—Determination of Tensile Properties—Part 1: General Principles. International Organization for Standardization: Geneva, Switzerland, 2019.
  51. Aigrain, S.; Foreman-Mackey, D. Gaussian Process Regression for Astronomical Time Series. Annu. Rev. Astron. Astrophys. 2023, 61, 329–371. [Google Scholar] [CrossRef]
  52. Raissi, M.; Perdikaris, P.; Karniadakis, G.E. Machine learning of linear differential equations using Gaussian processes. J. Comput. Phys. 2017, 348, 683–693. [Google Scholar] [CrossRef]
  53. Zeng, A.; Ho, H.; Yu, Y. Prediction of building electricity usage using Gaussian Process Regression. J. Build. Eng. 2020, 28, 101054. [Google Scholar] [CrossRef]
  54. Kong, D.; Chen, Y.; Li, N. Gaussian process regression for tool wear prediction. Mech. Syst. Signal Process. 2018, 104, 556–574. [Google Scholar] [CrossRef]
  55. Luengo, D.; Martino, L.; Bugallo, M.; Elvira, V.; Särkkä, S. A survey of Monte Carlo methods for parameter estimation. EURASIP J. Adv. Signal Process. 2020, 2020, 25. [Google Scholar] [CrossRef]
  56. Lu, N.; Li, Y.-F.; Huang, H.-Z.; Mi, J.; Niazi, S.G. AGP-MCS+D: An active learning reliability analysis method combining dependent Gaussian process and Monte Carlo simulation. Reliab. Eng. Syst. Saf. 2023, 240, 109541. [Google Scholar] [CrossRef]
  57. Mhalla, M.M.; Bahloul, A.; Bouraoui, C. Probability prediction of tensile strength with acoustic emission count of a glass fiber reinforced polyamide. Mech. Ind. 2018, 19, 110. [Google Scholar] [CrossRef]
  58. Gupta, A.; Singh, M. Reliability analysis to improve performance of multi-pin glass fiber-epoxy laminated composite joints using Weibull distribution. World J. Eng. 2023, 20, 621–630. [Google Scholar] [CrossRef]
  59. Arash, B.; Wang, Q.; Varadan, V.K. Mechanical properties of carbon nanotube/polymer composites. Sci. Rep. 2014, 4, 6479. [Google Scholar] [CrossRef] [PubMed]
  60. Malashin, I.; Tynchenko, V.; Gantimurov, A.; Nelyub, V.; Borodulin, A. Boosting-Based Machine Learning Applications in Polymer Science: A Review. Polymers 2025, 17, 499. [Google Scholar] [CrossRef]
  61. Huang, H.; Li, Z.; Peng, X.; Ding, S.X.; Zhong, W. Gaussian Process Regression With Maximizing the Composite Conditional Likelihood. IEEE Trans. Instrum. Meas. 2021, 70, 2512711. [Google Scholar] [CrossRef]
Figure 1. Machine learning-assisted research workflow for composite material property prediction.
Jcs 09 00364 g001
Figure 2. Convergence plots of key performance metrics over 2000 Monte Carlo iterations. (a) Coefficient of determination R for training data. (b) Coefficient of determination R for testing data. (c) Root mean square error for training data. (d) RMSE for testing data. (e) Mean absolute error for training data. (f) MAE for testing data.
Jcs 09 00364 g002aJcs 09 00364 g002b
Figure 3. Effect of training set size on model performance metrics based on 2000 Monte Carlo simulations. (a) Distribution of R values for training data. (b) Distribution of R values for testing data. (c) Willmott’s Index of Agreement (IA) for training data. (d) IA for testing data. (e) Slope of the linear regression line for training data. (f) Slope for testing data.
Jcs 09 00364 g003
Figure 4. Box plots show the distribution of performance metrics over 2000 Monte Carlo iterations. (a) Error-based metrics including RMSE, MAE, and MAPE. (b) Agreement and correlation metrics including R, Willmott’s Index of Agreement (IA), and regression slope.
Jcs 09 00364 g004
Figure 5. Visualization of prediction accuracy and error distribution. (a) Parity plot comparing predicted and actual tensile strength values. (b) Residual error plot showing the deviation between actual and predicted values across the full range.
Jcs 09 00364 g005
Figure 6. Relative importance of all 11 input features based on sensitivity analysis using the trained GPR model.
Jcs 09 00364 g006
Figure 7. 2D histograms showing correlation between R and other performance metrics: (a) RMSE, (b) MAE, (c) MAPE, (d) IA, (e) slope.
Jcs 09 00364 g007
Figure 8. Violin plots showing distribution of testing data error metrics over 2000 Monte Carlo trials. (a) Coefficient-based metrics (R, IA, slope). (b) Error-based metrics (RMSE, MAE, MAPE).
Jcs 09 00364 g008
Figure 9. Performance gain (%) of the GPR model over other machine learning models across six metrics: R, slope, IA, RMSE, MAE, and MAPE.
Jcs 09 00364 g009
Figure 10. Comparison of R-values for GPR and other machine learning models across 11 polymer matrix systems.
Jcs 09 00364 g010
Figure 11. Prediction uncertainty across quantiles of tensile strength.
Jcs 09 00364 g011
Figure 12. Parity plots comparing predicted and actual tensile strength using the GPR model. (a) Prediction over the full dataset. (b) Representative fold from Monte Carlo cross-validation. (c) Predictions within the Epoxy material subset.
Jcs 09 00364 g012
Figure 13. Error distribution across categorical variables. (a) Polymer matrix types. (b) CNT surface modification methods. (c) Processing methods.
Jcs 09 00364 g013
Figure 14. Error distribution across binned numerical variables. (a) CNT weight fraction. (b) Average diameter (nm). (c) Average length (nm).
Jcs 09 00364 g014
Table 1. Detailed comparison of GPR with six other machine learning models (LN, SVM, FL, RT, ANN, EBT) over 2000 Monte Carlo trials.
MethodRSlopeIARMSEMAEMAPE
LN−0.13−1.940.08725.84459.51479.67
SVM0.590.780.66112.4533.42324.8
FL0.90.820.9419.3112.871.67
RT0.940.90.9615.39.4827.52
ANN0.940.930.9615.4910.4259.16
EBT0.950.860.9714.3930.83
GPR0.960.910.9812.147.5631.73
%Gain vs. LN838.5146.9112598.398.497.9
%Gain vs. SVM62.716.748.589.277.490.2
%Gain vs. FL6.7114.337.140.955.7
%Gain vs. RT2.11.12.120.720.3−15.3
%Gain vs. ANN2.1−2.22.121.627.446.4
%Gain vs. EBT1.15.8115.116−2.9
Table 2. Relative influence of each input parameter.
Input ParameterRIASlopeRMSEMAE
Processing method0.0200.040.260
Young’s modulus of CNT0.030.020.230.270.03
Average CNT diameter0.060.040.230.540.12
Polymer matrix0.060.040.30.560.46
Average CNT length0.090.050.310.971.1
Young’s modulus of matrix0.10.060.311.181.25
Density of CNTs0.170.090.541.861.35
Density of matrix0.240.150.782.742.42
Tensile strength of matrix0.890.561.2810.0110.43
Weight fraction of CNTs1.470.793.1416.4516.25
CNT surface modification method3.371.895.9632.4928.55
Table 3. Comparative overview of probabilistic and ml-based composite modeling studies.
StudyMaterial SystemModeling ApproachProperty PredictedUncertainty QuantificationAccuracy (R2/RMSE)Dataset SizeGeneralizability Scope
Nadjafi et al. [43]CFRP LaminatesMCS + Stochastic FEMFatigue Life95% CI via MCS–/12% variation500 simulationsLow (single laminate type)
Mhalla et al. [57]Short-Fiber ThermoplasticsRSM + MCSTensile StrengthCV (8.7%)0.91/±8 MPa180Medium
An et al. [45]Hybrid LaminatesFORM-based RBDODelamination ResistanceFailure probability (β = 3.0)–/Safety margin ↑70%60–80Low
Gupta et al. [58]Nanoclay–EpoxyBayesian Inference + MCSFailure StrengthSafety Factor + Posterior CI–/90% CI span ±10%120Low
Arash et al. [59]CNT-PMMALHS + MCSTensile Modulus90% CI–/±0.6 GPa250Medium
Malashin et al. [60]Hybrid CompositesGPR + Dropout + SHAPFracture ToughnessDropout CI + Feature Explanation0.89/±7.6% CI300High
Malidarre et al. [32]Hydroxyapatite BiocompositeANN + MCSCompression StrengthMCS (10k trials)0.85/±15% error90Medium
Huang et al. [61]NanofluidsOptimizable GPR (O-GPR)Viscosity±4.5% (68% CI)0.95/MAE 3.2240Medium
Ariyasinghe and Herath [29]Woven CFRPGPR + Variance Decomp.Stiffness95% CI bands0.92/–200Medium
Bujaico et al. [38]Multiscale PolymersML + Feature EngineeringTensile Strength±10% error margins0.94/MAE 5.1500+High
This workPolymer Nanocomposites (25 matrices, 24 methods)GPR + 2000× Monte CarloTensile StrengthQuantile-based CI (68%, 95%, 99%)0.96/12.14 MPa400+High (across 11 polymers)
Disclaimer/Publisher’s Note: The statements, opinions and data contained in all publications are solely those of the individual author(s) and contributor(s) and not of MDPI and/or the editor(s). MDPI and/or the editor(s) disclaim responsibility for any injury to people or property resulting from any ideas, methods, instructions or products referred to in the content.

