Article

Influential Microstructural Descriptors for Predicting Mechanical Properties of Fiber-Reinforced Composites

by
Jamal F. Husseini
1,*,
Eric J. Carey
1,
Farhad Pourkamali-Anaraki
2,
Evan J. Pineda
3,
Brett A. Bednarcyk
3,* and
Scott E. Stapleton
1
1
Department of Mechanical and Industrial Engineering, University of Massachusetts Lowell, Lowell, MA 01854, USA
2
Department of Mathematical and Statistical Sciences, University of Colorado Denver, Denver, CO 80204, USA
3
Multiscale and Multiphysics Modeling Branch, NASA Glenn Research Center, Cleveland, OH 44135, USA
*
Authors to whom correspondence should be addressed.
J. Compos. Sci. 2025, 9(7), 363; https://doi.org/10.3390/jcs9070363
Submission received: 24 June 2025 / Revised: 7 July 2025 / Accepted: 10 July 2025 / Published: 12 July 2025

Abstract

Fiber-reinforced composites contain microscale features such as variations in local fiber volume fraction, fiber clusters, and resin-rich regions, which may impact mechanical properties. Microscale models need to be large enough to capture these features while maintaining high fidelity to capture the localized fiber-to-fiber interactions. This makes it difficult to efficiently model regions with equivalent fiber morphologies to as-manufactured scans and to perform large statistical studies to examine how these features drive mechanical performance. This study uses a novel microstructure generator and an efficient micromechanical model along with a characterization method that measures the geometry of these features to simulate a wide range of microstructures for strength and stiffness. After understanding how the mechanical properties are affected by morphology through correlation matrices, equivalent microstructures were generated to regions of an as-manufactured composite. The generation of microstructures based on different morphological descriptors allows for an understanding of which features are valuable when modeling these materials. In comparing microstructures with different equivalent descriptors to the case with all six descriptors, it was found that only using local fiber volume fraction median resulted in over predictions of strength and stiffness. Once two descriptors or more were introduced, such as local fiber volume fraction median and inter-quartile range, there was no significant difference in strength and stiffness. This suggests that at least two descriptors should be considered when generating equivalent microstructures for mechanical properties.

1. Introduction

Fiber-reinforced composites are versatile engineering materials with applications in many industries because of their high stiffness and strength-to-weight ratios. Although this facet is known, composites are difficult to use in practice because of the high safety factors stemming from uncertainty in their mechanical properties [1,2]. This often requires ply build-ups and reduces the strength-to-weight benefits. Uncertainty in mechanical properties can arise due to variability in manufacturing, such as fiber and tow misalignment [3,4,5,6,7,8], voids [9,10,11,12,13], thermally induced residual stresses [14,15,16,17], and fiber arrangement [18,19,20,21,22], to name a few. To improve confidence in the design of these materials, computational models can be developed that capture these phenomena and predict mechanical performance.
One prominent source of variability is heterogeneity in the microscale fiber arrangement, where fibers can either group close together to form clusters or be dispersed, resulting in matrix-rich regions. These regions create localized areas where failure can easily initiate and propagate [20,21,23,24,25]. Bednarcyk et al. [26] simulated microstructures with different amounts of fiber clustering and found that microstructures with clustering always yielded earlier than uniform arrangements. Conversely, Ghayoor et al. [24] simulated the effects of resin-rich regions on the failure of fiber-reinforced composites. Their results suggested that when a resin-rich region was artificially added, and the fibers around the resin-rich region were very close, the failure strain dropped significantly. Whereas hexagonal arrangements significantly increased failure strain past any non-uniform arrangement. These studies emphasize the impact fiber arrangement has on mechanical properties but can only examine a few microstructures due to the computation time required for mechanical simulation. Modeling these microstructures can be computationally expensive because of the domain required to capture enough fibers to be representative of actual arrangements while maintaining enough fidelity to capture close, local fiber-to-fiber interactions. To model the effect of microscale variability on mechanical properties, methods need to be employed where fiber arrangements can be efficiently generated and simulated considering nonlinear constitutive behaviors. Then, these responses need to be correlated to microstructure morphologies. Achieving this requires a comparison between real and artificial fiber arrangements. This starts with the ability to characterize random fiber arrangements based on descriptors such as resin-rich and fiber cluster geometries.
Many methods have been developed to characterize the spatial distribution of fibers at the microscale [22,27,28]. Commonly, studies use Ripley’s K function [29,30,31,32] or nearest neighbor measures [33,34,35,36,37,38,39,40] to characterize and compare microstructures. These metrics are typically easy to implement, mathematically robust, and can provide insight into the randomness of a fiber arrangement. Although beneficial, these metrics do not intuitively describe the microstructural features that commonly occur during manufacturing, but rather mathematical constructs. Other methods, such as those developed in [6,27,28,41], use triangulation-based algorithms to characterize microstructures based on geometric features, such as fiber clusters and resin-rich regions, which are easily interpreted.
Once microstructures can be characterized for their features, methods need to be established that can create equivalent, artificial arrangements. Microstructure generators are in abundance throughout the literature with varying degrees of complexity [32,33,35,36,37,42,43,44,45,46,47,48,49,50]. The simplest and most common microstructure generators rely on random placement until a desired volume fraction is achieved. These generators are commonly referred to as random sequential absorption (RSA) and can present many problems associated with a jamming limit at high-volume fractions [51,52]. The iterative nature of these processes also increases the computation time required to reach higher volume fractions. Fixes have been presented around this limit [53], but with this random placement, there is no control over forming microstructural features. Simulation-based generators can use more input variables to control the spatial arrangement of fibers. These generators can be more intricate, but are able to avoid jamming limits, maintain computational efficiency, and correlate closely with actual fiber arrangements [27,36,37,42,54,55,56]. Méchin et al. [47] highlighted this by examining different fiber arrangements and the impact on shear and compression response. They found algorithms that emphasize clustering can better predict certain properties than hexagonal or uniform. This highlights that the chosen generator is significant in being able to capture or predict certain mechanical properties. The most recent generators use machine learning algorithms to generate equivalent arrangements to microscopy scans [43,50]. While machine learning seems to be the natural path, these models may depend on microscopic image quality for fiber detection and may not be easily transferable to different material systems where fiber shapes and orientations can differ. Generators have been comprehensively compared in studies such as [33,45,47], with the conclusion that different mechanical properties depend on the fiber arrangement and, thus, the generation. Likely, there is not a single best generation algorithm, but a generator should be utilized that is capable of a wide range of fiber arrangements, which are equivalent to real morphologies measured from scans. Furthermore, it is necessary to characterize how simulated mechanical properties depend on the capabilities of the generator.
Not only do equivalent artificial microstructures need to be generated, but they need to be simulated under loading to understand how fiber arrangement impacts mechanical response. Specifically, it is important to understand which microstructure features can cause premature failure. These features often include tightly packed fiber clusters where fibers can be close or touching, which are difficult to include in mechanical simulations. Using traditional finite element analysis (FEA), close or touching fibers require significant mesh refinement, which ultimately increases computation time [57,58,59,60]. While this may not affect linear elastic analysis significantly, nonlinear analysis, such as failure and fracture, depends on accurately capturing these stress concentrations between fibers. This is especially true when the primary mode of failure results from loading transverse to the fiber direction or matrix cracks forming between neighboring fibers. Reduced-order, semi-analytical, and various other models have been developed that can perform nonlinear analysis at a fraction of the computation time, at the expense of some accuracy [61,62,63,64,65,66]. The benefit of these models is that many large microstructures can be simulated, allowing statistical analysis to be performed on how morphology impacts mechanical properties.
In this study, the impact of fiber morphology on mechanical properties, such as stiffness and transverse strength, was examined. It is noted that there are other microscale defects, such as voids and residual stresses, that can influence mechanical performance, but the scope of this work is to comprehensively characterize correlations between fiber arrangement and mechanical properties. A simulation-based microstructure generator was used to generate a wide range of possible arrangements, characterized by local volume fraction, fiber clusters, and resin-rich regions [27]. A comparison was made to a uniform–random generator that uses an RSA algorithm to show possible features that could be generated. Unlike current research that focuses on a few microstructures with relatively low numbers of fibers and small features, this work uses efficient generation, characterization, and simulation tools to perform a large statistical analysis. To this end, 3500 random microstructures for each case were generated and simulated for transverse strength and stiffness to show how microstructural descriptors of fiber arrangement correlate to mechanical properties. These microstructures, which vary in size and arrangement, allow for a complete examination of the possible fiber arrangements formed by feature-based tools. Then, microscopy scans were sampled and characterized to determine a minimum microstructure size required to obtain constant features. This size was used to inform microstructures sampled from larger scans, which were characterized and used as a baseline for arrangements possible from manufacturing. Equivalent microstructures were generated with different descriptors to show which descriptors are needed, at a minimum, to capture the same mechanical behavior as one with all equivalent descriptors.

2. Method

2.1. Artificial Microstructure Generation

2.1.1. Simulation-Based Generation

A simulation-based method for generating artificial microstructures was implemented that can tailor fiber arrangements from user-defined inputs while maintaining a degree of randomness [27,54]. The generator starts by seeding fibers randomly in a domain. Once seeded, contact is enforced, and the fibers are allowed to relax until sufficient energy is dispersed from the system. Different microstructures were generated by tuning seven parameters that controlled the seeding and simulation. Seeding parameters consisted of global volume fraction, V f , number of fibers, n f , number of fibers per cell, n f / c e l l , minimum fiber spacing, d m i n , and margin, m . The simulation parameters consisted of contact damping, d i j n , and global damping, d i . Further descriptions of these generator inputs are provided in detail in [27]. For simplicity, fiber radius, r f , was fixed to 3.5   μ m . With this generator, there is no limitation on V f and a microstructure can be made with a hexagonal close packing ( V f = 0.902 ) with minimal degradation to computation time or efficiency. To generate possible microstructures, 3500 pseudo-uniform random input combinations were sampled from the ranges specified in Table 1.

2.1.2. Uniform–Random Generation

A simple, uniform–random microstructure generator was also implemented in this study. These types of generators are often referred to as random sequential absorption (RSA) algorithms and have already been rigorously studied and critiqued. RSA generators are often simplest to implement due to the few independent variables, V f , n f , and d m i n , and still are widely used as the default choice to create artificial arrangements [44,67,68,69]. Given the wide breadth of generators developed for the same purpose, it is significant to distinguish their capabilities and how they relate to mechanical properties. If a simpler algorithm, such as RSA, can capture real-life morphologies, then it likely should be the default choice for that microstructure generation.
For the scope of this study, the developed simulation-based approach was compared to an RSA generator, herein referred to as uniform–random, to examine differences in microstructure morphologies and mechanical properties. An in-depth overview of the uniform–random generation is not included in this manuscript because these algorithms are widely available. The only difference in this manuscript is that constant boundary lengths are calculated from a user-defined V f and n f rather than being prescribed. A d m i n was also enforced between fibers during the placement. d m i n for this generator was fixed at the minimum defined in Table 1 because a higher d m i n would only increase the uniformity of the arrangement. These three parameters were used for consistency with the simulation-based generator. A constraint was enforced on the number of place attempts as n f × 10,000 , to allow for more attempts with larger or more densely packed microstructures. If the max attempts were reached, the simulation ended, and the actual V f and n f were recorded. Periodicity of the fiber arrangement was maintained by projecting the microstructure over each ± y , and ± z boundary.
A total of 3500 combinations of V f , n f , and d m i n were sampled based on the same ranges for the simulation-based generation in Table 1. After the first 1000 microstructures were generated, it was observed that many microstructures had a V f of nearly 0.6. This is because of the known jamming limitations of this approach and the inability to realize a greater V f than 0.6. When it was made to generate microstructures with a V f higher than 0.6, the iteration max was reached, and the result was a microstructure closer to 0.6. To account for this and achieve better variability at lower V f ’s, the sample range of V f for the remaining 2500 microstructures, were constrained to be 0.25 to 0.6.

2.2. Feature-Based Microstructure Characterization

Once artificial microstructures were generated, a method for characterizing the fiber arrangement was implemented. This characterization method has previously been shown to compare and quantify microstructure arrangements using real-life data from microscopy scans. The method, outlined in [27], works by triangulating neighboring fiber centers and calculating a local fiber volume fraction, V f j , within each triangle j . This results in a V f j distribution for a given microstructure, where a high V f j indicates a close grouping of fibers and a low V f j indicates a resin-rich region. Otsu’s method was used to threshold the V f j distribution with two bounds, such that triangles with sufficiently high V f j were identified as fiber clusters (FCs) and low V f j as matrix-rich clusters (MRCs). Then, a smoothing algorithm was implemented that preserved large, connected groupings of neighboring triangles with the same assignment. From this, descriptors were calculated to characterize how fibers were arranged. The first two descriptors calculated were the median local fiber volume fraction, V f M d n , and the local fiber volume fraction inter-quartile range (IQR), V f I Q R , which were used because they are more sensitive to skewed distributions than mean and standard deviation. Then the FC area density, ρ F C , and the MRC area density, ρ M R C , were found as
ρ k = A k A j
where k represents either FC or MRC, A k is the area of triangles assigned either FC or MRC, and A j is the area of all triangles in a microstructure. The last two descriptors measured were the number of FCs, N F C , and the number of MRCs, N M R C , both normalized by the total number of fibers in each microstructure, also expressed as
N k = N k n f
where N k is the number of FCs or MRCs. A single cluster, either FC or MRC, is defined as a group of triangles with the same assignment that are all connected by at least one side. For instance, one FC can be made of multiple, connected FC-assigned triangles. A depiction of this characterization process with an example microstructure is shown in Figure 1.

2.3. Equivalent Microstructure Generation with Machine Learning

The simulation-based generation process has an inherent randomness, commonly known as aleatoric uncertainty, which is a characteristic of the system and cannot be removed. For the simulation-based generator, this randomness stems from the fiber placement before relaxation. Depending on the initial overlap, dispersion during the simulation phase will result in slightly varying fiber arrangements for a single set of inputs. Since one generator input combination is not deterministic, generating a microstructure with predicted descriptors becomes a challenge.
In practice, the microstructure generation and characterization process typically occurs in reverse order. Usually, microstructure characteristics and descriptors are known or measured from microscopy of actual fiber arrangements, and the goal is to create an equivalent set of artificial microstructures. To address this, a two-stage machine learning model was developed, which can take a set of microstructure descriptors and produce input combinations to the generator it believes will result in equivalent descriptors. The first stage acts as the “learner”, where a potential set of candidates is determined from a nearest neighbor regression. Then, each candidate is passed to the “evaluator”, which uses a polynomial regressor to determine if the candidate can confidently produce the target. In the case of this study, the learner determined input combinations for the generator that it believed would produce a target microstructure descriptor, while the evaluator determined the best viable input combination. If none of the input combinations pass the evaluator, then no prediction will be given. This typically only occurred if the target was out of the range of the training data. For this study, descriptors measured from scans were compared to the generator to determine if similar ranges were captured. This framework has shown strong prediction capabilities in producing equivalent microstructures with multiple target descriptors compared to single-stage models. An in-depth overview of the model is not presented in this manuscript but can be found in [70]. When the model predicts an input combination, 50 microstructures are generated, and the one that matches the target descriptors with the lowest percent difference is chosen as equivalent.

2.4. Efficient Micromechanical Model for Strength and Stiffness

An efficient micromechanical model was needed that could simulate the strength and stiffness of thousands of microstructures generated. A fixed, triangulation-based mesh model, developed in [61], was adapted where higher-order elements are used to capture stress concentrations between neighboring fibers, but with fewer elements to maintain computational efficiency. Microstructures created by each generator already had a periodic arrangement, and during the meshing algorithm, it was ensured that this periodicity was maintained by having nodes on the bottom and left boundary projected to the top and right. Unlike traditional micromechanical models, the edges of the microstructure are not square due to the triangulation-based meshing from fiber center points. Regardless, since the fiber arrangement is periodic, the user-defined number of fibers and volume fraction is always maintained. Periodic boundary conditions were then enforced via the finite element penalty method. Fibers were meshed with six-noded triangular elements, and the matrix comprised eight-noded quadrilateral elements in the path between neighboring fibers, with six-noded triangular elements in between. This mesh and discretization of elements are shown in Figure 2.
To obtain transverse strength, S 22 , and stiffness components, C 2222 , C 3333 , and C 2323 , each microstructure was given a prescribed uniaxial strain of 0.015 in the direction transverse to the fibers. A stiffness homogenization scheme was used, where all components could be found directly after boundary conditions were applied, mitigating any need for load perturbations in all directions and, thus, additional integration.
It was assumed that failure could only occur in the matrix elements, which was initiated by a maximum principal stress criterion when
σ 1 σ c r     1
where σ c r is the critical stress of the matrix and σ 1 is the maximum tensile principal stress if σ 1     0 . Fiber and matrix constitutive properties were determined solely from literature and manufacturer data sheets. The 8552 matrix was modeled as isotropic, and the IM7 fibers were modeled as transversely isotropic, shown in Table 2 and Table 3, respectively.
Principal stresses were checked at matrix integration points. For the triangular matrix elements, if any integration point reached the criterion, the whole element stiffness became zero. This was because the triangular elements are in regions where there typically are lower stresses, and it was found that they would not fail in some cases. In the quadrilateral matrix elements, if the criterion was reached, only the integration point was damaged, resulting in the element stiffness effectively reducing. This model has been verified against finite elements with linear elements, and the high-fidelity generalized method of cells for microstructures of varying volume fractions and arrangements. The fixed-mesh model, when compared to traditional techniques, showed a 2% error for stiffness and a 5% error for strength.

2.5. Validation Using Microscopy Scans

Experimentation at the microscale is extremely difficult and has only begun in the literature [72]. The only available form of validation is using descriptors measured from actual fiber arrangements. To this end, the mechanical properties recorded in this manuscript are solely from simulation. It is still valuable to examine fiber arrangements that occur within as-manufactured parts, and how relative differences in arrangements can affect simulated mechanical performance.
Eleven microscopy scans of an IM7/8552 composite, each containing approximately 10,000 fibers, were used as validation in this study [73]. Fiber positions and radii were extracted from images using a pretrained microscopy model [74]. The fitting of radii to detected fibers was not perfect, which meant that some fibers were slightly overlapping. To resolve this, because overlapping fibers is not realistic and can influence characterization, relaxation was conducted where the fibers were allowed to disperse based on contact. Since the overlaps were very small relative to the fiber radius, the dispersions did not significantly alter the microstructure or fiber arrangement.
First, each scan was sampled with 500 square regions, or windows, ranging from 50 × 50   μ m to 150 × 150   μ m in 10   μ m increments. This was to achieve a distribution of microstructure descriptors across different scales. Smaller windows, such as 50 × 50   μ m , could have been placed within fiber clusters or a resin-rich zone, but a larger window was more likely to contain both resin-rich and fiber-dense features. Each of the six descriptors was recorded to determine where the distribution of a given descriptor is unaffected by window size.
Once the minimum microstructure size was determined, four microstructures were randomly sampled from that size window. The descriptors of each of these samples were used as targets in the machine learning inverse model, where equivalent, artificial microstructures were generated. First, only one equivalent descriptor was generated; then, an increasing number of descriptors were added. The baseline comparison is an artificial microstructure with all six descriptors that are equivalent to the window samples. This is to determine if all six descriptors are needed to capture mechanical behavior, or only a subset.

3. Results and Discussion

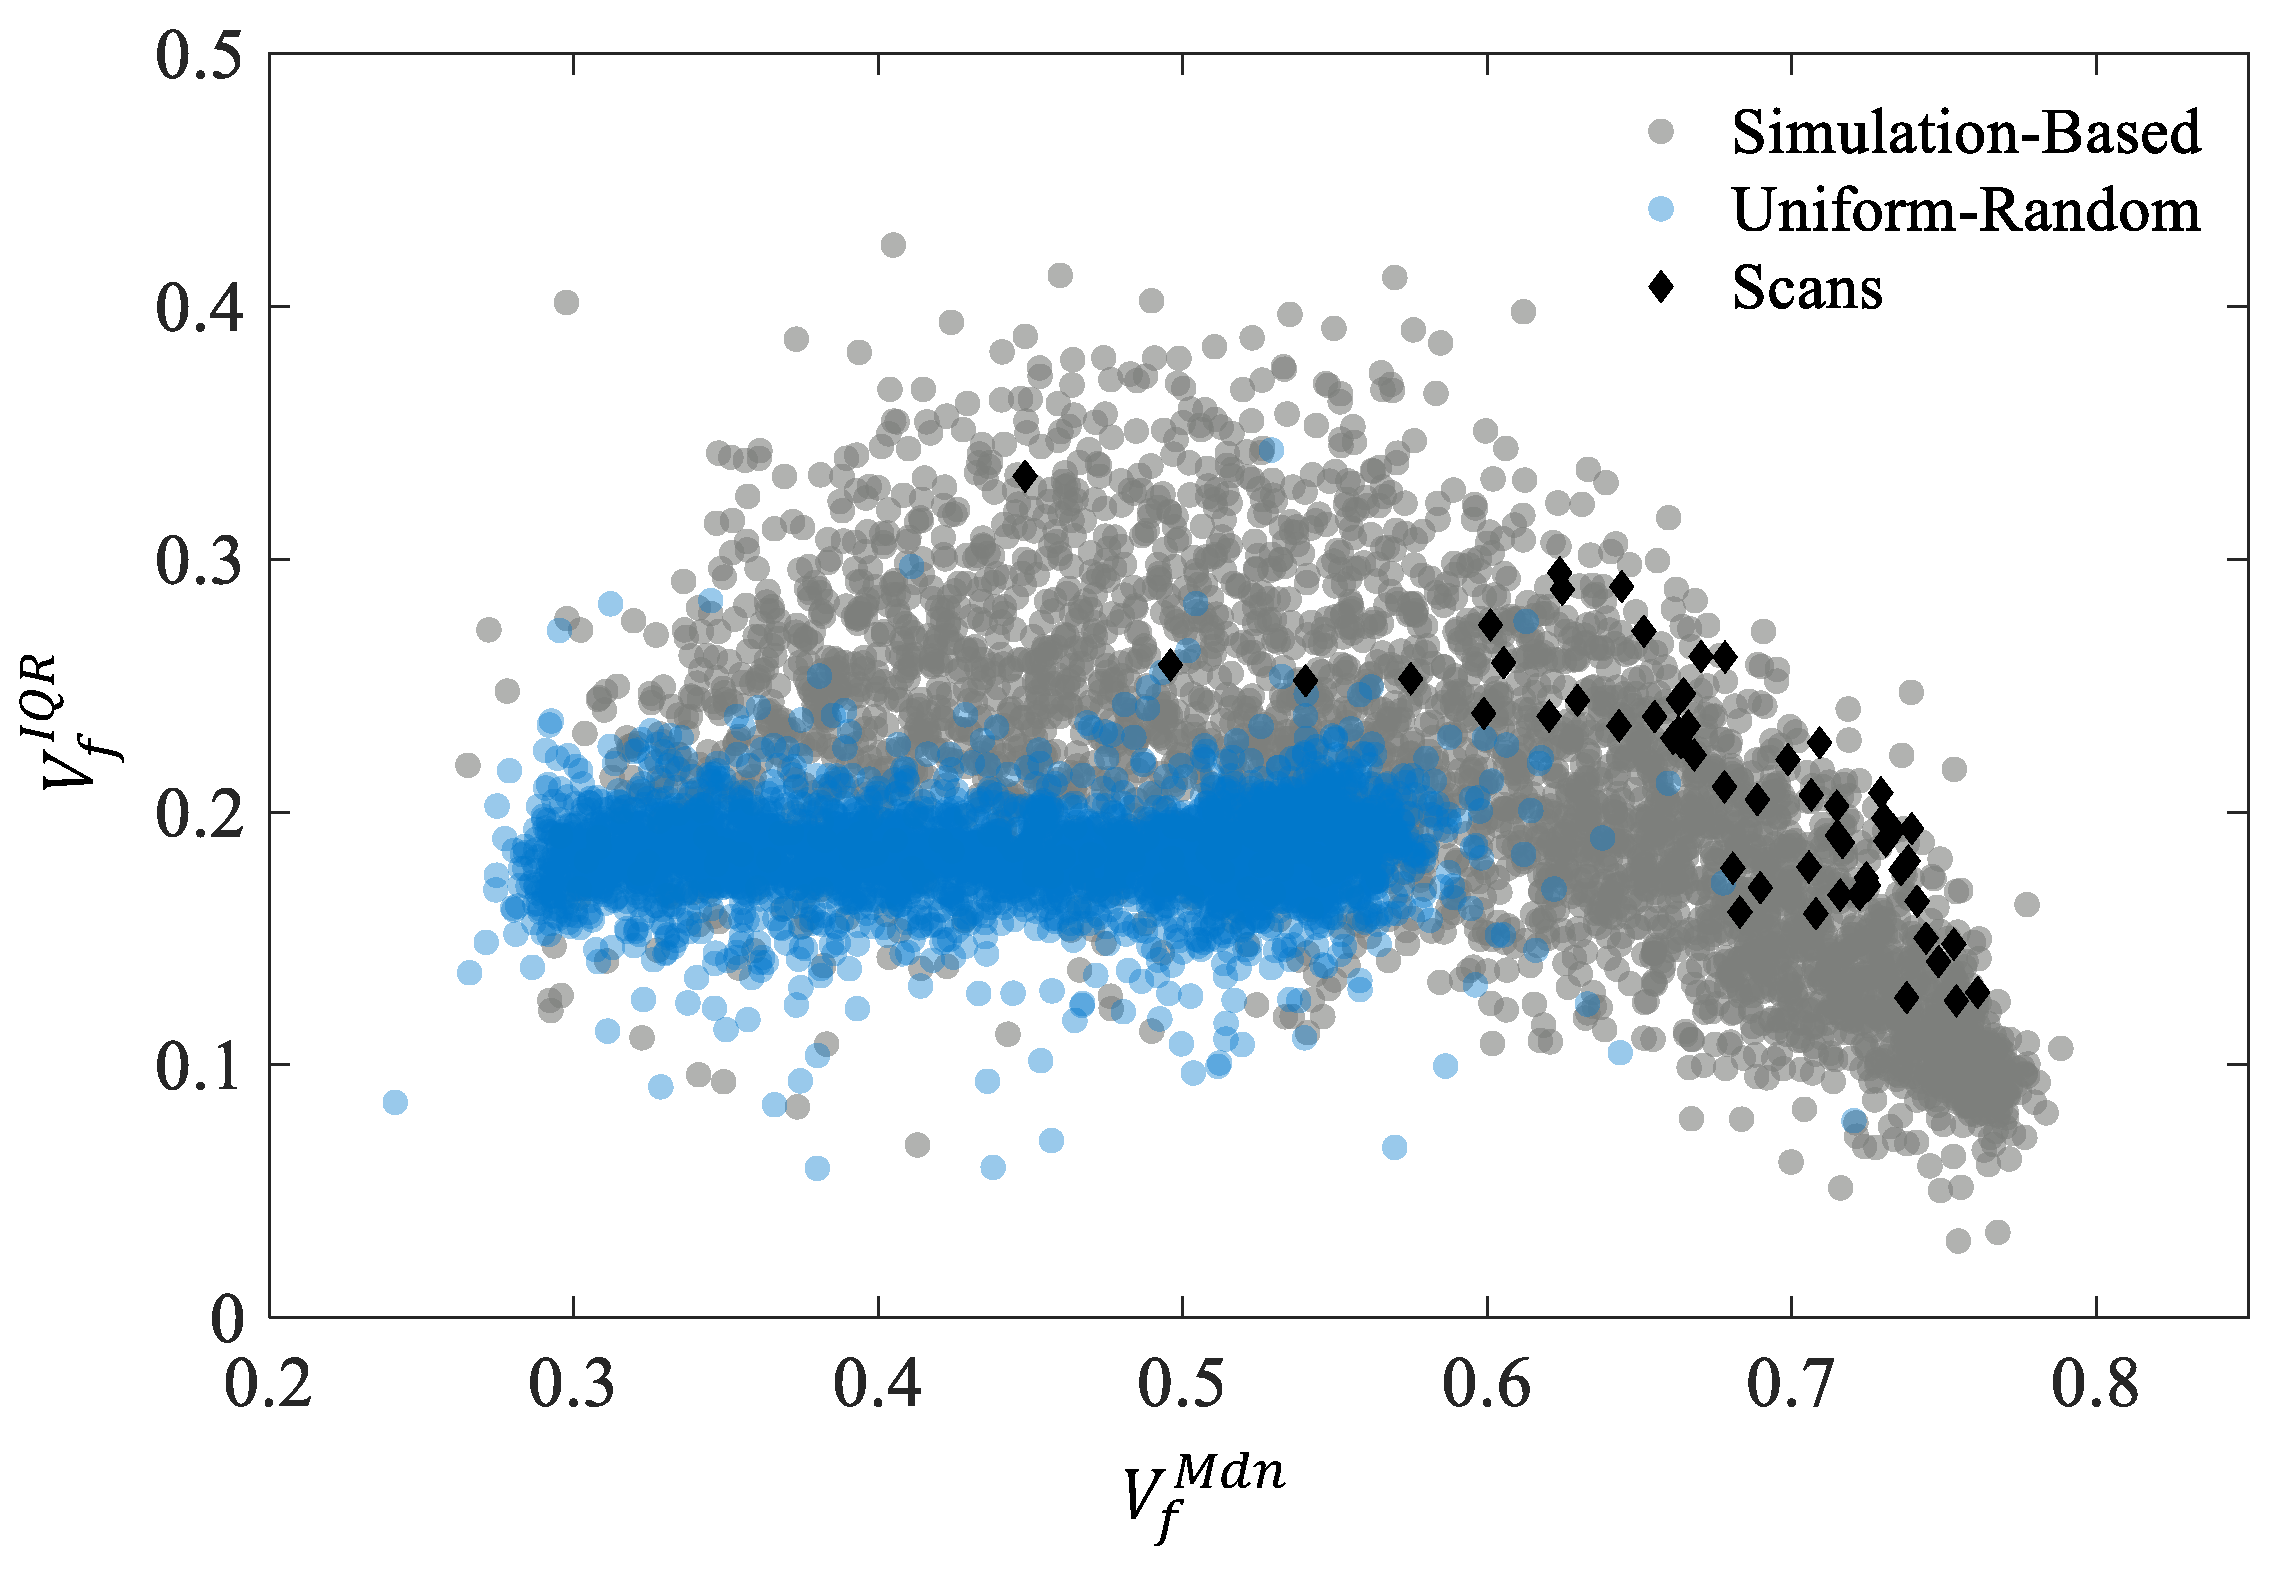
3.1. Comparison of Microstructure Descriptors Based on Generation Technique

A total of 3500 microstructures from the simulation-based generator and from the uniform–random generator were characterized for V f M d n , V f I Q R , ρ F C , ρ M R C , N F C , and N M R C . Then, they were compared to determine if the generation technique influences possible fiber arrangements. Fifty randomly selected microstructures from the windowed microscopy scans were added to show which generation process can produce similar descriptors. First, V f I Q R was plotted against V f M d n for all microstructures in Figure 3.
There is a distinct relationship between V f M d n and V f I Q R that is observed for the simulation-based generator in Figure 3. This relationship has previously been noted in [27]. Essentially, a high V f I Q R indicates a wide distribution of V f j , meaning there are more fiber clusters and resin-rich regions. A low V f I Q R means that the V f j distribution is narrow, and the fibers are regularly arranged. This is why at a high V f M d n , the V f I Q R is low and has little variation because the fibers are forced into a hexagonal arrangement. It is shown that the simulation-based generator can capture a wide range of V f I Q R and V f M d n   , while the uniform–random generator can only capture a nearly constant V f I Q R . These microstructures, while random, have a more homogeneous fiber dispersion and do not capture the extreme extent of fiber-dense and resin-rich regions. The scans fall on the upper end of the curve created by the simulation-based generator, meaning that for a given V f M d n , the scans typically have a higher degree of heterogeneity in their fiber arrangement. Rarely can the uniform–random generator capture the same V f M d n and V f I Q R of the scans, whereas there are many points from the simulation-based generator that are near the scans. The other four descriptors, ρ F C , ρ M R C , N F C , and N M R C , are shown in Figure 4.
The uniform–random microstructures have similar values to the scans for cluster area density, ρ k , and the best for the number of clusters, N k . The simulation-based generator can capture a larger region of ρ F C (Figure 4a), and this encapsulates all values from the scan sampling. The reason for this is likely due to the smoothing procedure to reach the final cluster geometries. During smoothing, isolated FC or MRC triangles are removed, and only ones that are connected to two or more neighbors are preserved. Since the uniform–random generation produces homogeneous arrangements, most FC triangles are filtered out, while the simulation-based generator can form these larger cluster features. N k of the scans seem to be captured well by both generators.

3.2. Simulated Strength and Stiffness Based on Generation Technique

Microstructures from both generation methods were simulated under transverse tension, where strength, S 22 , and stiffness components, C 2222 , C 3333 , and C 2323 were recorded. Each generator’s descriptors and mechanical properties are plotted as correlation matrices in Figure 5.
The color intensity of the correlation shows how strong the relationship is. A correlation of one indicates a strong positive correlation, while blue indicates a strong negative correlation. For the matrices in Figure 5, a linear correlation was used. The first observation to note is that for both generators, V f M d n shares nearly the same correlations with all other descriptors and mechanical properties as the stiffness components. The correlation between V f M d n and stiffness is nearly one, which indicates that stiffness is mainly dependent on, and can be predicted by V f M d n . It is already established that the main effect on stiffness stems from V f , and V f M d n is very similar to V f , as it describes the fiber arrangement in an average sense. S 22 shows strong correlations to many descriptors using the simulation-based generator. The strongest correlation is between S 22 and V f I Q R , which was mentioned previously, and it does well at capturing how clustered the microstructure arrangement is. The negative correlation of −0.48 between these two variables suggests that as V f I Q R , or the amount of heterogeneity increases, the transverse strength will decrease. Interestingly, when looking at the S 22 correlations in the uniform–random generation, there is a decrease compared to the simulation-based generator. Since the descriptors and mechanical properties are measured the same between both generators, the difference stems from the uniform–random method not being able to generate a large range of fiber arrangements. To illustrate this further, S 22 is plotted against V f I Q R for both generators in Figure 6.
The simulation-based generator shows an observable trend between S 22 and V f I Q R . As V f I Q R increases, S 22 tends to decrease. But with the uniform–random generator, only a slice of the data is captured, which is consistent with the previous observations in Figure 3. When comparing the scan data plotted in Figure 3, many scan samples have a V f I Q R greater than 0.25, and the uniform generation cannot capture that. Thus, uniform–random microstructures will tend to over-predict S 22 .

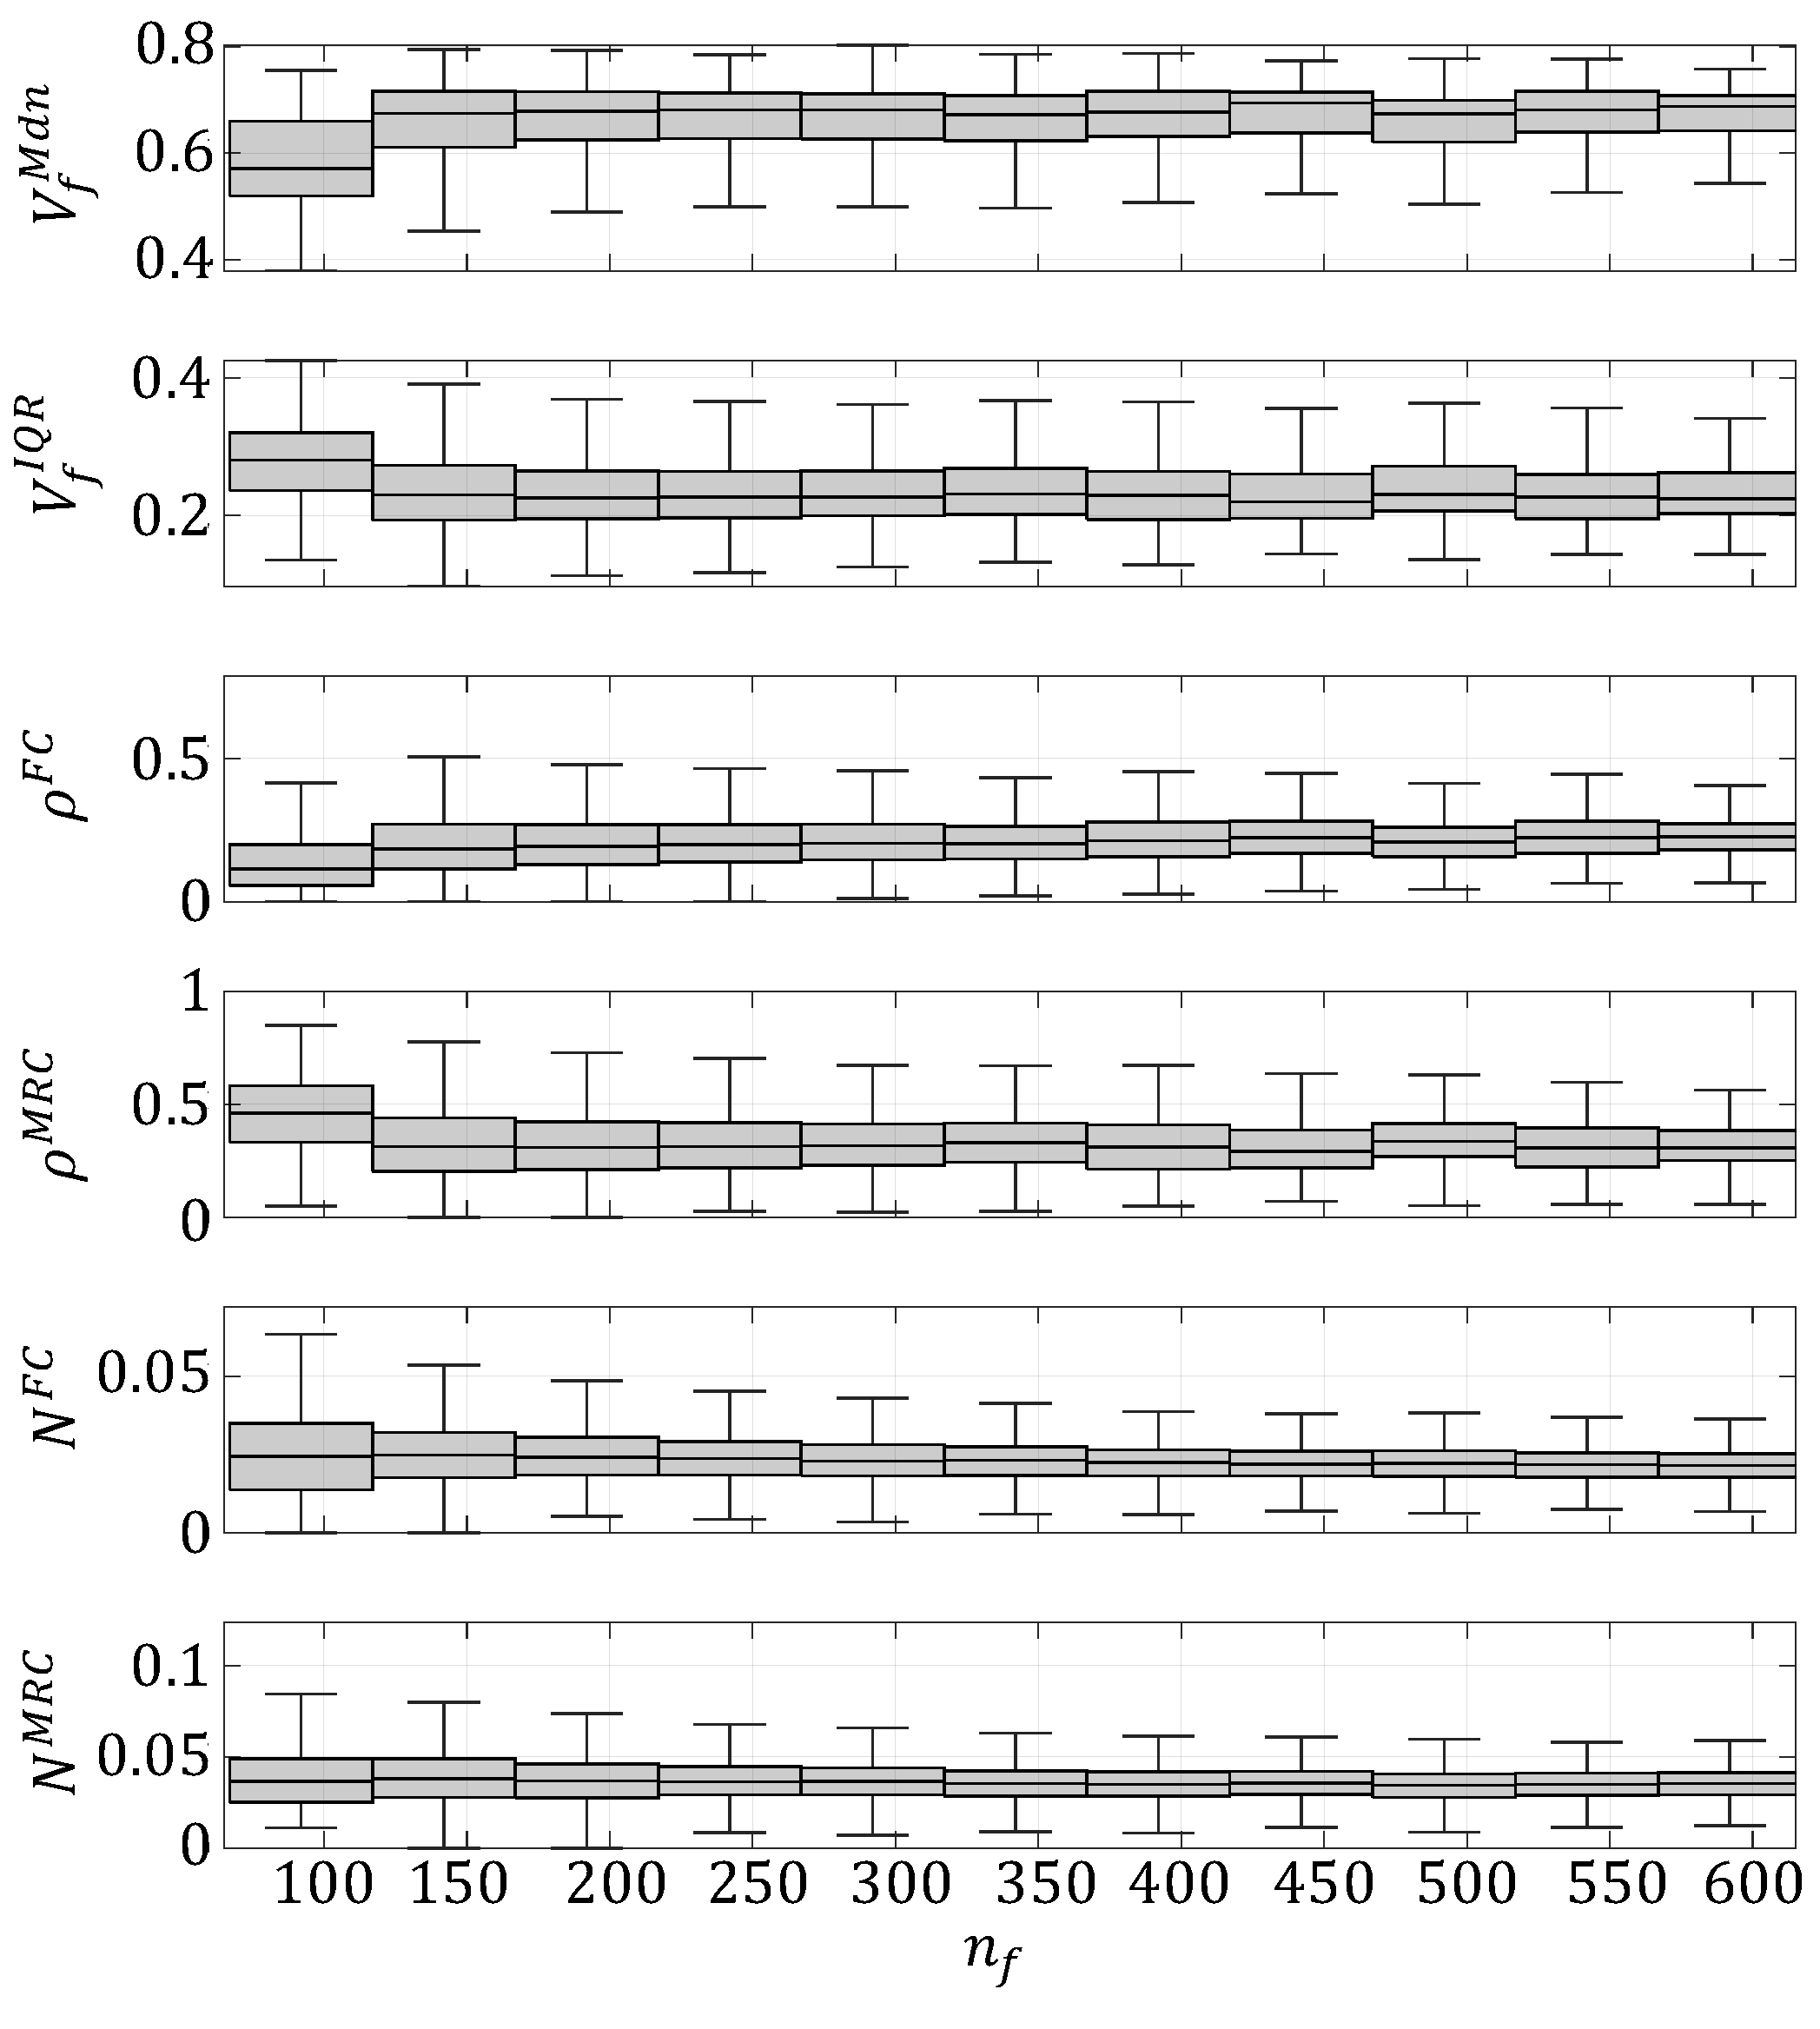
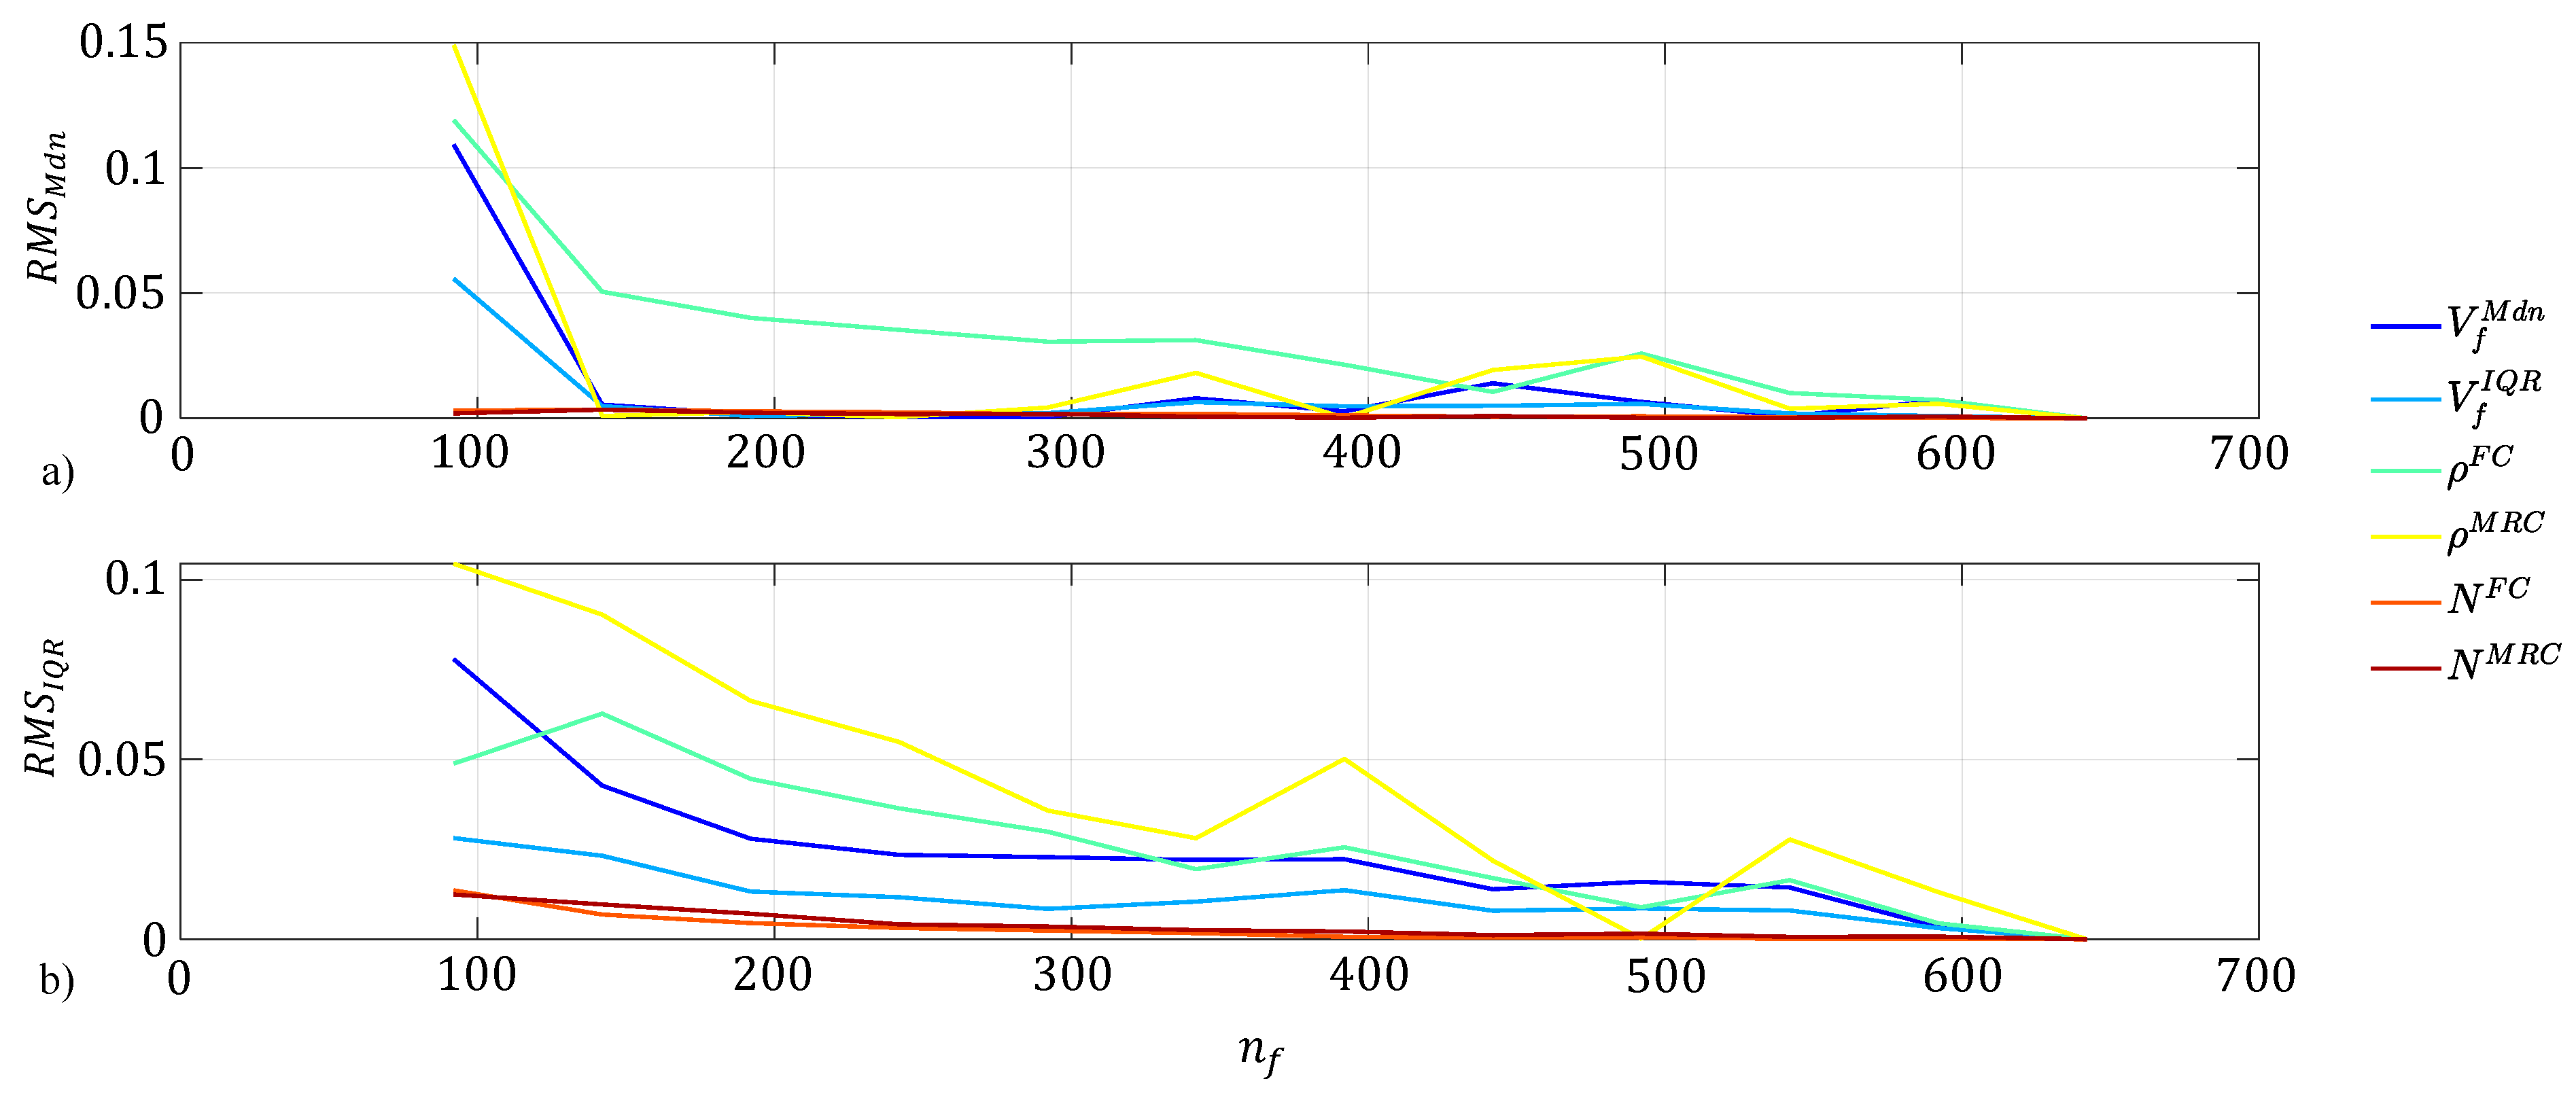
3.3. Size Effect on Descriptors Measure from Scans

Microscopy scans were sampled with randomly placed square windows to measure fiber arrangements that may occur in real parts. Windows ranged in size from 50 × 50 to 150 × 150   μ m in 10   μ m increments. A total of 5500 windows were obtained for each size, which were measured across 11 scans. Values of the six descriptors, V f M d n , V f I Q R , ρ F C , ρ M R C , N F C , and N M R C , were measured as a function of the number of fibers, n f , and are plotted in Figure 7.
The box and whisker plots in Figure 7 show distributions of measured descriptors as n f increases, where n f was binned in increments of 50. Qualitatively, there is a leveling of the measured descriptors as n f increases. In the range below n f = 200 , V f M d n and ρ F C starts low relative to the level-off because these values were measured from a low V f regions, which are mainly matrix. V f I Q R and ρ M R C start higher and decrease as n f increases because there is the most heterogeneity in the low V f regions. To determine where the descriptors are no longer a significant function of n f , the root-mean-squared (RMS) of each box-and-whisker median and IQR were calculated in reference to n f = 600 , in Figure 8.
RMS was chosen because it is less sensitive to very low values less than one, which is common for many of these descriptors. The median and IQR were also used for this measure from the box-and-whisker plots in Figure 7 because they are more sensitive to skewed data. The RMS of the median in Figure 8a shows a steady decrease until n f   110 , where after this, the RMS is nearly constant. Similarly, Figure 8b shows a similar trend with the RMS of the IQR. All these RMS values are very low and indicate that the measured descriptors are not changing significantly after n f = 110 . For the rest of this study, this was set as the minimum microstructure size for equivalent generation.

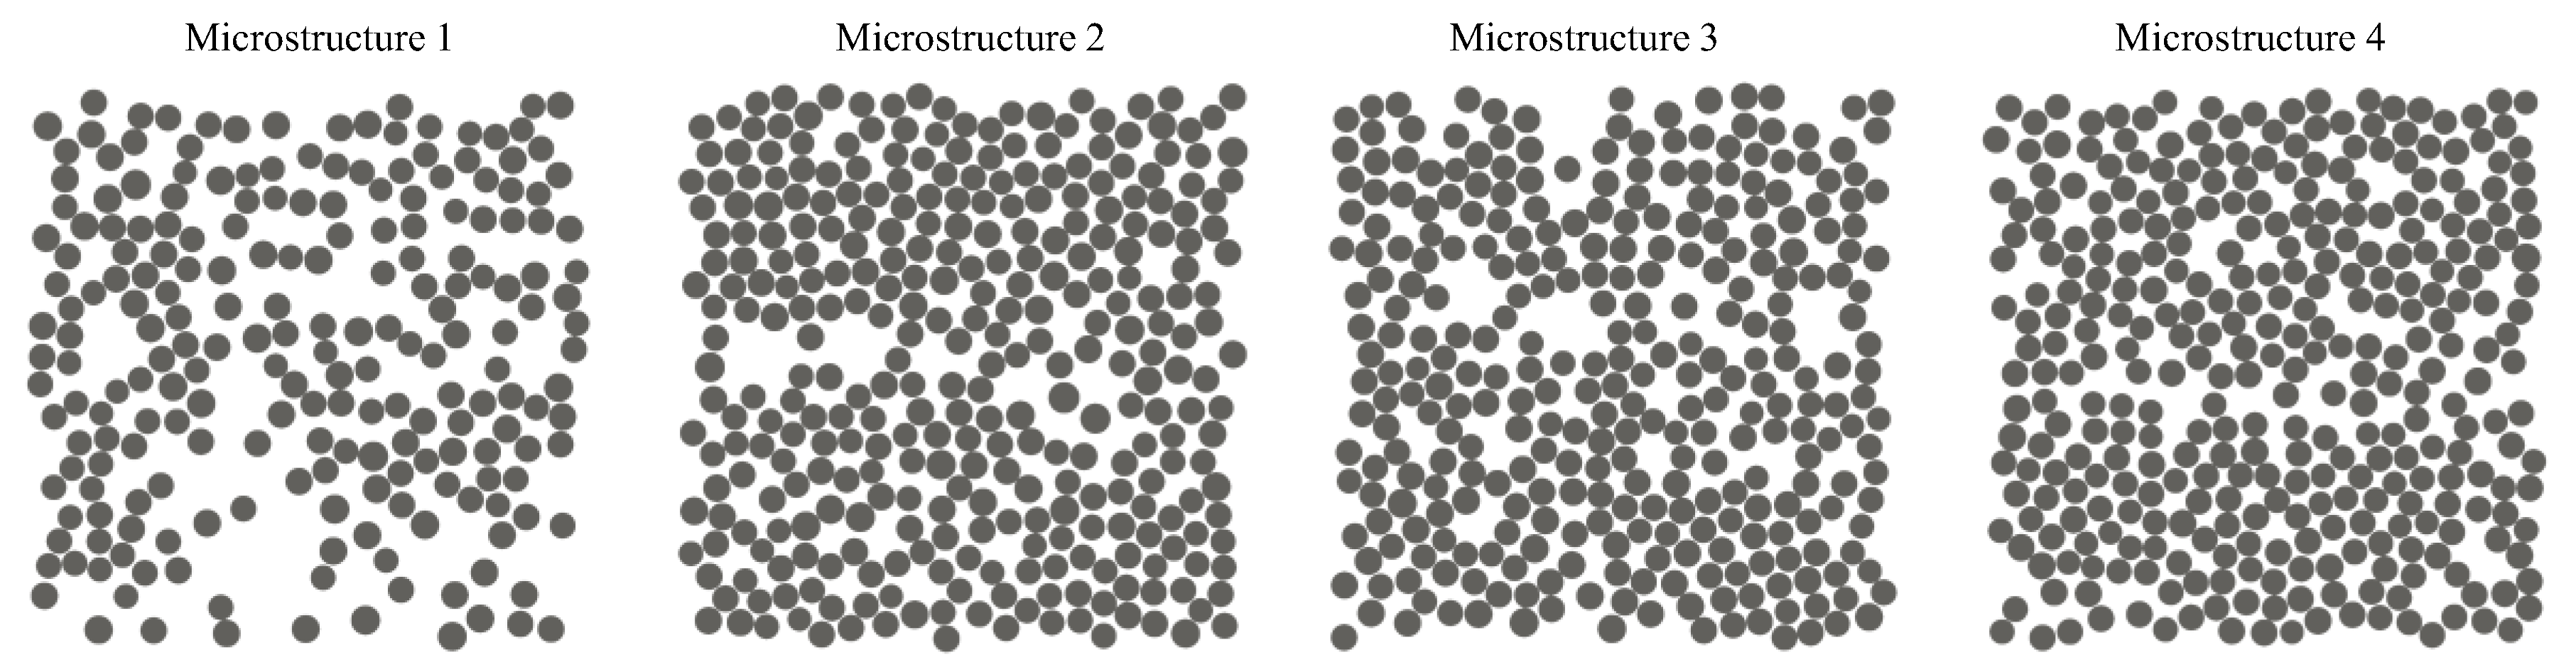
3.4. Regeneration of Scan Samples

Four random microstructures were selected from the scan sampling at the minimum n f determined from the previous section. These four microstructures are shown in Figure 9.
These microstructures vary in V f and the overall arrangement. The microstructures were characterized, and their descriptors are shown in Table 4.
These descriptors were used as targets in the machine learning model to generate equivalent microstructures. Each descriptor was introduced in order as a target. For instance, equivalent microstructures were generated only based on V f M d n , then V f M d n and V f I Q R , and so on until all six were used. The machine learning prediction resulted in generator inputs that were then used to run 250 microstructures. Then, the 20 microstructures with the lowest cumulative percent difference to the targets were determined as the best matches. Each microstructure was simulated for S 22 and C 2222 . First, the results for the simulated C 2222 are shown in Figure 10.
The baseline for each microstructure in Figure 10 is that of six equivalent descriptors, drawn in black. This is meant to be the case that is most equivalent to the microstructures in Figure 9. Although all descriptors are used in that case, the machine learning model search becomes quite exhaustive to find an equivalent set of inputs. Typically, the fewer the number of target descriptors, the faster the prediction. It can be seen when one descriptor ( V f M d n ) is used as the target, C 2222 is overpredicted. In fact, the case with one descriptor has the highest percentage difference from the case with six descriptors. The reason for this is that many different microstructures can have the same V f M d n and microstructures with different global volume fractions, V f s , can have the same V f M d n . A microstructure with a low V f can have a higher V f M d n when the arrangement is more heterogeneous. When the machine learning model is only using V f M d n to make a prediction, it can produce microstructures with vastly different V f s , and in this case, predicted higher values, which increased the stiffness. Once two descriptors were used, V f M d n and V f I Q R , the results become much more consistent with the case with all six descriptors. These two descriptors provide the most information about the local fiber volume fraction, V f j distribution. Adding more descriptors does not change the accuracy with respect to the six-descriptor case in any predictable way. The other descriptors (such as ρ k and N k ) are also obtained from this distribution, so it stands to reason that V f M d n and V f I Q R are the most important. To further investigate this, simulated S 22 is shown in Figure 11.
The distributions in Figure 11 for microstructures one and three show no meaningful differences between all cases. Microstructures two and four share similar results to Figure 10, where the case with one descriptor tended to over-predict. The reason for this is the same as stated previously, only using one descriptor does not ensure any uniqueness to the microstructure, like how two microstructures can have identical V f s but vastly different arrangements. Although not depicted, when comparing this effect on C 3333 and C 2323 , a similar trend is shared with C 2222 and S 22 . When one descriptor is used for equivalent generation, the prediction of mechanical properties is higher than in the rest of the cases. Once two descriptors were introduced with V f M d n and V f I Q R , the results become nearly unchanged with an increasing number of descriptors. This highlights that V f M d n and V f I Q R seem to be the most important for characterization, but if other, additional descriptors are desired, they can be introduced without significant effect to C 2222 ,   C 3333 ,   C 2323 and S 22 .

4. Conclusions

In this study, a simulation-based microstructure generator was used to create a wide range of microscale fiber morphologies that were then characterized by their local fiber volume fraction median, V f M d n and V f I Q R , fiber and matrix-rich cluster area density, ρ F C and ρ M R C , and number of fiber and matrix-rich clusters, N F C and N M R C . This generator was compared to a simple, uniform–random procedure and regions sampled within a microscopy scan to highlight its capabilities. This comparison showed that the simulation-based generator was able to capture a larger range of possible microstructure arrangements than the uniform–random generation. The simulation-based generator was able to capture the same descriptors measured from the scans, while the uniform–random could only capture a subset. Microstructures from both generation methods were simulated for transverse strength and stiffness to understand the relationship between descriptors and mechanical properties. Correlation matrices showed that V f M d n was a near-exact positive correlation to stiffness components. It was also found that transverse strength was most correlated to V f I Q R . This means that as V f I Q R increased, which is indicative of how clustered a microstructure was, the strength tended to decrease. The uniform–random generator was unable to capture this correlation because it could only generate a nearly constant V f I Q R .
Descriptors measured from scans were used as a baseline in this study because actual experimentation at this scale is not well-developed. Square windows of varying sizes were randomly sampled across scans, and the descriptors for each size were measured. It was shown how, for these scans, the descriptors changed as a function of the number of fibers. The minimum microstructure size was found where there was no significant change in descriptors, and four microstructures were randomly sampled at this size. Equivalent artificial microstructures were generated for each of the four samples with different numbers of descriptors. This was performed to determine if all six descriptors were needed for determining mechanical properties, or if only a few were required. It was found that for all cases, only using V f M d n to establish equivalency resulted in overpredictions of stiffness, and in some cases, strength, compared to the case with all six descriptors. But when V f M d n and V f I Q R were used, there was no significant difference from the six-descriptor case. This indicated that establishing equivalency based on V f M d n and V f I Q R was sufficient in capturing transverse strength and stiffness compared to all descriptors.
These findings highlight the importance of understanding how microscale fiber arrangement can impact certain mechanical properties. Also, consideration must be taken to ensure that generation techniques can capture the same arrangements that occur from actual manufacturing procedures. While this work only focuses on the effect of microstructure arrangement, future work should be geared towards additional microscale heterogeneities such as voids or 3-D features.

Author Contributions

Conceptualization, J.F.H., E.J.C., F.P.-A., E.J.P., B.A.B. and S.E.S.; Methodology, J.F.H., E.J.C., F.P.-A., E.J.P. and S.E.S.; Software, J.F.H., E.J.C. and S.E.S.; Validation, J.F.H.; Formal analysis, J.F.H., E.J.C. and S.E.S.; Investigation, J.F.H., F.P.-A. and S.E.S.; Resources, E.J.P. and B.A.B.; Data curation, J.F.H.; Writing – original draft, J.F.H.; Writing – review & editing, J.F.H., F.P.-A., E.J.P., B.A.B. and S.E.S.; Visualization, J.F.H.; Supervision, F.P.-A., E.J.P., B.A.B. and S.E.S.; Project administration, F.P.-A.; Funding acquisition, F.P.-A., E.J.P., B.A.B. and S.E.S. All authors have read and agreed to the published version of the manuscript.

Funding

This work was funded by a NASA Space Technology Graduate Research Opportunity under grant 80NSSC21K1285. Stapleton’s work was funded by a NASA NRA (80NSSC2lN0l02) through the NASA Transformational Tools and Technologies (TTT) program, under the Aeronautics Research Mission Directorate (ARMD).

Data Availability Statement

The original contributions presented in this study are included in the article. Further inquiries can be directed to the corresponding authors.

Acknowledgments

The authors would also like to acknowledge Michael Czabai of University of Utah for experimental scans and Josh Stuckner of NASA Glenn Research Center for help in image processing and support.

Conflicts of Interest

The authors declare no conflicts of interest.

References

  1. Whitehead, R.S.; Kan, H.P.; Cordero, R.; Saether, E. Certification Testing Methodology for Composite Structure. Volume 2. Methodology Development; Northrop Corp., Aircraft Division: Hawthorne, CA, USA, 1986. [Google Scholar]
  2. Naghipour, P.; Arnold, S.M.; Pineda, E.J.; Stier, B.; Hansen, L.; Bednarcyk, B.A.; Waas, A.M. Multiscale Static Analysis of Notched and Unnotched Laminates Using the Generalized Method of Cells. J. Compos. Mater. 2017, 51, 1433–1454. [Google Scholar] [CrossRef]
  3. Barlow, G.; Mollenhauer, D.; Zhou, E.; Whitcomb, J.; Stapleton, S.E. Inducing Fiber Entanglement to Achieve Realistic Tow Fiber Volume Fractions in Textile Reinforced Composite Models. Comput.-Aided Des. 2023, 162, 103546. [Google Scholar] [CrossRef]
  4. Woo, K.; Whitcomb, J.D. Effects of Fiber Tow Misalignment on the Engineering Properties of Plain Weave Textile Composites. Compos. Struct. 1997, 37, 343–355. [Google Scholar] [CrossRef]
  5. Li, Y.; Stier, B.; Bednarcyk, B.; Simon, J.-W.; Reese, S. The Effect of Fiber Misalignment on the Homogenized Properties of Unidirectional Fiber Reinforced Composites. Mech. Mater. 2016, 92, 261–274. [Google Scholar] [CrossRef]
  6. Schey, M.J.; Beke, T.; Appel, L.; Zabler, S.; Shah, S.; Hu, J.; Liu, F.; Maiaru, M.; Stapleton, S. Identification and Quantification of 3D Fiber Clusters in Fiber-Reinforced Composite Materials. JOM 2021, 73, 2129–2142. [Google Scholar] [CrossRef]
  7. Drummer, J.; Tafesh, F.; Fiedler, B. Effect of Fiber Misalignment and Environmental Temperature on the Compressive Behavior of Fiber Composites. Polymers 2023, 15, 2833. [Google Scholar] [CrossRef]
  8. Ahmadian, H.; Yang, M.; Nagarajan, A.; Soghrati, S. Effects of Shape and Misalignment of Fibers on the Failure Response of Carbon Fiber Reinforced Polymers. Comput. Mech. 2019, 63, 999–1017. [Google Scholar] [CrossRef]
  9. Schey, M.; Beke, T.; Owens, K.; George, A.; Pineda, E.; Stapleton, S. Effects of Debulking on the Fiber Microstructure and Void Distribution in Carbon Fiber Reinforced Plastics. Compos. Part A Appl. Sci. Manuf. 2023, 165, 107364. [Google Scholar] [CrossRef]
  10. Mehdikhani, M.; Gorbatikh, L.; Verpoest, I.; Lomov, S.V. Voids in Fiber-Reinforced Polymer Composites: A Review on Their Formation, Characteristics, and Effects on Mechanical Performance. J. Compos. Mater. 2019, 53, 1579–1669. [Google Scholar] [CrossRef]
  11. Hyde, A.; He, J.; Cui, X.; Lua, J.; Liu, L. Effects of Microvoids on Strength of Unidirectional Fiber-Reinforced Composite Materials. Compos. Part B Eng. 2020, 187, 107844. [Google Scholar] [CrossRef]
  12. Liu, L.; Zhang, B.-M.; Wang, D.-F.; Wu, Z.-J. Effects of Cure Cycles on Void Content and Mechanical Properties of Composite Laminates. Compos. Struct. 2006, 73, 303–309. [Google Scholar] [CrossRef]
  13. Ashouri Vajari, D.; González, C.; Llorca, J.; Legarth, B.N. A Numerical Study of the Influence of Microvoids in the Transverse Mechanical Response of Unidirectional Composites. Compos. Sci. Technol. 2014, 97, 46–54. [Google Scholar] [CrossRef]
  14. Tsai, J.-L.; Chi, Y.-K. Investigating Thermal Residual Stress Effect on Mechanical Behaviors of Fiber Composites with Different Fiber Arrays. Compos. Part B Eng. 2008, 39, 714–721. [Google Scholar] [CrossRef]
  15. Liu, P.F.; Li, X.K. A Large-Scale Finite Element Model on Micromechanical Damage and Failure of Carbon Fiber/Epoxy Composites Including Thermal Residual Stress. Appl. Compos. Mater. 2018, 25, 545–560. [Google Scholar] [CrossRef]
  16. Shah, S.P.; Maiarù, M. Effect of Manufacturing on the Transverse Response of Polymer Matrix Composites. Polymers 2021, 13, 2491. [Google Scholar] [CrossRef] [PubMed]
  17. Shah, S.P.; Maiarù, M. Analytical Model for Composite Transverse Strength Based on Computational Micromechanics. Int. J. Multiscale Comput. Eng. 2023, 21, 77–97. [Google Scholar] [CrossRef]
  18. Sudhir, A.; Talreja, R. Simulation of Manufacturing Induced Fiber Clustering and Matrix Voids and Their Effect on Transverse Crack Formation in Unidirectional Composites. Compos. Part A Appl. Sci. Manuf. 2019, 127, 105620. [Google Scholar] [CrossRef]
  19. Ding, X.; Gu, Z.; Hou, X.; Xia, M.; Ismail, Y.; Ye, J. Effects of Defects on the Transverse Mechanical Response of Unidirectional Fibre-Reinforced Polymers: DEM Simulation and Deep Learning Prediction. Compos. Struct. 2023, 321, 117301. [Google Scholar] [CrossRef]
  20. Mishnaevsky, L.; Dai, G. Hybrid Carbon/Glass Fiber Composites: Micromechanical Analysis of Structure–Damage Resistance Relationships. Comput. Mater. Sci. 2014, 81, 630–640. [Google Scholar] [CrossRef]
  21. Ghayoor, H.; Hoa, S.V.; Marsden, C.C. A Micromechanical Study of Stress Concentrations in Composites. Compos. Part B Eng. 2018, 132, 115–124. [Google Scholar] [CrossRef]
  22. Elnekhaily, S.A.; Talreja, R. Damage Initiation in Unidirectional Fiber Composites with Different Degrees of Nonuniform Fiber Distribution. Compos. Sci. Technol. 2018, 155, 22–32. [Google Scholar] [CrossRef]
  23. Kwon, Y.W.; Allen, D.H.; Talreja, R. (Eds.) Multiscale Modeling and Simulation of Composite Materials and Structures; Springer: New York, NY, USA, 2008; ISBN 978-0-387-36318-9. [Google Scholar]
  24. Ghayoor, H.; Marsden, C.C.; Hoa, S.V.; Melro, A.R. Numerical Analysis of Resin-Rich Areas and Their Effects on Failure Initiation of Composites. Compos. Part A Appl. Sci. Manuf. 2019, 117, 125–133. [Google Scholar] [CrossRef]
  25. Li, H.; Zhang, B.; Bai, G. Effects of Constructing Different Unit Cells on Predicting Composite Viscoelastic Properties. Compos. Struct. 2015, 125, 459–466. [Google Scholar] [CrossRef]
  26. Bednarcyk, B.A.; Aboudi, J.; Arnold, S.M. Analysis of Fiber Clustering in Composite Materials Using High-Fidelity Multiscale Micromechanics. Int. J. Solids Struct. 2015, 69–70, 311–327. [Google Scholar] [CrossRef]
  27. Husseini, J.F.; Pineda, E.J.; Stapleton, S.E. Generation of Artificial 2-D Fiber Reinforced Composite Microstructures with Statistically Equivalent Features. Compos. Part A Appl. Sci. Manuf. 2023, 164, 107260. [Google Scholar] [CrossRef]
  28. Fast, T.; Scott, A.E.; Bale, H.A.; Cox, B.N. Topological and Euclidean Metrics Reveal Spatially Nonuniform Structure in the Entanglement of Stochastic Fiber Bundles. J. Mater. Sci. 2015, 50, 2370–2398. [Google Scholar] [CrossRef]
  29. Dixon, P.M. Ripley’s K Function. In Wiley StatsRef: Statistics Reference Online; John Wiley & Sons, Ltd.: Hoboken, NJ, USA, 2014; ISBN 978-1-118-44511-2. [Google Scholar]
  30. Ripley, B.D. Modelling Spatial Patterns. J. R. Stat. Soc. Ser. B (Methodol.) 1977, 39, 172–192. [Google Scholar] [CrossRef]
  31. Liu, K.C.; Ghoshal, A. Validity of Random Microstructures Simulation in Fiber-Reinforced Composite Materials. Compos. Part B Eng. 2014, 57, 56–70. [Google Scholar] [CrossRef]
  32. Park, S.-M.; Lim, J.H.; Seong, M.R.; Sohn, D. Efficient Generator of Random Fiber Distribution with Diverse Volume Fractions by Random Fiber Removal. Compos. Part B Eng. 2019, 167, 302–316. [Google Scholar] [CrossRef]
  33. Wang, W.; Dai, Y.; Zhang, C.; Gao, X.; Zhao, M. Micromechanical Modeling of Fiber-Reinforced Composites with Statistically Equivalent Random Fiber Distribution. Materials 2016, 9, 624. [Google Scholar] [CrossRef]
  34. Ge, W.; Wang, L.; Sun, Y.; Liu, X. An Efficient Method to Generate Random Distribution of Fibers in Continuous Fiber Reinforced Composites. Polym. Compos. 2019, 40, 4763–4770. [Google Scholar] [CrossRef]
  35. Sanei, S.H.R.; Barsotti, E.J.; Leonhardt, D.; Fertig, R.S. Characterization, Synthetic Generation, and Statistical Equivalence of Composite Microstructures. J. Compos. Mater. 2017, 51, 1817–1829. [Google Scholar] [CrossRef]
  36. Wang, W.; Wang, H.; Fei, S.; Wang, H.; Dong, H.; Ke, Y. Generation of Random Fiber Distributions in Fiber Reinforced Composites Based on Delaunay Triangulation. Mater. Des. 2021, 206, 109812. [Google Scholar] [CrossRef]
  37. Cai, C.; Wang, B.; Yin, W.; Xu, Z.; Wang, R.; He, X. A New Algorithm to Generate Non-Uniformly Dispersed Representative Volume Elements of Composite Materials with High Volume Fractions. Mater. Des. 2022, 219, 110750. [Google Scholar] [CrossRef]
  38. Liu, Z.; Zhu, C.; Zhu, P. Generation of Random Fiber Distributions for Unidirectional Fiber-Reinforced Composites Based on Particle Swarm Optimizer. Polym. Compos. 2019, 40, 1643–1653. [Google Scholar] [CrossRef]
  39. Zhang, T.; Yan, Y. A Comparison between Random Model and Periodic Model for Fiber-Reinforced Composites Based on a New Method for Generating Fiber Distributions. Polym. Compos. 2017, 38, 77–86. [Google Scholar] [CrossRef]
  40. Maher Saad Hayder, H.; Afrasiab, H.; Gholami, M. Efficient Generation of Random Fiber Distribution by Combining Random Sequential Expansion and Particle Swarm Optimization Algorithms. Compos. Part A Appl. Sci. Manuf. 2023, 173, 107649. [Google Scholar] [CrossRef]
  41. Li, X.; McMains, S. A Voronoi Diagram Approach for Detecting Defects in 3D Printed Fiber-Reinforced Polymers from Microscope Images. Comp. Vis. Media 2023, 9, 41–56. [Google Scholar] [CrossRef]
  42. Ismail, Y.; Yang, D.; Ye, J. Discrete Element Method for Generating Random Fibre Distributions in Micromechanical Models of Fibre Reinforced Composite Laminates. Compos. Part B Eng. 2016, 90, 485–492. [Google Scholar] [CrossRef]
  43. Guo, R.; Alves, M.; Mehdikhani, M.; Breite, C.; Swolfs, Y. Synthesising Realistic 2D Microstructures of Unidirectional Fibre-Reinforced Composites with a Generative Adversarial Network. Compos. Sci. Technol. 2024, 250, 110539. [Google Scholar] [CrossRef]
  44. Haddani, F.; Maliki, A.E.; Lkouen, A. Random Microstructure Generation. In Proceedings of the 2nd International Conference on Embedded Systems and Artificial Intelligence (ESAI’21), Fez, Morocco, 1–2 April 2021. [Google Scholar]
  45. Ding, Y.; Camanho, P.P.; Silva, A. Comparison of Three Algorithms Generating Virtual Microstructures in Terms of the Degree of Randomness. Compos. Part A Appl. Sci. Manuf. 2024, 177, 107959. [Google Scholar] [CrossRef]
  46. Mechin, P.-Y.; Borras, A.; Cottard, K.; Keryvin, V. A Unified Method to Generate Representative Volume Elements with Tailored Random Fibre Arrangements to Estimate the Shear and Transverse Behaviours of Unidirectional Continuous Fibres Composite Plies. J. Compos. Mater. 2025, 59, 793–805. [Google Scholar] [CrossRef]
  47. Méchin, P.-Y.; Borras, A.; Keryvin, V. Influence of Microstructure Randomness on the Shear Behaviour and Compressive Strength of Continuous Carbon Fibre Composites. Appl. Compos. Mater. 2024, 31, 1173–1189. [Google Scholar] [CrossRef]
  48. Pathan, M.V.; Tagarielli, V.L.; Patsias, S.; Baiz-Villafranca, P.M. A New Algorithm to Generate Representative Volume Elements of Composites with Cylindrical or Spherical Fillers. Compos. Part B Eng. 2017, 110, 267–278. [Google Scholar] [CrossRef]
  49. Riaño, L.; Joliff, Y. An AbaqusTM Plug-in for the Geometry Generation of Representative Volume Elements with Randomly Distributed Fibers and Interphases. Compos. Struct. 2019, 209, 644–651. [Google Scholar] [CrossRef]
  50. Hamza, M.H.; Chattopadhyay, A. Multi Deep Learning-Based Stochastic Microstructure Reconstruction and High-Fidelity Micromechanics Simulation of Time-Dependent Ceramic Matrix Composite Response. Compos. Struct. 2024, 345, 118360. [Google Scholar] [CrossRef]
  51. Feder, J. Random Sequential Adsorption. J. Theor. Biol. 1980, 87, 237–254. [Google Scholar] [CrossRef]
  52. Hinrichsen, E.L.; Feder, J.; Jøssang, T. Geometry of Random Sequential Adsorption. J. Stat. Phys. 1986, 44, 793–827. [Google Scholar] [CrossRef]
  53. Yang, L.; Yan, Y.; Ran, Z.; Liu, Y. A New Method for Generating Random Fibre Distributions for Fibre Reinforced Composites. Compos. Sci. Technol. 2013, 76, 14–20. [Google Scholar] [CrossRef]
  54. Stapleton, S.E.; Appel, L.; Simon, J.-W.; Reese, S. Representative Volume Element for Parallel Fiber Bundles: Model and Size Convergence. Compos. Part A Appl. Sci. Manuf. 2016, 87, 170–185. [Google Scholar] [CrossRef]
  55. Wang, X.; Guan, Z.; Du, S.; Han, G.; Zhang, M. A Long-Range Force Based Random Method for Generating Anisotropic 2D Fiber Arrangement Statistically Equivalent to Real Composites. Compos. Sci. Technol. 2019, 180, 33–43. [Google Scholar] [CrossRef]
  56. Li, G.; Sharifpour, F.; Bahmani, A.; Montesano, J. A New Approach to Rapidly Generate Random Periodic Representative Volume Elements for Microstructural Assessment of High Volume Fraction Composites. Mater. Des. 2018, 150, 124–138. [Google Scholar] [CrossRef]
  57. Wongsto, A.; Li, S. Micromechanical FE Analysis of UD Fibre-Reinforced Composites with Fibres Distributed at Random over the Transverse Cross-Section. Compos. Part A Appl. Sci. Manuf. 2005, 36, 1246–1266. [Google Scholar] [CrossRef]
  58. Jia, X.; Xia, Z.; Gu, B. Numerical Analyses of 3D Orthogonal Woven Composite under Three-Point Bending from Multi-Scale Microstructure Approach. Comput. Mater. Sci. 2013, 79, 468–477. [Google Scholar] [CrossRef]
  59. Maligno, A.; Warrior, N. Finite Element Investigations on the Microstructure of Fibre-Reinforced Composites. Express Polym. Lett. 2008, 2, 665–676. [Google Scholar] [CrossRef]
  60. Ge, C.; Dong, Y.; Maimaitituersun, W. Microscale Simulation on Mechanical Properties of Al/PTFE Composite Based on Real Microstructures. Materials 2016, 9, 590. [Google Scholar] [CrossRef] [PubMed]
  61. Carey, E.J.; Husseini, J.F.; Stapleton, S.E. Design of a Reduced Order Finite Element Model to Study the Effects of Microstructure Morphology on Composite Properties. In Proceedings of the 39th ASC Technical Conference, San Diego, CA, USA, 21–24 October 2024. [Google Scholar]
  62. Ballhause, D.; König, M.; Kröplin, B. Modelling Fabric-Reinforced Membranes with the Discrete Element Method. In Textile Composites and Inflatable Structures II; Oñate, E., Kröplin, B., Eds.; Computational Methods in Applied Sciences; Springer: Dordrecht, The Netherlands, 2008; pp. 51–67. ISBN 978-1-4020-6856-0. [Google Scholar]
  63. Bednarcyk, B.A.; Aboudi, J.; Arnold, S.M. Micromechanics of Composite Materials Governed by Vector Constitutive Laws. Int. J. Solids Struct. 2017, 110–111, 137–151. [Google Scholar] [CrossRef]
  64. Pineda, E.; Bednarcyk, B.; Waas, A.; Arnold, S. On Multiscale Modeling Using the Generalized Method of Cells: Preserving Energy Dissipation across Disparate Length Scales. Comput. Mater. Contin. 2013, 35, 119–154. [Google Scholar] [CrossRef]
  65. Aboudi, J. The Generalized Method of Cells and High-Fidelity Generalized Method of Cells Micromechanical Models—A Review. Mech. Adv. Mater. Struct. 2004, 11, 329–366. [Google Scholar] [CrossRef]
  66. Ricks, T.M.; Lacy, T.E.; Bednarcyk, B.A.; Arnold, S.M.; Hutchins, J.W. A Multiscale Progressive Failure Modeling Methodology for Composites That Includes Fiber Strength Stochastics. Comput. Mater. Contin. 2014, 40, 99–129. [Google Scholar]
  67. Zhou, J.; Qi, L.; Gokhale, A.M. Generation of Three-Dimensional Microstructure Model for Discontinuously Reinforced Composite by Modified Random Sequential Absorption Method. J. Eng. Mater. Technol. 2016, 138, 021003. [Google Scholar] [CrossRef]
  68. Herráez, M.; Mora, D.; Naya, F.; Lopes, C.S.; González, C.; LLorca, J. Transverse Cracking of Cross-Ply Laminates: A Computational Micromechanics Perspective. Compos. Sci. Technol. 2015, 110, 196–204. [Google Scholar] [CrossRef]
  69. Segurado, J.; Llorca, J. A Numerical Approximation to the Elastic Properties of Sphere-Reinforced Composites. J. Mech. Phys. Solids 2002, 50, 2107–2121. [Google Scholar] [CrossRef]
  70. Pourkamali-Anaraki, F.; Husseini, J.F.; Pineda, E.J.; Bednarcyk, B.A.; Stapleton, S.E. Two-Stage Surrogate Modeling for Data-Driven Design Optimization with Application to Composite Microstructure Generation. Eng. Appl. Artif. Intell. 2024, 138, 109436. [Google Scholar] [CrossRef]
  71. HexTow Laminate Properties in HexPly® 8552 | Hexcel. Available online: https://www.hexcel.com/Products/Resources/1664/hextow-laminate-properties-in-hexply-8552 (accessed on 17 July 2024).
  72. Flores, M.; Sharits, A.; Wheeler, R.; Sesar, N.; Mollenhauer, D. Experimental Analysis of Polymer Matrix Composite Microstructures under Transverse Compression Loading. Compos. Part A Appl. Sci. Manuf. 2022, 156, 106859. [Google Scholar] [CrossRef]
  73. Arndt, C.M.; de Carvalho, N.V.; Czabaj, M.W. Experimental Reexamination of Transverse Tensile Strength for IM7/8552 Tape-Laminate Composites. J. Compos. Mater. 2020, 54, 3297–3312. [Google Scholar] [CrossRef]
  74. Stuckner, J.; Harder, B.; Smith, T.M. Microstructure Segmentation with Deep Learning Encoders Pre-Trained on a Large Microscopy Dataset. npj Comput. Mater. 2022, 8, 200. [Google Scholar] [CrossRef]
Figure 1. The microstructure characterization process, where fiber positions are triangulated to calculate a local fiber volume fraction, V f j . Then, triangles are filtered as fiber clusters (FCs) or matrix-rich clusters (MRCs) based on thresholding. Smoothing is employed to obtain the final FC and MRC descriptors.
Jcs 09 00363 g001
Figure 2. Mesh discretization of a microstructure where higher-order fiber and matrix elements are represented in an isoparametric space.
Jcs 09 00363 g002
Figure 3. Local fiber volume fraction inter-quartile range, V f I Q R , v e r s u s   m e d i a n , V f M d n , for 3500 artificial microstructures created with a simulation-based generator and with a uniform–random generator. Fifty characterized microstructures obtained from microscopy scans are also shown for comparison.
Jcs 09 00363 g003
Figure 4. Comparison of characterized microstructures from a simulation-based generator, a uniform–random generator, and microscopy scans for (a) area density of matrix-rich clusters (MRCs), ρ M R C ,   v e r s u s   f i b e r   c l u s t e r s   ( F C s ) ,   ρ F C ,   a n d   ( b )   n o r m a l i z e d   n u m b e r   o f   M R C s ,   N M R C ,   v e r s u s   F C s ,   N F C .
Jcs 09 00363 g004
Figure 5. Correlation matrices between descriptors and mechanical properties for microstructures generated with the simulation-based method and with the uniform–random method.
Jcs 09 00363 g005
Figure 6. Simulated transverse strength, S 22 ,   v e r s u s   l o c a l   f i b e r   v o l u m e   f r a c t i o n   i n t e r     q u a r t i l e   r a n g e ,   V f I Q R , for microstructures generated with the simulation-based method and with the uniform–random method.
Jcs 09 00363 g006
Figure 7. Box and whisker plots of all six microstructure descriptors measured from randomly placed square windows of increasing size within microscopy scans.
Jcs 09 00363 g007
Figure 8. Root mean squared (RMS) of (a) the median and (b) IQR of measured descriptors as a function of the number of fibers, n f .   T h e   R M S   w a s   c a l c u l a t e d   i n   r e f e r e n c e   t o   t h e   m a x i m u m   n f value.
Jcs 09 00363 g008
Figure 9. Four different microstructures sampled from microscopy scans of an IM7/8552 composite.
Jcs 09 00363 g009
Figure 10. Simulated transverse stiffness, C 2222 , of equivalent microstructures with different amounts of descriptors to microscopy samples.
Jcs 09 00363 g010
Figure 11. Simulated transverse strength, S 22 , of equivalent microstructures with different amounts of descriptors to microscopy samples.
Jcs 09 00363 g011
Table 1. Input variables and ranges used to sample the simulation-based generator.
ParameterVariableMinimumMaximum
Global volume fraction V f 0.200.80
Number of fibers n f 16400
Minimum spacing d m i n 0.05 × r f 0.01 × r f
Number of fibers per cell n f / c e l l 2 n f
Margin m 0.00 0.2 × n f 2 × c e i l n f n f / c e l l × π V f
Contact Damping d i j n 0.051.00
Global Damping d i 0.051.00
Table 2. Isotropic material properties of 8552 resin, as reported by Hexcel [71].
E   ( G P a ) v σ c r i t   ( M P a )
4.670.36121
Table 3. Transversely isotropic material properties of IM7 fibers, where 1 indicates the longitudinal fiber direction [72].
E 1   ( G P a ) E 2   ( G P a ) v 12 v 23 G 12   ( G P a )
276140.260.2620
Table 4. Microstructure descriptors measured from sampled regions of a microscopy scan.
Microstructure Number V f M d n V f I Q R ρ F C ρ M R C N F C N M R C
10.5160.3070.0990.4770.0280.028
20.6960.1780.3470.3940.0120.027
30.6780.2030.2810.4120.0190.048
40.7030.1890.3480.3890.0110.035
Disclaimer/Publisher’s Note: The statements, opinions and data contained in all publications are solely those of the individual author(s) and contributor(s) and not of MDPI and/or the editor(s). MDPI and/or the editor(s) disclaim responsibility for any injury to people or property resulting from any ideas, methods, instructions or products referred to in the content.

