1. Introduction
Posidonia oceanica (PO) is a Mediterranean seagrass species that plays a fundamental role in marine ecosystems. It has roots, stems, leaves, and the ability to produce flowers and fruits with seeds. PO forms extensive underwater meadows on sandy and gravelly seabeds, growing in clear waters, making its presence an indicator of high water quality. However, storms can detach large amounts of PO leaves, which accumulate on beaches in the form of aegagropilae—fibrous balls that contribute to coastal erosion protection. Despite their ecological importance, these accumulations are often perceived negatively due to their visual impact on tourism and the odor produced by microbial decomposition. This highlights the potential for waste recycling and sustainable applications of PO, encouraging its valorization in various fields.
In recent years, some authors have investigated possible uses of PO as a low-cost adsorbent for the removal of dyes or phenol [
1,
2], for biofuel production [
3,
4] as a substitute for structural wood particle boards in construction [
5], as a filler for thermal insulation in buildings [
6], and as a reinforcement of polymeric matrix to realize new natural composites [
7,
8] or nanocomposite films [
9,
10,
11,
12,
13]. In fact, based on PO’s high fire resistance [
5], Macià et al. [
5] prepared different biocomposites based on a mixture of PO and pinewood particles in a polyurethane matrix, in order to demonstrate their potential as structural panels by showing high dimensional stability and improved resistance to environmental factors.
Further, due to environmental issues that have recently been pointing to a need for more biobased fillers, PO is gaining attention as an additive to plastics to improve mechanical and thermal properties. Specifically, Ferrero et al. [
8] investigated the mechanical and thermal behavior of composites of PO with high-density polyethylene HDPE derived from sugarcane, finding an increase in stiffness with a relevant decrease in elongation at break for a composite with 40% wt of PO and an improvement in both tensile and flexural moduli up to 60%. Further, Scaffaro et al. [
12] used leaves of PO to prepare PLA biocomposites, finding a beneficial effect of the PO leaves on both tensile and flexural moduli as the PO content increased. Seggiani et al. [
6] examined the feasibility of manufacturing biocomposites through extrusion, utilizing polyhydroxyalkanoates (PHAs) reinforced with PO fibers. Their research showed significant mechanical enhancements in the hybrid material. In particular, they reported improved impact and tensile properties based on a measured tensile modulus of 2.3 GPa for biocomposites with 30% wt PO fiber, representing an 80% increase compared to the neat material (1.24 GPa). Further, accelerated biodegradation in marine sediments was observed for films composed of 30% wt PO fibers, indicating that PO fibers aid in biodegradation. These findings highlight the potential for PO-based biocomposites in marine applications, offering structural integrity while promoting environmentally sustainable disposal.
This study explored how PO affects the thermal degradation and flammability of a commercial epoxy resin that was appropriately modified by dispersing prepared PO powder at three different concentration levels. To assess the dispersion and interaction mechanisms of PO within the resin matrix, scanning electron microscopy (SEM) and Fourier transform infrared spectroscopy (FT-IR) were carried out on both PO itself and the resulting hybrid composites. Further, thermogravimetric analysis (TGA) and cone calorimetry tests were performed to investigate thermal degradation and flammability behavior. The experimental results highlighted that PO could be a good low-cost green filler to improve the thermal and flammability properties of thermosetting resins. Hence, the PO-modified resin at 12% (w/w) was used to impregnate a twill basalt reinforcement and realize composites by vacuum infusion. The PO–epoxy fiber-reinforced composites showed better fire performance than neat-based composites by cone calorimetry characterization.
2. Materials and Methods
PO leaves gathered from the Campania coast were subjected to a two-phase drying process in a vacuum oven: a first stage at 100 °C for 2 h, followed by a second stage at 80 °C for 22 h. Once dehydrated, the material was cut into smaller pieces and ground to obtain granules using a Mulino (Mulino Ultra Centrifugo ZM 100, Retsch, Haan, Germany). To examine the morphology of the prepared PO materials, imaging and analysis were performed using an Esem_Fei_Inspect_S electron microscope (Quanta, TX, USA) integrated with an Oxford INCA PentaFETx3 EDX spectrometer (Si(Li) detector, nitrogen-cooled, featuring an ultrathin ATW2 window). The collected data were then processed using INCA software v7 (Staufen im Breisgau, Germany), enabling comprehensive material characterization.
PO powder was dispersed within an epoxy resin (PRIME 20LV by Gurit, Zurich, Switzerland) using an IKA Turrax homogenizer (Sigma-Aldrich, Milan, Italy) at a homogenization speed of 14,000 rpm for 30 min. After degassing in a vacuum oven for three hours, low reactive PrimeTM hardener at a 26:100 resin ratio was added to the mixture. Resin consolidation was performed at 60 °C for 16 h based on the curing indications on the resin datasheet. Three different kinds of epoxy resins, with 8%, 10%, and 12% w/w PO, were attained. Additive content in the range of 8–12%wt was considered in order to achieve a uniform dispersion of PO within the polymer matrix and to ensure good processability. Further, both the neat epoxy resin and the PO-modified matrix at 12% w/w were used to obtain fiber-reinforced composites using the vacuum infusion process. In particular, 16 layers of a basalt fabric of 200 g/mq (BASALTEX NV, Wevelgem, Belgium) were impregnated by vacuum action and then consolidated at 60 °C for 16 h.
Fourier transform infrared analysis was performed using a Frontier MIR/FIR spectrometer (Perkin Elmer, Springfield, MA, USA) on the PO powder, the neat resin, and the hybrid resin with 12% w/w PO percentage.
The neat and hybrid resins were characterized by thermogravimetric (TGA) and cone calorimetry tests. TGA tests were performed using a TA-Q500 (TA Instruments Ltd., New Castle, DE, USA) from environmental temperature to 1000 °C with a heating rate of 10 °C/min under air flow (90.0 mL/min).
The cone calorimetry experiments were performed by testing the samples horizontally under an incident flux of 50 KW/m
2 with a Fire Testing Technology Ltd. instrument (West Sussex, UK) according to ISO 5650 procedure [
14]. Specimens with standard dimensions of 100 × 100 × 3 mm were fabricated. A total of three samples were evaluated, and the resulting data were averaged to ensure consistency. The cone calorimetry tests were performed on the resultant fiber basalt-reinforced composites in the same conditions.
3. Results
3.1. Particle Morphology and Size Analysis
Scanning electron microscopy was used to investigate the morphology of neat basalt fiber-reinforced composites, PO powder, and PO–epoxy hybrid composites.
Figure 1 shows the SEM micrograph of the epoxy–basalt composite. It is possible to observe the typical smooth and glassy morphology of the epoxy matrix, which appears homogeneous, with minimal porosity and good dispersion through the basalt fibers.
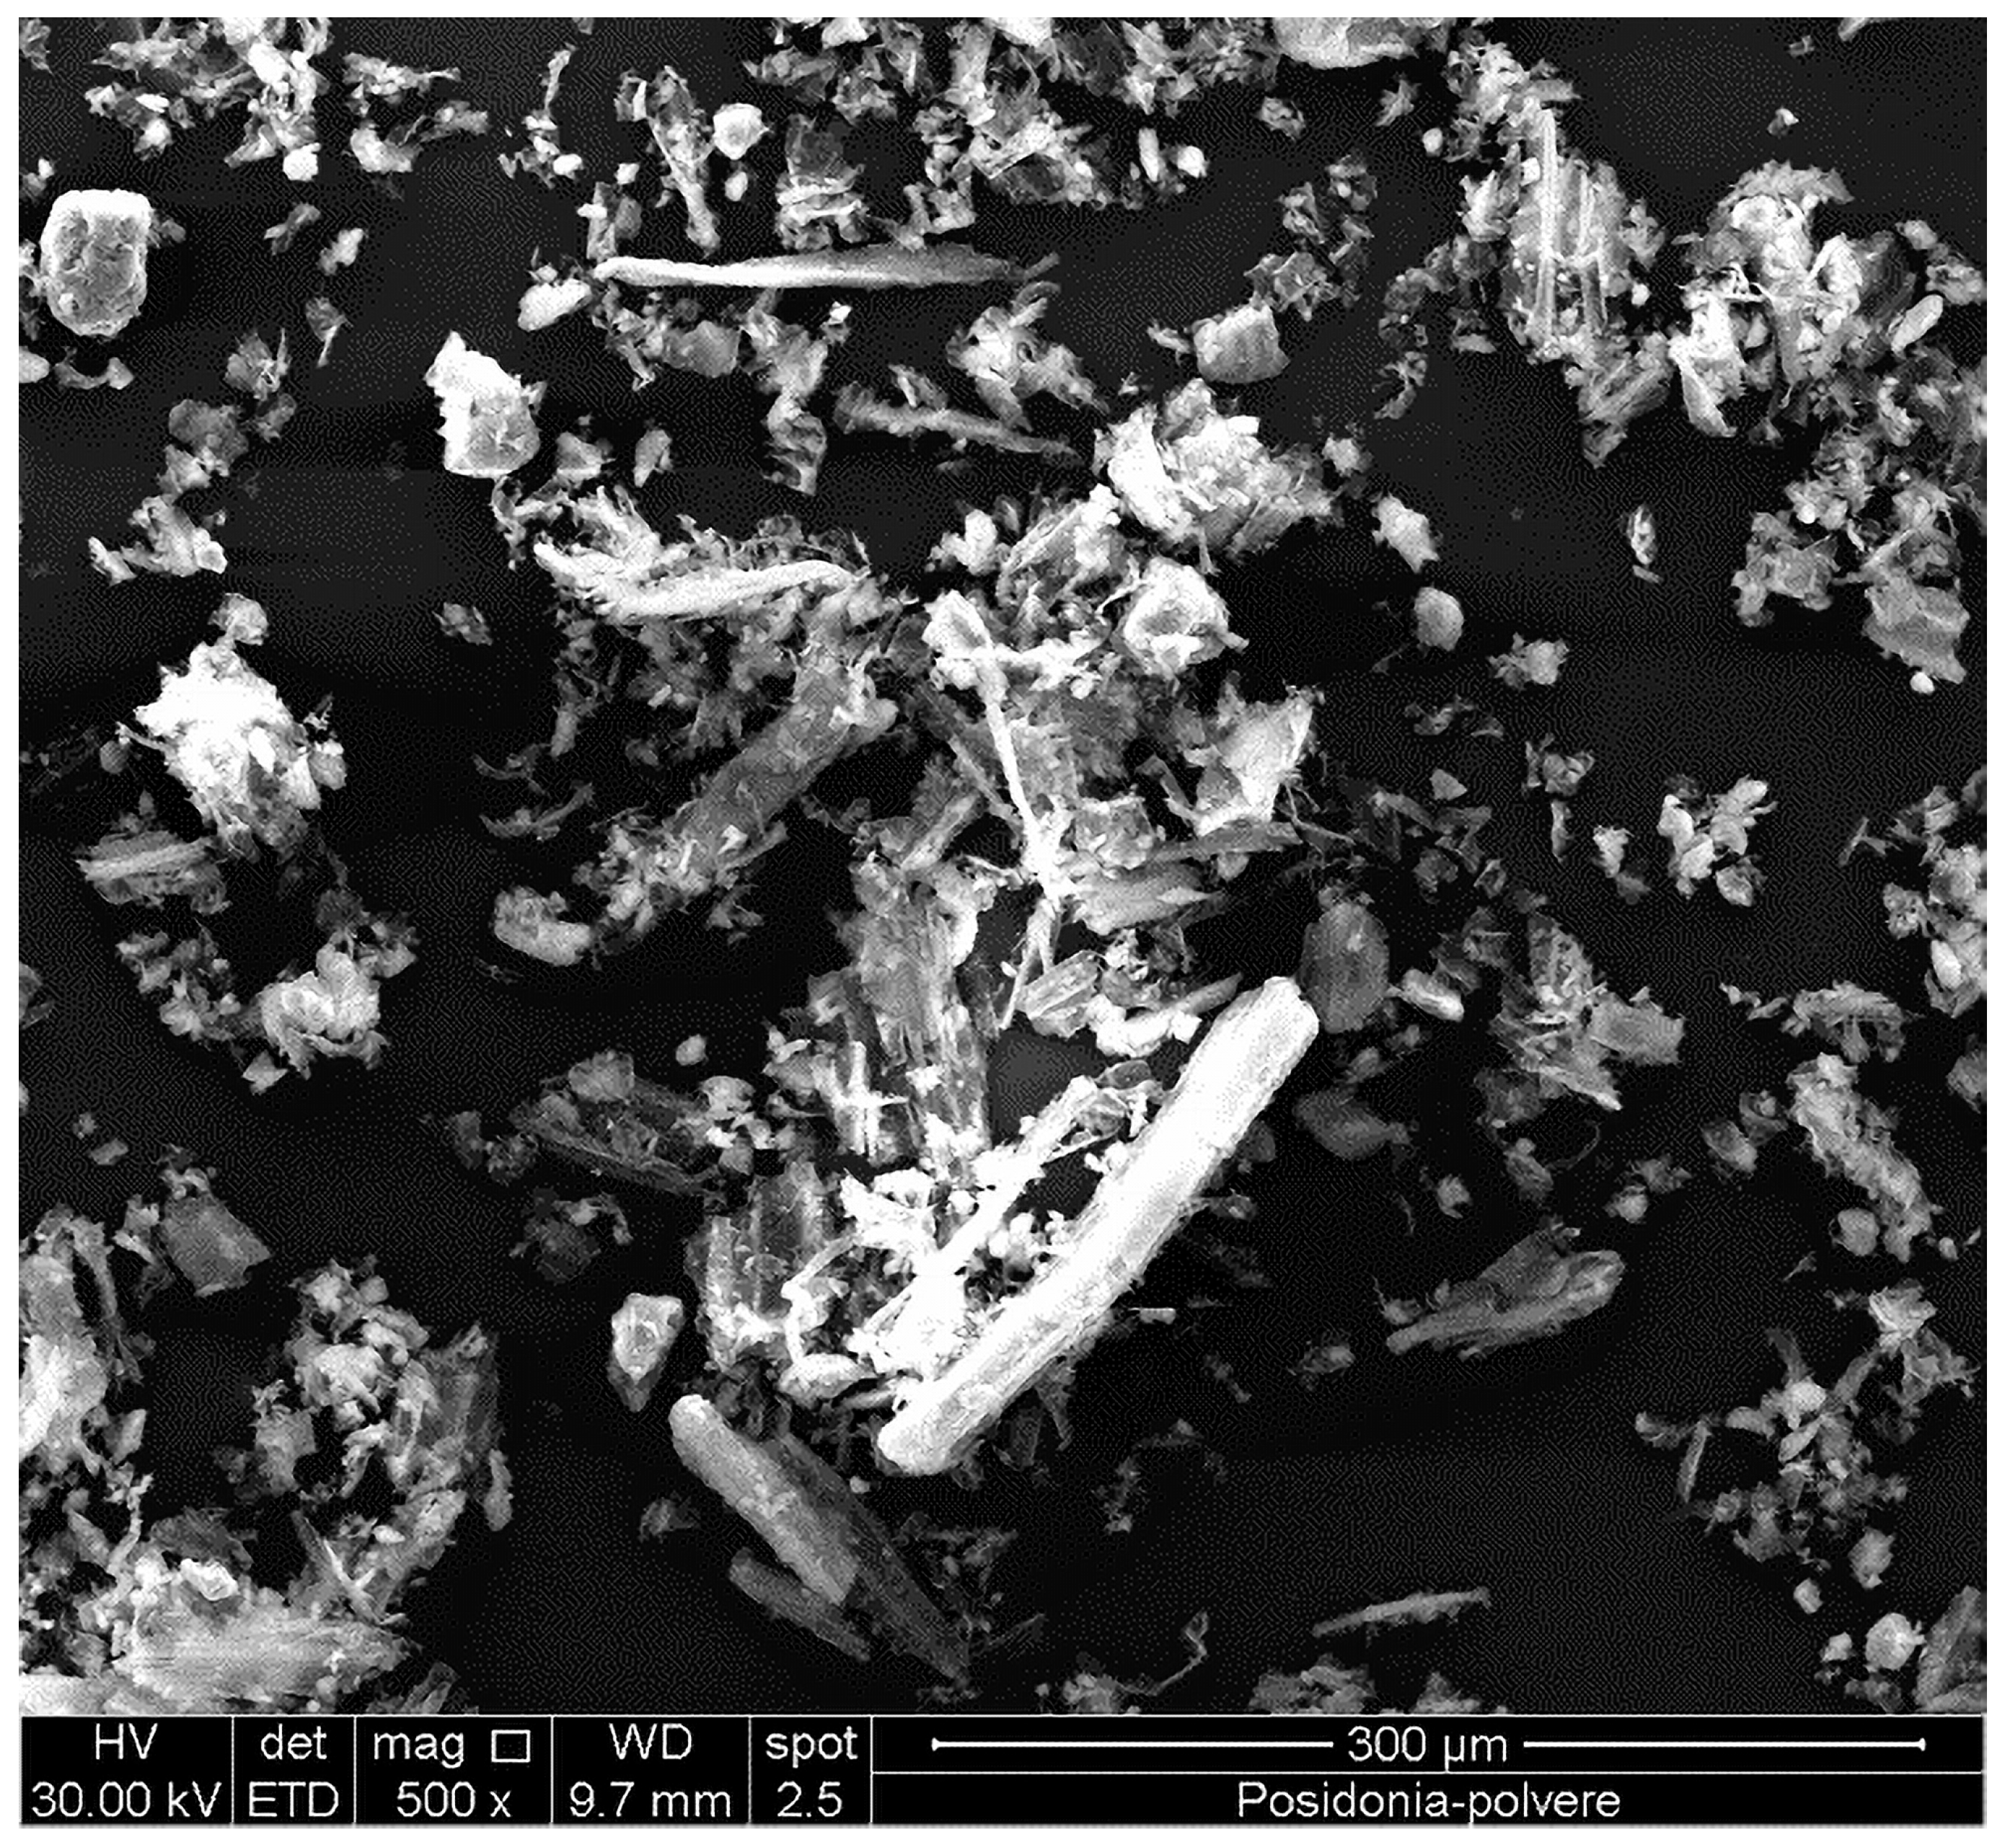
An SEM micrograph of the obtained PO powder is shown in
Figure 2. It is characterized by an irregular morphology with different-shaped particles, some of which appear fibrous or elongated, while others are more granular or fragmented.
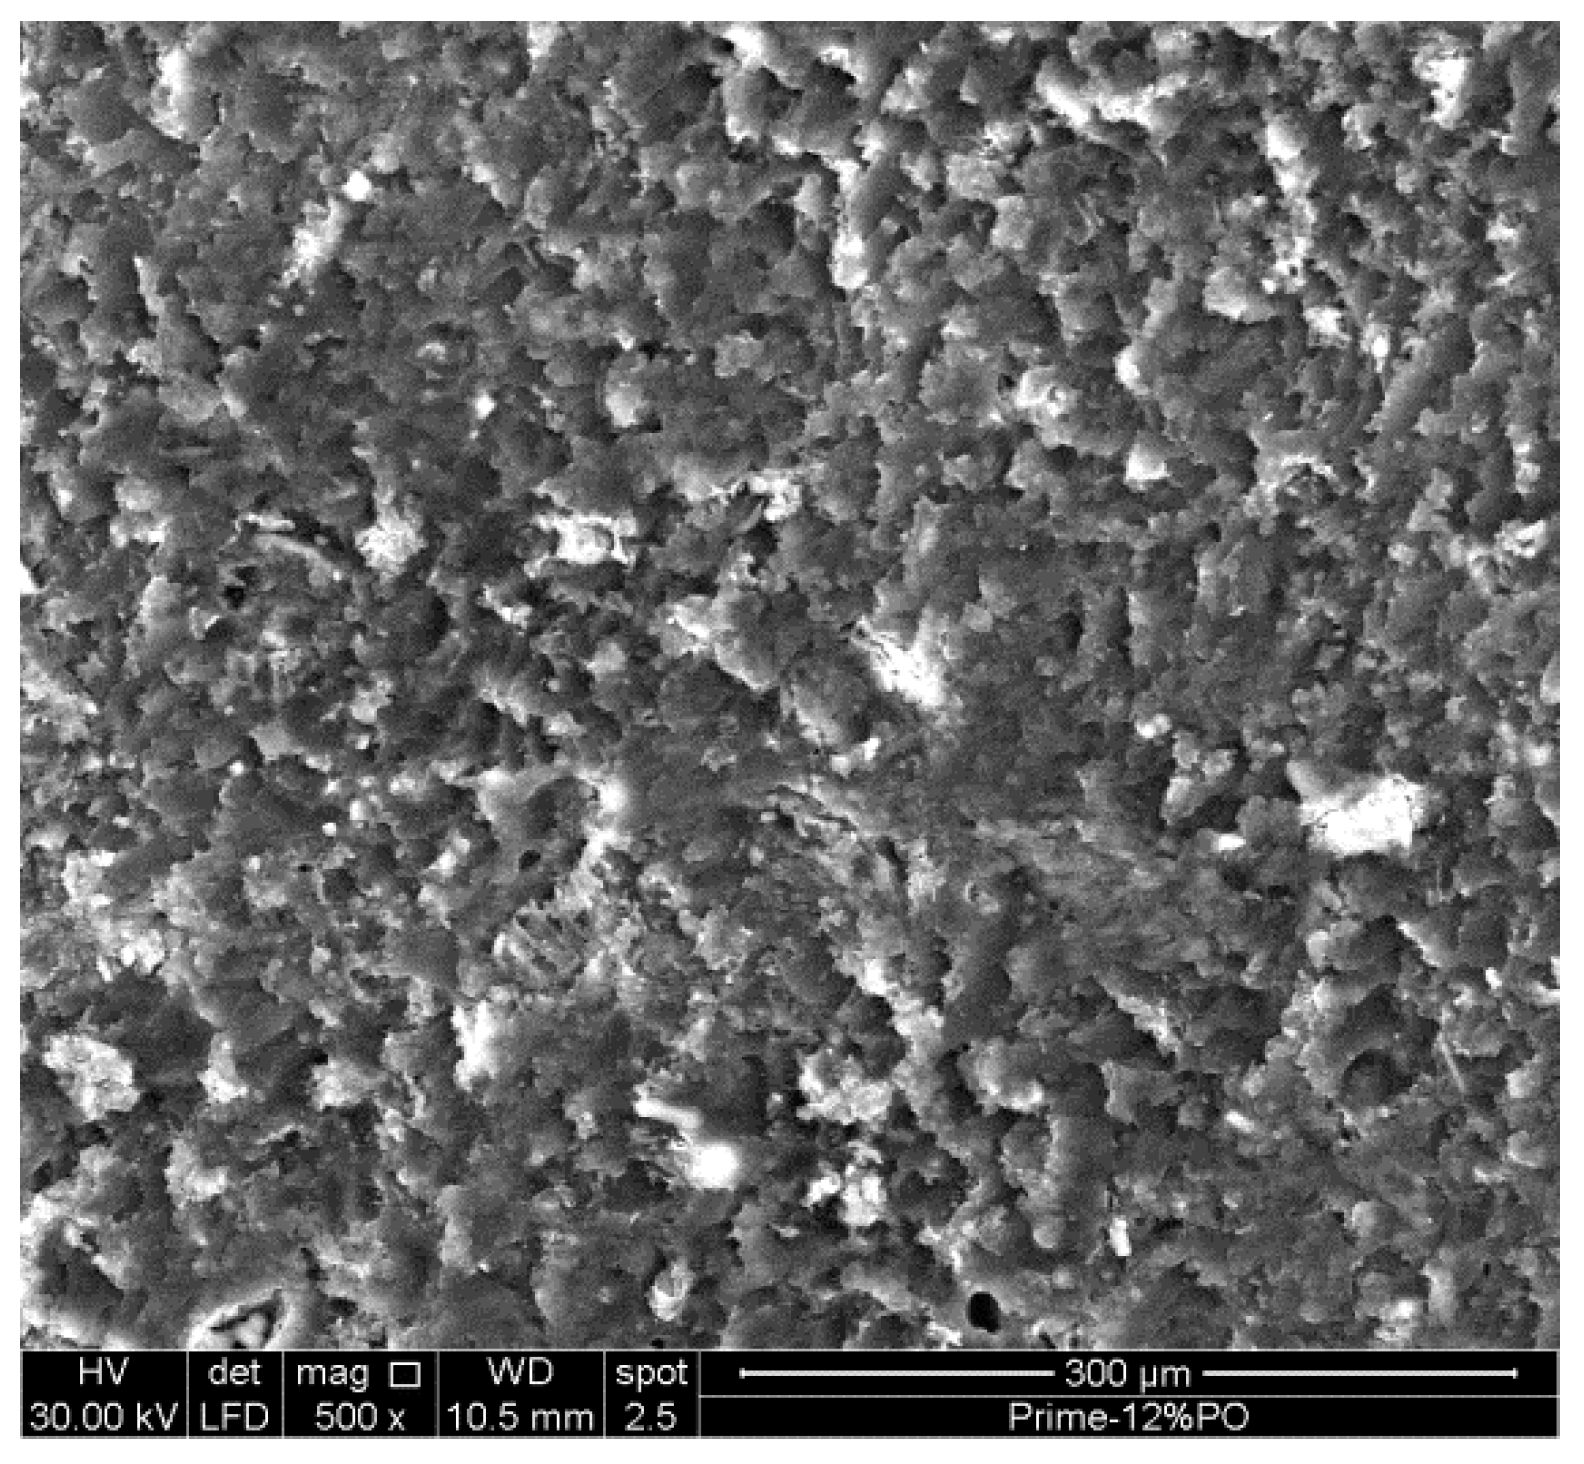
SEM analysis of the hybrid resins was accomplished also (
Figure 3,
Figures S1 and S2). In
Figure 3, the micrograph of the composite exhibits a uniform dispersion of PO.
The size of the PO granules was measured by laser diffraction, and the results are shown in
Figure 4.
Figure 4a illustrates the percentage of cumulative volume and
Figure 4b shows the non-cumulative relative volume distribution as a function of the particle size.
The average diameter of the PO particles was estimated to be about 32 μm. Further, most particles (90%) were less than 70 μm, as expected based on the use of a grinder.
3.2. Spectroscopic Analysis
FT-IR analysis was performed to investigate potential chemical interactions between the epoxy resin and the PO powder. The FT-IR spectra relative to the PO, the neat epoxy, and the hybrid resin with PO at 12%
w/
w are shown in
Figure 5 and
Figure S3.
PO is characterized by a strong band at 1035 cm
−1, which, together with the two shoulders at about 1092 cm
−1 and 1148 cm
−1, can be ascribed to the C-O stretching of the polysaccharide structure. Three small peaks at 1254, 1317, and 1388 cm
−1 and a discrete peak at 1420 cm
−1 can be ascribed to the O-H deformations of phenolic and aliphatic groups. A weak band is observed around 1650 cm
−1 in the PO spectrum, which is commonly associated with H–O–H bending vibrations of absorbed water. This observation supports the presence of moisture in the PO material, which aligns with the thermal degradation results obtained by TGA and could affect flammability. A small peak around 1600–1620 cm
−1 is also present and could be assigned to C=C stretching in aromatic rings and COO- groups [
15]. Further, the peaks visible in the PO spectrum, which correspond to C–O and C–O–C stretching, underwent slight attenuation or shifting in the composite spectrum. These changes indicate the composition of the epoxy resin and PO, but the spectra are not informative enough to analyze the interaction between the two through chemical or physical linkages.
3.3. Thermogravimetric Results
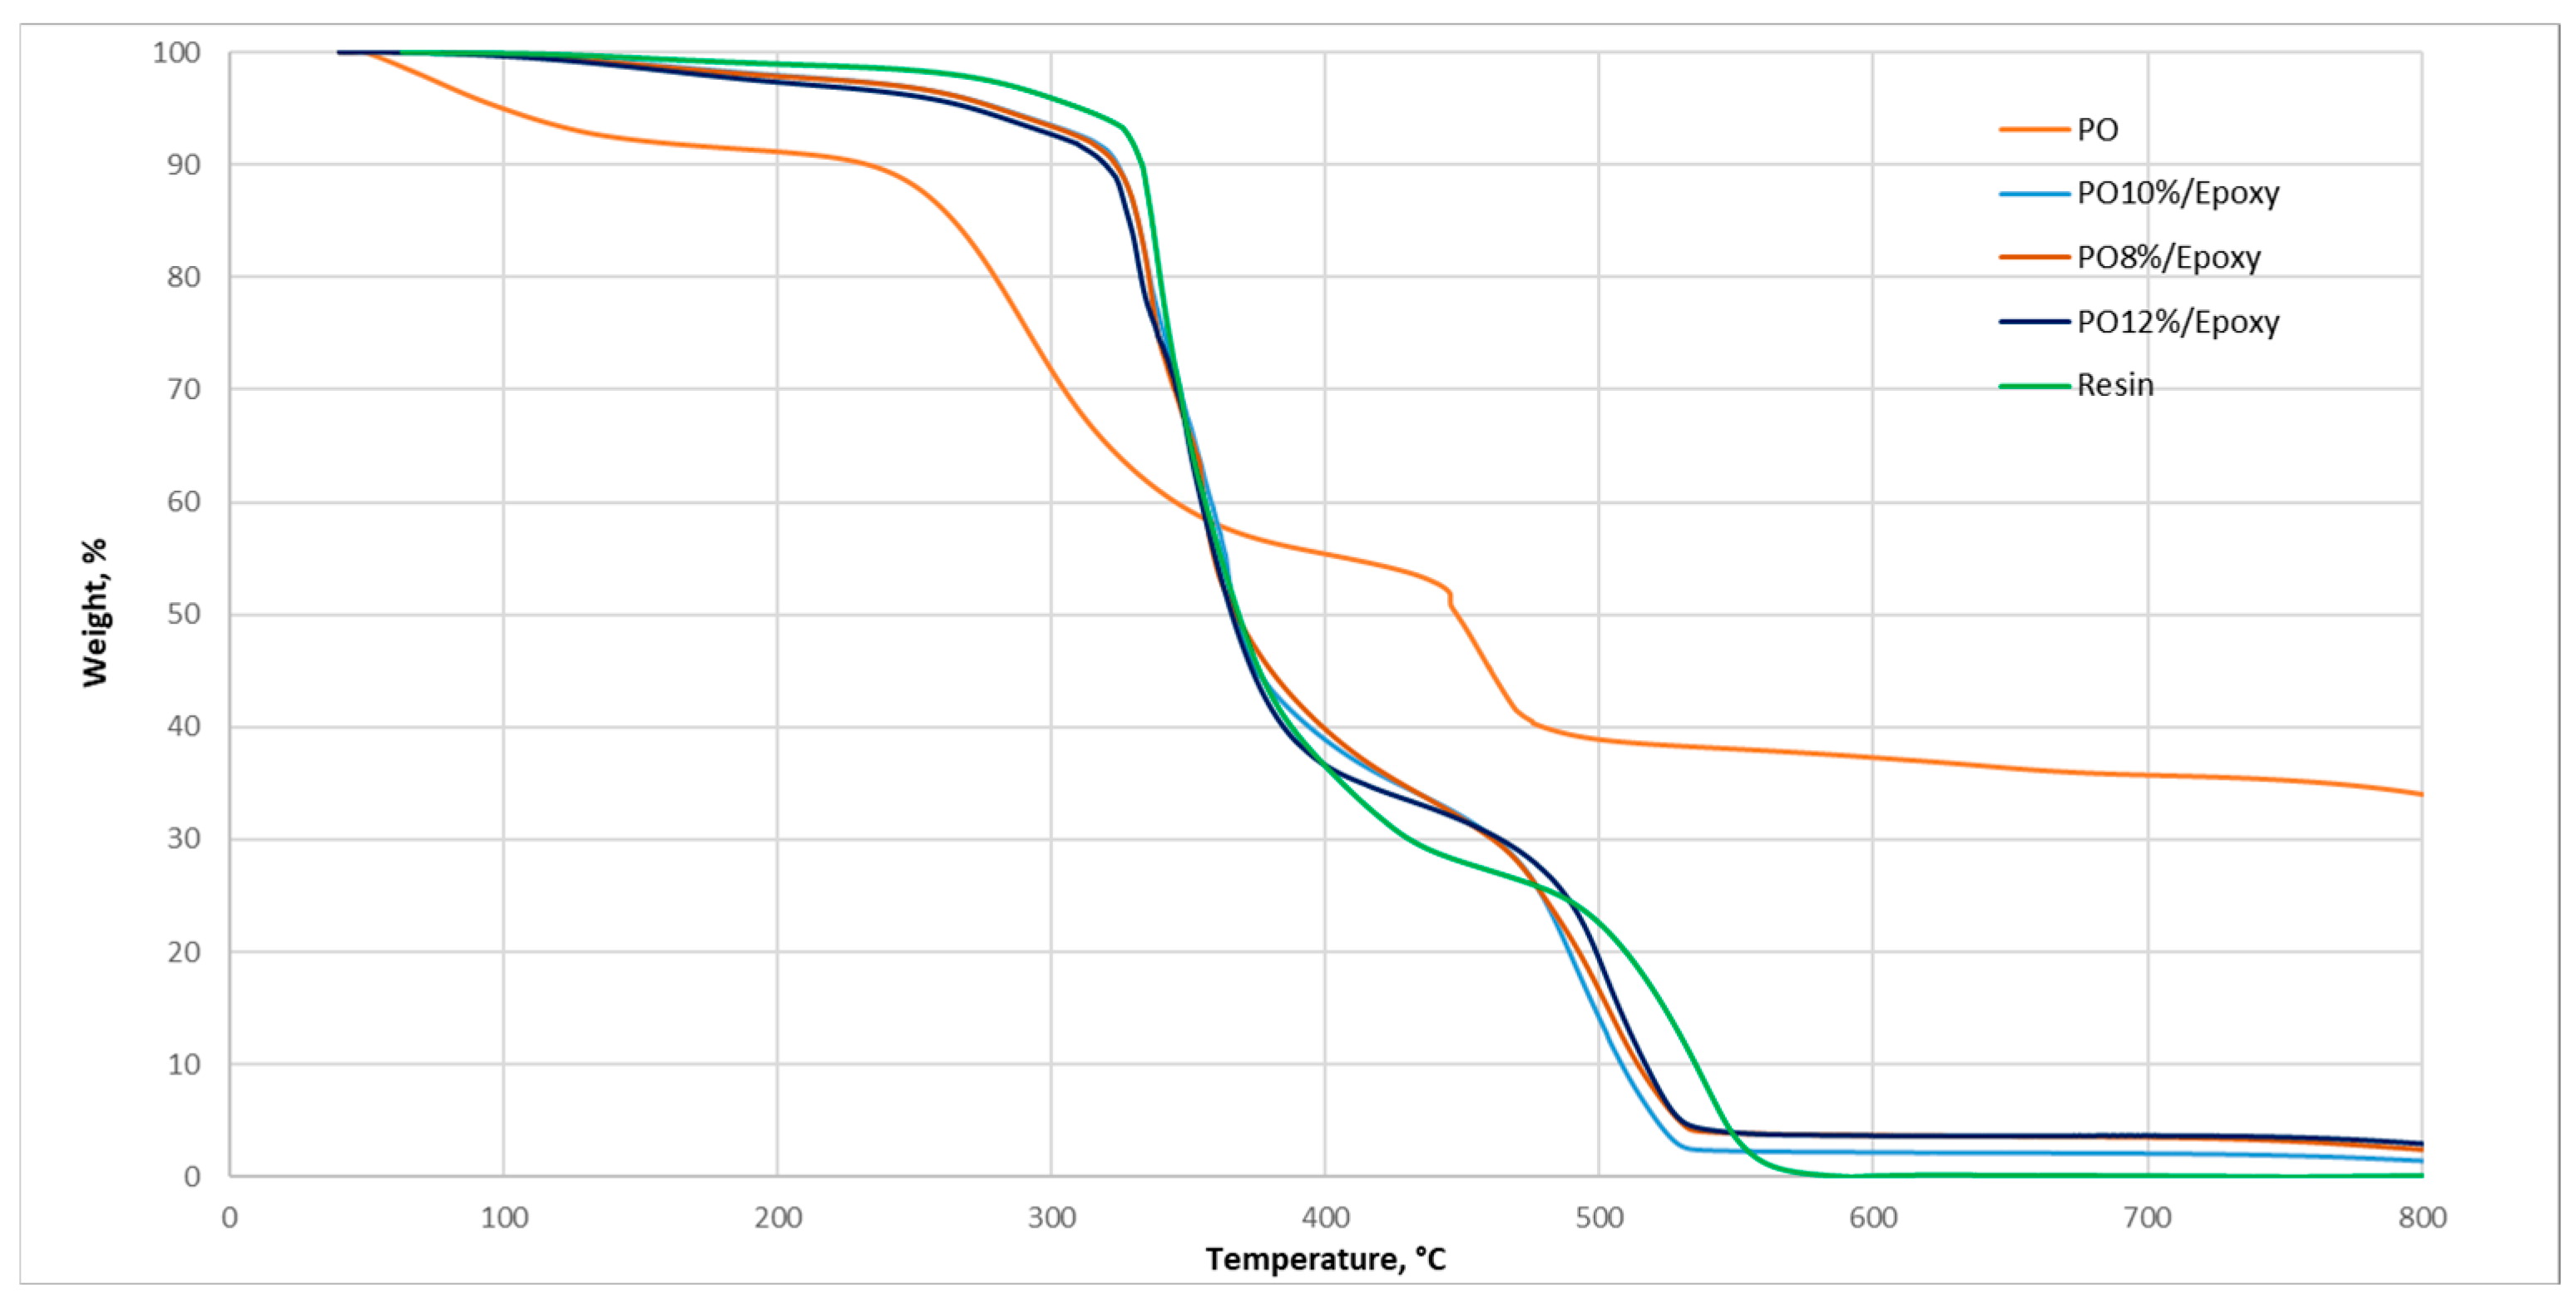
The thermal degradation behavior of the PO-based epoxy composites was investigated under air flow at a heating rate of 10 °C/min. The TGA and DTG curves, respectively, for PO, neat epoxy, and hybrid resins are illustrated in
Figure 6 and
Figure 7.
The degradation rate and the peak temperature relative to each step are reported in
Table 1.
The profile of PO shows three degradation steps associated with the moisture release, decomposition of its constituents (hemicellulose, cellulose, and lignin) with the consequent release of volatile products, and finally the combustion of char residues. Jeguirim et al. [
16] have shown that release of volatiles is characterized by a solid-state mechanism based on a three-dimensional diffusion controlled reaction, while the char combustion mechanism corresponds to a contracting area phase boundary controlled reaction. On the other hand, the epoxy resin is characterized by two steps, one in the range between 300 °C and 400 °C and the other between 450 °C and 600 °C. Further, a shoulder is observed around 430 °C. An intermediate behavior is observed for the hybrid composites, which show more degradation steps than the neat resin. In particular, in the temperature range between 300 °C and 400 °C, two stages with a degradation rate lower than that of the neat resin are noticeable: one corresponds to the degradation of PO and the other to the degradation of the polymer matrix. In particular, this second degradation stage is delayed with respect to the neat resin and is shifted from 12 °C up to 26 °C, denoting a synergistic effect of the PO that increases the thermal stability of the resin by the action of its phenolic compounds [
7]. In addition, the incorporation of the PO in the epoxy matrix affects the weight residual, which increases as the PO concentration increases in the hybrid epoxy, as reported in
Table 2.
3.4. Cone Calorimetry Results
The flammability characteristics of epoxy resin with PO powder and basalt-reinforced composites were evaluated using cone calorimetry tests.
Figure 8 shows the heat release rate over time, comparing the neat resin to hybrid composites with PO at 8%, 10%, and 12% (
w/
w).
Figure 9 shows the evolution of the heat release rate for both neat and hybrid basalt-reinforced composites.
Table 3 summarizes the key data derived from the cone calorimetry tests for all examined materials.
The incorporation of PO had a moderate impact on ignition time but significantly influenced flammability performance. In particular, PO at 8% (w/w) reduced the peak heat release rate (PHRR) of epoxy resin by 47%, while PO at 10% and 12% (w/w) achieved a 52% reduction. The PHRR of basalt-reinforced composites decreased by 27.2% with PO addition. Further, the fire growth rate index (the ratio of PHRR to the time at which PHRR occurs, TTP) was substantially lower in PO-based materials, dropping from 11.39 KW/s·m2 to approximately 6 KW/s·m2. No major differences were observed between hybrid resins with 10% and 12% PO, but the 12% (w/w) PO–epoxy composite exhibited lower total heat release (THR) and retained a higher char residue after combustion.
SEM observations were performed on the final residue samples.
Figure 10a–c show the scanning electron micrographs of the composite materials incorporating PO at 8%, 10%, and 12% (
w/
w). A char porous layer characterizes all systems, with a different level of porosity. In particular, the 12% (
w/
w) PO–epoxy is slightly porous and has a more compact topography.
In order to better understand the flame-retardant mechanism due to the addition of PO to the epoxy and epoxy–basalt composites, digital pictures of burned fiber-reinforced composites were analyzed and results are shown in
Figure 11, revealing that neat epoxy basalt composites underwent complete combustion, leaving only basalt fibers (
Figure 11a) and that PO–epoxy composites retained visible carbon residue. In particular, as the concentration of PO increased, the carbon structure became denser and more compact, suggesting an improved protective effect against combustion. In fact, the PO 8%–epoxy surface (
Figure 11b) shows some holes and cavities, while the carbon structure of the PO 12% composite (
Figure 11d) appears more cohesive and continuous, suggesting enhanced shielding ability.
Thus, these results confirm that PO could be useful to promote epoxy carbonization and the formation of a solid char that acts as a physical barrier, preventing flame propagation and minimizing material degradation and hence providing protection in the condensed phase, slowing down the thermal degradation of the underlying material [
17,
18].
4. Conclusions
The feasibility of using PO as filler of a commercial epoxy resin to enhance its thermal degradation and flammability behavior was investigated. In particular, PO leaves were ground and reduced to granules of size less than 80 μm and then dispersed within the resin. Hybrid composites at three concentration levels (8%, 10%, 12% w/w) of PO were prepared and characterized. It was found that the plant acts in a physical way on the thermal and flammability behavior of the resin by lowering its characteristic degradation rate and delaying degradation. Further, an enhancement of flame retardancy was verified by cone calorimetry tests, which evidenced strong reductions in PHHR, FIGRA, and THR up to 52%, 50%, and 31%, respectively. Finally, to validate the efficacy of the PO, the fire behavior of neat epoxy and hybrid (PO at 12% w/w) basalt fiber composites was verified by cone calorimetry tests, which showed a reduction of 27.2% for PHRR and of 25.4% for FIGRA for the modified composites. The observed experimental flame-retardant improvement and the digital images of the burned composites suggest that PO acts in a condensed phase by promoting epoxy carbonization and the formation of a protective solid char.
In conclusion, the results demonstrated the potential of PO powder as sustainable filler to reduce the flammability of polymer resins and fiber-reinforced composites and to provide added value to unutilized waste material.
Supplementary Materials
The following supporting information can be downloaded at
https://www.mdpi.com/article/10.3390/jcs9070349/s1. Figure S1: SEM micrograph of 8% PO–epoxy composite; Figure S2: SEM micrograph of 10% PO–epoxy composite; Figure S3: FT-IR spectra of PO, neat epoxy, and hybrid 12% PO–epoxy.
Author Contributions
Conceptualization, M.R.R. and V.A.; methodology, M.R.R. and V.A.; software, V.A.; validation, M.R.R. and V.A.; formal analysis, M.R.R. and V.A.; investigation, M.R.R. and V.A.; data curation, M.R.R.; writing—original draft preparation, M.R.R. and V.A.; writing—review and editing, M.R.R. and V.A.; visualization, M.R.R. and V.A.; supervision, M.R.R. and V.A.; project administration, M.R.R. and V.A.; funding acquisition, M.R.R. and V.A. All authors have read and agreed to the published version of the manuscript.
Funding
This research received no external funding.
Data Availability Statement
Data will be made available on request.
Acknowledgments
The authors gratefully acknowledge Maria Rosaria Marcedula, Fabio Docimo, Francesco Cristiano (Nanesa), and Carmine Vitagliano for the technical support provided to this research.
Conflicts of Interest
The authors declare no conflicts of interest.
Abbreviations
The following abbreviations are used in this manuscript:
| PO | PO |
| PHRR | peak of heat release rate |
| THR | total heat released |
| TTP | time to peak |
| FIGRA | fire growth rate index |
| FO | flame out |
| TTI | time to ignition |
References
- Ncibi, M.C.; Mahjoub, B.; Seffen, M. Kinetic and equilibrium studies of methylene blue biosorption by Posidonia oceanica (L.) fibres. J. Hazard. Mater. 2007, 139, 280–285. [Google Scholar] [CrossRef] [PubMed]
- Chadlia, A. Removal of basic blue 41 from aqueous solution bt carboxymethylated PO. J. Appl. Polym. Sci. 2007, 103, 1215–1225. [Google Scholar] [CrossRef]
- Pilavtepe, M.; Celiktas, M.S.; Sargin, S.; Yesil-Celiktas, O. Transformation of PO residues to bioethanol. Ind. Crop. Prod. 2013, 51, 348–354. [Google Scholar] [CrossRef]
- Zaafouri, K.; Trabelsi, A.B.H.; Krichah, S.; Ouerghi, A.; Aydi, A.; Claumann, C.A.; Wust, Z.A.; Naoui, S.; Bergauoi, L.; Hamdi, M. Enhancement of biofuels production by means of co-pyrolisis L and frying oil wastes: Experimental study and process modeling. Bioresour. Tecnol. 2016, 207, 387–398. [Google Scholar] [CrossRef] [PubMed]
- Macia, A.; Baeza, F.J.; Saval, J.M.; Ivorra, S. Mechanical properties of boards made in biocomposites reinforced with wood and Posidonia oceanica fibers. Compos. Part B 2016, 104, 1–8. [Google Scholar] [CrossRef]
- Seggiani, M.; Cinelli, P.; Mallegni, N.; Balestri, E.; Puccini, M.; Vitolo, S.; Lardicci, C.; Lazzeri, A. New Bio-Composites Based on Polyhydroxyalkanoates and Posidonia oceanica Fibres for Applications in a Marine Environment. Materials 2017, 10, 326. [Google Scholar] [CrossRef] [PubMed]
- Braiek, M.; Briki, C.; Karkri, M.; Settar, A.; Jemni, A. Thermo-physical and mechanical performances of a new lightweight construction material made with clay and PO-Oceanica fibers. Case Stud. Constr. Mater. 2023, 19, e02599. [Google Scholar] [CrossRef]
- Ferrero, B.; Fombuena, V.; Fenollar, O.; Boronat, T.; Balart, R. Development of natural fiber-reinforced plastics (NFRP) based on biobased polyethylene and waste fibers from Posidonia oceanica seaweed. Polym. Compos. 2015, 36, 1378–1385. [Google Scholar] [CrossRef]
- Fortunati, E.; Luzi, F.; Puglia, D.; Petrucci, R.; Kenny, J.; Torre, L. Processing of PLA nanocomposites with cellulose nanocrystals extracted from PO waste: Innovative reuse of coastal plant. Ind. Xrop. Prod. 2015, 67, 439–447. [Google Scholar] [CrossRef]
- Benito-Gozalez, I.; Lopez-Rubio, A.; Marinez-Sanz, M. Potential of lignocellulosic fractions from PO to improve barrier and mechanical properties of bio-based packaging materials. Int. J. Biol. Macromol. 2018, 118, 542–551. [Google Scholar] [CrossRef] [PubMed]
- Scaffaro, R.; Lopresti, F.; Botta, L. PLA based biocomposites reinforced with PO leaves. Compos. Part B 2018, 139, 1–11. [Google Scholar] [CrossRef]
- Scaffaro, R.; Maio, A.; Lopresti, F. Physical properties of green composites based on poly-lactic acid or Mater-Bi® filled with PO leaves. Compos. Part A Appl. Sci. Manuf. 2018, 112, 315–327. [Google Scholar] [CrossRef]
- Maio, A.; Gulino, E.F.; Gammino, M.; Citarrella, M.C.; Scaffaro, R. Photochemical degradation of PLA-based green composites containing waste biomass from PO, Chamaerops humilis and Ailanthus altissima: A comparative study. Polym. Degrad. Stab. 2025, 234, 111204. [Google Scholar] [CrossRef]
- ISO 5660-1:2015; Reaction-to-Fire Tests—Heat Release, Smoke Production and Mass Loss Rate—Part 1: Heat Release Rate (Cone Calorimeter Method) and Smoke Production Rate (Dynamic Measurement). International Organization for Standardization: Geneva, Switzerland, 2015.
- Cocozza, C.; Parente, A.; Zaccone, C.; Mininni, C.; Santamaria, P.; Miano, T. Chemical, physical and spectroscopic characterization of PO (L.) Del. residues and their possible recycle. Biomass Bioenergy 2011, 35, 799–807. [Google Scholar] [CrossRef]
- Jeguirim, M.; Elmay, Y.; Limousy, L. Thermal degradation kinetics and mechanisms of PO under indert and oxidative atmospheres. Int. J. Green Energy 2016, 13, 665–671. [Google Scholar] [CrossRef]
- Huo, S.; Yang, S.; Wang, J.; Cheng, J.; Zhang, Q.; Hu, Y.; Ding, G.; Zhang, Q.; Song, P.; Wang, H. A Liquid Phosphaphenanthrene-Derived Imidazole for Improved Flame Retardancy and Smoke Suppression of Epoxy Resin. ACS Appl. Polym. Mater. 2020, 2, 3566–3575. [Google Scholar] [CrossRef]
- Wang, H.; Li, S.; Zhu, Z.; Yin, X.; Wang, L.; Weng, Y.; Wang, X. A novel DOPO-based flame retardant containing benzimidazolone structure with high charring ability towards low flammability and smoke epoxy resins. Polym. Degrad. Stab. 2021, 183, 109426. [Google Scholar] [CrossRef]
Figure 1.
SEM micrographs of the epoxy–basalt fiber composite at different scales.
Figure 1.
SEM micrographs of the epoxy–basalt fiber composite at different scales.
Figure 2.
SEM micrograph of PO powder.
Figure 2.
SEM micrograph of PO powder.
Figure 3.
SEM micrograph of 12% PO–epoxy composite.
Figure 3.
SEM micrograph of 12% PO–epoxy composite.
Figure 4.
Granule size of ground PO measured by laser diffraction analysis: (a) cumulative logarithmic distribution, (b) non-cumulative histogram distribution.
Figure 4.
Granule size of ground PO measured by laser diffraction analysis: (a) cumulative logarithmic distribution, (b) non-cumulative histogram distribution.
Figure 5.
FT-IR spectra of PO, cured epoxy and hybrid 12% PO–epoxy.
Figure 5.
FT-IR spectra of PO, cured epoxy and hybrid 12% PO–epoxy.
Figure 6.
TGA curves of PO, neat epoxy, and PO–epoxy composites (10 °C/min in air).
Figure 6.
TGA curves of PO, neat epoxy, and PO–epoxy composites (10 °C/min in air).
Figure 7.
DTG curves for PO, cured epoxy resin, and PO–epoxy composites.
Figure 7.
DTG curves for PO, cured epoxy resin, and PO–epoxy composites.
Figure 8.
Heat release rate as a function of time for the hybrid PO–epoxy composites (incident flux 50 KW/m2).
Figure 8.
Heat release rate as a function of time for the hybrid PO–epoxy composites (incident flux 50 KW/m2).
Figure 9.
Heat release rate for the epoxy–basalt composites (incident flux 50 KW/m2).
Figure 9.
Heat release rate for the epoxy–basalt composites (incident flux 50 KW/m2).
Figure 10.
SEM micrograph of PO–epoxy composite after burning: (a) PO 8%–epoxy, (b) PO 10%–epoxy, (c) PO 12%–epoxy.
Figure 10.
SEM micrograph of PO–epoxy composite after burning: (a) PO 8%–epoxy, (b) PO 10%–epoxy, (c) PO 12%–epoxy.
Figure 11.
Digital images of PO–epoxy composites after burning: (a) neat epoxy basalt composite, (b) PO 8%–epoxy, (c) PO 10%–epoxy, (d) PO 12%–epoxy.
Figure 11.
Digital images of PO–epoxy composites after burning: (a) neat epoxy basalt composite, (b) PO 8%–epoxy, (c) PO 10%–epoxy, (d) PO 12%–epoxy.
Table 1.
Peaks of derivatives of thermal weight loss of PO, cured epoxy resin, and PO–epoxy composites (10 °C/min in air).
Table 1.
Peaks of derivatives of thermal weight loss of PO, cured epoxy resin, and PO–epoxy composites (10 °C/min in air).
| Sample | Deriv. Weight,
%/°C | T, °C | Deriv. Weight,
%/°C | T, °C | Deriv. Weight,
%/°C | T, °C |
|---|
| PO neat | 0.13 | 62 | 0.43 | 289.4 | 1.11 | 457 |
| Epoxy neat | 1.60 | 339 | - | - | 0.48 | 539 |
| PO 8%–epoxy | 1.30 | 336 | 1.37 | 356.3 | 0.49 | 504 |
| PO 10%–epoxy | 1.11 | 335 | 1.22 | 364.5 | 0.52 | 502 |
| PO 12%–epoxy | 1.09 | 331 | 1.16 | 350.6 | 0.59 | 502 |
Table 2.
Percentage weight loss.
Table 2.
Percentage weight loss.
| Sample | Weight Loss, %
T Range: [250–400 °C] | Weight Loss, %
T Range: [450–600 °C] |
|---|
| PO neat | 33.9 | 14.3 |
| Epoxy neat | 61.8 | 38.5 |
| PO–8% epoxy | 56.9 | 36.0 |
| PO–10% epoxy | 58 | 36.5 |
| PO–12% epoxy | 59.5 | 32.9 |
Table 3.
Key cone calorimetry experimental data. (incident flux 50 KW/m2).
Table 3.
Key cone calorimetry experimental data. (incident flux 50 KW/m2).
| Material | TTI, s | FO, s | PHRR, KW/m2 | TTP, s | THR, MJ/m2 | FIGRA, KW/s.m2 | Residue, % |
|---|
| Epoxy neat | 44 | 416 | 1765 | 155 | 167.0 | 11.4 | 3.70 |
| PO 8%–epoxy | 37 | 397 | 930 | 155 | 132.2 | 6.0 | 8.22 |
| PO 10%–epoxy | 37 | 394 | 830 | 145 | 133.6 | 5.7 | 7.93 |
| PO 12%–epoxy | 37 | 372 | 865 | 140 | 129.5 | 6.2 | 10.20 |
| Basalt composite neat | 26 | 407 | 562 | 85 | 64.5 | 8.7 | 54.3 |
| PO 12%–epoxy basalt composite | 37 | 440 | 409 | 60 | 63 | 6.5 | 61.9 |
| Disclaimer/Publisher’s Note: The statements, opinions and data contained in all publications are solely those of the individual author(s) and contributor(s) and not of MDPI and/or the editor(s). MDPI and/or the editor(s) disclaim responsibility for any injury to people or property resulting from any ideas, methods, instructions or products referred to in the content. |
© 2025 by the authors. Licensee MDPI, Basel, Switzerland. This article is an open access article distributed under the terms and conditions of the Creative Commons Attribution (CC BY) license (https://creativecommons.org/licenses/by/4.0/).


