Article

Predicting and Unraveling Flexural Behavior in Fiber-Reinforced UHPC Through Based Machine Learning Models

by
Jesus D. Escalante-Tovar
1,
Joaquin Abellán-García
1,* and
Jaime Fernández-Gómez
2
1
Department of Civil and Environmental Engineering, Universidad Del Norte, km 5 Via Puerto Colombia, Barranquilla 081007, Colombia
2
Departamento de Ingeniería Civil: Construcción, Escuela Técnica Superior de Ingenieros de Caminos, Canales y Puertos (ETSICCP), Universidad Politécnica de Madrid (UPM), 28008 Madrid, Spain
*
Author to whom correspondence should be addressed.
J. Compos. Sci. 2025, 9(7), 333; https://doi.org/10.3390/jcs9070333
Submission received: 10 May 2025 / Revised: 21 June 2025 / Accepted: 24 June 2025 / Published: 27 June 2025

Abstract

Predicting the flexural behavior of fiber-reinforced ultra-high-performance concrete (UHPC) remains a significant challenge due to the complex interactions among numerous mix design parameters. This study presents a machine learning-based framework aimed at accurately estimating the modulus of rupture (MOR) of UHPC. A comprehensive dataset comprising 566 distinct mixtures, characterized by 41 compositional and fiber-related variables, was compiled. Seven regression models were trained and evaluated, with Random Forest, Extremely Randomized Trees, and XGBoost yielding coefficients of determination (R2) exceeding 0.84 on the test set. Feature importance was quantified using Shapley values, while partial dependence plots (PDPs) were employed to visualize both individual parameter effects and key interactions, notably between fiber factor, water-to-binder ratio, maximum aggregate size, and matrix compressive strength. To validate the predictive performance of the machine learning models, an independent experimental campaign was carried out comprising 26 UHPC mixtures designed with varying binder compositions—including supplementary cementitious materials such as fly ash, ground recycled glass, and calcium carbonate—and reinforced with mono-fiber (straight steel, hooked steel, and PVA) and hybrid-fiber systems. The best-performing models were integrated into a hybrid neural network, which achieved a validation accuracy of R2 = 0.951 against this diverse experimental dataset, demonstrating robust generalizability across both material and reinforcement variations. The proposed framework offers a robust predictive tool to support the design of more sustainable UHPC formulations incorporating supplementary cementitious materials without compromising flexural performance.

1. Introduction

1.1. Background

UHPC is a complex material that has received a lot of interest within the structural engineering community, particularly due to its enhanced mechanical properties [1,2]. Recent reviews reiterate that, although UHPC routinely attains compressive strengths above 150 MPa and outstanding durability, its broad implementation remains constrained by the high price of specialized ingredients, limited design guidance and the complexity of mixing/curing protocols [3]. UHPC is commonly utilized in multiple examples of high-performance structures, including high-rise buildings, long-span bridges, and the upgrading of current infrastructure [3,4]. Its exceptional compressive strength, durability, and resistance to extreme environmental conditions make UHPC a suitable material for applications where both performance and long life cycle are critical [5,6]. As UHPC is used in more and more demanding structural conditions, it is thus critical to know and predict how it will behave under different loading scenarios, particularly based on those properties that are key features for UHPC’s applications, such as its flexural performance.
One of the major advancements in UHPC has been the use of fibers to improve the mechanical properties of UHPC, such as flexural strength and ductility. The fibers included (such as steel and polymeric, with the proper geometric and mechanical properties) significantly increased the material’s flexural strength and ductility, making it appropriate for use in circumstances requiring significant bending resistance to cracking and deformation [7,8]. Fibers, particularly steel fibers, have been shown to improve the flexural performance of UHPC beams, thereby enhancing the material’s capacity to withstand repeated stresses [9]. In addition, fibers play a crucial role in delaying crack propagation, which ultimately contributes to enhanced flexural strength and longer-lasting durability [9]. This extraordinary synergy between the fibers and matrix creates a material that is stronger and superior at resisting dynamic loading, compared to conventional concrete.
It is important to note that UHPC’s flexural performance is emerging as a critical attribute driving its adoption across a range of applications. In structural systems, its capacity to sustain high bending stresses enables the design of precast bridge deck panels that offer enhanced durability and diminished maintenance requirements [10,11,12], as well as thin-shell structures capable of spanning significant distances without sacrificing structural stability [13]. Beyond structural use, UHPC’s flexural performance is also a key feature for this fiber-reinforced composite deployment in precast façade components, leverages, and urban furniture [14,15]. Moreover, another UHPC application that necessitates a proper UHPC’s flexural performance is the road pavement rehabilitation by means of ultra-thin overlays, commonly in the range of just 40 to 50 mm [10,16,17].
However, modeling the flexural behavior of fiber-reinforced UHPC is still a complex problem to solve. The complexity arises from the interactions of the material properties, failure modes, and modeling approach in defining the behavior of UHPC under flexural loading. Furthermore, the interaction between different fiber types and the different UHPC-making materials, such as mineral admixtures, polycarboxylate-based superplasticizers, and others, further complicates predictions, especially as combinations of fibers in varying quantities yield different mechanical properties [18]. These complexities suggest that more robust tools are required to predict the flexural behavior of UHPC more reliably and to make reasonable decisions about the use of UHPC within structures. In this case, ML (Machine Learning) offers a competitive means to predict the flexural behavior of fiber-reinforced UHPC by recognizing more complex patterns and relationships within a dataset. Many traditional analytical models observed in constructions, which theorize flexural behavior through experimental observations, are unable to describe complex interactions between fibers and the matrix, especially with nonlinear, high-dimensional data. Consequently, this study attempts to develop and apply ML models to predict flexural strength more objectively and reliably while leveraging their nonlinear modeling capabilities and insights on the impacts of various material components on flexural behavior.
Given that flexural performance is a defining property of UHPC in both structural and architectural applications, developing reliable models to predict this behavior is essential for effective material utilization and structural design. Due to the increasing use of UHPC in structural applications, accurate prediction of its behavior becomes necessary for the purpose of optimized mix designs and material selection. In this paper, a complete solution through machine learning models, which have been trained on a database of 566 UHPC mixtures collected from scientific literature, with 41 input variables and an output variable, i.e., the UHPC modulus of rupture (MOR), is provided. First, a series of individual ML approaches are adjusted and evaluated. Then, the better-performing individual models are used to create SHAP (SHapley Additive exPlanations) to visualize the effects of essential mixture parameters on MOR response and provide an understanding of the effects of material property variations on performance. Further, the ensemble learning approaches are employed in this research, by means of better-performing individual models, to increase predictive accuracy when generalized, and a model that is potentially more effective at predicting flexural behavior than the individual ML approaches. Moreover, an experimental campaign is also developed with the intention of serving as an experimental evaluation of the ensembled model as well as the individual ones. By utilizing ML techniques, while learning about material behavior, this work serves as the measurement that pushes toward the future use of UHPC, or further future use of UHPC, in design projects that are demanding, and provides the safety that UHPC can perform under its extreme material properties maximally.

1.2. Bibliographical Overview

On the one hand, a comprehensive multiscale review by Du et al. [19] highlights two complementary research needs: (i) lowering the environmental footprint of UHPC through high-volume supplementary cementitious materials, reduced binder contents, and energy-efficient curing; and (ii) advancing multiscale-physics reinforcement strategies (including fiber hybrid systems) to fine-tune the response of this material.
On the other hand, while considerable advancements have been made in leveraging ML techniques to predict and evaluate the UHPC’s mechanical characteristics, most of the existing literature remains centered around compressive strength [20,21,22]. In contrast, flexural behavior—despite its vital role in structural design and long-term durability—has not been explored as extensively. Moreover, the limited number of studies that do address this aspect often suffer from constraints related to material variation, fiber combinations, dataset size, and the complexity of the employed ML frameworks.
For example, Ergen et al. [23] examined the flexural properties of UHPC reinforced with conventional steel fibers through ML methodologies. However, their investigation is limited by a narrow selection of constituent materials and fiber types, lacking consideration for interactions between multiple fiber categories or variable dosages. Additionally, the relatively modest dataset (just 82 observations) used in their study poses challenges to the robustness and generalizability of their predictive models.
Similarly, Soni and Nateriya [24] performed experimental work on UHPC beams to analyze flexural behavior. While their contribution is noteworthy, it is confined to traditional steel fibers, without addressing hybrid fiber systems or potential synergies arising from multi-fiber configurations. On the other hand, their ML analysis also relies solely on Support Vector Machines (SVM), a method that may not capture complex, nonlinear patterns as effectively as more contemporary ensemble-based models [25].
In another notable effort, Qian et al. [26] utilized Artificial Neural Networks (ANN) to estimate the flexural strength of fiber-reinforced UHPC. Although the incorporation of ML in this context is commendable, the study is restricted by its use of a single fiber type, without considering the hybrid reinforcement system. Additionally, while the sample size of 317 observations is acceptable, a larger dataset could further enhance the model’s robustness and generalizability. Furthermore, it lacks an in-depth evaluation of supplementary cementitious materials (SCMs) such as silica fume (SF), fly ash (FA), and ground granulated blast-furnace slag (GGBFS), all of which are known to significantly affect flexural performance.
Lastly, Das and Abul Kashem [27] adopted hybrid ensemble models, including XGBoost and LightGBM, to predict both compressive and flexural strengths. While their work demonstrates progress in applying advanced ML algorithms, it does not incorporate fiber type diversity or explore the integration of various SCMs. Another important aspect is that the study primarily emphasizes predictive accuracy, without delving into the influence of different mix design parameters on flexural behavior.
To address these gaps, this study significantly expands the scope and depth of current knowledge by integrating a broader range of mineral admixtures and employing advanced machine learning methodologies. A comprehensive dataset comprising 566 UHPC mixtures collected from scientific literature was assembled, with 80% allocated for models training and the remaining 20% reserved for initial models’ validation. To further strengthen the evaluation, an independent experimental campaign was conducted, encompassing 26 UHPC series developed with up to three distinct matrix formulations incorporating diverse mineral admixtures, including mixes both with and without fiber reinforcement. This experimental program included three types of fibers and explored hybrid fiber reinforcement systems by combining two different fiber types within a single mix. Models assessed included linear regression, K-Nearest Neighbors, Support Vector Regressor, XGBoost, Random Forest, Extremely Random Trees, and Artificial Neural Networks. A hybrid neural network, constructed by integrating the best-performing individual models (R2 > 0.80 on the testing subset), demonstrated enhanced predictive performance and robustness. Collectively, these advancements not only refine the predictive capabilities for flexural strength in UHPC but also provide critical insights for optimizing mixture design in high-performance, fiber-reinforced concrete applications.

1.3. Scope and Significance of the Research

Recent machine-learning contributions that do report UHPC flexural data remain limited in scope. Ergen and Katlav [23] modeled only 82 mixes with a single steel-fiber morphology; Qian et al. [26] used 317 observations but omitted hybrid fibers and SCM interactions; and Das & Kashem [27] focused mainly on predictive accuracy without external validation. No peer-reviewed study to date has combined (i) a parametric dataset exceeding 500 UHPC mixes, (ii) multiple fiber classes in mono- and hybrid configurations, (iii) a broad suite of mineral admixtures, and (iv) independent laboratory validation.
Accordingly, the present study closes these gaps by assembling 566 mixes with 41 variables, training interpretable ensemble models, and verifying them against 26 new UHPC formulations covering three distinct matrix chemistries and hybrid fiber systems. Therefore, this research proposes a comprehensive predictive framework to assess the UHPC’s MOR under flexural loadings by leveraging advanced ML techniques and ensemble learning strategies. Through a detailed examination of structural, matrix-related, and reinforcement parameters, the study identifies the key factors—such as fiber dosage, fiber type, cement content, silica fume proportion, and water-to-binder ratio—that critically influence flexural strength. By elucidating these relationships, the developed models support data-informed material selection and formulation strategies, enabling the design of optimized, high-performance UHPC mixtures for structural elements such as bridge girders, high-strength pavements, and seismic-resistant structures.
Importantly, the study integrates SHAP-based interpretability techniques to provide actionable insights, enhancing the transparency and trustworthiness of ML-driven predictions. This allows engineers and researchers not only to predict performance accurately but also to understand the underlying drivers behind flexural behavior. In doing so, the research promotes a shift toward intelligent, performance-oriented, and sustainable material design in civil engineering practice, ultimately advancing the broader adoption of UHPC in demanding structural applications.
Figure 1 puts forward a flow chart of the study presented herein.

2. Materials and Methods

2.1. Data Compilation

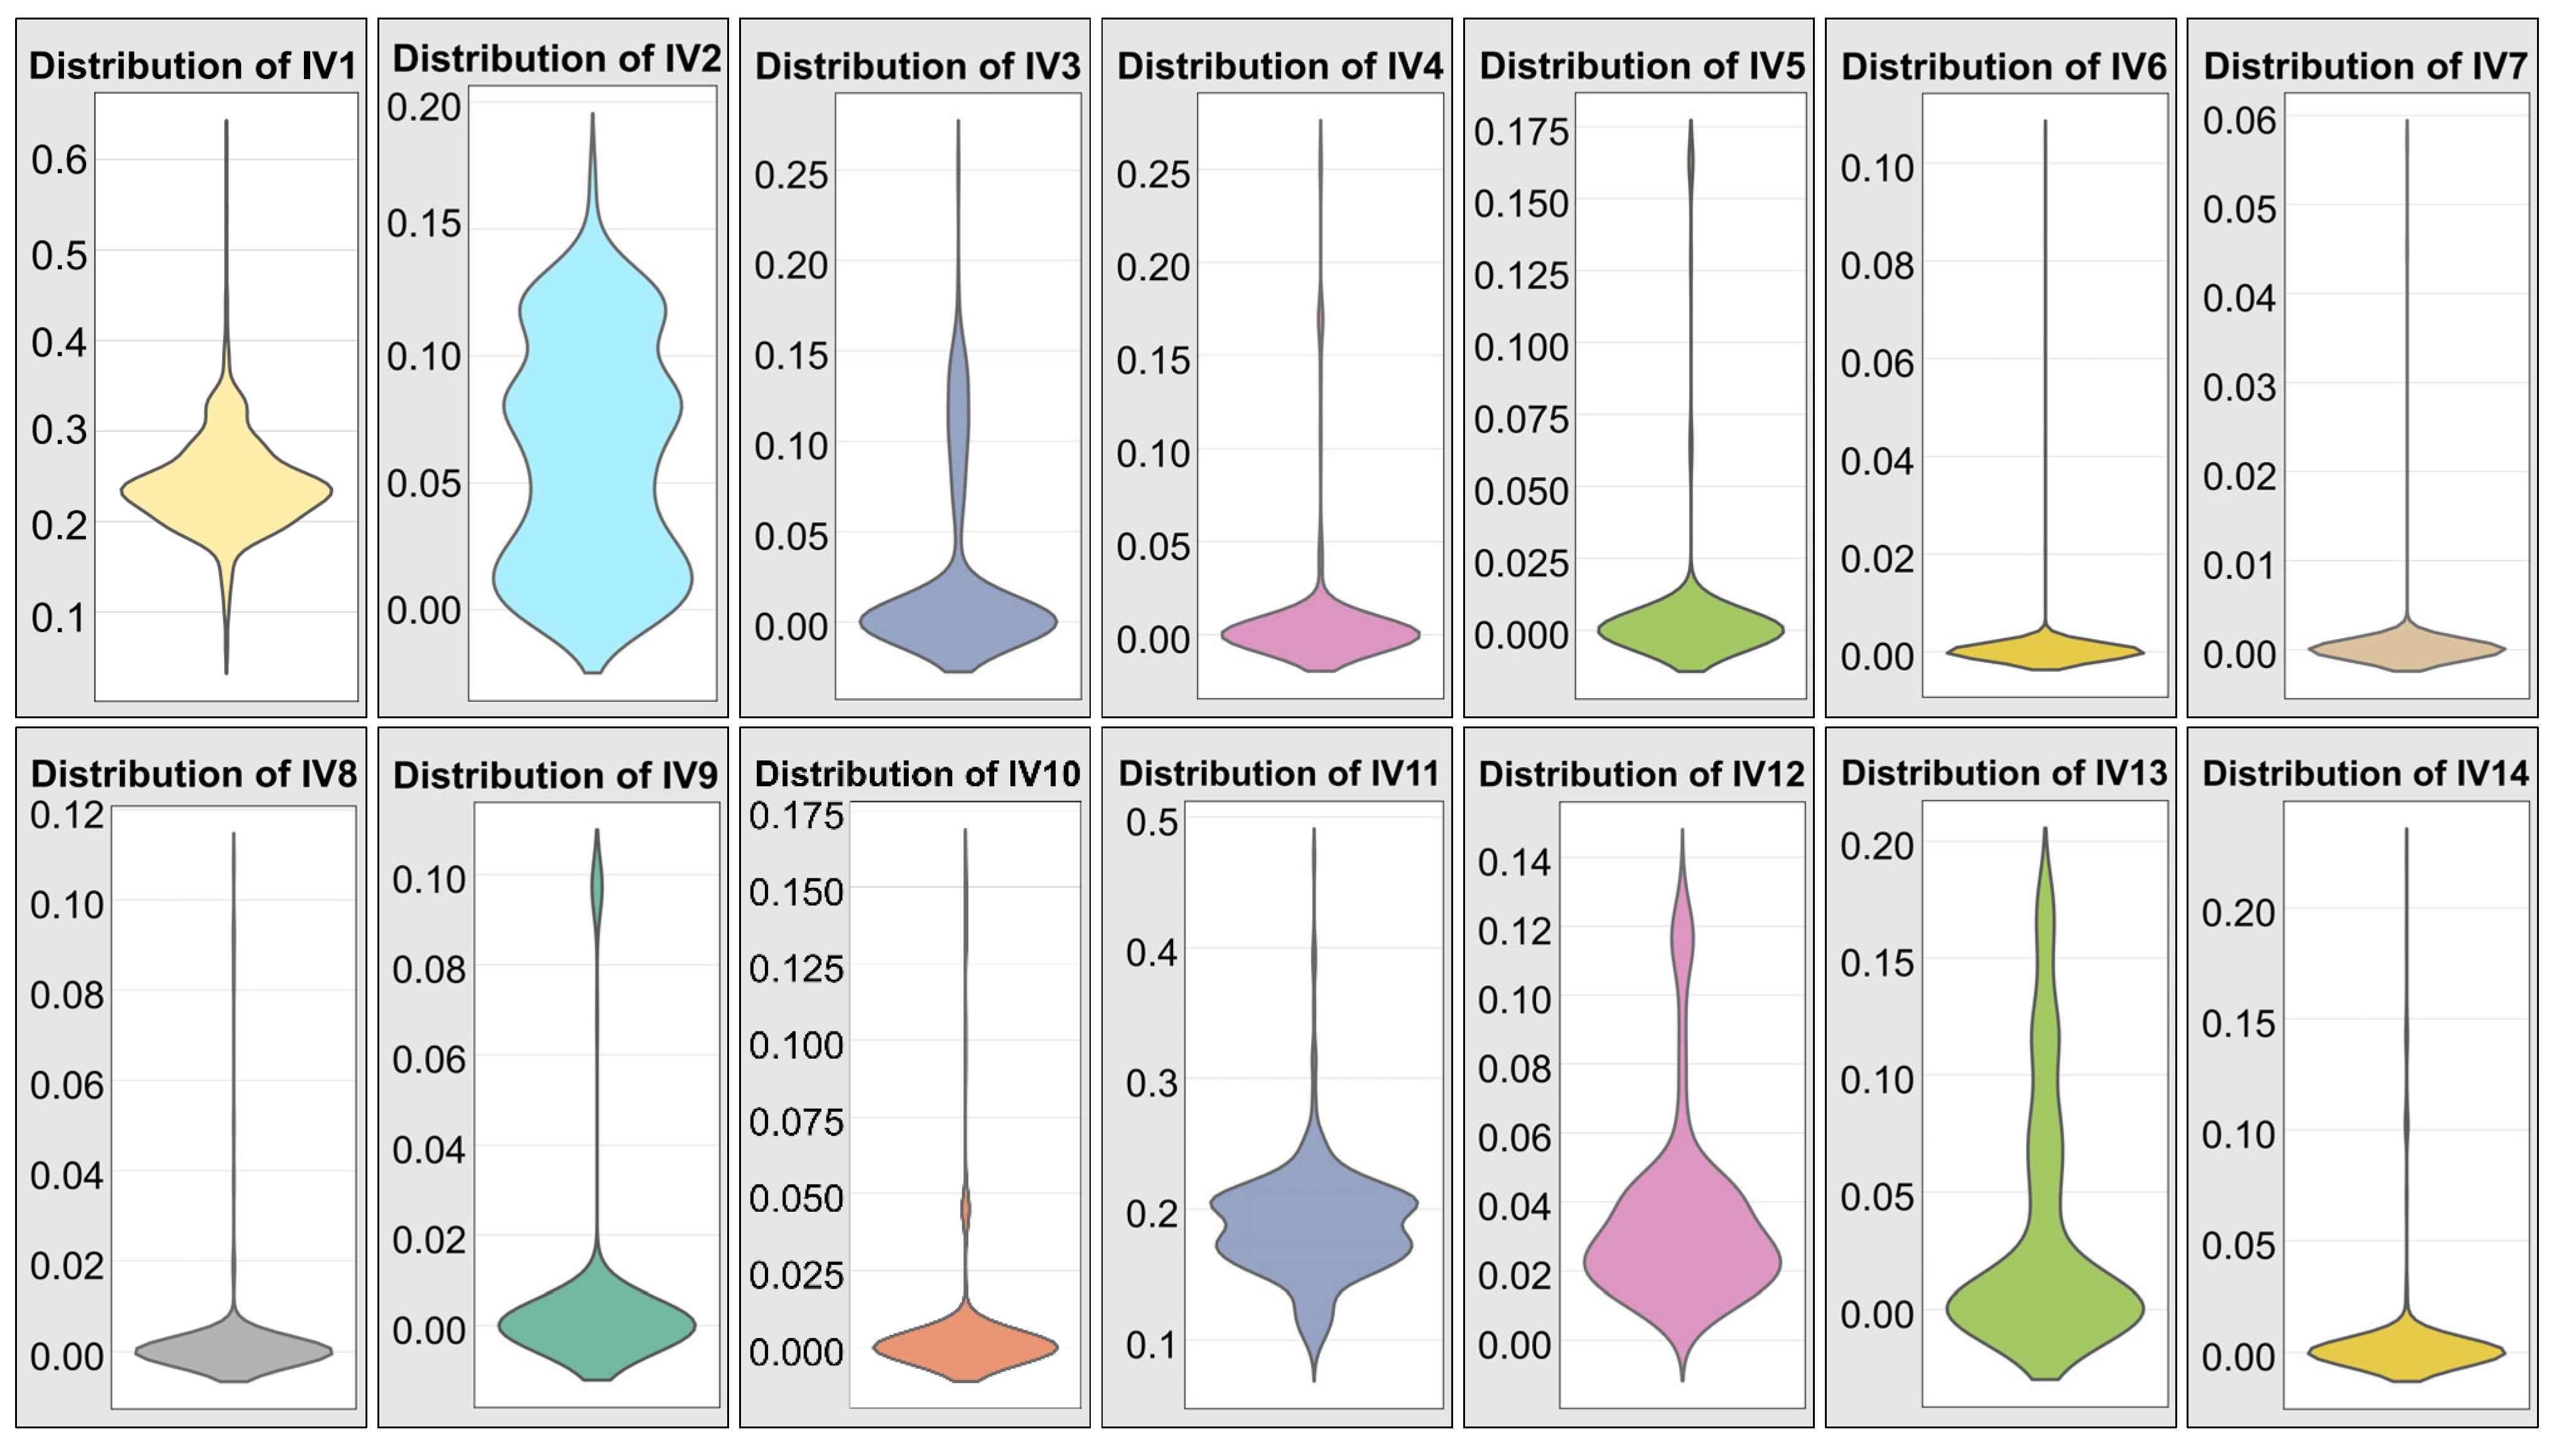
2.1.1. Literature-Based Dataset for Models Development

The literature-based dataset employed in this investigation was constructed from a wide-ranging corpus of peer-reviewed articles and proceedings from international conferences centered on UHPC research. In total, 566 experimental data points were extracted from 36 scholarly sources [7,8,28,29,30,31,32,33,34,35,36,37,38,39,40,41,42,43,44,45,46,47,48,49,50,51,52,53,54,55,56,57,58,59,60,61], each reporting both UHPC mix compositions and corresponding MOR values, the latter serving as the principal response metric in this study. Studies that did not conform to ASTM C1609/C1609M-19 [62] or equivalent flexural test protocols were not taken into account in the database. This standard specifies a span-to-depth ratio of approximately 4, which ensures the development of a constant-moment region with negligible shear influence.
To capture the complex, multi-scale phenomena governing flexural performance, 41 independent variables (IVs) were identified and harmonized across the dataset. These span from binder composition and admixture content to aggregate features, proportioning parameters, and descriptors of fiber geometry and mechanical properties. All raw values extracted from the 36 source studies were first converted to a common unit system (i.e., constituent contents in m3 m−3; fiber mass in kg m−3; mechanical strengths in MPa). The explanatory variables used in modeling were classified into six main categories:
  • Group 1: IV1–IV14 (UHPC paste-making constituents):
  • These variables represent the volumetric content (m3/m3) of different binder components in the UHPC mix:
    IV1: Cement.
    IV2: Silica Fume (SF).
    IV3: Fly Ash (FA).
    IV4: Ground Granulated Blast-Furnace Slag (GGBFS).
    IV5: Ground Recycled Glass.
    IV6: Rice Husk Ash (RHA).
    IV7: Fluid Catalytic Cracking Catalyst Residue (FC3R) from petroleum refining.
    IV8: Metakaolin.
    IV9: Calcium Carbonate.
    IV10: Other SCMs not listed in IV2–IV8 (m3/m3).
    IV11: Water content.
    IV12: Superplasticizer dosage.
    IV13: Quartz powder.
    IV14: Other non-reactive additions (excluding IV9 and IV13).
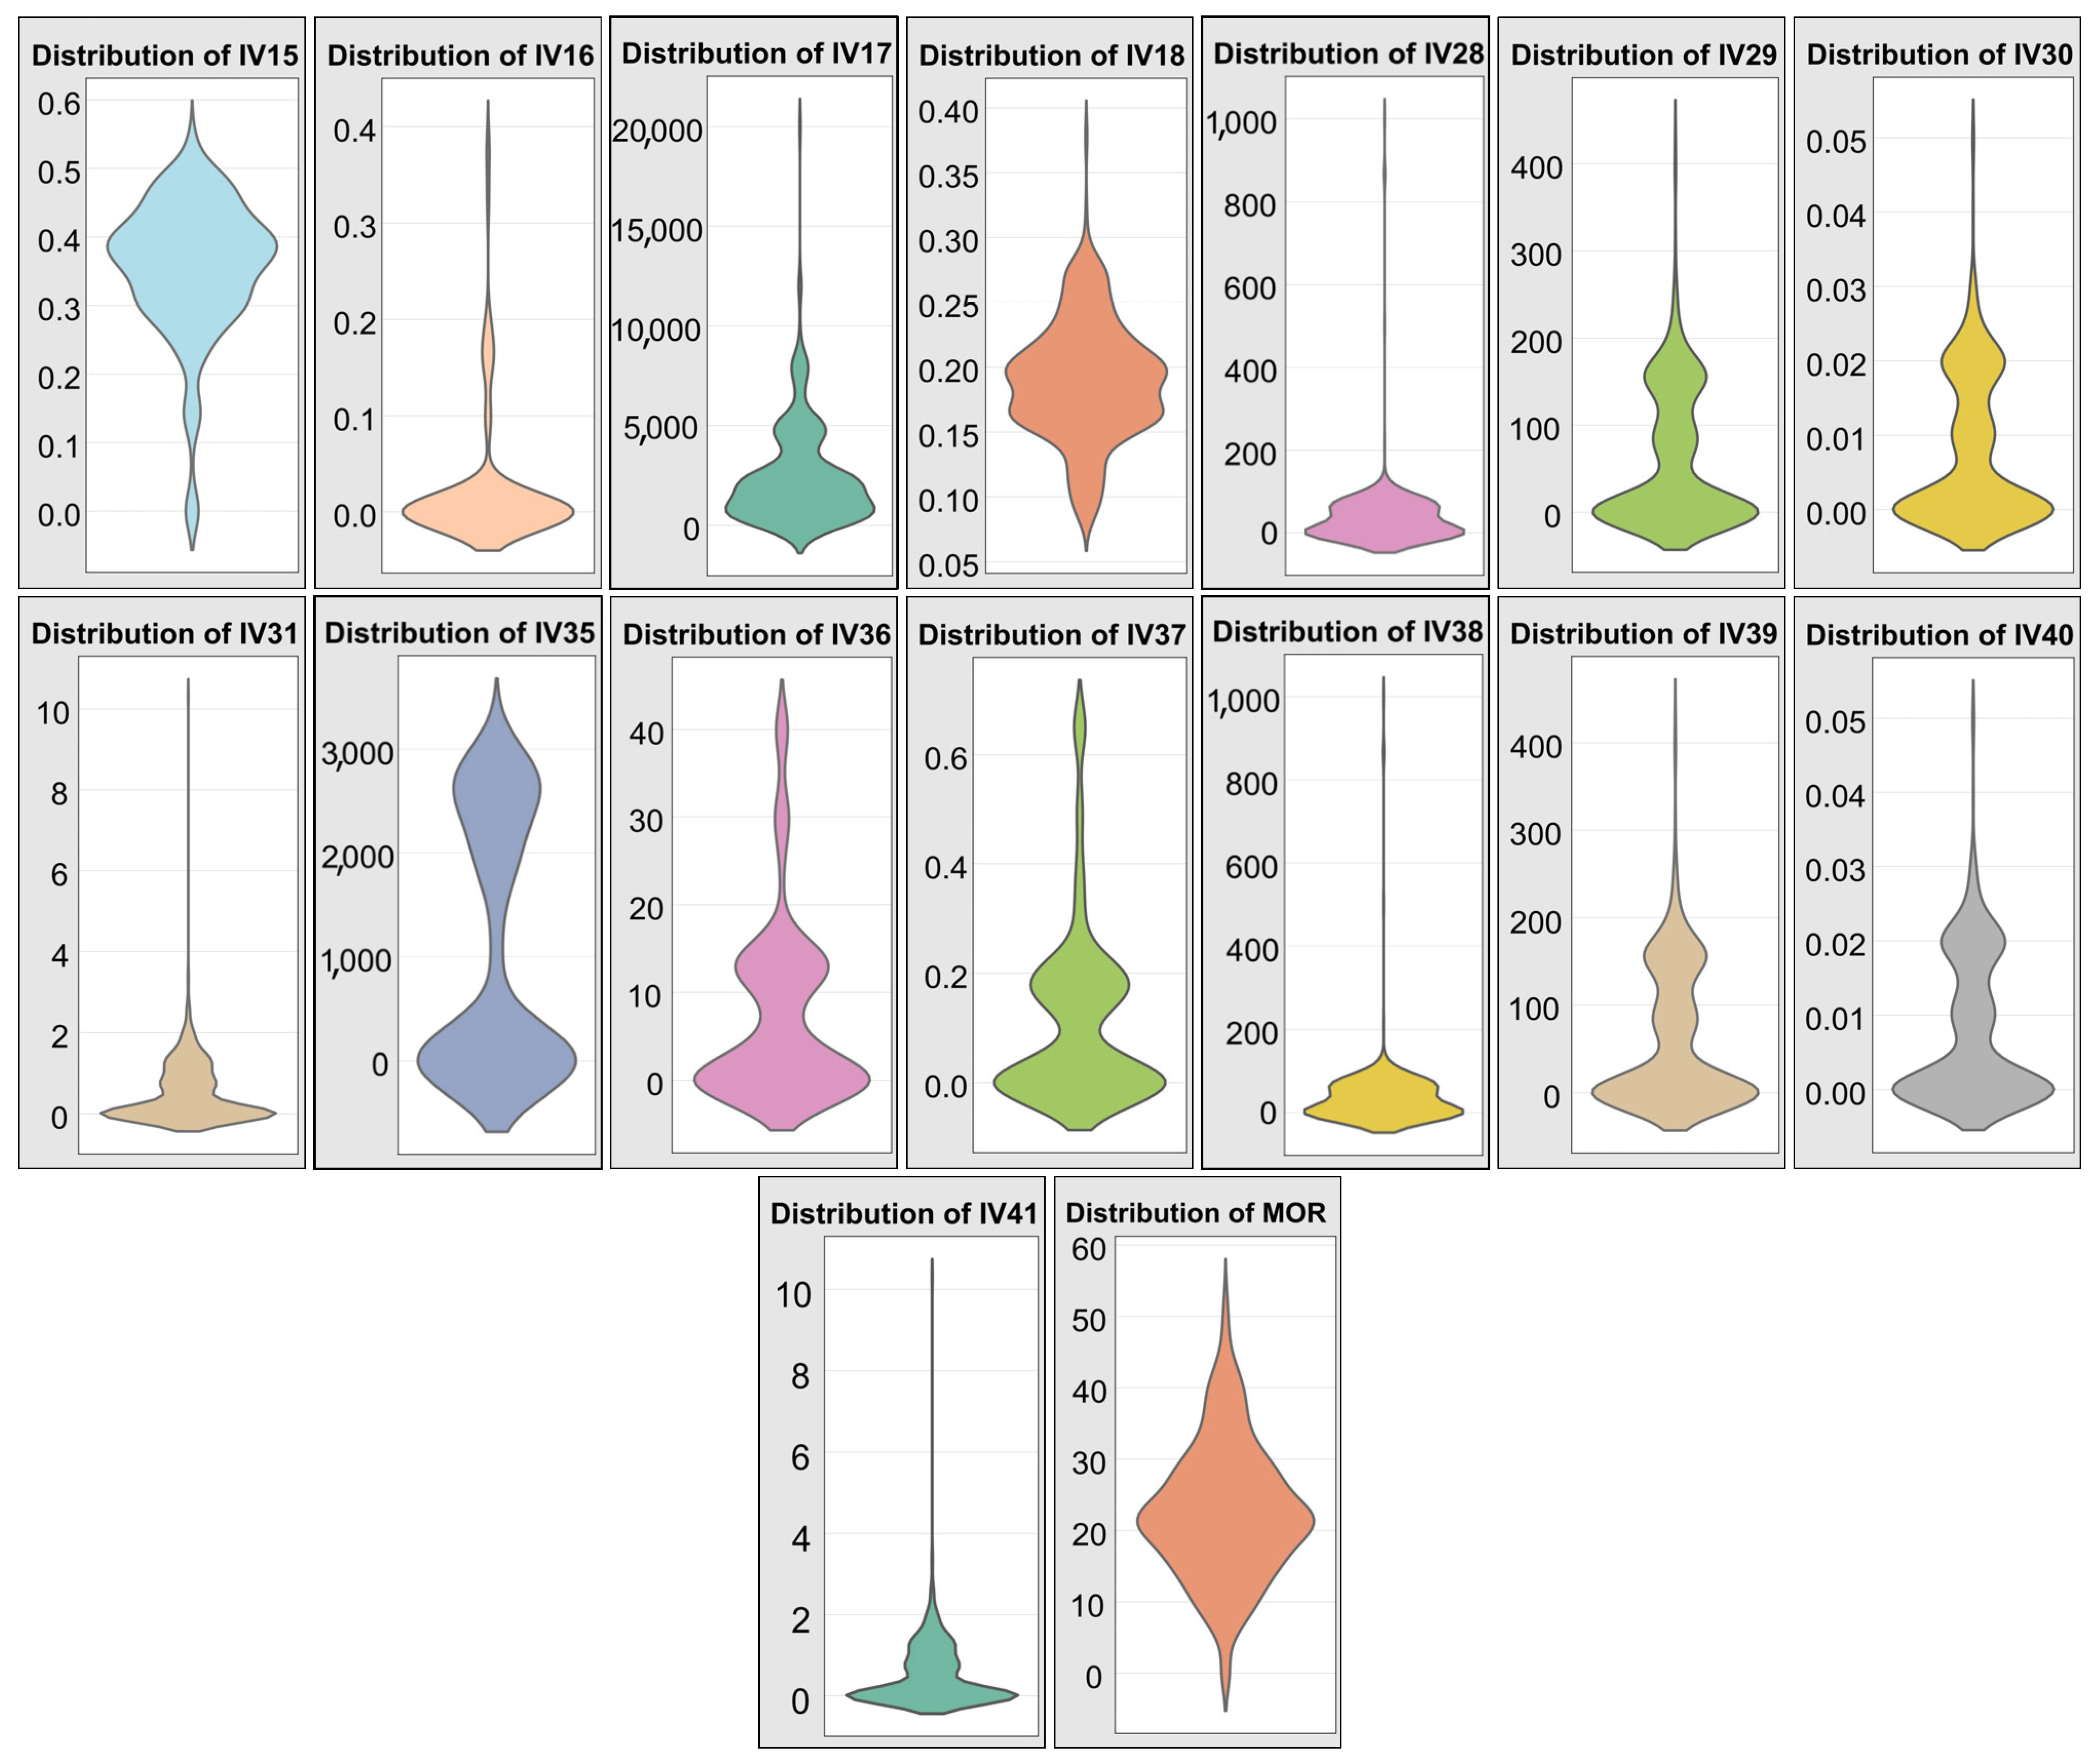
  • Group 2: IV15–IV17 (A—ggregates):
    IV15: Fine aggregate (sand) content (m3/m3).
    IV16: Coarse aggregate content (m3/m3).
    IV17: Maximum aggregate size (μm).
  • Group 3: IV18–IV19 (Mix Proportioning and Mechanical Properties):
    IV18: Water-to-binder ratio.
    IV19: Compressive strength of UHPC (MPa).
  • Group 4: IV20–IV21 (Global Fiber Properties):
    IV20: Total fiber volume fraction (m3/m3).
    IV21: Global fiber factor for the UHPC mix.
  • Group 5: IV22–IV31 (Fiber Type 1 Characteristics):
    IV22: Binary variable indicating if Fiber 1 is straight steel (1 = yes, 0 = no).
    IV23: Hooked-end steel fiber (1 = yes, 0 = no).
    IV24: Polymeric fiber (1 = yes, 0 = no).
    IV25: Tensile strength of Fiber 1 (MPa).
    IV26: Length of Fiber 1 (mm).
    IV27: Equivalent diameter of Fiber 1 (mm).
    IV28: Aspect ratio (length-to-diameter) of Fiber 1.
    IV29: Mass of Fiber 1 in the mix (kg/m3).
    IV30: Volume fraction of Fiber 1 (m3/m3).
    IV31: Fiber factor for Fiber 1.
  • Group 6: IV32–IV41 (Fiber Type 2 Characteristics):
These variables replicate the descriptors used for Fiber 1, applied to a second type of fiber (when present):
IV32: Binary variable indicating if Fiber 2 is straight steel (1 = yes, 0 = no).
IV33: Hooked-end steel fiber (1 = yes, 0 = no).
IV34: Polymeric fiber (1 = yes, 0 = no).
IV35: Tensile strength of Fiber 2 (MPa).
IV36: Length of Fiber 2 (mm).
IV37: Equivalent diameter of Fiber 2 (mm).
IV38: Aspect ratio of Fiber 2.
IV39: Mass of Fiber 2 in the mix (kg/m3).
IV40: Volume fraction of Fiber 2 (m3/m3).
IV41: Fiber factor for Fiber 2.
This diverse and multiscale set of variables enables a detailed representation of UHPC composition and fiber reinforcement strategies, facilitating accurate modeling of its flexural behavior. The inclusion of both cementitious matrix- and fiber-level descriptors ensures that the ML models capture not only the influence of bulk constituents but also the synergistic and hybrid effects of multi-type fiber reinforcement.
Initial statistical insights are provided in Figure 2, which features violin plots for all input variables, allowing visualization of their density distributions. Moreover, Figure 3 presents the distribution of the response variable (MOR).
Figure 3 illustrates the distribution of the MOR values across the compiled dataset. The histogram reveals a near-Gaussian distribution centered around a median value of 22.63, as indicated by the vertical dashed line. This central tendency, reinforced by the kernel density estimate (KDE) curve, highlights the concentration of data points near the median, with relatively few extreme values. Understanding this distribution is critical for training robust machine learning models, as it informs assumptions about data variability, the presence of outliers, and potential skewness, all of which influence algorithm selection and feature engineering.
Before training the models, the data from the database were preprocessed. Specifically, the numeric predictors were centered and scaled (µ = 0, σ = 1) to eliminate scale-induced bias while preserving the underlying physical relationships.
Figure 4 presents the Pearson correlation matrix, offering a detailed view of linear relationships among the 41 input variables and the MOR. Several features exhibit noteworthy correlations with flexural strength. Notably, cement content (IV1), superplasticizer dosage (IV12), and fiber factor (IV21) show positive associations with MOR, suggesting their reinforcing roles in enhancing flexural capacity. Additionally, compressive strength (IV19) and total fiber volume (IV20) display moderate correlations, aligning with established knowledge of their mechanical contributions.
Conversely, the water-to-binder ratio (IV18) shows a marked negative correlation with MOR, emphasizing its detrimental impact on matrix integrity and flexural response. Similarly, the maximum aggregate size (IV17) exhibits a negative relationship, possibly reflecting poorer fiber dispersion and reduced homogeneity in larger-grained mixes.
It is also important to note that the matrix put forward in Figure 3 serves as a diagnostic foundation for subsequent model development, enabling informed feature selection and deeper interpretability in predicting UHPC’s flexural performance through machine learning frameworks.
Finally, it is also relevant to say that for model development, 80% of the compiled dataset was randomly allocated to the training data subset, while the remaining 20% was reserved for testing purposes to evaluate model performance after adjusting with the training data.

2.1.2. Experimental Dataset for External Model Validation

To further validate the predictive performance of the machine learning models, an independent experimental dataset was generated, comprising 26 distinct UHPC mixtures. Flexural tests were conducted on 70 × 70 × 350 mm prismatic specimens (span = 280 mm) under third-point loading conditions, following ASTM C1609/C1609M-19 [62] guidelines. The standard adopts a span-to-depth ratio of 4, which promotes a central region dominated by bending, with minimal shear contribution.
For each mixture, three prismatic specimens were cast and tested under flexural loading using a third-point loading configuration, as presented in Figure 5. For each UHPC mixture, three identical specimens were tested under the same conditions, and the modulus of rupture was reported as the average of these three values, in accordance with ASTM C1609/C1609M-19.
The mixture designs were developed following the modified Andreasen and Andersen particle packing model, aiming to maximize packing density and improve homogeneity. Cement and silica fume were used as the primary cementitious components across all formulations, with selected mixes incorporating additional mineral admixtures—including fly ash, ground recycled glass, and calcium carbonate—to evaluate their effects on flexural behavior.
Three types of fibers were employed as reinforcement strategies: straight high-strength steel fibers, hooked-end steel fibers, and polyvinyl alcohol (PVA) polymeric fibers. Both mono-fiber and hybrid fiber-reinforced systems were investigated, the latter combining two distinct fiber types to explore potential synergistic enhancements in post-cracking performance.
UHPC mixtures were prepared using a 20 L food-type mixer. The mixing process was executed in sequential stages to ensure uniform material dispersion. First, water and superplasticizer were blended at low speed for one minute. All powders—including cement, silica fume, and additional mineral admixtures—were then gradually incorporated and mixed at low speed for another minute. The mixing speed was increased progressively to medium and then high, continuing for approximately 3 to 5 min until a homogeneous and flowable paste was achieved. Sand was then added and mixed for one minute at low speed, followed by two minutes at high speed. Fibers were incorporated at low speed (speed 1) to avoid clumping or fiber balling. After fiber addition, the speed was raised to medium (speed 3) for two minutes and finally to maximum speed for three minutes. Upon completion of the mixing process, three prismatic specimens of the aforementioned dimensions (70 × 70 × 350 mm) were cast for each series and tested in accordance with ASTM C1609/C1609M-19 under third-point loading.
Detailed mechanical and geometric properties of the fibers are presented in Table 1. Table 2 summarizes the complete composition and material dosages of the three UHPC matrices used for validation, specifying the contents of cement (IV1), silica fume (IV2), fly ash (IV3), glass powder (IV5), calcium carbonate powder (IV9), water (IV11), superplasticizer (IV12), and sand (IV15), as well as the maximum aggregate size (IV17), water-to-binder ratio (IV18), and compressive strength (IV19). Measurement units are consistent with those outlined in Section 2.1.1. Variables from groups 1 and 2 not explicitly listed in Table 2 were assigned a value of zero across all matrices.
Finally, Table 3 presents the UHPC series reinforced with fibers and used for the experimental validation of the machine learning models. The series notation is straightforward: the first character denotes the UHPC matrix type, the second group specifies the primary fiber type and its volume fraction, and, when applicable, the third group identifies the secondary fiber in hybrid systems along with its corresponding dosage. For instance, A0 indicates matrix A without fiber reinforcement (plain UHPC); B-H2 refers to matrix B reinforced with 2% by volume of hooked-end steel fibers; and A-OL1-PVA1 represents matrix A reinforced with a hybrid combination of 1% straight steel fibers (OL) and 1% PVA fibers.
In total, the experimental program comprised 26 series, including three plain UHPC series, eighteen mono-fiber reinforced series, and five hybrid-fiber reinforced series.
In light of the information presented in Table 2 and Table 3, Table 4, Table 5 and Table 6 present information on the IVs of Groups 5, 5, and 6, respectively. The IV values for these groups are zero for dosages A0, B0, and C0, as they do not have fiber reinforcement. Similarly, information on Group 6 is only presented for the hybrid fiber blend series.
It is important to note that, for prediction purposes, for each experimental series, the value of any IV not described in Table 2 and Table 4, Table 5 and Table 6 will be equal to zero.

2.2. Machine Learning

2.2.1. Linear Regression Models

Linear Regression (LR) is among the simplest and most widely adopted statistical models for predicting continuous outcomes in machine learning. It operates under the assumption of a linear relationship between the independent variables (features) and the dependent variable (target). The general form of a linear regression model is expressed in Equation (1):
y = β 0 + β 1 x 1 + β 2 x 2 + + β n x n +
where y denotes the predicted output (flexural strength), β0 is the intercept term, β1 through β41 represent the coefficients corresponding to each input variable x1 to xn, and ∈ accounts for the residual error between predicted and observed values.
Model fitting in linear regression can be achieved through analytical methods, such as the normal equation, or iterative optimization techniques like gradient descent. In this work, the coefficients were determined using the normal Equation (2):
β ^ = ( X T X ) 1 X T y
where β is the vector of estimated regression coefficients, X is the input feature matrix, and y is the vector of observed response values. This closed-form solution enables the direct computation of the optimal parameters, provided that the matrix (XᵀX) is invertible.
By establishing a baseline predictive performance, the LR model serves as a reference for evaluating the benefits of more complex machine learning algorithms applied to flexural strength prediction.

2.2.2. K-Nearest Neighbors (KNN) Models

The K-Nearest Neighbors (KNN) algorithm is a non-parametric, instance-based learning technique commonly employed for both classification and regression tasks. Its predictive strength relies on the assumption that similar input instances tend to exhibit similar output behaviors, making it particularly suitable for materials science applications where complex, multi-variable interactions are prevalent [63].
For regression problems, the working principle of KNN can be summarized as follows:
i.
The algorithm computes the distance between a query point and all points in the training dataset using a metric such as the Euclidean distance;
ii.
Identifies the k closest neighbors;
iii.
Predicts the output as the average of the target values of these neighbors.
Formally, the Euclidean distance between two instances, xi and xj, each characterized by n attributes, is calculated as Equation (3):
d x i , x j = r = 1 n ( a r ( x i ) a r ( x j ) ) 2
where ar(x) denotes the value of the rth attribute of instance x.
For its part, the predicted output for a test point xₜₑₛₜ is then given by Equation (4):
y ^ ( x t e s t ) = 1 k i = 1 k y i
where yᵢ represents the target value of the ith nearest neighbor, and k is the number of neighbors considered [64,65]. The optimal value of k is determined through a k-fold cross-validation, selecting the number of neighbors that minimized the prediction error on the validation set [63].

2.2.3. Support Vector Regression Model

Support Vector Regression (SVR) is a supervised learning algorithm derived from Support Vector Machines (SVM), designed to perform regression tasks by identifying a function that approximates the underlying data within a specified margin of tolerance. Rather than minimizing the prediction error for each training point, SVR seeks to fit a model within an ε-insensitive tube, penalizing only deviations exceeding this threshold.
The prediction function for SVR can be expressed as depicted in Equation (5):
z ( a , w ) = ( w     ϕ ( a ) + c )
where
z ( a , w ) is the predicted value for input a.
w is the weight vector.
ϕ(a) is a feature function that maps the input a to a higher-dimensional space.
c is a bias term.

2.2.4. Random Forest

Random Forest (RF) is a robust ensemble learning method designed for both regression and classification tasks. Building upon decision trees, RF mitigates overfitting and variance by constructing multiple trees and aggregating their predictions. In regression problems, such as predicting the flexural strength of UHPC, the final output is typically obtained by averaging the individual tree predictions, as illustrated schematically in Figure 6. In this diagram, the yellow circles denote the sequence of internal decision nodes that a specific input vector xi that traverses in each tree: beginning at the root node, following successive split criteria based on feature values, and ultimately arriving at the terminal leaf node (also highlighted in yellow) whose numeric output contributes to f t ( x i ) . All remaining nodes, shown in gray, represent branches not visited by that sample. This ensemble approach significantly enhances model stability and generalization, particularly when dealing with complex and heterogeneous datasets [66].
Mathematically, the prediction for the ith instance is given by Equation (6):
y ^ i = 1 T   i = 1 T f t ( x i )
where ŷᵢ is the predicted output for the ith sample, T is the total number of trees in the forest, fₜ(xᵢ) denotes the prediction of the tth tree, and xᵢ represents the input feature vector for that instance [66].

2.2.5. Extreme Random Trees

The Extremely Randomized Forest (XRF) algorithm is an advanced ensemble learning technique derived from RF approaches, aimed at further reducing overfitting and enhancing predictive performance. Unlike RF, XRF constructs trees by using the entire training dataset and introducing additional randomness through the selection of split thresholds at each node. This approach increases model diversity and stability while maintaining computational efficiency [23,67].
Mathematically, the output of the XRF model can be written as Equation (7) describes:
f t ( x ) = f ( t 1 ) + f ( x )
where
f t ( x ) is the final prediction of the model after t-iterations.
f ( t 1 ) is the prediction from the previous iteration.
f ( x ) is the new prediction at the current iteration, generated based on a random subset of the feature [22,65]

2.2.6. Extreme Gradient Boosting

The Extreme Gradient Boosting (XGBoost) is a high-performance ensemble learning algorithm derived from the gradient boosting framework, also based on decision trees, but offering a fundamentally different approach compared to RF. While RF builds multiple independent trees in parallel and aggregates their outputs to reduce variance through bagging, XGBoost constructs trees sequentially, with each new tree focusing on correcting the residual errors of the previous one [68,69].
This sequential boosting process could enable XGBoost to achieve higher predictive accuracy, particularly in complex, high-dimensional datasets. Furthermore, XGBoost incorporates explicit regularization techniques (L1 and L2 penalties) to control overfitting, a feature not present in standard RF models [65,70]. Optimization in XGBoost is performed through gradient descent on a specified loss function, whereas RF relies purely on averaging without explicit loss minimization [69].
The general formulation for the model prediction is depicted in Equation (8) [67]:
y i ^ = t = 1 T f t ( x i )
where
y i ^ is the predicted output for the i t h sample.
f t ( x i ) represents the output of the t t h decision tree (weak learner) based on input features x i .
T is the total number of trees in the ensemble.

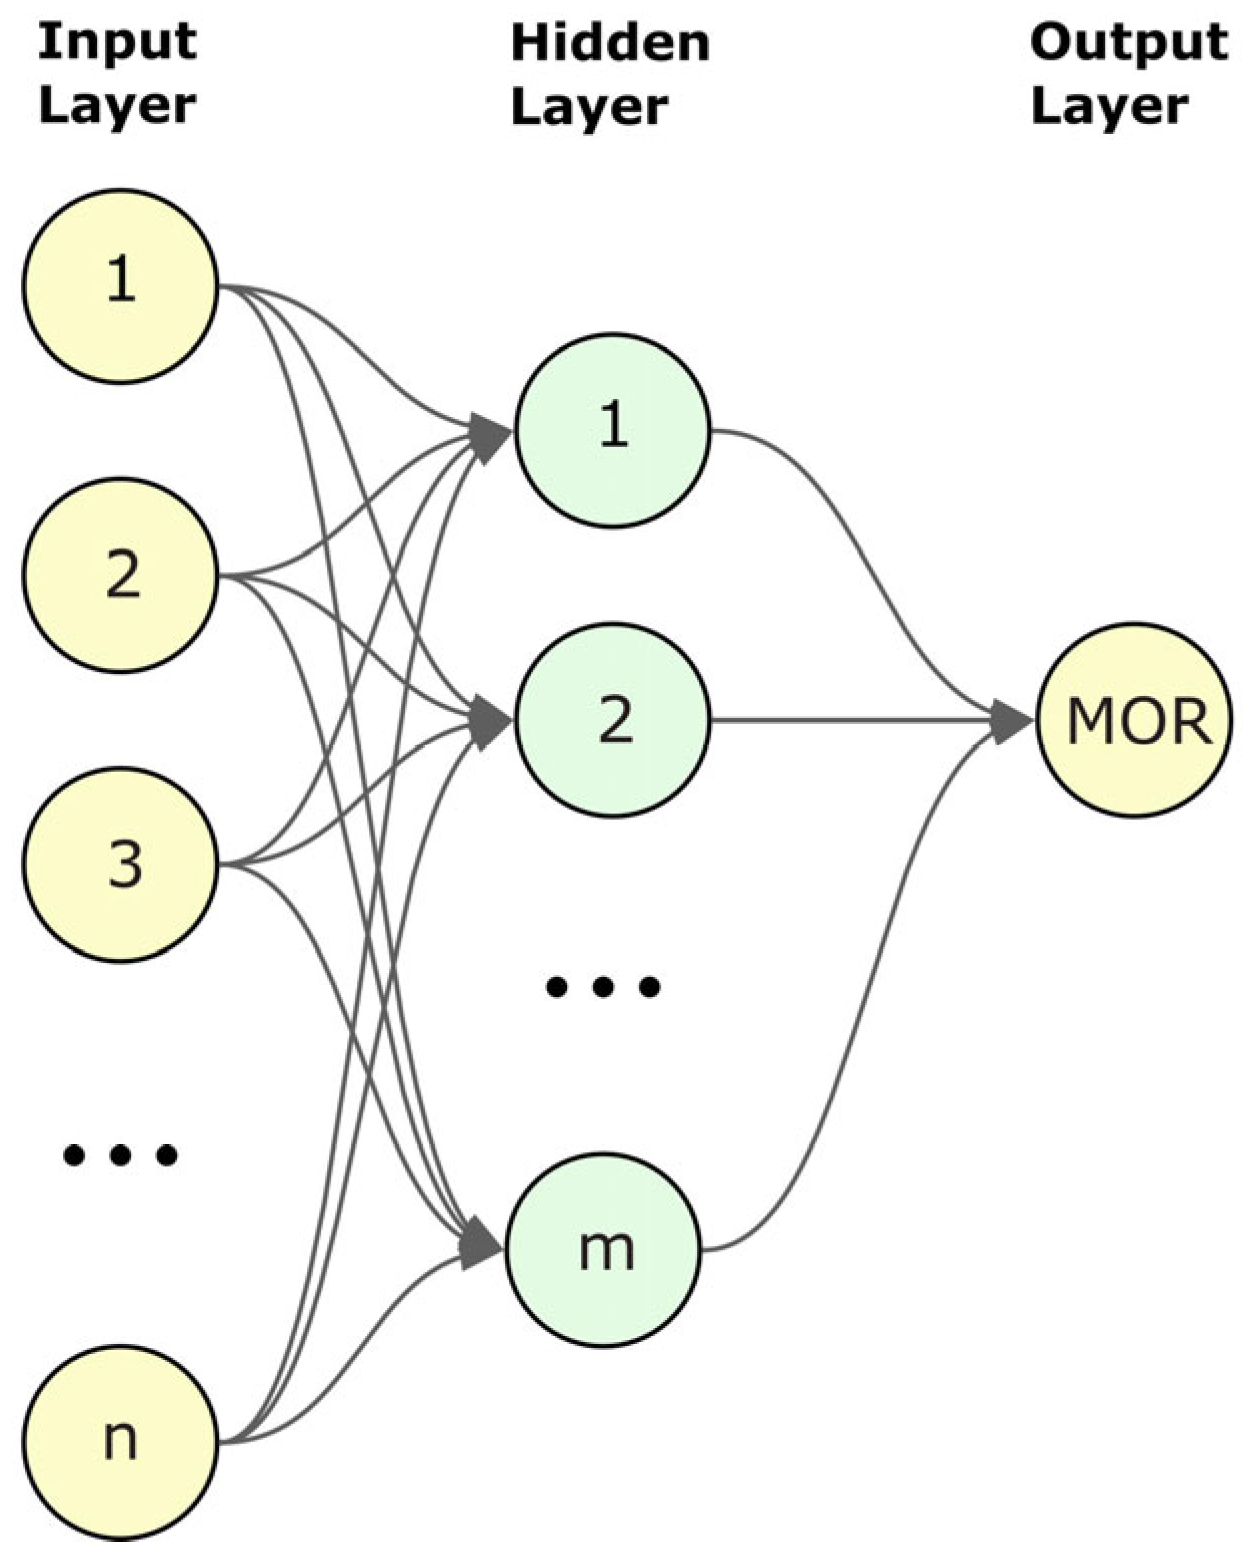
2.2.7. Artificial Neural Networks

Feedforward Artificial Neural Networks (ANNs) are supervised learning models composed of interconnected layers of neurons organized sequentially from input to output, without cycles or feedback loops, as presented in Figure 7. Each neuron computes a weighted sum of its inputs, adds a bias term, and applies a nonlinear activation function, enabling the network to model complex, nonlinear relationships between features and target variables [71].
The formula for the output of a single neuron is presented by Equation (9):
y j = f ( i = 1 n w i j x i + b j )
where
y j is the output of neuron j in the current layer.
w i j represents the weights between neuron i in the previous layer and neuron j in the current layer.
x i is the input from neuron i.
b j is the bias term for neuron j.
f is the activation function (such as ReLU, Sigmoid, or Tanh), which introduces nonlinearity into the model.
Training involves adjusting the weights and biases through the backpropagation algorithm combined with optimization techniques like gradient descent, minimizing a defined loss function. For regression tasks, the output layer typically consists of a single neuron producing a continuous value. Therefore, ANNs offer a flexible and powerful framework capable of capturing complex mappings between input variables and outputs, making them particularly effective for predictive modeling tasks in high-dimensional spaces [71,72].
Beyond their conventional role as high-dimensional black-box regressors, ANNs have been increasingly leveraged as surrogate models within probabilistic frameworks, particularly for composite materials characterized by intrinsic uncertainties. For instance, Kushari et al. [73] developed an ANN-based model to simulate first-ply failure in laminated composites under random variations in ply orientation and stacking sequence, effectively capturing variability-driven failure envelopes while substantially reducing computational demands relative to Monte Carlo simulations. Similarly, Gotlib et al. [74] proposed an ANN architecture capable of generalizing the effective thermal and electrical conductivities of disordered composites, even when microstructural geometries are entirely random or non-idealized. More recently, Kamiński [75] applied ANNs within a stochastic homogenization framework to evaluate entropy-based uncertainty metrics—such as Shannon entropy, Kullback–Leibler divergence, and Bhattacharyya distance—for fiber-reinforced composites with imperfect interfacial zones. These works collectively demonstrate that ANNs are not only effective predictive tools but also offer interpretability benefits in uncertainty quantification. Their demonstrated capacity to map the probabilistic behavior of composite systems provides strong support for their adoption in this study as interpretable surrogates for estimating the flexural strength of UHPC mixtures with complex formulations and hybrid reinforcements.

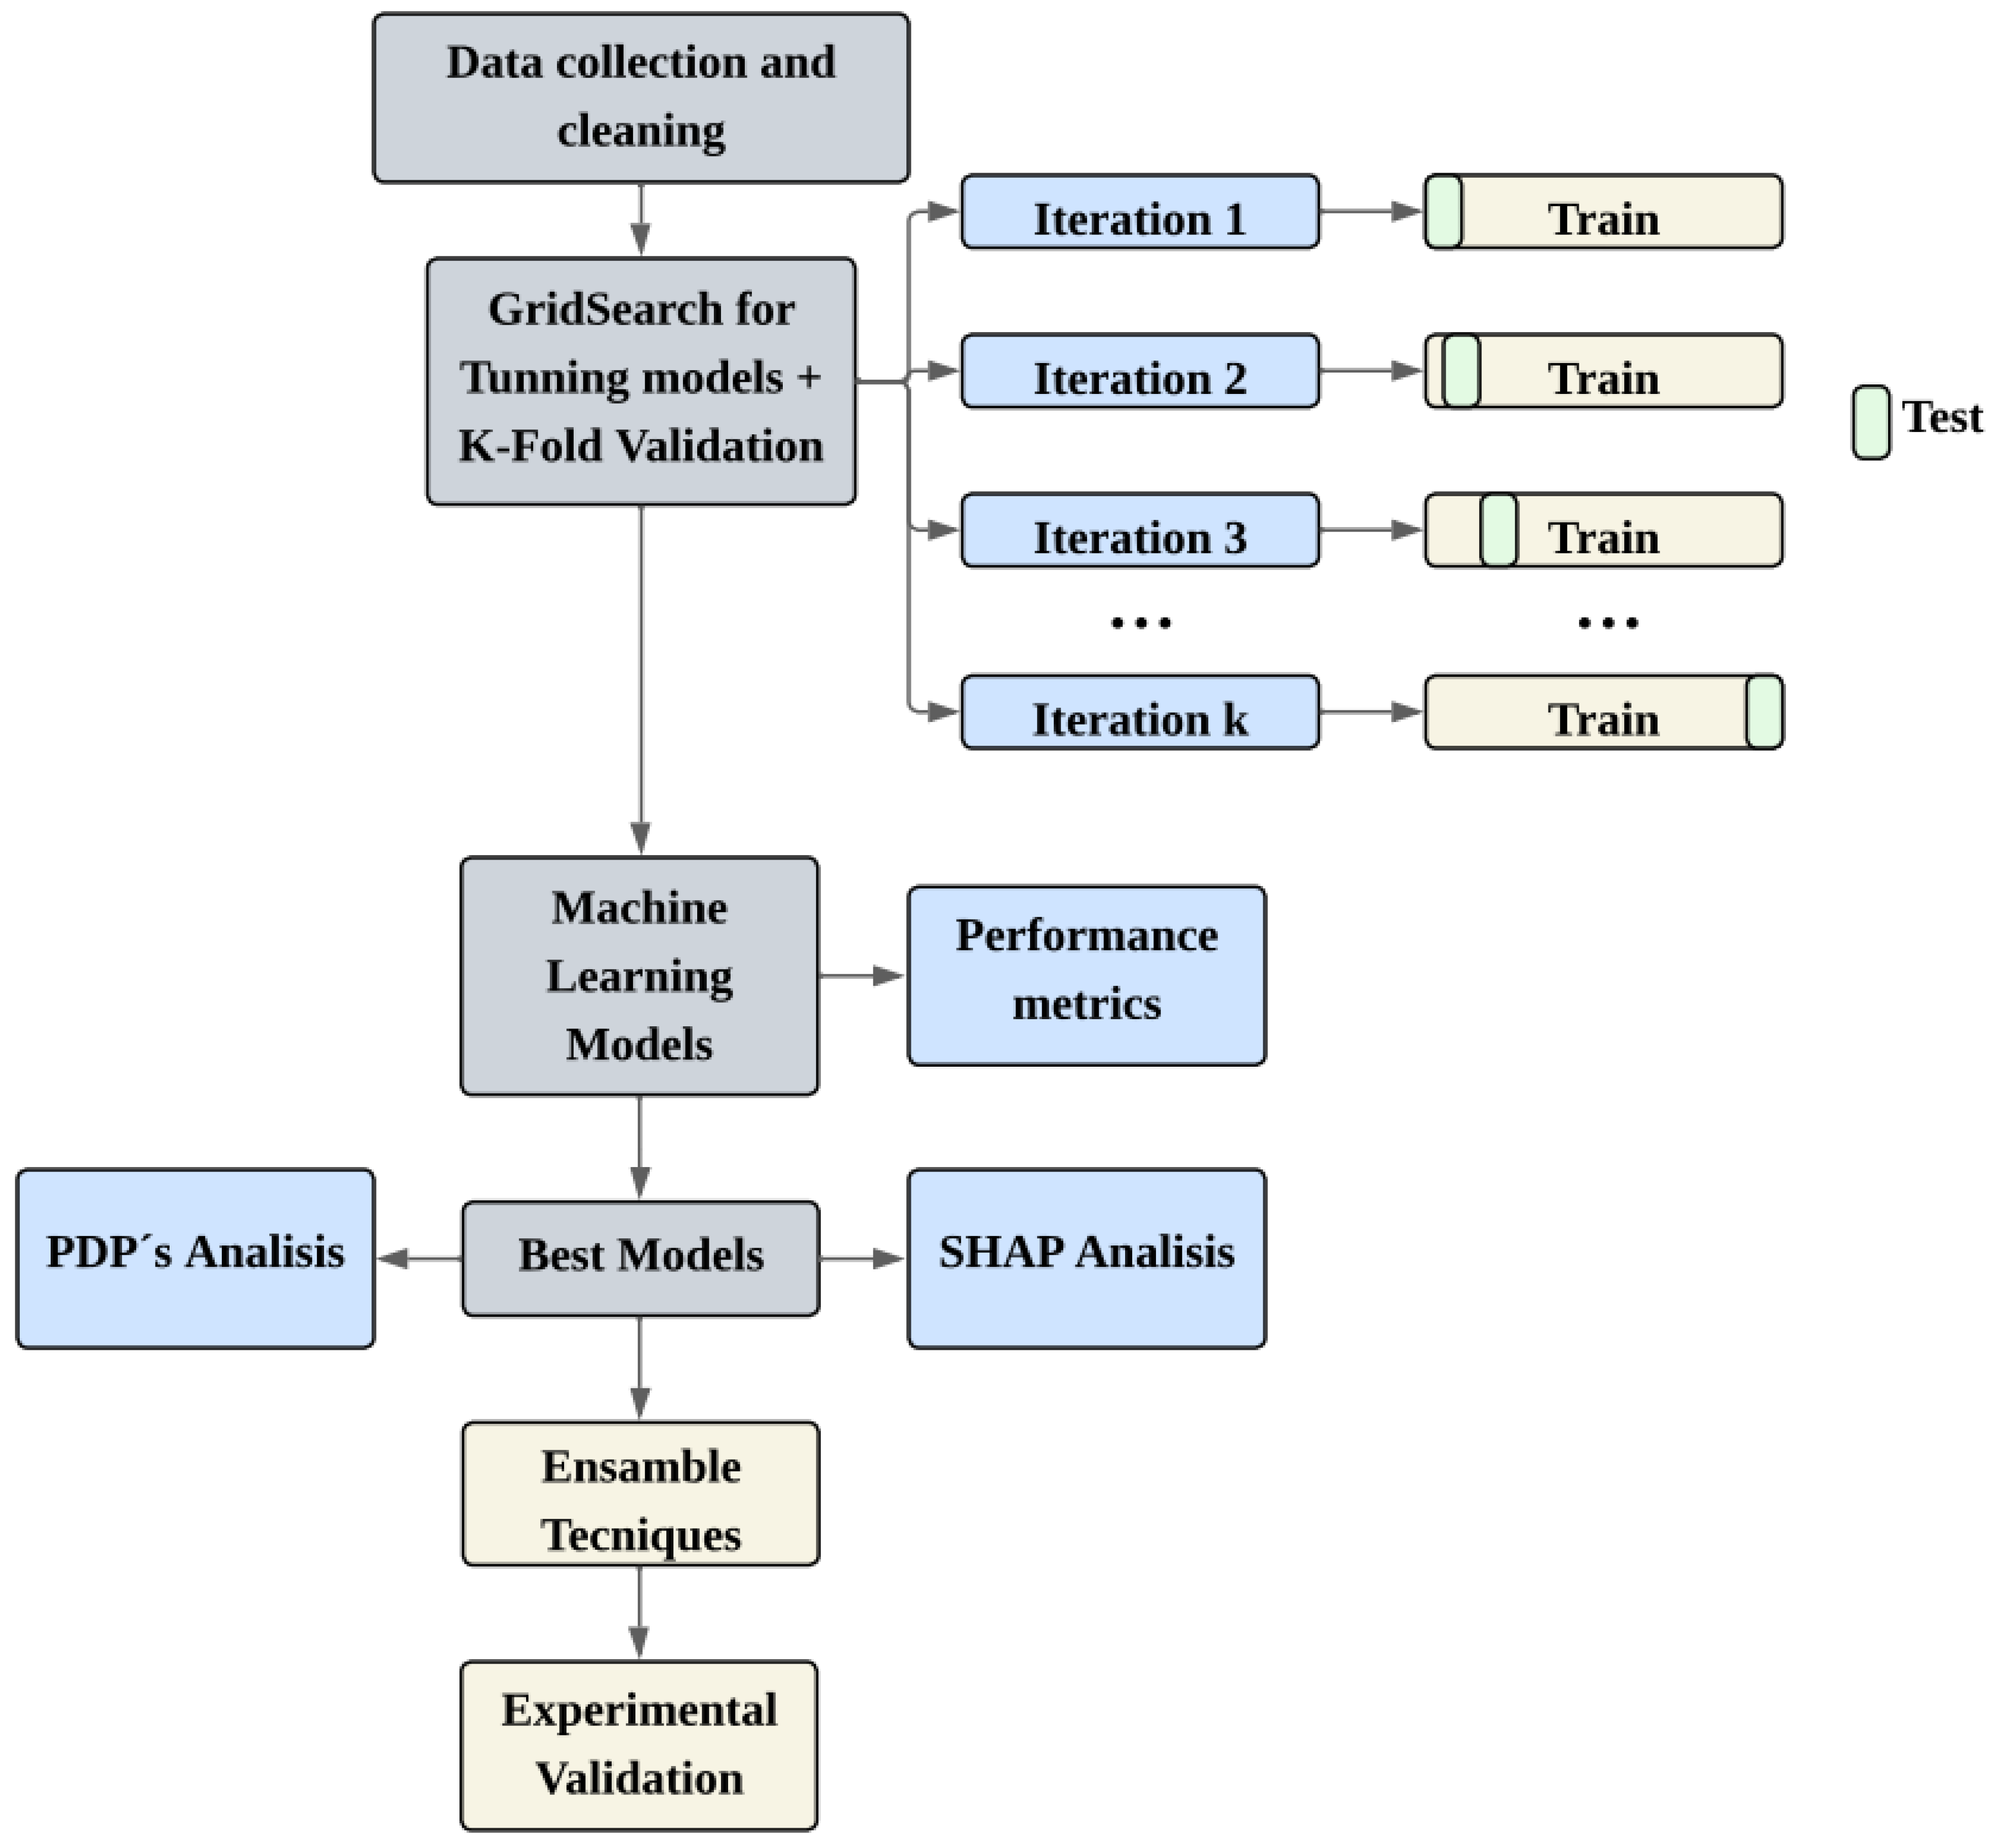
2.3. Model Tunning and Evaluation

2.3.1. Computational Resources and Execution Time

To enhance the transparency and reproducibility of the modeling pipeline, the computational environment used in this study is detailed here. All machine learning models were developed and executed on a personal workstation equipped with an AMD Ryzen 7 7735HS processor, 16 GB of RAM, and an AMD Radeon RX 7700S GPU. This configuration provided sufficient processing power to support both traditional algorithms and more complex ensemble and hybrid neural architectures.
The total average computation time for the complete modeling workflow was approximately 1.8 h. This includes all stages of the process: training of base models, construction of ensemble learners, implementation of hyperparameter tuning via GridSearch, 10-fold cross-validation, generation of one-way and two-way Partial Dependence Plots, and application of SHAP-based global and local interpretability routines.

2.3.2. Model Tunning

Hyperparameter optimization is a critical step in machine learning model development, as it directly influences model architecture, training dynamics, and generalization capacity. In this study, GridSearch was employed to systematically explore combinations of hyperparameters and identify the configurations that yield optimal model performance based on evaluation metrics such as the coefficient of determination (R2).
GridSearch conducts an exhaustive, structured search across predefined hyperparameter spaces, ensuring that potential sources of overfitting or underfitting associated with arbitrary hyperparameter selection are minimized. Although optimal hyperparameters do not guarantee perfect predictive accuracy, careful tuning enhances both model reliability and robustness.
Hyperparameter optimization was applied to all machine learning models considered, including ensemble methods and artificial neural networks, providing a foundation for fair comparison and maximizing each model’s predictive capabilities.

2.3.3. K-Fold Validation

All machine learning models were trained and evaluated using K-Fold cross-validation with K = 10. In this procedure, the dataset is partitioned into ten equal subsets; for each iteration, nine subsets are used for training while the remaining one is used for testing, ensuring that every instance is utilized for both purposes across the validation cycle [62].
This methodology provides a comprehensive assessment of model generalization while minimizing the risk of overfitting. Performance metrics, specifically the coefficient of determination (R2), were computed for each fold and averaged to obtain a robust estimate of model accuracy [76].
Figure 8 illustrates the distribution of the R2 scores obtained across the folds for individual models through box-and-whisker plots, offering a visual representation of the variability and stability achieved during the cross-validation process. In these plots, the central line indicates the median R2, the box spans the interquartile range (IQR), and the whiskers extend to ±1.5 × IQR; the white circles beyond the whiskers represent outlier fold scores that exceed this range, thereby highlighting instances of extreme performance deviation.

2.3.4. Prediction Performance Metric

The coefficient of determination (R2) was used as the primary evaluation metric to assess the predictive performance of the regression models. R2 quantifies the proportion of variance in the dependent variable that is explained by the independent variables, serving as an indicator of model goodness-of-fit.
The R2 value ranges from 0 to 1, where higher values denote better explanatory power of the model. A value of 1 indicates that the model perfectly accounts for the observed variance, while a value close to 0 suggests minimal predictive capability.
The computation of R2 is given by Equation (10):
R 2 = 1 i = 1 n ( a i y i ^ ) 2 i = 1 n y i ^ 2
where aᵢ represents the observed values and ŷᵢ the predicted values.
To give a better and stronger evaluation perspective of model performance, additional error metrics were also evaluated: Mean Absolute Error (MAE), Root Mean Squared Error (RMSE), Mean Squared Error (MSE), and Mean Absolute Percentage Error (MAPE). Each one of these measures the prevalence and variance of the prediction errors in its own way.
The MAE represents the average absolute difference between predicted and actual values, providing a direct measure of prediction accuracy is given by Equation (11):
M A E = 1 n   i = 1 n | a i y i ^ |
The RMSE reflects the square root of the average of the squared differences between observed and predicted values. It penalizes larger errors more severely due to the squaring operation is given by Equation (12):
R M S E = 1 n   i = 1 n ( a i y i ^ ) 2
The MSE is the square of RMSE, often used to capture the overall magnitude of errors, especially when comparing models where large deviations are critical is given by Equation (13):
M S E = 1 n   i = 1 n ( a i y i ^ ) 2
The MAPE expresses the prediction error as a percentage, making it particularly useful when comparing models across different scales or units is given by Equation (14):
M A P E = 100 % n   i = 1 n | a i y i ^ a i |
The combined interpretation of the indicators provides a precise assessment of predictive accuracy and reliability to the outlier, robustness to prediction more importantly, the generalizing ability of the predictive model, all of which are salient features in an engineering context, where reliable predictions and the ability to interpret those predictions are of utmost importance.

2.4. SHAP (Shapley Additive ExPlanations)

Shapley Additive Explanations (SHAP) were employed to interpret the contribution of individual input variables to the model predictions. Based on cooperative game theory, SHAP values provide a consistent and locally accurate attribution of feature importance, enhancing the transparency of complex machine learning models.
Following the framework proposed by Lundberg and Lee [77], the prediction for a given instance can be expressed as given in Equation (15):
h z = ϕ 0 + i = 1 N ϕ i z i
where
h z is the prediction made by the model.
ϕ 0 is the baseline prediction (the average prediction of the model without any features).
ϕ i is the Shapley value for feature i, representing its contribution to the prediction.
z i is the value of feature i for the given instance.
For its part, the attribution of each feature is determined by calculating the weighted average of its marginal contributions across all possible subsets of features. The mathematical expression for this is given in Equation (16):
ϕ i = K M i I K I ! N I K I 1 ! N ! [ g x K   i g x ( K ) ]
where
ϕ i is the Shapley value for feature i.
K is a subset of features without feature i.
M is the set of all features.
N is the total number of features.
g x ( K ) Represents the predicted value of the model when the feature set K is used.
SHAP analysis has been widely adopted in scientific and engineering domains due to its solid theoretical foundations, model-agnostic applicability, and ability to reveal nonlinear and interaction effects between features [78]. In this study, SHAP was applied to the best-performing individual learners (RF, XRF, XGB) to uncover the most critical parameters influencing flexural strength in UHPC, both at the global and local levels.

2.5. Partial Dependence Plots

In this study, Partial Dependence Plots (PDPs) served as a supporting interpretability technique to expand the understanding of how identified input variables influenced the predicted flexural performance of UHPC. PDPs, originally introduced by Friedman [79], quantify the marginal effect of one or two input features on the predicted output of a machine learning model while averaging the effect of all other input variables. This model-agnostic visualization allows for an intuitive way to see how important predictors affect the response variable or how the predictors modify the response variable (i.e., in this study, the modulus of rupture (MOR)).
Formally, the partial dependence function of a machine learning model f with respect to a subset of features S ⊆ {1, …, p} is defined as in Equation (17) [79]:
f ^ s x s = Ε x c f x s ,   x c = f x s ,   x c   d P ( x c )
where
x s denotes the values of the feature(s) of interest.
x c represents the complementary features (i.e., the remaining predictors not in S).
f x s ,   x c is the prediction function of the model.
P ( x c ) is the marginal probability distribution of the complementary features.

2.6. Ensemble Learning Techniques

To further enhance predictive performance, this study explores ensemble learning techniques, which combine multiple base models to capitalize on their individual strengths and mitigate their weaknesses. These strategies aim to improve model robustness, stability, and generalization beyond what could be achieved with standalone algorithms.

2.6.1. Bagging

Bootstrap Aggregating (Bagging) is an ensemble learning method designed to enhance the accuracy and robustness of predictive models by reducing variance through the aggregation of multiple learners. It operates by generating diverse versions of a base model, each trained on a random bootstrap sample of the training data.
In Bagging, models are trained independently, and their outputs are combined to produce the final prediction. For regression tasks, the ensemble output is typically the average of the individual model predictions, formulated as in the case of the individual decision tree-based models (see Equations (6) and (8)).
This strategy is particularly effective when applied to strong base models that individually demonstrate high predictive performance, offering a systematic approach to mitigating overfitting and enhancing model stability.

2.6.2. Stacking

Stacking is an ensemble learning technique that combines predictions from multiple base models of different types to exploit their individual strengths and mitigate their weaknesses. In this approach, several base learners are first trained independently on the training dataset. Their respective predictions are then used as input features for a secondary model, known as the meta-model, which generates the final output.
The prediction generated through Stacking is given by Equation (18):
y ^ = i = 1 N w i f i x + w 0
where
y ^ is the final predicted output.
f i x represents the prediction from the ith base model.
w i are the learned weights of each base model’s prediction, learned by the meta-model.
w 0 is the bias term learned by the meta-model.
By leveraging diverse predictive patterns captured by different models, Stacking often achieves superior generalization performance compared to individual learners.

2.6.3. Boosting

Stacking Boosting is an ensemble learning technique that constructs a strong predictive model by sequentially training a series of weak learners, each focused on correcting the errors of its predecessor. At each iteration, a new model is trained to minimize the residuals of the combined previous models, progressively improving overall predictive accuracy.
The final prediction produced by a Boosting ensemble can be expressed as (Equation (19)):
y i ^ = t = 1 T α t f t x i
where
  • y i ^ is the final predicted output for the ith sample.
  • f t x i is the prediction from the tth model.
  • α t is the weight assigned to each model’s prediction, based on its accuracy.

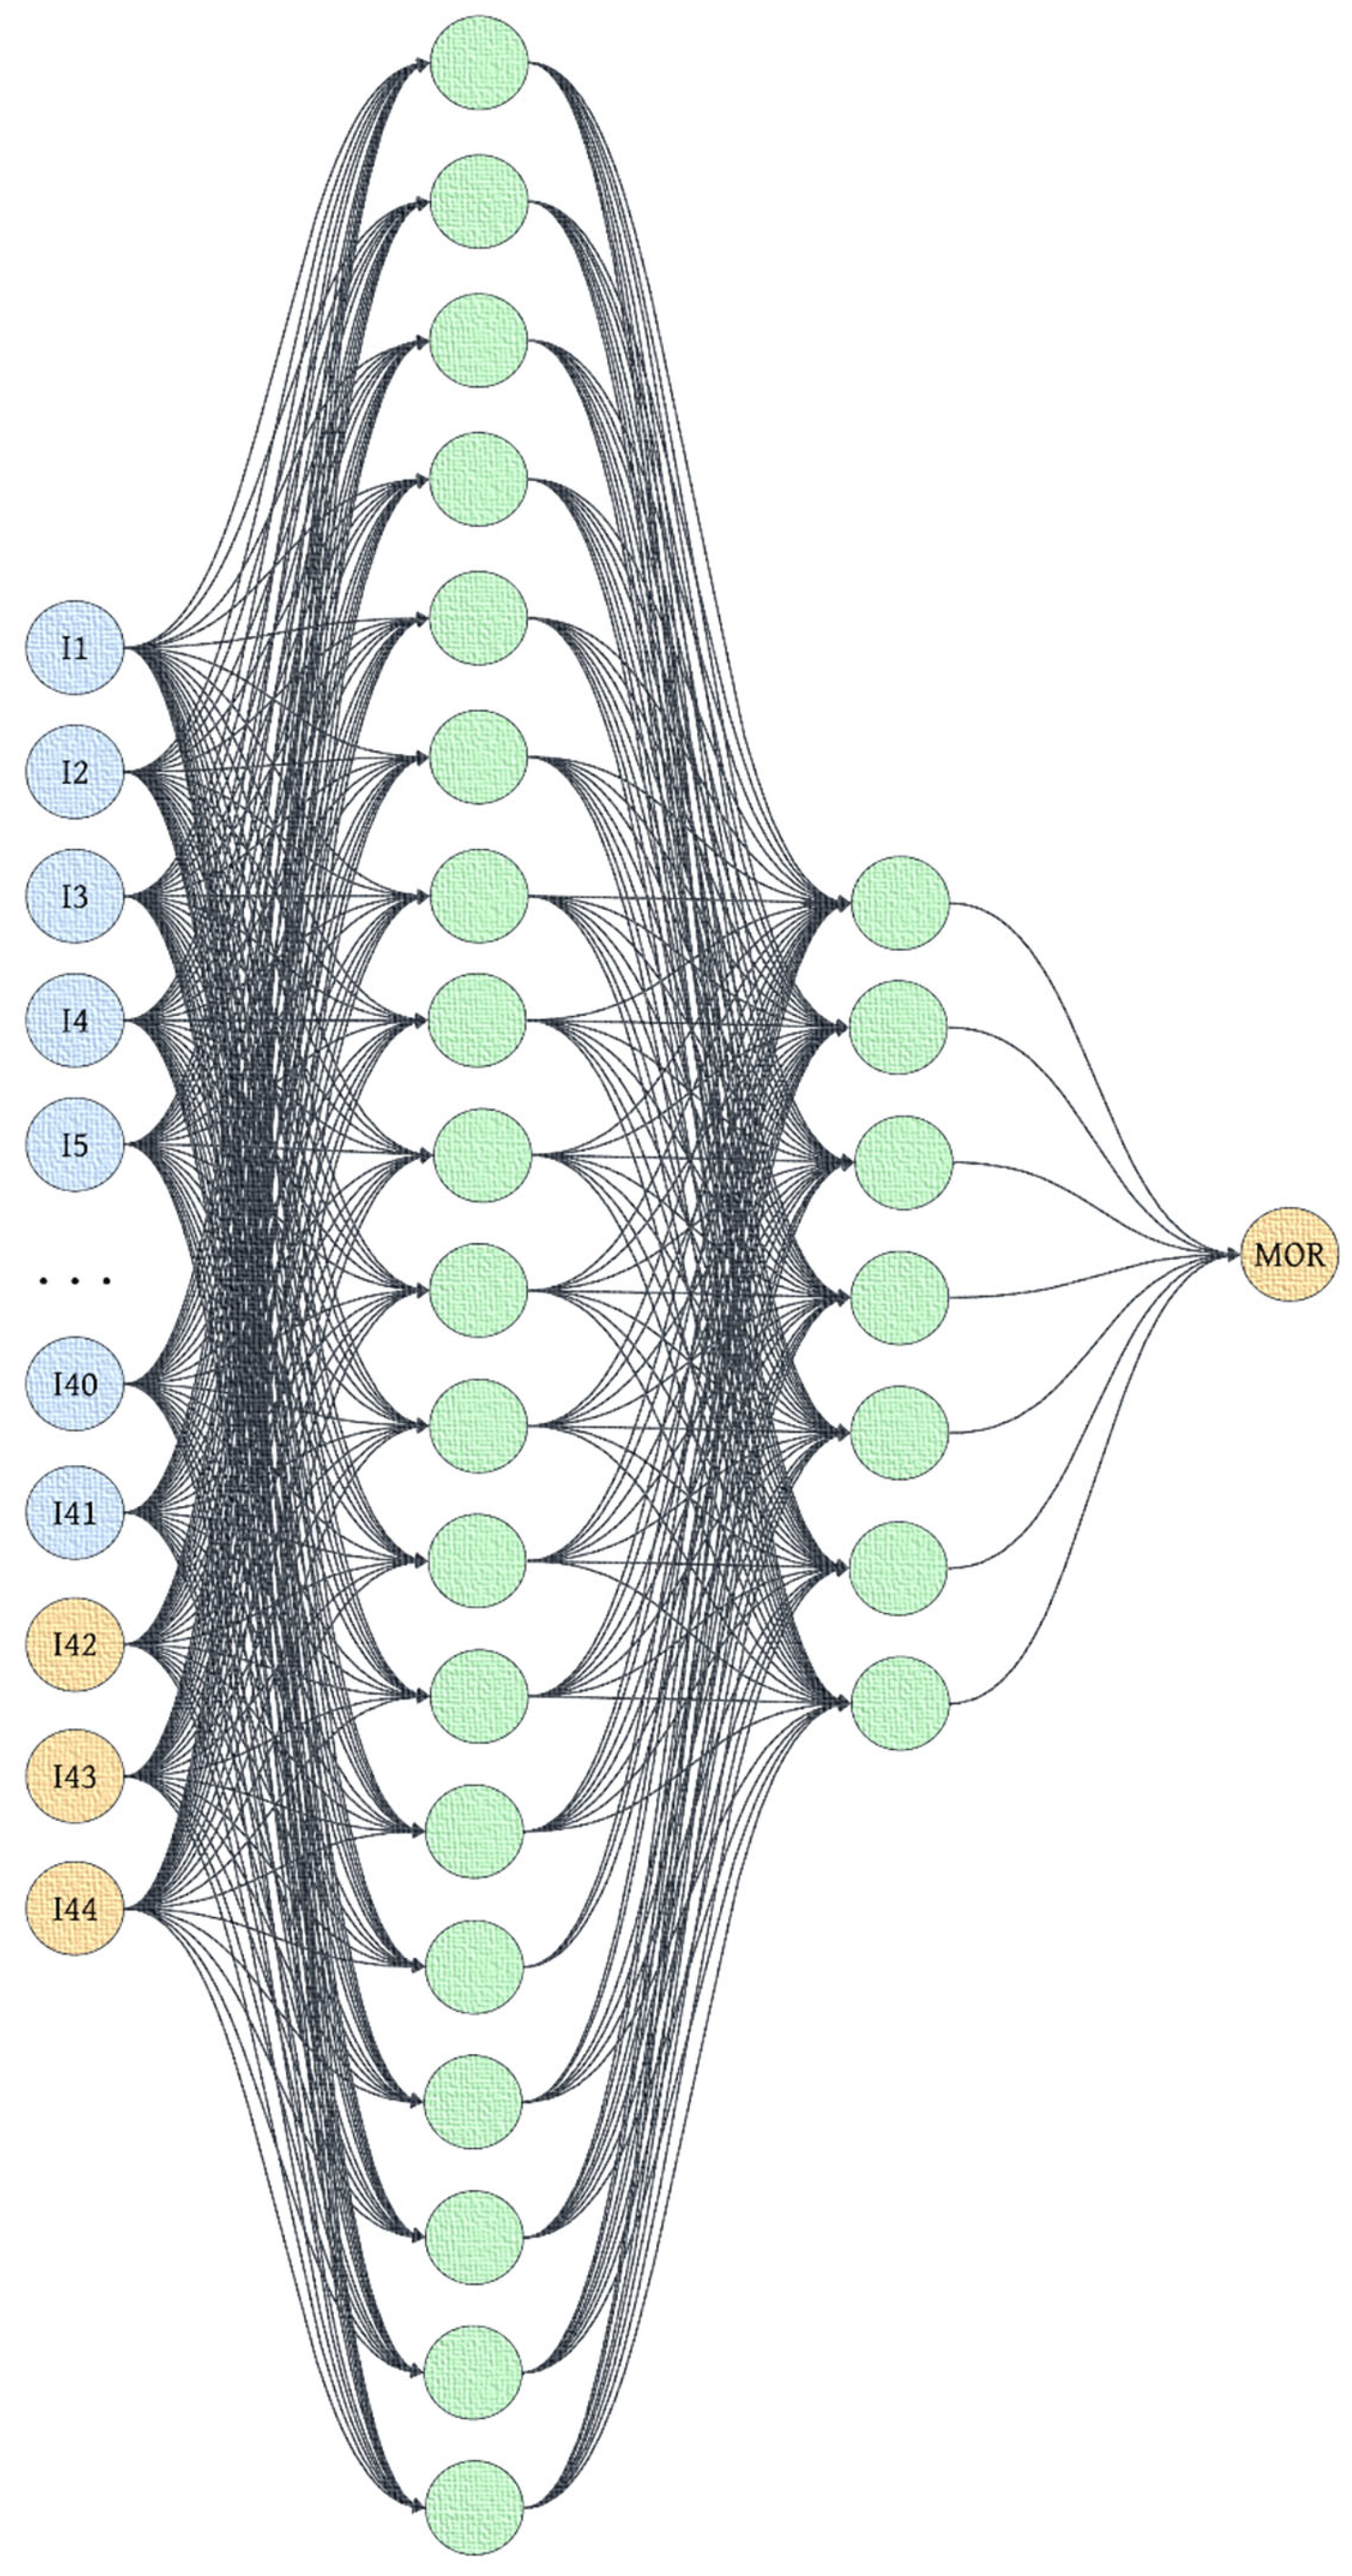
2.6.4. Hybrid Neural Network

The Hybrid Neural Network (Hybrid NN) is an advanced ensemble approach that integrates the predictions from multiple machine learning models with the original input features to improve predictive accuracy and generalization. This architecture capitalizes on the strengths of individual models by using their outputs as additional features within a neural network framework, thus reducing individual model biases and enhancing overall performance.
Initially, high-performing base models are trained independently, and their predictions are collected alongside the original feature set. The Hybrid NN receives these combined inputs and processes them through multiple hidden layers equipped with nonlinear activation functions. Weight optimization is performed using backpropagation and gradient descent, minimizing a predefined loss function such as Mean Squared Error.
The final prediction generated by Hybrid NN is represented as (Equation (20)):
y ^ h y b r i d = f ( y ^ R F ,   y ^ X R F ,   y ^ X G B ,   X 1 ,   X 2 ,   ,   X 41 )
where
y ^ h y b r i d is the final prediction of the Hybrid Neural Network.
y ^ R F ,   y ^ X R F ,   y ^ X G B are the outputs from the base models (RF, XRF, XGB), each with an R2 value greater than 0.8.
X 1 ,     X 2 ,   ,   X 41 are the original input features, such as fiber content, water-to-binder ratio, cement content, etc.
By combining model outputs with raw features, the Hybrid Neural Network offers a flexible and powerful methodology for capturing complex relationships within predictive modeling tasks.

3. Results

This section may be divided by subheadings. It should provide a concise and precise description of the experimental results, their interpretation, as well as the experimental conclusions that can be drawn.

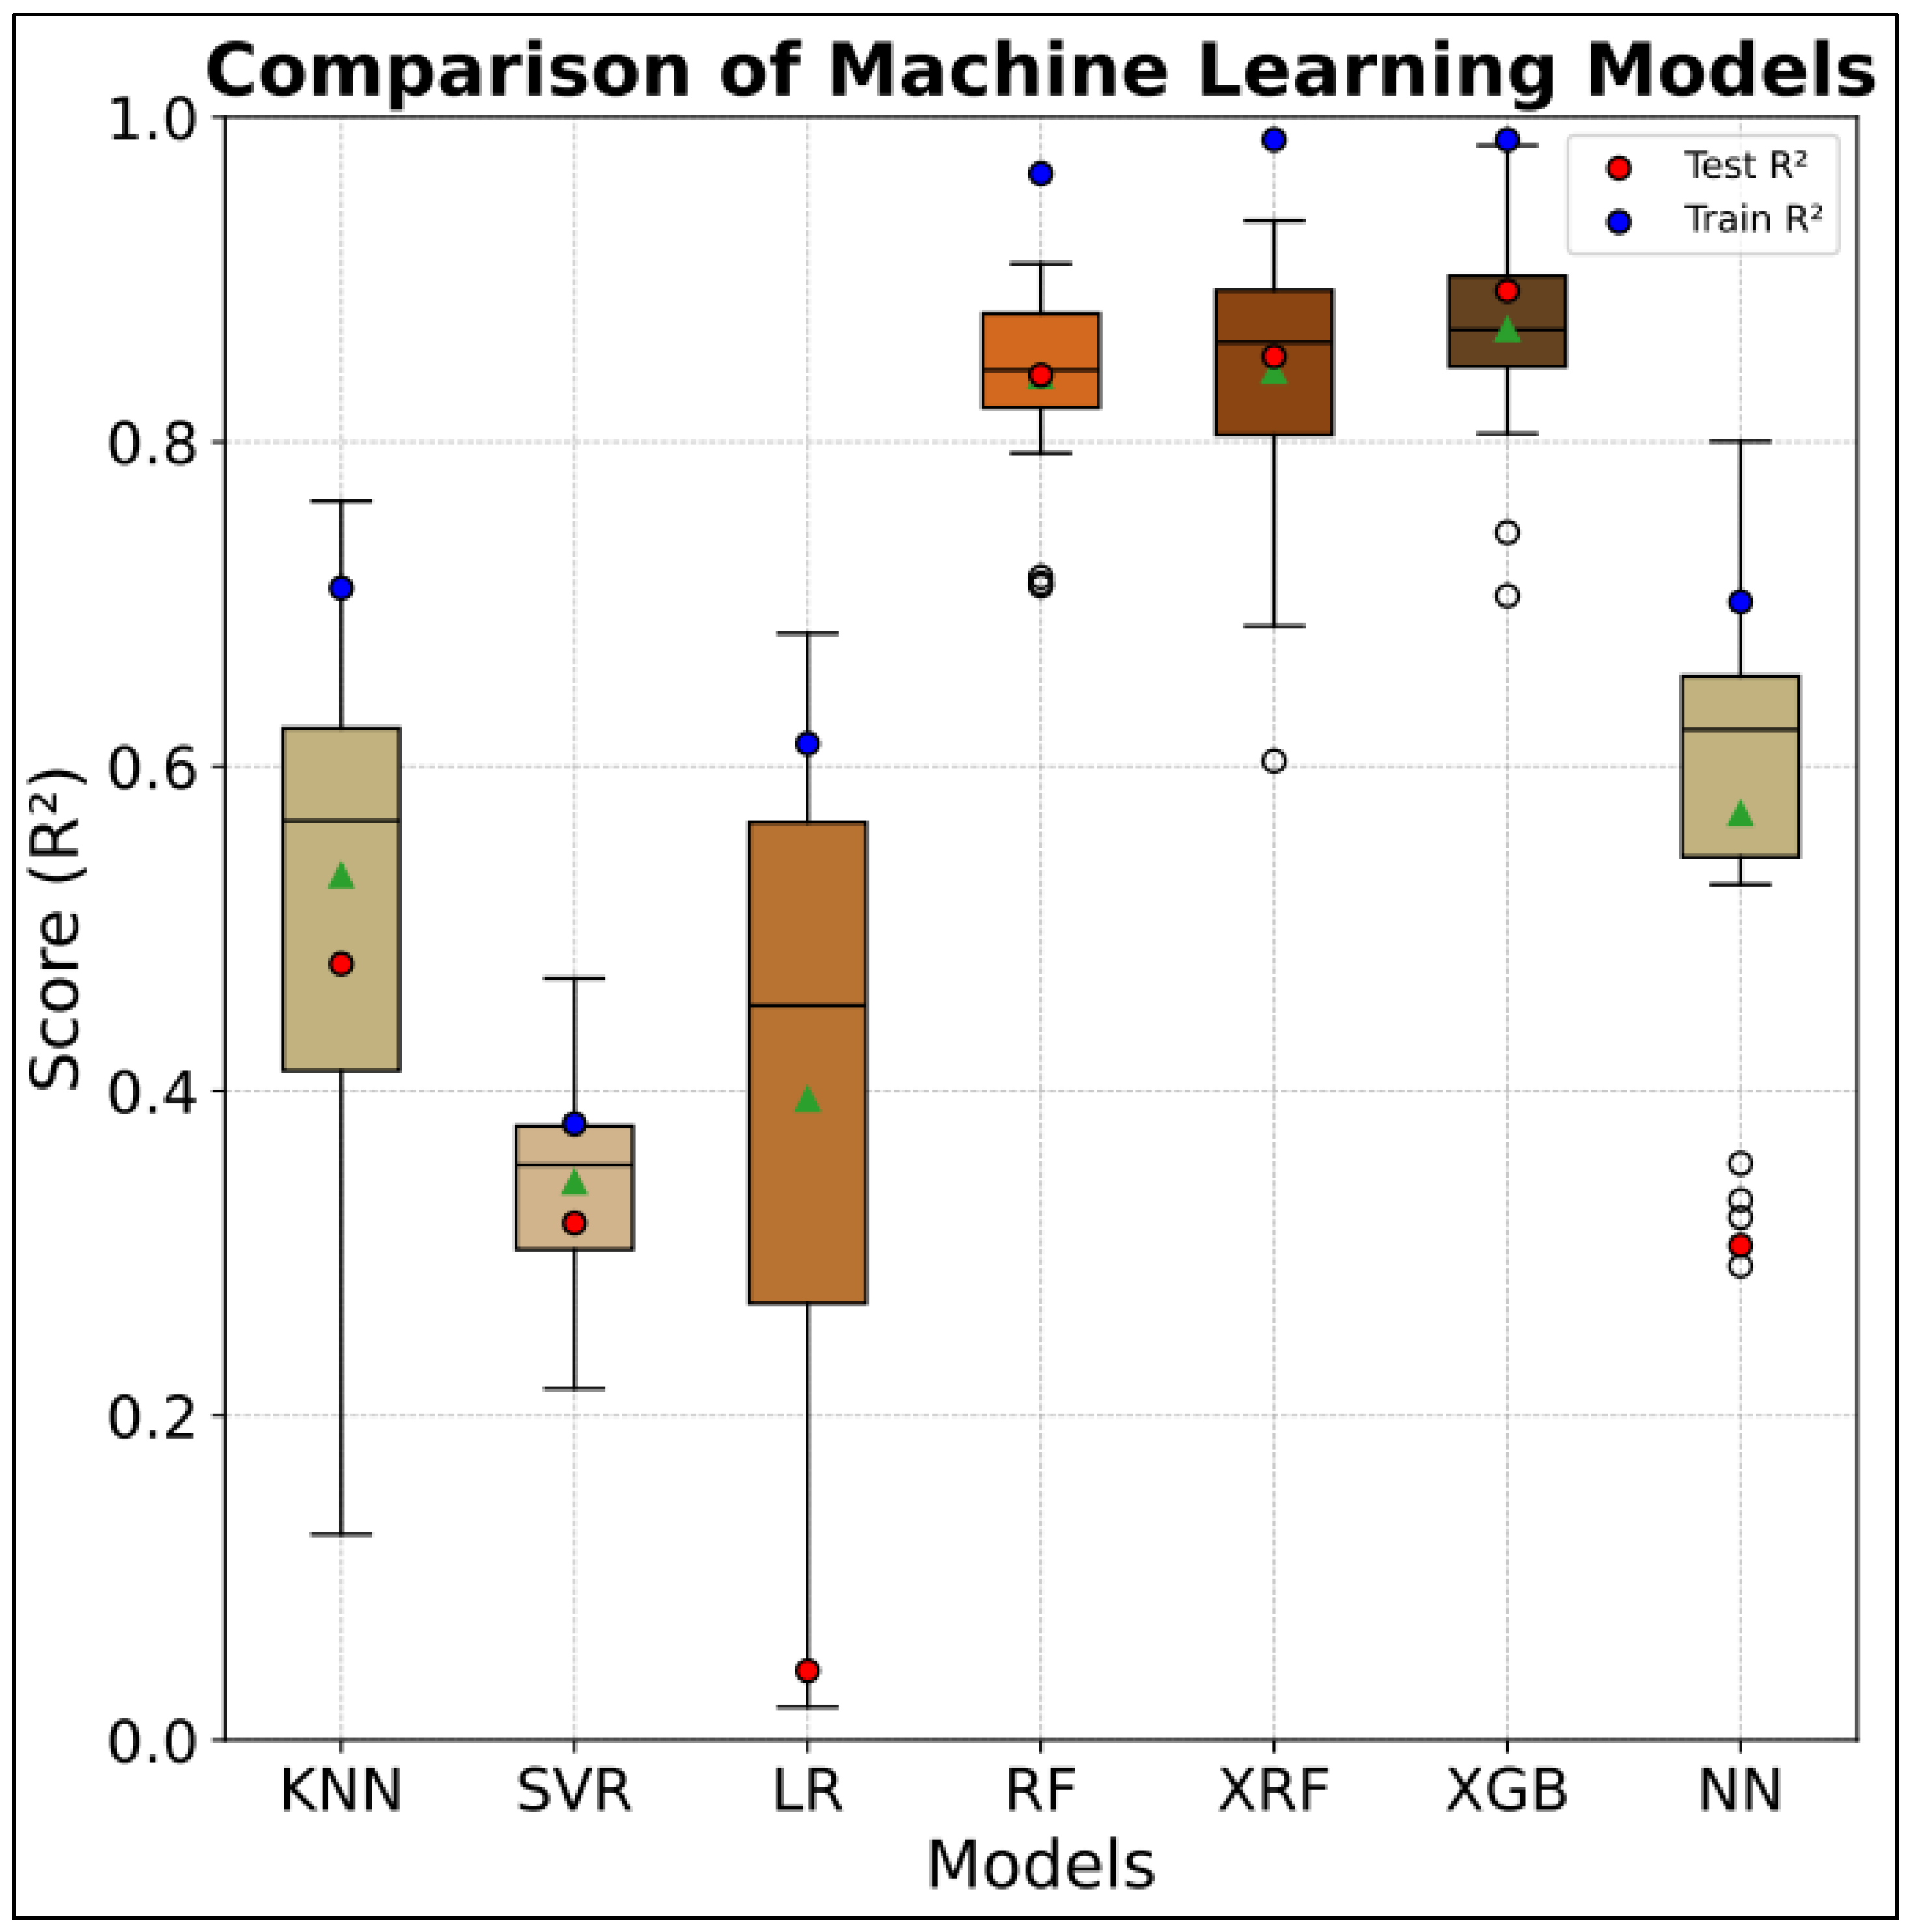
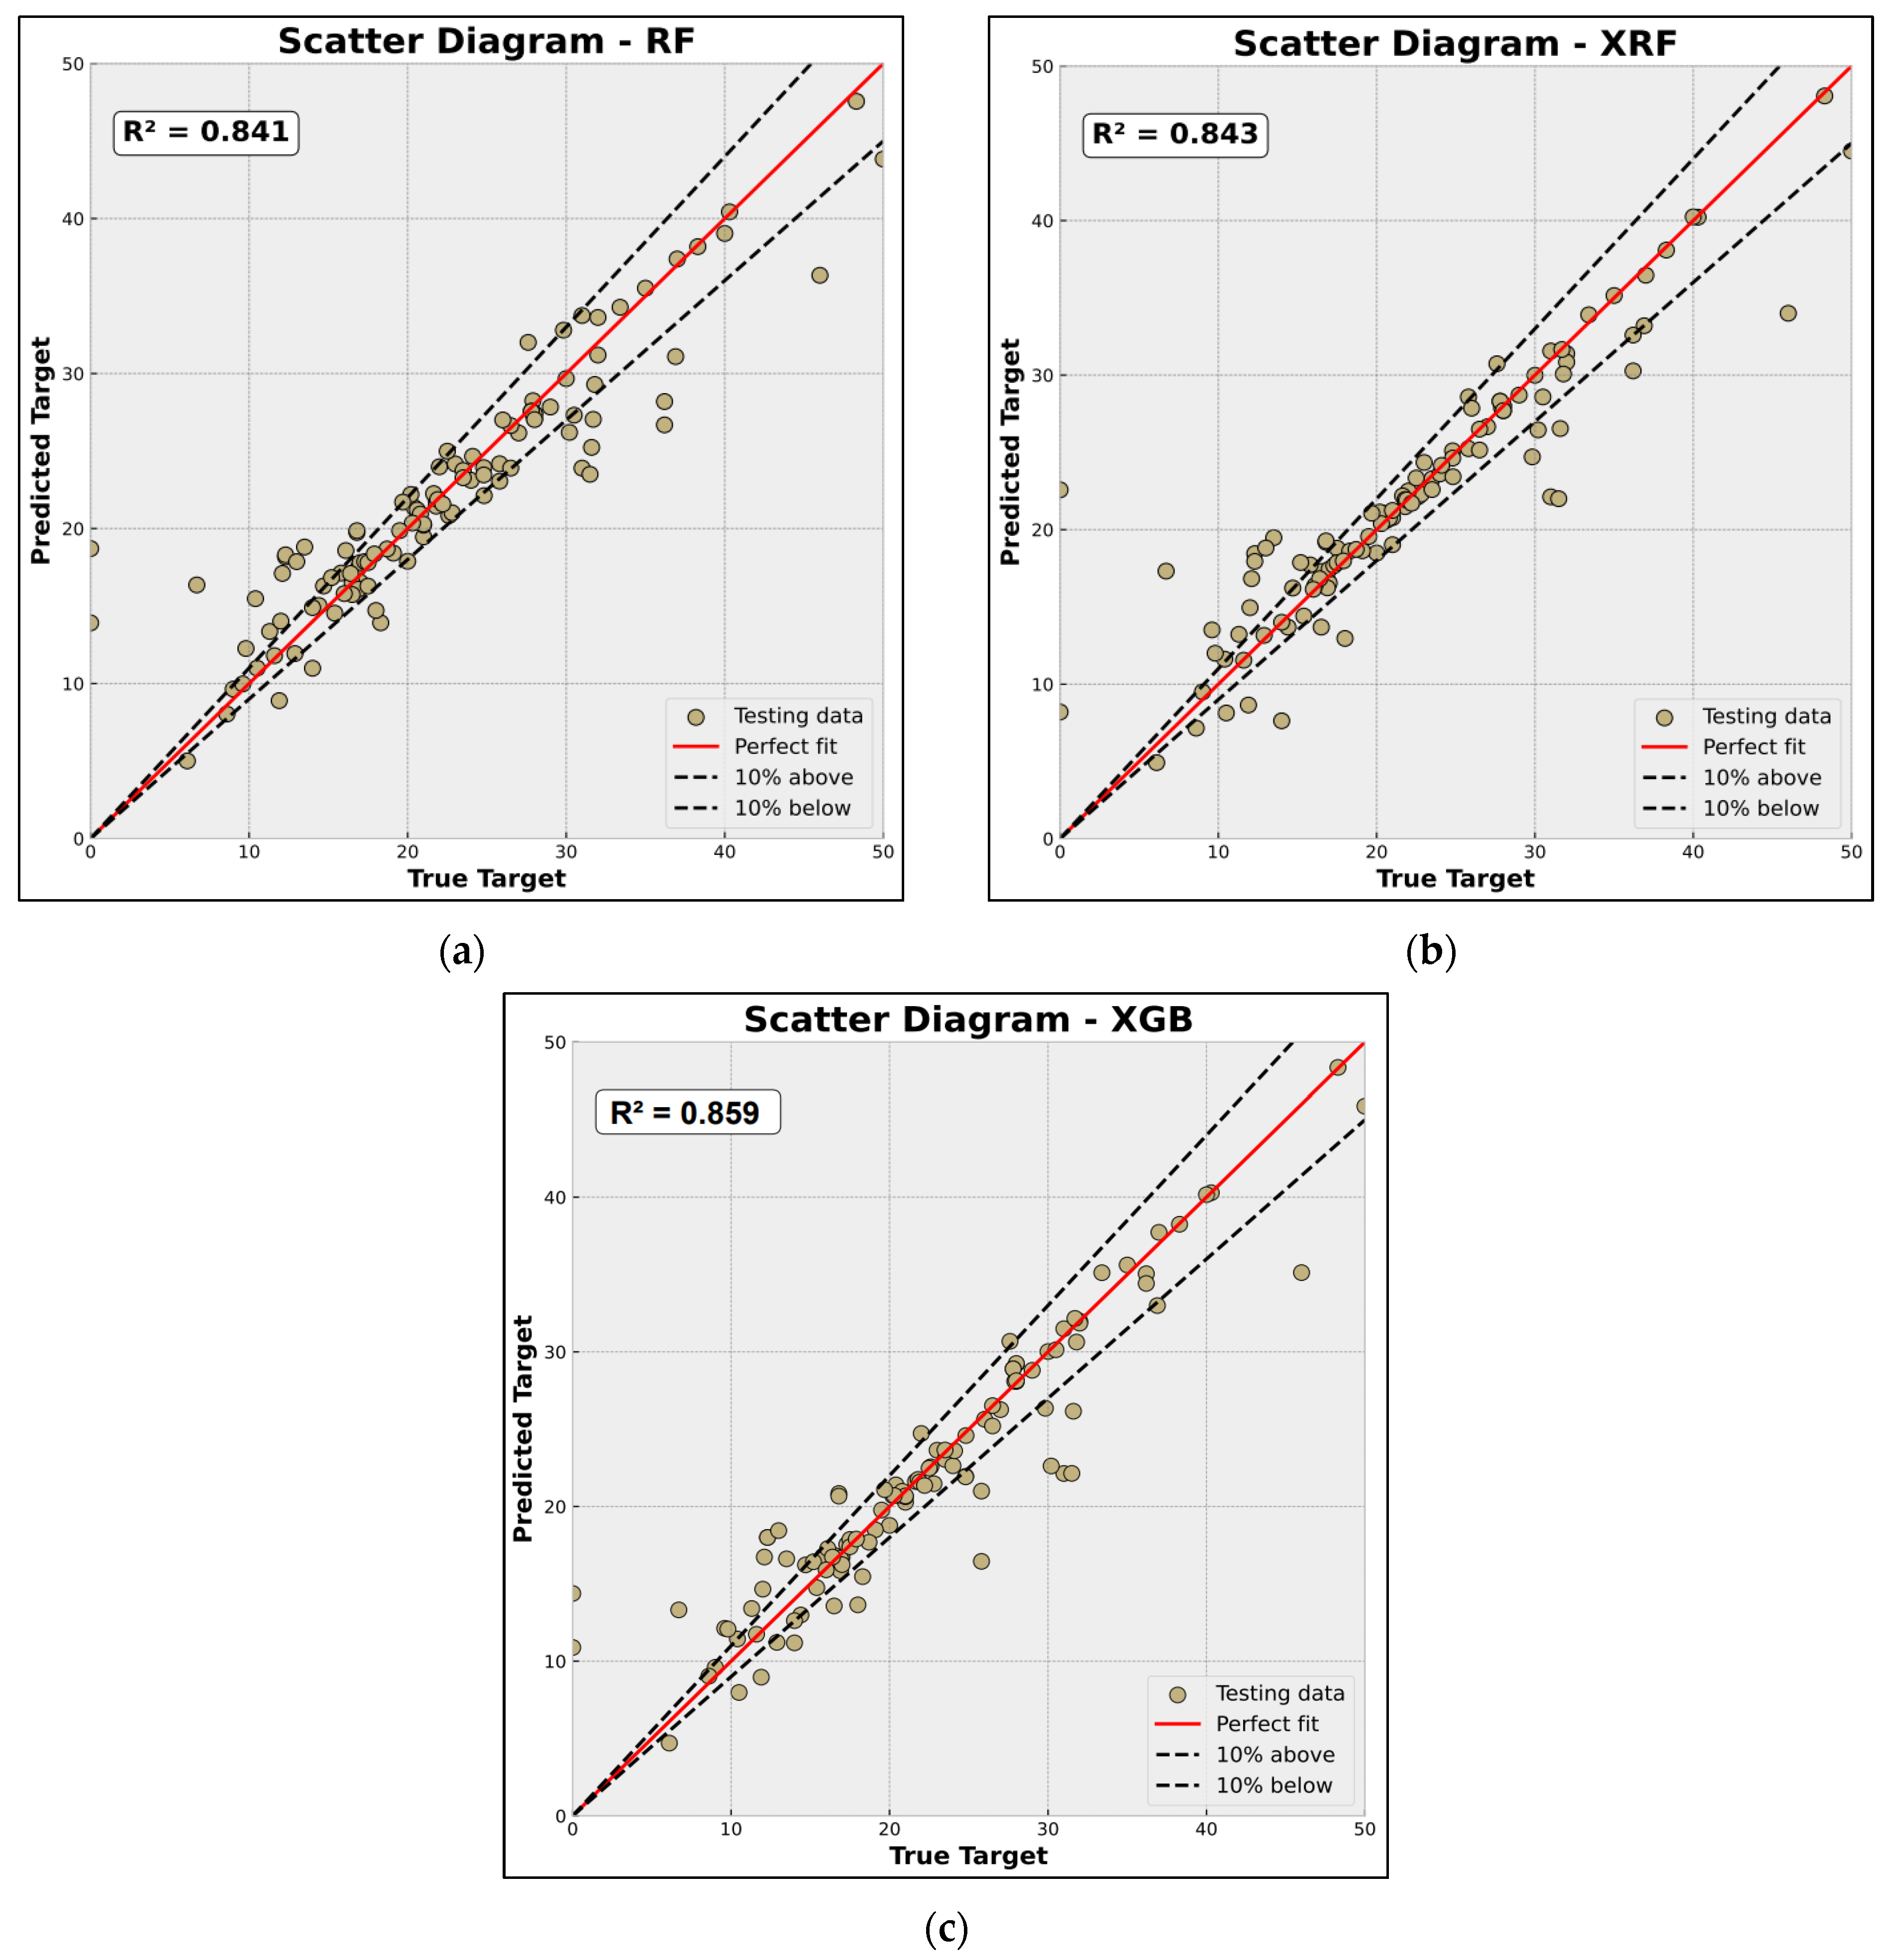
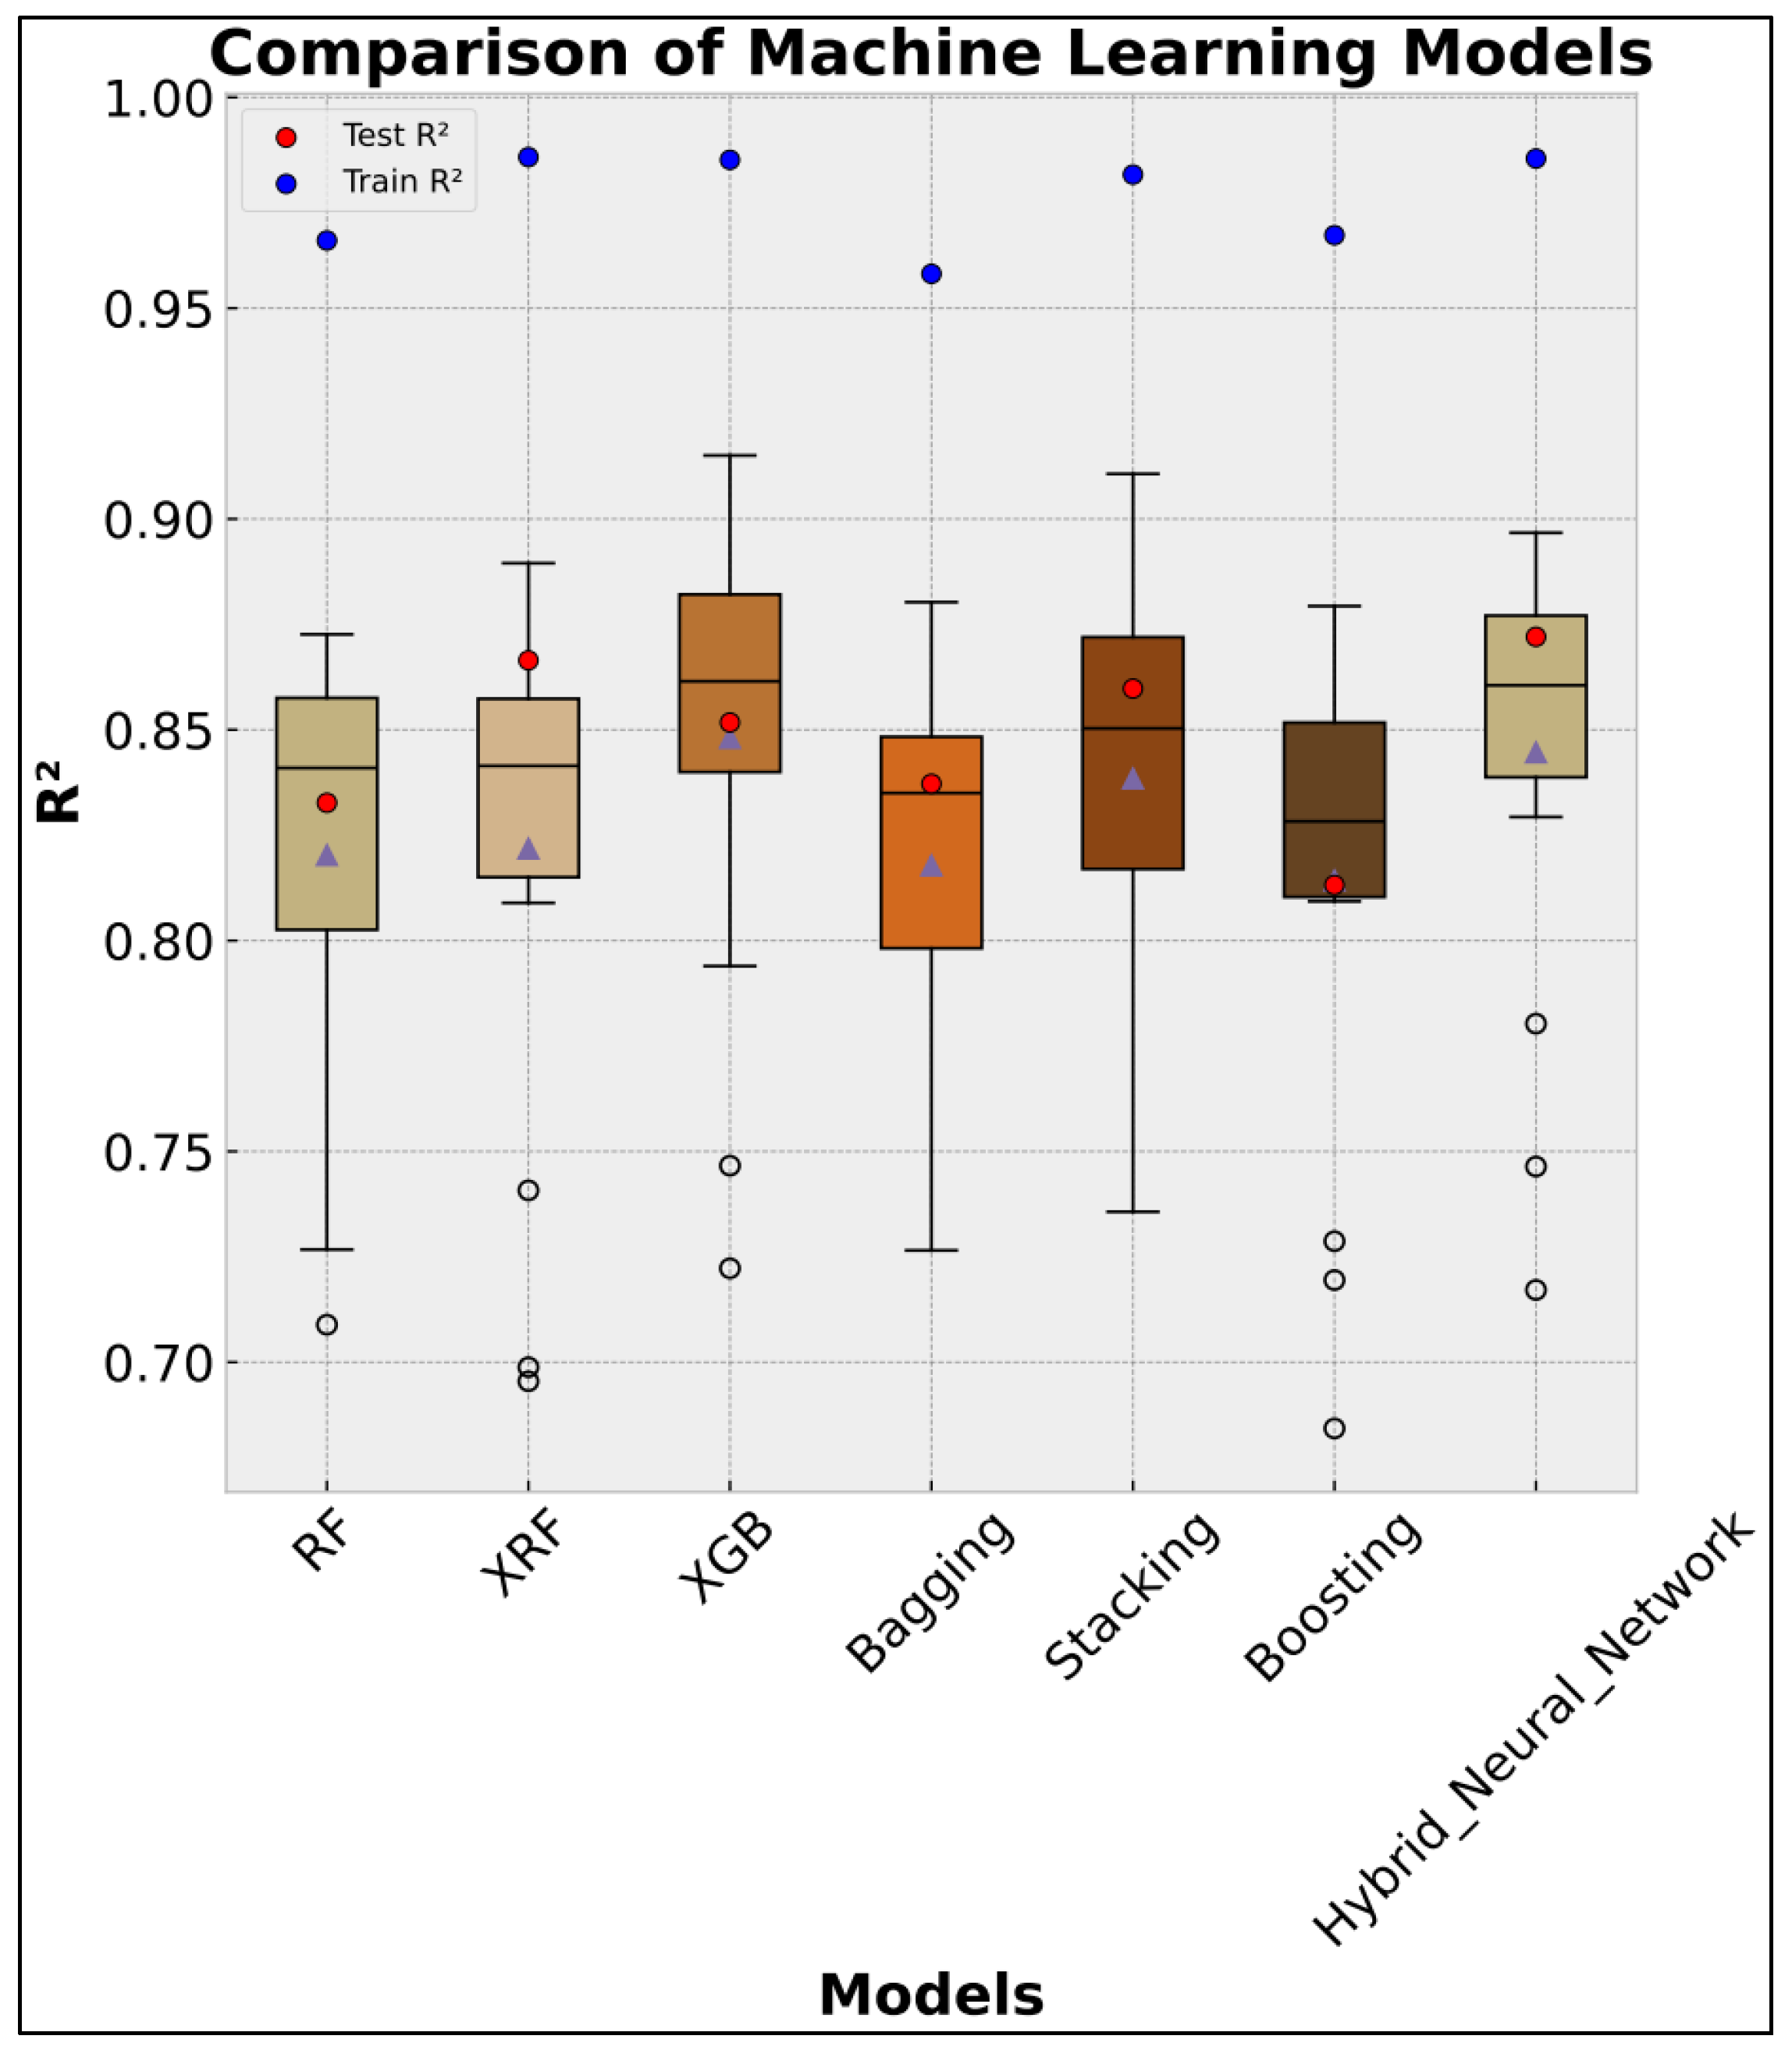
3.1. Performance of the Individual Machine Learning Models

The predictive performance of the individual machine learning (ML) models developed in this study was assessed using a 10-fold cross-validation scheme applied to the training subset. Figure 8 summarizes the performance metrics through box-and-whisker plots, depicting the distribution of the R2 scores across the folds for each model, as well as the R2 values measured on both the training and testing subsets.
The results of the hyperparameter selection for each model by using GridSearh are summarized in Table 7.
Overall, the results demonstrate a wide variability in model performance. Among the models evaluated, RF, XRF, and XGB exhibited superior predictive capabilities, each achieving R2 scores exceeding 0.80 on the testing subset. Specifically, the R2 scores recorded for these models on the testing set were 0.8415 for RF, 0.8432 for XRF, and 0.8563 for XGB, indicating excellent generalization performance. In contrast, the other models—KNN, SVR, Linear LR, and the Feedforward ANN—delivered notably lower R2 scores, with maximum values of 0.5379, 0.3186, 0.0428, and 0.3714, respectively.
Given these findings, only RF, XRF, and XGB were selected for further analysis and integration into subsequent ensemble learning strategies. Figure 9 illustrates the regression plots for these best-performing individual models across the testing subset.
The superior performance of RF, XRF, and XGB can be attributed to their inherent capabilities in modeling nonlinear and multivariate relationships, combined with mechanisms for controlling overfitting—such as bootstrap aggregation, random threshold selection, and gradient-boosting optimization—thereby making them particularly well-suited for capturing the complex behavior of fiber-reinforced UHPC under flexural loadings.

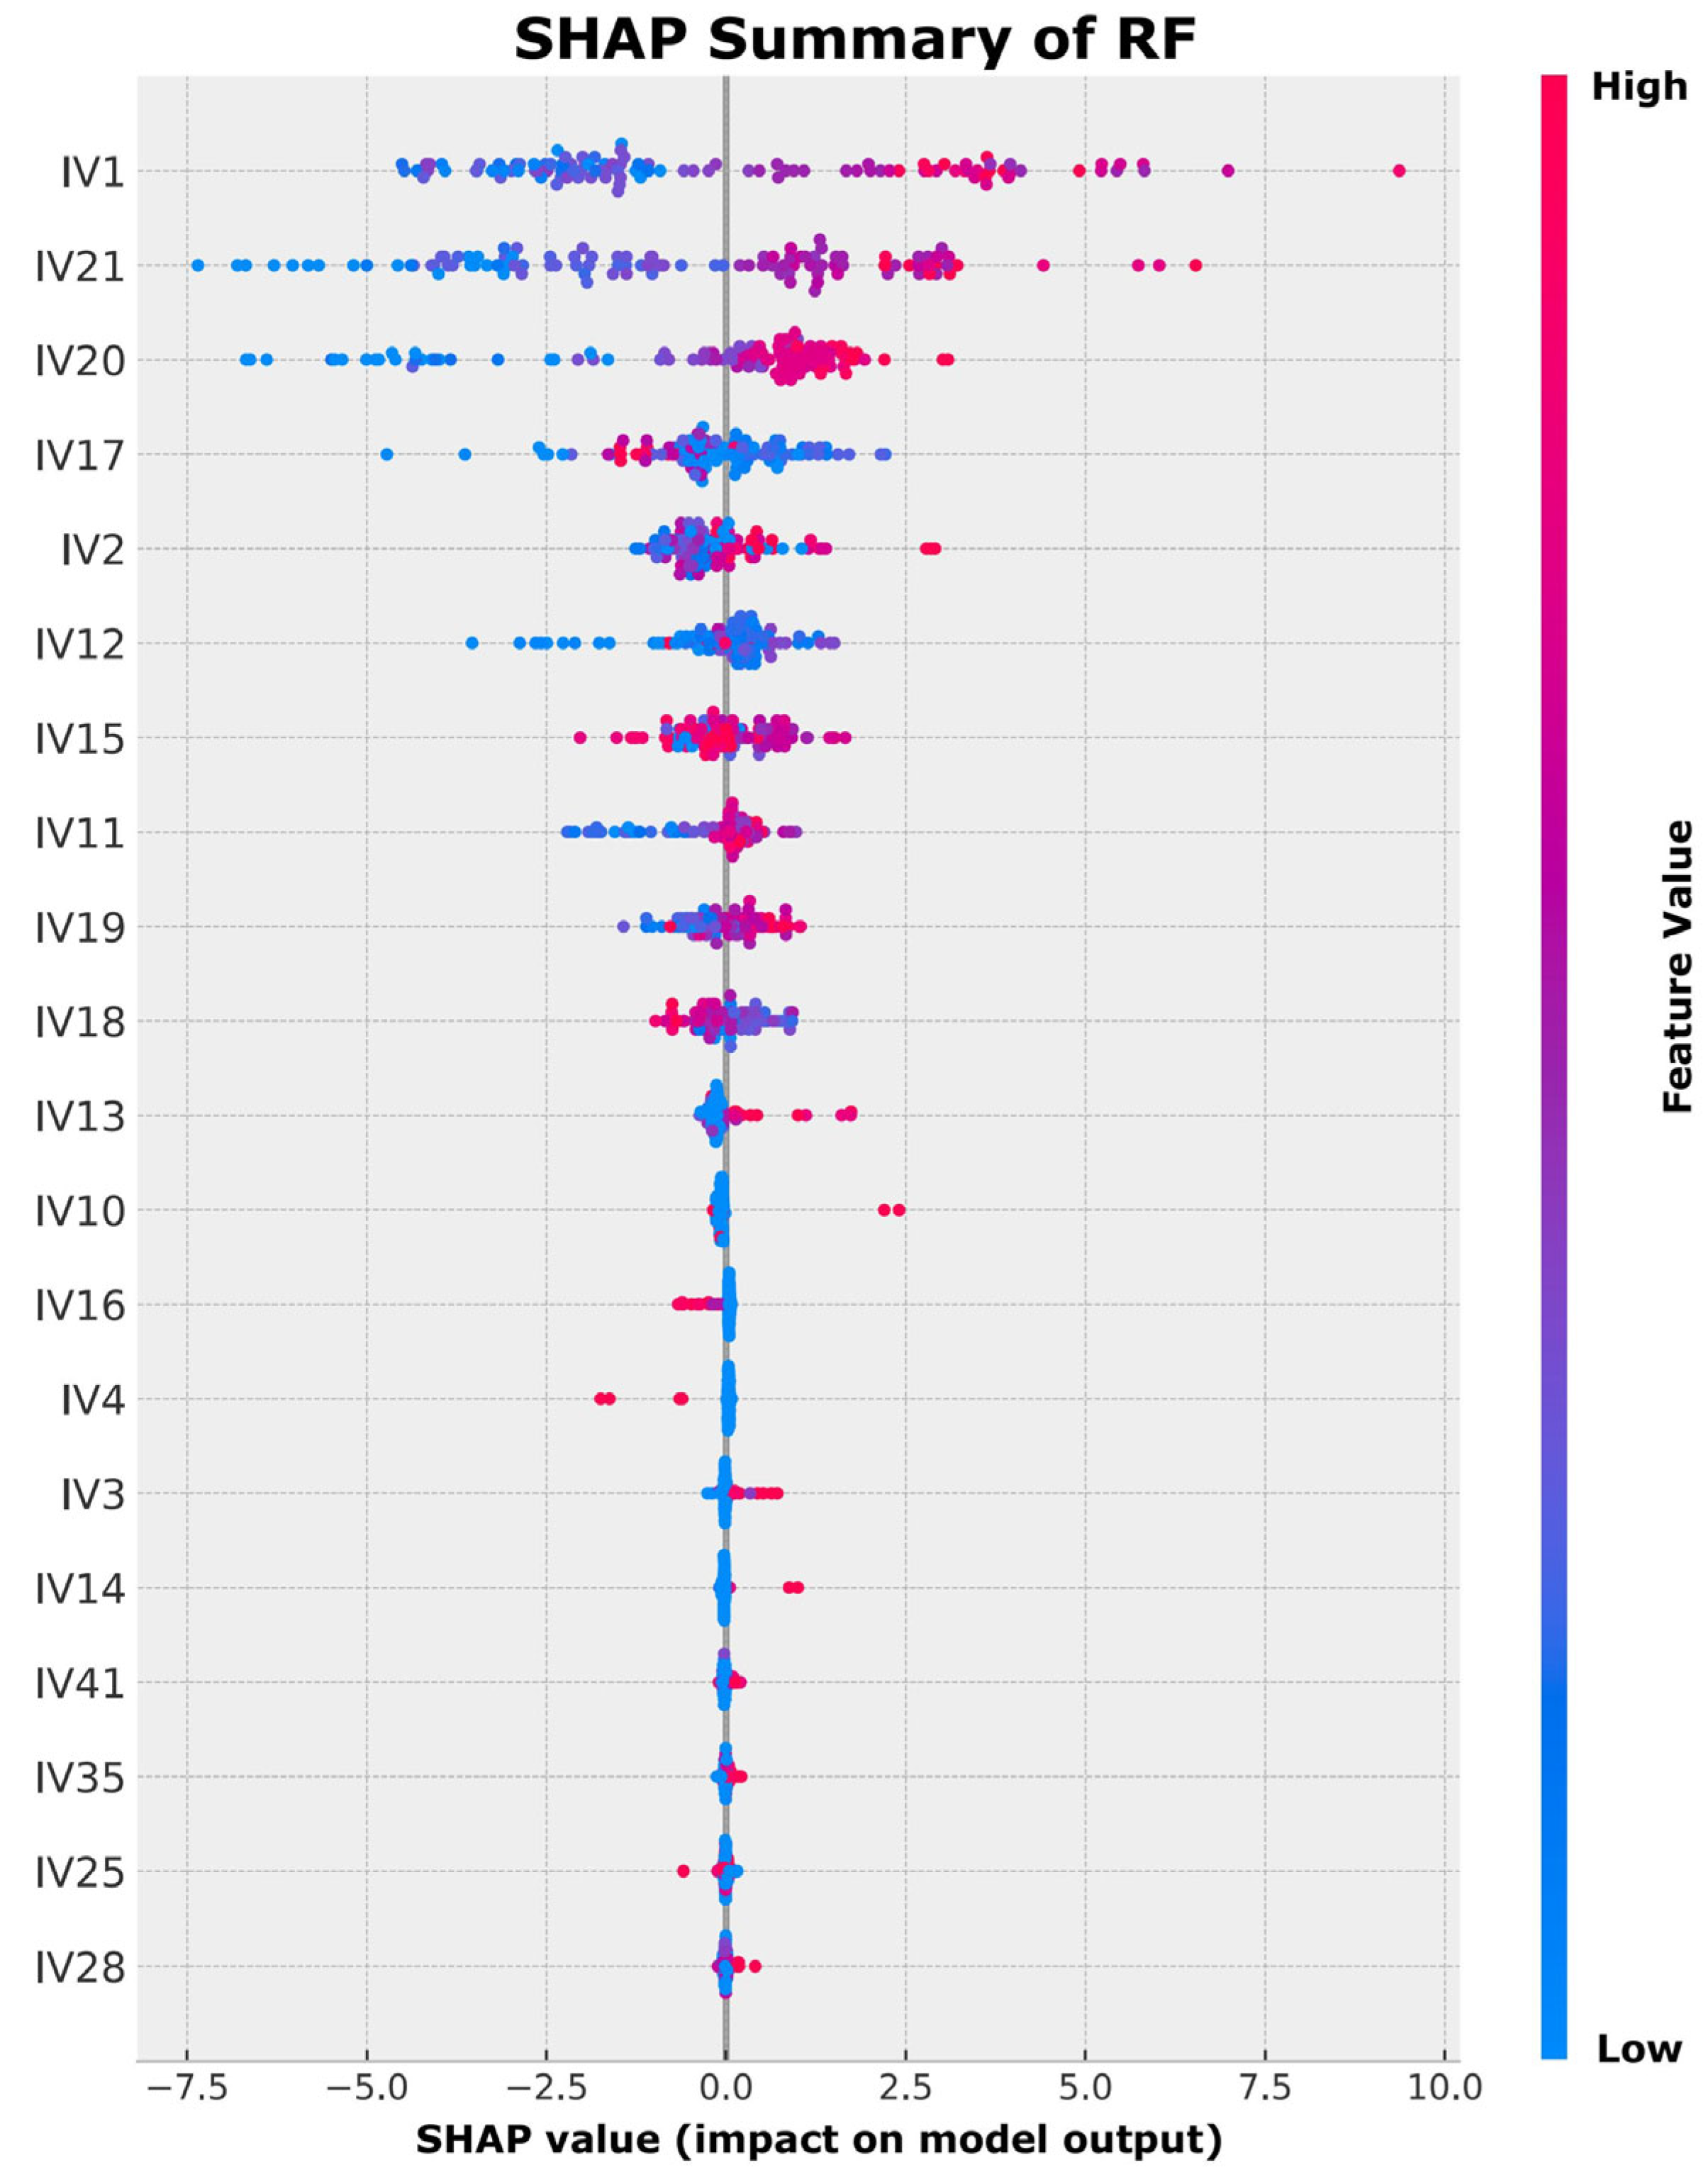
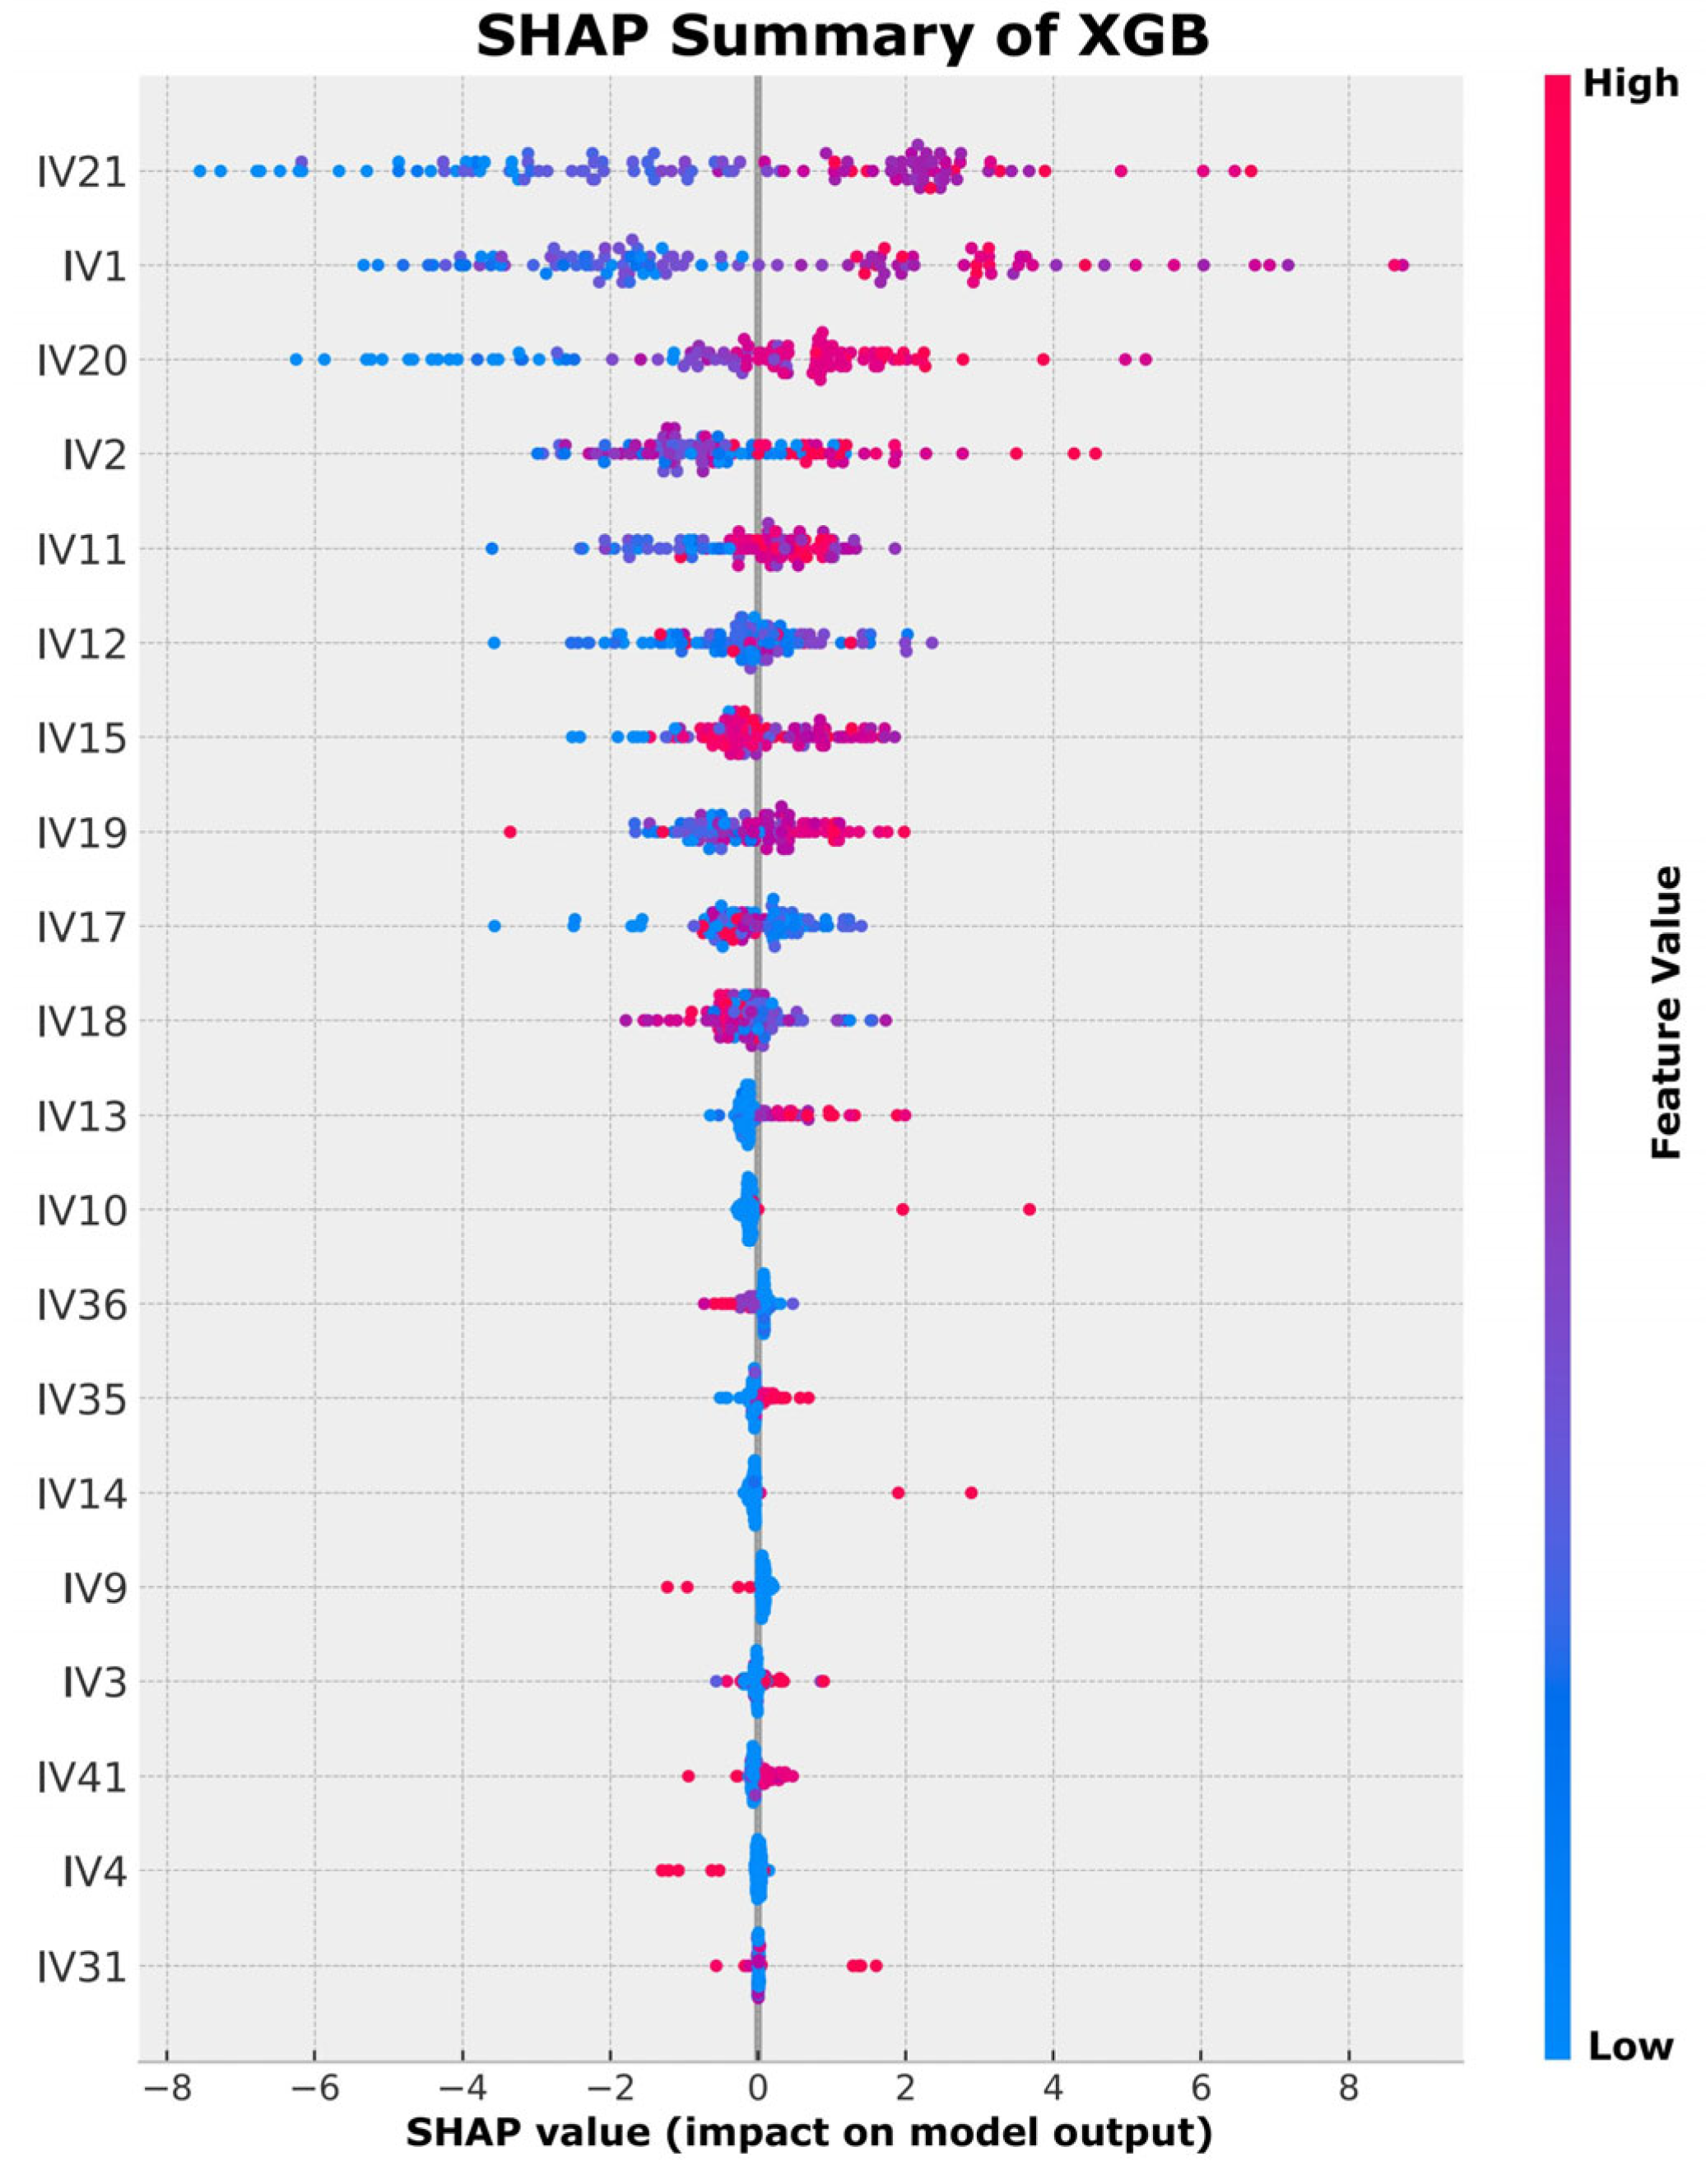
3.2. Feature Importance Analysis Using SHAP

3.2.1. Interpretability of Individual Models via Shapley Additive Explanations

To deepen the understanding of the internal predictive mechanisms of the individual machine learning models prior to ensemble integration, Shapley Additive Explanations (SHAP) analysis was performed on the best-performing individual models. This interpretability technique provides a comprehensive assessment of the contribution of each input feature to the model predictions, allowing for a clearer understanding of the critical variables influencing flexural strength predictions.
Therefore, Figure 10, Figure 11 and Figure 12 present the SHAP summary plots for the RF, (XRF, and XGB models, respectively. In these figures, the top ten most influential variables for each model are highlighted, complemented by brief discussions of additional relevant features.
For the RF model (Figure 10), the most influential variable was the cement content (IV1), exerting a positive contribution to the predicted modulus of rupture (MOR). The fiber factor (IV21) and total fiber volume fraction (IV20) followed closely, both enhancing the model’s output. Maximum aggregate size (IV17) demonstrated a negative influence, whereas the superplasticizer content (IV12) and silica fume dosage (IV2) showed positive effects. Other influential variables included water content (IV11), compressive strength (IV19), sand content (IV15), and notably, a strong negative impact associated with the water-to-binder ratio (IV18).
In the XRF model (Figure 11), total fiber volume (IV20) emerged as the dominant feature, followed by fiber factor (IV21) and cement content (IV1). Coarse aggregate and maximum aggregate size (IV17) were ranked fourth and fifth, with both negatively impacting flexural strength predictions. Silica fume content (IV2), compressive strength (IV19), water-to-binder ratio (IV18), supplementary cementitious materials (IV10), and superplasticizer dosage (IV12) rounded out the top contributors.
For the XGB model (Figure 12), the fiber factor (IV21) again led the feature ranking, followed by cement content (IV1) and total fiber volume (IV20), confirming the consistency observed across models. Silica fume dosage (IV2) and water content (IV11) were also significant contributors. Superplasticizer dosage (IV12), sand content (IV15), compressive strength (IV19), maximum aggregate size (IV17), and water-to-binder ratio (IV18) were included among the most relevant features, with trends largely aligning with those observed for RF and XRF.
An important observation across the models is the limited influence of alternative Supplementary Materials, such as fly ash (IV3), ground granulated blast-furnace slag (IV4), and ground calcium carbonate (IV9). Although in some instances minor positive or negative effects were observed (particularly for IV3), their overall impact on flexural strength was marginal. This finding suggests that the incorporation of these alternative materials—while environmentally beneficial for reducing UHPC’s carbon footprint—does not significantly compromise flexural performance, aligning with recent studies on sustainable UHPC design.

3.2.2. Scientific Pattern of SHAP-Identified Factors

The results displayed in Figure 10, Figure 11 and Figure 12 highlight the relevance of several key input variables in determining the flexural performance of UHPC, which can be scientifically supported through previous experimental and theoretical studies.
The consistent prominence of the fiber reinforcement index (IV21) across the models is explained by its definition, which involves the product of the fiber aspect ratio and its volumetric content [80,81]. This index encapsulates both geometric and quantitative aspects of fiber reinforcement, playing a central role in bridging cracks and improving post-cracking behavior [80,82,83]. Its contribution to the fiber-bridging capacity is well established as a critical factor for energy absorption and flexural strength in fiber-reinforced UHPC [84,85,86,87].
Similarly, the cement content (IV1) serves as the primary source of hydration products in the matrix, producing calcium silicate hydrate (C-S-H) and portlandite upon hydration, both of which are essential to mechanical strength development [88,89,90]. These hydrates interact with pozzolanic materials, such as silica fume, to form additional C-S-H that densifies the matrix and enhances strength.
The positive contribution of silica fume (IV2) aligns with its dual role as a highly reactive pozzolan and micro-filler. Its extremely fine particle size improves particle packing and reduces porosity, while its pozzolanic reaction contributes to additional C-S-H formation, thus strengthening the matrix [88,91]. In addition, silica fume enhances the fiber-matrix bond by improving the interface microstructure, especially when combined with low water content [92,93,94,95].
The influence of total water content (IV11) is more nuanced. While a minimum amount of water is necessary to facilitate hydration and support the development of mechanical properties, excessive water leads to increased porosity, reducing strength and interfacial bonding [94,96,97]. In UHPC, the low water-to-binder ratio typically results in dense microstructures and clogged fiber interfaces, thereby enhancing bonding and load transfer [85,98,99]. Moreover, the water dosage must be carefully balanced with silica fume due to its high specific surface area and water demand [88,100].
The negative impact of the water-to-binder ratio (IV8) can be attributed to its strong correlation with matrix porosity. Higher values increase pore connectivity and reduce the compactness of the matrix, which directly impairs mechanical performance [94,96,97].
Superplasticizer content (IV12) contributes positively to flexural strength by reducing the water requirement in the mix, allowing for low-porosity, high-density matrices without compromising workability [88,101]. This effect supports better fiber dispersion and improves the fiber-matrix bond, both of which enhance flexural behavior.
Compressive strength (IV19) also appears as a relevant factor due to its intrinsic relation to the matrix compactness and cracking resistance. Although an overly rigid matrix may limit ductility, an optimal level of compressive strength is necessary to support the multitrack cracking pattern typical of UHPC [102,103]. Studies have shown that fiber-reinforced composites with moderate matrix strength may display superior fiber-matrix behavior due to more effective crack distribution and energy dissipation [92].
The size of the largest aggregate (IV17) typically has a negative effect on flexural strength. Smaller aggregate sizes contribute to a more homogeneous matrix and a stronger interfacial transition zone (ITZ), both of which improve mechanical performance and fiber anchorage [89,94,104]. In contrast, larger aggregates tend to disrupt fiber distribution and reduce the effective interaction between fibers and the matrix, thereby compromising the load-bearing capacity [84,105,106].
Finally, the total fiber volume (IV20) shows a strong positive influence, as expected. Increasing fiber dosage improves both pre- and post-cracking responses, leading to higher performance of the fiber reinforced cementitious composite [83,84,106].

3.3. Partial-Dependence Analysis

3.3.1. One-Way Partial-Dependence Analysis

As per Figure 10, Figure 11 and Figure 12, Fiber Factor (IV21), Cement Content (IV1), Silica Fume Content (IV2), Maximum Aggregate Size (IV17), Total Fiber Volume (IV20), and Superplasticizer Dosage (IV12)—were noted as the most impactful variables to the prediction of the MOR within the best-performing models.
To better understand how these six variables impact the model output, we conducted and analyzed Partial Dependence Plots (PDPs) for each of the six variables. PDPs also allow for a more visual and interpretable way to illustrate the relationship between single features and the predicted MOR, while still holding the average effect of all other variables constant.
As shown in Figure 13, the flexural strength increases with the cement content, which correlates well with the literature. First, cement serves as the primary source of hydration products in UHPC [101]. Moreover, cement content allows for greater bond properties within the concrete matrix and is able to better distribute loads and increase resistance to bending stresses [107]. However, the graph also shows that the flexural strength decreases with greater than 0.31 m3/m3 cement content, which suggests that the flexural strength decreases due to excessive cement content. There are a few reasons for this pattern. First, when the cement content exceeds a threshold and the water-to-cement ratio is not properly adjusted, the porosity of the cement paste may increase, which consequently reduces the overall strength [108]. Further, higher cement content can alter the micromechanical properties, resulting in lower fracture toughness ratios, which negatively impact the flexural strength [109]. Finally, excess cement can interfere with the proper dispersion and bonding of fibers within the concrete matrix, limiting their effectiveness and contributing to the decrease in strength [110].
For its part, Figure 14 illustrates the influence of silica fume content (IV2) on UHPC flexural performance, showing a clear increase in partial dependence up to an optimal value of approximately 0.093 m3/m3. This trend aligns with prior studies indicating that adequate silica fume additions enhance flexural strength by densifying the matrix, refining pore structure, and improving fiber–matrix interaction [111]. Beyond this point, performance declines as further increases in silica fume content reduce workability and promote agglomeration, which disrupts fiber dispersion and bonding [112]. In addition, the strength loss observed at higher contents can also be attributed to excessive matrix densification, which weakens fiber–matrix adhesion and limits reinforcement effectiveness [113]. Moreover, the resulting poor workability hinders uniform fiber distribution, potentially introducing voids and reducing structural integrity [114]. In addition, high silica fume levels may also promote micro-cracking and increase brittleness, facilitating crack propagation under load [115].
Figure 15 demonstrates a clear nonlinear relationship between superplasticizer content (IV12) and flexural strength. The partial dependence rises until reaching a peak at approximately 0.04 m3/m3, after which performance declines. When added in proper amounts, superplasticizers improve workability and fiber dispersion, promoting a denser and more cohesive matrix that enhances flexural performance [101,116]. However, exceeding the optimal dosage can lead to mix segregation, non-uniform fiber distribution, and stickier-than-desired mixtures, which negatively impact mechanical performance [101,107].
Figure 16 illustrates the relationship between maximum aggregate size (IV17) and flexural strength, showing an initial increase to a peak, followed by a decline and eventual stabilization. This behavior can be attributed to the disruptive effect of larger aggregates on fiber dispersion and orientation. As aggregate size increases, fibers become less effective in bridging cracks due to impaired alignment and reduced interaction with the matrix, ultimately diminishing their reinforcement contribution [117]. In addition, larger particles can limit the effective embedment length of fibers, compromising their mechanical engagement and reducing the overall structural performance of UHPC [118].
Similarly, Figure 17 shows that increasing fiber volume leads to higher flexural strength up to a saturation point. Maximum gains are observed between volume fractions of 0.008 and 0.03, consistent with prior research indicating optimal values around 2–3% of the total mix volume [119]. Within this range, fiber content is sufficient to enhance crack-bridging, cohesion, and stress transfer. Beyond this threshold, the contribution of fibers stabilizes as their alignment and dispersion become less efficient, marking the upper limit of their reinforcing effect [120].
Finally, as shown in Figure 18, the relationship between fiber factor and flexural strength reveals a sharp increase between values of 1.0 and 1.2, peaking near 2.0, followed by a gradual decline. This trend aligns with previous studies indicating that a higher fiber factor—reflecting fiber volume, length, and aspect ratio—enhances crack-bridging, energy dissipation, and post-crack toughness, thereby increasing flexural strength [121]. However, as discussed in the previous paragraph, beyond the optimal range, performance gains taper off or diminish due to fiber agglomeration, increased air entrapment, and reduced workability and alignment [122]. The observed peak around a fiber factor of 2.0 likely marks the threshold before negative side effects—such as poor fiber dispersion and limited contribution to toughness—begin to outweigh the structural benefits. Once this point is exceeded, the reinforcing efficiency declines, explaining the downward trend in the PDP curve [123].

3.3.2. Two-Way Partial-Dependence Analysis

SHAP value analyses (Figure 10, Figure 11 and Figure 12) have consistently identified the global fiber factor (IV21) as the most influential predictor of MOR across the top-performing individual learners, including the Random Forest, Extremely Randomized Trees, and XGBoost models. Given the central role of IV21 in fiber-reinforced cementitious composites—where it governs the balance between fiber dosage, aspect ratio, and dispersion efficiency—its interaction with matrix-related parameters warrants detailed investigation.
To this end, three bivariate PDPs were generated, each pairing IV21 with a key matrix property. These plots, presented in Figure 19, Figure 20 and Figure 21, help elucidate how IV21’s influence on MOR is modulated by specific matrix characteristics. The analysis was conducted using the best-performing model for each variable pairing: RF was used for IV21 × IV17 (maximum aggregate size, μm), XGB for IV21 × IV18 (water-to-binder ratio), and XRF for IV21 × IV19 (matrix compressive strength, MPa).
The first interaction (Figure 19) reveals that smaller aggregate sizes yield higher MOR. This trend is attributed to improved fiber alignment and a higher effective aspect ratio, both of which are disrupted by the presence of larger aggregates. Coarse particles have been shown to weaken the fiber-matrix bond, limiting stress transfer and reducing mechanical efficiency [105]. Furthermore, larger aggregates contribute to heterogeneous fiber dispersion and promote wider, interconnected cracking, thereby diminishing toughness and impairing flexural performance despite the limited impact on compressive strength [117,124].
The second PDP (Figure 20) illustrates how reduced water-to-binder ratios significantly elevate MOR by reinforcing the synergistic effect of higher IV21 values. This enhancement stems from improved fiber-matrix adherence via densified microstructures, reduced pore connectivity, and superior bond-slip behavior at lower w/b ratios, all of which strengthen fiber pull-out resistance and matrix homogeneity [99,125].
The third interaction (Figure 21) highlights a positive monotonic relationship between compressive strength and MOR. As compressive strength rises, so does the matrix’s ability to sustain bridging stresses induced by fibers, thereby allowing IV21 to more effectively contribute to flexural strength. This enhancement is attributed to improved crack-bridging capacity and stress transfer efficiency, as stronger matrices better anchor fibers and sustain post-cracking loads [121,126]. Empirical studies confirm that increases in compressive strength—driven by optimized mix designs or advanced fiber types—can yield disproportionately higher gains in flexural performance, in some cases exceeding 100% improvements [123].
Finally, across all three PDPs, a converging trend is evident: the marginal benefit of increasing IV21 begins to diminish as it approaches values between approximately 1.8 and 2.0. This phenomenon is consistent with reports indicating that excessive fiber volumes (i.e., values of fiber factor around 2) may lead to reduced ductility and the onset of brittle failure mechanisms, undermining the deformation capacity of UHPC [127,128]. Additionally, higher fiber contents can disrupt uniform distribution and orientation, inducing anisotropic responses that compromise UHPC’s performance [129].

3.4. Ensemble Learning Results

To enhance the predictive performance beyond that achieved by individual machine learning (ML) models, several ensemble learning techniques were employed and evaluated, namely Bagging, Stacking, Boosting, and the Hybrid Neural Network approach. The results are summarized in Figure 22, which presents the R2 scores obtained for each ensemble method on the testing dataset. Each box-and-whisker plot depicts the distribution of fold-wise R2 values: the central line marks the median, the box spans the interquartile range, and the whiskers extend to 1.5 × IQR. The colored triangle within each box indicates the mean R2 across the ten folds, providing a complementary measure of central tendency, while the white circles beyond the whiskers denote outlier fold scores that exceed the ±1.5 × IQR threshold. As can be appreciated, Bagging achieved an R2 of 0.848, demonstrating an improvement over the best individual models by reducing variance through the aggregation of multiple predictors. Stacking outperformed Bagging, reaching an R2 of 0.868, highlighting the advantage of combining heterogeneous base models through a meta-model that optimally integrates their outputs. Boosting, while improving bias correction through sequential training, achieved a slightly lower R2 of 0.814 compared to Bagging and Stacking.
The best overall performance was achieved by the Hybrid Neural Network, which reached an R2 value of 0.872 on the testing subset. This model was designed to combine both the original 41 input variables and the predictions from the three best-performing individual models—Random Forest (RF), Extremely Randomized Forest (XRF), and XGBoost (XGB)—thus incorporating a total of 44 input features. The architecture of the Hybrid Neural Network, shown schematically in Figure 23, includes two hidden layers: the first with 19 neurons and the second with 7 neurons, each utilizing nonlinear activation functions to enhance feature interaction and representation learning.
The predictive capacity of the Hybrid Neural Network is illustrated in Figure 24 through regression plots comparing the predicted versus actual values for the testing subset. These results confirm that the Hybrid Neural Network offers superior generalization capabilities, outperforming both individual and traditional ensemble models in accurately capturing the complex relationships governing the flexural behavior of fiber-reinforced UHPC.
In addition, Table 8 presents a comparative analysis between the top-performing individual models and the hybrid model. This evaluation, conducted on the test dataset, includes key performance indicators such as the Mean Absolute Error (MAE), Root Mean Squared Error (RMSE), and the coefficient of determination (R2)
As shown in Table 8, the hybrid model outperforms the individual models across all three metrics. It achieves the highest coefficient of determination (R2 = 0.872), indicating better predictive accuracy, while also yielding the lowest MAE (1.8597) and RMSE (3.1315), reflecting reduced prediction error on the test set.

3.5. Experimental Validation of the Developed Models

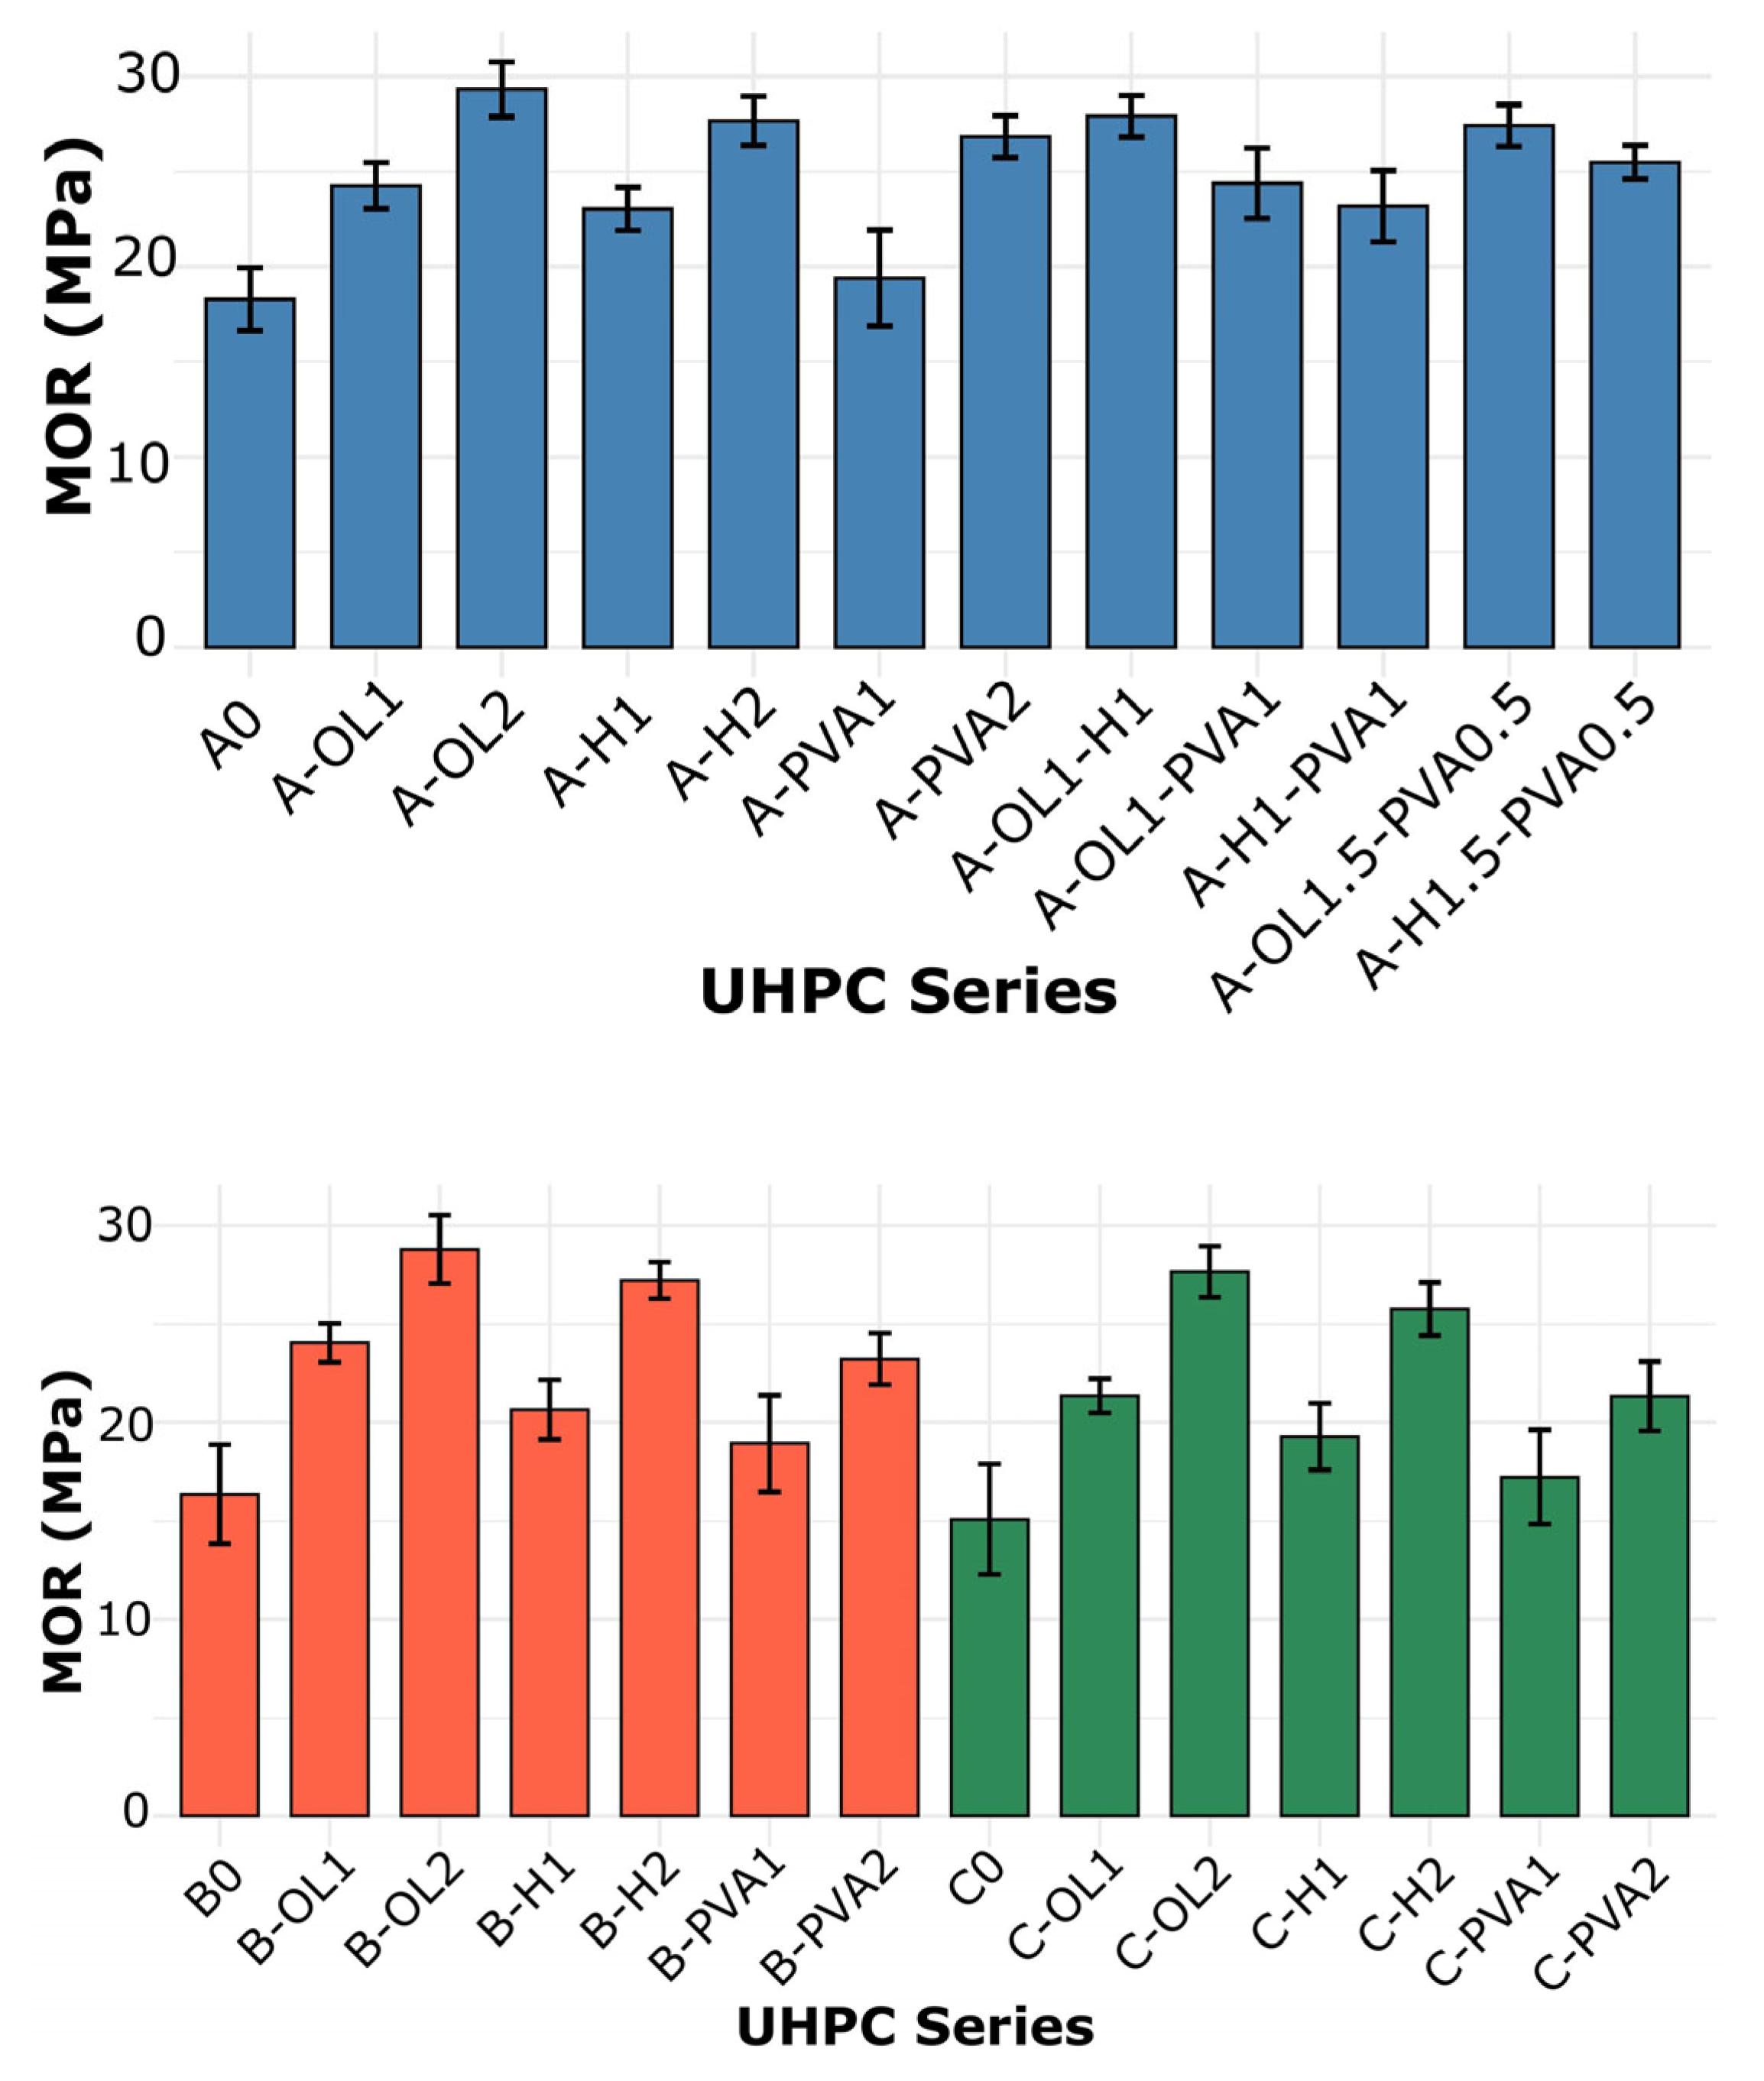
3.5.1. Experimental Findings

To provide an external validation of the developed predictive models, an experimental campaign was conducted involving 26 different UHPC mixtures featuring variations in matrix composition, fiber content, and hybrid reinforcement strategies. The MOR results obtained from these tests are summarized in Figure 25.
The experimental program covered a wide range of flexural strengths, reflecting the influence of key design parameters previously highlighted through SHAP analysis. As identified in the feature importance analysis, variables such as cement content, fiber factor, total fiber volume, water-to-binder ratio, and maximum aggregate size exhibited strong impacts on flexural performance predictions. The experimental results confirmed these trends: higher MOR values were generally associated with increased cement content, optimized fiber reinforcement (both in type and volume fraction), and lower water-to-binder ratios, while mixtures with larger maximum aggregate sizes tended to exhibit reduced flexural performance. In this sense, Figure 25 reveals that, for the same fiber reinforcement system, UHPC-matrix type A outperforms type B and C. On the other hand, for the same UHPC-matrix type, fiber dosage is a dominant feature.
Furthermore, the limited influence of supplementary cementitious materials such as fly ash, ground glass powder, and calcium carbonate—previously noted in the SHAP interpretation—was corroborated by the experimental data, where variations in these components produced relatively minor shifts in MOR values.
Overall, the experimental findings validate the predictive insights obtained from the machine learning models and the SHAP-based feature analysis, confirming the relevance of the selected variables in governing the flexural behavior of fiber-reinforced UHPC

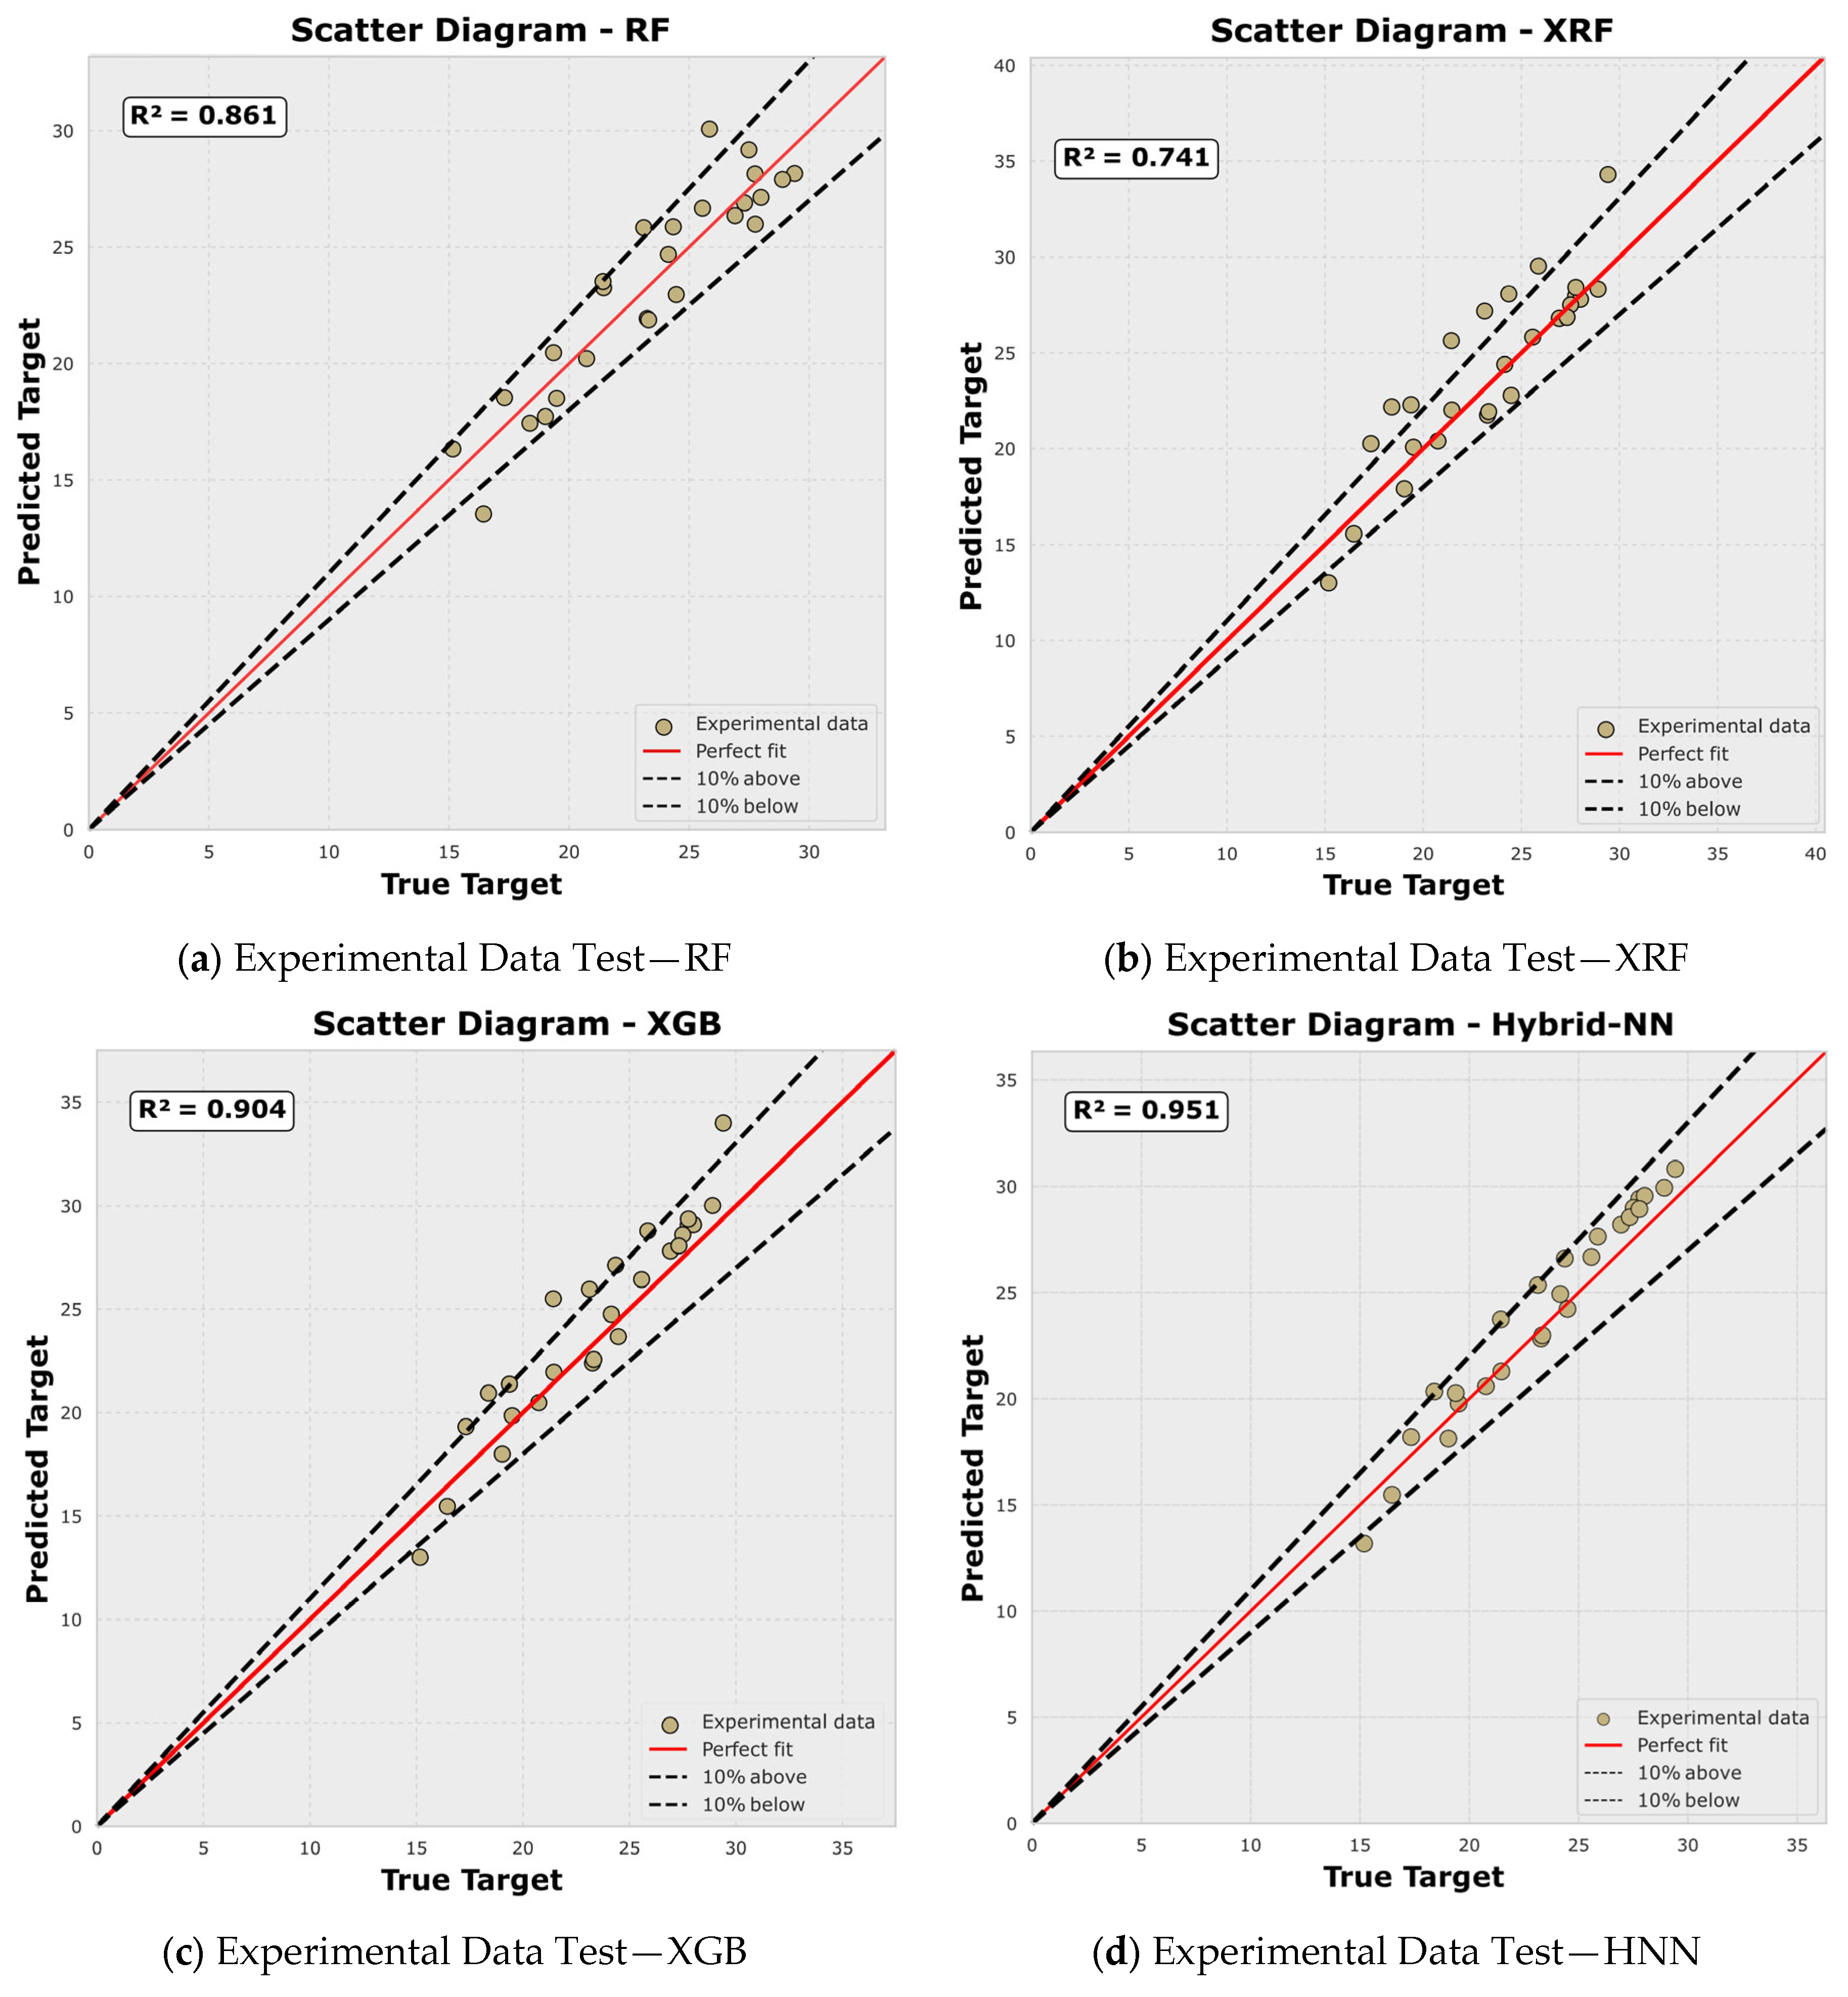
3.5.2. Machine Learning Evaluation by Means of the Experimental Findings

The predictive capabilities of the selected machine learning models—i.e., RF, XRF, XGB, and the Hybrid Neural Network—were further evaluated using the experimental dataset. Figure 26 presents regression plots comparing the predicted versus measured flexural strength values (MOR) for each model, with the dashed line representing perfect agreement between predictions and experimental results. In addition, Table 9 presents additional metrics (i.e., MAE and RMSE) measured on the experimental data for the individual best-performing models and the hybrid one as well.
Among the individual models, XGB exhibited the best performance with an R2 value of 0.904, closely approximating the experimental measurements. The RF model followed with an R2 of 0.861, indicating good predictive accuracy but with slightly greater dispersion, particularly at higher MOR values. In contrast, the XRF model showed a markedly lower R2 of 0.741, reflecting a weaker ability to capture the true flexural behavior across the entire range of data.
The Hybrid Neural Network achieved the highest predictive performance, with an R2 of 0.951, demonstrating excellent alignment between predicted and actual MOR values. The close clustering of data points around the ideal prediction line in Figure 24 highlights the robustness and enhanced generalization capability of the hybrid approach.
These findings confirm that combining individual model predictions with the original feature set through a hybrid neural network framework significantly improves predictive accuracy, offering a powerful and reliable tool for modeling the complex flexural behavior of fiber-reinforced UHPC materials.

4. Conclusions

This study developed and validated a machine learning-based framework to predict the flexural behavior of fiber-reinforced UHPC, addressing the inherent complexity arising from the interactions among constituent materials, fiber reinforcements, and matrix characteristics. Key findings can be summarized as follows:
(1)
Among the evaluated models, Random Forest (RF), Extremely Randomized Forest (XRF), and XGBoost (XGB) demonstrated superior predictive capabilities, each achieving R2 scores above 0.80 on the testing subset, significantly outperforming traditional models such as Linear Regression, K-Nearest Neighbors, Support Vector Regression, and conventional Artificial Neural Networks.
(2)
SHAP-based interpretability highlighted cement content, fiber factor, total fiber volume fraction, silica fume dosage, water-to-binder ratio, and maximum aggregate size as the dominant parameters influencing flexural strength. These insights were scientifically consistent with the current understanding of UHPC material behavior.
(3)
The application of ensemble methods further enhanced predictive performance. While Bagging, Stacking, and Boosting showed notable improvements, the Hybrid Neural Network model achieved the highest predictive accuracy with an R2 of 0.872, outperforming all other approaches on the testing dataset.
(4)
An independent experimental campaign involving 26 novel UHPC mixtures confirmed the robustness of the developed models. The Hybrid Neural Network again provided the best performance, achieving an R2 of 0.951 against the experimental results, thereby demonstrating exceptional generalization capability and reliability.
(5)
The experimental findings, aligned with SHAP interpretations, confirmed that the incorporation of supplementary cementitious materials such as fly ash, recycled glass powder, and calcium carbonate marginally impacted flexural strength, supporting the potential for sustainable UHPC mix designs without compromising mechanical performance.
(6)
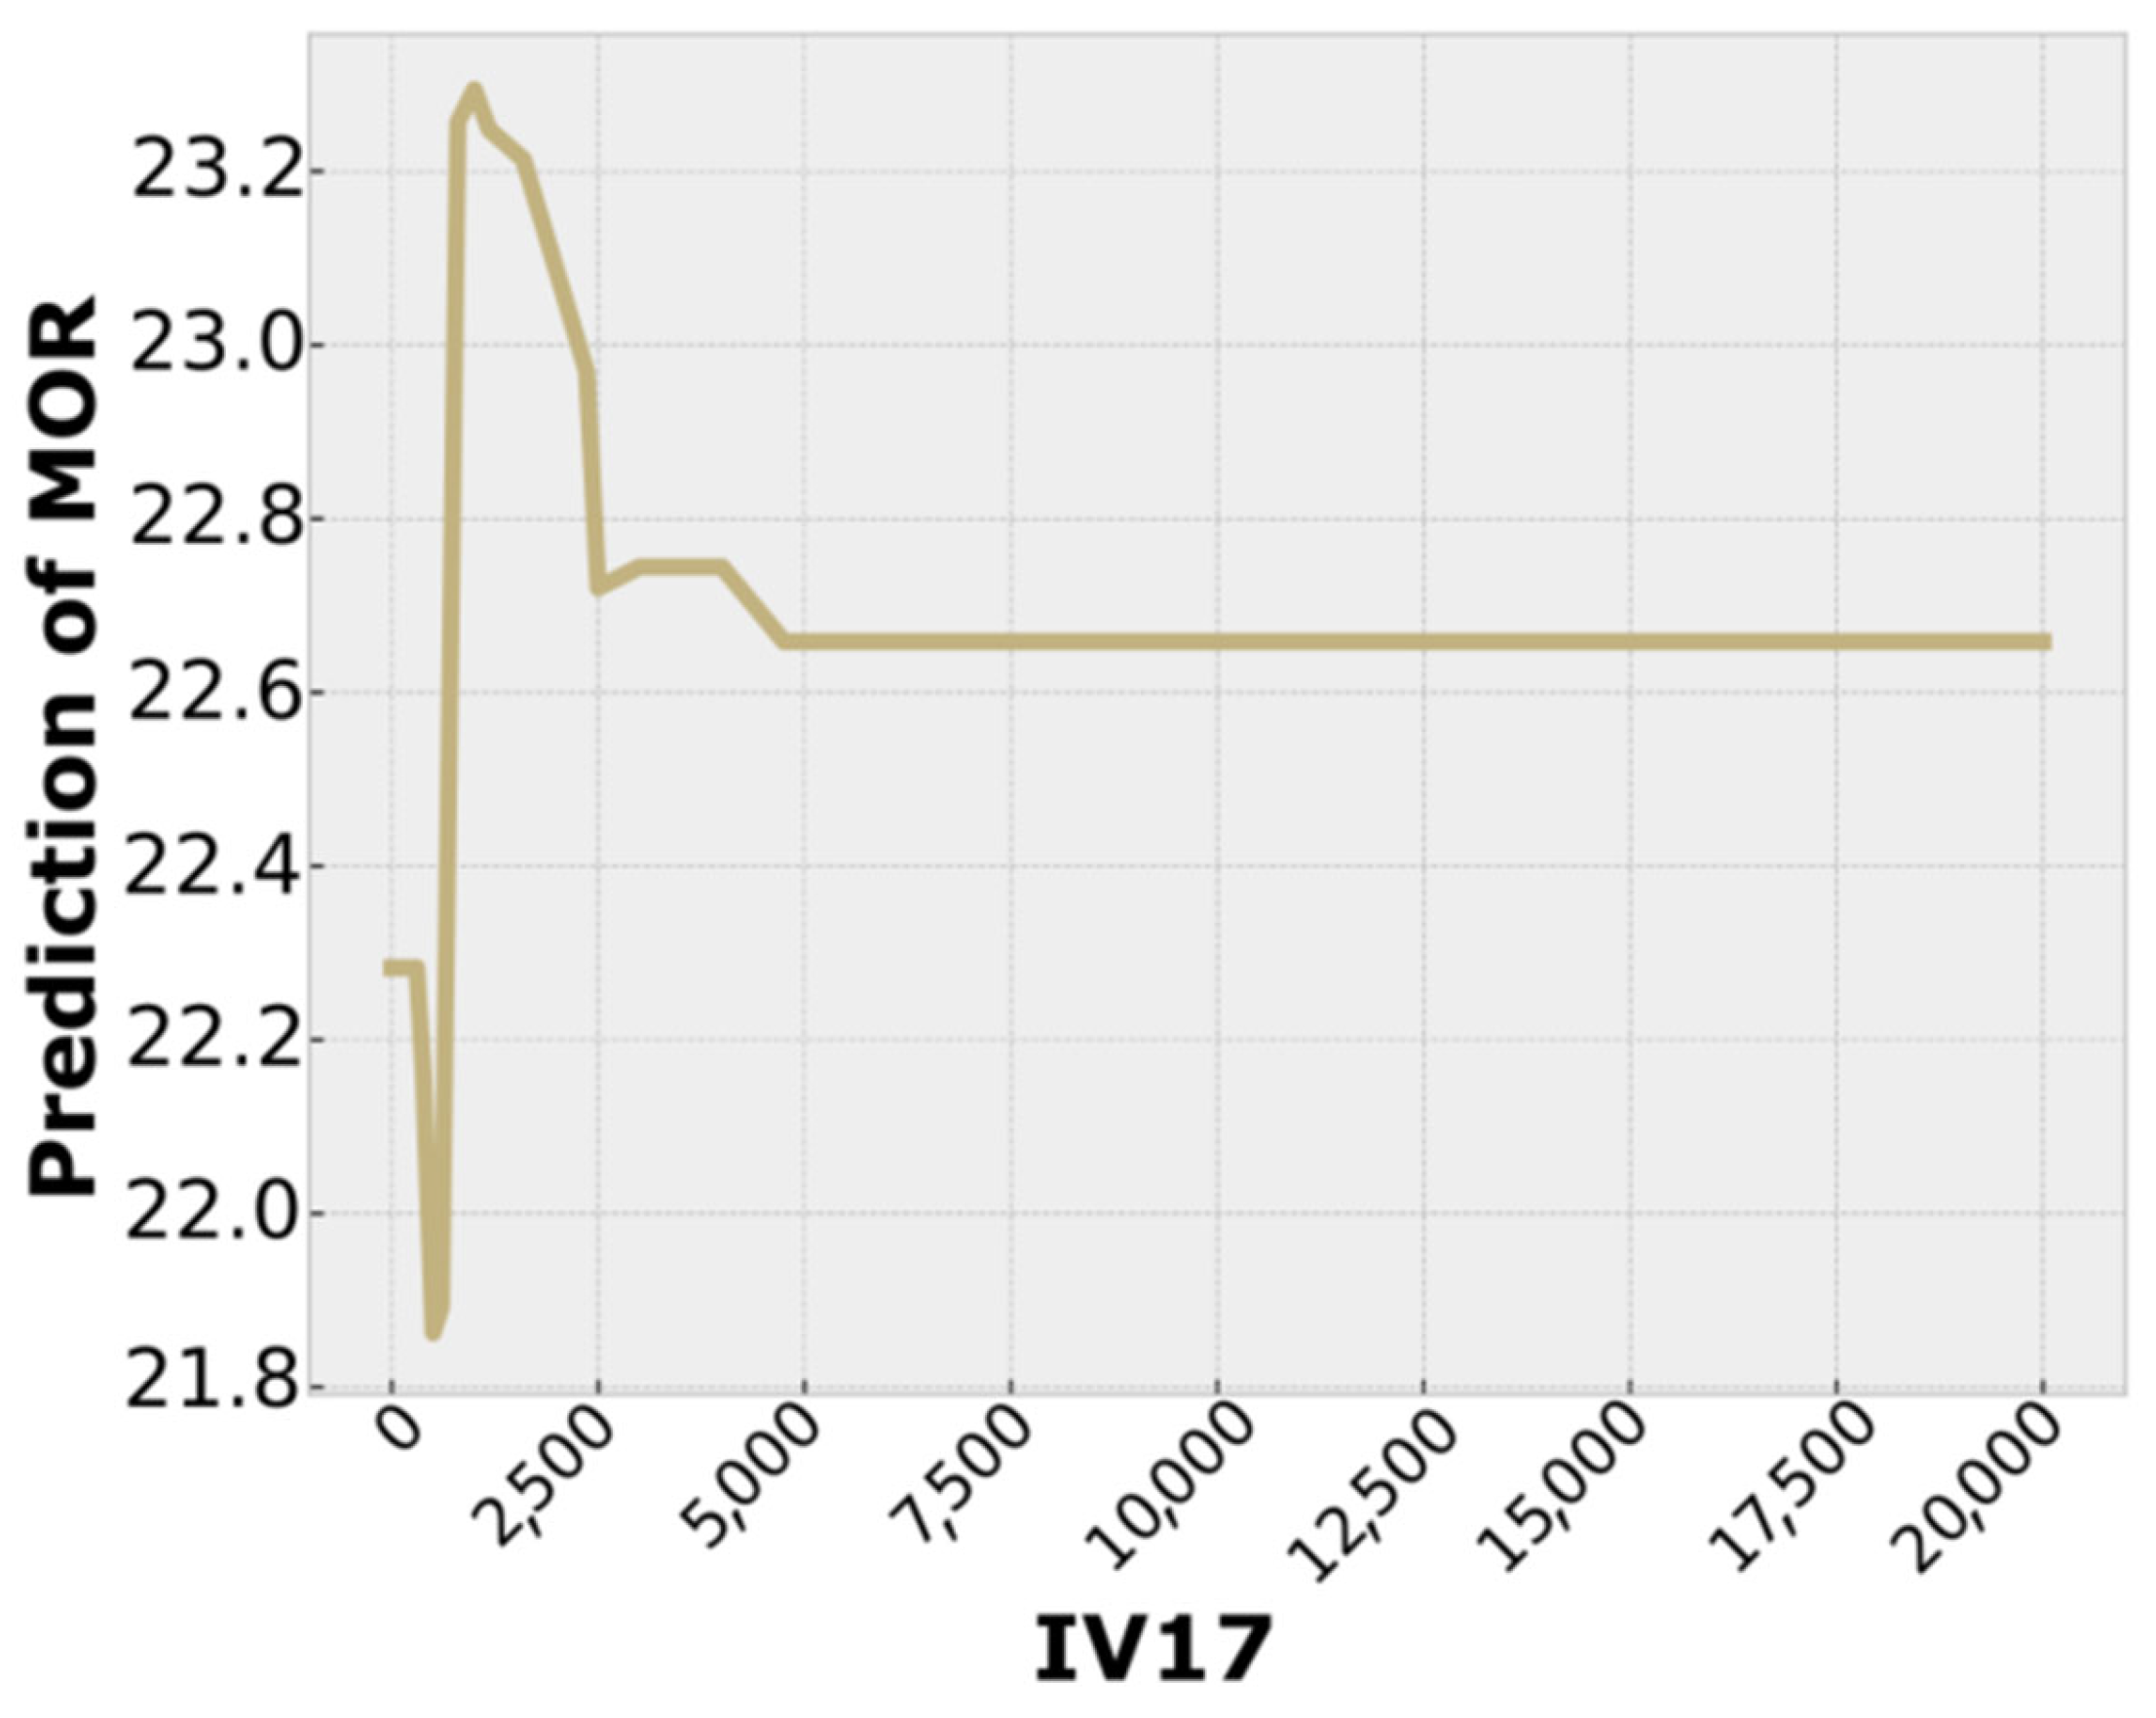
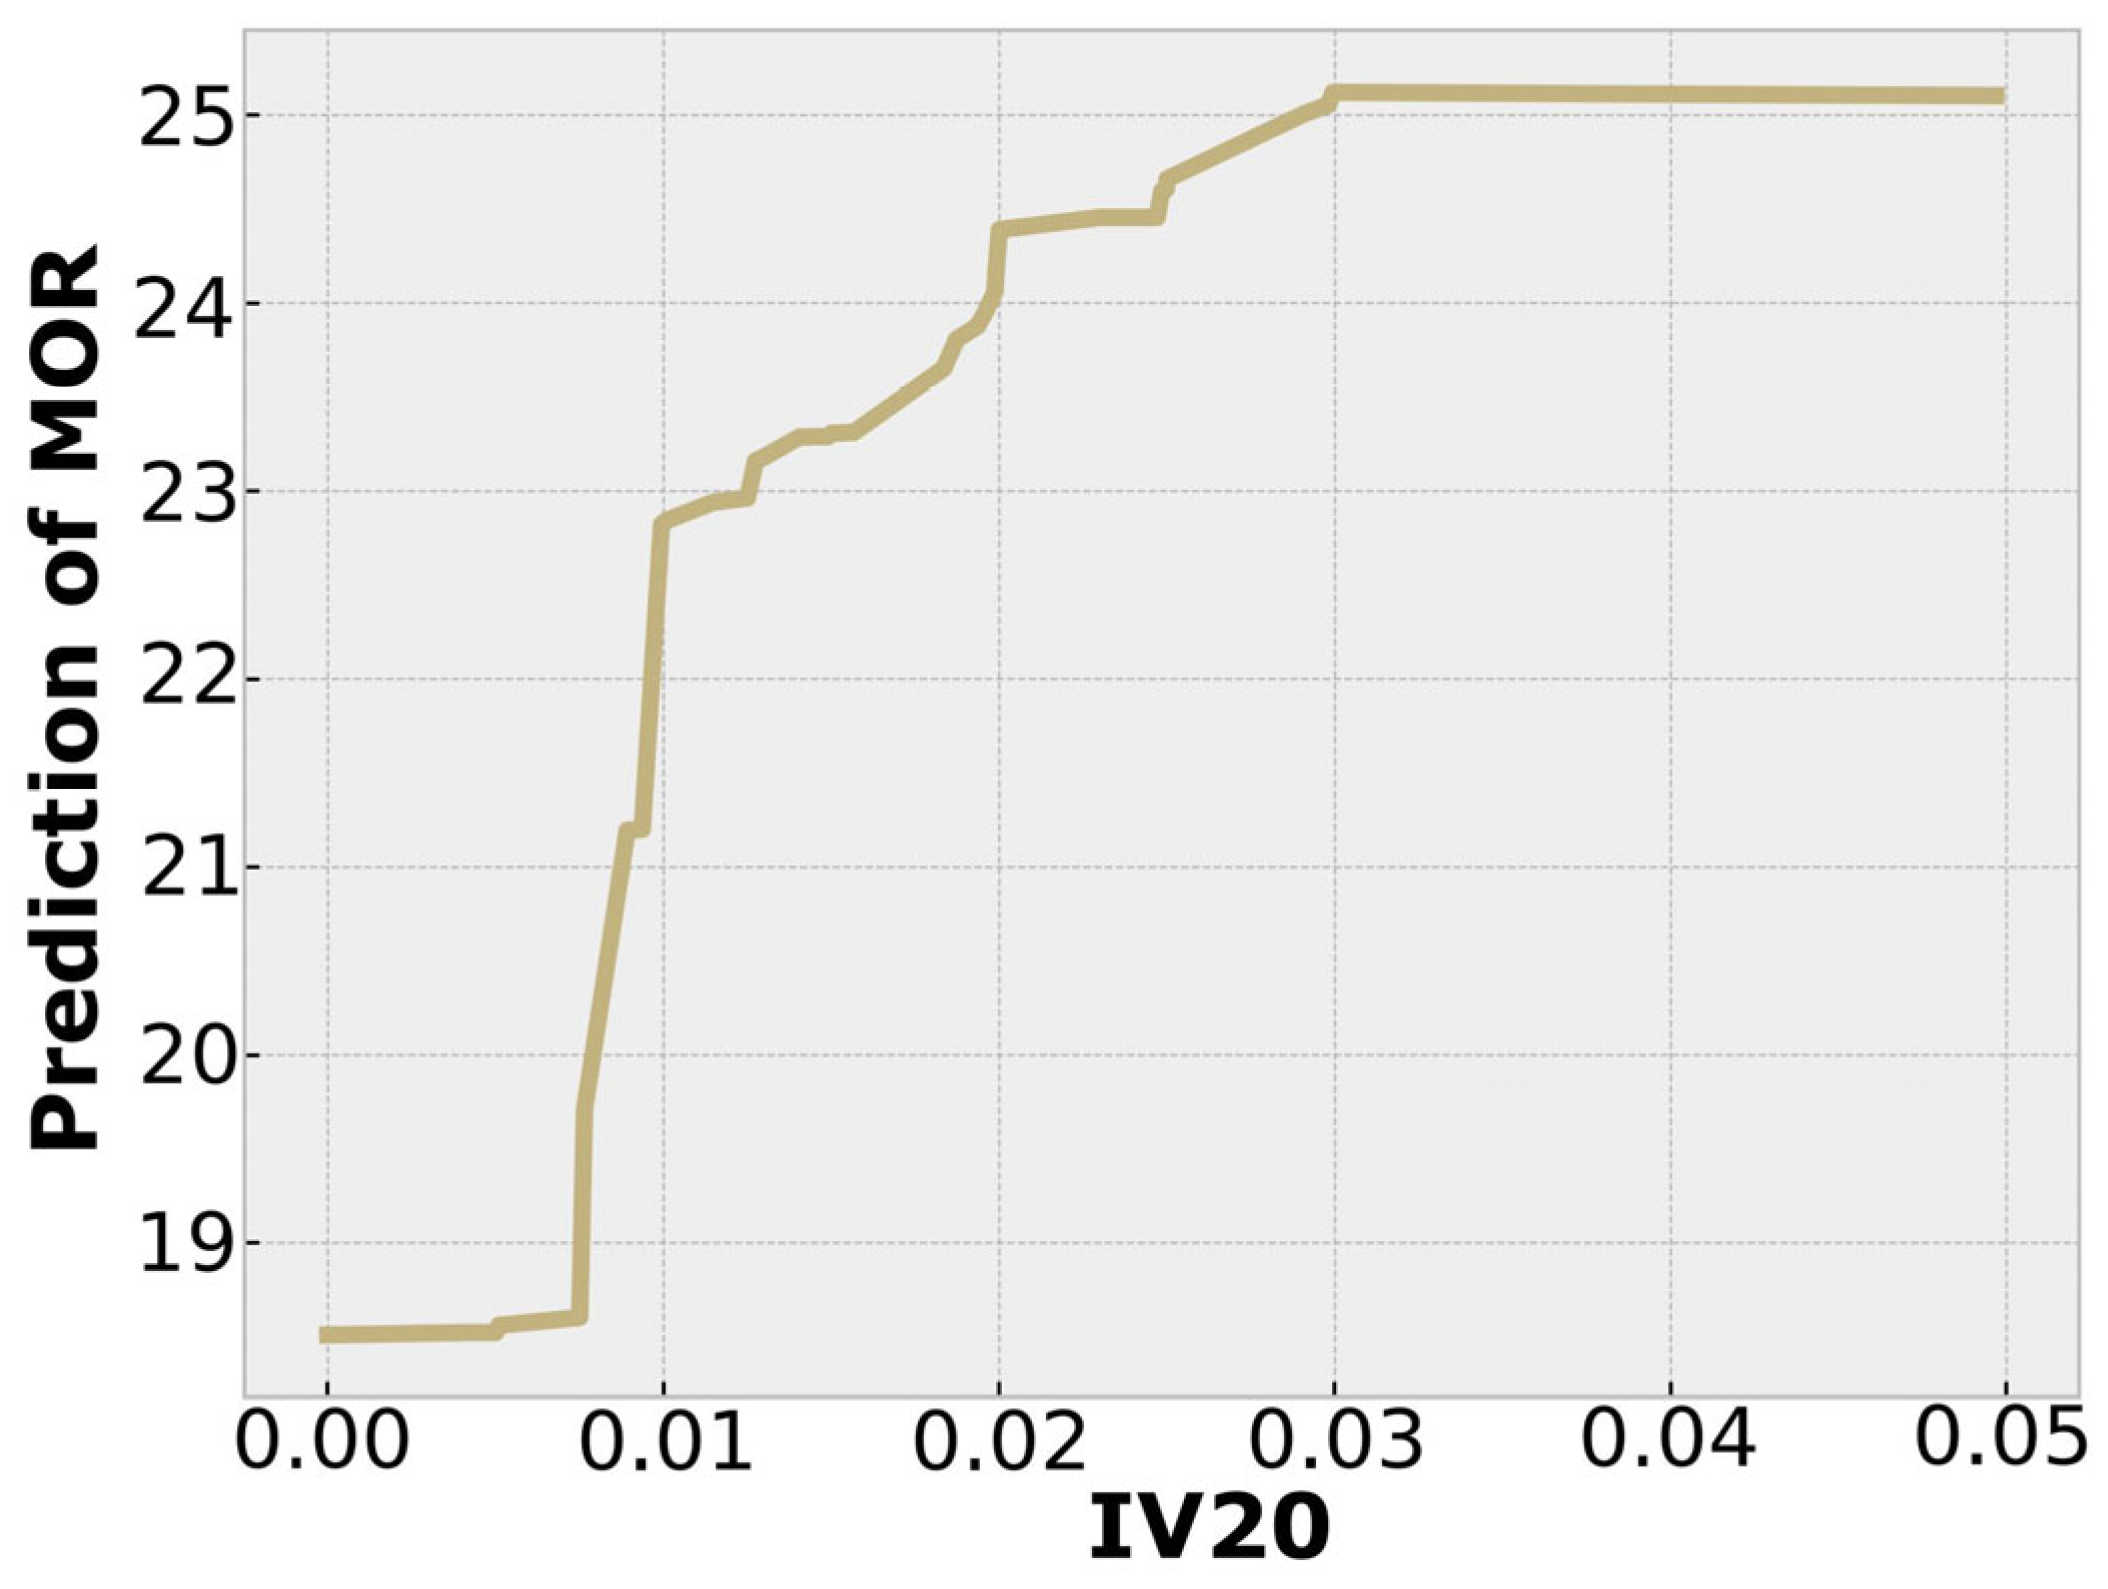
A detailed one-way Partial Dependence Plot (PDP) analysis was conducted on six key variables—cement content, silica fume content, superplasticizer dosage, maximum aggregate size, fiber volume fraction, and fiber factor. Each variable exhibited a characteristic nonlinear effect: cement and silica fume improved strength up to optimal dosages (~0.27 m3/m3 and ~0.093 m3/m3, respectively), beyond which negative effects such as porosity and agglomeration could emerge. Superplasticizer content showed benefits up to ~0.04 m3/m3 but declined thereafter possibly due to porosity and hydration interference. Coarse aggregate size negatively impacted MOR, which could be ascribed to poor fiber dispersion and orientation, reducing effectiveness. Fiber volume and fiber factor enhanced flexural strength up to ~3% and ~2, respectively, before plateauing or declining what can be explained by due to poor dispersion and fiber clustering.
(7)
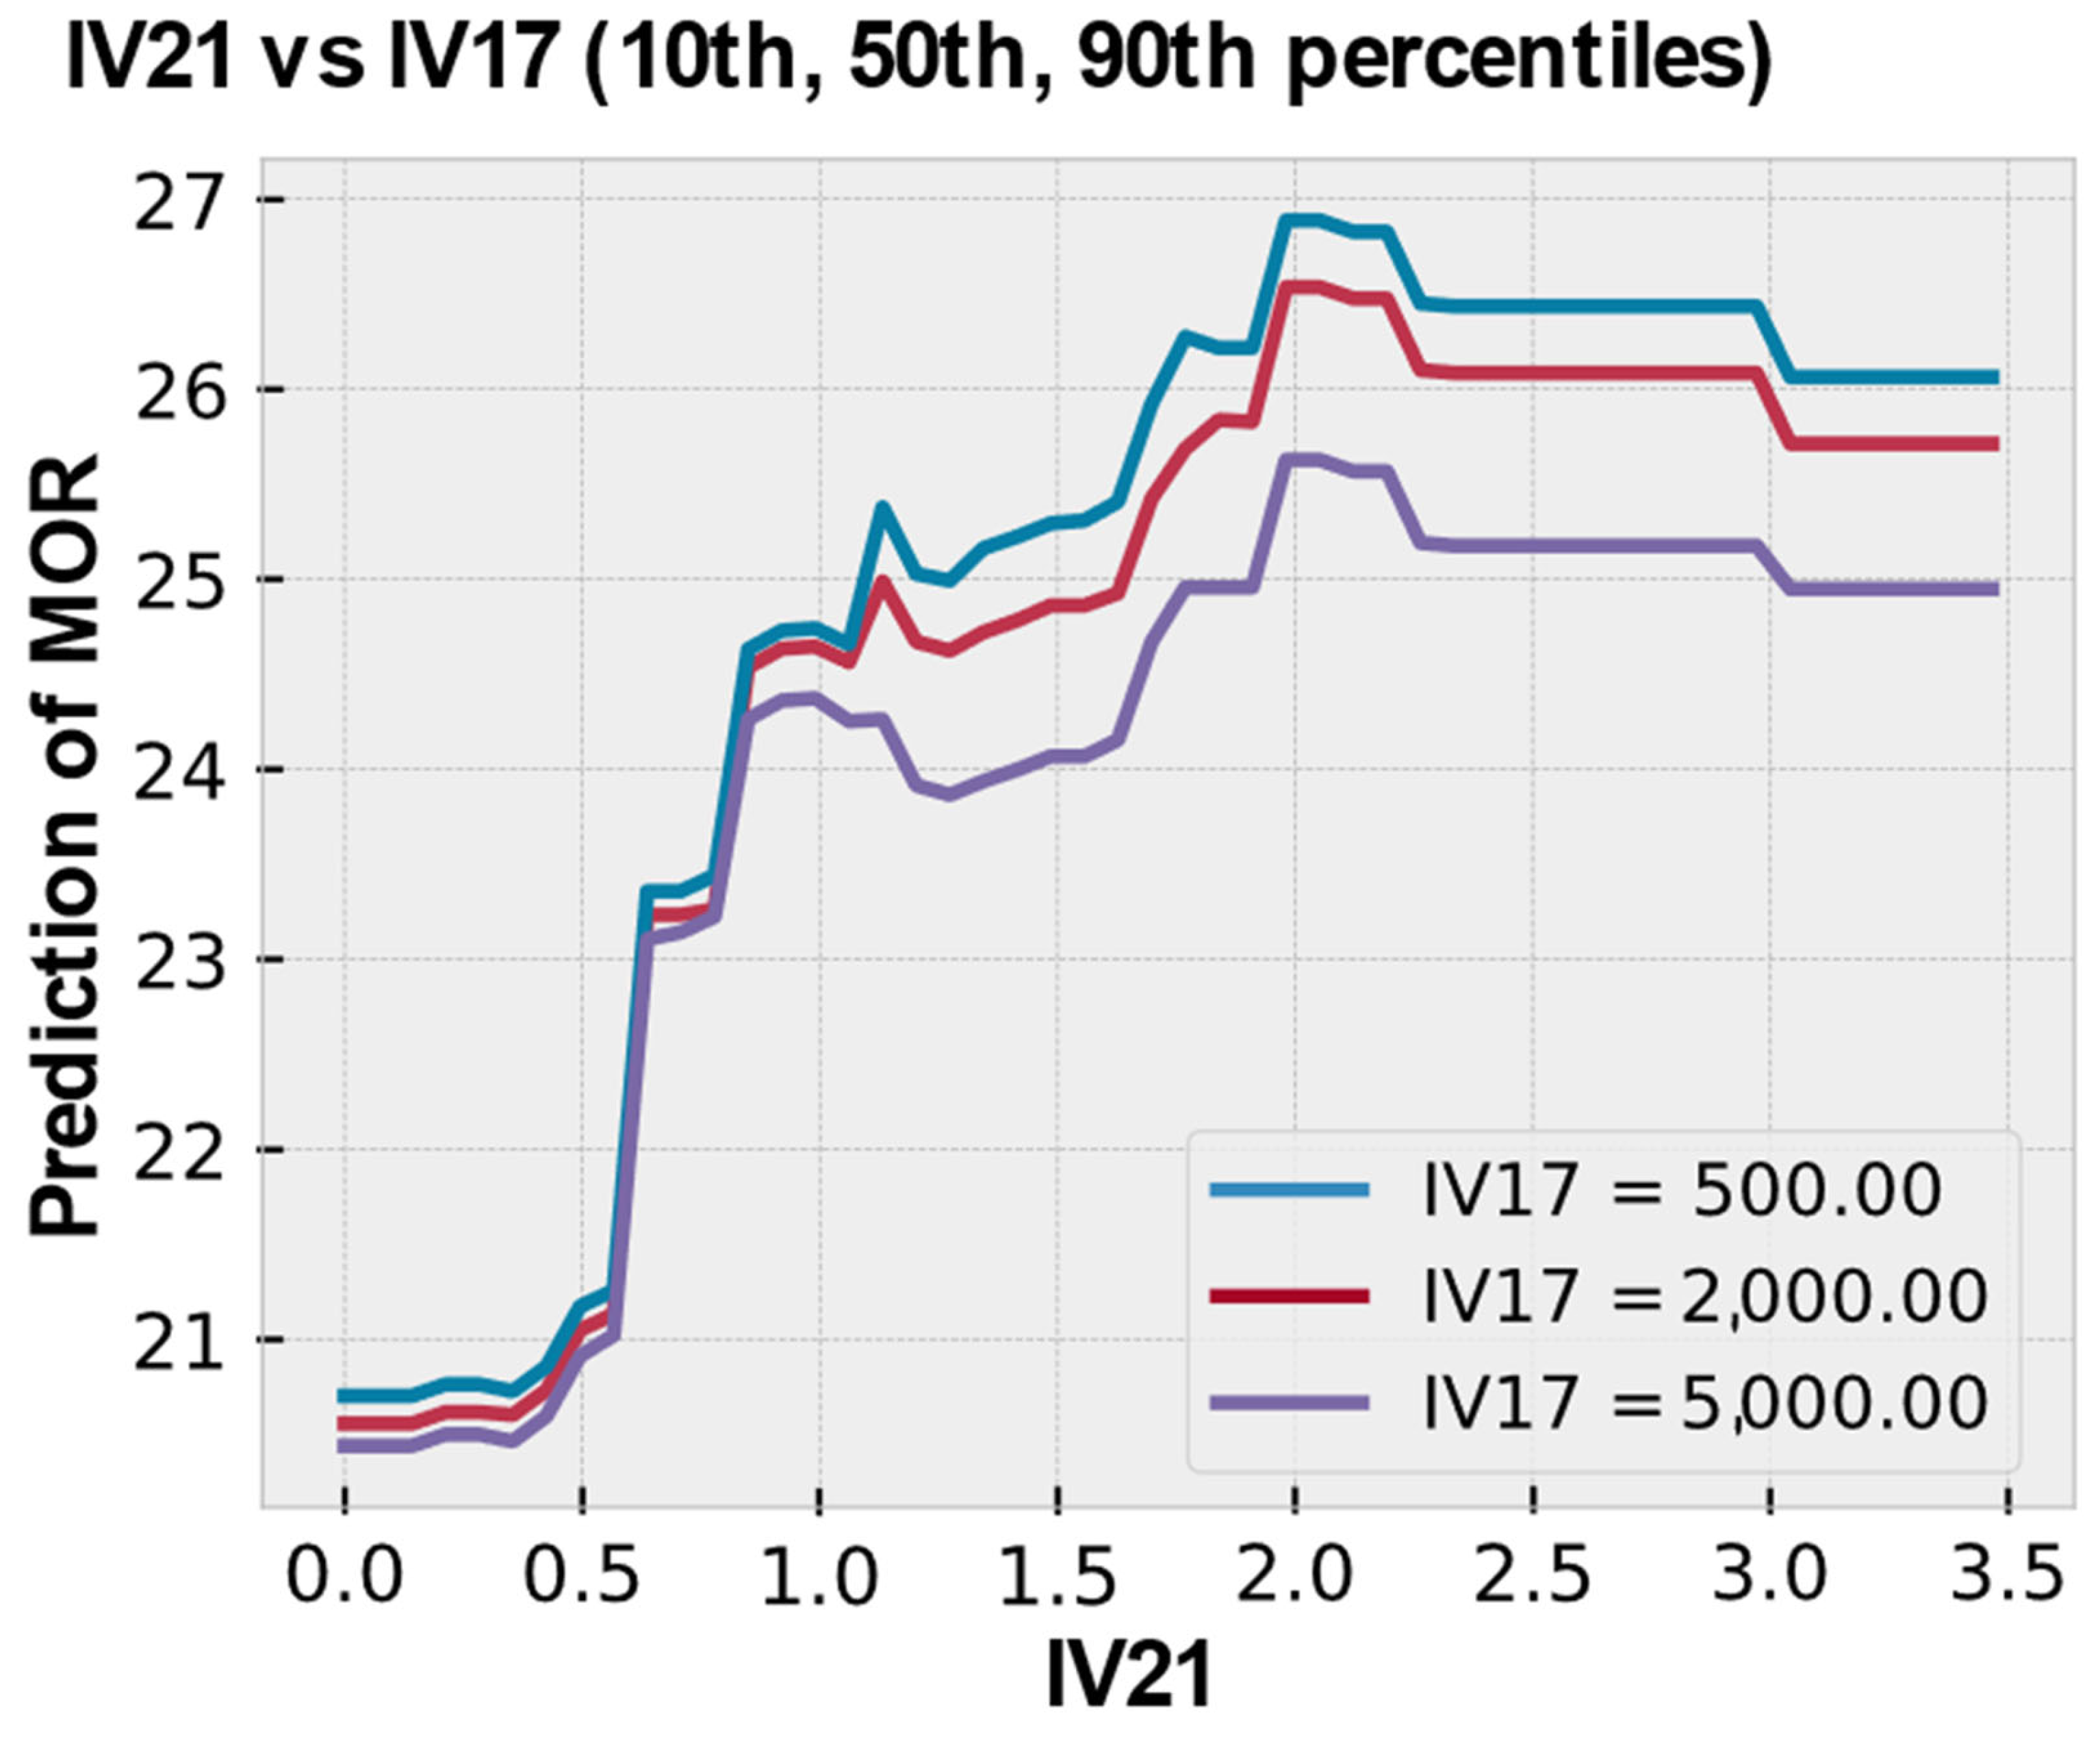
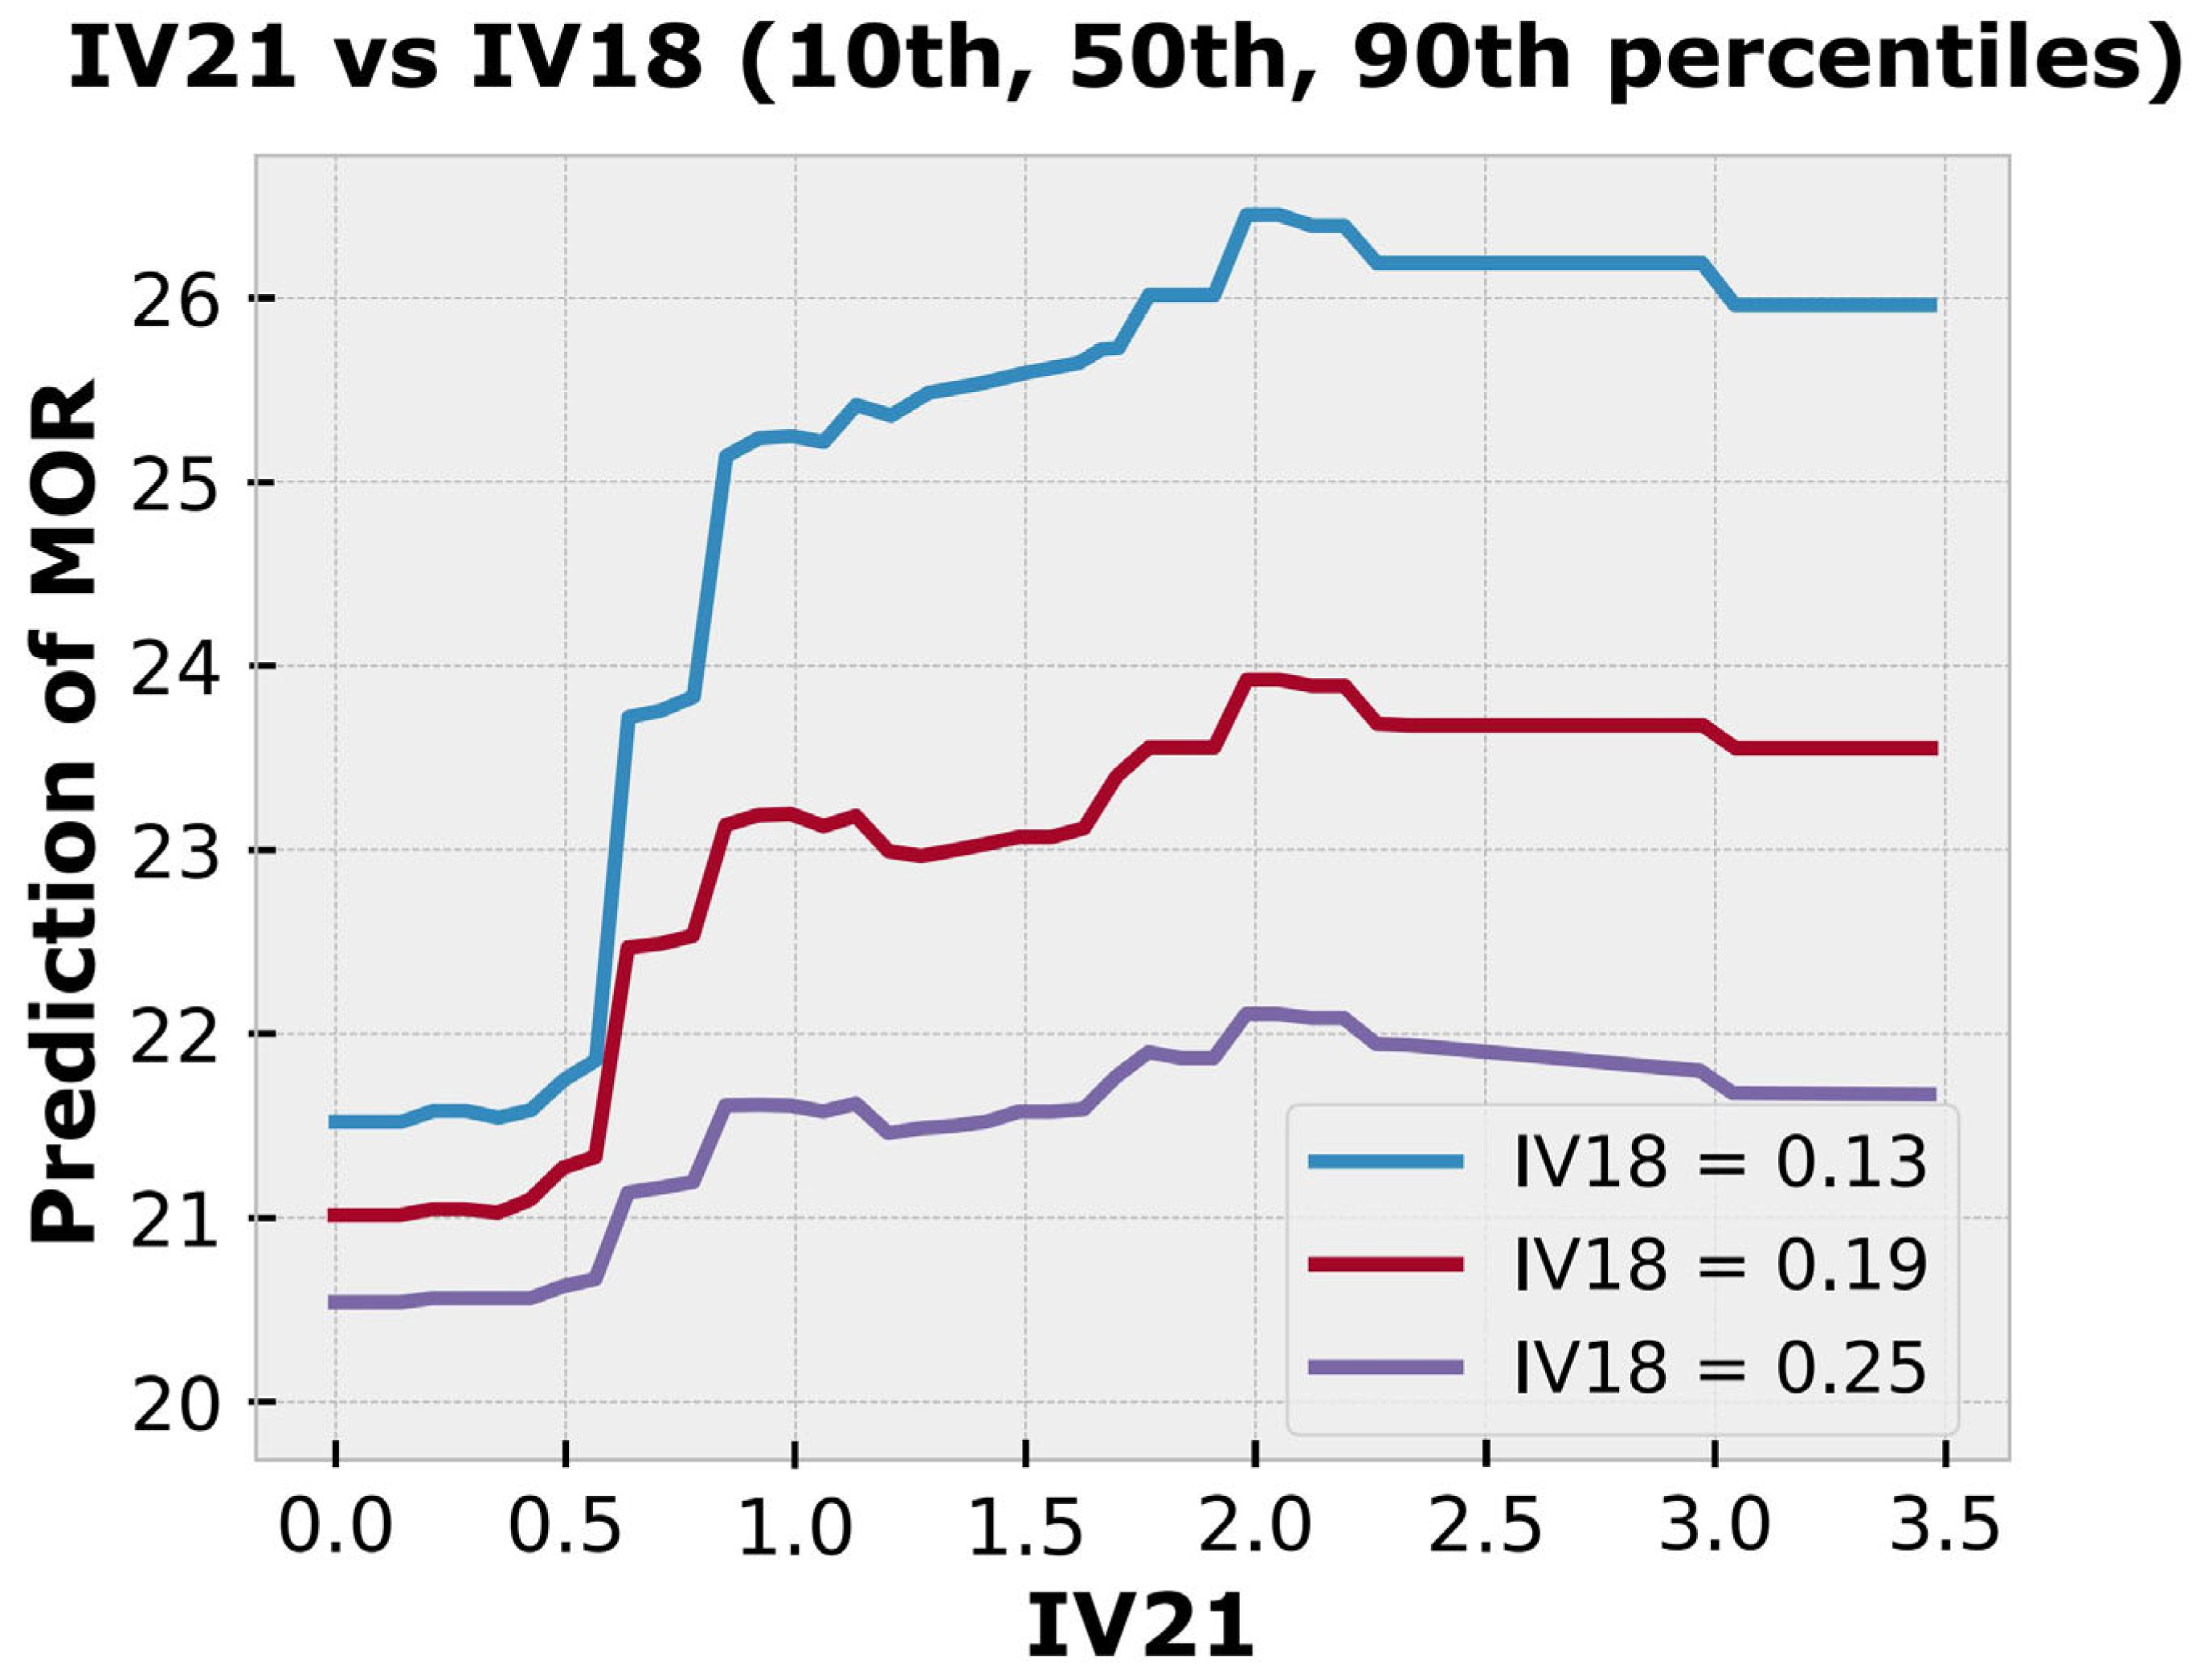
In two-way partial-dependence interaction analyses (PDPs), the interaction of global fiber factor (IV21) with relevant matrix properties—maximum aggregate size, water-to-binder ratio, and matrix compressive strength—was investigated to modulate MOR. These bivariate PDPs showed diminishing marginal returns at a fiber factor of ~1.8–2.0. Other conclusions of the analysis include the following:
a.
Smaller aggregate sizes enhance MOR due to improved fiber alignment and higher effective aspect ratios.
b.
Lower water-to-binder ratios amplify IV21’s effect by improving fiber-matrix bond strength and matrix density.
c.
Higher compressive strengths increase MOR by enabling better stress transfer and fiber anchorage.
In conclusion, the integration of advanced machine learning models, ensemble strategies, and interpretable AI techniques offers a powerful, reliable, and transparent framework for predicting and optimizing the flexural behavior of fiber-reinforced UHPC. This study not only advances the predictive modeling of UHPC mechanical properties but also contributes to the design of more sustainable, efficient, and high-performance concrete materials for critical structural applications.
Future research could focus on extending the methodology toward multi-objective optimization frameworks, incorporating durability-related properties, and further exploring the integration of novel, eco-efficient Supplementary Materials in UHPC formulations. In addition, forthcoming work will also explore the use of physics-informed neural network frameworks—particularly the consistent Deep-Energy Method—to simulate fiber pull-out and fracture behavior at the meso-scale.

Author Contributions

Conceptualization, J.D.E.-T., J.A.-G. and J.F.-G.; methodology, J.D.E.-T., J.A.-G. and J.F.-G.; data curation, J.D.E.-T.; writing—original draft preparation, J.D.E.-T.; writing—review and editing, J.D.E.-T., J.A.-G. and J.F.-G.; visualization, J.D.E.-T.; supervision, J.A.-G. and J.F.-G.; project administration, J.A.-G. All authors have read and agreed to the published version of the manuscript.

Funding

This research received no external funding.

Data Availability Statement

Dataset available on request from the authors. The data presented in this study are available from the corresponding author upon reasonable request.

Acknowledgments

The authors would like to express their gratitude to Universidad del Norte (Barranquilla, Colombia) for the institutional support provided throughout the development of this research.

Conflicts of Interest

The authors declare no conflicts of interest.

References

  1. Azmee, N.M.; Shafiq, N. Ultra-High Performance Concrete: From Fundamental to Applications. Case Stud. Constr. Mater. 2018, 9, e00197. [Google Scholar] [CrossRef]
  2. Abbas, S.; Nehdi, M.L.; Saleem, M.A. Ultra-High Performance Concrete: Mechanical Performance, Durability, Sustainability and Implementation Challenges. Int. J. Concr. Struct. Mater. 2016, 10, 271–295. [Google Scholar] [CrossRef]
  3. Bajaber, M.A.; Hakeem, I.Y. UHPC Evolution, Development, and Utilization in Construction: A Review. J. Mater. Res. Technol. 2021, 10, 1058–1074. [Google Scholar] [CrossRef]
  4. Tang, M.-C. High Performance Concrete—Past, Present and Future. In Proceedings of the international symposium on UHPC, Kassel, Germany, 13–15 September 2004; ISBN 3899580869. [Google Scholar]
  5. Scheydt, J.C.; Müller, H.S. Microstructure of Ultra High Performance Concrete (UPHC) and Its Impact on Durability. In Proceedings of the Hipermat 2012—3rd International Symposium on UHPC and Nanotechnology for Construction Materials, Kassel, Germany, 7–9 March 2012; Kassel University: Kassel, Germany, 2012; pp. 349–356. [Google Scholar]
  6. Schmidt, M.; Fehling, E. Ultra-High-Performance Concrete: Research, Development and Application in Europe. ACI Symp. Publ. 2005, 228, 51–78. [Google Scholar] [CrossRef]
  7. Wu, Z.; Shi, C.; He, W.; Wu, L. Effects of Steel Fiber Content and Shape on Mechanical Properties of Ultra High Performance Concrete. Constr. Build. Mater. 2016, 103, 8–14. [Google Scholar] [CrossRef]
  8. Meng, W.; Khayat, K.H. Effect of Hybrid Fibers on Fresh Properties, Mechanical Properties, and Autogenous Shrinkage of Cost-Effective UHPC. J. Mater. Civ. Eng. 2018, 30, 04018030. [Google Scholar] [CrossRef]
  9. Nasiri, H.; Pourbaba, M.; Lotfollahi Yaghin, M.A. Numerical Study on the Flexural and Shear Behavior of Steel Fiber and High-strength Steel Combination in Ultra-high-performance Fiber-reinforced Concrete Beams under Cyclic Loading. Struct. Concr. 2024, 26, 3663–3677. [Google Scholar] [CrossRef]
  10. Abellán-García, J.; Carvajal-Muñoz, J.S.; Ramírez-Munévar, C. Application of Ultra-High-Performance Concrete as Bridge Pavement Overlays: Literature Review and Case Studies. Constr. Build. Mater. 2024, 410, 134221. [Google Scholar] [CrossRef]
  11. Jiao, Y.; Zhang, Y.; Guo, M.; Zhang, L.; Ning, H.; Liu, S. Mechanical and Fracture Properties of Ultra-High Performance Concrete (UHPC) Containing Waste Glass Sand as Partial Replacement Material. J. Clean. Prod. 2020, 277, 123501. [Google Scholar] [CrossRef]
  12. Nasrin, S.; Ibrahim, A. Flexural Response of Ultra-High-Performance Concrete (UHPC) Hybrid Bridge Deck Connections Made with Local Materials. Constr. Build. Mater. 2021, 270, 121451. [Google Scholar] [CrossRef]
  13. Tayeh, B.A. Ultra-High-Performance Concrete (UHPC)—Applications Worldwide: A State-of-the-Art Review. J. Eng. Res. Tecnol. 2023, 10, 12–27. [Google Scholar] [CrossRef]
  14. Zhang, K. The Characteristics of Ultra-High Performance Concrete and Its Application in Structures. Highlights Sci. Eng. Technol. 2024, 106, 513–518. [Google Scholar] [CrossRef]
  15. Perry, V.H. Ultra-High-Performance-Concrete Advancements and Industrialization—The Need for Standard Testing. Adv. Civ. Eng. Mater. 2015, 4, 1–16. [Google Scholar] [CrossRef]
  16. Schmidt, C.; Schmidt, M. ‘Whitetopping’ of Asphalt and Concrete Pavements with Thin Layers of Ultra-High-Performance Concrete—Construction and Economic Efficiency. In Proceedings of the Hipermat 2012—3rd International Symposium on UHPC and Nanotechnology for Construction Materials, Kassel, Germany, 7–9 March 2012; Fröhlich, M., Schmidt, E., Fehling, C., Glotzbach, S., Piotrowski, S., Eds.; Kassel University: Kassel, Germany, 2012; pp. 921–927. [Google Scholar]
  17. Teng, L.; Khayat, K.H. Effect of Overlay Thickness, Fiber Volume, and Shrinkage Mitigation on Flexural Behavior of Thin Bonded Ultra-High-Performance Concrete Overlay Slab. Cem. Concr. Compos. 2022, 134, 104752. [Google Scholar] [CrossRef]
  18. Hiew, S.Y.; Bin Teoh, K.; Raman, S.N.; Kong, D.; Hafezolghorani, M. A Generalised Predictive Model for the Mechanical Properties of Mono/Hybrid Fibre-Reinforced Ultra-High-Performance Concrete. Constr. Build. Mater. 2024, 426, 136154. [Google Scholar] [CrossRef]
  19. Du, J.; Meng, W.; Khayat, K.H.; Bao, Y.; Guo, P.; Lyu, Z.; Abu-obeidah, A.; Nassif, H.; Wang, H. New Development of Ultra-High-Performance Concrete (UHPC). Compos. Part B Eng. 2021, 224, 109220. [Google Scholar] [CrossRef]
  20. Alabduljabbar, H.; Khan, M.; Awan, H.H.; Eldin, S.M.; Alyousef, R.; Mohamed, A.M. Predicting Ultra-High-Performance Concrete Compressive Strength Using Gene Expression Programming Method. Case Stud. Constr. Mater. 2023, 18, e02074. [Google Scholar] [CrossRef]
  21. Marani, A.; Jamali, A.; Nehdi, M.L. Predicting Ultra-High-Performance Concrete Compressive Strength Using Tabular Generative Adversarial Networks. Materials 2020, 13, 4757. [Google Scholar] [CrossRef]
  22. Zhang, J.; Zhao, Y. Prediction of Compressive Strength of Ultra-High Performance Concrete (UHPC) Containing Supplementary Cementitious Materials. In Proceedings of the 2017 International Conference on Smart Grid and Electrical Automation (ICSGEA), Changsha, China, 27–28 May 2017; pp. 522–525. [Google Scholar] [CrossRef]
  23. Ergen, F.; Katlav, M. Machine and Deep Learning-Based Prediction of Flexural Moment Capacity of Ultra-High Performance Concrete Beams with/out Steel Fiber. Asian J. Civ. Eng. 2024, 25, 4541–4562. [Google Scholar] [CrossRef]
  24. Soni, A.; Nateriya, R. Exploring Ultimate Flexural Strengths of Ultra-High-Performance Concrete (UHPC) Samples through Experimental Analysis in Comparison with Ordinary Concrete Structures. Natl. Acad. Sci. Lett. 2024. [Google Scholar] [CrossRef]
  25. Lima, C.; Coelho, A.; Von Zuben, F. Ensembles of Support Vector Machines for Regression Problems. In Proceedings of the International Joint Conference on Neural Network, Honolulu, HI, USA, 1 February 2002; Volume 3, pp. 2381–2386. [Google Scholar]
  26. Qian, Y.; Su, M.; Hakamy, A.; Deifalla, A.F.; El-said, A. Application of Machine Learning Algorithms to Evaluate the in Fl Uence of Various Parameters on the Fl Exural Strength of Ultra-High-Performance Concrete. Front. Mater. 2023, 9, 1114510. [Google Scholar] [CrossRef]
  27. Das, P.; Kashem, A. Hybrid Machine Learning Approach to Prediction of the Compressive and Flexural Strengths of UHPC and Parametric Analysis with Shapley Additive Explanations. Case Stud. Constr. Mater. 2024, 20, e02723. [Google Scholar] [CrossRef]
  28. Yu, R.; Spiesz, P.; Brouwers, H.J.H. Mix Design and Properties Assessment of Ultra-High Performance Fibre Reinforced Concrete (UHPFRC). Cem. Concr. Res. 2014, 56, 29–39. [Google Scholar] [CrossRef]
  29. Šerelis, E.; Vaitkevičius, V.; Kerševičius, V. Mechanical Properties and Microstructural Investigation of Ultra-High Performance Glass Powder Concrete. J. Sustain. Archit. Civ. Eng. 2016, 1, 5–11. [Google Scholar] [CrossRef]
  30. Huang, H.; Gao, X.; Wang, H.; Ye, H. Influence of Rice Husk Ash on Strength and Permeability of Ultra-High Performance Concrete. Constr. Build. Mater. 2017, 149, 621–628. [Google Scholar] [CrossRef]
  31. Yu, R.; Tang, P.; Spiesz, P.; Brouwers, H.J.H. A Study of Multiple Effects of Nano-Silica and Hybrid Fibres on the Properties of Ultra-High Performance Fibre Reinforced Concrete (UHPFRC) Incorporating Waste Bottom Ash (WBA). Constr. Build. Mater. J. 2014, 60, 98–110. [Google Scholar] [CrossRef]
  32. Li, Z. Proportioning and Properties of Ultra-High-Performance Concrete Mixtures for Application in Shear Keys of Precast Concrete Bridges; Clemson University: Clemson, SC, USA, 2015. [Google Scholar]
  33. Chen, T.; Gao, X.; Ren, M. Effects of Autoclave Curing and Fly Ash on Mechanical Properties of Ultra-High Performance Concrete. Constr. Build. Mater. 2018, 158, 864–872. [Google Scholar] [CrossRef]
  34. Ibrahim, M.A.; Farhat, M.; Issa, M.A.; Hasse, J.A. Effect of Material Constituents on Mechanical & Fracture Mechanics Properties of Ultra-High-Performance Concrete. ACI Struct. J. 2017, 114, 453–465. [Google Scholar] [CrossRef]
  35. Wu, Z.; Shi, C.; He, W. Comparative Study on Flexural Properties of Ultra-High Performance Concrete with Supplementary Cementitious Materials under Different Curing Regimes. Constr. Build. Mater. 2017, 136, 307–313. [Google Scholar] [CrossRef]
  36. Hassan, A.M.T.; Jones, S.W.; Mahmud, G.H. Experimental Test Methods to Determine the Uniaxial Tensile and Compressive Behaviour of Ultra High Performance Fibre Reinforced Concrete (UHPFRC). Constr. Build. Mater. 2012, 37, 874–882. [Google Scholar] [CrossRef]
  37. Yu, R.; Spiesz, P.; Brouwers, H.J.H. Development of Ultra-High Performance Fibre Reinforced Concrete (UHPFRC): Towards an Efficient Utilization of Binders and Fibres. Constr. Build. Mater. 2015, 79, 273–282. [Google Scholar] [CrossRef]
  38. Vatannia, S.; Kearsley, E.; Mostert, D. The Mechanical Properties of Uhpc Reinforced By Different Types of Fiber. In Proceedings of the FIB Symposium 2016 Performance-Based Approaches for Concrete Structures, Cape Town, South Africa, 21–23 November 2016. [Google Scholar]
  39. Filho, R.D.T.; Koenders, E.A.B.; Formagini, S.; Fairbairn, E.M.R. Performance Assessment of Ultra High Performance Fiber Reinforced Cementitious Composites in View of Sustainability. Mater. Des. 2012, 36, 880–888. [Google Scholar] [CrossRef]
  40. Abdulkareem, O.M.; Ben Fraj, A.; Bouasker, M.; Khelidj, A. Mixture Design and Early Age Investigations of More Sustainable UHPC. Constr. Build. Mater. 2018, 163, 235–246. [Google Scholar] [CrossRef]
  41. Wang, R.; Gao, X. Relationship between Flowability, Entrapped Air Content and Strength of UHPC Mixtures Containing Different Dosage of Steel Fiber. Appl. Sci. 2016, 6, 216. [Google Scholar] [CrossRef]
  42. Askar, L.K.; Tayeh, B.A.; Bakar, B.H. Effect of Different Curing Conditions on the Mechanical Properties of UHPFC. Iran. J. Energy Environ. 2013, 4, 299–303. [Google Scholar] [CrossRef]
  43. Šerelis, E.; Vaitkevičius, V.; Kerševičius, V. Research of UHPC Properties Prepared with Industrial Mixer. IOP Conf. Ser. Mater. Sci. Eng. 2017, 246, 012048. [Google Scholar] [CrossRef]
  44. Meng, W.; Khayat, K. Effects of Saturated Lightweight Sand Content on Key Characteristics of Ultra-High-Performance Concrete. Cem. Concr. Res. 2017, 101, 46–54. [Google Scholar] [CrossRef]
  45. Costa, H. Design of UHPFRC with Enhanced Ductility and Flowability Design of Uhpfrc with Enhanced Ductility and Flowability. In Proceedings of the 8th Rilem International Symposium on Fiber Reinforced Concrete, Guimares, Portugal, 19–21 September 2012. [Google Scholar]
  46. Yoo, D.-Y.; Banthia, N.; Yoon, Y.-S. Impact Resistance of Ultra-High-Performance Fiber-Reinforced Concrete with Different Steel Fibers. In Proceedings of the 9th RILEM International Symposium on Fiber Reinforced Concrete—BEFIB 2016, Vancouver, BC, Canada, 19 September 2016; pp. 398–405. [Google Scholar]
  47. Ghafari, E.; Costa, H.; Nuno, E.; Santos, B. RSM-Based Model to Predict the Performance of Self-Compacting UHPC Reinforced with Hybrid Steel Micro-Fibers. Constr. Build. Mater. 2014, 66, 375–383. [Google Scholar] [CrossRef]
  48. Liu, J.; Ou, Z.; Mo, J.; Chen, Y.; Guo, T.; Deng, W. Effectiveness of Saturated Coral Aggregate and Shrinkage Reducing Admixture on the Autogenous Shrinkage of Ultrahigh Performance Concrete. Adv. Mater. Sci. Eng. 2017, 2017, 2703264. [Google Scholar] [CrossRef]
  49. Schmidt, M.; Fehling, E.; Geisenhanslükem, C. (Eds.) Proceedings of the International Symposium on Ultra High Performance Concrete; University of Kassel: Kassel, Germany, 2004. [Google Scholar]
  50. Habel, K.; Charron, J.-P.; Braike, S.; Hooton, R.D.; Gauvreau, P.; Massicotte, B. Ultra-High Performance Fibre Reinforced Concrete Mix Design in Central Canada. Can. J. Civ. Eng. 2008, 35, 217–224. [Google Scholar] [CrossRef]
  51. Prem, P.R. Influence of Curing Regime and Steel Fibres on the Mechanical Properties of UHPC. Mag. Concr. Res. 2015, 67, 988–1002. [Google Scholar] [CrossRef]
  52. Kim, D.J.; Park, S.H.; Ryu, G.S.; Koh, K.T. Comparative Flexural Behavior of Hybrid Ultra High Performance Fiber Reinforced Concrete with Different Macro Fibers. Constr. Build. Mater. 2014, 25, 4144–4155. [Google Scholar] [CrossRef]
  53. Konvalinka, P. Mixture Design and Testing of Ultra High Performance Fiber Reinforced Concrete. Malays. J. Civ. Eng. 2013, 25, 74–87. [Google Scholar]
  54. Ren, G.M.; Wu, H.; Fang, Q.; Liu, J.Z. Effects of Steel Fiber Content and Type on Static Mechanical Properties of UHPCC. Constr. Build. Mater. 2018, 163, 826–839. [Google Scholar] [CrossRef]
  55. Mechtcherine, V.; Slowik, V.; Kabele, P. Strain-Hardening Cement-Based Composites: SHCC4; RILEM Bookseries; Springer: Berlin/Heidelberg, Germany, 2018; Volume 15, pp. 3–4. [Google Scholar] [CrossRef]
  56. Fehling, E.; Schmidt, C.; Stüwald, S. (Eds.) Proceedings of the Second International Symposium on Ultra High Performance Concrete; University of Kassel: Kassel, Germany, 2008. [Google Scholar]
  57. Proceedings of Hipermat 2012 3rd International Symposium on UHPC and Nanotechnology for High Performance Construction Materials. 2012. Available online: https://books.google.com.hk/books/about/Ultra_high_Performance_Concrete_and_Nano.html?id=eAKkMwEACAAJ&redir_esc=y (accessed on 10 May 2025).
  58. Camacho Torregrosa, E. Dosage Optimization and Bolted Connections for UHPFRC Ties. Ph.D. Thesis, Polytechnic University of Valencia, Valencia, Spain, 2013. [Google Scholar]
  59. Kou, S.C.; Xing, F. The Effect of Recycled Glass Powder and Reject Fly Ash on the Mechanical Properties of Fibre-Reinforced Ultrahigh Performance Concrete. Hindawi Publ. Corp. Adv. Mater. Sci. Eng. 2012, 2012, 263243. [Google Scholar] [CrossRef]
  60. Amanjean, E.N.; Vidal, T. Low Cost Ultra-High Performance Fiber Reinforced Concrete (UHPFRC) with Flash Metakaolin. Key Eng. Mater. 2015, 629–630, 55–63. [Google Scholar] [CrossRef]
  61. Vaitkevicius, V.; Šerelis, E.; Hilbig, H. The Effect of Glass Powder on the Microstructure of Ultra High Performance Concrete. Constr. Build. Mater. 2014, 68, 102–109. [Google Scholar] [CrossRef]
  62. ASTM C1609/C1609M-19; Standard Test Method for Flexural Performance of Fiber-Reinforced Concrete (Using Beam with Third-Point Loading). ASTM International: West Conshohocken, PA, USA, 2019.
  63. Huang, P.; Dai, K.; Yu, X. Machine Learning Approach for Investigating Compressive Strength of Self-Compacting Concrete Containing Supplementary Cementitious Materials and Recycled Aggregate. J. Build. Eng. 2023, 79, 107904. [Google Scholar] [CrossRef]
  64. Kang, M.C.; Yoo, D.Y.; Gupta, R. Machine Learning-Based Prediction for Compressive and Flexural Strengths of Steel Fiber-Reinforced Concrete. Constr. Build. Mater. 2021, 266, 121117. [Google Scholar] [CrossRef]
  65. Khan, M.I.; Abbas, Y.M. Intelligent Data-Driven Compressive Strength Prediction and Optimization of Reactive Powder Concrete Using Multiple Ensemble-Based Machine Learning Approach. Constr. Build. Mater. 2023, 404, 133148. [Google Scholar] [CrossRef]
  66. Oshiro, T.M.; Perez, P.S.; Baranauskas, J.A. How Many Trees in a Random Forest? In Proceedings of the Machine Learning and Data Mining in Pattern Recognition: 8th International Conference, MLDM 2012, Berlin, Germany, 13–20 July 2012; 7376 LNAI. pp. 154–168. [Google Scholar] [CrossRef]
  67. Geurts, P.; Ernst, D.; Wehenkel, L. Extremely Randomized Trees. Mach. Learn. 2006, 63, 3–42. [Google Scholar] [CrossRef]
  68. Chen, T.; Guestrin, C. XGBoost: A Scalable Tree Boosting System. In Proceedings of the 22nd ACM SIGKDD International Conference on Knowledge Discovery and Data Mining; Association for Computing Machinery: New York, NY, USA, 2016; pp. 785–794. [Google Scholar]
  69. Ni, X.; Duan, K. Machine Learning-Based Models for Shear Strength Prediction of UHPFRC Beams. Mathematics 2022, 10, 2918. [Google Scholar] [CrossRef]
  70. Zhang, X.; Yan, C.; Gao, C.; Malin, B.A.; Chen, Y. Predicting Missing Values in Medical Data Via XGBoost Regression. J. Healthc. Inform. Res. 2020, 4, 383–394. [Google Scholar] [CrossRef] [PubMed]
  71. Deshpande, N.; Londhe, S.; Kulkarni, S. Modeling Compressive Strength of Recycled Aggregate Concrete by Artificial Neural Network, Model Tree and Non-Linear Regression. Int. J. Sustain. Built Environ. 2014, 3, 187–198. [Google Scholar] [CrossRef]
  72. Sahoo, K.; Sarkar, P.; Robin Davis, P. Artificial Neural Networks for Prediction of Compressive Strength of Recycled Aggregate Concrete. In Proceedings of the International Conference on Environment, Agricultural and Civil Engineering (ICEACE-2016), London, UK, 24–25 March 2016. [Google Scholar] [CrossRef]
  73. Kushari, S.; Chakraborty, A.; Mukhopadhyay, T.; Maity, S.R.; Dey, S. ANN-Based Random First-Ply Failure Analyses of Laminated Composite Plates. In Recent Advances in Computational Mechanics and Simulations; Saha, S.K., Mukherjee, M., Eds.; Springer: Singapore, 2021; pp. 131–142. ISBN 9789811581380. [Google Scholar]
  74. Gotlib, V.A.; Sato, T.; Beltzer, A.I. Neural Computing of Effective Properties of Random Composite Materials. Comput. Struct. 2001, 79, 1–6. [Google Scholar] [CrossRef]
  75. Kaminski, M. Probabilistic Entropy and Relative Entropy for the Effective Characteristics of the Fiber-Reinforced Composites with Stochastic Interface Defects. Comput. Methods Appl. Mech. Eng. 2024, 432, 117308. [Google Scholar] [CrossRef]
  76. Kumar Tipu, R.; Batra, V.; Suman; Pandya, K.S.; Panchal, V.R. Shear Capacity Prediction for FRCM-Strengthened RC Beams Using Hybrid ReLU-Activated BPNN Model. Structures 2023, 58, 105432. [Google Scholar] [CrossRef]
  77. Lundberg, S.M.; Lee, S. A Unified Approach to Interpreting Model Predictions. In Proceedings of the 31st Conference on Neural Information Processing Systems (NIPS 2017), Long Beach, CA, USA, 4–9 December 2017; pp. 1–10. [Google Scholar]
  78. Lundberg, S.M.; Erion, G.; Chen, H.; DeGrave, A.; Prutkin, J.M.; Nair, B.; Katz, R.; Himmelfarb, J.; Bansal, N.; Lee, S.-I. From Local Explanations to Global Understanding with Explainable AI for Trees. Nat. Mach. Intell. 2020, 2, 56–67. [Google Scholar] [CrossRef]
  79. Friedman, J. Greedy Function Approximation: A Gradient Boosting Machine. Ann. Stat. 2001, 29, 1189–1232. [Google Scholar] [CrossRef]
  80. Le Hoang, A.; Fehling, E. Influence of Steel Fiber Content and Aspect Ratio on the Uniaxial Tensile and Compressive Behavior of Ultra High Performance Concrete. Constr. Build. Mater. 2017, 153, 790–806. [Google Scholar] [CrossRef]
  81. Abellán-García, J.; Ortega-Guzmán, J.J.; Chaparro-Ruiz, D.A.; García-Castaño, E. A Comparative Study of LASSO and ANN Regressions for the Prediction of the Direct Tensile Behavior of UHPFRC. Adv. Civ. Eng. Mater. 2022, 11, 235–262. [Google Scholar] [CrossRef]
  82. Ryu, G.S.; Kim, S.H.; Ahn, G.H.; Koh, K.T. Evaluation of the Direct Tensile Behavioral Characteristics of UHPC Using Twisted Steel Fibers. Adv. Mater. Res. 2012, 602–604, 96–101. [Google Scholar] [CrossRef]
  83. Abellan-Garcia, J. Tensile Behavior of Recycled-Glass-UHPC under Direct Tensile Loading. Case Stud. Constr. Mater. 2022, 17, e01308. [Google Scholar] [CrossRef]
  84. Park, S.H.; Kim, D.J.; Ryu, G.S.; Koh, K.T. Tensile Behavior of Ultra High Performance Hybrid Fiber Reinforced Concrete. Cem. Concr. Compos. 2012, 34, 172–184. [Google Scholar] [CrossRef]
  85. Yoo, D.Y.; Sohn, H.K.; Borges, P.H.R.; Fediuk, R.; Kim, S. Enhancing the Tensile Performance of Ultra-High-Performance Concrete through Strategic Use of Novel Half-Hooked Steel Fibers. J. Mater. Res. Technol. 2020, 9, 2914–2925. [Google Scholar] [CrossRef]
  86. Abellán-García, J.; Guzmán-Guzmán, J.S. Random Forest-Based Optimization of UHPFRC under Ductility Requirements for Seismic Retrofitting Applications. Constr. Build. Mater. 2021, 285, 122869. [Google Scholar] [CrossRef]
  87. Abellán-García, J. Comparison of Artificial Intelligence and Multivariate Regression in Modeling the Flexural Behavior of UHPFRC. Dyna 2020, 87, 239–248. [Google Scholar] [CrossRef]
  88. Shi, C.; Wu, Z.; Xiao, J.; Wang, D.; Huang, Z.; Fang, Z. A Review on Ultra High Performance Concrete: Part I. Raw Materials and Mixture Design. Constr. Build. Mater. 2015, 101, 741–751. [Google Scholar] [CrossRef]
  89. Shi, C.; Wu, Z.; Xiao, J.; Wang, D.; Huang, Z.; Fang, Z. A Review on Ultra High Performance Concrete: Part II. Hydration, Microstructure and Properties. Constr. Build. Mater. 2015, 96, 368–377. [Google Scholar] [CrossRef]
  90. Li, J.; Wu, Z.; Shi, C.; Yuan, Q.; Zhang, Z. Durability of Ultra-High Performance Concrete—A Review. Constr. Build. Mater. 2020, 255, 119296. [Google Scholar] [CrossRef]
  91. Amin, M.; Zeyad, A.M.; Tayeh, B.A.; Saad Agwa, I. Effect of Ferrosilicon and Silica Fume on Mechanical, Durability, and Microstructure Characteristics of Ultra High-Performance Concrete. Constr. Build. Mater. 2022, 320, 126233. [Google Scholar] [CrossRef]
  92. Al-azzawi, A.A.; Ali, A.S.; Risan, H.K. Behavior of Ultra High Performance Concrete Structures. ARPN J. Eng. Appl. Sci. 2011, 6, 95–109. [Google Scholar]
  93. Park, S.; Wu, S.; Liu, Z.; Pyo, S. The Role of Supplementary Cementitious Materials (Scms) in Ultra High Performance Concrete (Uhpc): A Review. Materials 2021, 14, 1472. [Google Scholar] [CrossRef] [PubMed]
  94. Deng, Y.; Zhang, Z.; Shi, C.; Wu, Z.; Zhang, C. Steel Fiber–Matrix Interfacial Bond in Ultra-High Performance Concrete: A Review. Engineering 2022, 22, 215–232. [Google Scholar] [CrossRef]
  95. Li, S.; Cheng, S.; Mo, L.; Deng, M. Effects of Steel Slag Powder and Expansive Agent on the Properties of Ultra-High Performance Concrete (UHPC): Based on a Case Study. Materials 2020, 13, 683. [Google Scholar] [CrossRef]
  96. Abellán, J.; Fernández, J.; Torres, N.; Núñez, A. Statistical Optimization of Ultra-High-Performance Glass Concrete. ACI Mater J. 2020, 117, 243–254. [Google Scholar] [CrossRef]
  97. Wang, W.; Wu, C.; Liu, Z.; Si, H. Compressive Behavior of Ultra-High Performance Fiber-Reinforced Concrete (UHPFRC) Confined with FRP. Compos. Struct. 2018, 204, 419–437. [Google Scholar] [CrossRef]
  98. Yoo, D.Y.; Park, J.J.; Kim, S.W. Fiber Pullout Behavior of HPFRCC: Effects of Matrix Strength and Fiber Type. Compos. Struct. 2017, 174, 263–276. [Google Scholar] [CrossRef]
  99. Abdallah, S.; Fan, M.; Zhou, X. Pull-Out Behaviour of Hooked End Steel Fibres Embedded in Ultra-High Performance Mortar with Various W/B Ratios. Int. J. Concr. Struct. Mater. 2017, 11, 301–313. [Google Scholar] [CrossRef]
  100. Viet Thein An, V.; Ludwig, H.-M. Proportioning Optimization of UHPC Containing Rice Husk Ash and Ground Granulated Blast-Furnace Slag. In Proceedings of the Hipermat 2012—3rd International Symposium on UHPC and Nanotechnology for Construction Materials, Kassel, Germany, 7–9 March 2012; Schmidt, M., Fehling, E., Glotzbach, C., Fröhlich, S., Piotrowski, S., Eds.; Kassel University: Kassel, Germany, 2012; pp. 197–205. [Google Scholar]
  101. Abellán-García, J. Study of Nonlinear Relationships between Dosage Mixture Design and the Compressive Strength of UHPC. Case Stud. Constr. Mater. 2022, 17, e01228. [Google Scholar] [CrossRef]
  102. Tram, N.-T.; Nguyen, D.-H. Influence of Matrix Strength on the Pullout Behavior of High Strength Steel Fibers. In CIGOS 2021, Emerging Technologies and Applications for Green Infrastructure; Ha-Minh, C., Tang, A.M., Bui, T.Q., Huynh, D.V.K., Eds.; Springer: Singapore, 2022; pp. 697–704. ISBN 978-981-16-7160-9. [Google Scholar]
  103. Abbass, W.; Khan, M.I.; Mourad, S. Evaluation of Mechanical Properties of Steel Fiber Reinforced Concrete with Different Strengths of Concrete. Constr. Build. Mater. 2018, 168, 556–569. [Google Scholar] [CrossRef]
  104. He, Z.H.; Du, S.G.; Chen, D. Microstructure of Ultra High Performance Concrete Containing Lithium Slag. J. Hazard. Mater. 2018, 353, 35–43. [Google Scholar] [CrossRef] [PubMed]
  105. Liu, J.; Han, F.; Cui, G.; Zhang, Q.; Lv, J.; Zhang, L.; Yang, Z. Combined Effect of Coarse Aggregate and Fiber on Tensile Behavior of Ultra-High Performance Concrete. Constr. Build. Mater. 2016, 121, 310–318. [Google Scholar] [CrossRef]
  106. Abellán-García, J.; Fernández-Gómez, J.; Torres-Castellanos, N.; Núñez-López, A. Tensile Behavior of Normal Strength Steel Fiber Green UHPFRC. ACI Mater. J. 2021, 118, 127–138. [Google Scholar] [CrossRef]
  107. Abellan-Garcia, J.; Fernández, J.; Khan, M.I.; Abbas, Y.M.; Carrillo, J. Uniaxial Tensile Ductility Behavior of Ultrahigh-Performance Concrete Based on the Mixture Design—Partial Dependence Approach. Cem. Concr. Compos. 2023, 140, 105060. [Google Scholar] [CrossRef]
  108. Zhao, Y.; Yu, H.; Wang, W.D.; Li, Y. Research on Mix Proportion Design Method of Cement Concrete for Road Mixed with Antifreeze Admixtures Sealed in Capsules. Key Eng. Mater. 2020, 861, 429–437. [Google Scholar] [CrossRef]
  109. Li, S.; Jensen, O.M.; Wang, Z.; Yu, Q. Influence of Micromechanical Property on the Rate-Dependent Flexural Strength of Ultra-High Performance Concrete Containing Coarse Aggregates (UHPC-CA). Compos. Part B Eng. 2021, 227, 109394. [Google Scholar] [CrossRef]
  110. Witkowski, P.; Kuczma, M.; Demby, M.; Rudnicki, T. Influence of Compressive Strength and Curing Time of Fiber Reinforced Concrete on Its Residual Flexural Tensile Strength. Adv. Sci. Technol. Res. J. 2025, 19, 329–341. [Google Scholar] [CrossRef]
  111. Wu, Z.; Khayat, K.H.; Shi, C. Changes in Rheology and Mechanical Properties of Ultra-High Performance Concrete with Silica Fume Content. Cem. Concr. Res. 2019, 123, 105786. [Google Scholar] [CrossRef]
  112. Subban, N.; Muthusamy, N.; Natarajan, B. Optimizing High Strength Concrete: A Comprehensive Study on the Synergistic Effects of Natural Fibres and Silica Fume on Workability, Mechanical and Flexural Behavior. Rev. Mater. 2024, 29, e20240525. [Google Scholar] [CrossRef]
  113. Wu, Z.; Khayat, K.H.; Shi, C. How Do Fiber Shape and Matrix Composition Affect Fiber Pullout Behavior and Flexural Properties of UHPC? Cem. Concr. Compos. 2018, 90, 193–201. [Google Scholar] [CrossRef]
  114. Zhang, H.Y.; Liu, X.Y.; Wei, D.F. Influence of Silica Fume Content on Performance of High-Performance Concrete. In Proceedings of the 3rd International Symposium on Architecture Research Frontiers and Ecological Environment (ARFEE 2020), Zhangjiajie, China, 18–20 December 2020; Agnès, H., Ed.; EDP Sciences—Web of Conferences: Les Ulis, France, 2021; Volume 03039, pp. 1–4. [Google Scholar]
  115. Zhang, J.P.; Liu, L.M.; Zhu, Z.D.; Zhang, F.T.; Cao, J.Z. Flexural Fracture Toughness and First-Crack Strength Tests of Steel Fiber-Silica Fume Concrete and Its Engineering Applications. Strength Mater. 2018, 50, 166–175. [Google Scholar] [CrossRef]
  116. Jansen, D.; Neubauer, J.; Goetz-Neunhoeffer, F.; Haerzschel, R.; Hergeth, W.-D. Change in Reaction Kinetics of a Portland Cement Caused by a Superplasticizer—Calculation of Heat Flow Curves from XRD Data. Cem. Concr. Res. 2012, 42, 327–332. [Google Scholar] [CrossRef]
  117. Shen, C.; Wang, H.; Tang, D.; Lyu, Z.; Zhang, H.; Yu, L.; Yang, C. Investigating the Influence of Coarse Aggregate Characteristics and Fiber Dispersion on the Flexural Performance of Ultra-High Performance Concrete (UHPC). J. Build. Eng. 2024, 97, 110738. [Google Scholar] [CrossRef]
  118. Han, J.; Zhao, M.; Chen, J.; Lan, X. Effects of Steel Fiber Length and Coarse Aggregate Maximum Size on Mechanical Properties of Steel Fiber Reinforced Concrete. Constr. Build. Mater. 2019, 209, 577–591. [Google Scholar] [CrossRef]
  119. Yoo, D.-Y.; Soleimani-Dashtaki, S.; Oh, T.; Chun, B.; Banthia, N.; Lee, S.-J.; Yoon, Y.-S. Strain-Hardening Effect on the Flexural Behavior of Ultra-High-Performance Fiber-Reinforced Concrete Beams with Steel Rebars. Dev. Built Environ. 2024, 17, 100343. [Google Scholar] [CrossRef]
  120. Wu, Z.; Shi, C.; Khayat, K.H. Investigation of Mechanical Properties and Shrinkage of Ultra-High Performance Concrete: Influence of Steel Fiber Content and Shape. Compos. Part B Eng. 2019, 174, 107021. [Google Scholar] [CrossRef]
  121. Nguyen, C.T.; Pham, H.H.; Nguyen, V.T.; Pham, S.D.; Cu, V.H. Evaluating the Effect of Steel Fibers on Some Mechanical Properties of Ultra-High Performance Concrete. In Proceedings of the ICSCEA 2019 International Conference on Sustainable Civil Engineering and Architecture; Reddy, J.N., Wang, C.M., Luong, V.H., Le, A.T., Eds.; Springer: Singapore, 2020; pp. 493–501. [Google Scholar]
  122. Teng, L.; Meng, W.; Khayat, K.H. Rheology Control of Ultra-High-Performance Concrete Made with Different Fiber Contents. Cem. Concr. Res. 2020, 138, 106222. [Google Scholar] [CrossRef]
  123. El-Tair, A.M. The Impact of Different Steel Fibers Percentages on the Mechanical Properties of Ultra-High-Strength Concrete toward a Sustainable Composition. Innov. Infrastruct. Solut. 2024, 9, 199. [Google Scholar] [CrossRef]
  124. Li, P.P.; Cao, Y.Y.Y.; Sluijsmans, M.J.C.; Brouwers, H.J.H.; Yu, Q. Synergistic Effect of Steel Fibres and Coarse Aggregates on Impact Properties of Ultra-High Performance Fibre Reinforced Concrete. Cem. Concr. Compos. 2021, 115, 103866. [Google Scholar] [CrossRef]
  125. Feng, S.; Xiao, H.; Ma, M.; Zhang, S. Experimental Study on Bonding Behaviour of Interface between UHPC and Concrete Substrate. Constr. Build. Mater. 2021, 311, 125360. [Google Scholar] [CrossRef]
  126. Jeong, G.Y.; Jang, S.J.; Kim, Y.C.; Yun, H. Do Effects of Steel Fiber Strength and Aspect Ratio on Mechanical Properties of High-Strength Concrete TT—Effects of Steel Fiber Strength and Aspect Ratio on Mechanical Properties of High-Strength Concrete. J. Korea Concr. Inst. 2018, 30, 197–205. [Google Scholar] [CrossRef]
  127. Luo, X.; Zhang, S.; Li, A.; Zhang, D. Fiber Content Optimization of UHPC and R-UHPC Oriented to Tensile Behavior and Cost Reduction. Constr. Build. Mater. 2023, 395, 132314. [Google Scholar] [CrossRef]
  128. Shao, Y.; Billington, S.L. Impact of UHPC Tensile Behavior on Steel Reinforced UHPC Flexural Behavior. J. Struct. Eng. 2022, 148, 4021244. [Google Scholar] [CrossRef]
  129. Kim, H.; Kang, D.; Oh, S.J.; Joo, C. Nondestructive Evaluation on Dispersion of Steel Fibers in UHPC Using THz Electromagnetic Waves. Constr. Build. Mater. 2018, 172, 293–299. [Google Scholar] [CrossRef]
Figure 1. Flow Chart of the study.
Jcs 09 00333 g001
Figure 2. Violin plots distribution of the study’s variables.
Jcs 09 00333 g002aJcs 09 00333 g002b
Figure 3. Statistical depiction of distributions of the response variable (MOR).
Jcs 09 00333 g003
Figure 4. Matrix encoded with Pearson’s correlation coefficients.
Jcs 09 00333 g004
Figure 5. Test setup for flexural loading of UHPC as per ASTM C1609/C1609M-19 [62].
Jcs 09 00333 g005
Figure 6. Scheme of an RF model used for regression purposes.
Jcs 09 00333 g006
Figure 7. Scheme of a feed-forward neural network.
Jcs 09 00333 g007
Figure 8. Model performance of the individual ML regression models evaluated.
Jcs 09 00333 g008
Figure 9. Regression plots of the best-performing individual ML regression models with R2 over 80% measured on the testing data subset: (a) FR; (b) XRF; and (c) XGB.
Jcs 09 00333 g009
Figure 10. Impact on the RF model’s output by SHAP value.
Jcs 09 00333 g010
Figure 11. Impact on the XRF model’s output by SHAP value.
Jcs 09 00333 g011
Figure 12. Impact on the XGB model’s output by SHAP value.
Jcs 09 00333 g012
Figure 13. Partial dependence of MOR on cement content (IV1).
Jcs 09 00333 g013
Figure 14. Partial dependence of MOR on silica fume content (IV2).
Jcs 09 00333 g014
Figure 15. Partial dependence of MOR on superplasticizer content (IV12).
Jcs 09 00333 g015
Figure 16. Partial dependence of MOR on maximum aggregate size (IV17).
Jcs 09 00333 g016
Figure 17. Partial dependence of MOR on fiber volume fraction (IV20).
Jcs 09 00333 g017
Figure 18. Partial dependence of MOR on composite fiber factor (IV21).
Jcs 09 00333 g018
Figure 19. IV21 × IV17 (maximum aggregate size, μm).
Jcs 09 00333 g019
Figure 20. IV21 × IV18 (water-to-binder ratio).
Jcs 09 00333 g020
Figure 21. IV21 × IV19 (matrix compressive strength, MPa).
Jcs 09 00333 g021
Figure 22. Model performance of the best-performing individual ML regression models along with the ensembled models evaluated.
Jcs 09 00333 g022
Figure 23. Scheme of the Hybrid Neural Network.
Jcs 09 00333 g023
Figure 24. Regression plots of the Hybrid Neural Network on the testing data subset.
Jcs 09 00333 g024
Figure 25. Experimental results of flexural strength (MOR) for the 26 UHPC series evaluated.
Jcs 09 00333 g025
Figure 26. Regression plots of the best-performing individual ML regression models and the Hybrid Neural network on the experimental dataset.
Jcs 09 00333 g026
Table 1. Mechanical and geometrical properties of fibers used in the experimental mixtures.
NotationMaterialType/ShapeTensile StrengthLength (mm)Diameter (mm)lf/df
OLSteelStraight2650 (MPa)130.2065
HSteelHooked1800 (MPa)350.5070
PVAPVAStraight1600 (MPa)60.02300
Table 2. Composition of UHPC matrices considered (information corresponding to IV’s Groups 1, 2 and 3).
NotationIV1IV2IV3IV5IV9IV11IV12IV15IV17IV18IV19
A0.2540.115000.0610.20.0360.3256000.16157
B0.2540.0450.0840.0610.0610.2160.0210.3196000.15153
C0.2310.06800.0850.0330.2260.0240.3346000.19124
Table 3. Fiber-reinforced UHPC series experimentally evaluated.
UHPC’s Series NotationMatrixFiber 1 TypeFiber 1 Volume FractionFiber 2 TypeFiber 2 Volume Fraction
A0A----
A-OL1AOL1%--
A-OL2AOL2%--
A-H1AH1%--
A-H2AH2%--
A-PVA1APVA1%--
A-PVA2APVA2%--
A-OL1-H1AOL1%H1%
A-OL1-PVAAOL1%PVA1%
A-H1-PVA1AH1%PVA1%
A-OL1.5-PVA0.5AOL1.5%PVA0.5%
A-H1.5-PVA0.5AH1.5%PVA0.5%
B0B----
B-OL1BOL1%--
B-OL2BOL2%--
B-H1BH1%--
B-H2BH2%--
B-PVA1BPVA1%--
B-PVA2BPVA2%--
C0C----
C-OL1COL1%--
C-OL2COL2%--
C-H1CH1%--
C-H2CH2%--
C-PVA1CPVA1%--
C.PVA2CPVA2%--
Table 4. Global fiber properties (Group 4: IV20–IV21) for the experimental series.
UHPC’s Series NotationIV20IV21
A-OL10.010.65
A-OL20.021.3
A-H10.010.7
A-H20.021.4
A-PVA10.013
A-PVA20.026
A-OL1-H10.021.35
A-OL1-PVA0.023.65
A-H1-PVA10.023.7
A-OL1.5-PVA0.50.022.15
A-H1.5-PVA0.50.022.55
B-OL10.010.65
B-OL20.021.3
B-H10.010.7
B-H20.021.4
B-PVA10.013
B-PVA20.026
C-OL10.010.65
C-OL20.021.3
C-H10.010.7
C-H20.021.4
C-PVA10.013
C.PVA20.026
Table 5. Fiber Type 1 characteristics (Group 5: IV22–IV31) for the experimental series.
UHPC’s Series NotationIV22IV23IV24IV25IV26IV27IV28IV29IV30IV31
A-OL11002650130.26578.50.010.65
A-OL21002650130.2651570.021.3
A-H10101800350.57078.50.010.7
A-H20101800350.5701570.021.4
A-PVA1001160060.0230011.50.013
A-PVA2001160060.02300230.026
A-OL1-H11002650130.26578.50.010.65
A-OL1-PVA11002650130.26578.50.010.65
A-H1-PVA10101800350.57078.50.010.7
A-OL1.5-PVA0.51002650130.26578.50.0150.975
A-H1.5-PVA0.50101800350.57078.50.0151.05
B-OL11002650130.26578.50.010.65
B-OL21002650130.2651570.021.3
B-H10101800350.57078.50.010.7
B-H20101800350.5701570.021.4
B-PVA1001160060.0230011.50.013
B-PVA2001160060.02300230.026
C-OL11002650130.26578.50.010.65
C-OL21002650130.2651570.021.3
C-H10101800350.57078.50.010.7
C-H20101800350.5701570.021.4
C-PVA1001160060.0230011.50.013
C.PVA2001160060.02300230.026
Table 6. Fiber Type 2 characteristics (Group 5: IV32–IV41) for the experimental series.
UHPC’s Series NotationIV32IV33IV34IV35IV36IV37IV38IV39IV40IV41
A-OL1-H10101800350.57078.50.010.7
A-OL1-PVA1001160060.0230011.50.013
A-H1-PVA1001160060.0230011.50.013
A-OL1.5-PVA0.5001160060.0230011.50.0051.5
A-H1.5-PVA0.5001160060.0230011.50.0051.5
Table 7. Hyperparameter tuning ranges and selected optimal values for each machine learning model using GridSearch.
ModelSelected Hyperparameters
Linear Regression (LR)
  • fit_intercept = True
  • copy_X = True
  • normalize = False
KNN
  • n_neighbors = 7
  • weights = ‘distance’
RF
  • n_estimators = 300
  • max_depth = None
  • bootstrap = True
  • min_samples_split = 2
  • min_samples_leaf = 1
  • max_features = ‘sqrt’
XRF
  • n_estimators = 200
  • max_depth = None
  • bootstrap = False
  • min_samples_split = 2
  • min_samples_leaf = 1
  • max_features = ‘auto’
XGBoost
  • n_estimators = 100
  • learning_rate = 0.2
  • booster = ‘gbtree’
  • max_depth = 6
  • subsample = 1.0
  • colsample_bytree = 1.0
  • reg_alpha = 0
  • reg_lambda = 1
ANN
  • Hidden layers: [32,63]
  • Activation (hidden): ReLU
  • Activation (output): linear
  • Optimizer: Adam (lr = 1 × 10⁻³)
  • Loss: MSE; Metric: MAE
  • Epochs: 100 (early stopping, patience = 10)
  • Batch size: 32
Table 8. Comparative performance metrics of individual models (RF, XRF, XGB) and the proposed hybrid model, evaluated using R2, MAE, and RMSE, measured on the testing data subset.
ModelR2MAERMSEMSEMAPE
RF0.8412.30143.653113.348119.4000
XRF0.8432.01243.540212.529019.1101
XGB0.8591.94683.282310.769516.9485
Hybrid0.8721.85973.13159.808316.6920
Table 9. Comparative performance metrics of individual models (RF, XRF, XGB) and the proposed hybrid model, evaluated using R2, MAE, and RMSE, measured on the experimental data subset.
ModelR2MAERMSEMSEMAPE
RF0.8611.66272.03724.15116.2277
XRF0.7412.22243.752114.07337.8542
XGB0.9041.52671.79583.22505.4667
Hybrid0.9511.38921.65282.73283.7331
Disclaimer/Publisher’s Note: The statements, opinions and data contained in all publications are solely those of the individual author(s) and contributor(s) and not of MDPI and/or the editor(s). MDPI and/or the editor(s) disclaim responsibility for any injury to people or property resulting from any ideas, methods, instructions or products referred to in the content.

