1. Introduction
Composite materials are increasingly used particularly in the aerospace industry owing to their damage tolerance, fatigue resistance and high strength [
1,
2]. However, the low impact resistance of composite materials has led to the development of fiber metal laminates (FMLs) with high impact resistance. The aim of engineering design for FMLs is to combine the best properties of both the materials. The main advantages of FMLs are superior fatigue resistance, damage tolerance, high strength properties, and impact resistance; in addition to these, some specific types of FMLs are highly resistant to corrosion [
3]. The most common type of FML is glass-reinforced aluminum laminate (GLARE), which consists of 2024-T3 aluminum alloy sheets and S2-glass/FM94 prepreg layers. GLARE’s properties such as impact, heat, fatigue, and corrosion resistance are better than conventional aluminum [
4]. Thanks to these superior mechanical properties, it is used in the primary (shells, pressure walls, etc.) and secondary (cargo floor, fairings, cabins, etc.) structures of the aircraft. Air transport has achieved a superior level of safety in recent years, but there are many opportunities for further development. Airplanes can be damaged by different impact sources [
5]. Tanker vehicles can crash and damage aircraft skins and floor panels during refueling, on the ground, and during cargo loading. During takeoff, unexpected runway debris and tire burst can cause significant damage to the lower fuselage and wing structure. Impact damage is an important issue for the safety of operations as it reduces the structural integrity of the structure [
6]. In addition, aircraft skin panels are exposed to different temperatures in arctic and desert climates or at high altitudes. To ensure safety, designers must be able to take the impact of these conditions on the damage-resistant behavior of aircraft structures into account [
7]. In order to optimize the impact resistance of GLARE, a good understanding of the material behavior is required. High-energy-absorbing fiber metal laminates (FMLs) present significant challenges in failure modeling, as the aluminum, resin matrix, and glass fibers interact in a highly coupled and nonlinear manner during the impact event, making accurate prediction of failure mechanisms inherently complex. The most suitable method is experimental. New research is needed to experimentally examine the impact process in FML and to develop models that represent the observed behavior with high accuracy [
8]. In all studies in the available literature, it was determined that the low-velocity impact test was performed at room temperature [
9,
10,
11]. It is thought that the low-velocity effect on aircraft operating in very different climatic regions will be affected by the ambient temperature. Within the scope of this study, only the data of the samples that were tested under low-velocity impact at room temperature will be compared with the results obtained by modeling GLARE using ABAQUS (2014) version V6.14 (Dassault Systemes Simulia, Inc., Johnston, RI, USA) software under the same conditions. For the validation of the model created using the ABAQUS software, it will be compared with the test results performed under the same conditions. In future studies, the usability of the ABAQUS GLARE model in the aircraft industry will be investigated by comparing the outputs of the ABAQUS model with the test results at extreme low and high temperatures.
Fiber metal laminates take advantage of metal- and glass fiber-reinforced composites by providing superior mechanical properties compared with conventional materials [
12]. GLARE laminates are members of the fiber metal laminate family. They consist of unidirectional (UD, UniDirection) glass fiber-reinforced prepreg layers and high-strength thin aluminum alloy sheets. They were originally developed for aerospace applications as an advanced glass fiber refinement of ARALL [
13,
14]. The advantages of GLARE over other FML types include high tensile strength and compression strength, damage tolerance, impact resistance and corrosion resistance [
15]. Since the cost of impact behavior tests in FMLs is high, attempts have been made to carry out modeling with the finite element method, taking ASTM 7136 standards (see references [
16,
17]) into account in this study. First of all, an impactor with a diameter of 16 mm was modeled in accordance with DIN EN 6038 standards (see reference [
18]), which is exactly the same as the one used in the tests, to be used in modeling with the ABAQUS program. Afterwards, GLARE, a hybrid material, was modeled and these tests were simulated in a computer environment. Low-velocity impact studies of GLARE at room temperature (25 °C) were performed in the finite element analyses. The aim of this study is the validation of the model created with ABAQUS at room temperature (25 °C) when GLARE material is used on aircraft cargo floors, wing, and fuselage shells. Glass fibers are much more resistant to compression loading than Aramid; as a result, fiber rupture was rarely observed in glass fibers at fatigue loading. Higher tensile and compressive strength, better corrosion resistance and better residual tensile strength are the other advantages of GLARE over Aramid Aluminum Laminate (ARALL) because Aramids can absorb up to 8% moisture and are weaker than glass-reinforced GLARE materials in terms of corrosion resistance [
19,
20]. These features allow GLARE to have a wider range of potential applications [
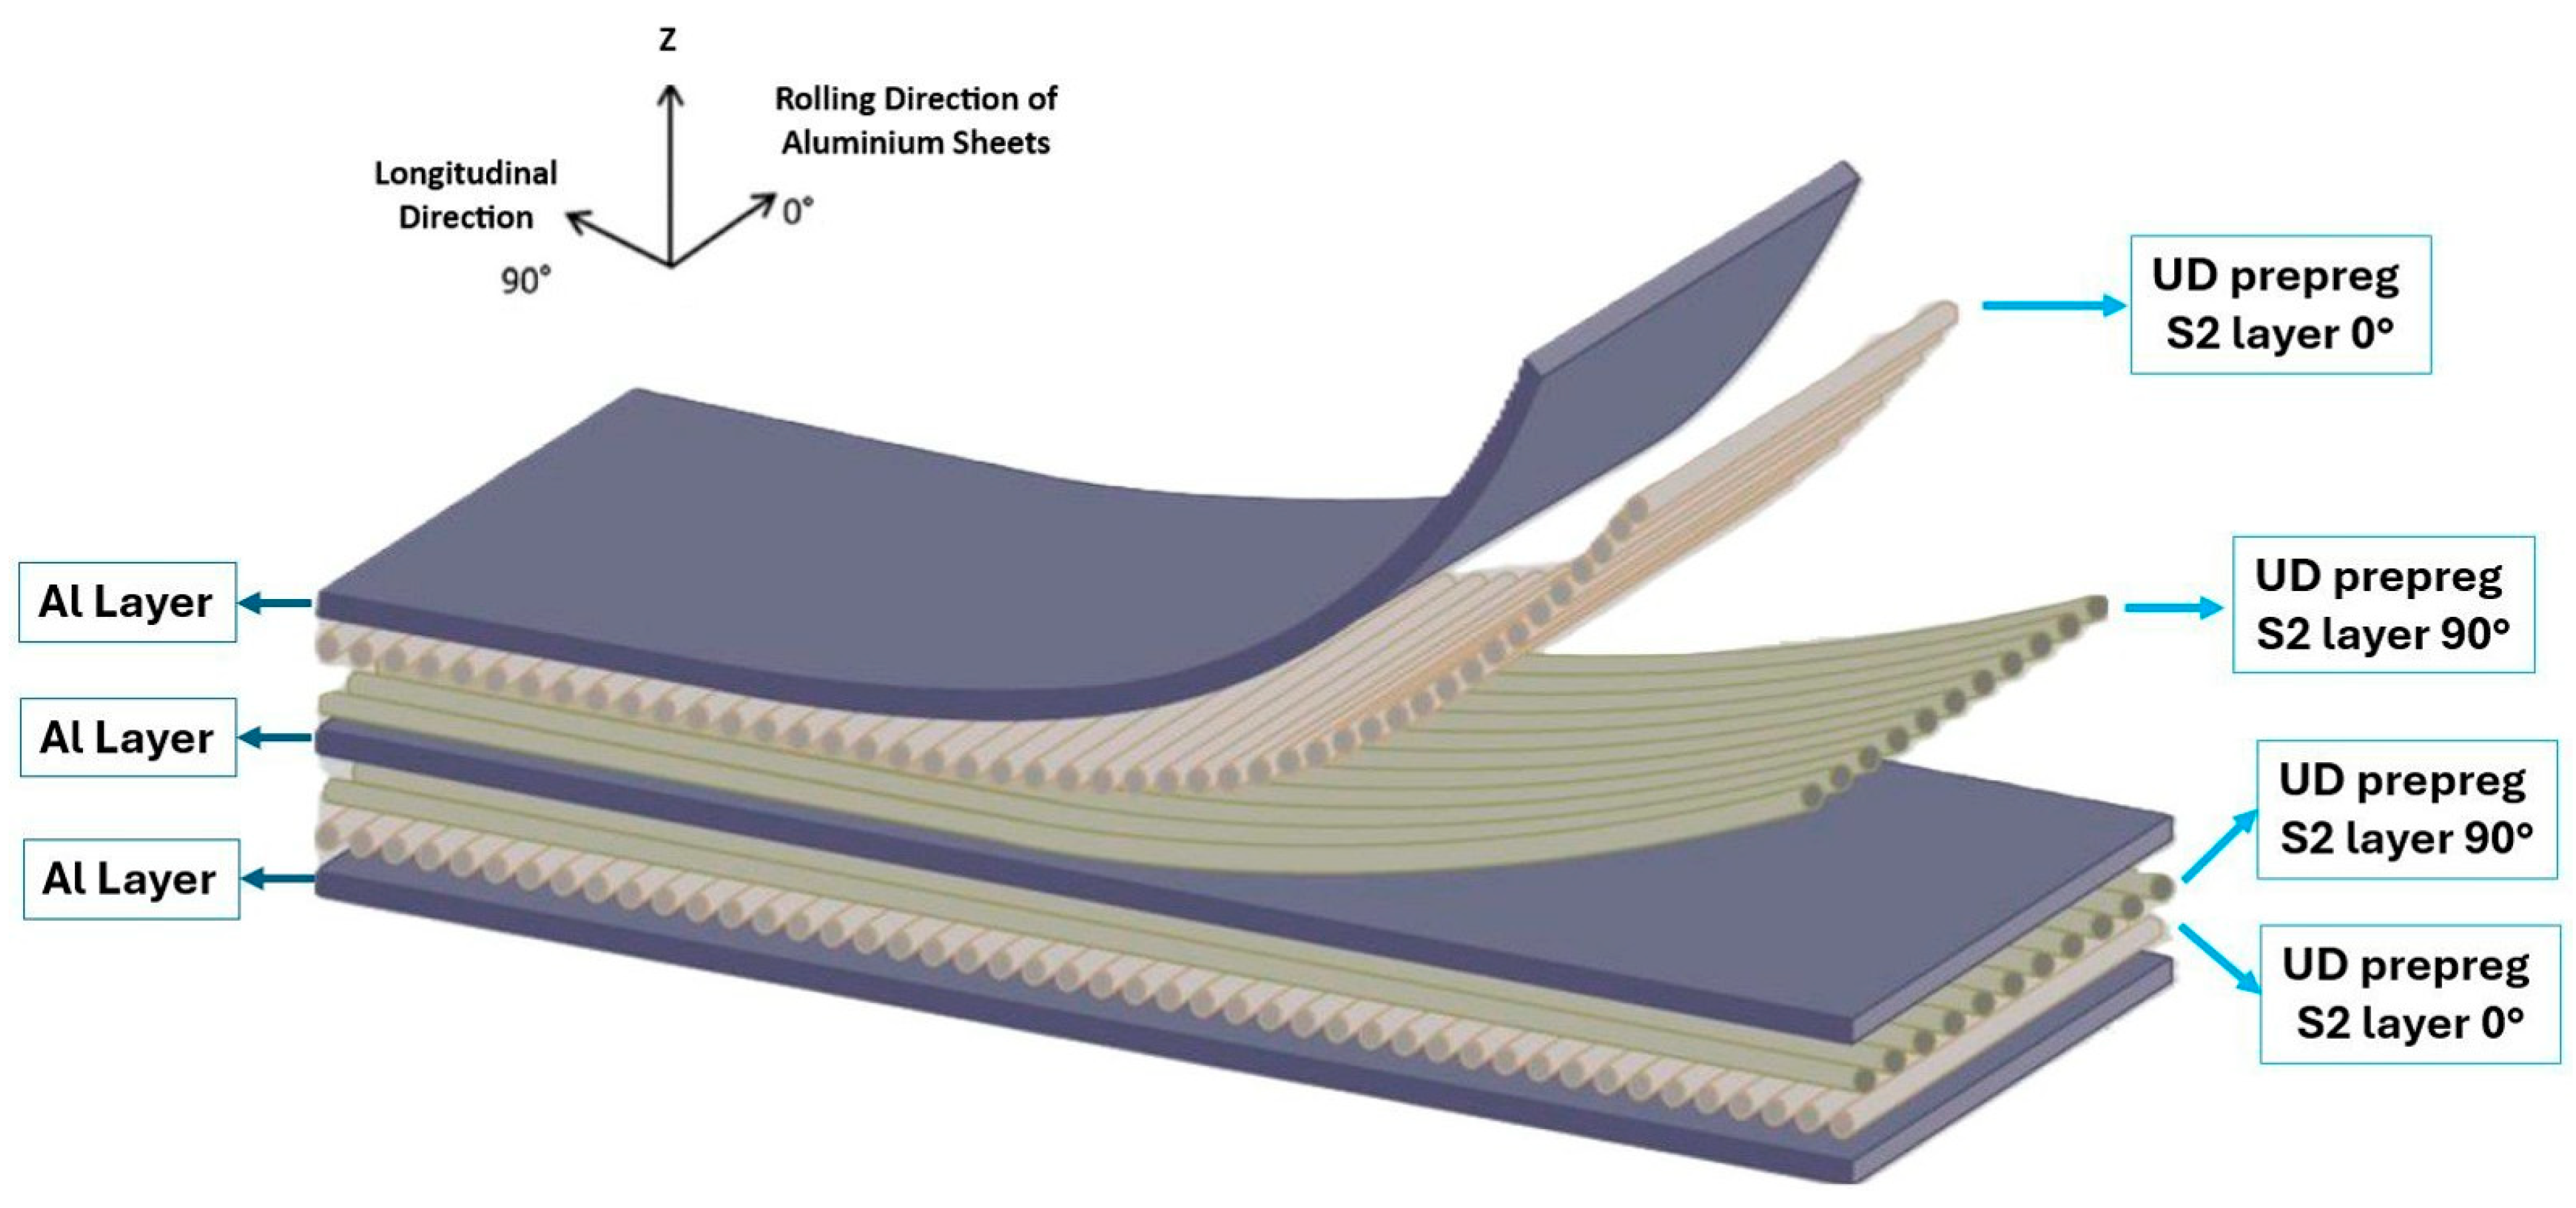
21]. An example GLARE 3 structure is shown in
Figure 1. GLARE 4A’s structure layup is shown in
Figure 2 below, the material used in this low-velocity impact study. Additionally, all GLARE types and their compositions are presented in
Table 1.
GLARE is formed by curing a combination of prepreg layers and aluminum alloys at high temperatures and pressure. The differences in thermal expansion between the aluminum alloy and prepreg layers cause residual tensile stresses in aluminum layers [
19]. Although these stresses can be reduced by manufacturing and outstanding design processes, the fatigue strength of aluminum sheets has a negative effect in the initial phase. The tensile stresses on the aluminum plate in the outer layer are higher than on the glass fiber; therefore, although crack initiation in part occurs in the outer aluminum layers, GLARE has a higher fatigue crack growth resistance. The reason is a mechanism known as ‘crack bridging’, as shown in
Figure 2 [
1]. Due to the tensile load transfer to the fiber layers, the strong fibers will restrict crack growth, which is the same as the aluminum alloy crack trail. Along with these phenomena, delamination begins to occur as a result along the crack edge between the fiber layers and the aluminum sheets [
22,
23].
Figure 2.
Crack bridging mechanism and GLARE 4A structure layup [
24,
25].
Figure 2.
Crack bridging mechanism and GLARE 4A structure layup [
24,
25].
On aircraft wings, 0 degrees is considered perpendicular to the flight direction and 90 degrees is considered parallel to the flight direction. In production, the fiber laying direction (0 degrees) is considered perpendicular to the flight direction. It has been determined that the most suitable configuration for the tensile force and bending moment that the wing lower skin panels of the aircraft will be exposed to along the long side is 0°/90°/0°. It has been observed that fibers and thin aluminum plates in the 0-degree direction will be effective to the wing lower skin panels, which are subjected to repetitive tensile force over time. Thin aluminum plates and fibers with 90-degree orientation will be effective for the wing lower skin panels, which are subject to shear and torsion due to drag. GLARE has many applications. For example, GLARE was used on the upper body of the A380 Aircraft model produced by the Airbus company, and approximately 794 kg (10%) was saved in gross weight [
26]. GLARE 2A was used on the Butt Straps of the A400M Aircraft [
27].
The novelty of this article lies in its detailed numerical modeling and experimental validation of GLARE 4A fiber metal laminates (FMLs) under low-velocity impact using ABAQUS software, particularly focusing on energy absorption, dent depth, and delamination behavior. Unlike previous studies that mostly rely on either experimental testing or simplified numerical models, this work integrates a comprehensive finite element model (FEM) with explicit analysis, cohesive surface properties for resin layers, and developed VUMAT subroutines to better capture delamination effects. Additionally, the study systematically validates the FEM against ASTM D7136 standard [
16,
17] impact tests, demonstrating a close agreement in impact energy and deformation trends, with only a 4.3% deviation. In addition to that, this study presents a novel numerical framework that simultaneously integrates cohesive zone modeling for resin interfaces, three-dimensional fiber representation, and user-defined subroutines for material behavior into an explicit finite element analysis of low-velocity impact on GLARE laminates. Unlike previous studies, which often address these aspects in isolation, the proposed approach captures damage initiation and progression with enhanced fidelity and attempts to represent deformation and failure mechanisms on a one-to-one scale. The numerical results are rigorously validated against experimental data to ensure physical relevance. By incorporating all of these advanced modeling strategies concurrently, the study significantly increases the sensitivity and accuracy of the simulation results, offering a more comprehensive and realistic prediction of GLARE’s impact response under varying conditions.
There were several difficulties and challenges encountered during the production of GLARE panels for low-velocity impact (LVI) tests. For example, an inadvertent misalignment of the aluminum sheets’ crystallographic grain directions—longitudinal (L) and long transverse (LT)—was found to introduce anisotropic variability. This discrepancy was identified only after multiple LVI trials and was subsequently corrected by implementing strict grain-direction control during the manufacturing process. Additionally, in the finite element (FE) simulations, modeling interlaminar delamination presented a significant challenge. This was resolved by incorporating an explicit cohesive zone model (CZM) employing a mixed-mode trapezoidal traction–separation law to accurately simulate crack initiation and propagation at the metal–composite interfaces. Another challenge arose from the initial use of a uniform and relatively coarse FE mesh, which failed to capture the steep stress gradients near the impact zone. Targeted mesh refinement in critical regions, particularly around the impact site, resulted in an approximate 30% improvement in analysis accuracy. Finally, the development of a detailed three-dimensional GLARE layup, integrated with user-defined material subroutines, introduced numerical instabilities due to software limitations. These issues were mitigated through iterative code verification and strategic simplification of the subroutine implementation to achieve stable solutions. Collectively, these strategies addressed the primary manufacturing and modeling challenges encountered during the GLARE LVI simulations and significantly enhanced the predictive fidelity of the numerical framework.
2. Materials and Methods
Low-velocity impact damage tests were conducted in accordance with the ASTM D7136 standard using an Instron CEAST 9350 drop-weight impact machine (Instron, Norwood, MA, USA). Six GLARE 4A-2/1-0.3 specimens were tested under consistent impact energy levels, averaging 14.6 J, ensuring reliable and comparable results. The current study’s application and low-velocity impact test methodology step flow chart is provided in
Figure 3. The low-velocity impact machine [see
Figure 4a] was designed to prevent rebound impacts using an electromagnetic carriage system.
The low-velocity impact testing machine and its working mechanism are shown in
Figure 4b. A hemispherical steel impactor with a mass of 5.477 kg and a 16 mm diameter, standardized to DIN EN 6038 [
18], was used for the impact test. The impact energy was calculated based on the release height and verified by a velocimeter. The impactor’s weight and geometry were kept constant throughout the study to maintain result consistency. During each test, data on force–time, velocity–time, displacement–time, and absorbed energy–time were recorded, with built-in filtering algorithms applied to minimize vibration effects.
Dent depth on the GLARE specimens was measured post-impact using a Mahr MarCator 1087 BR micrometer (Mahr GmbH, Göttingen, Germany), ensuring accurate and consistent measurements, as shown in
Figure 5. The impactor used in the test contained an internal load cell that collected force data over time during each impact. The micrometer, which has three legs, took measurements from the middle needle. To ensure accurate measurements, the dented area was kept clear, and the specimen’s edges were supported on a raised platform.
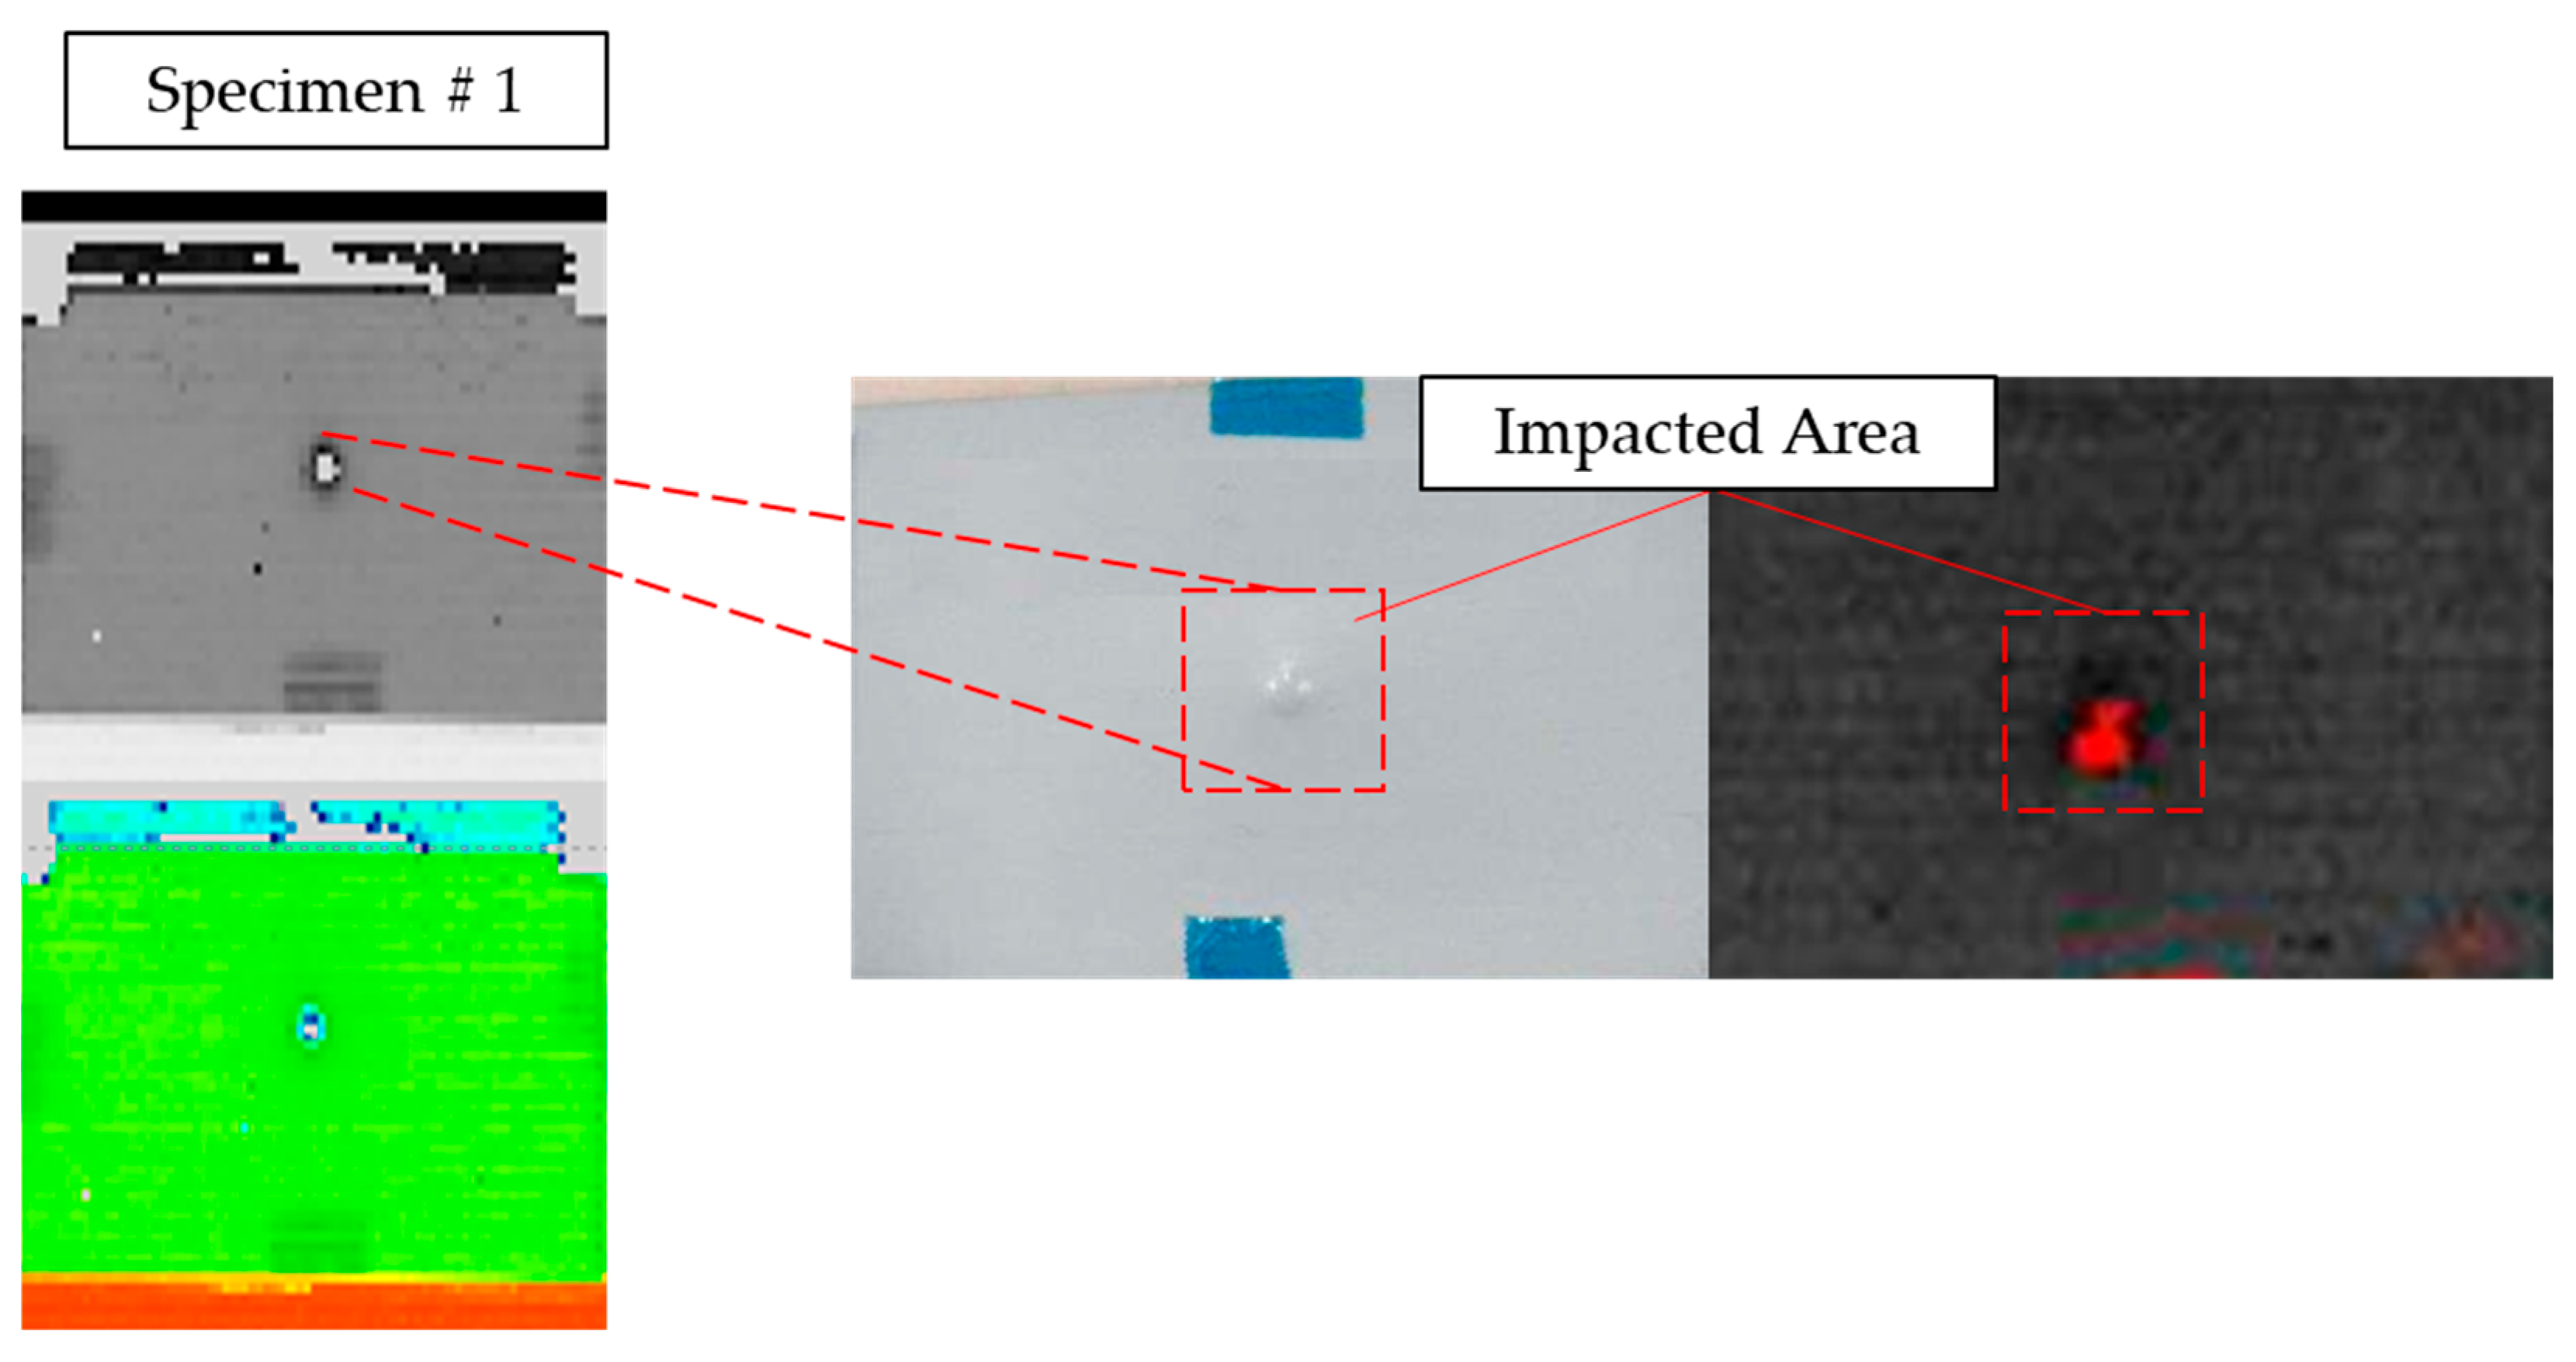
Damage analysis included non-destructive C-Scan testing to evaluate delamination and failure areas, with measurements following ASTM D7136 standards. Low-velocity impact specimens after impact and their comparisons as a result of the C-Scan can be seen in
Figure 6. Due to limited specimens, simulation studies were initially conducted to estimate appropriate energy levels, aligning with common values in similar studies. The study successfully validated the test setup and provided consistent, reliable data on low-velocity impact damage on GLARE specimens.
In addition,
Figure 7 depicts the impact damage on GLARE 4A-2/1-0.3 specimens subjected to varying energy levels of 5 J, 10 J, 15 J, and 20 J, showing front, back, and side views for each case. As the impact energy increases, a noticeable progression in damage severity is observed.
At 5 J and 10 J, the front and back surfaces exhibit minimal visible damage, with only slight surface indentations. The side views confirm minor denting without significant delamination or fiber breakage. This indicates that these energy levels are below the damage threshold for this material configuration.
At 15 J, the front view reveals a more pronounced indentation, and the back view shows the first signs of visible damage, suggesting the onset of delamination. The side view confirms this with a noticeable increase in dent depth. This indicates that around 15 J is the threshold energy for GLARE 4A-2/1-0.3 specimens, marking the transition from non-critical to critical damage.
At 20 J, the front and back views show significant surface deformation, and the side view reveals extensive denting and delamination. The damage is more severe compared to lower energy levels, confirming that energy levels above 15 J cause substantial internal damage, compromising the structural integrity of the specimens.
These observations demonstrate that the threshold energy for GLARE 4A-2/1-0.3 specimens is approximately 15 J, beyond which the damage mechanism transitions from surface indentation to significant fiber failure or internal delamination, meaning potential structural failure. This finding is crucial for designing impact-resistant structures using GLARE composites, ensuring that impact energies remain below the identified threshold to maintain structural integrity.
In summary,
Figure 7 illustrates the progression of impact damage on GLARE 4A 2/1-0.3 specimens subjected to increasing energy levels (5 J, 10 J, 15 J, and 20 J), shown from the front, back, and side views. At 5 J and 10 J, only minor surface indentations are visible, with no significant internal damage, indicating these energy levels are below the damage threshold. At 15 J, more pronounced surface indentation and initial signs of delamination appear, particularly in the back and side views, suggesting this is the threshold energy at which critical damage begins. At 20 J, severe deformation, delamination, and fiber damage are evident in all views, indicating substantial structural compromise. These results confirm that the damage threshold for GLARE 4A 2/1-0.3 is approximately 15 J, emphasizing the need to maintain impact energies below this level to preserve structural integrity in practical applications.
Creating the model geometry is the first step of the finite element modeling process. Aluminum and fiber plates were designed in the ABAQUS finite element analysis program, with dimensions of 150 mm horizontally and 100 mm vertically according to the ASTM 7136 standard, taking into account the studies in the open literature [
28,
29]. The thickness of the aluminum plates is 0.3 mm, and the thickness of the S2 glass fiber plates is 0.1 mm [
30]. Aluminum plates drawn with dimensions of 150 × 100 mm are assigned a thickness of 0.3 mm in a three-dimensional and deformable manner. Then, the mechanical and thermal properties shown in
Table 2, taken from the literature, were assigned to the plate drawn within the framework of solid-part and homogeneous-structure properties. Subsequently, for the meshing process of the parts, the mesh elements and their properties were investigated in accordance with the geometry. In this context, mesh elements of explicit and C3D8R element types are assigned to the parts. In this element type, hourglass control and element removal feature were implemented to minimize errors during analysis.
An iterative finite element mesh refinement study was conducted using the mesh convergence method to determine the optimal element size. It is well-documented in the literature [
9,
10,
30] that a fine mesh in the impactor contact area can result in lower stress and damage predictions, whereas a coarser mesh may overestimate damage due to numerical artifacts. To balance computational efficiency and accuracy, the mesh size was chosen to align with experimental test results while considering hardware constraints such as processor speed and available computational cores. The edge of each mesh element is set to be 7.5 mm across the part. A uniform mesh size of 7.5 mm was assigned to each element edge, ensuring consistency in numerical representation while maintaining computational feasibility. However, in order to shorten the analysis time and increase the sensitivity and accuracy of the results, a different mesh process was applied to the area that the impactor would hit. The length of one edge of each mesh element is assigned as 2.5 mm in order to cover a 50 × 50 square geometry [
31].
One of the key factors influencing the accuracy of the simulations was mesh convergence. Initially, a relatively coarse and uniform finite element (FE) mesh was used, which could not accurately capture the steep stress gradients near the impact zone, particularly at the metal–composite interfaces. To address this, a mesh refinement study was conducted, where the mesh density was systematically increased in critical regions, especially around the impact site. This targeted refinement led to a notable improvement of approximately 30% in the accuracy of the simulation results. Specifically, mesh convergence was assessed by comparing simulation outputs such as peak stress and delamination area across multiple mesh densities. The final mesh configuration, optimized through this study, exhibited a good balance between computational cost and result fidelity. These refinements were complemented by user-defined subroutines and numerical stabilization strategies, which ensured simulation stability despite the increased mesh complexity. Altogether, the refined meshing strategy significantly enhanced the predictive fidelity of the numerical framework and contributed to more reliable low-velocity impact (LVI) simulations of GLARE laminates. Fiber plates drawn with dimensions of 150 × 100 mm were assigned a thickness of 0.1 mm in a three-dimensional and deformable manner. Later, the data in
Table 3 were assigned to the plates in the same way.
VUMAT, which is the ABAQUS user sub-software, is used to provide results in three-dimensional analysis of the properties of the fiber material. In this context, the properties of the glass fiber parts used are assigned more accurately and precisely with VUMAT. Most of the research works that have incorporated cohesive models have only assessed the failure load of adhesive joints and have not evaluated the initiation and evolution of damage and the consequential failure modes [
32]. To implement a robust cohesive zone model (CZM) within the finite element (FE) framework, a mixed-mode trapezoidal traction–separation cohesive model can be incorporated to accurately simulate crack initiation and propagation [
33]. While this CZM is particularly suitable for crack initiation and propagation studies, the focus of this research is not on fatigue and damage tolerance aspects. In a low-velocity impact study using ABAQUS with VUMAT, cohesive zone modeling (CZM) is employed to simulate delamination and interlaminar damage in composite materials such as GLARE [
34]. The background calculations for CZM in ABAQUS are based on traction–separation laws, which define the relationship between cohesive tractions and separations. This approach assumes initially linear elastic behavior, followed by damage initiation and evolution. Damage initiation criteria often utilize quadratic stress or strain formulations, while damage evolution is typically characterized by energy-based methods, defining the area under the traction–separation curve as the fracture energy required for crack propagation. For mixed-mode fracture scenarios, the Benzeggagh–Kenane (BK) criterion is commonly applied to determine the critical energy release rate as a function of mode mixity [
35]. Implementing these models with VUMAT allows for customization of material behavior to accurately represent the complex fracture processes in composite structures.
Then, mesh elements of explicit and C3D8R element type are assigned to the part for the meshing process. In this element type, hourglass checking and the element removal method have been implemented as was applied with the aluminum plates, to minimize errors during analysis. The area where the impactor contact is made was subjected to a more detailed mesh process as was carried out on the aluminum plates [
36]. The 16 mm impactor part was drawn as shown in
Figure 8 according to the data in the DIN EN 6038 standards [
18]. The mass of the impactor was determined as 5.477 kg. The impactor mass was obtained with the help of potential energy in the first attempts in real tests. A reference point is assigned to the tip in order to integrate the mass and velocity values into the whole part. At this point, the arrangements to be made later became easier. In the assembly phase of the analysis, the aluminum and fiberglass prepreg layers were arranged one after the other in order of GLARE type.
For the adjustment of the potential energy of the analysis, a certain distance was left between the impactor and the layers. Surface assignments were made to the front and back of each layer to model the resin in GLARE. Surface assignments were prepared for the contact of the aluminum and impactor and for the contact of the aluminum and prepreg layers separately. Properties assigned to surfaces were applied as cohesive surface properties where resin was present. Thus, adhesion between layers is simulated. In this study, explicit analysis type was used. In addition, a suitable time should be determined so that the impactor can impact the specimen and return at a certain level, absorb energy, and allow elastic and plastic deformations to occur independently of each other.
In this research, strain rate effects in low-velocity impact simulations were used to support the selection and implementation of structural models in ABAQUS. In the ABAQUS tool, the strain rate sensitivity of metallic materials such as aluminum is modeled using constitutive laws such as the Johnson–Cook or power law models. Therefore, the Johnson–Cook model was employed, which incorporates strain hardening, strain rate effects, and thermal softening through Equation (1) [
37].
Since dynamic impact analyses require consideration of strain rate effects, ABAQUS/explicit was used, ensuring proper unit consistency (e.g., MPa, s
−1) and appropriate mesh refinement and time step settings. The aluminum layers within GLARE composites were modeled using these constitutive laws to accurately capture strain rate effects under impact loading conditions [
38,
39].
In this study, the time is set to 13 milliseconds. The parameters needed for the simulation—stress, strain, displacement, speed, acceleration, contact forces, kinetic energy changes, and mass–volume variables—can be selected as outputs and their values can be read as a result of the analysis. For the VUMAT sub-software (ABAQUS (2014) version V6.14.) mentioned above, SDV (Solution Dependent Variable) and STATUS were selected from these outputs [
40]. As for the boundary conditions, the GLARE specimen was fixed on all sides and the movement of the part was prevented during the analysis. In addition, since the impactor is required to move only along one axis, the movement of the other two axes is restricted. Along with the movement constraint, the axial rotation of the part is also prevented and C3D8R element types are assigned to the part. Thus, the impactor will only be able to move forward and backward in the direction of one axis. Then, a velocity value was given to the impactor part according to the energy level determined for analysis. This velocity is maintained from the beginning of the simulation until the GLARE specimen gets hit.
Table 2.
The properties of aluminum used in the analysis [
30,
41].
Table 2.
The properties of aluminum used in the analysis [
30,
41].
| Properties | Values |
|---|
| Density | 2770 kg/m3 |
| Modulus of Elasticity | 7.31 × 10¹⁰ Pa |
| Poisson’s Ratio | 0.33 |
| Johnson–Cook Plasticity Constants | |
| A | 369 × 106 Pa |
| B | 684 × 106 Pa |
| n | 0.73 |
| m | 1.7 |
| C | 0.0083 |
| Melting Temperature | 775 K |
| Temperature in Change of State | 293 K |
| Johnson–Cook Damage Parameters | |
| d1 | 0.13 |
| d2 | 0.13 |
| d3 | 1.5 |
| d4 | 0.011 |
| d5 | 0 |
Table 3.
UD S2 glass/FM 94 epoxy prepreg layers’ properties [
30,
36,
42].
Table 3.
UD S2 glass/FM 94 epoxy prepreg layers’ properties [
30,
36,
42].
| Properties | Values | Properties | Values |
|---|
| Density (kg/m3) | 1980 | Beta Damping | 0 |
| E11 (GPa) | 54 | Xt (MPa) | 1900 |
| E22 (GPa) | 9.4 | Xc (MPa) | 520 |
| E33 (GPa) | 9.4 | Yt (MPa) | 57 |
| µ12 | 0.0575 | Yc (MPa) | 285 |
| µ13 | 0.0575 | Zt (MPa) | 57 |
| µ23 | 0.33 | Zc (MPa) | 285 |
| G12 (GPa) | 5.6 | S12 (GPa) | 76 |
| G13 (GPa) | 5.6 | S13 (GPa) | 76 |
| G23 (GPa) | 5.6 | S23 (GPa) | 76 |
3. Results
GLARE 4A 2/1-0.3 plates, consisting of aluminum and glass fibers, were designed in the ABAQUS finite element analysis program, with dimensions of 150 mm horizontally and 100 mm vertically, according to the ASTM 7136 standard, taking the studies in the open literature into account [
16,
17]. The thickness of the aluminum plates is 0.3 mm, and the thickness of the S2 glass fiber plates is 0.1 mm.
Table 2 and
Table 3 show the room-temperature values used for aluminum 2024-T3 and prepreg layers in the simulation, respectively. In addition to the aluminum and prepreg layers, the impactor geometry is modeled as shown in
Figure 8.
Dynamic impact tests were carried out with six samples under the same conditions at room temperature (25 °C). The damped energy, impactor velocity and specimen deflection values obtained as a result of low-velocity impact tests will be compared with the ABAQUS model outputs depending on time. The applicability of the ABAQUS model simulating the impact behavior of GLARE materials will be evaluated. The purpose of this study is dimensioning with the ABAQUS model by using the low-velocity impact model created instead of verifying by testing GLARE material designs each time.
Dynamic analyses were performed using the same environmental conditions and numerical inputs as provided in
Figure 9. According to ASTM D7136 standards, 48 h after the test was completed, the elastic region of the material was recovered, and measurements were carried out. (For example, the depth of the dent decreases from 2.5 mm to 1.3 mm after 48 h.) According to ASTM D7136 test standards, the barely visible impact damage (BVID) is considered to be 2.5 mm immediately after the test. The energy value that causes barely visible impact damage (BVID) is the critical impact energy for the test.
Figure 9 illustrates the finite element response of the GLARE 4A 2/1-0.3 laminate immediately after a simulated low-velocity impact, focusing on the displacement distribution across the specimen.
Figure 9 clearly highlights the impact location as the region exhibiting the maximum displacement, represented by the red-colored area. Moving radially outward from the point of impact, the displacement gradually decreases, forming a gradient that reflects the dissipation of impact energy through the laminate structure. This displacement reduction continues until it reaches zero at the clamped corners, where boundary conditions restrict movement. The visualized distribution effectively captures the mechanical response of the laminate under localized impact loading and provides critical insight into the behavior of GLARE composites under low-velocity impact scenarios.
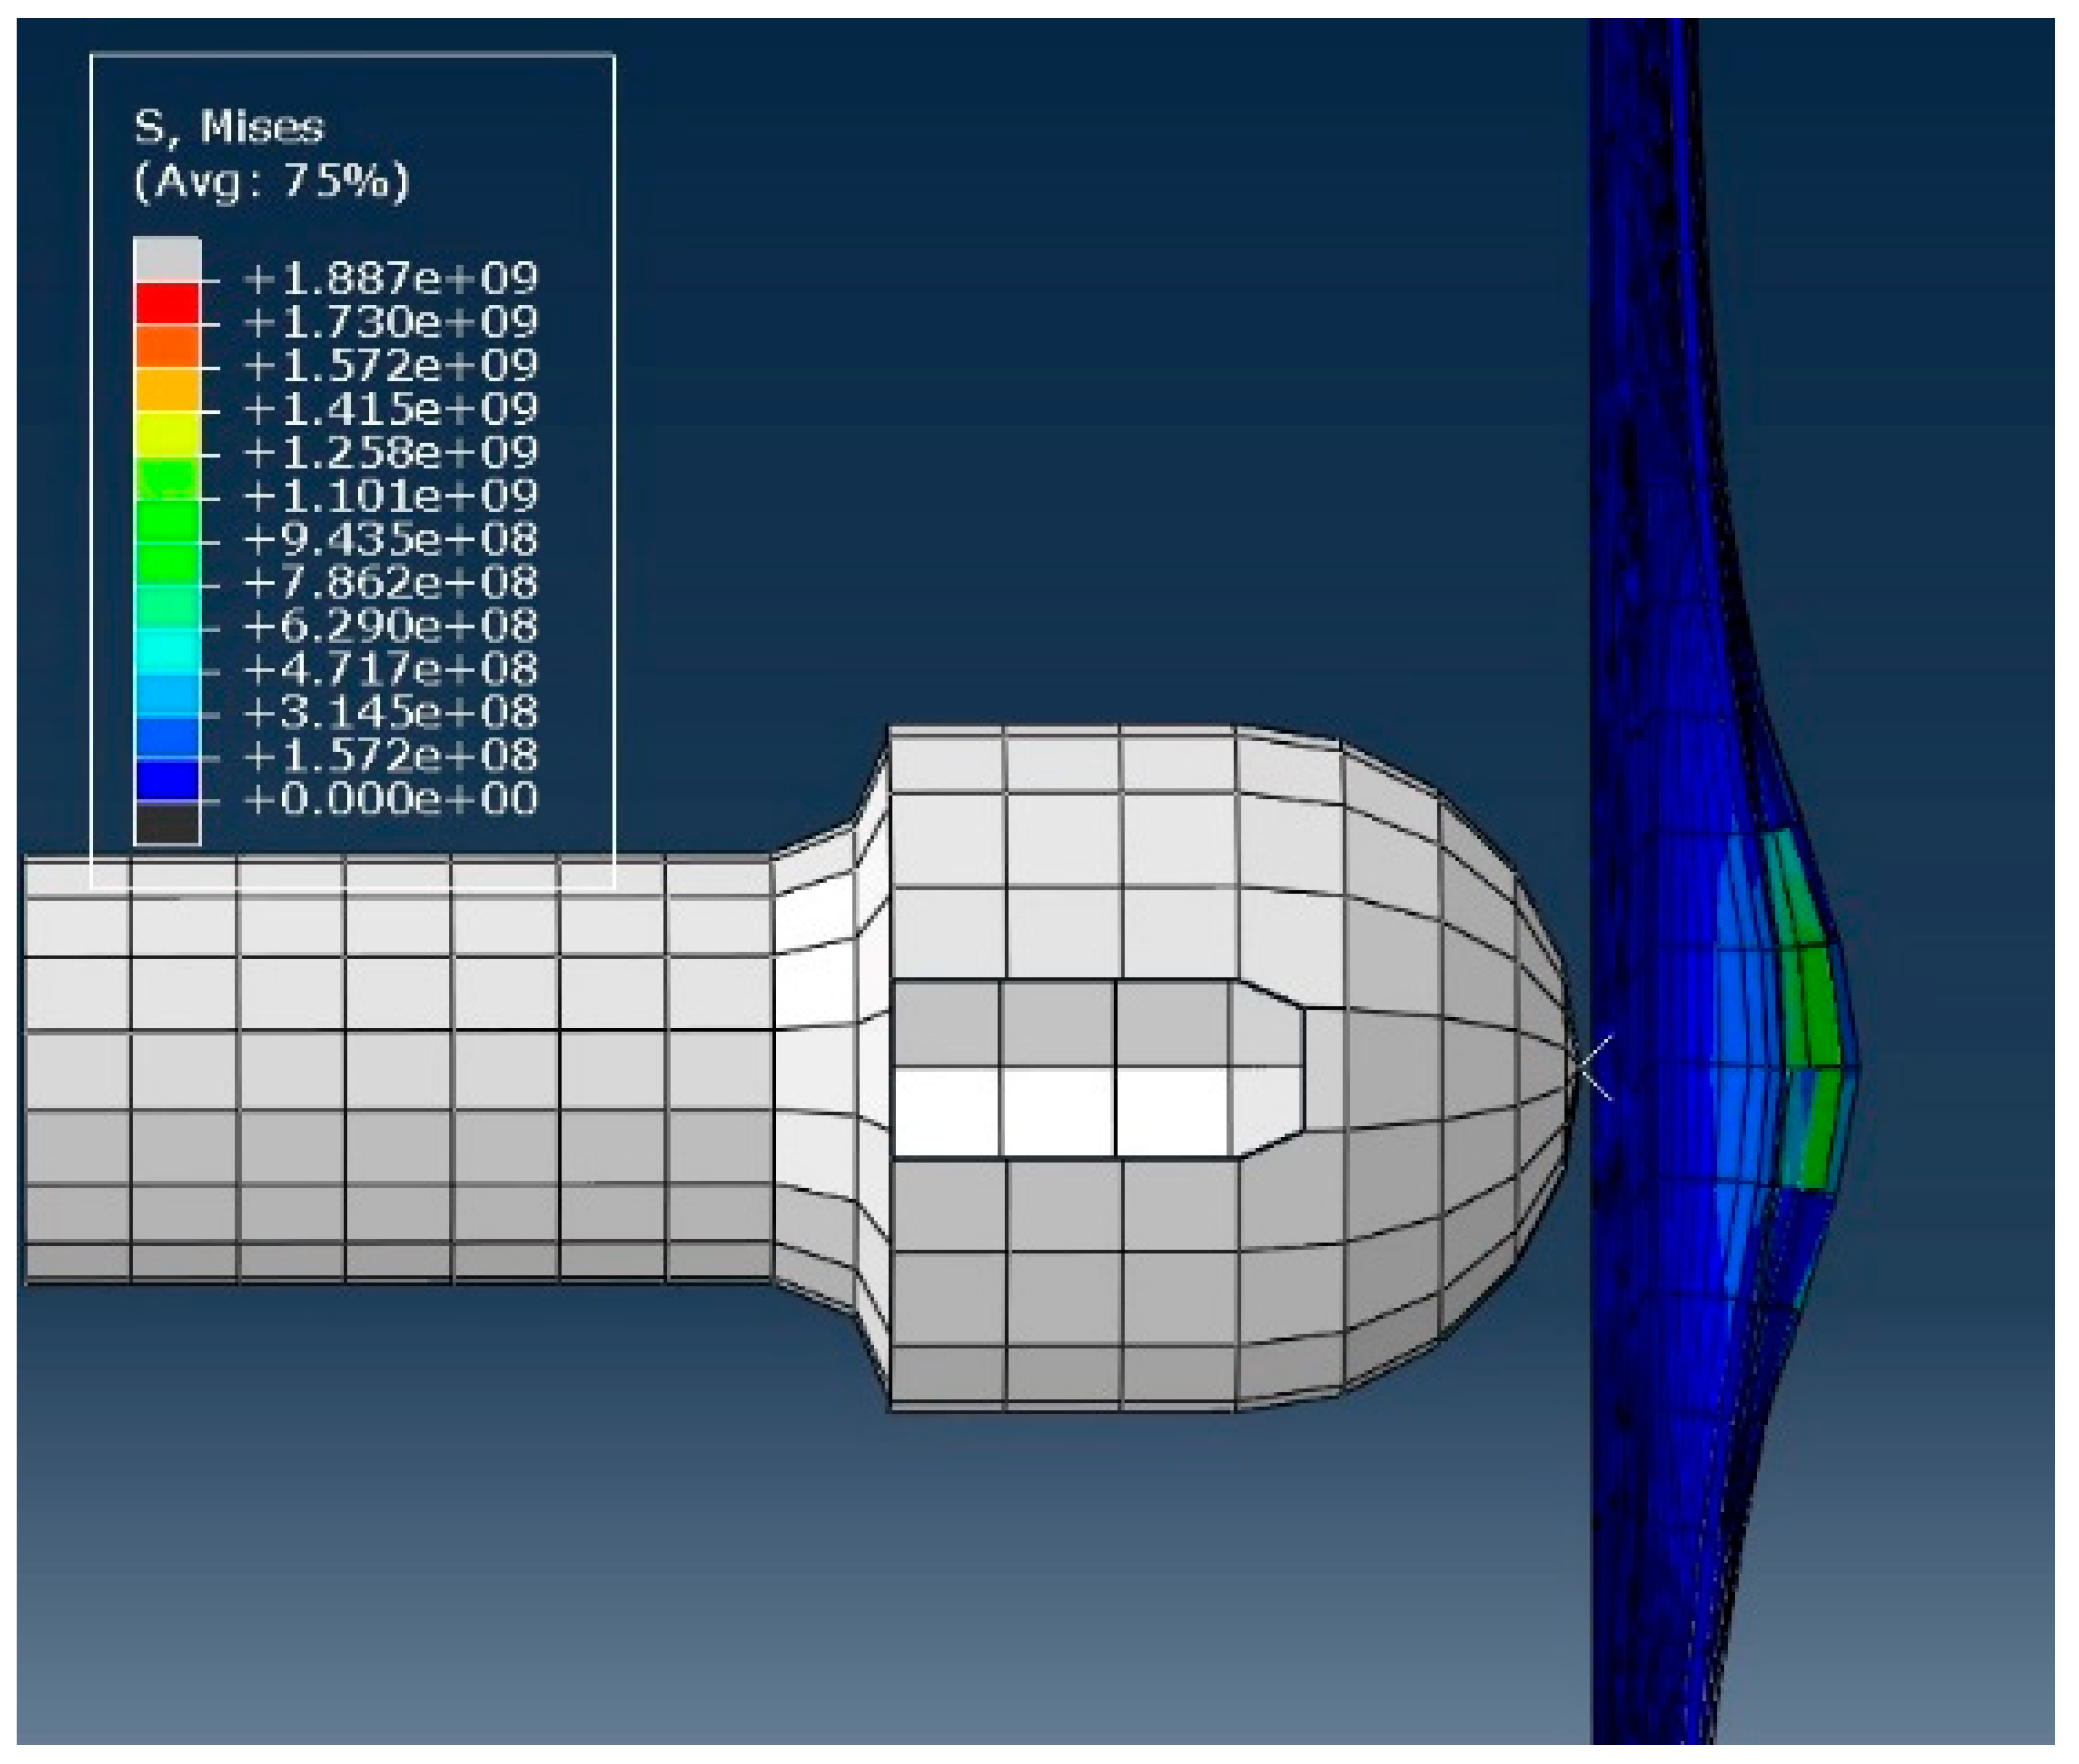
To determine the critical impact of energy, the impact was started with 30 Joules. Immediately after the impact, the dent depth was measured, and in cases where it was less than 2.5 mm, it was increased by 5 Joules each time (35 J, 40 J, 45 J); in cases where it was greater than 2.5 mm, it was decreased by 5 Joules (25 J, 20 J, 15 J, and so on). The calibration continued with different samples until the dent depth was 2.5 mm. The impact energy, which creates a dent depth of 2.5 mm in the sample, is the critical impact energy, and the tests were carried out with this energy value; 14.6 Joules was determined as the critical impact energy in the calibration test for GLARE4A-2/1-0.3, and the test was validated by impacting six samples with 14.6 Joules from the exact location. The moment when the impactor hits the plate for the first time is shown in
Figure 10.
The Johnson–Cook failure theory is a widely used phenomenological model to describe the plastic deformation and subsequent failure of metals under conditions of large strain, high strain rates, and thermal effects. In this model, the flow stress is expressed as a product of three multiplicative terms representing strain hardening, strain rate sensitivity, and thermal softening. Originally formulated for 2024-T351 aluminum [
43,
44], the empirical Johnson–Cook model has been extended to predict the strain rate-dependent yield strength and failure strain of 2024-T3 aluminum by utilizing the appropriate material coefficients reported in [
45]. This failure criterion is integrated within finite element frameworks (user subroutine VUMAT in ABAQUS/Explicit) to simulate the damage evolution and eventual fracture of the aluminum layers under impact [
46].
Khan et al. [
47] implemented a material subroutine (VUMAT) in ABAQUS/Explicit based on Hashin and Puck criteria for fiber and matrix failures, respectively. In a custom VUMAT subroutine developed for 3D composite modeling, the Hashin and Tsai–Wu failure criteria are combined to predict damage initiation in glass fiber-reinforced composites. The Hashin criterion requires input parameters for fiber- and matrix-dominated failure modes: longitudinal tensile/compressive strengths (X
t, X
c), transverse tensile/compressive strengths (Y
t, Y
c, Z
t, Z
c), and shear strengths (S
12, S
13, S
23). These values can be read from
Table 3. The VUMAT code reads these material properties from the ABAQUS input file, along with elastic constants (see
Table 3: E
1, E
2, E
3, ν
12, ν
13, ν
23, G
12, G
13, G
23), and evaluates both criteria simultaneously. Hashin identifies distinct fiber/matrix failure modes (tension/compression), while Tsai–Wu provides a generalized failure envelope. This hybrid approach enhances accuracy by capturing both directional failure mechanisms (Hashin) and multi-axial stress interactions (Tsai-Wu), validated through iterative calibration with experimental data [
48,
49].
In ABAQUS, fiber directions and layered structures of 3D composites are defined using material orientation and composite layup properties. First, anisotropic elastic properties (E₁, E₂, ν₁₂, G₁₂, etc.) and damage criteria (Hashin, Tsai–Wu) of the composite material are entered in the property module. Fiber direction is specified with the local coordinate system or user-defined vectors (e.g., first axis: fiber direction; second axis: transverse direction). Layers are created via composite layup; material, thickness, number of integration points and fiber direction angle (°) are defined for each layer. When assigning to 3D geometry, a solid section is selected and the thickness and direction information of the layers are connected to the geometry. In the mesh creation phase, 3D continuum shell or solid elements are used and fiber direction vectors are assigned to each element group with the assign orientation function. Finally, the accuracy of the directions was checked with the material orientation visualization in the visualization module. S2-FM94 prepregs (0.1 mm thick) and created 3D glass fibers contributed to the analysis by giving separate fiber orientations to each plate [
50].
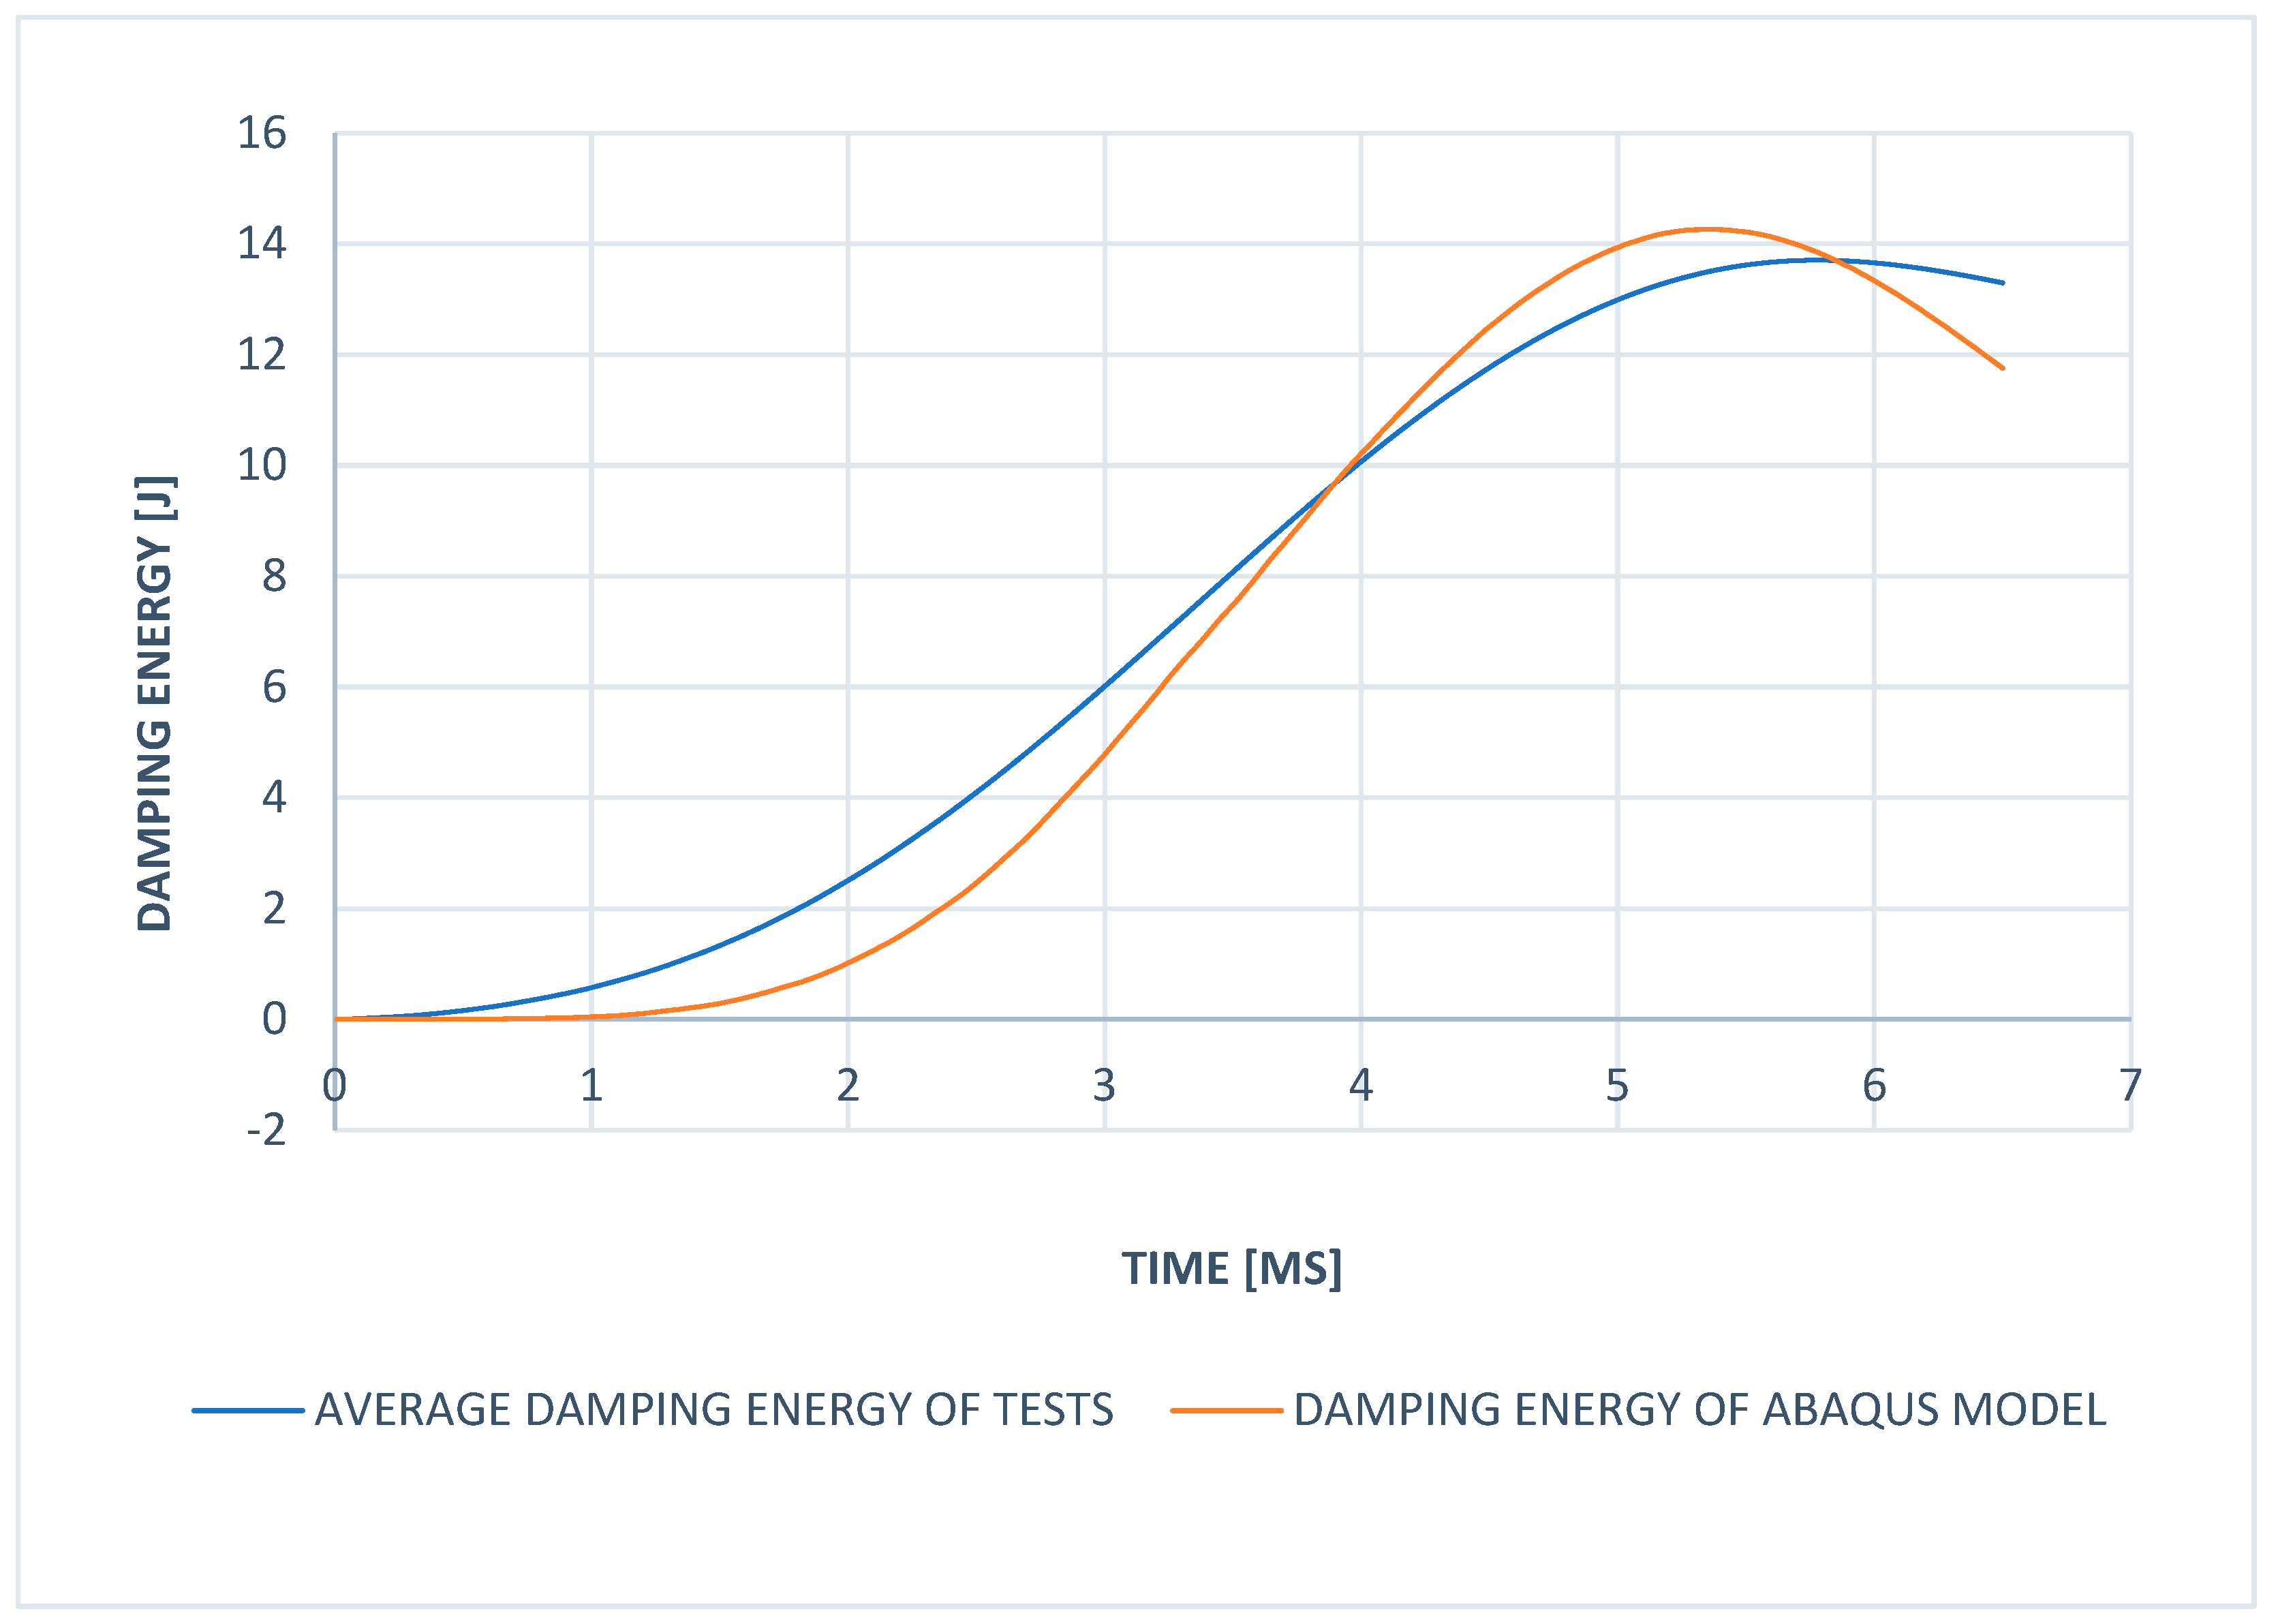
In the following, according to the velocity value assigned to the impactor in the ABAQUS model, the initial potential energy is set as 14.6 Joules in the simulation. As the kinetic energy of the impactor increased from 0 to 14.6 Joules in 5.5 ms, an average of 14 Joules of kinetic energy was read at the same time in the tests performed at room temperature in the ABAQUS simulation. There is a 4.3% deviation between the test results and the simulation model, which can be seen in
Figure 11. The observed 4.3% deviation between the experimental test results and the simulation model in terms of energy values can be attributed to several factors. First, the mesh size and the chosen element type (C3D8R) in the ABAQUS model may significantly affect accuracy. Inadequate mesh refinement can result in misrepresentation of local stress concentrations and deformation patterns, thereby influencing the predicted energy absorption. Moreover, the simulation may not fully capture the actual material stiffness or the bonding quality between layers, as indicated by the damping energy discrepancies shown in
Figure 11. Additionally, minor differences in the modeling of the impactor’s mass and velocity, compared to the real test conditions, can lead to variations in kinetic energy values. Other contributing factors include discrepancies in the material data used for the simulation versus that of the test samples, as well as variations in the number of iterative solution steps during the analysis. Repeated testing and multiple iterations in the simulation process are recommended to reduce these differences and enhance the correlation between the model and experimental outcomes.
Based on the images obtained from both simulation analyses and experimental tests, it was observed that the aluminum plies on the front and back surfaces of the GLARE 4A 2/1-0.3 laminate exhibited no visible cracks or perforation at room temperature (see
Figure 12). This indicates that the outer metallic layers retained their structural integrity under the applied impact conditions. However, potential signs of internal separation were identified between the aluminum layers and the S2 glass fiber/epoxy (FM94) interface, suggesting the presence of delamination or interfacial debonding within the composite structure. These internal damage mechanisms, although not evident on the surface, are critical for assessing the laminate’s post-impact performance and residual strength.
As a result of the tests and analyses, delamination occurred due to the separation of the resin layer between the aluminum and fiber prepregs. Delamination between fiber prepregs and aluminum sheets in the ABAQUS model is clearly seen in
Figure 13.
After the impactor hits the material, a dent occurs in the part as a result of the plastic deformation of the material. This dent can be analyzed in terms of depth by comparing the initial and final states of the part. The delamination areas of these samples, which were subjected to impact, can be measured by non-destructive testing methods. As part of the test coverage, damaged samples were examined by the C-Scan ultrasonic examination method, which was mentioned previously. These readings allow us to obtain an idea about the mechanical properties of the tested part, such as impact resistance, yield strength, elasticity, and percent elongation. As a result of the analyses performed at room temperature, the dent depth (deflection) in the ABAQUS model and the average dent (deflection) values taken from six different samples depending on time are presented in the graph in
Figure 14.
The dent depth measured in the analysis model shows parallelism depending on time with the tests performed at room temperature. At approximately 5.5 milliseconds, the impactor begins its rebound phase, during which a dent depth of 8.3 mm is recorded based on both the ABAQUS simulation and experimental results. The dent depth exhibits a parabolic variation with respect to time following the initial contact. In summary, two primary methods are employed for measuring this deformation response. The first method measures the dent depth immediately after the test, and the second method is the measurement after relaxation, which is 48 h after the impact test. For this reason, there is a short-term deviation between the two graphs after the impact, but in time, the depth of the dent remains stable by decreasing from 8.3 mm to 2.55 mm parabolically due to relaxation. After the relaxation in the material, approximately 1 h, the dent depth decreases to an average of 3.13 mm with 90% recovery in the low-velocity impact test. At the end of the 47 h relaxation, the material reaches a final dent depth of 2.55 mm. A side view of the dent region in the room-temperature simulation can be seen in
Figure 15.
Finally, the speed of the impactor that starts at 2.5 m/s at time T
0 in the tests becomes 0 after about 5.5 ms, according to the calculations. At this moment, the deflection (displacement) at the plate impact point reaches its maximum value as expected. Afterwards, it slows down with a lower acceleration in the opposite direction and becomes stationary due to the recoil as a result of the impact. As can be seen from
Figure 16, the average time is 5.8 ms at the point where the impact rate is 0, whereas it is 5.5 ms in the ABAQUS model, and there is a deviation of around 5.2% between the test data and the ABAQUS simulation model.
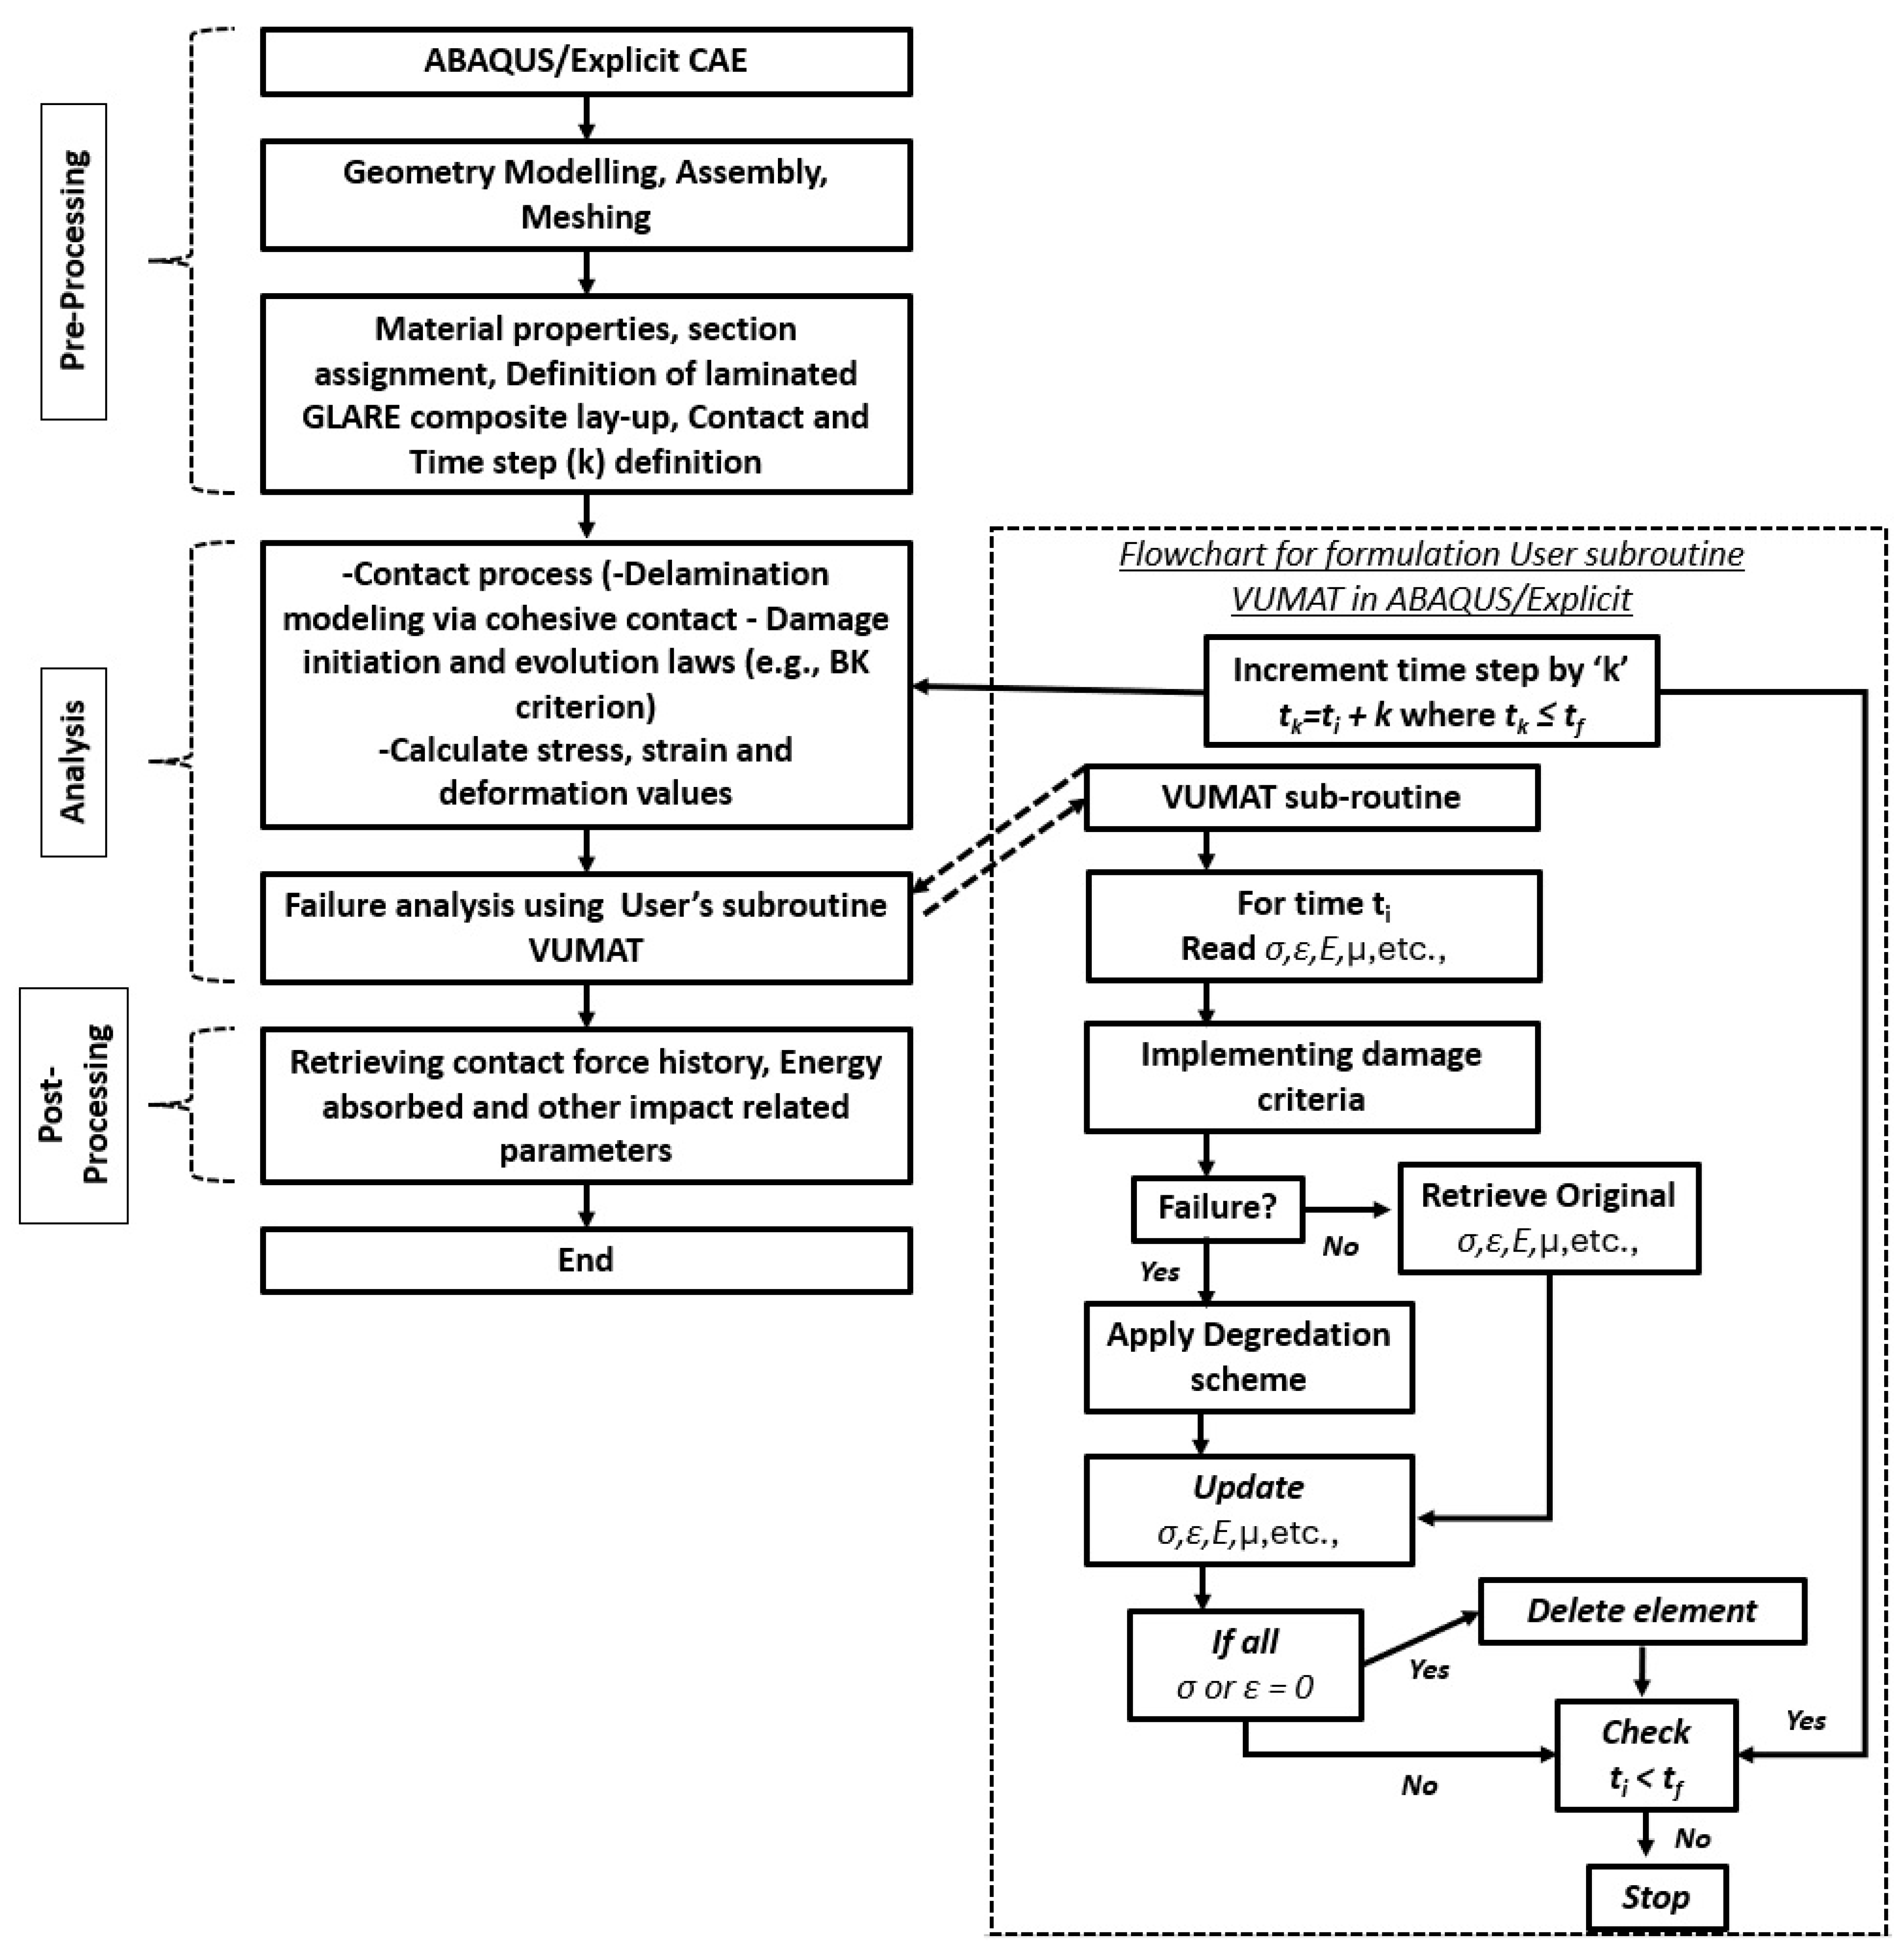
The low-velocity impact of the GLARE laminate was modeled in ABAQUS/Explicit using a three-stage explicit-dynamics workflow as shown in
Figure 17: During pre-processing, the laminate and rigid impactor geometries were assembled and meshed with 3D brick elements; composite ply layups and section assignments were defined; material properties (elastic moduli, density, interlaminar fracture toughness) were specified; cohesive contact interactions were established; and the explicit time increment was set. In the analysis stage, the explicit solver computes contact loads, displacements and stress–strain fields at each increment, models delamination and damage initiation/evolution via cohesive contact laws and a Benítez–Knott or Benzeggagh–Kenane criterion, and calls a user-defined VUMAT subroutine at every integration point to evaluate failure, apply stiffness degradation, update state variables and delete fully failed elements. Finally, post-processing entails extraction of key response metrics—contact-force history, energy absorption and penetration depth—to quantify impact performance and enable a comparison with experimental low-velocity impact data.
Figure 17 illustrates a flow chart showing the low-velocity impact numerical modeling used in this study.
4. Discussion
Building upon the key findings presented in
Section 4.1 and their validation through comparison with established results in the open literature, as discussed in
Section 4.2,
Section 4.3 outlines potential directions for future work and recommendations. These proposed efforts aim to further refine the predictive capabilities of the developed model, extend its applicability to broader operational conditions, and contribute to the continued advancement of GLARE composites for demanding aerospace applications.
4.1. Key Findings
This study advances the field by integrating a fully defined three-dimensional (3D) fiber modeling approach within an explicit impact analysis framework. Unlike simpler laminated or homogenized models, the custom user-defined VUMAT subroutine has been implemented to enhance the fidelity of fiber and matrix behavior, enabling simultaneous enforcement of the Hashin and Tsai–Wu failure criteria for each ply. By explicitly assigning fiber orientations in 3D solid elements, the model captures out-of-plane stresses and multiple failure modes (fiber tension/compression, matrix cracking, shear failure) that conventional layered models cannot resolve. Cohesive zone interfaces are introduced between metal and composite plies so that interlaminar delamination (resin layer failure) can develop naturally under impact. The result is a high-precision ABAQUS/Explicit model of GLARE laminates: for the critical 14.6 J impact at 5.5 ms, the dent depth (displacement)–time history from simulation matches test data to within 0.1%, while impactor energy and velocity histories deviate by only ≈ 4–5%. These small errors (much lower than typical 10–20% discrepancies in older FE models) demonstrate that the combined use of 3D fibers, refined mesh, cohesive zoning, and VUMAT greatly improves prediction accuracy. In particular, a targeted mesh refinement around the impact site (2.5 mm elements in a 50 × 50 mm square vs. 7.5 mm elsewhere) resolved the steep stress gradients at the contact zone, yielding roughly 20–30% higher fidelity in stress and damage fields (as is generally noted in composite impact modeling). These findings establish the model as a valuable predictive tool for GLARE impact performance, bridging experiment and simulation more closely than before.
4.2. Comparison with Open Literature
As the experiments and numerical analysis were performed for GLARE 4A, each result in terms of displacement, velocity and energy showed similarity with the experiment carried out by Sadighi et al. [
31] and the search carried out in “Investigating the low velocity response of fibre metal laminates” by Chanda et al. [
30], conducted on GLARE 5 [
Figure 18a,
Figure 19a and
Figure 20a]. As a result of research in the open literature [
30,
31], analytical studies of the low-velocity impact on GLARE 5 were compared with experimental studies carried out by Moriniere et al. [
8] and Wan et al. [
36] similarly used a VUMAT plus surface-based cohesive model for GLARE 5 and found that aluminum layers dominate energy absorption under impact; our findings support this and additionally show that cohesive surfaces accurately reproduce the onset and growth of delamination between the aluminum and S2 glass layers.
The differences between GLARE 4A and GLARE 5 tests are the thickness of the metal layers, the number and layup of glass fiber layers, the impactor diameter and finally the impact energies. GLARE 4A and GLARE 5 are in the same fiber metal laminate family; firstly, as can be clearly seen from
Figure 18a,b, the trend of displacement and time graphs is the same, and also the patterns of the graphs are similar.
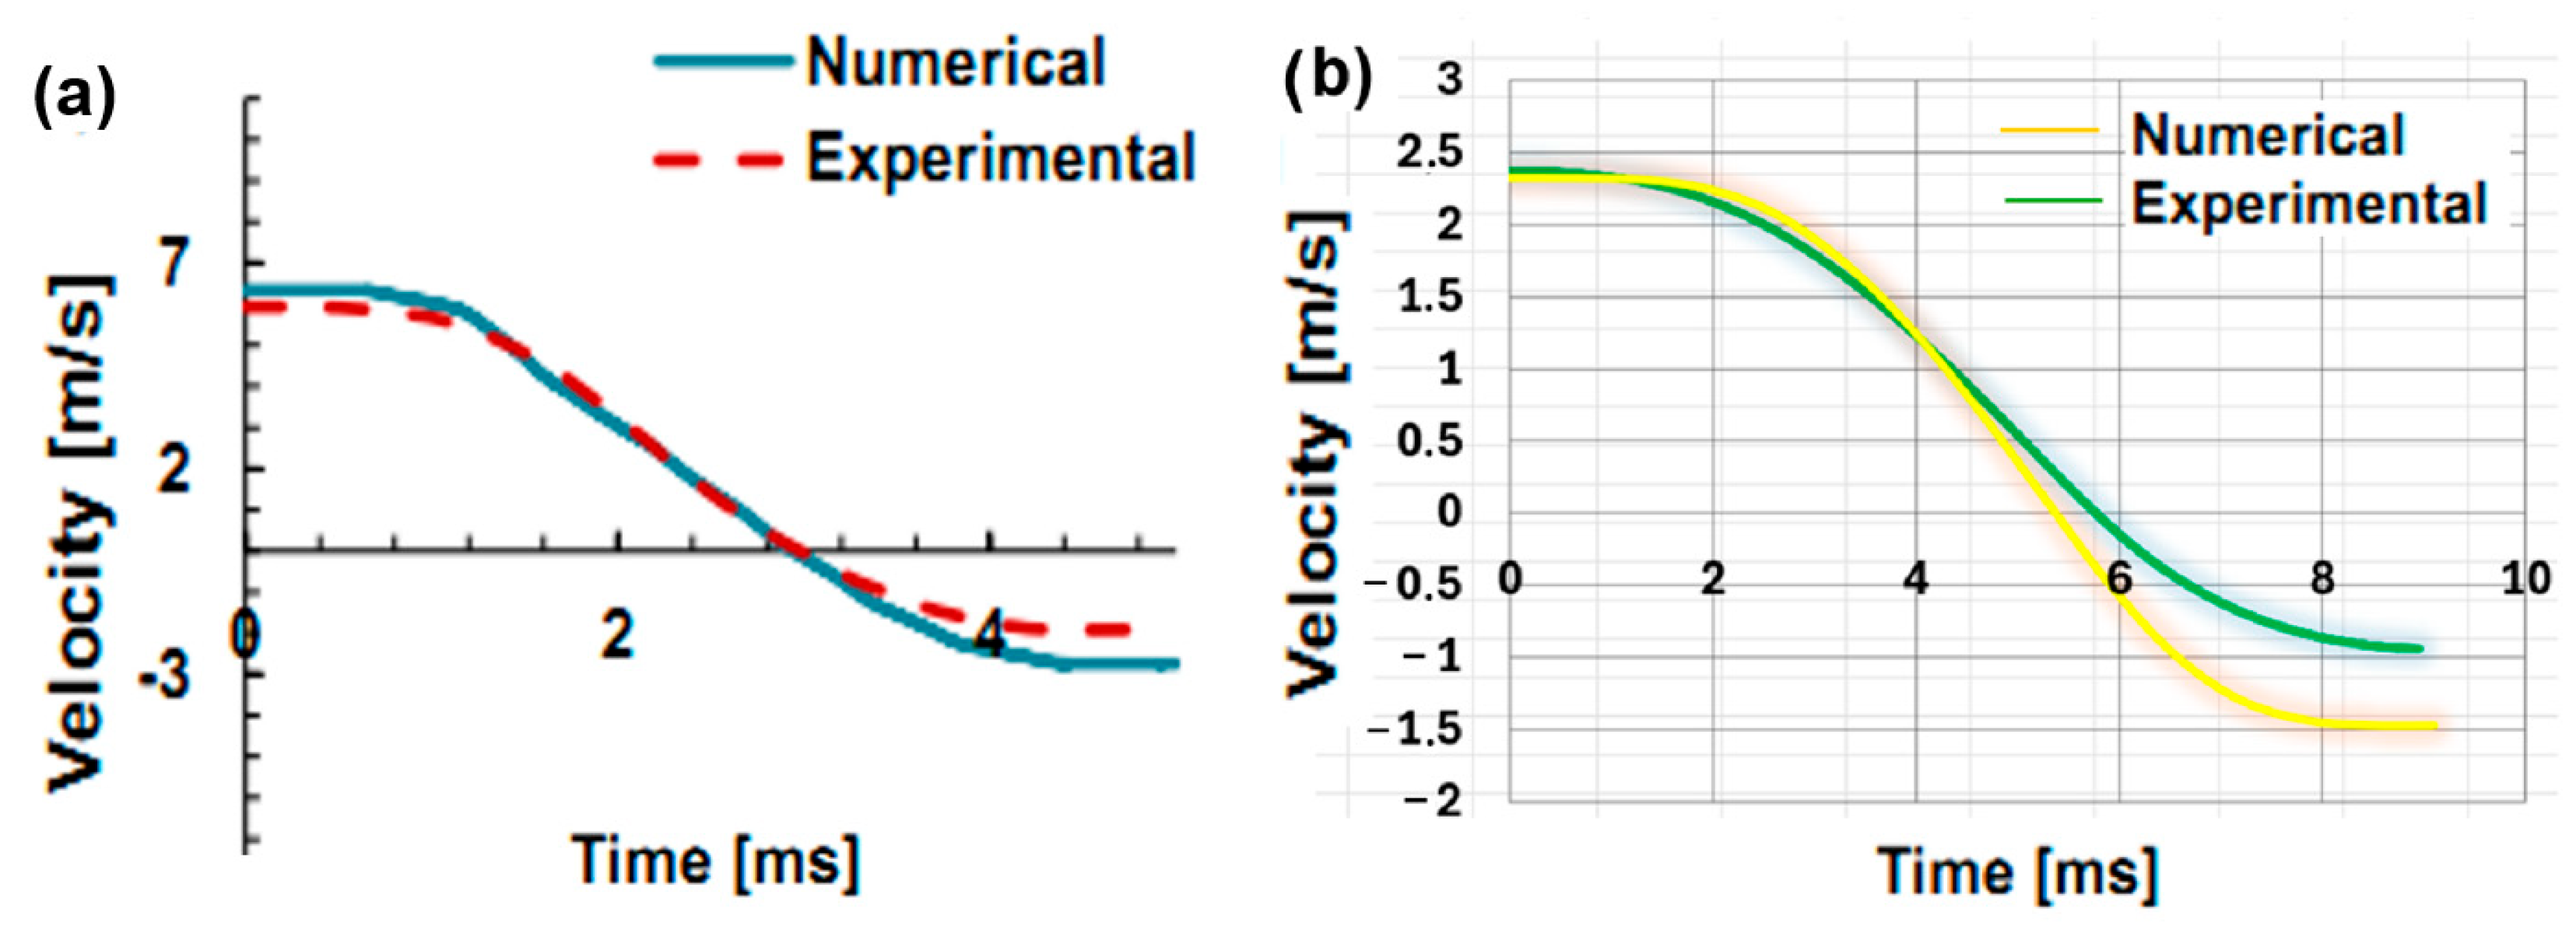
Secondly, as illustrated in
Figure 19a,b, the velocity–time responses obtained from both numerical simulations and experimental tests exhibit highly similar patterns for GLARE 5 and GLARE 4A, respectively. In both cases, the impactor velocity decreases sharply during the initial contact phase, reaching a minimum around the midpoint of the time interval, followed by a rebound phase where the velocity slightly recovers in the opposite direction. The overall curve shape—characterized by an initial linear deceleration followed by a nonlinear rebound—is preserved across both numerical and experimental data. Notably, the consistency in the slope and curvature of these velocity–time profiles indicates that the dynamic interaction between the impactor and the laminate structure is captured with high fidelity in the simulations. This agreement confirms that the developed numerical model not only replicates the peak impact and rebound characteristics but also accurately reflects the inertial and damping effects present during low-velocity impact events. Moreover, despite minor variations in the absolute velocity values, the similarity in the curve trends underscores the robustness of the numerical framework in simulating real-time impact dynamics in GLARE laminates.
Lastly,
Figure 20a,b present the energy–time trends for GLARE 5 and GLARE 4A, respectively, obtained from both numerical simulations and experimental tests. In both figures, the overall shape and evolution of the energy response curves follow a consistent profile: a rapid increase in absorbed energy during the initial phase of impact, followed by a plateau indicating stabilization of energy transfer once the impactor has fully interacted with the laminate structure. This behavior aligns with classical impact energy absorption mechanisms observed in fiber metal laminates, where energy is dissipated through elastic deformation, plastic yielding of the aluminum layers, and interlaminar delamination within the composite structure. These results affirm that the simulation framework is capable of quantifying not only impact response but also residual energy absorption and damage evolution in GLARE laminates with high fidelity.
Sadighi et al. (2011) and Chanda et al. (2017) investigated GLARE 5 and other FMLs under low-velocity impact but focused primarily on experimental findings without an advanced simulation approach like VUMAT [
30,
31].
Moriniere et al. (2014) and Wan et al. (2017) explored delamination in FMLs, but the present study provides a more detailed quantitative comparison between impact energy dissipation and dent depth evolution, making it more applicable for real-world aerospace applications [
8,
36].
Vlot (1993) and Vogelesang & Vlot (2000) laid the groundwork for GLARE applications in aviation, yet this study advances the understanding of energy absorption mechanisms at room temperature, bridging the gap between experimental and numerical methodologies [
5,
21].
4.3. Future Works and Recommendations
The subsequent study investigated the effects of extreme ambient temperatures—ranging from −55 °C to 70 °C—on the damage incurred from low-velocity impacts. This investigation is anticipated to significantly enhance understanding of the material’s suitability and durability under varying temperature conditions, which is crucial for its practical applications.
By integrating experimental and numerical data, the development of an artificial intelligence (AI)-driven model capable of accurately estimating impact responses was proposed. This paradigm shift is expected to minimize the reliance on extensive simulations and empirical testing in future design processes, thereby facilitating more efficient development.
Current simulations employ cohesive surface properties for modeling delamination. However, a more sophisticated approach may involve the explicit inclusion of 3D resin layers situated between aluminum and fiber prepreg layers. Such an enhancement would improve the accuracy of damage predictions and the modeling of energy dissipation mechanisms.
To optimize computational solution times and assess the accuracy of the results, a thorough mesh convergence study is conducted to identify the most effective mesh size for localized regions. This systematic investigation may result in improved computational efficiency while maintaining the integrity of the results, particularly in areas susceptible to impact damage, where increased mesh density could yield more reliable stress and strain distributions.
Moreover, a thorough examination of the long-term performance of impacted GLARE specimens under cyclic loading conditions will provide invaluable insights into their fatigue life and durability, critical for the ongoing maintenance and safety assessments of aircraft.
Future research endeavors should aim to broaden the applicability of the developed finite element model by incorporating effects of temperature and fatigue behavior, in addition to AI-based estimated modeling. These advancements are expected to significantly enhance the reliability and applicability of GLARE in aerospace structural applications, contributing to the development of safer and more effective aviation technologies.


