Abstract
The effect of the interaction between silica (nS) and hydroxyapatite (nHap) nanomaterials on the characteristics of unidirectional glass-fiber-reinforced epoxy (GF/Ep) composite systems is investigated in this work. The goal of the study is to use these nanofillers to improve the microstructure and mechanical characteristics. Pultrusion was used to produce hybrid nanocomposites while keeping the GF loading at a consistent 75% by weight. The hybrid nanocomposites were made with a total filler loading of 6 wt.%, including nHap, and a nS loading ranging from 2 to 4 wt.%. The mechanical performance of the composite was greatly improved by the use of these nanofillers. Compared to neat GF/Ep, hybrid nanocomposites with 6 wt.% combined fillers exhibited increased hardness (14%), tensile strength (25%), interlaminar shear strength (21.3%), and flexural strength (33%). These improvements are attributed to efficient filler dispersion, enhanced fiber-matrix adhesion, and crack propagation resistance. Incorporating 4 wt.% nS alone improved hardness (6%), tensile strength (9%), tensile modulus (21%), interlaminar shear strength (11.4%), flexural strength (12%), and flexural modulus (14%). FTIR analysis indicated Si-O-Si network formation and increased hydrogen bonding, supporting enhanced interfacial interactions. Ultraviolet reflectance measurements showed increased UV reflectivity with nS, especially in hybrid systems, due to synergistic effects. Impact strength also improved, with a notable 11.6% increase observed in the hybrid nanocomposite. Scanning and transmission electron microscopy confirmed that the nanofillers act as secondary reinforcements within the matrix. These hybrid nanocomposites present a promising material choice for various industries, including marine structural applications and automotive components.
1. Introduction
The integration of nanofillers into polymer matrices and advancements in material science have led to a global focus on research on improving the performance of materials used in construction, automotive, and insulation applications [1,2,3]. Because of its high strength-to-weight ratio, resistance to corrosion, and design flexibility, glass fiber (GF)-reinforced polymer matrix composites (GF-RPMCs) have garnered a lot of interest from a variety of industries, including biomedical, automotive, marine, aerospace, and construction. Their exceptional mechanical characteristics, including high strength, stiffness, low density, and longevity, make them perfect for load-bearing constructions in a variety of applications, from the transportation and aerospace industries to wind energy and housing [3,4]. The types of GFs, matrices, and fillers used have a significant impact on the performance of GF-RPMCs [5,6,7,8,9,10,11].
GF-RPMCs are widely employed because of their easy manufacture, cost-effectiveness, and excellent mechanical characteristics. They may, however, prematurely fail under severe loading circumstances because of limitations in interfacial bonding, tensile strength, flexural strength, and impact resistance. The tensile strength of basalt fiber reinforced epoxy composites was shown to be superior to that of glass fiber/epoxy (GF/Ep) composites by Agrawal et al. [12]. Additionally, fiber orientation and strain rate have a substantial impact on the flexural parameters of GF/Ep composites; the highest flexural strength is obtained with 0° fiber alignment. Flexural strength can be further weakened by increasing strain rates [13]. For applications where impact performance is crucial, the inadequate impact resistance of GF/Ep composites can lead to unexpected failure under dynamic loading situations [14,15,16]. Additionally, inadequate impact resistance and weak interfacial bonding may lead to fiber pull-out and delamination [17,18,19,20], which reduces the composite’s overall strength. These challenges have prompted researchers to investigate various ways to enhance the mechanical properties of GF/Ep composites. One effective technique is to incorporate nanofillers into the epoxy matrix [21,22]. Carbon nanotubes [23], graphene [24], silica [25], and Hap [26] are examples of nanofillers that have shown tremendous promise in enhancing the mechanical performance of GF-RPMCs by increasing interfacial adhesion, minimizing fracture propagation, and improving load transfer efficiency. Nanofillers can be added to the composite to improve its microstructure, which will increase the material’s strength, stiffness, and toughness.
Optimizing interfacial adhesion, preserving fiber alignment, and attaining uniform dispersion are some of the well-known difficulties associated with adding nanofillers to GF-RPMCs [27,28]. Although there are other manufacturing techniques, pultrusion has clear benefits for resolving these problems and improving the uniformity and functionality of composites. Pultrusion guarantees more consistent distribution of nanofillers than manual methods such as hand lay-up, which frequently lead to uneven dispersion and agglomeration because of operator variability [29]. Its continual impregnation process aids in maintaining homogeneity and dissolving agglomerates, as do shear pressures in the shaping die and resin bath. Furthermore, pultrusion offers better interfacial bonding and fiber alignment. In load-bearing directions, mechanical properties are improved by maintaining exact longitudinal alignment under tension through continuous fiber pulling through guides and dies. By reducing gaps and improving bonding at fiber–matrix and nanofiller interfaces through controlled resin impregnation and curing, the procedure also encourages complete wet-out and strong interfacial adhesion [30].
Combining pulling and extrusion, pultrusion is a continuous polymer composite fabrication process that enables high fiber volume fractions, which improve composite stiffness. The study by Fairuz et al. [31] discovered that excessive loading results in poorer performance owing to increased viscosity and porosity, whereas moderate filler loading boosts tensile and flexural properties. Due to poor stress transfer and moisture-induced degradation, pultrusion-prepared kenaf fiber reinforced polyester composites exhibited decreased mechanical properties after 260 days of water absorption [32]. The pultrusion of jute and jute/glass hybrid-reinforced polyester composites with high fiber volume fraction was studied by Akil et al. [33] under environmental ageing, revealing significant mechanical degradation due to water absorption and moderate temperatures. Glass fiber addition in the pultruded hybrids improved moisture resistance and strength retention, mitigating the negative effects of water ageing and temperature compared to pure jute composites. According to Safiee et al. [34], pultrusion of jute and jute/glass hybrid reinforced polyester composites with a high fiber volume fraction under environmental aging revealed significant mechanical degradation because of moderate temperatures and water absorption. The pultrusion of Kenaf Fiber Reinforced Composites (PKFRCs) with varying fiber loadings and yarn types revealed that a 70% fiber loading provided superior flexural and compression properties [35]. However, the use of twisted kenaf yarn resulted in lower mechanical performance compared to single yarn, highlighting the influence of fiber structure on pultruded composite behavior.
When nanofillers are incorporated into thermoset matrices, issues such as agglomeration, increased viscosity, and reduced mechanical properties may arise [36]. Poor dispersion can further lead to performance degradation and the formation of stress concentrations. Ultrasonication offers an effective approach to enhancing nanofiller distribution by breaking up agglomerates and promoting uniform dispersion within the polymer matrix [37].The ability of nanofillers to alter the matrix phase at the nanoscale, greatly enhancing mechanical properties without adding undue weight, makes them popular in composite materials. By increasing the density of crosslinking sites in the polymer matrix, ceramic nanofillers such as silica and Hap improve wear resistance, hardness, and stiffness while also improving load distribution. Lubricating nanofillers, including hexagonal boron nitride and molybdenum disulfide (MoS2), increase fracture toughness and decrease internal friction, which improves the flexibility and durability of composites. The processability of silica/epoxy composite is impacted by its high viscosity, which is usually caused by nanoparticle aggregation. Viscosity was successfully decreased by surface modification and solvent dispersion techniques, enhancing mechanical characteristics, which include impact and tensile strengths [38]. In order to improve mechanical performance, Akthar et al. [39] explored calcium hydroxyapatite (nHap) as reinforcing fillers in dental resin nanocomposites. Their results indicated the material’s potential for use in dentistry by showing enhanced hardness, flexural strength, and biocompatibility. Suresha and Saini evaluated epoxy composites loaded with alumina and MoS2 and reinforced with carbon fabric in a different study [40]. Improved thermal stability, decreased void content, and improved mechanical properties resulted from the use of these fine particles. Interestingly, adding 10 wt.% MoS2 increased the flexural strength by 20% and the flexural modulus by 40%.
Hybrid composites, which are polymers reinforced with multiple strengthening agents, offer unique advantages that are frequently not possible with two-phase composites. The following rationalizes the choice of UD-GFs, nS, and nHap particles for the fabrication of hybrid nanocomposites: predominantly wellknown are the outstanding properties of nanofillers in GF/Ep composites. ECR-GF, which is known for its remarkable strength, stiffness, and insulation properties, can be combined with them to produce a hybrid composite with complementary mechanical, tribological, and insulating properties. When compared to neat GF/Ep composite, the combination could end up in a composite with a better strength-to-weight ratio and mechanical performance.
The high surface area, easily adjustable surface, well-defined ordered structure, and cost-effective production of silica particles have garnered significant interest [41,42]. Silica particles in the polymer composition can improve the thermal properties and self-sufficiency of the polymer under operating conditions [43]. Hydroxyapatite (Hap), the most recently developed bioceramic, is widely used in numerous biomedical applications, mainly in orthopedics and dentistry. There are many similarities between Hap and the inorganic mineral found in teeth and bone [44].
Recent literature highlights that improving the interfacial and mechanical properties of GF/Ep composites necessitates the incorporation of carefully selected nanofillers in small, well-dispersed quantities. This study presents a novel method for uniformly dispersing small amounts of surface-modified nS and nHap within UD-GF/Ep composites using ultrasonication. The approach ensures uniform dispersion, which is essential for optimizing reinforcement efficiency, and overcomes common limitations in earlier research, such as nanofiller agglomeration. The incorporation of UD-GF and the pultrusion process makes the study even more distinctive by facilitating accurate fiber alignment and the production of scalable, industrially relevant composites.
The study aims to use well-dispersed nanofillers to enhance the interfacial bonding and overall performance of GF/Ep composites. The effects of nS and nHAp on important mechanical and physical characteristics such as strength, stiffness, and toughness are methodically assessed. In order to optimize composite design for improved structural integrity under a range of service conditions, the research aims to clarify the reinforcement mechanisms of these nanofillers. The developed hybrid nanocomposites are tailored for use in advanced structural applications where lightweight and high-performance materials are essential. Target sectors include the automotive, marine, aerospace, and civil engineering industries, where the demand for materials with superior strength-to-weight ratios, long-term reliability, and environmental resistance is continually increasing.
2. Materials and Methods
2.1. Materials
Surface-functionalized ECR–glass continuous fibers (18 µm in diameter) and pultrusion-grade epoxy resin were among the materials employed in this investigation. High-grade, uncoated silica and hydroxyapatite particles were used as supplementary reinforcements. Sigma-Aldrich in Bengaluru provided the bioactive nano-sized hydroxyapatite (nHap; diameter: 10–20 nm, length: 50–70 nm) and nano-silica (nS). Sisco Laboratories Pvt. Ltd., located in Mumbai, supplied the coupling agent 3-aminopropyltriethoxysilane (APTES). The mold was made of grade EN8 steel, the release agent was zinc stearate, and analytical-quality toluene was provided by Gems Chemicals India Pvt. Ltd, Coimbatore, India. Table 1 provides a summary of the vendor details and the densities of the materials used.

Table 1.
Summary of vendor details and material densities.
2.2. Amine Functionalization of Silica
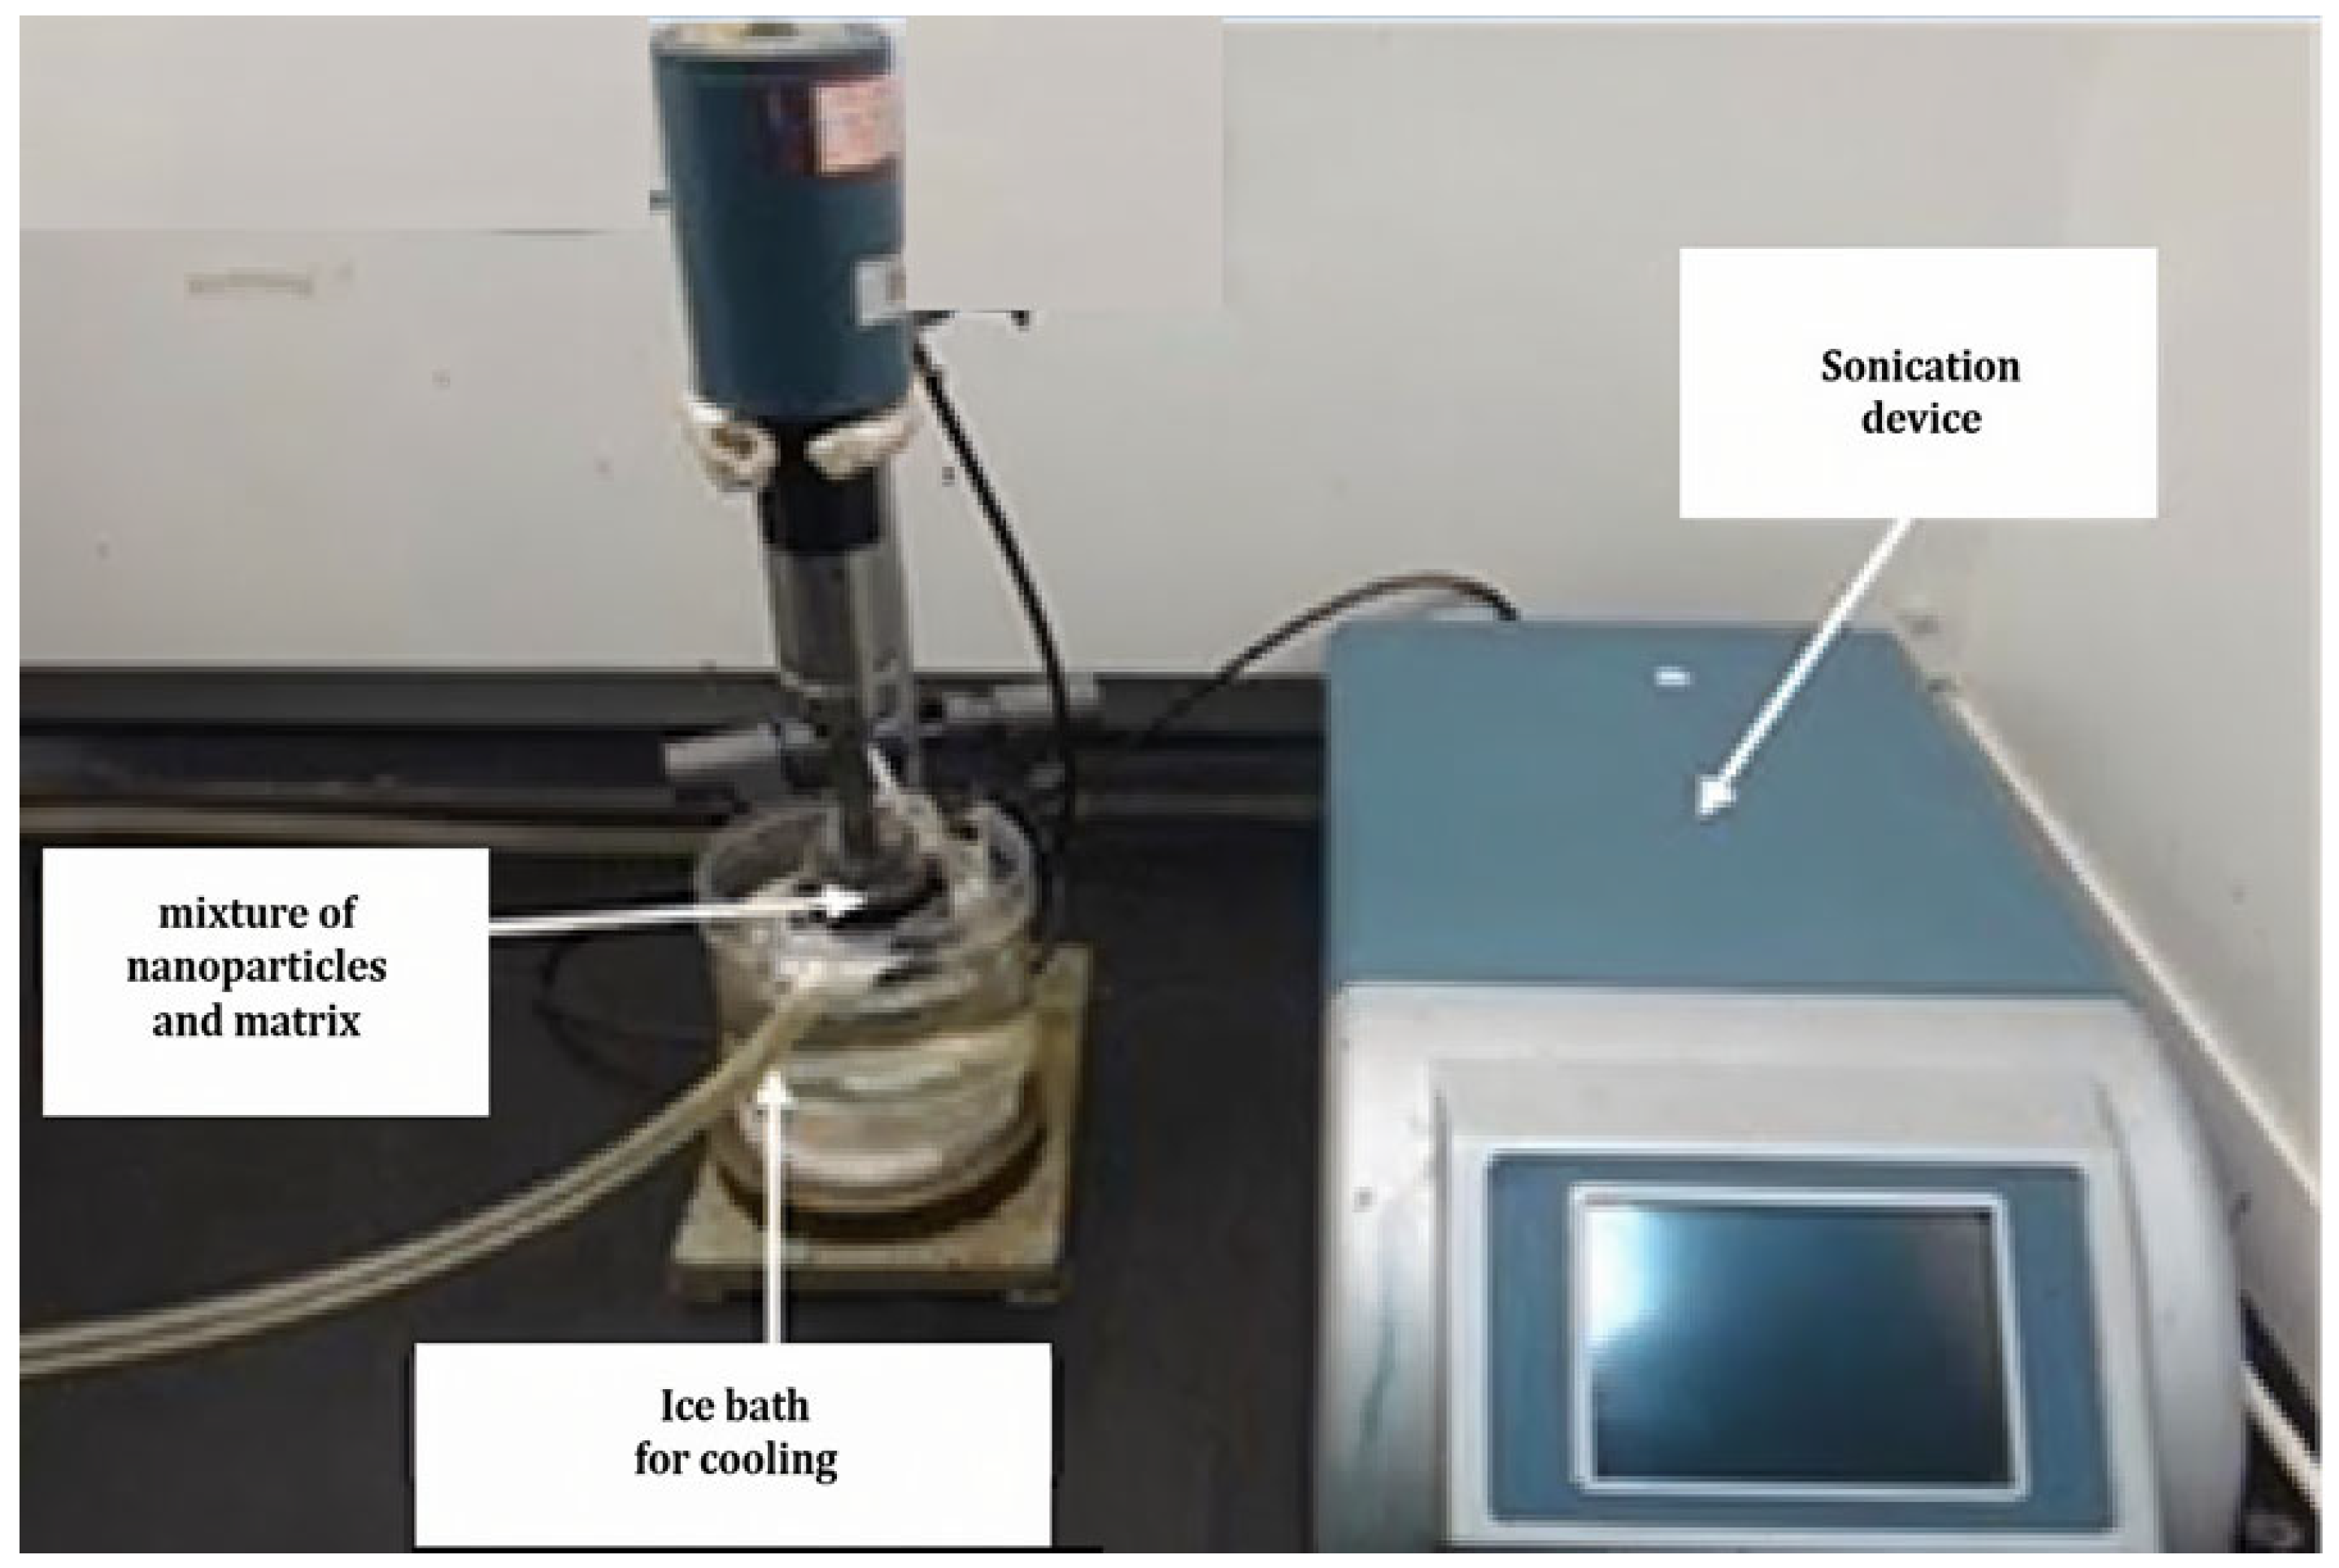
The covalent functionalization of nano-silica (nS) was achieved through 3-aminopropyltriethoxysilane (APTES) silanization, as illustrated in Figure 1. This process involved modifying the surface of nS particles to introduce amine functional groups, enhancing their reactivity for further applications.

Figure 1.
Ultrasonic dispersion of nano-silica.
To achieve uniform dispersion and reduce agglomeration, 1.5 g of nS particles were dispersed in 150 mL of analytical-grade toluene and sonicated for 45 min at a power density of 0.2 W/mL for silanization. For APTES modification, a semi-industrial sonicator (Model VCX 1500, Sonics and Materials, Newtown, CT 06470,USA) with a titanium tip, a frequency of 20 kHz, and a power output of 1500 W was employed. The ultrasonication of 100 g of nS for 25 min at 20 kHz using 1500 W of power requires a total energy input of 4050 kJ (1.125 kWh), corresponding to 40.5 kJ per gram of nS. To ensure reproducibility after sonication, 1.5 wt.% APTES was added to nS. This ratio, equivalent to 1.5 g of APTES per 100 g of nS, enables efficient amine functionalization by facilitating the engagement of silane molecules with the silica’s surface hydroxyl groups. The covalent bond between APTES and the silica surface was subsequently facilitated by refluxing the reaction mixture for 5 h at 110 °C. This stage ensured that the hydrolysis and condensation processes successfully attached the amine-functionalized silane chains. Filtration was used to remove the modified silica nanoparticles from the reaction liquid following the reflux procedure. The obtained solid product was then thoroughly washed multiple times with fresh toluene to remove any unreacted APTES and byproducts. Finally, the functionalized nS particles were dried under controlled conditions to eliminate residual solvents, yielding amine-functionalized nS suitable for the production of nanoparticle-filled GF/Ep composites.
2.3. Fabrication of Functionalized nS and nHap-Infused Composites
The required amounts of epoxy resin (MY740) and curing agent (HY918) were heated for 1 h at 60 °C in a vacuum chamber. The nS and nHap particles were treated with silane and then dried for 24 h at 110 °C in a hot air oven. To ensure even dispersion, the nHap particles were first agitated in pure ethanol and then combined with a high-shear mixer set at 1000 rpm for 5 min, followed by 40 min of ultrasonic agitation. Sonication was performed at room temperature using a 12 mm probe with an amplitude of 5 mm (1.1 s On, 2.5 s Off). After dispersion, the mixture was hydrolyzed for 10 min with the addition of a silane coupling agent. A 1 kg epoxy resin was then gradually mixed with the silane-treated nS and nHap particles, followed by 5 min of additional sonication and 40 min of further sonication. Finally, the mixture was heated to 85 °C in a vacuum oven to remove the ethanol, after which the hardener of 3 phr, i.e., 30 g, was added and stirred for 15 min at 3000 rpm.
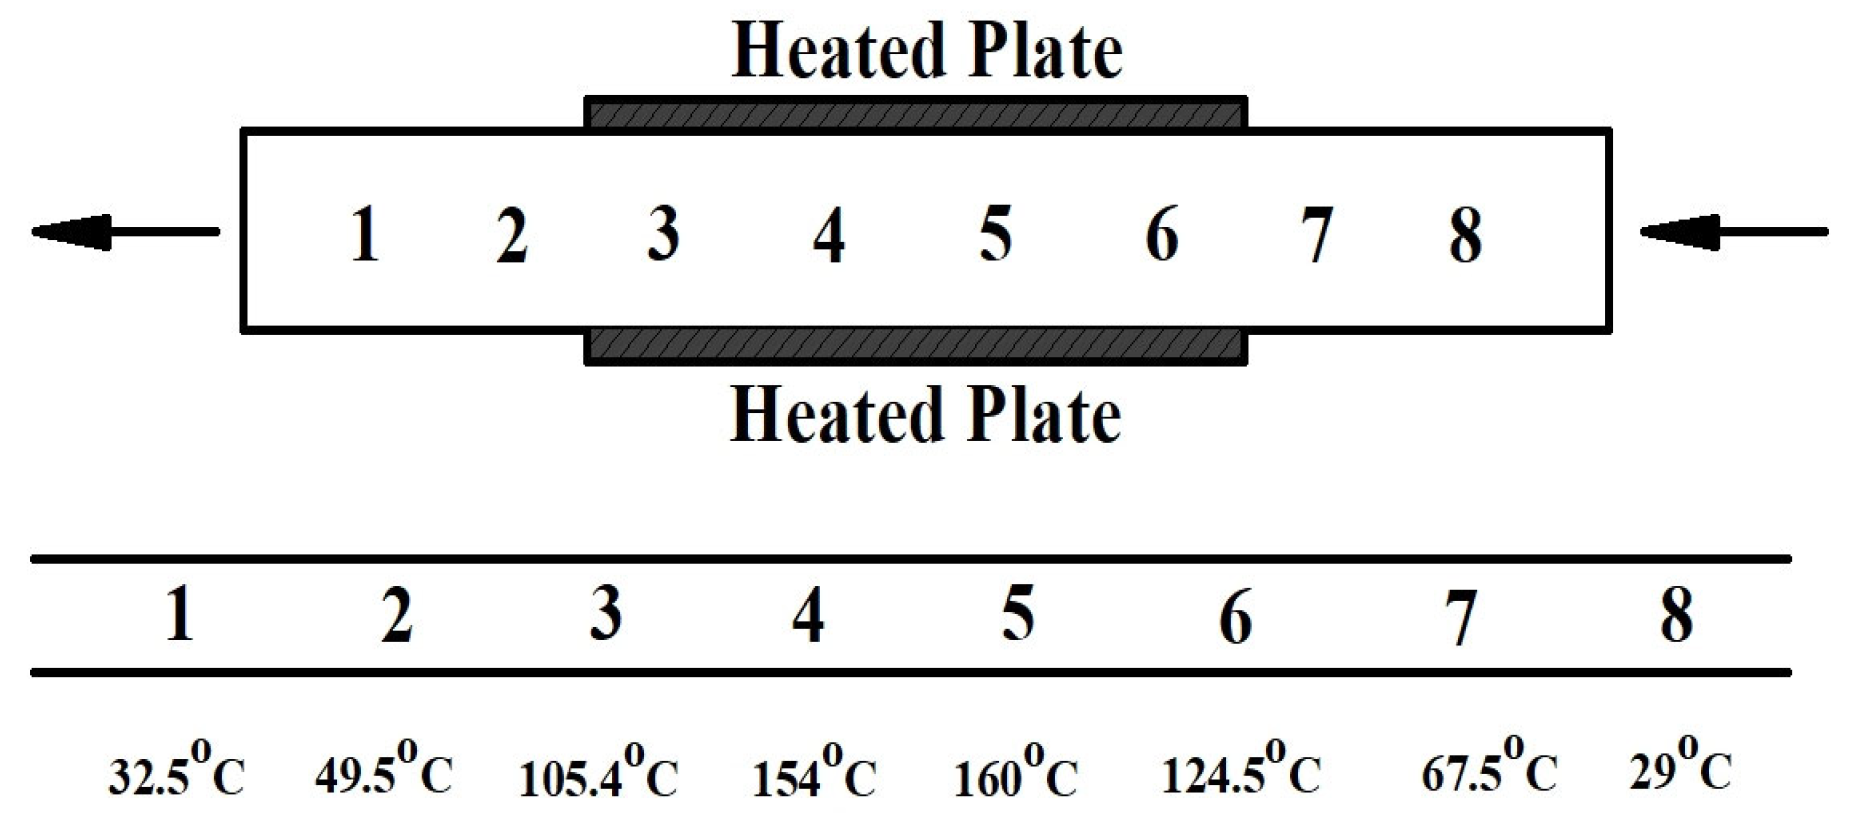
Glass fibers modified with a silane coupling agent were used to enhance interfacial adhesion. In the final composite, the GF reinforcement was maintained at 75 wt.%. A resin bath, a pultrusion die (500 mm C85 mm C 2.5 mm), and a puller comprised the lab-scale tabletop pultrusion machine. A water circulation system was used to maintain a constant temperature at both the die entrance and exit, while high-temperature PTFE tape was applied to the die surface to prevent sticking. The GF rovings were pre-cured by winding them into skeins on a former, immersing them in resin, and then drawing them through flared glass tubes. Clear, void-free composite strips were produced by pultruding the material to remove excess resin and trapped air (a flow chart is presented in Figure 2). Optimal processing temperatures along the die are shown in Figure 3. The pultrusion process was carried out at a pulling speed of 400 mm/min. With this speed and a die length of 600 mm, the predicted dwell time inside the die was nearly 2 min.The specifications of the GF/Ep composites and their hybrid nanocomposites developed and analyzed in this study are summarized in Table 2.
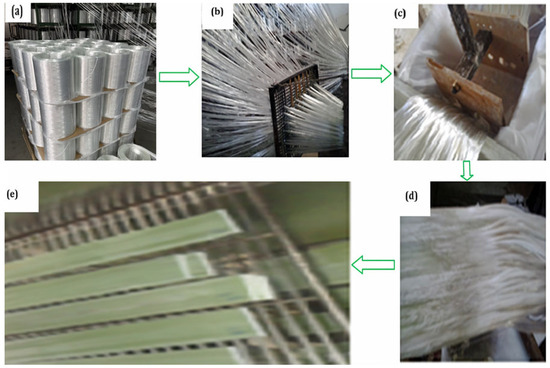
Figure 2.
(a) Creel for glass fibers; (b) glass fibers being pulled from roving bobbins; (c) fiber yarns drawn through a resin bath, ensuring thorough wetting of the fibers; (d) resin-soaked fibers fed into the die and heated; (e) finished composite slabs.
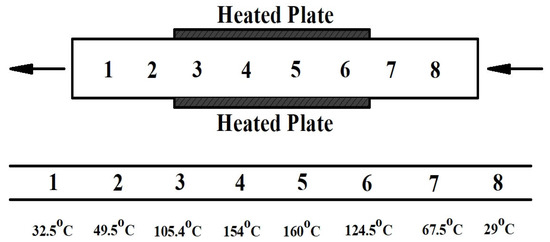
Figure 3.
Optimal temperatures for processing along the die while manufacturing composite slabs.
Table 2.
Hybrid nanocomposites selected for the present study.
2.4. Microstructure Characterization of Nanofillers and Composites
In this research work, a Joel JSM-6510LV model (JEOL Ltd., Tokyo, Japan) was used to analyze the microstructure of the silane-treated nS and nHap particles. The primary goals of the microstructure analysis of GF/Ep composites containing nanoparticles are the dispersion, interfacial bonding, and overall structural integrity of the composite material. The transmission electron microscope (TEM) sheds light on void formation, nanoparticle dispersion, and fiber–matrix adhesion. For TEM analysis, ultra-thin sections approximately 80 nm in thickness were prepared using a ultracut ultramicrotome (Leica Microsystems, Wetzlar, Germany) at room temperature. The sections were mounted on 200-mesh copper grids and examined with a JEM-2100 TEM (JEOL Ltd., Tokyo, Japan) operating at an accelerating voltage of 200 kV in bright-field mode. The study of Fourier Transform Infrared Spectroscopy (FTIR) uses infrared light that is absorbed at particular frequencies that match the vibrational bond energies of atoms in molecules. A bond absorbs mid-infrared light energy when its vibrational energy equals that of the light. At particular wavelengths, infrared radiation is absorbed by various molecular bonds that vibrate at different energies. These absorption bands collectively provide a unique molecular fingerprint, and their position (frequency) and strength affect the entire spectrum. Powder weighing 10 to 15 mg was utilized for FTIR characterization using a 4100-Type-A instrument (JASCO International Co., Ltd., Tokyo, Japan) with a scanning speed of 2 mm/s and a resolution of 16 cm−1. A UV spectrophotometer (LAMBDA 750, PerkinElmer, Freehold, NJ 07728, USA) was used to examine the transmittance characteristics of GF/Ep hybrid nanocomposites and the cured epoxy (Ep) product. This technique measures the amount of light that passes through the material over a wavelength range of 300–800 nm, giving information about the optical transparency and absorption behavior of the composites. The transmittance spectra help evaluate the effect of nanoparticle integration on the optical properties of the epoxy matrix by identifying potential changes in light scattering, refractive index, and uniformity of nanoparticle dispersion.
2.5. Hardness
The hardness of the composites was measured using a Shore D hardness tester (HT-6510D, To Kwa Wan Kowloon, Hong Kong), following the guidelines of ASTM D2240-00 [45]. A hardened steel indenter with a 1.4 mm diameter, 30° conical point, and a 0.1 mm radius tip was employed to assess the depth of indentation. A constant load of 45 N was applied during testing. Composite samples of 25 mm × 25 mm × 2.5 mm were subjected to Shore D hardness testing. To mitigate interaction effects, ten indentations were produced in each sample in two rows, separated by at least 4 mm and 2.5 mm from the edges.
2.6. Mechanical Properties (Tensile, Interlaminar Shear, Flexural, and Impact)
The GF/Ep composites and their hybrid nanocomposites were assessed for tensile strength, impact strength, flexural characteristics, and interlaminar shear strength in accordance with ASTM D638, ASTM D2344, ASTM D790, and ASTM D256 standards, respectively.
Using axial loads at both ends, tensile tests were conducted on dog-bone-shaped specimens that measured 110 mm × 10 mm × 3.5 mm. A universal testing machine (UTM) from Kalpak Instruments, Pune, India, which was configured with a suitable loading configuration for tensile testing, was used to perform the tests. Tensile tests were conducted at 23 °C using a UTM with a 100 kN capacity and a crosshead speed of 25 mm/min in compliance with ASTM D638-14 [46]. Four samples were used in the experiments to guarantee reliability. The load–displacement curve was used to calculate the Young’s modulus.
Using the same UTM, the short beam shear test was conducted in accordance with ASTM D2344M-22 criteria [47] for the interlaminar shear strength (ILSS) measurements. The test samples’ width was twice that of their thickness, and their span-to-depth ratio was 7:1.
Flexural properties of all samples were evaluated using the same UTM, in accordance with ASTM D790 standards [48]. The device measures the flexural strength of composite slabs under bending load. The samples, measuring 90 mm × 12 mm × 3.5 mm, were tested with a constant crosshead speed of 5 mm/min at 23 °C. The load–deflection curve was recorded to calculate the flexural modulus. To ensure consistency, five specimens were tested for each composition, and the results were analyzed using the UTM’s software Release 6. At least four samples were tested per composition, and the standard deviation was calculated.
In compliance with ASTM D 256 [49], the Izod impact test was used to evaluate the impact strength of GF/Ep and their hybrid nanocomposites. The measurements used for producing the specimens were as follows, per ASTM guidelines: 3.5 mm × 12 mm × 64 mm with notch marked. As per ASTM D256, the Izod impact specimens were notched with a notch tip radius of 0.25 mm and a notch depth of 2.54 mm. To perform an impact test, a hammer with a 0–5.42 J capability was employed. At least three duplicate samples were analyzed for each sample. The pendulum hammer was released from a predefined height and struck the specimen after it had been clamped vertically in the Izod impact tester. The impact energy absorbed upon fracture was recorded in order to assess toughness. This procedure was repeated for each specimen to ensure accuracy and reliability.
2.7. Fractography
The microstructure of nS-filled composites and those with dual fillers (nS and nHap) combined with GF/Ep were investigated using SEM. In addition, the fracture surfaces of the tested composites were analyzed to identify their fractographic features. Selected fractured samples of both GF/Ep and its hybrid composites were examined to provide insight into the failure mechanisms. Prior to SEM analysis, the fractured surfaces were coated with a thin layer of gold, which acts as a conductive material, to enhance imaging quality. The SEM analysis was carried out using a Joel JSM-6510LV model (JEOL Ltd., Tokyo, Japan), operating within a voltage range of 5–15 kV. All tests were conducted under semi-vacuum conditions to optimize imaging resolution and minimize surface charging effects.
3. Results and Discussion
3.1. Microstructure Study
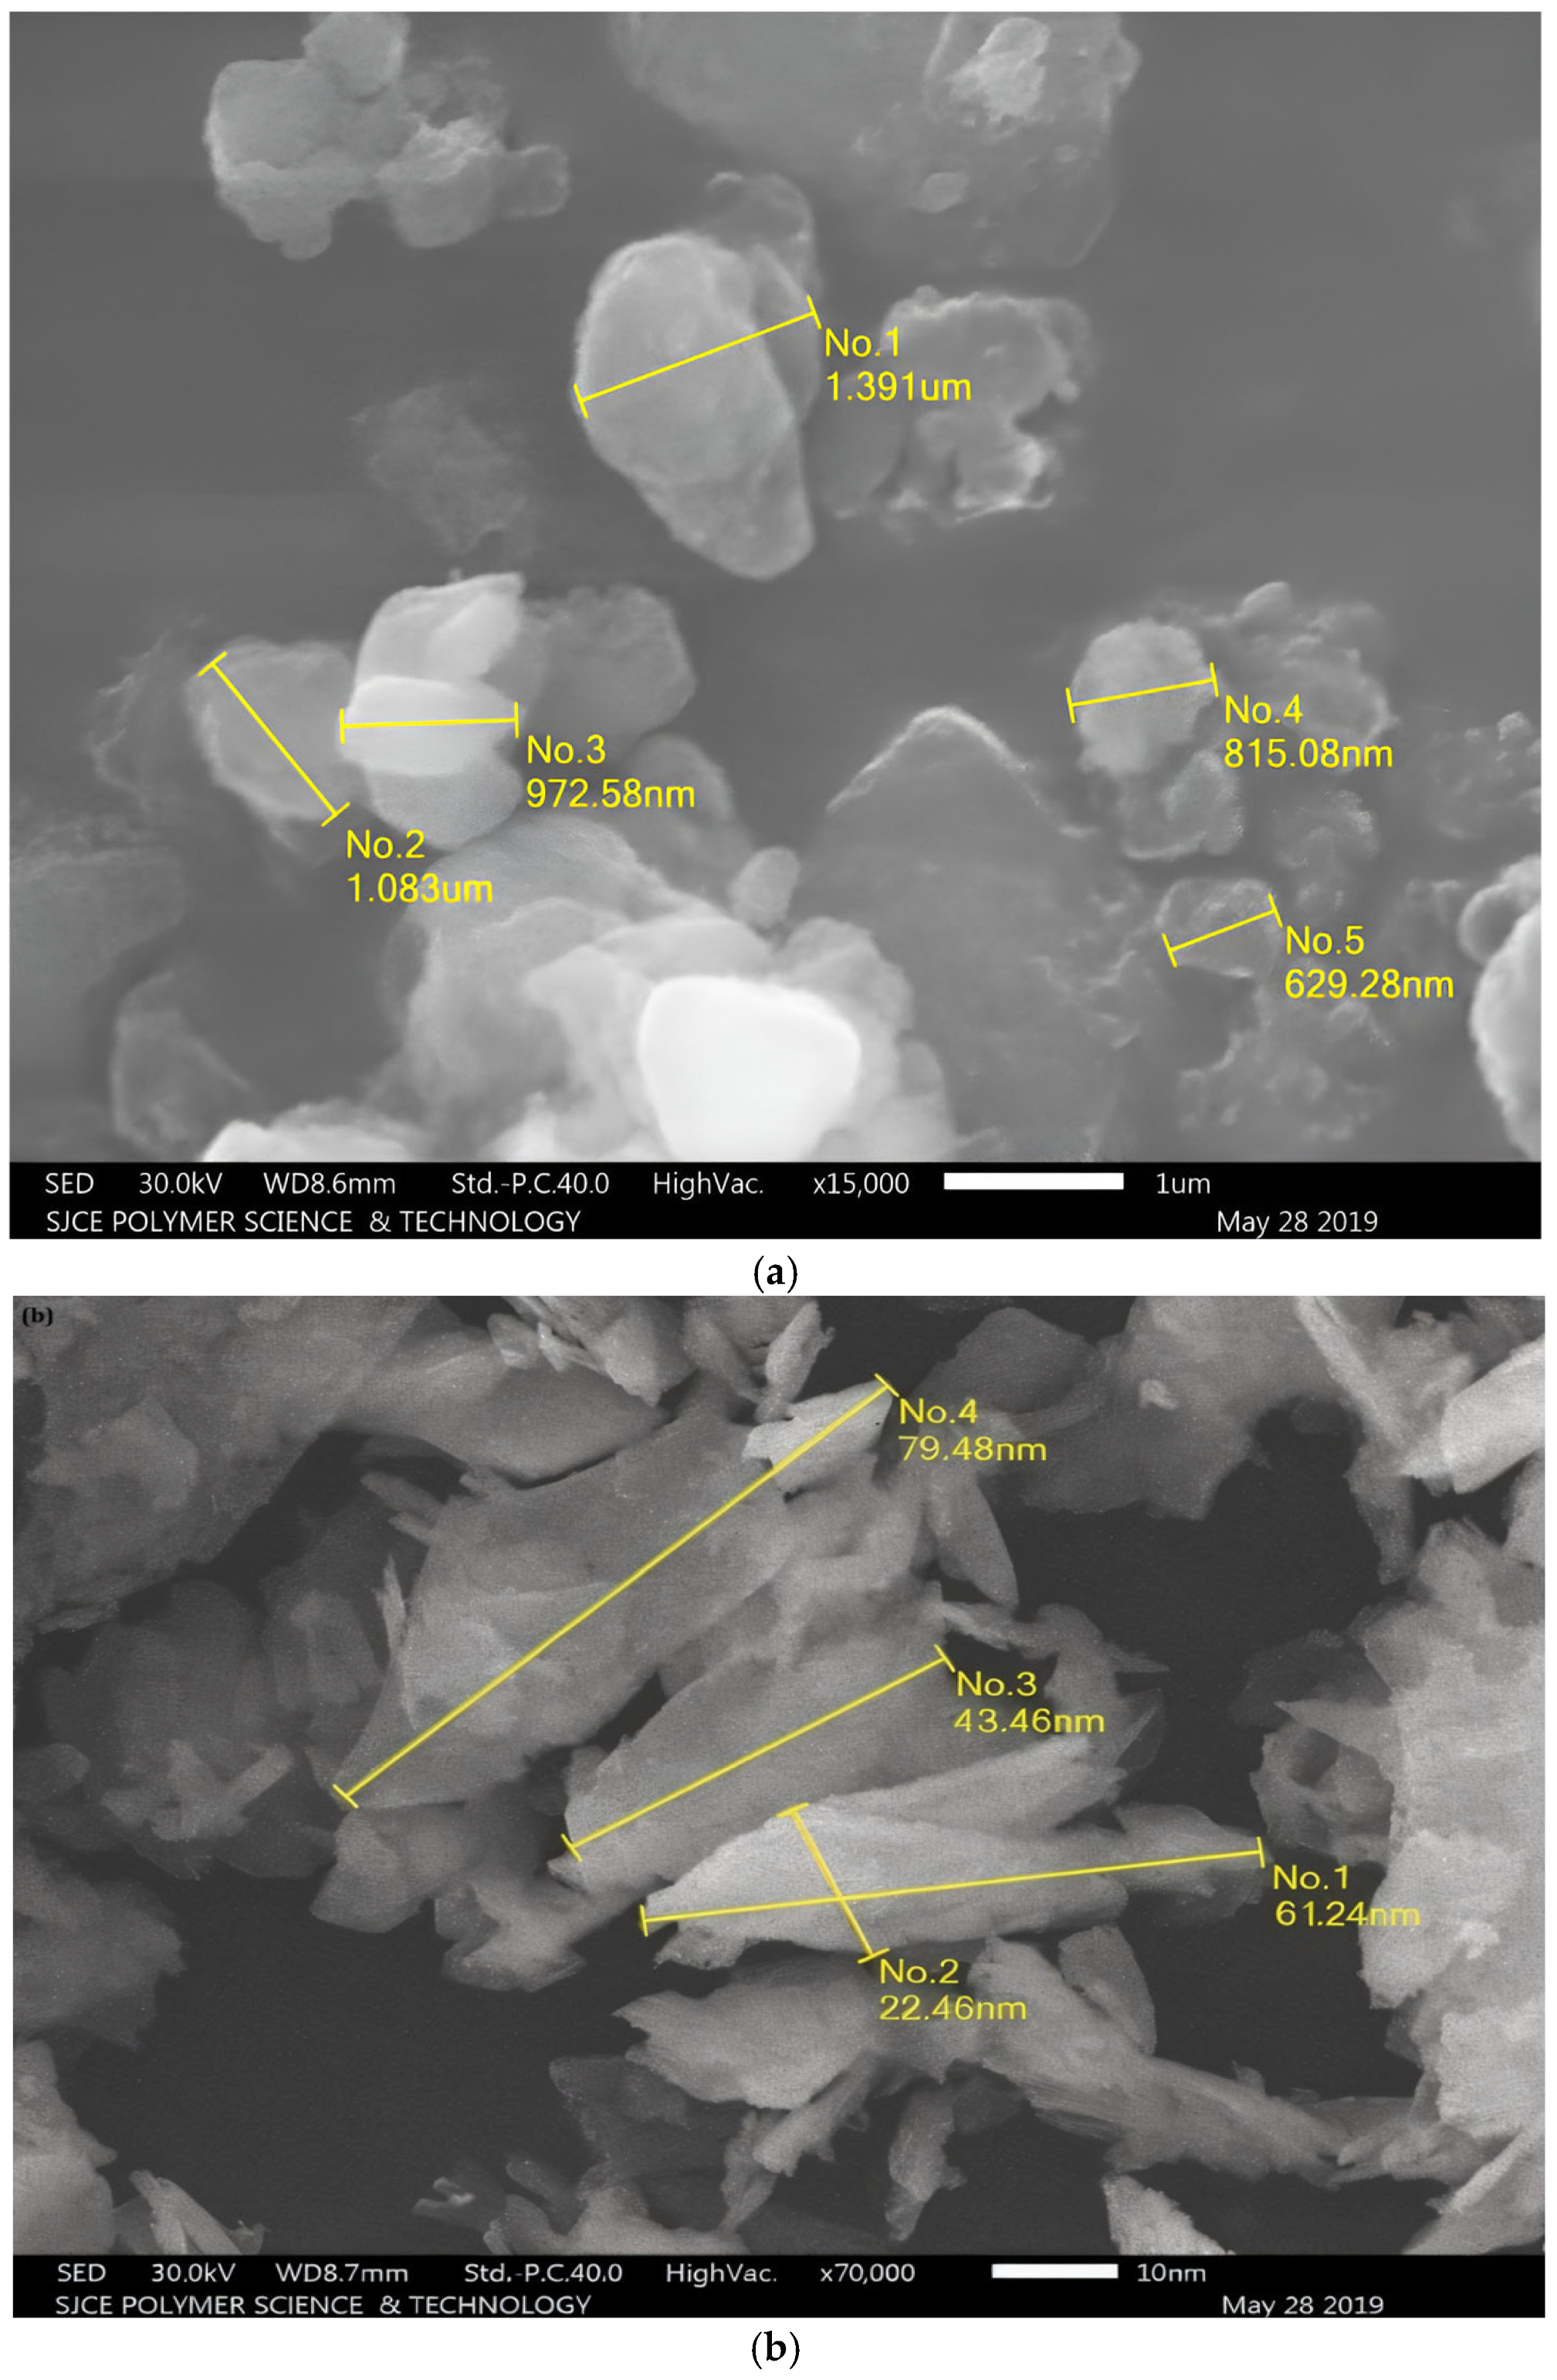
As depicted in Figure 4a, silane-functionalized nS exhibits improved dispersion and reduced agglomeration. Key morphological characteristics such as particle size, shape, and dispersion are visible in the SEM image.
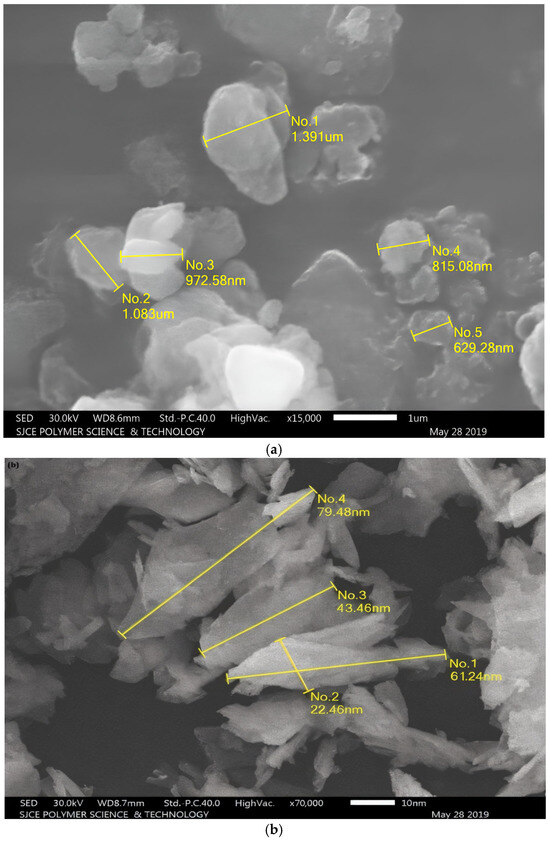
Figure 4.
Scanning electron microscopy images of (a) nS and (b) nHap particles.
Because of its high surface energy, nS usually take the form of nearly spherical particles that have a propensity to aggregate. Figure 4b displays the shape of nano-hydroxyapatite (nHap) nanoparticles. According to the analysis, the nHap particles are needle-like in shape and typically range in size from 15 to 40 nm. Transmission electron microscopy (TEM) was used to analyze the nanoparticle dispersion inside the GF/Ep composite samples. Figure 5 depicts TEM pictures of GF/Ep and their hybrid nanocomposites. TEM micrographs revealed the presence of individually dispersed nS and nHap particles embedded in the GF/Ep composite. Although occasional agglomerates were observed, the overall nanoparticle dispersion was uniform and satisfactory. Figure 5a presents a TEM micrograph of the GF/Ep (H0) composite, clearly illustrating the distinct interface between the epoxy matrix and the surrounding glass fibers. The fiber–matrix interface shows good wetting and interfacial adhesion because the Ep is uniform and devoid of voids or defects. Effective load transfer and mechanical performance of the composite depend on the matrix successfully impregnating the fiber surface, as indicated by the smooth, distinct boundaries between the GFs and Ep.
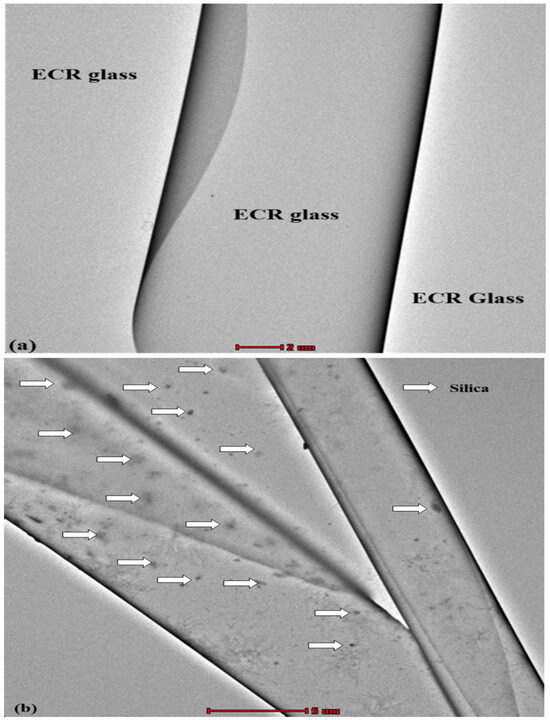

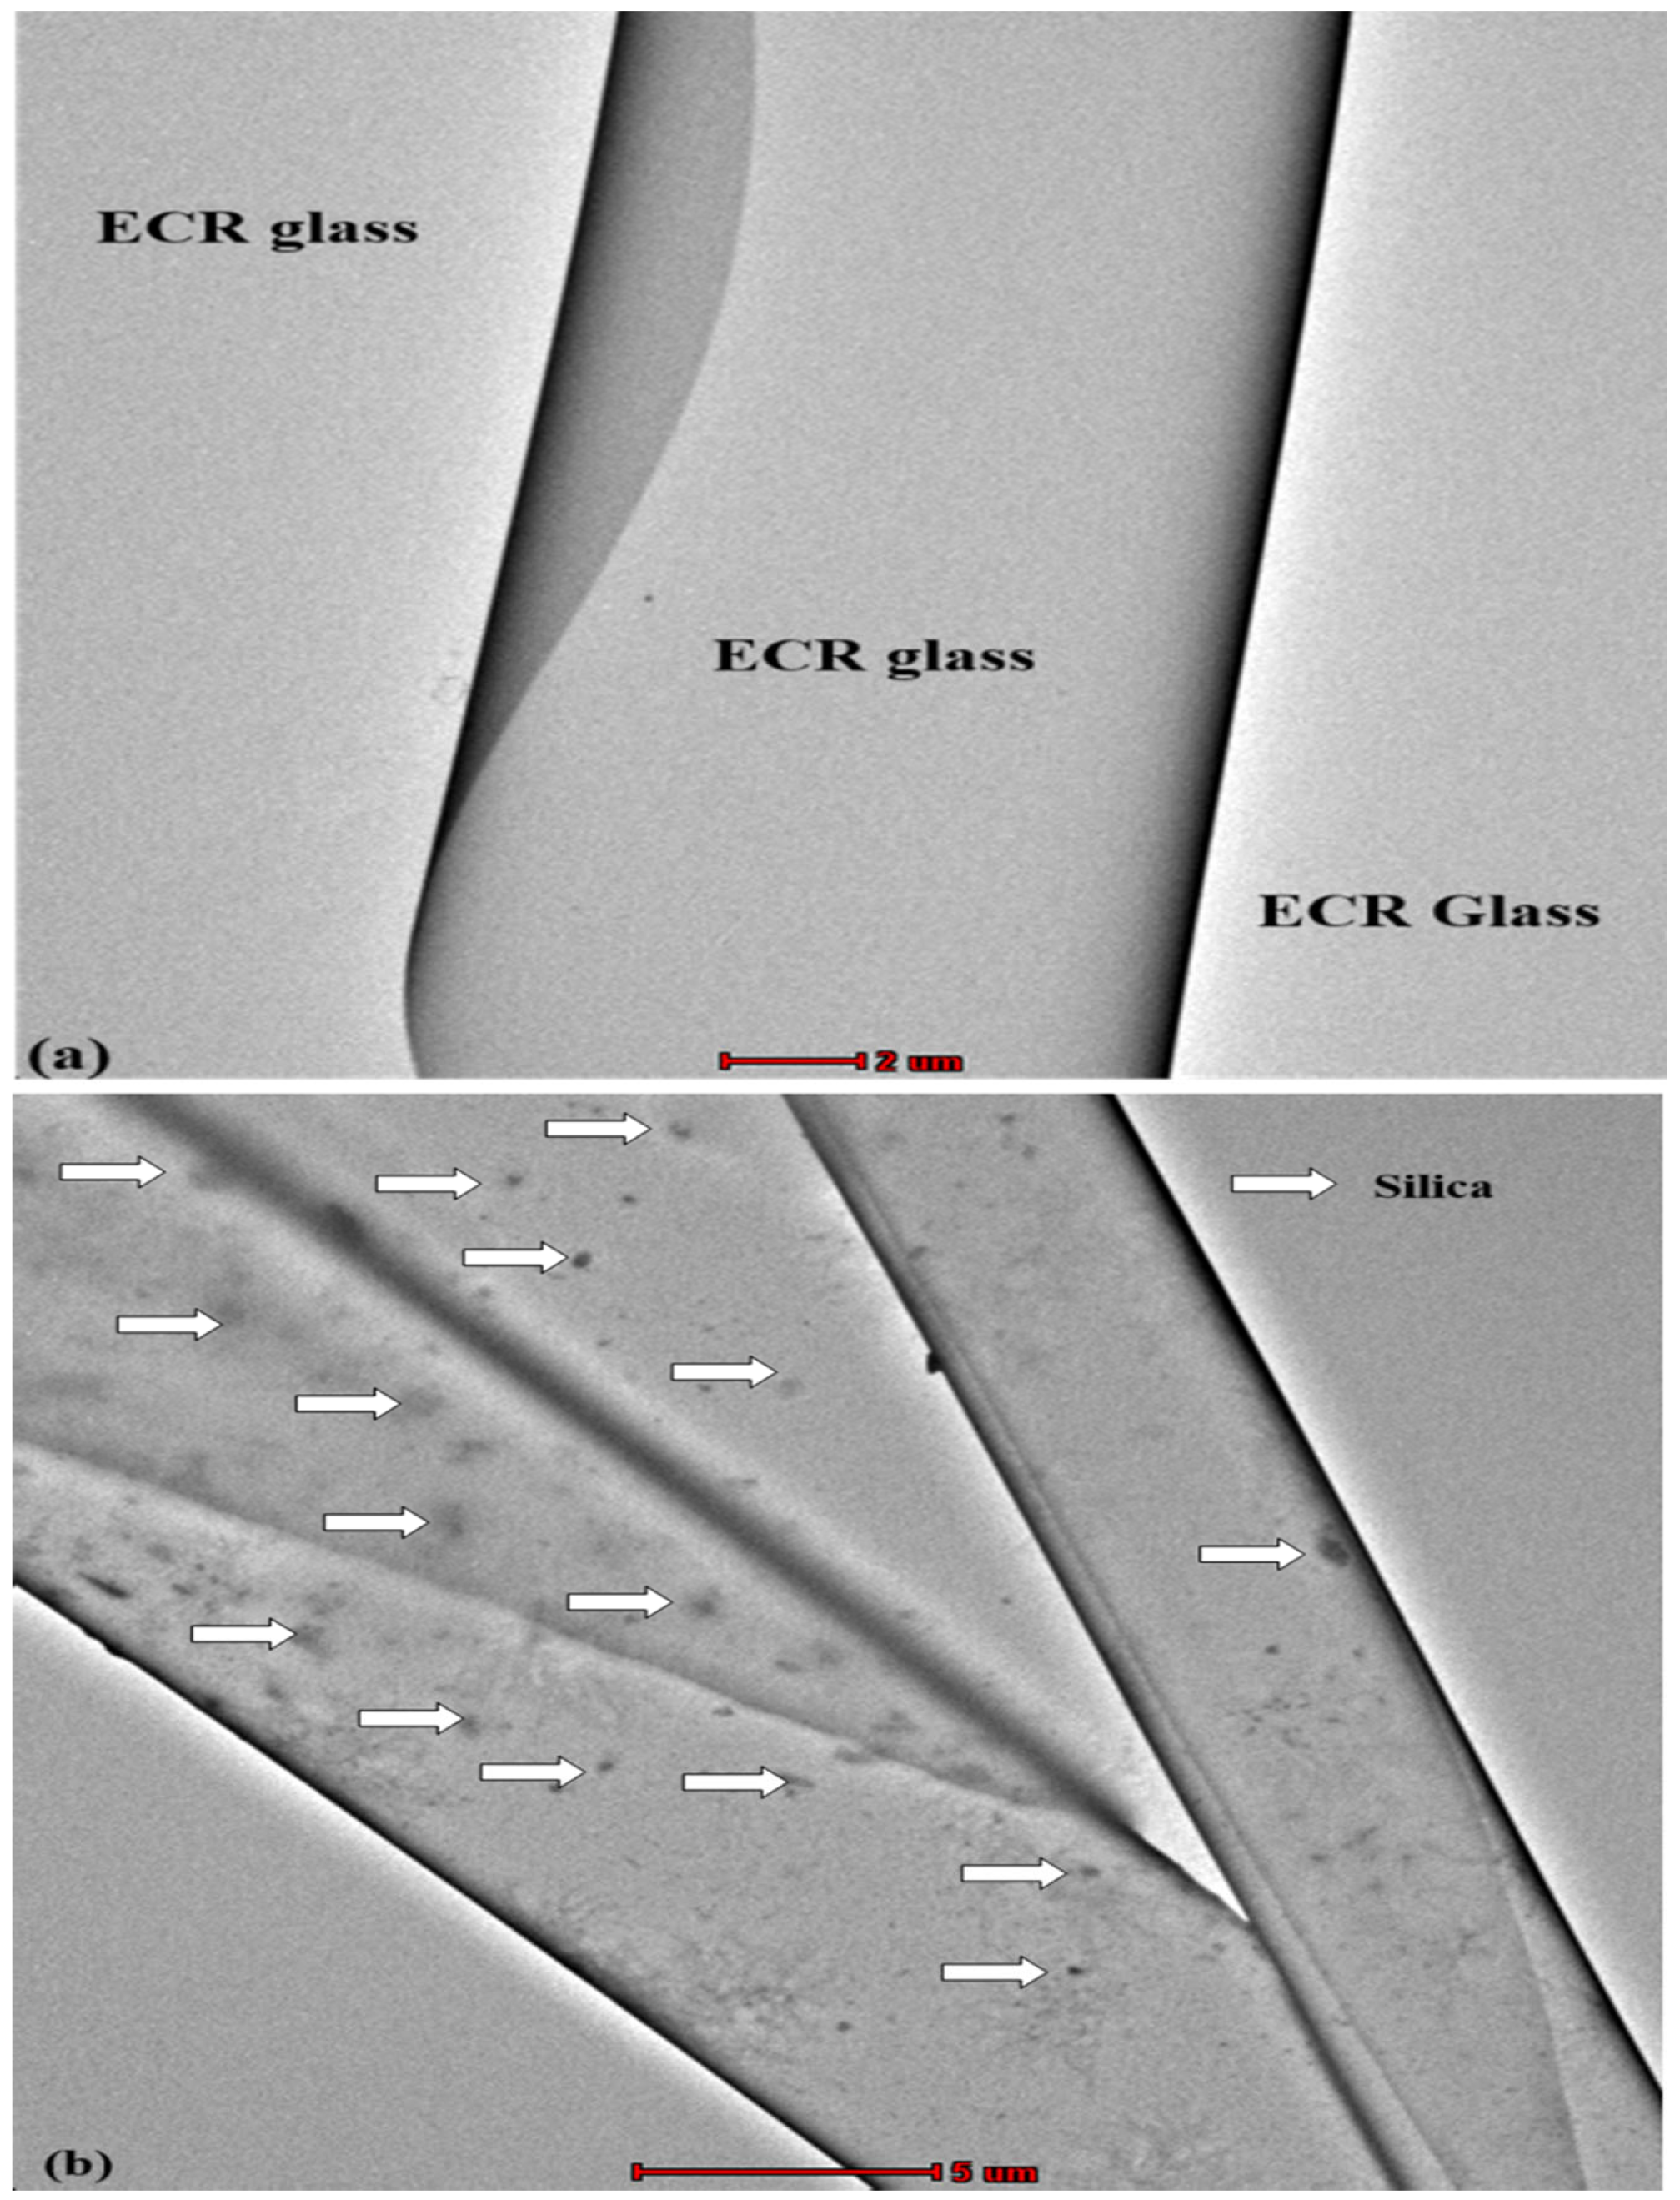
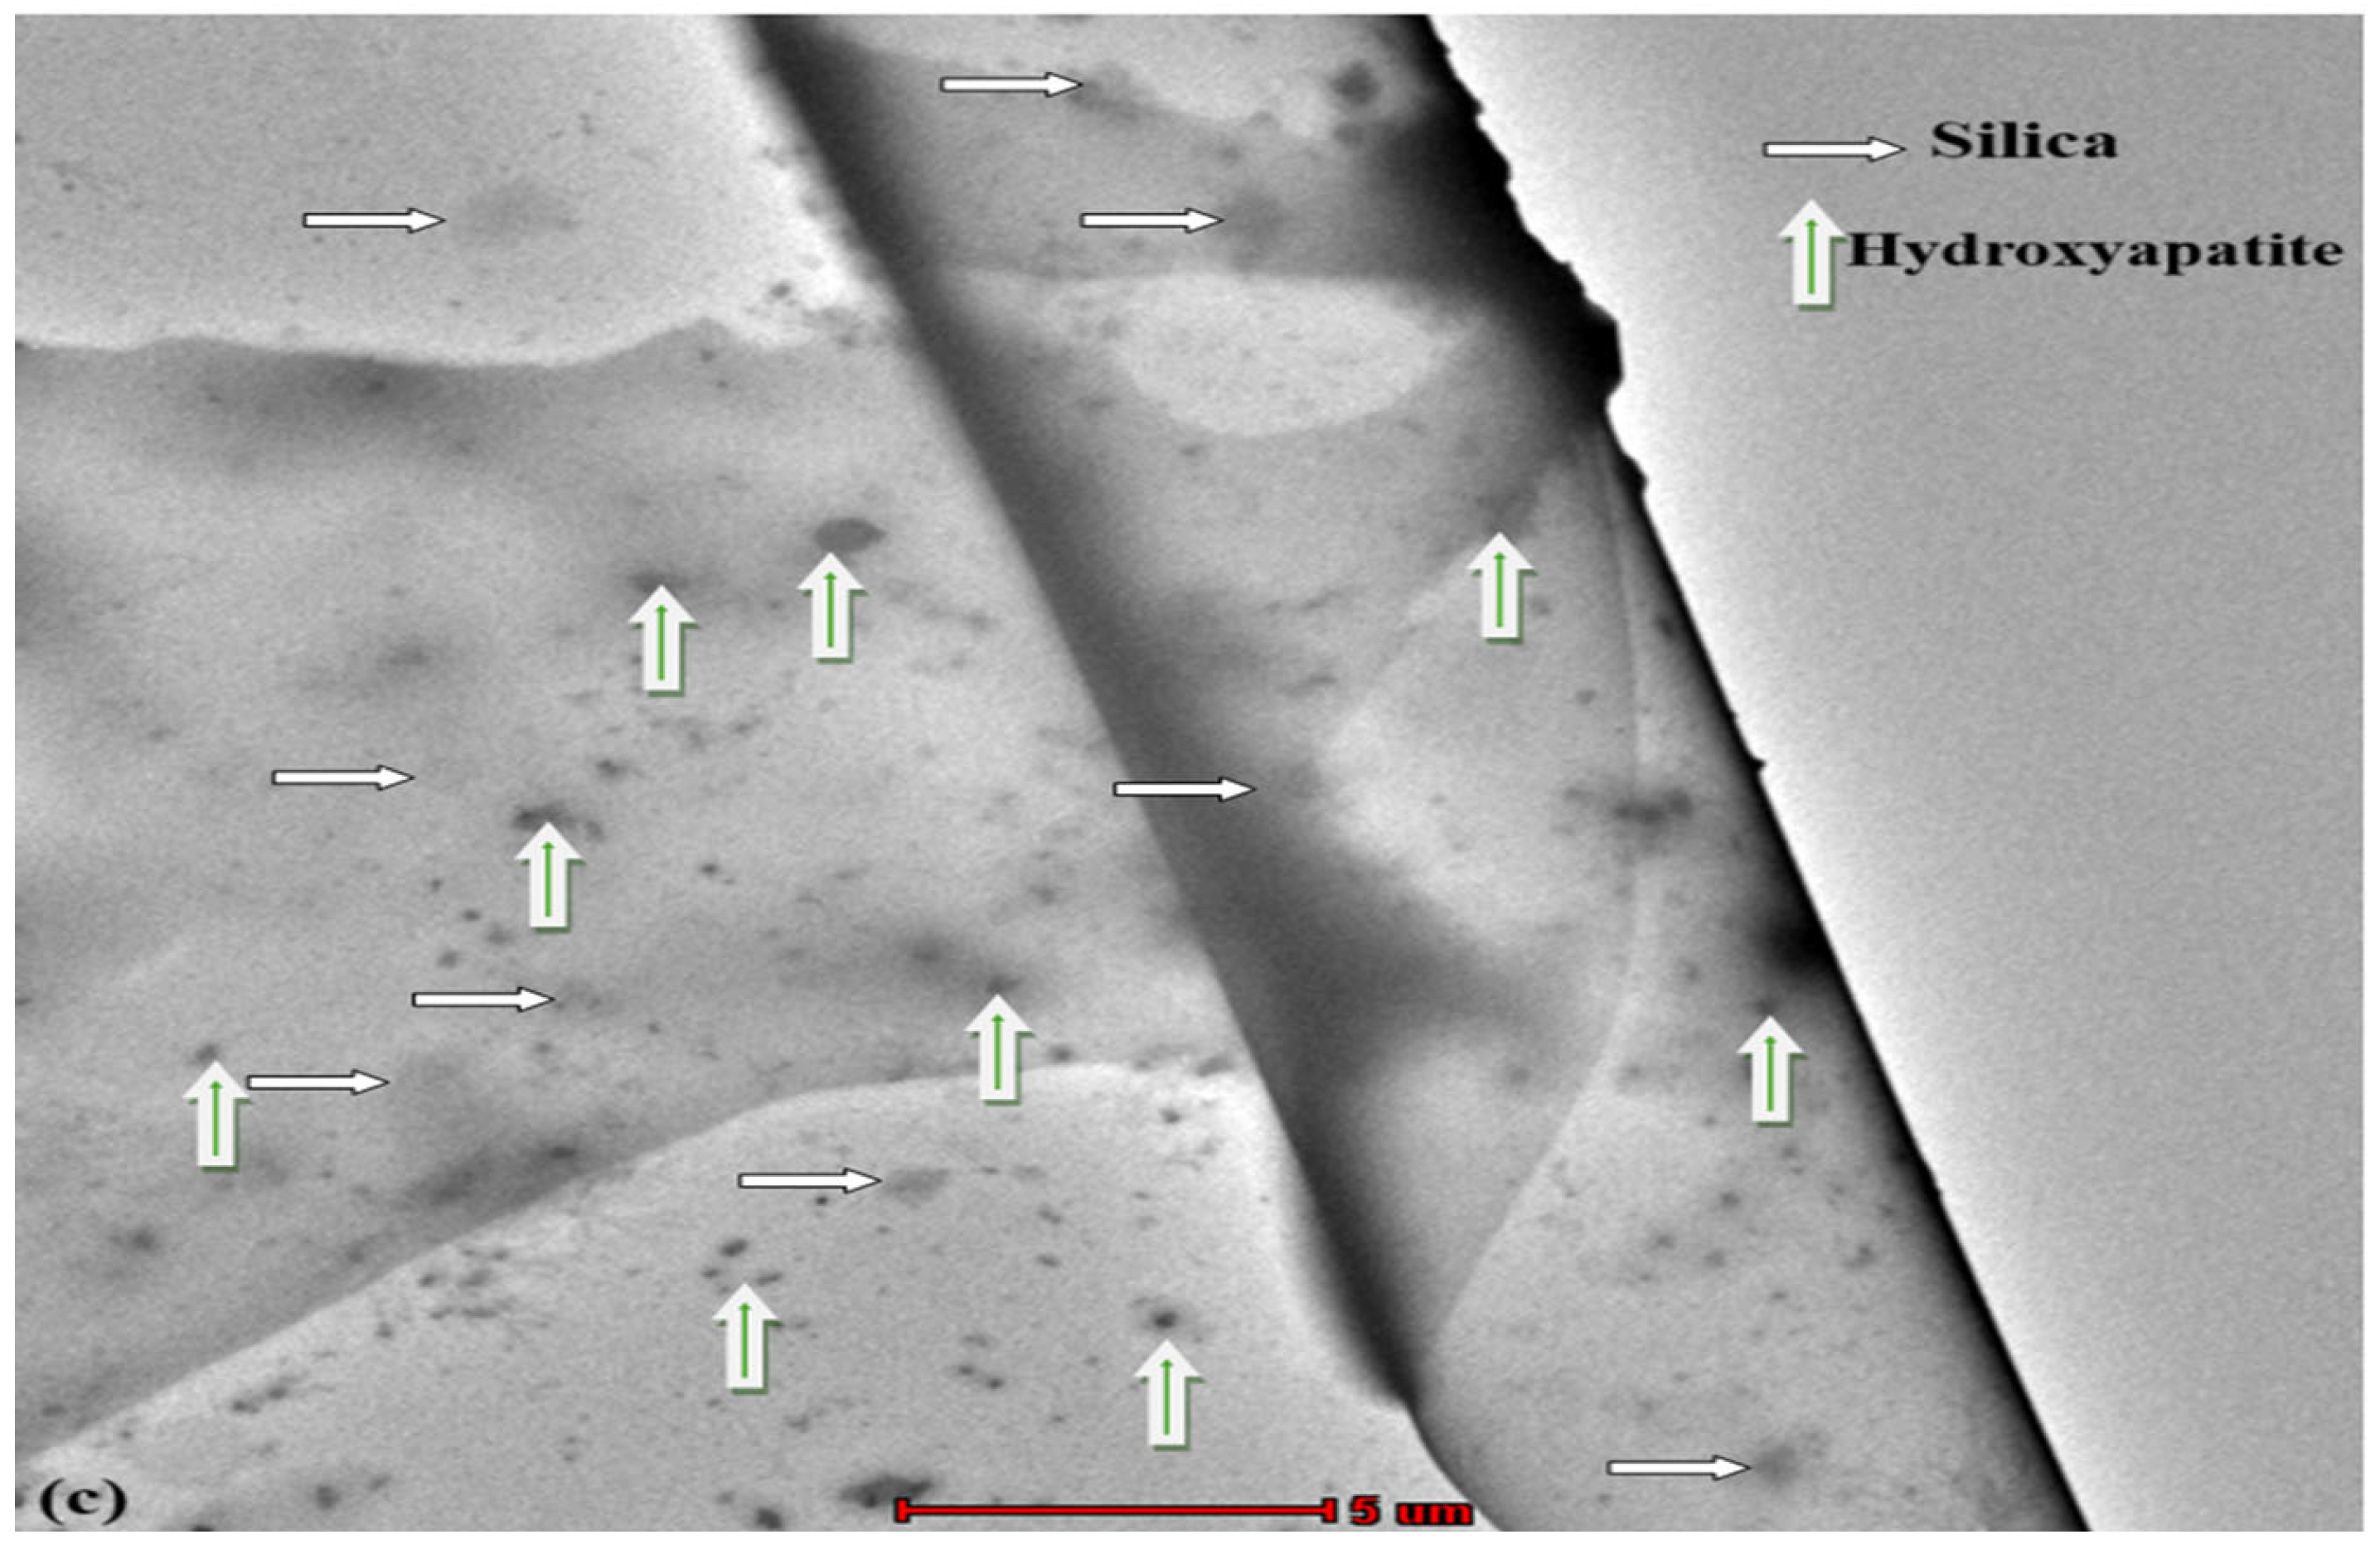
Figure 5.
TEM images of GF/Ep hybrid nanocomposites: (a) H0, (b) H2, (c) H3.
The microstructure of the GF/Ep composite modified with nS particles (H2) is shown in Figure 5b. The scattered nS particles embedded in the Ep matrix are highlighted by the white arrows. Despite a few small agglomerations, the nanoparticles seem to be evenly distributed throughout the matrix. Because the nS particles serve as stress transfer bridges, their presence near the GFs suggests a possible improvement in interfacial adhesion. Overall, a more heterogeneous microstructure has been produced by the addition of nS, which can improve mechanical properties by preventing cracks from spreading and increasing the effectiveness of load transmission at the fiber–matrix interface.
Figure 5c shows the TEM microstructure of the GF/Ep composite reinforced with both nS and nHap particles (H3). The image clearly shows the presence of GFs embedded in the epoxy matrix, along with uniformly dispersed nS and nHap particles. The white arrows indicate the location of nS particles, while the green arrows mark the distribution of hydroxyapatite particles. The dispersion of both nanoparticles appears homogeneous, with minimal signs of agglomeration, suggesting effective mixing and processing during composite fabrication. The incorporation of nS and nHap has notably modified the microstructure of the composite. The nanoparticles are well distributed in the Ep matrix, particularly near the fiber–matrix interface, which can enhance interfacial bonding and improve load transfer efficiency. Overall, the stronger adhesion between the GFs and the Ep matrix is shown by the improved dispersion and close interaction of the nanoparticles with the GFs. This might result in improved mechanical performance, increased fracture resistance, and increased longevity of the composite system.
3.2. FTIR Analysis
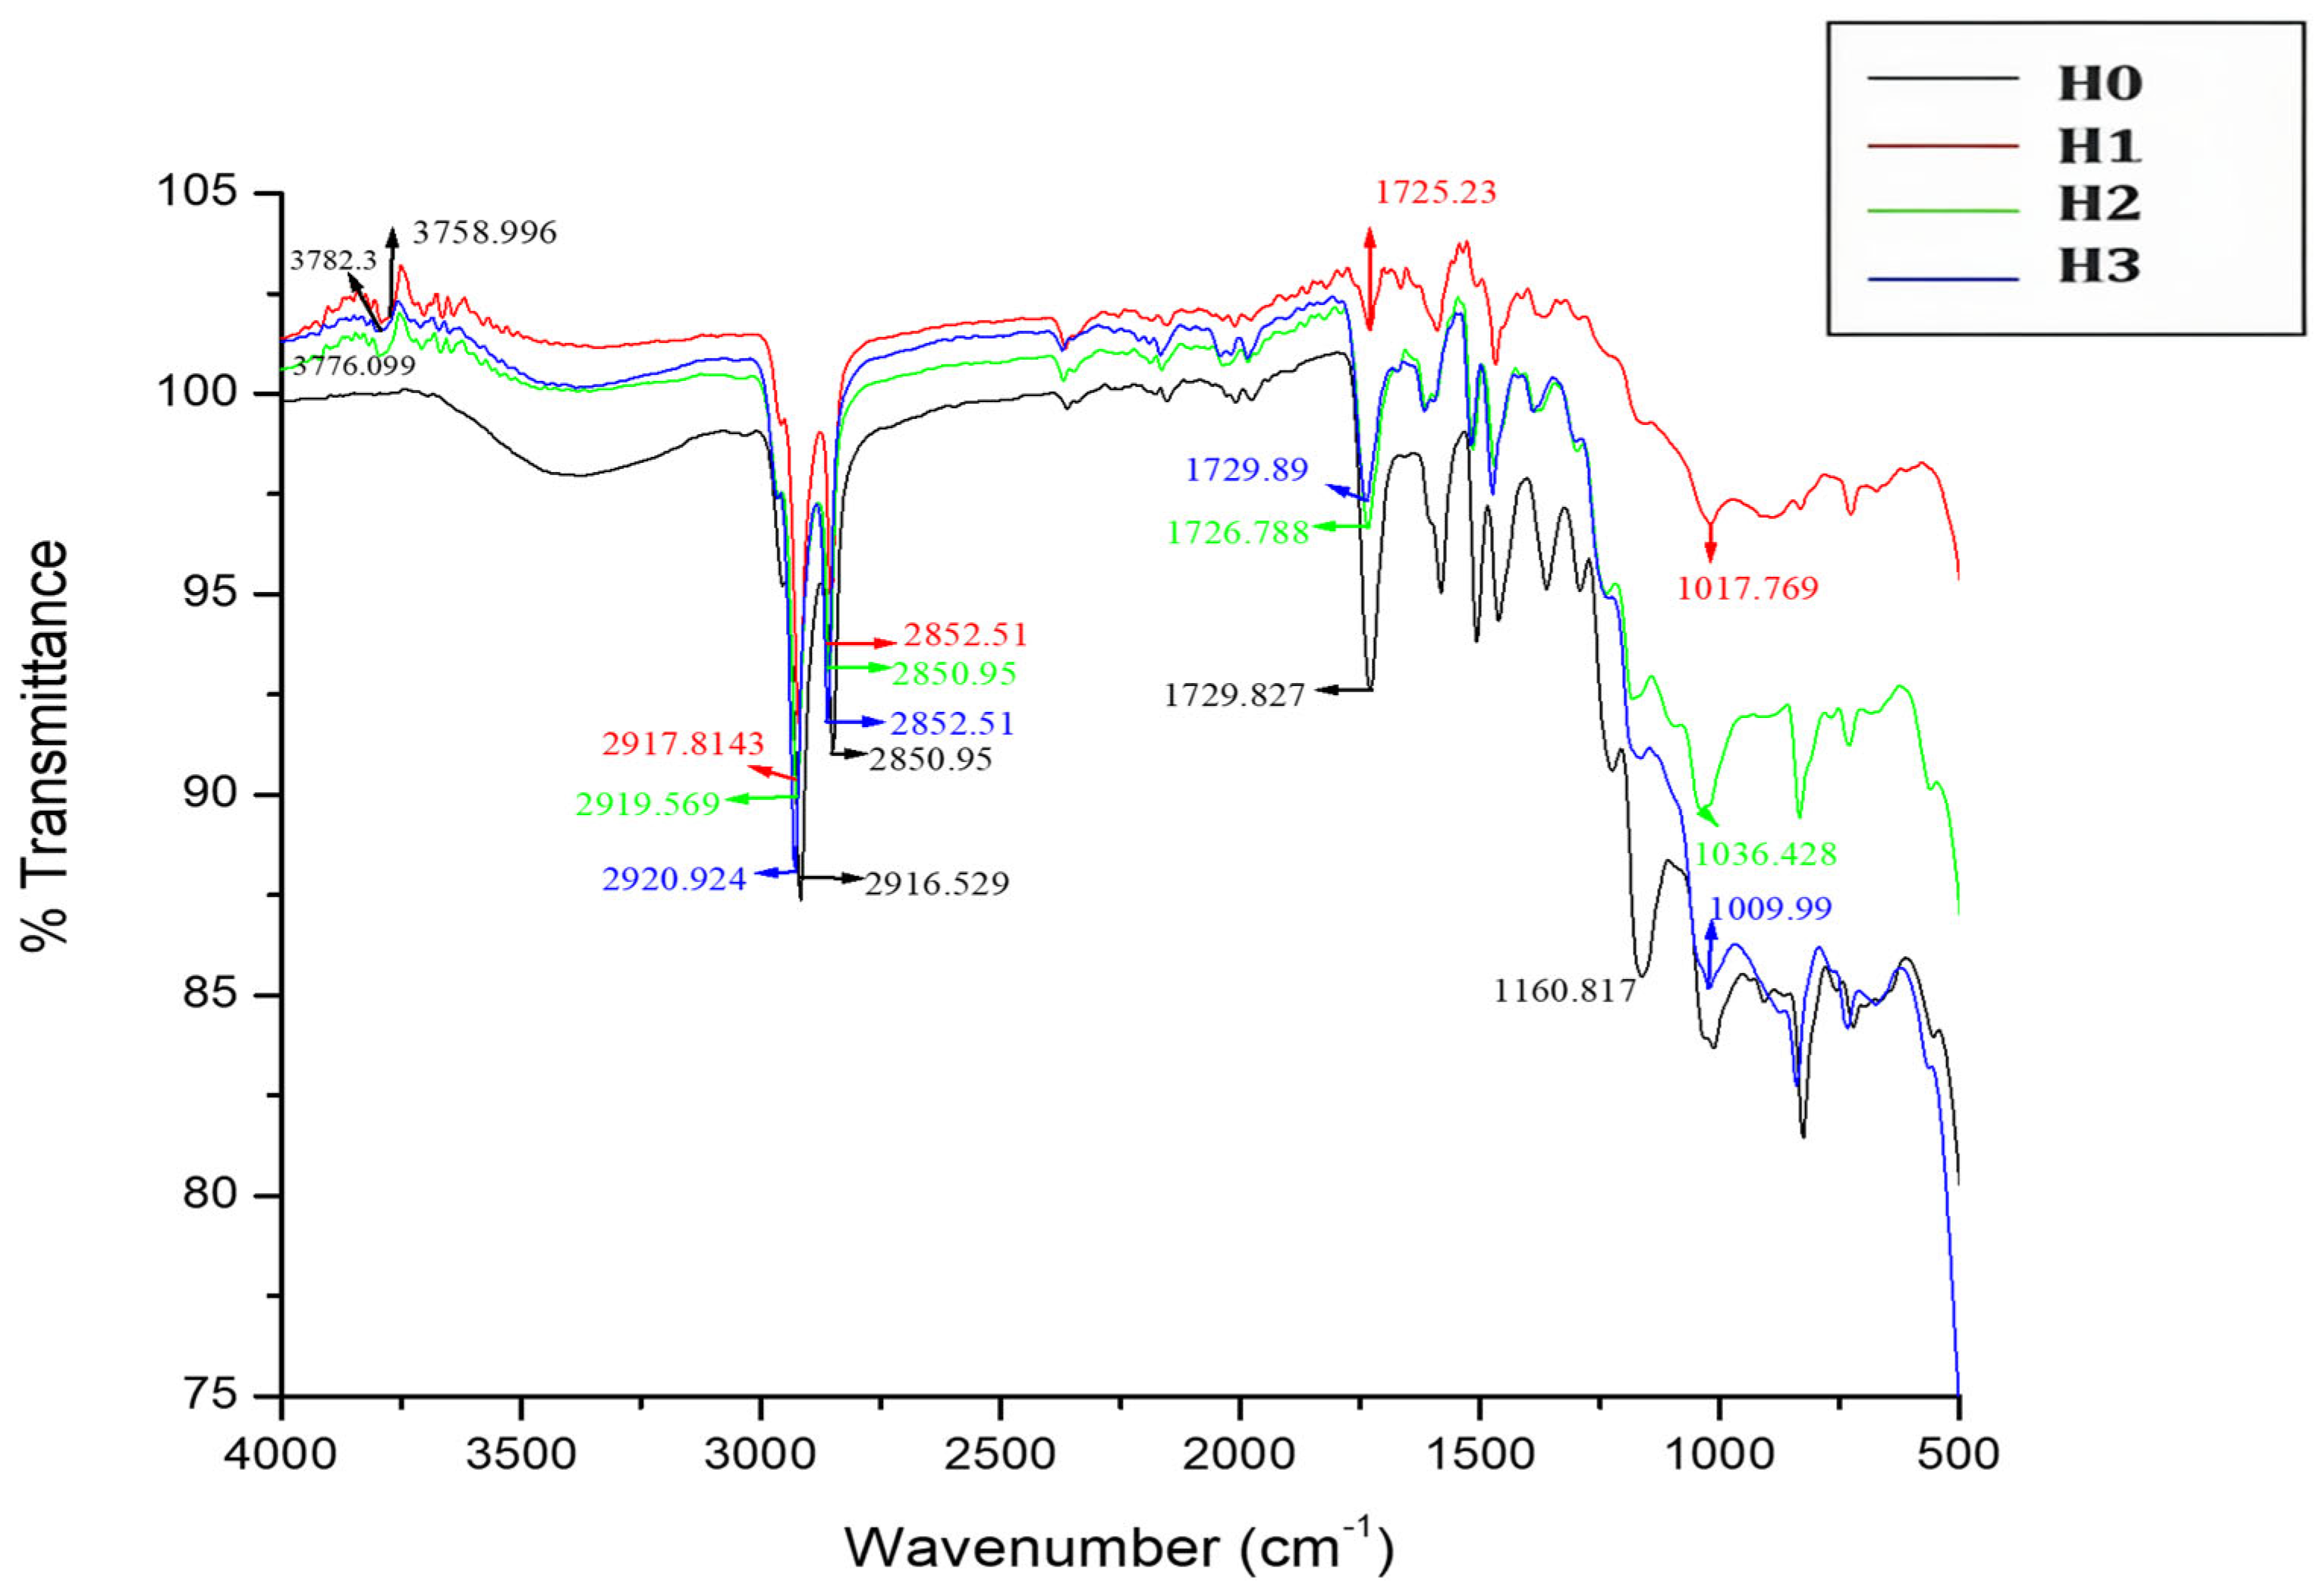
Figure 6 presents the FTIR spectra of neat and nanofiller-modified GF/Ep composites: H0 (control sample), H1 (2 wt.% nS), H2 (4 wt.% nS), and H3 (4 wt.% nS + 2 wt.% nHap). Characteristic epoxy peaks, including C–H (~2900 cm−1), C=O (~1730 cm−1), and C–O–C (~1140–1260 cm−1), are evident in the neat matrix (H0) and serve as a baseline for comparison. Second-derivative FTIR analysis was performed to address the risk of spectral overlap, specifically in the 1000–1300 cm−1 region where the Si–O–Si (~1050 cm−1), P–O (~1020 cm−1), and C–O–C (~1140–1250 cm−1) bands may coincide. The presence of distinct Si–O–Si and P–O contributions in modified composites, particularly H2 and H3, was confirmed, and peak assignments were clarified. Using baseline correction and spectral normalization (4000–400 cm−1), the quantitative peak area ratios listed in Table 3 offer objective measurements of interfacial interactions. In particular, the O-H/C-O-C and O-H/Si-O-Si ratios gradually decline from H0 to H3. Due to improved hydrogen bonding between filler surface functionalities (such as silanol and phosphate groups) and polar moieties in the epoxy matrix, this trend shows a decrease in free -OH groups.
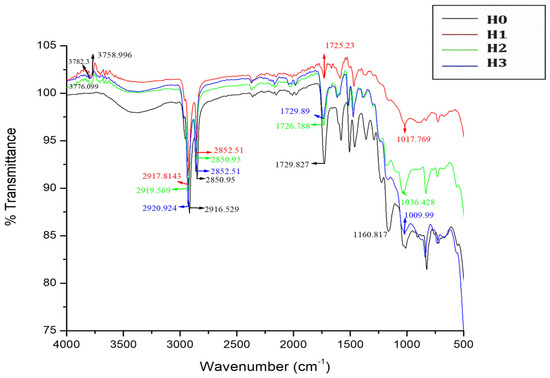
Figure 6.
FTIR spectra of GF/Ep and their hybrid nanocomposites.
Table 3.
Quantitative analysis of interfacial interactions via normalized FTIR peak area ratios at different filler loadings.
In hybrid nanocomposites, a red shift in the C=O stretching (~1730 cm−1) is seen, which is consistent with hydrogen bonding between the carbonyl groups and the solvents’ surface –OH or P–OH groups. The C=O bond is weakened by such interactions, which lowers its vibrational frequency. Dipole–dipole interactions or coordination between ether oxygen and electron-deficient filler sites (e.g., Si–O, P=O) are responsible for similar shifts in the C–O–C region. In certain instances, especially when reactive silanol or phosphate groups are present, these shifts may also indicate the formation of covalent bonds or crosslinking at the interface. Further evidence for increased hydrogen bonding comes from the observed decrease in O-H peak intensity (~3400 cm−1) across the filler-loaded samples. Enhancing matrix–filler compatibility, more free –OH groups are probably involved in interfacial interactions as fewer are left. This pattern is in line with enhanced stress transfer, decreased interfacial debonding, and enhanced fiber–matrix adhesion. As demonstrated by distinctive shifts in isocyanate, carboxyl, and hydroxyl group vibrations, Zhnag et al. [50] used FT-IR analysis to show that chemical and physical interactions such as nucleophilic addition and hydrogen bonding between polymer, isophorone diisocyanate, and silica play a critical role in improving composite properties. Jung et al. [51] confirmed C–O–C and Si–O–Si shifts due to covalent bonding in silane-treated systems. In this work, the successful incorporation and chemical interaction of nS and nHap fillers within the GF/Ep matrix are confirmed by both qualitative and quantitative FTIR analyses. Normalized area ratios and peak shifts provide objective confirmation of improved interfacial bonding, implying better dispersion, chemical compatibility, and possible improvements in mechanical and thermal properties.
3.3. UV Reflectance Analysis
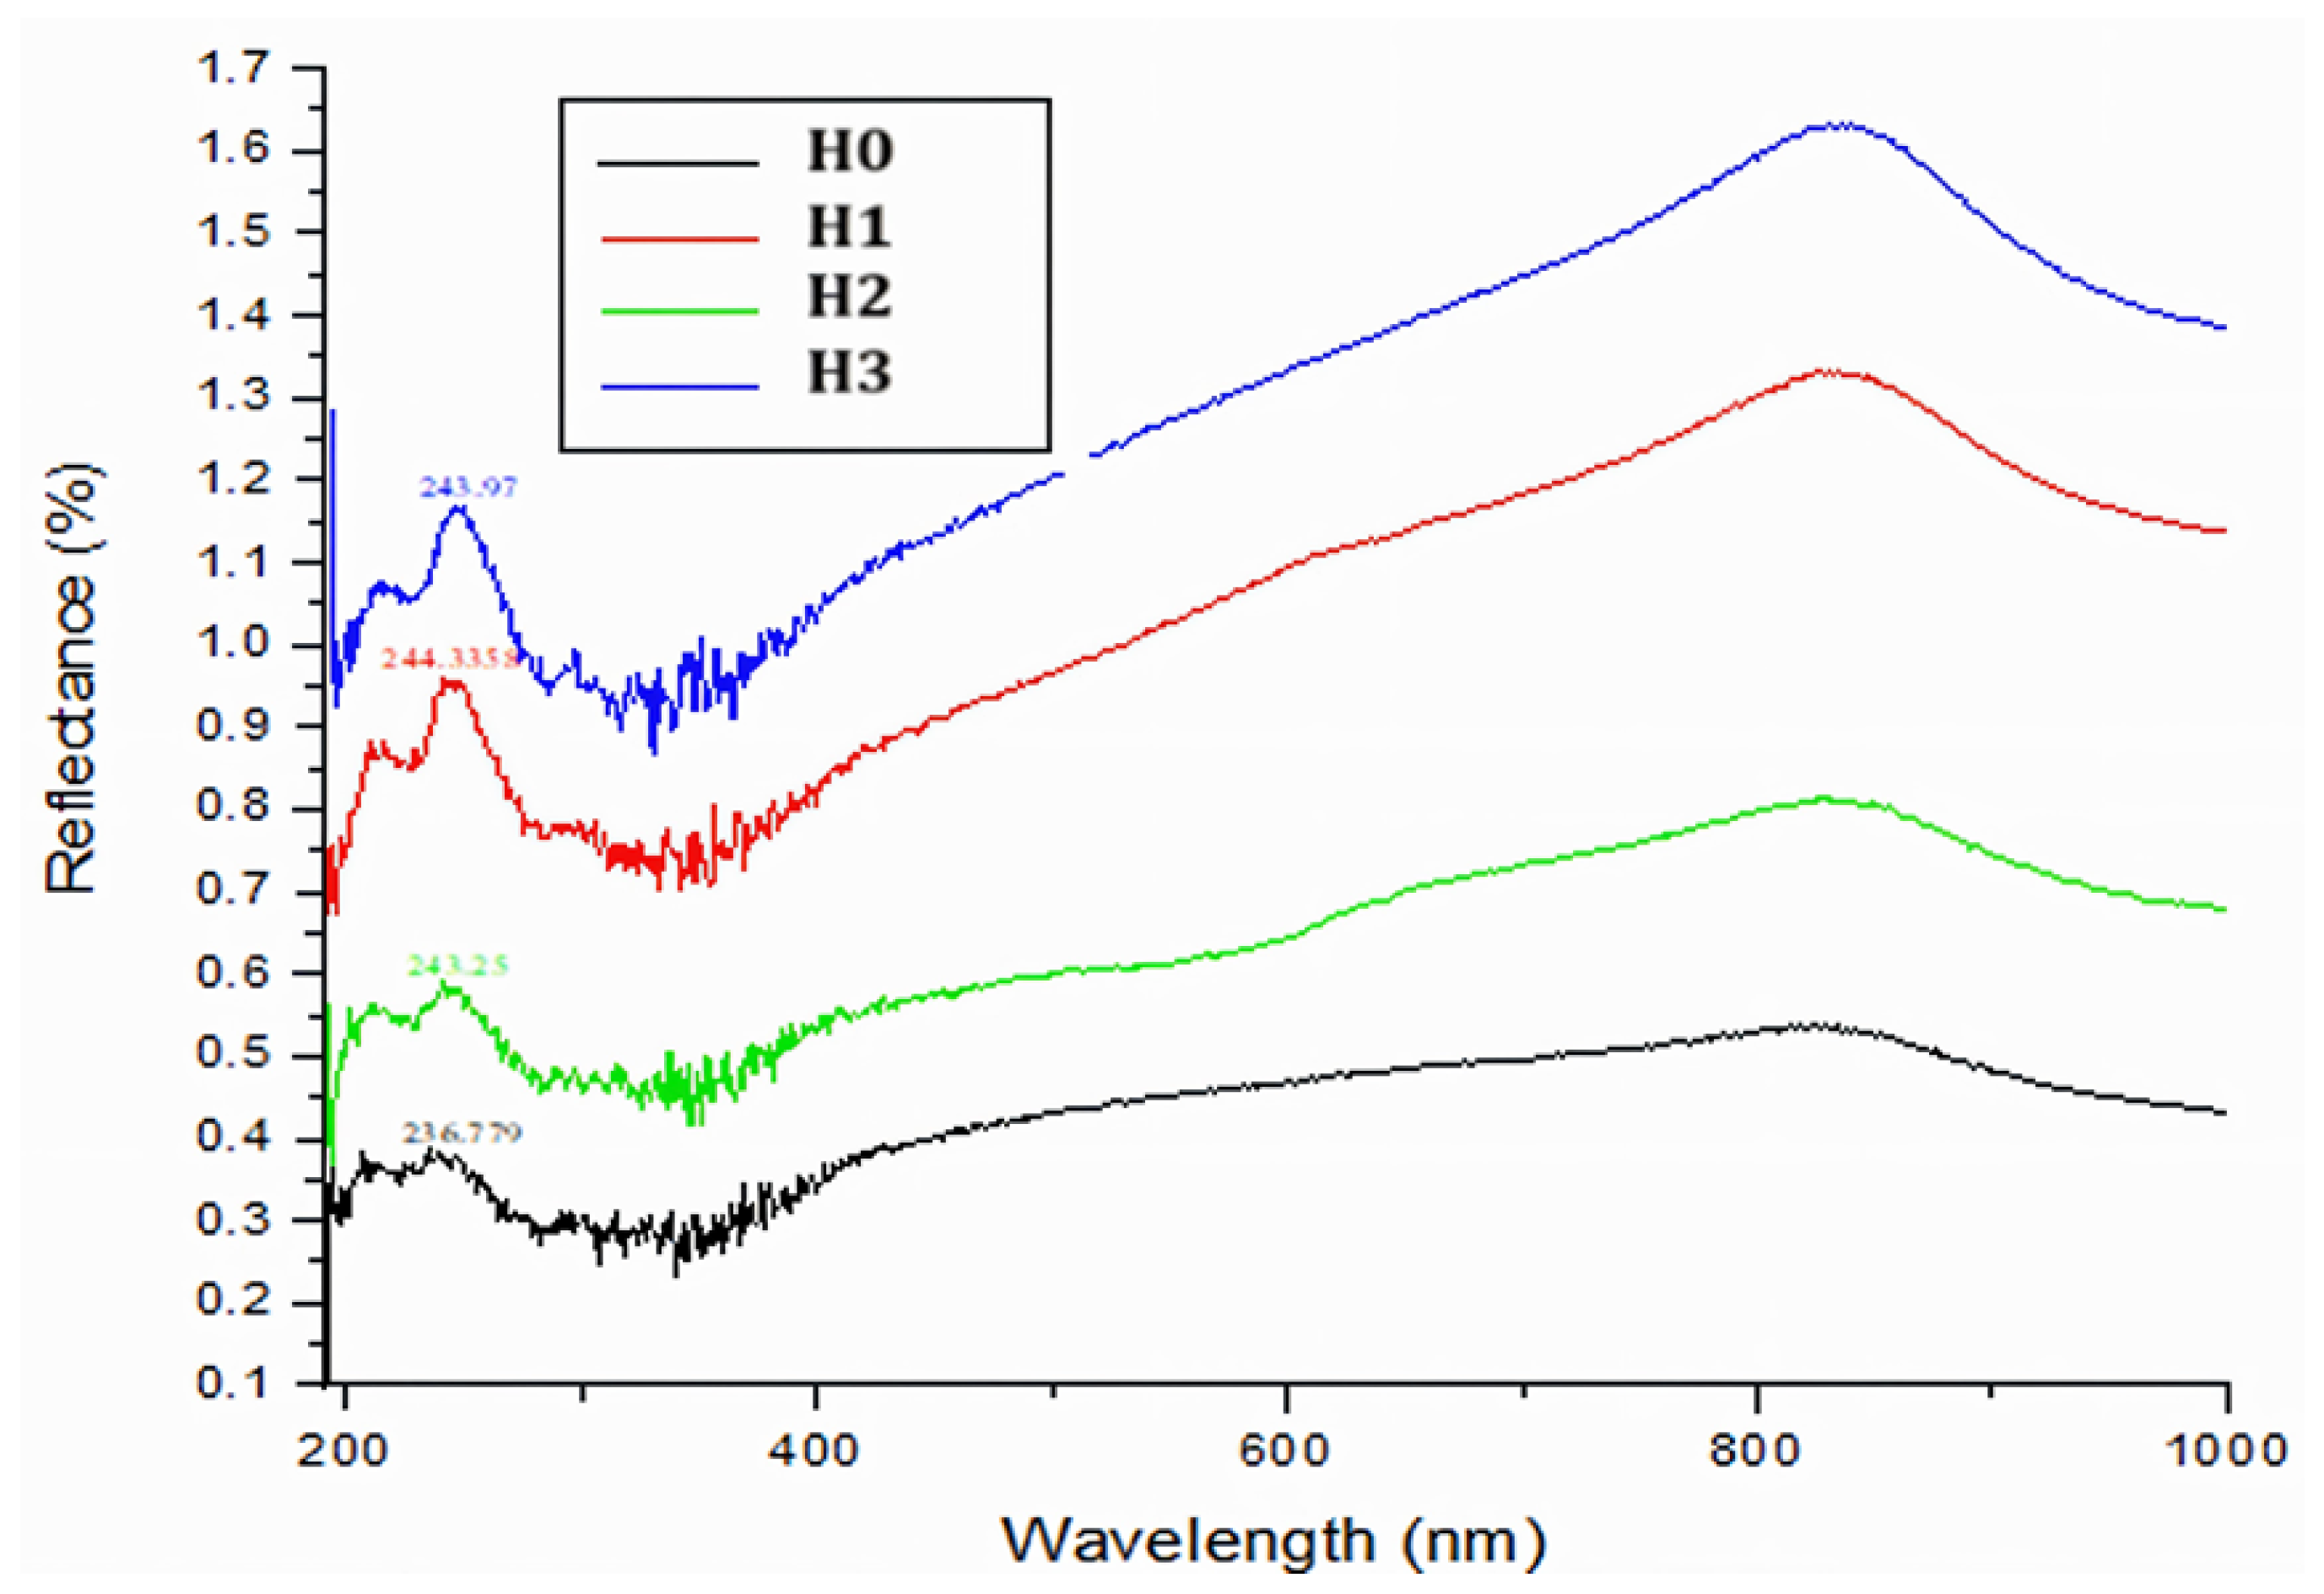
Over a wavelength range of 200–1000 nm, the reflectance spectra of samples H0–H3 shown in Figure 7 demonstrate a steady upward trend in reflectance with each change in composition. H0, H1, H2, and H3 reflectance values at 250 nm are around 0.32%, 0.78%, 0.56%, and 1.02%, respectively. Accordingly, these values increase to about 0.43%, 0.89%, 0.61%, and 1.14% at 400 nm. Distinct reflectance peaks can be seen in the ultraviolet region at 236.78 nm (H0), 244.34 nm (H1), 241.25 nm (H2), and 243.97 nm (H3). These peak values are probably caused by variations in the samples’ electronic transitions or surface interactions.
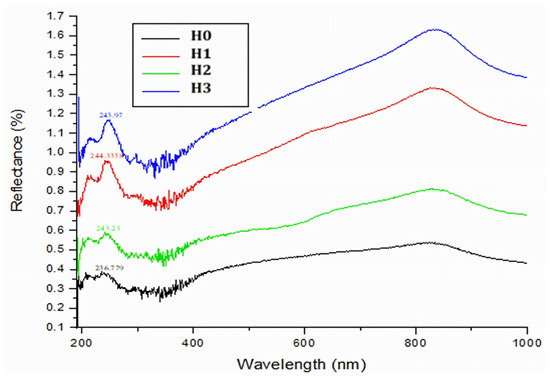
Figure 7.
UV reflectance spectra of GF/Ep and their hybrid nanocomposites.
Reflectance progressively rises from about 300 nm to 800 nm, peaking at about 0.6% (H0), 1.3% (H1), 0.9% (H2), and 1.6% (H3). All samples exhibit a slight decrease beyond 800 nm. These findings demonstrate that every compositional alteration improves optical reflectivity, especially in the visible and ultraviolet spectrums. In contrast to H1, the addition of nS (H2) significantly raises UV reflectance, indicating either surface modification or better light scattering. Because phosphate–silica interactions increase UV reflectivity, the addition of Hap to H3 results in the highest overall reflectance.
A slight shift in the peak near 243 nm in H3 relative to the others suggests that nS and nHap may work in concert to alter optical transitions. Increased reflectance in the ~240–260 nm range is consistently correlated with higher nanofiller loading. While the lower-reflectance H0 might be more appropriate for light-absorbing applications such as sensors or photo thermal devices, these improvements make H3 a promising candidate for UV shielding, optical coatings, or photovoltaic light management.
3.4. Density and Hardness
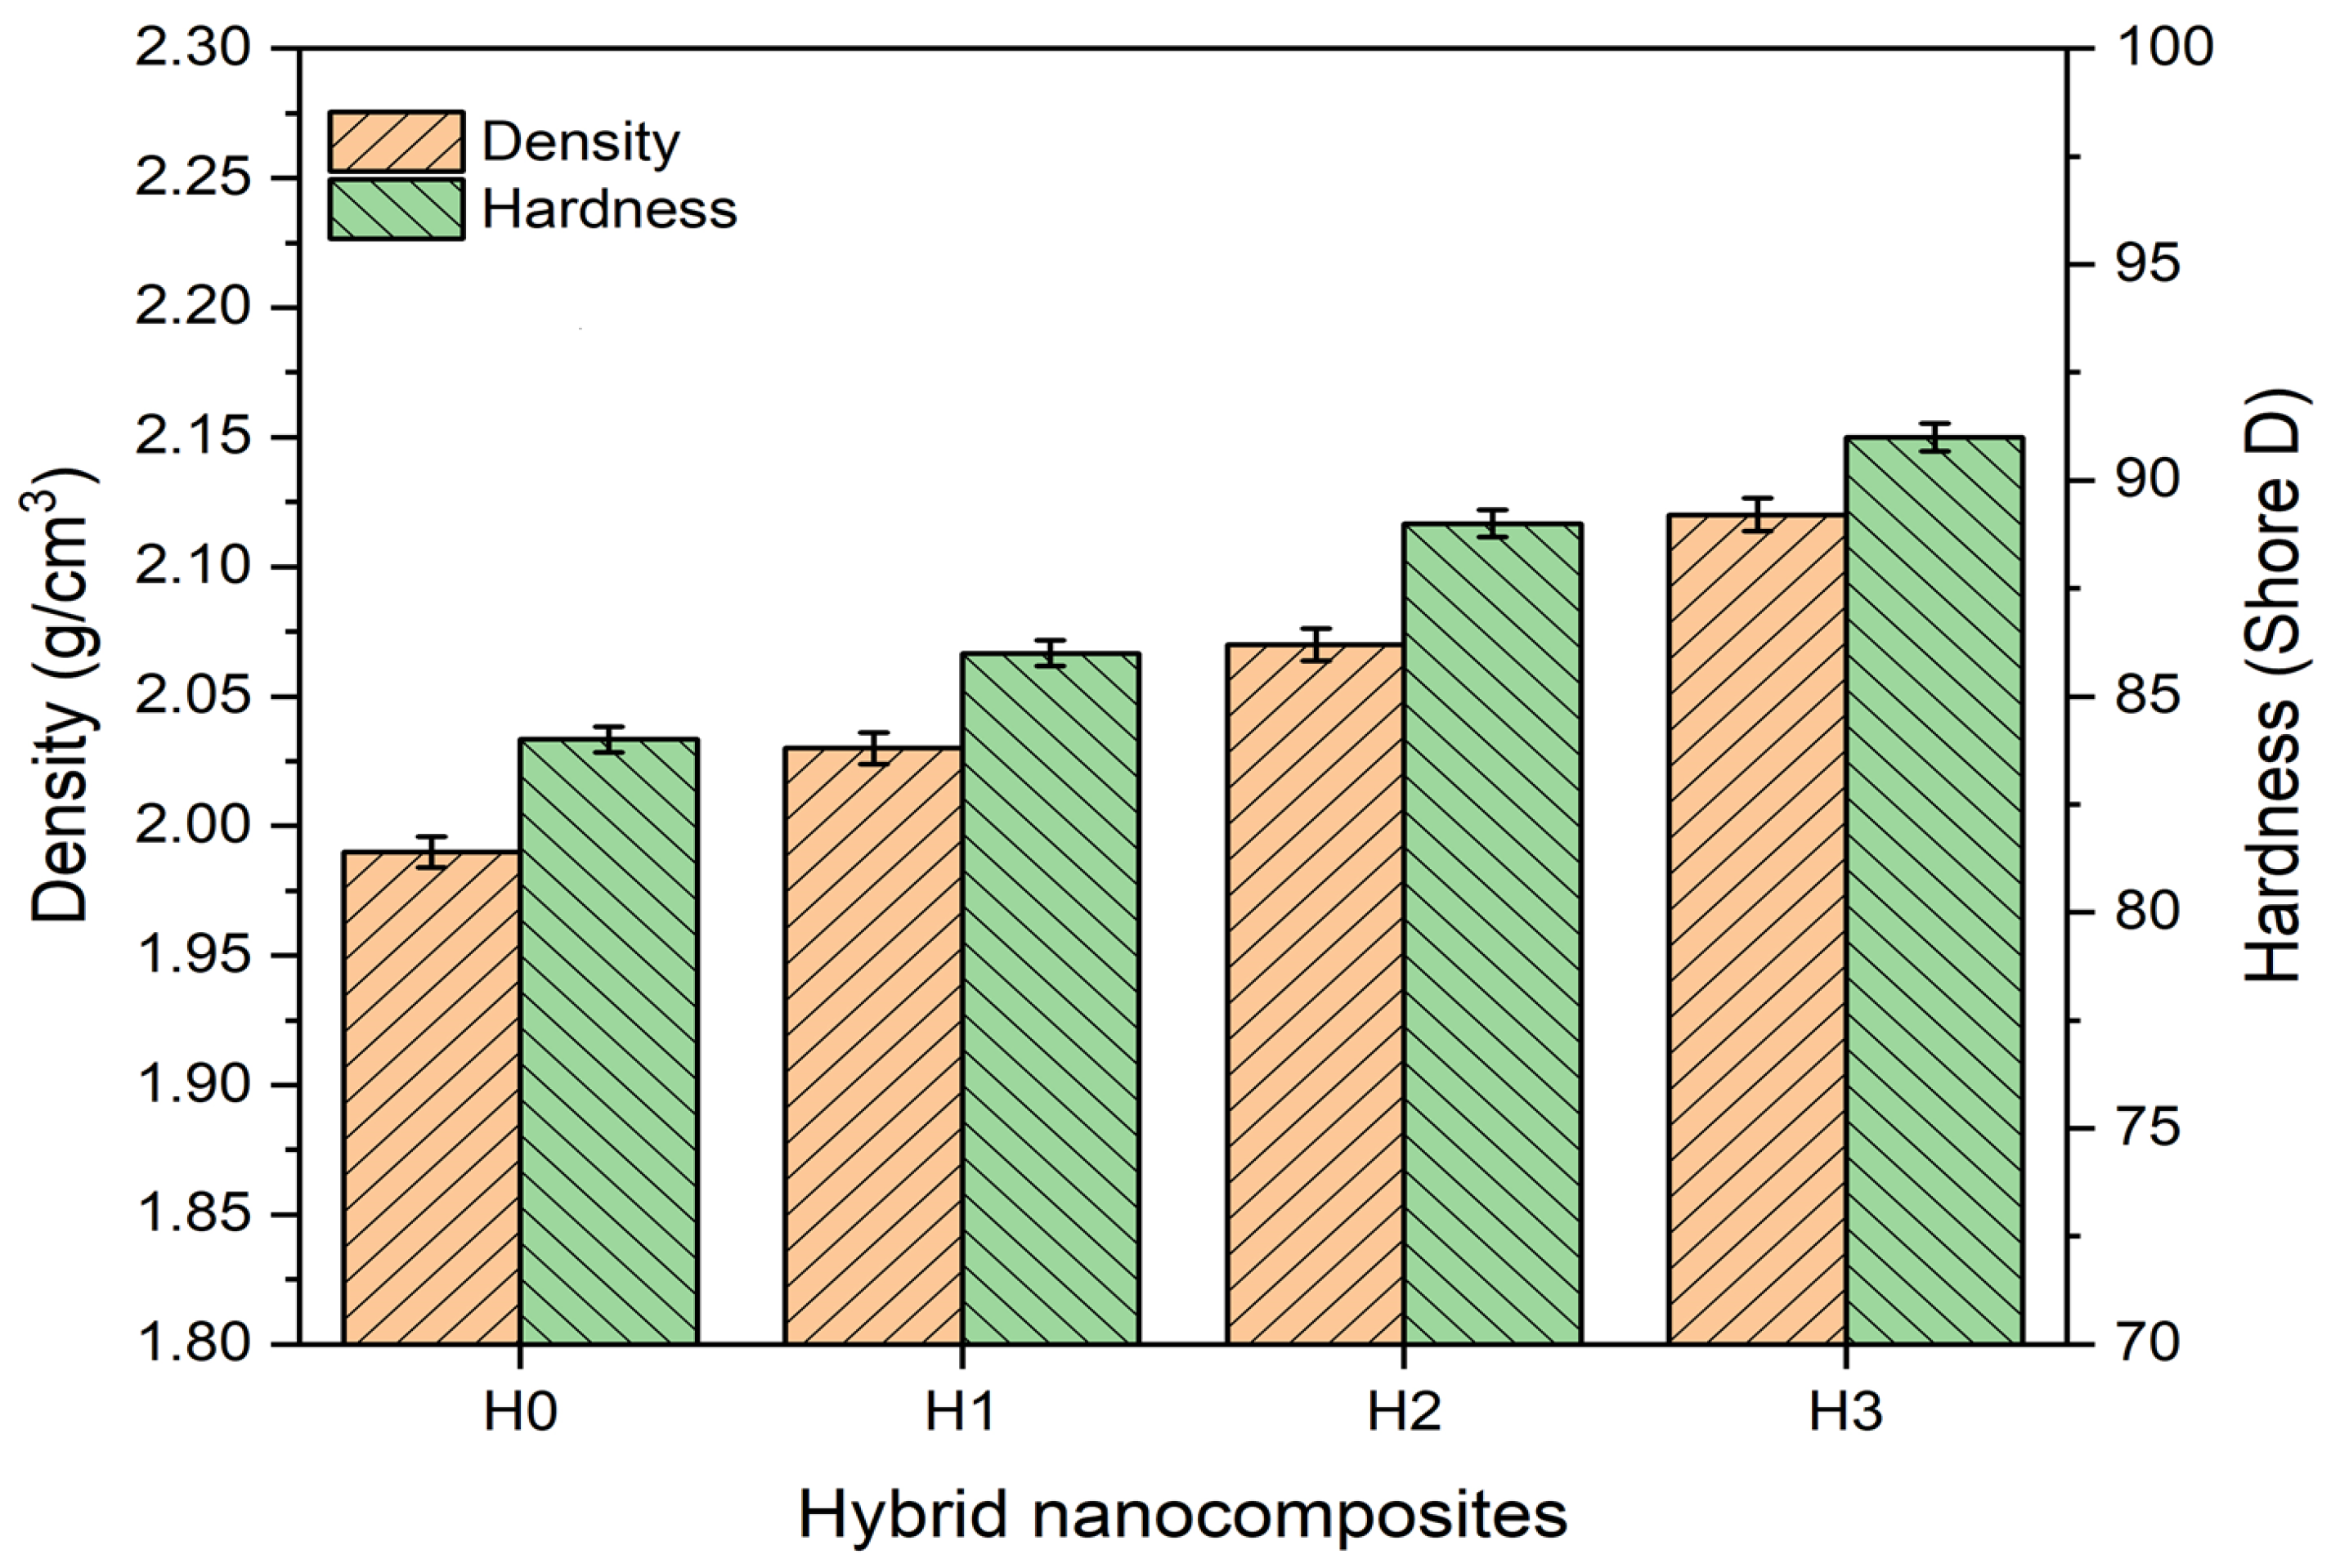
Figure 8 shows the GF/Ep and their hybrid nanocomposites’ experimental density and hardness (Shore D). The graph concisely demonstrates that density and hardness increase as the nanofiller loading increases. For H0, the density is 1.99 g/cm3; for H1, it is 2.03 g/cm3; for H2, it is 2.07 g/cm3; and for H3, it is 2.12 g/cm3. The corresponding Shore D hardness values for H0, H1, H2, and H3 are 84, 86, 89, and 91, respectively. These findings demonstrate the consequences of adding hydroxyapatite and silica nanofillers to the glass fiber/epoxy matrix.

Figure 8.
Measured density and hardness of GF/Ep and their hybrid nanocomposites.
The composites’ increasing densities (H0 to H3) imply that the addition of nHap and nS results in denser and more compact material. The overall composite density rises when epoxy is gradually replaced with these nanofillers because nS and nHap have higher densities than epoxy (H3 > H2 > H1 > H0). This pattern is in agreement with earlier research on polymer composites [52,53], which found that adding filler increases density by expanding the polymer matrix.
The results for hardness also indicate an upward trend as the amount of nanofiller increases. The hardness of H0 (84 Shore D), which had no nanofillers, was the lowest. Hardness increased slightly (86 Shore D) when 2 wt.%nS was added to H1, most likely as a result of improved structural changes at low filler content. At higher concentrations, nS particles appear to effectively reinforce the Ep matrix, as evidenced by the hardness improving to 89 Shore D after the nS content in H2 increased to 4 wt.%. As demonstrated by the maximum hardness (91 Shore D) in H3, which comprised 4 weight percent nS and 2 wt.% nHap, the combination of nS and nHap fillers significantly increases the mechanical stiffness of the composite. This pattern is consistent with the well-established knowledge that ceramic-based fillers increase the load-bearing capacity and limit deformation, hence increasing polymer hardness [54,55].
Overall, the trends show that adding nS and nHap to GF/Ep composites improves their hardness and density. These hybrid composites may be appropriate for applications needing high-strength materials because of their increased density, which indicates a denser structure, and their improved hardness, which indicates increased resistance to indentation.
3.5. Tensile Properties
The results in Figure 9 demonstrate a clear pattern in the mechanical properties of the hybrid nanocomposites. Tensile strength increases with the addition of nS; H1 (2 wt.% SiO2) shows a significant improvement to 829.9 MPa (+9%), while H2 (4 wt.% SiO2) shows the slightest increase to 790.8 MPa (+3.9%). However, the tensile strength only slightly increases to 837.5 MPa (+10%) when nHap is added to H3 (4 wt.% nS + 2 wt.% nHap), demonstrating that nHap does not significantly increase tensile strength beyond nS reinforcement. Nevertheless, the tensile modulus shows a more noticeable improvement, rising from 6.49 GPa (H0) to 7.11 GPa (H1, +9.5%) and then increasing to 7.85 GPa (H2, +21%), demonstrating that nS effectively increases stiffness. H3 has the highest modulus (8.31 GPa, +28%), indicating that nHap plays a larger role in stiffness than tensile strength. The best strength-to-stiffness ratio is typically provided by H2 composite, whereas H3 is the stiffest composite and thus appropriate for applications needing high rigidity. However, in practical applications, it should be taken into account that too much nHap can cause brittleness.
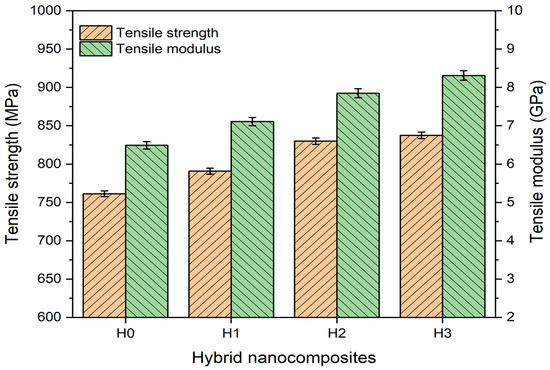
Figure 9.
Tensile strength and tensile modulus of GF/Ep and their hybrid nanocomposites.
Tensile strength is marginally improved by the addition of 2 wt.% nS (H1) because of improved load transfer. An ideal reinforcement effect is demonstrated by the additional 9% increase that occurs when nS is increased to 4 wt.% (H2). Although nHap does not substantially outperform nS alone, it does contribute to matrix reinforcement, as evidenced by the fact that H3 slightly raises tensile strength above H2. In agreement with earlier research showing nS improves fiber–matrix adhesion, the addition of nS (H1 and H2) exhibits a strengthening trend. Although nHap (H3) makes the composite stiffer (higher modulus), it can also cause brittleness, which marginally reduces tensile strength. Additionally, the highest modulus (8.31 GPa, +28% overall) is obtained by including nHap in H3. This implies that Hap efficiently increases stiffness, most likely as a result of its intrinsic rigidity and capacity to limit the mobility of polymer chains.
Strength and stiffness are traded off in accordance with the typical behavior of composite materials, where the mechanical response is influenced by the type and dispersion of reinforcement. Research on GF/Ep composites reinforced with nS shows that nS enhances mechanical interlocking and load transfer, resulting in increased strength. Although adding nHap is known to increase modulus, in certain situations, it can result in stress concentrations that lower tensile strength. This is consistent with research showing that nS particles strengthen polymer matrices by improving interfacial bonding. On the other hand, a high filler content could cause agglomeration and decrease efficacy.
Studies on Ep-based composites reinforced with nS show comparable increases in strength and modulus as a result of improved stress transfer and resistance to cracking [56,57]. Silicon dioxide typically works best in the range of 2–4 wt.%, after which agglomeration may occur [58]. According to research, modulus is more influenced by nHap than strength [59,60]. Although the modulus rises significantly, too much Hap can cause micro voids, which restrict the improvement in tensile strength [61]. The strongest and highest modulus is achieved with a mixture of 2 wt.% nHap and 4 wt.% nS. However, more tests (such as impact resistance and fracture toughness) would shed light on the composite’s overall performance.
In material science, understanding a material’s mechanical behavior under tensile stress requires knowledge of its Young’s modulus and maximal tensile strength. The effects of different nanofiller additions are demonstrated in Figure 9 through a comparison of samples H0 (control), H1 (2 wt.% nS), H2 (4 wt.% nS), and H3 (4 wt.% nS + 2 wt.% nHap). The baseline mechanical properties of the GF/Ep system are provided by the H0 control sample. The mechanical properties of H1 and H2 (nS) nanoparticles, such as their huge surface area, are anticipated to be improved, including stiffness and strength [62,63]. Since increasing filler loading might result in enhanced properties up to a point, after which agglomeration difficulties may cause a drop in performance, comparing H1 and H2 enables the optimization of nS loading [63]. In this work, the GF/Ep system with nanofillers has a higher Young’s modulus because the nanoparticles, which are naturally stiff materials, serve as secondary reinforcement inside the epoxy matrix. Their presence stiffens the matrix and, in turn, the entire composite by limiting the movement of polymer chains. Additionally, by bridging microcracks, rearranging crack paths, or starting new energy-absorbing microcracks, nanoparticles can stop cracks from spreading. As a result, the material responds to stress with greater strength and stiffness since the energy needed for fracture is effectively increased. Furthermore, H3 is essential for comprehending the possible synergistic effects of combining various nanofillers due to its hybrid filler system of nS and nHap [64]. Nano-hydroxyapatite is frequently used because it is biocompatible and can further increase stiffness and strength, which is particularly useful in applications that aim to replicate the characteristics of real bone [65]. The precise role of nHap in the presence of nS can be elucidated by comparing H3 and H2,which could assist in the development of composites with specialized multifunctional properties.
3.6. Fractographic Analysis Under Tensile Loading
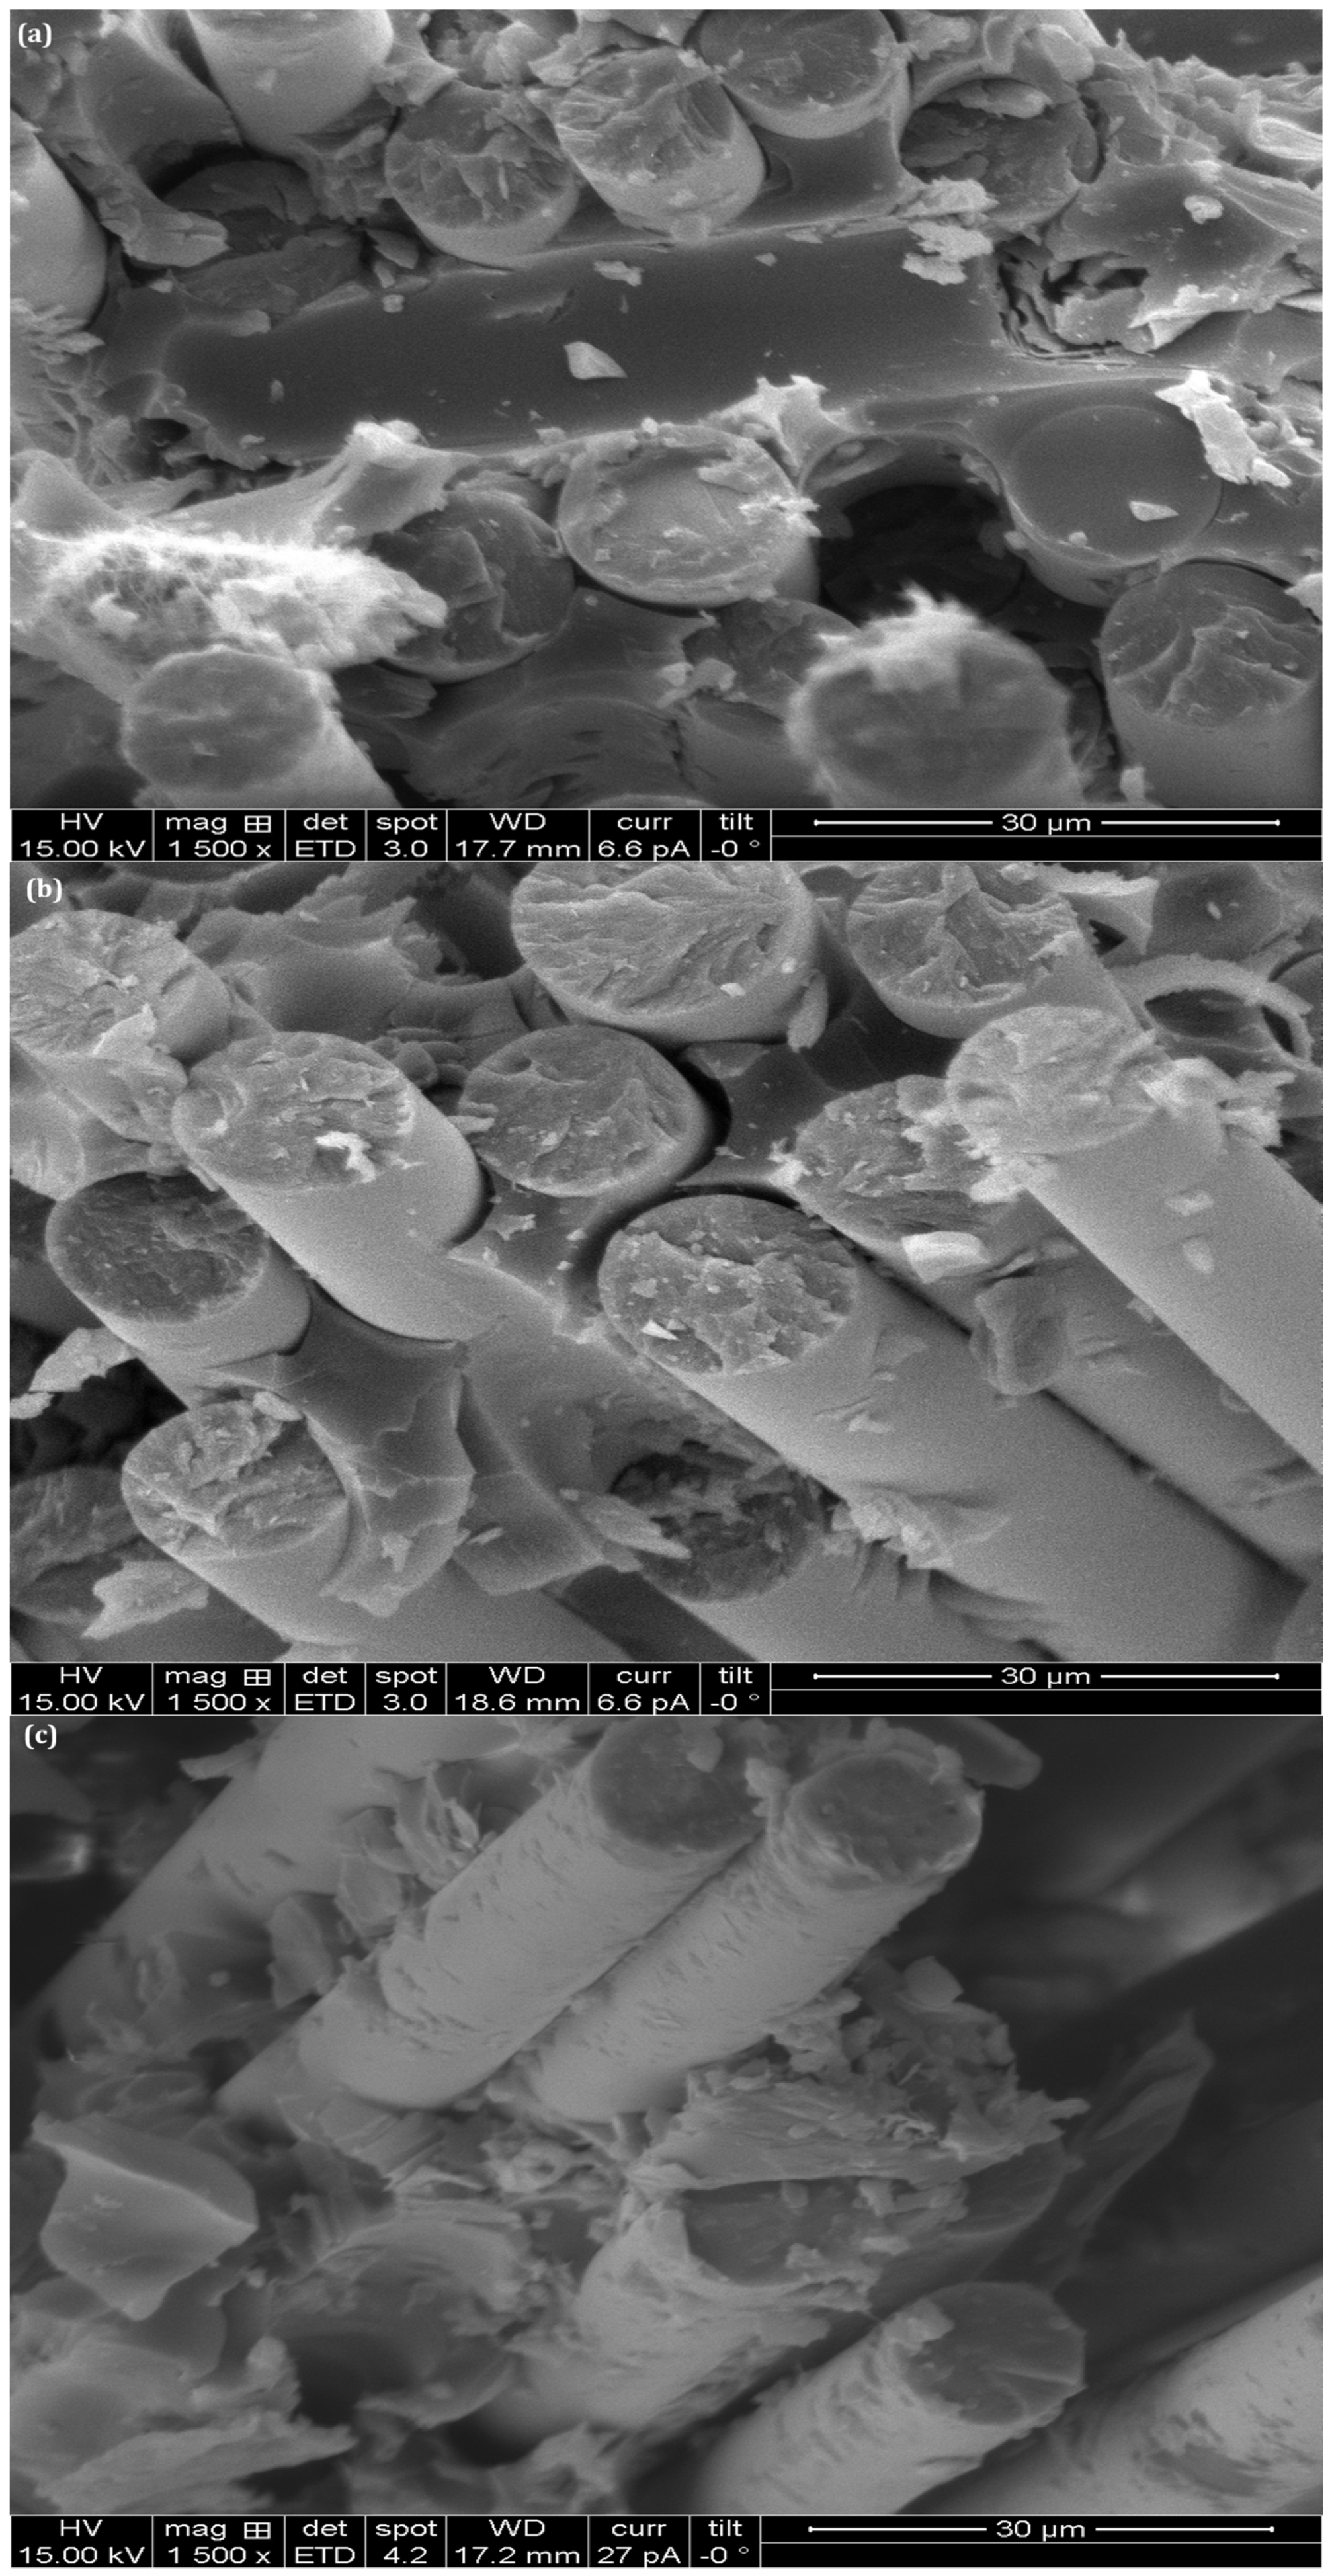
The fracture surface micrographs of different GF/Ep (H0), GF/Ep + 4 wt.% nS (H2), and GF/Ep + 4 wt.% nS + 2 wt.% nHap (H3) composites under tensile loading are displayed in Figure 10a–c. Understanding the failure mechanisms and the impact of nHap and nS on fracture behavior is possible owing to these SEM images.
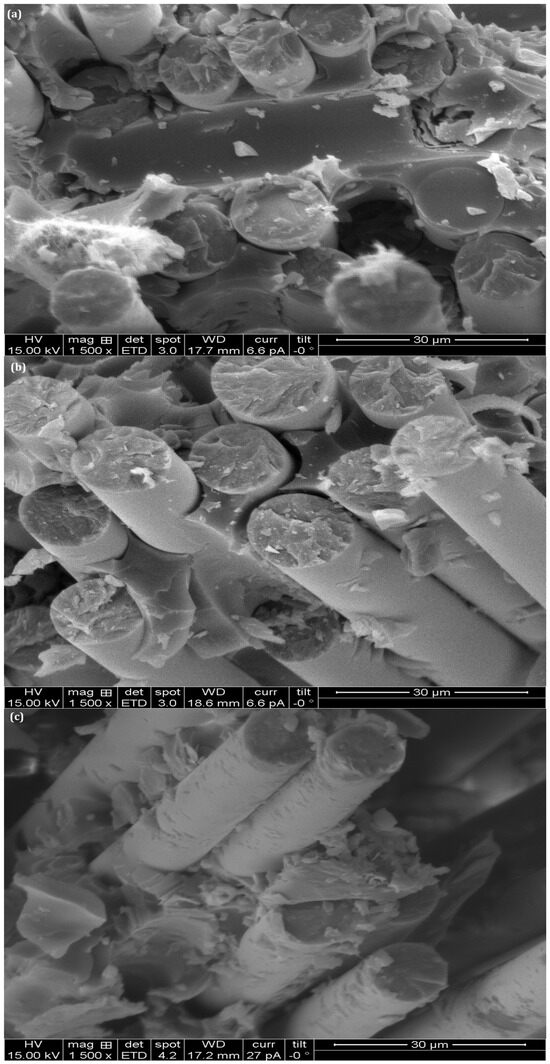
Figure 10.
Tensile failed fractography of (a) H0, (b) H2, (c) H3.
The H0 composite sample fracture surface shows indications of brittle failure in Figure 10a, which is typified by a comparatively smooth Ep matrix with limited fiber pull-out. Weak interfacial bonding was the main cause of failure at the fiber–matrix interface, as indicated by the GFs appearing to be largely intact. Under tensile stress, voids in brittle polymer composites often show matrix cracking and fiber debonding.
The addition of nS (sample H2) dramatically changes the fracture morphology in Figure 10b. With less fiber pull-out and a rougher fracture surface, this surface exhibits improved fiber–matrix bonding in comparison to the unaltered composite. Higher energy absorption is suggested by the increased roughness, which points to a shift toward a more ductile failure mode. The distributed nS particles enhance the toughness of the composite by aiding in stress transfer and crack deflection.
The GF/Ep with nS and nHap (H3) sample shows the strongest fiber–matrix adhesion in Figure 10c. Fiber breakage and limited pull-out are both visible on the fracture surface, indicating that Hap has improved mechanical interlocking. The hybrid nanofillers (nS + nHap) successfully stop cracks from spreading, which results in a more ductile fracture behavior and higher failure resistance. Debris and microcracks are additional signs of an improved fracture toughness mechanism, where energy dissipation and crack deflection take place more effectively. The SEM study indicates that the inclusion of nS and nHap fillers significantly improves the fiber–matrix interface and modifies the fracture behavior of H0 composites.
3.7. Interlaminar Shear Strength
Table 2 lists the hybrid polymer nanocomposites H0, H1, H2, and H3′s interlaminar shear strength (ILSS) at varying nS weight percentages and a fixed loading of 2 wt.% nHap in H3 composites. The ILSS of the H1 and H2 hybrid nanocomposites rises by 9.6% and 13.8%, respectively, when nS is added at 2.0 and 4 wt.%;in contrast, the addition of dual fillers (4 wt.% nS and 2 wt.% nHap) to the GF/Ep composite (H3) increases the ILSS by 21.4%.
The H2 and H3 hybrid epoxy nanocomposites showed the highest ILSS value at 4 wt.% nS and a combined filler weight of 6 wt.% (4 wt.% nS and 2 wt.% nHap). Nanofillers tend to form a good bond between adjacent layers in the composite, strengthening the shear strength and boosting the load-bearing capacity in the shear direction. This could be due to nS and nHap dispersing well at these loadings. Similarly, nS and nHap enhance the chemical and mechanical interactions between the fibers and matrix, allowing for the development of a robust interface [66].
For GF-RPMCs, the ILSS was affected by the matrix’s wettability as well as the interfacial bonding between the protein and matrix. In the H2 hybrid nanocomposite, ILSS enhancement is only 13.8% after 2 wt.% of nS is added to GF/Ep, suggesting that it is less effective because of the slight agglomeration. The viscosity of the epoxy resin increased when a larger weight percentage of nS was added. Consequently, less resin enters the GF reinforcement during the manufacturing process. Increased viscosity weakens impregnation and interfacial bonding, which in turn results in decreased interfacial bonding between the matrix and fiber. When the proportion of nanomaterials is higher, an analogous pattern is seen [55,67,68].
3.8. Flexural Strength
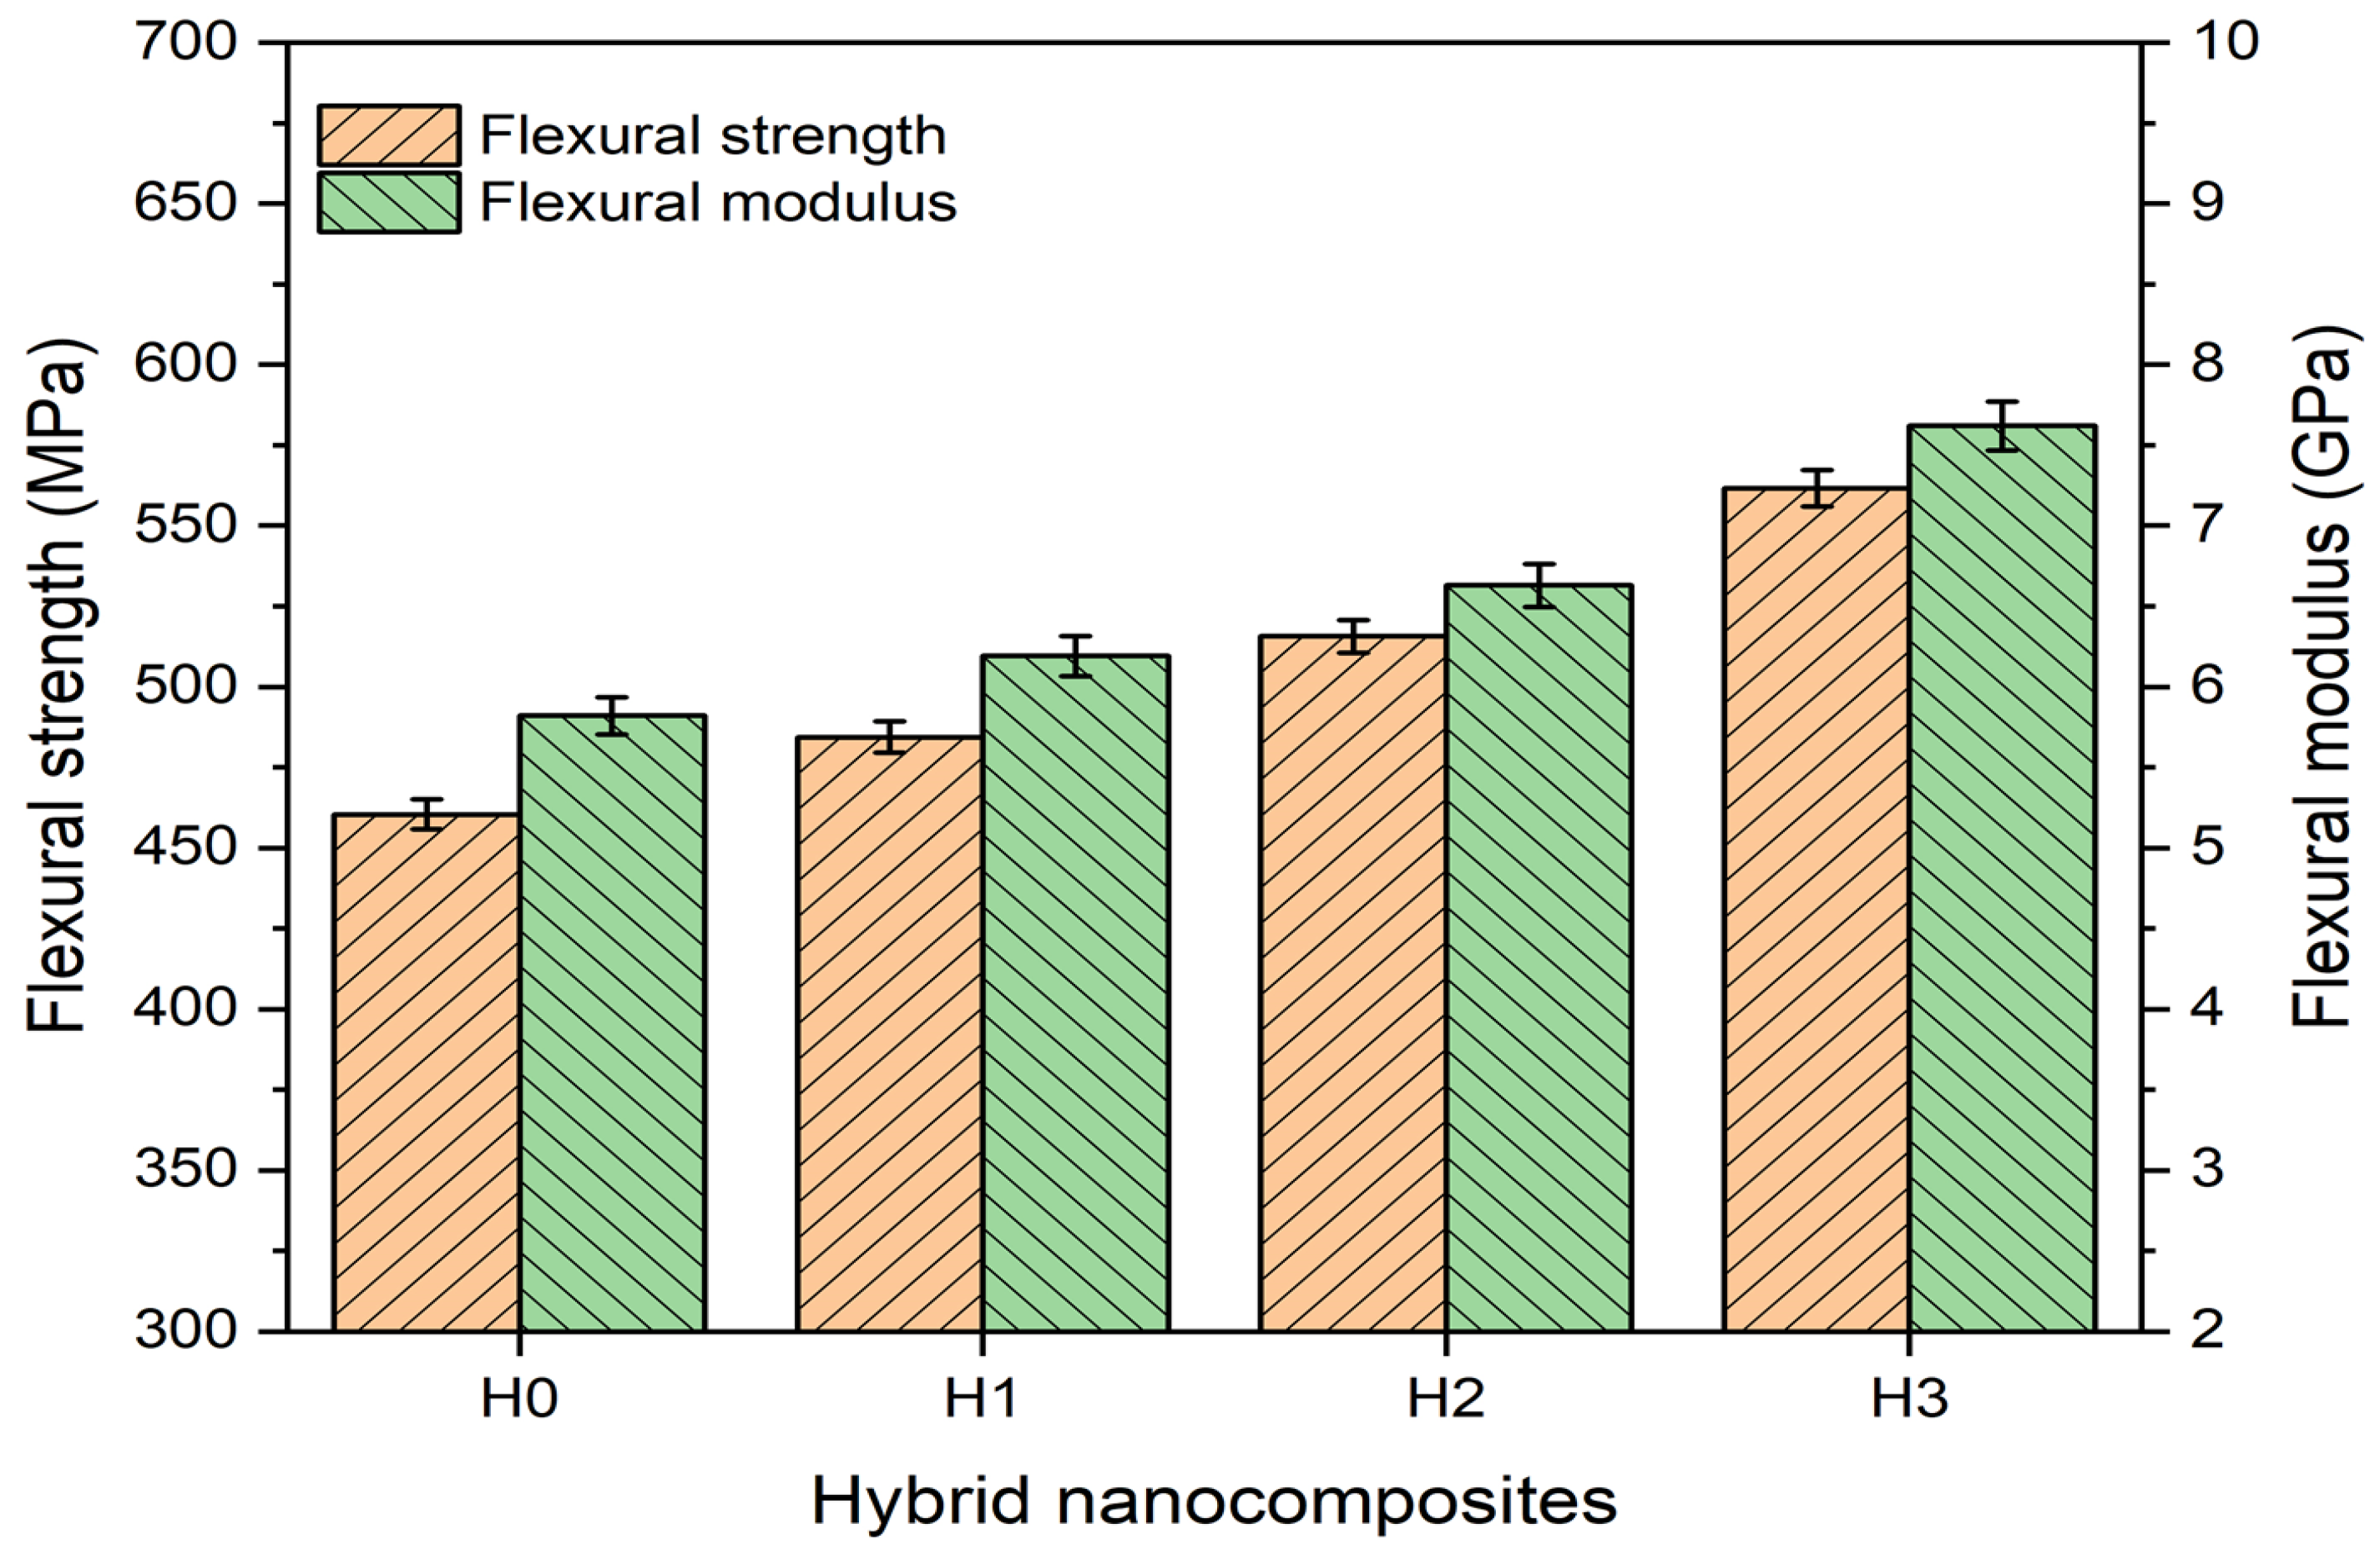
Flexural strength and flexural modulus variations for various hybrid nanocomposites, designated H0, H1, H2, and H3, are depicted in Figure 11. Flexural strength and flexural modulus both steadily increase as the hybrid nanocomposites’ composition shifts from H0 to H3, corresponding to the graph’s trend. The orange line with circular markers represents the flexural strength, which gradually increases from approximately 450 MPa in H0 to about 600 MPa in H3. This signifies that improvements in the composition of the nanocomposite lead to improved mechanical properties, especially with regard to resistance to bending forces.

Figure 11.
Flexural strength and modulus of GF/Ep composites and their hybrid nanocomposites.
A similar upward trend is seen in the flexural modulus, which is symbolized by the blue line with square markers. In H0, the modulus is approximately 5.5 GPa, and in H3, it is closer to 8 GPa. This shows an obvious increase in stiffness, suggesting that the nanocomposites become more rigid as they move from H0 to H3. The graph’s error bars shed light on how reliable the data is. The comparatively small error margins support the validity of the observed trends by indicating little variation in the measurements.
When compared to the control GF/Ep composite (H0), the addition of nS particles significantly changes the flexural modulus and flexural strength of GF/Ep samples (H1 and H2). Additionally, the modulus was enhanced by adding 2 wt.% of nHap to the H2 sample (4 wt.% nS into GF/Ep); however, the strength was not increased. The increase in strength and modulus may be due to the interfacial bond that nS and nHap create between the fiber and matrix. The addition of nS created a robust Si-O-Si network in the GF/Ep composite (H1 and H2), as shown by the appearance and intensification of peaks around 1000–1100 cm−1, as examined by the FTIR technique. This probably improved the material’s stiffness and load-bearing ability (Figure 6). Furthermore, samples with nS and nHap exhibit a higher O-H stretching intensity around 3400 cm−1, indicating the potential for stronger hydrogen bonding interactions. This could result in enhanced interfacial adhesion between the fillers and the epoxy matrix, as well as improved mechanical performance overall.
Adding fillers to the resin matrix can improve the mechanical properties of resin-based materials, according to several studies [69,70]. Notably, the type and size of fillers (micro and nano), their physical orientation, and their capacity to stick to the resin phase can all affect the physical characteristics of resin-based materials [71,72]. Graphene [73], nanofibers [74], and nHap [75] have been the primary targets of grafting inorganic nanomaterials. It has become a hotspot for modified fibers because these inorganic nanomaterials have good dispersion, a mature preparation process, numerous active centers, and improved chemical activity on the modified fiber surface. When Siddiqui et al. grafted nHap onto GF using microwave radiation, the nHap was evenly distributed in a spherical shape on the GF surface [75]. It is possible that the hydrophilic unmodified nanoparticles clump together in the resin phase due to their inability to be properly dispersed, depending on the type of filler. This phenomenon causes stress to be concentrated at particular points in the resin phase, which facilitates the spread of cracks through the matrix resin’s unfilled areas. This could be the main factor causing cracks to spread, reducing flexural strength and leading to matrix fracture. These explanations demonstrate why unmodified nanoparticles did not significantly change the flexural strength.
3.9. Fractographic Analysis Under Flexural Loading
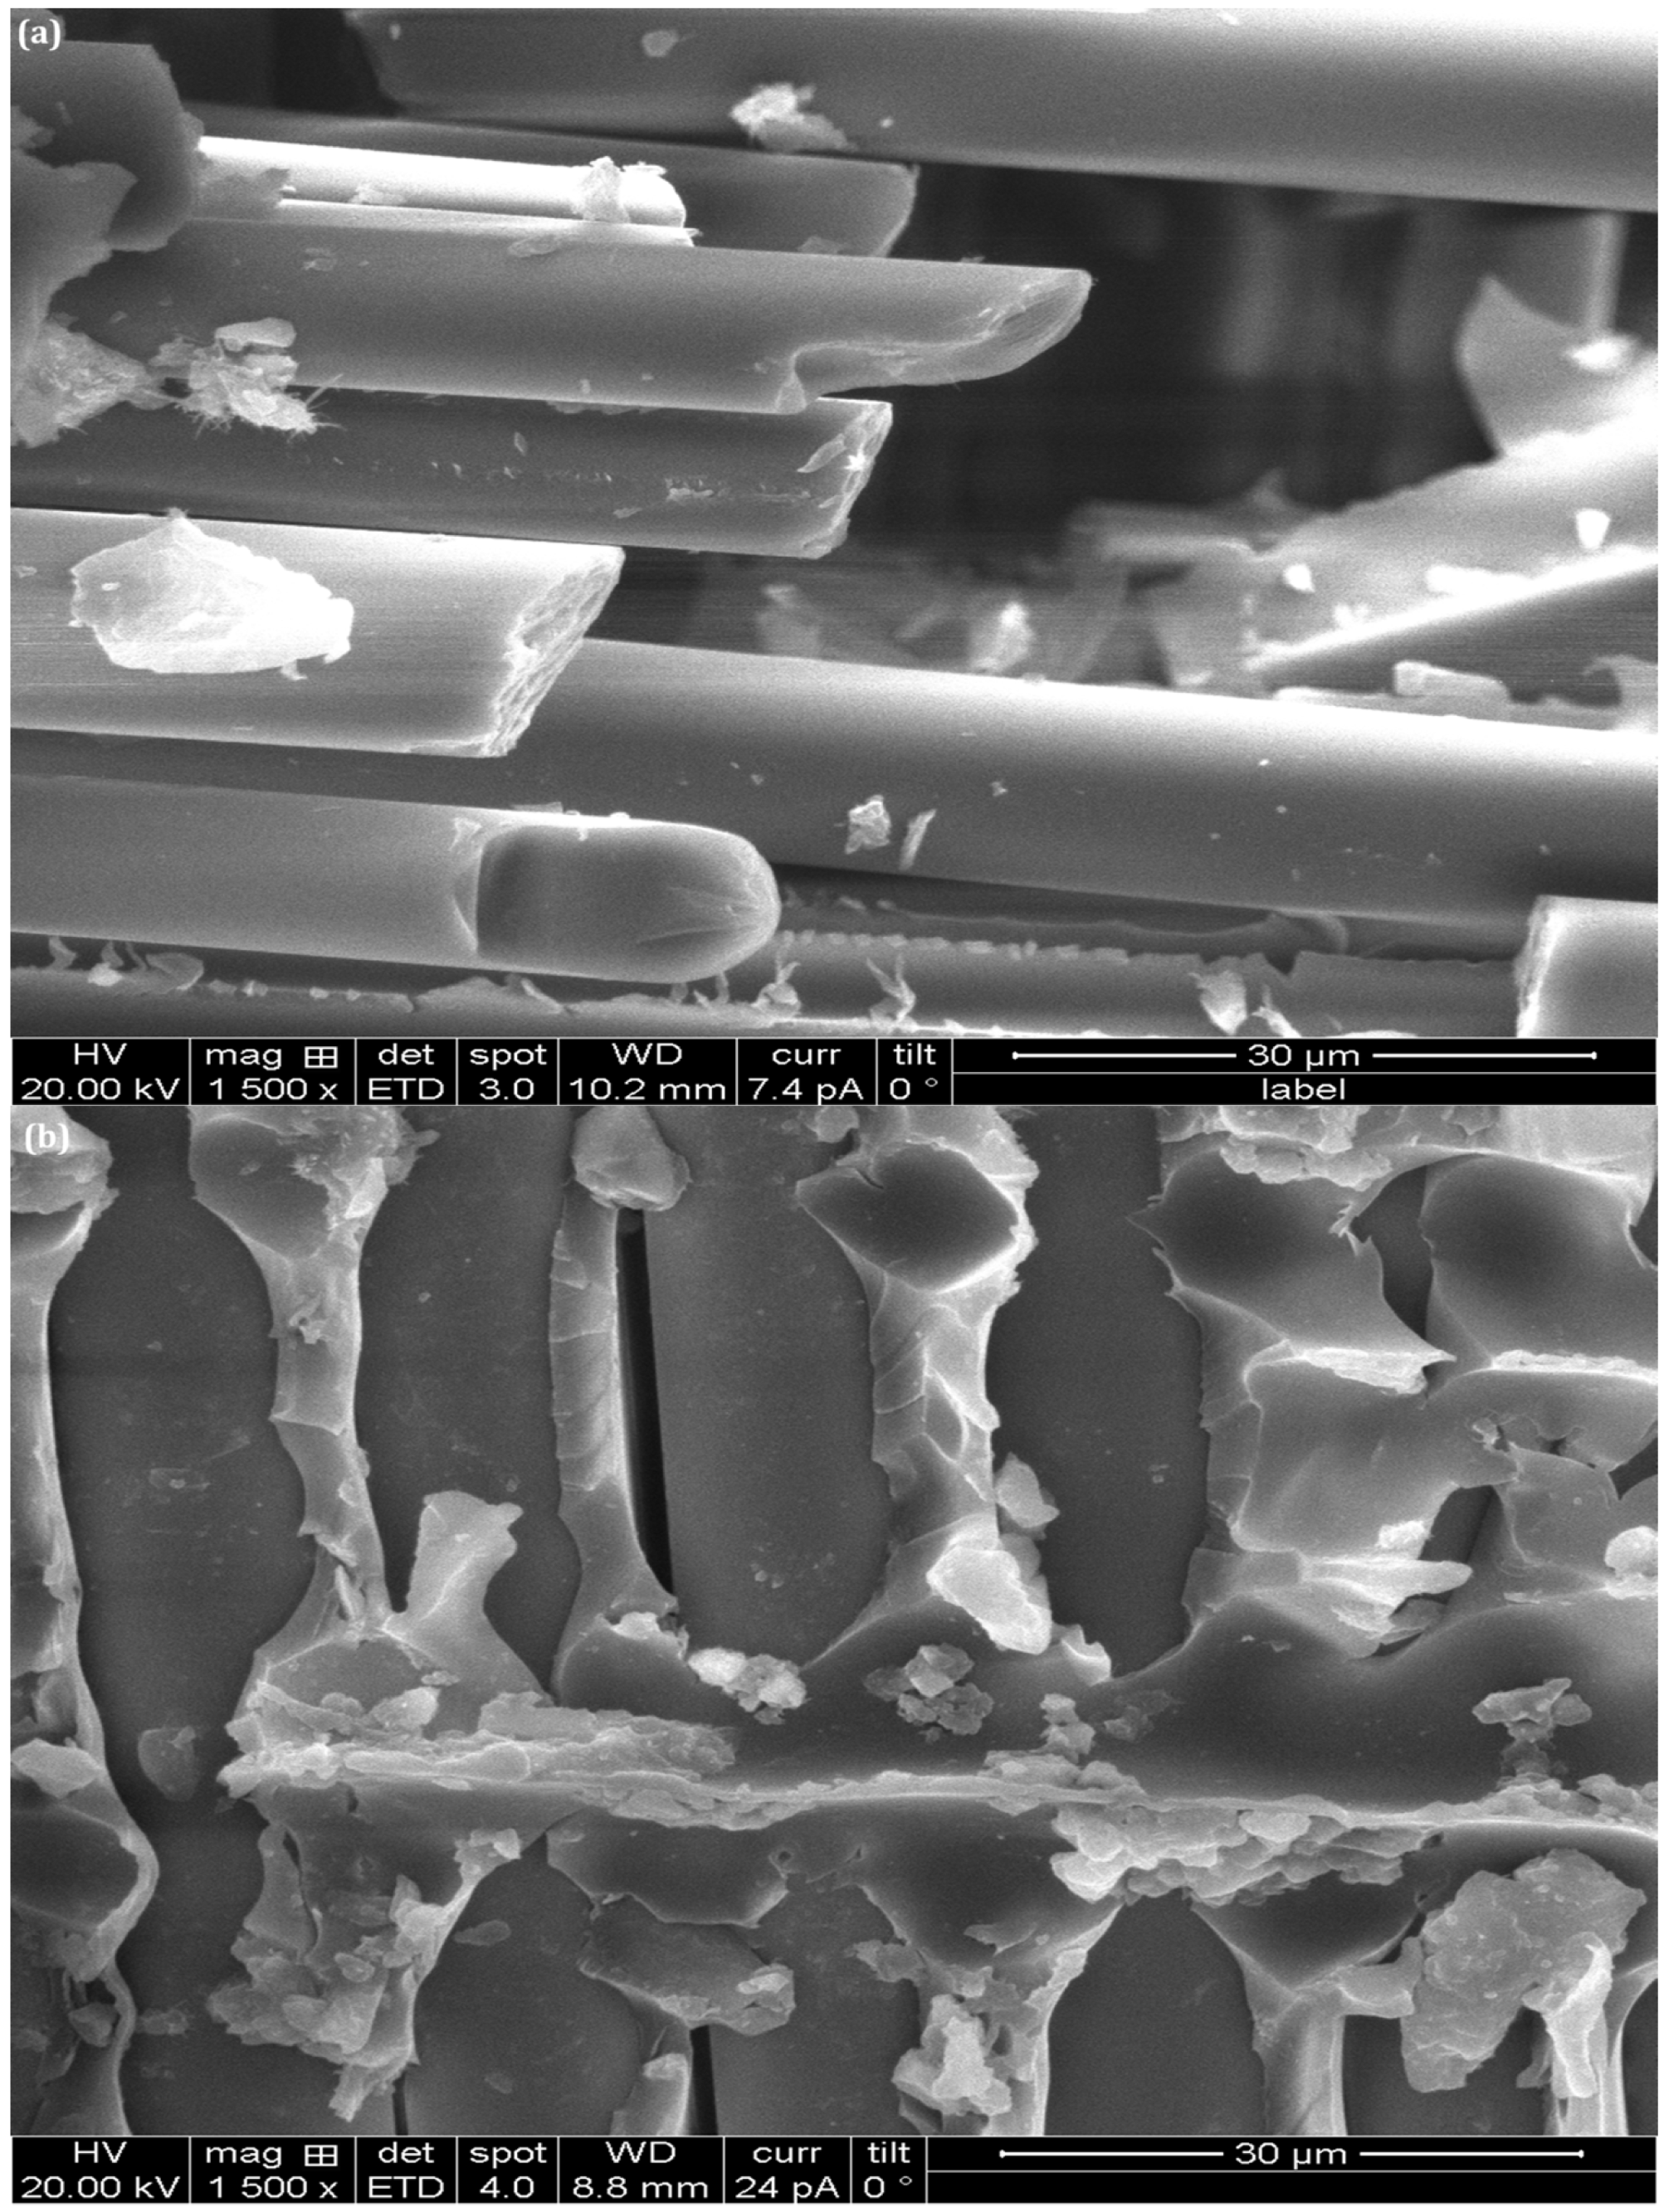
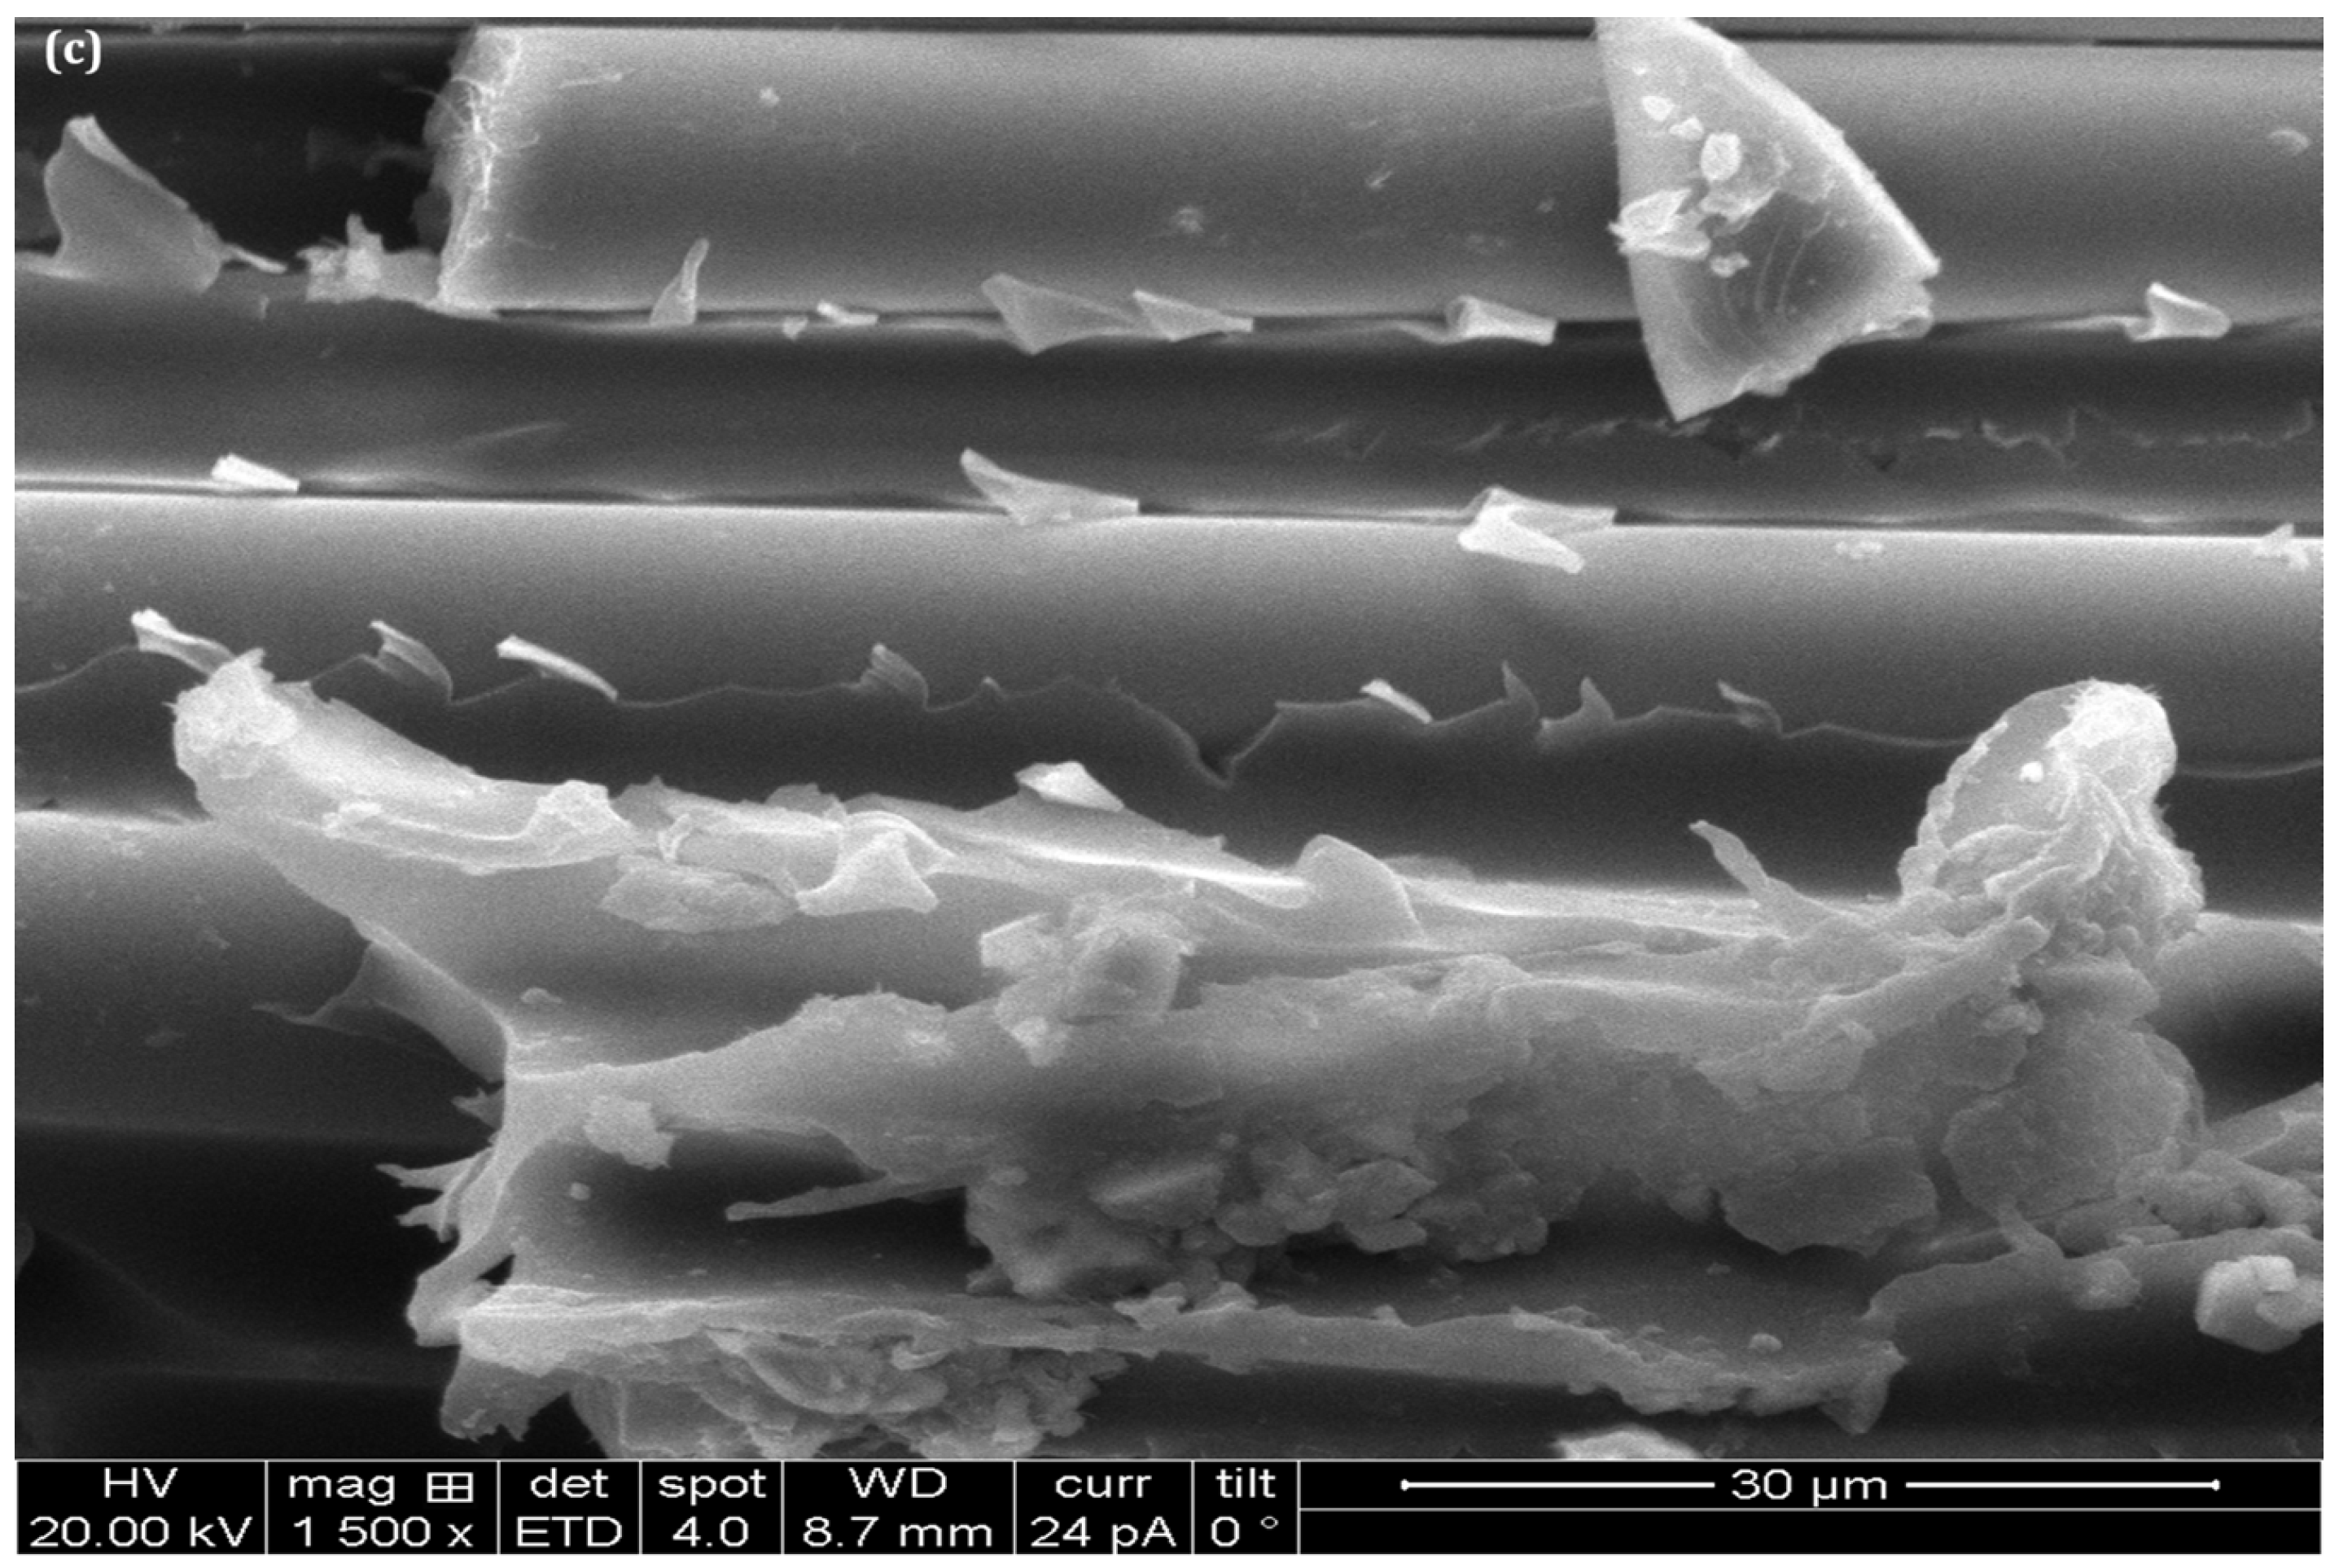
Photomicrographs of samples at their fractured surfaces due to the bending load are shown in Figure 12a–c. SEM analysis demonstrated fiber fracture, fiber–matrix delamination, and matrix failure. Further degradation was seen in the control GF/Ep sample (H0).

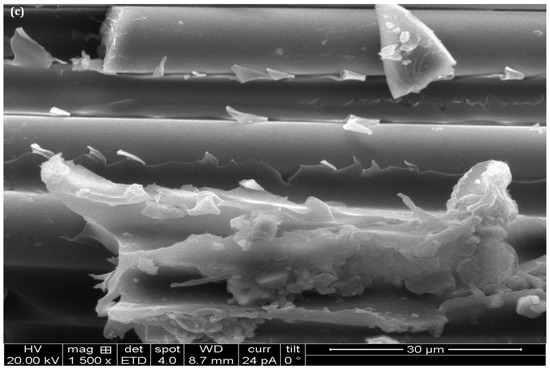
Figure 12.
Photomicrographs showing the fracture surfaces of (a) H0, (b) H2, and (c) H3 samples under bending load.
The GF/Ep composite (H0) fracture surface, displayed in Figure 12a, primarily demonstrates fiber pull-out and clean fiber surfaces, indicating weak fiber–matrix adhesion. The most prevalent fracture characteristics are brittle, exhibiting minimal matrix plastic deformation. Minor matrix fragmentation is suggested by the presence of debris or tiny fragments on the fibers. More complex fracture morphology results from the addition of nS particles, which increases matrix toughness (Figure 12b, GF/Ep with 4 wt.% nS; H2 sample). Improved energy absorption is indicated by the fractured surface’s increased roughness, matrix bridging, and shear deformation. The fiber–matrix interface exhibits reduced fiber pull-out and improved bonding in comparison to Figure 12a.
The fractured surface of GF/Ep with nS and nHap (H3), as seen in the photomicrograph displayed in Figure 12c, has the highest degree of fracture roughness, with interesting micro-crack formations and crack deflection. The nHap improves the interfacial bonding between fibers and the matrix by reducing fiber pull-out. The epoxy matrix exhibits signs of plastic deformation, indicating enhanced mechanical performance and toughness. The analysis concludes that nano-reinforcements elevate mechanical performance under bending loads by substantially modifying the fracture mechanisms.
3.10. Impact Strength
The impact strength results depicted in Figure 13 indicate a progressive enhancement in the impact strength of hybrid nanocomposites with increasing filler loading. The GF/Ep composite sample (H0) exhibits the lowest impact strength, suggesting that the unmodified matrix is more susceptible to brittle fracture. Impact strength increases by 2.4% and 2.7% in H1 and H2, respectively, as nS fillers are added. This is probably because of better energy dissipation and crack deflection mechanisms. The increase is still modest, though, suggesting that lower nS loadings largely improve the epoxy matrix without appreciably changing the failure behavior. When small amounts of nS and nHap (H3) are added, the GF/Ep’s impact strength changes dramatically. There was an 11.6% increase in impact strength.
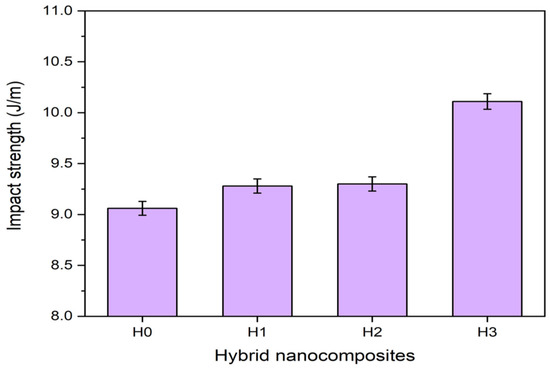
Figure 13.
Impact strength of GF/Ep and their hybrid nanocomposites.
Generally speaking, energy is absorbed by glass-fiber-reinforced polymer composites (GFRPCs) under impact loading conditions through matrix material plastic deformation, matrix/reinforcement interface debonding, and reinforcing material fracture [76,77]. Fracture results when the phenomenon that requires the least amount of energy to occur becomes noticeable. The crack length increases significantly during the fracture process when there are tiny particles mixed into the matrix. For a given weight fraction of the filler material, the smaller the filler particles, the larger their surface area, and this will increase the crack length and the amount of energy absorbed prior to fracture. The same result will be obtained if the filler particles are incompatible with the matrix material. This happens because crack blunting at the filler particle location will be significant.
In GF-RPMCs, impact strength can be affected by the type and amount of fillers used. Though it is known to improve some mechanical properties, silica rarely has a positive impact on impact strength. Silica nanoparticles primarily act as a stiffening agent, improving the hardness and modulus of the composite; however, they may also cause increased brittleness, which would lower impact resistance. For example, studies show that adding nS fillers improves the composite’s tensile and hardness characteristics, but they may also make it more brittle, which could reduce its capacity to absorb impact energy [78]. As a bioceramic material, nHap has unique interfacial bonding properties with glass and epoxy fibers. It enhances impact strength and slows the spread of cracks by improving the interfacial adhesion between glass fibers and epoxy. Furthermore, nHap is an energy-absorbing substance that releases impact energy through plastic deformation and micro-cracking. It efficiently absorbed and distributed impact forces in the H3 composite in this study by supporting toughening mechanisms such as crack bridging and crack deflection.
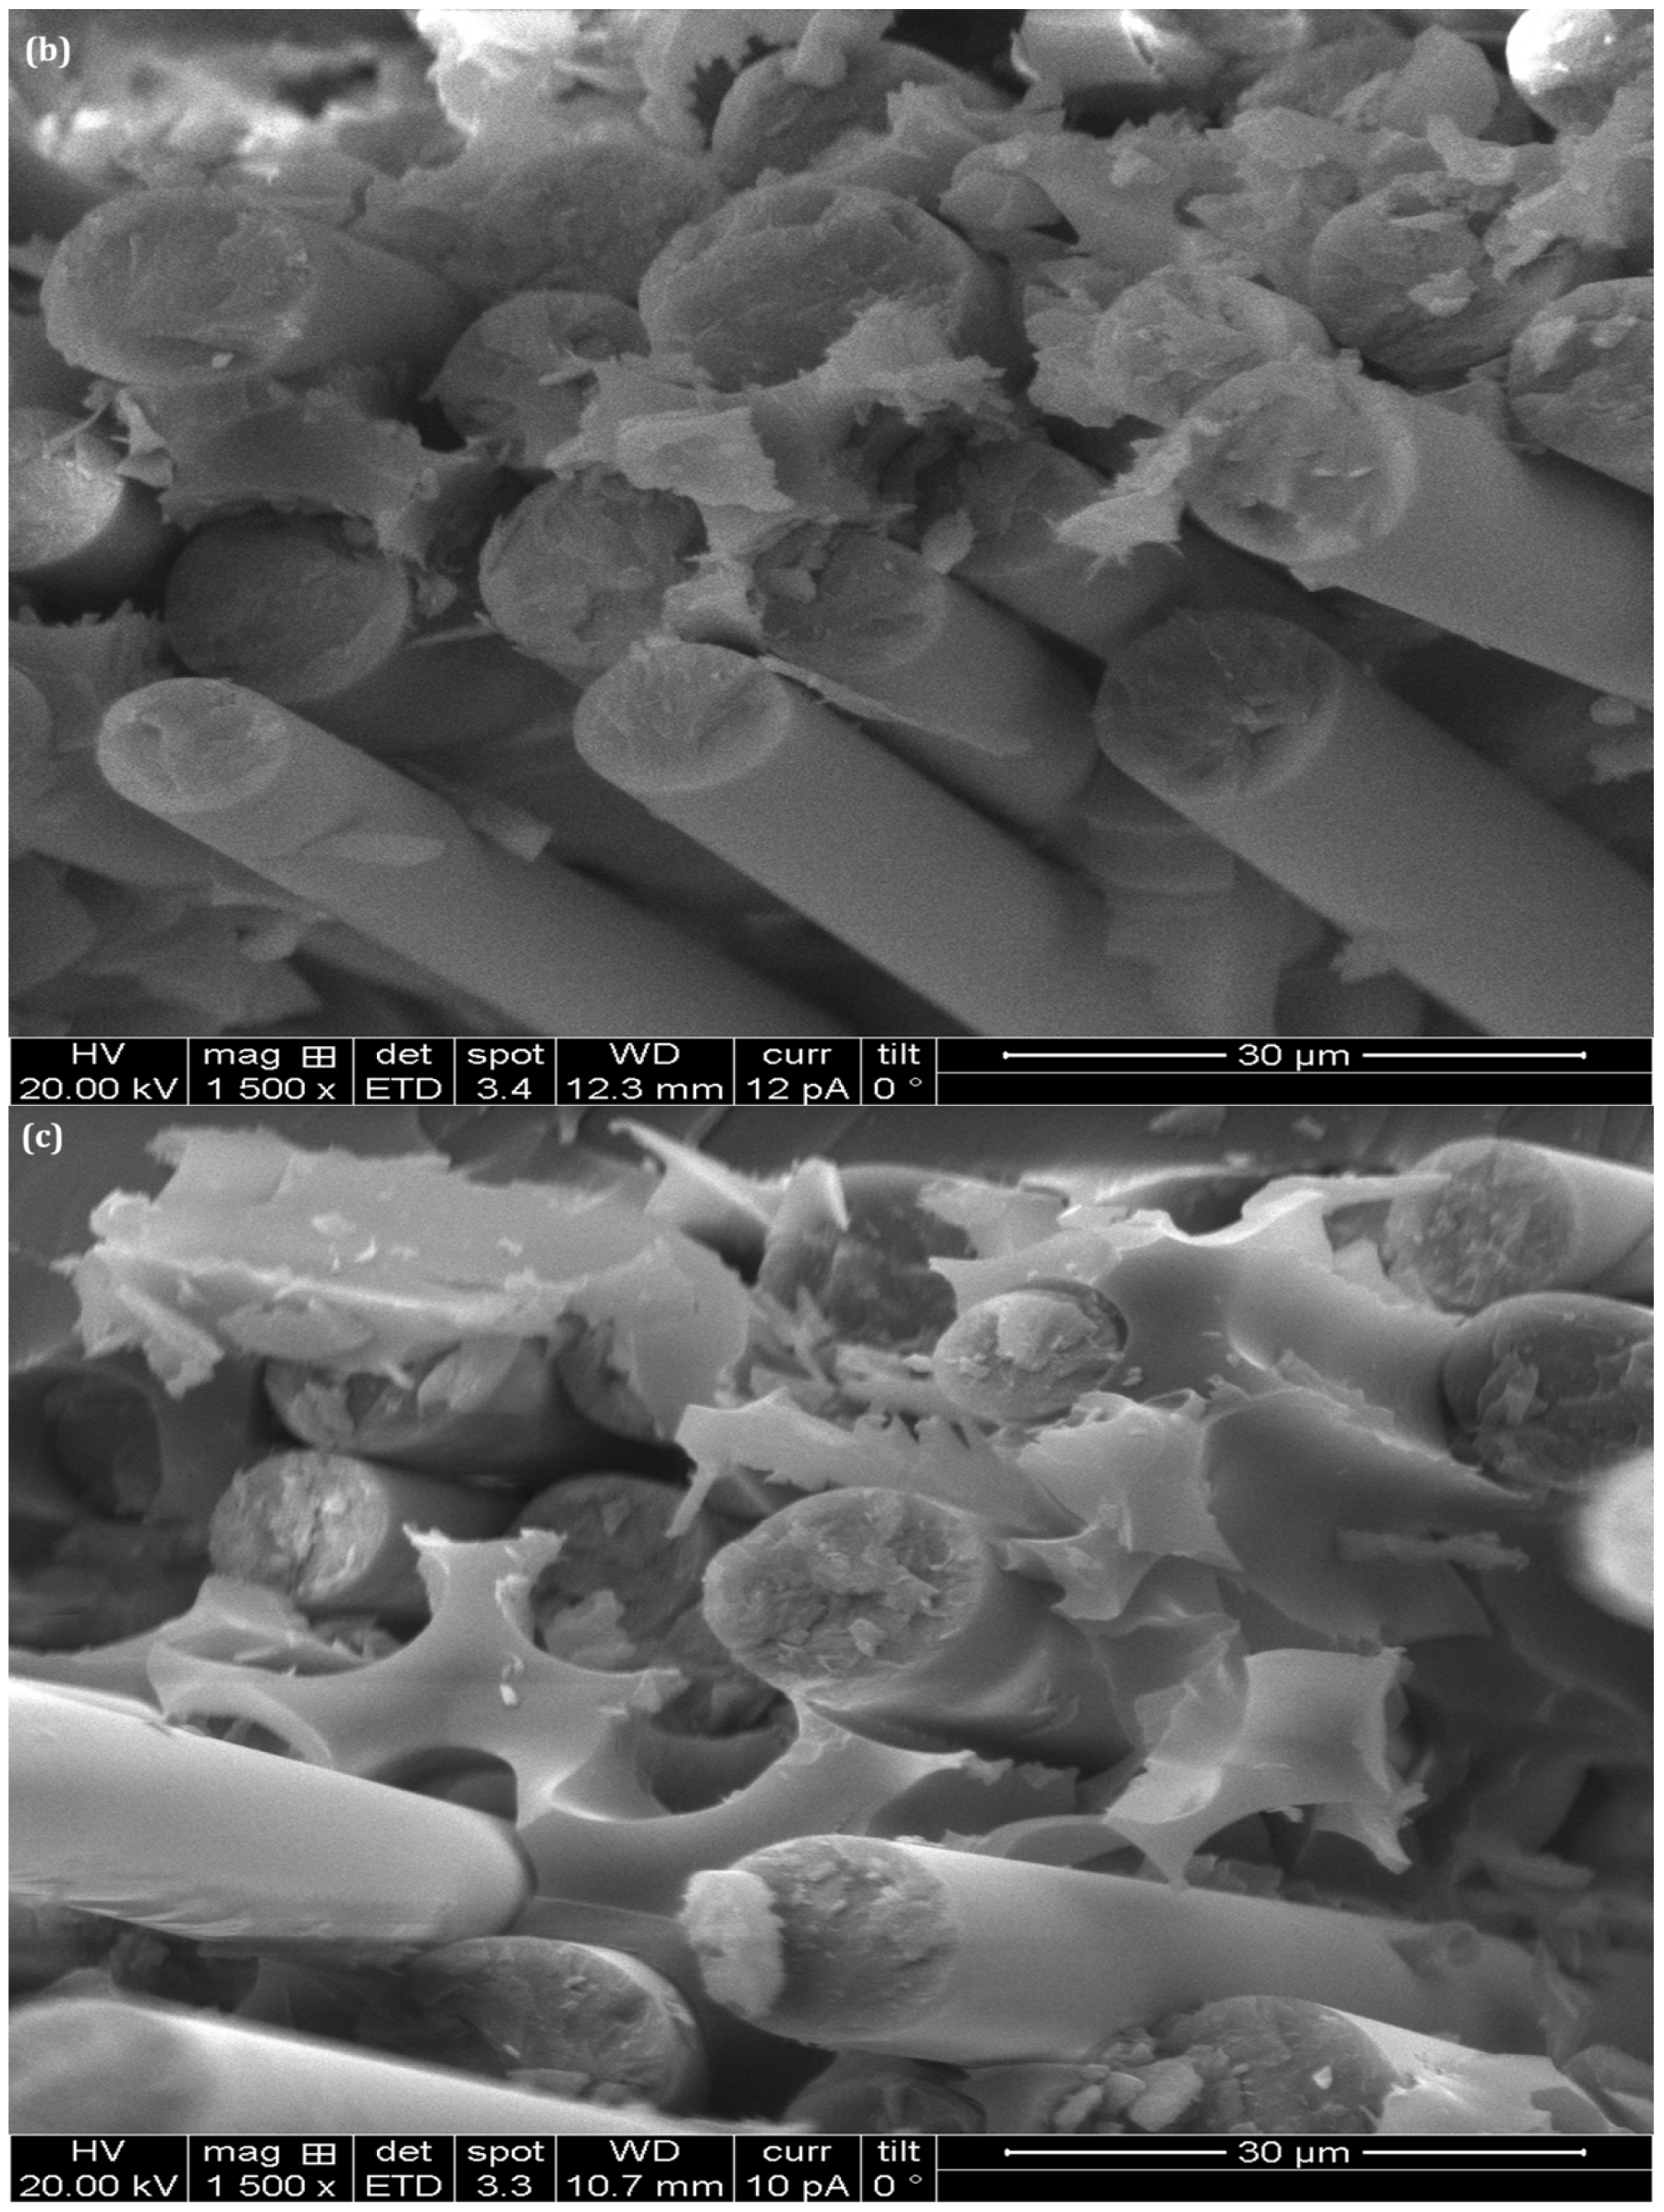
The addition of dual fillers to GF/Ep (H3) appears to be compatible with the matrix resin, based on SEM observation (Figure 14c). Even with good dispersion, a significant number of nanoparticles are visible on the fractured surface (Figure 14c). This supports the claim that a growing crack front had to alter its course multiple times during the fracture process following interaction with nanoparticles, boosting the effective crack length and thus, the energy absorption during the fracture process. Better toughness is also influenced by enhanced interfacial bonding and the capacity to stop early crack propagation. The impulsive increase in impact strength from H2 to H3 suggests that there may be a threshold beyond which the fracture behavior is dominated by the nanofillers, greatly increasing impact resistance. The significance of optimizing nanofiller content to maximize mechanical performance in hybrid nanocomposites is underscored by these findings. A deeper understanding of the dispersion quality and failure mechanisms underlying the observed improvements is possible with additional microstructural analysis, which is covered in the section that follows.

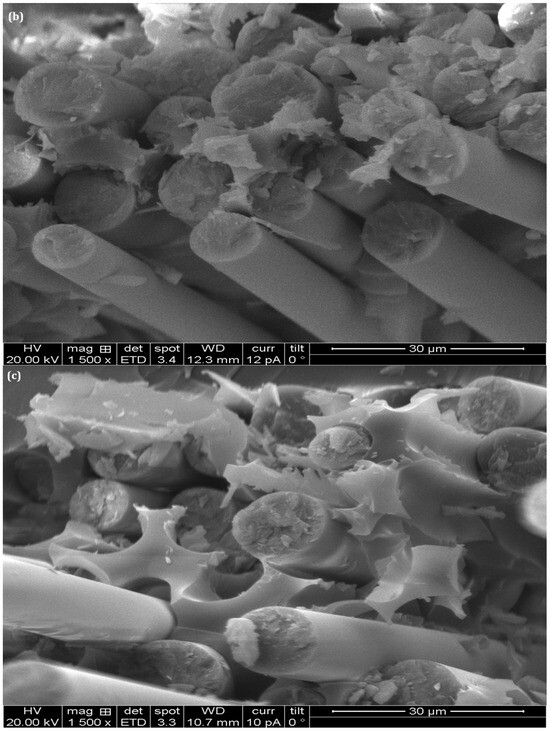
Figure 14.
Micrographs showing the fracture surfaces of (a) H0, (b) H2, and (c) H3 samples under Izod impact testing.
3.11. Fractographic Analysis Under Impact Loading
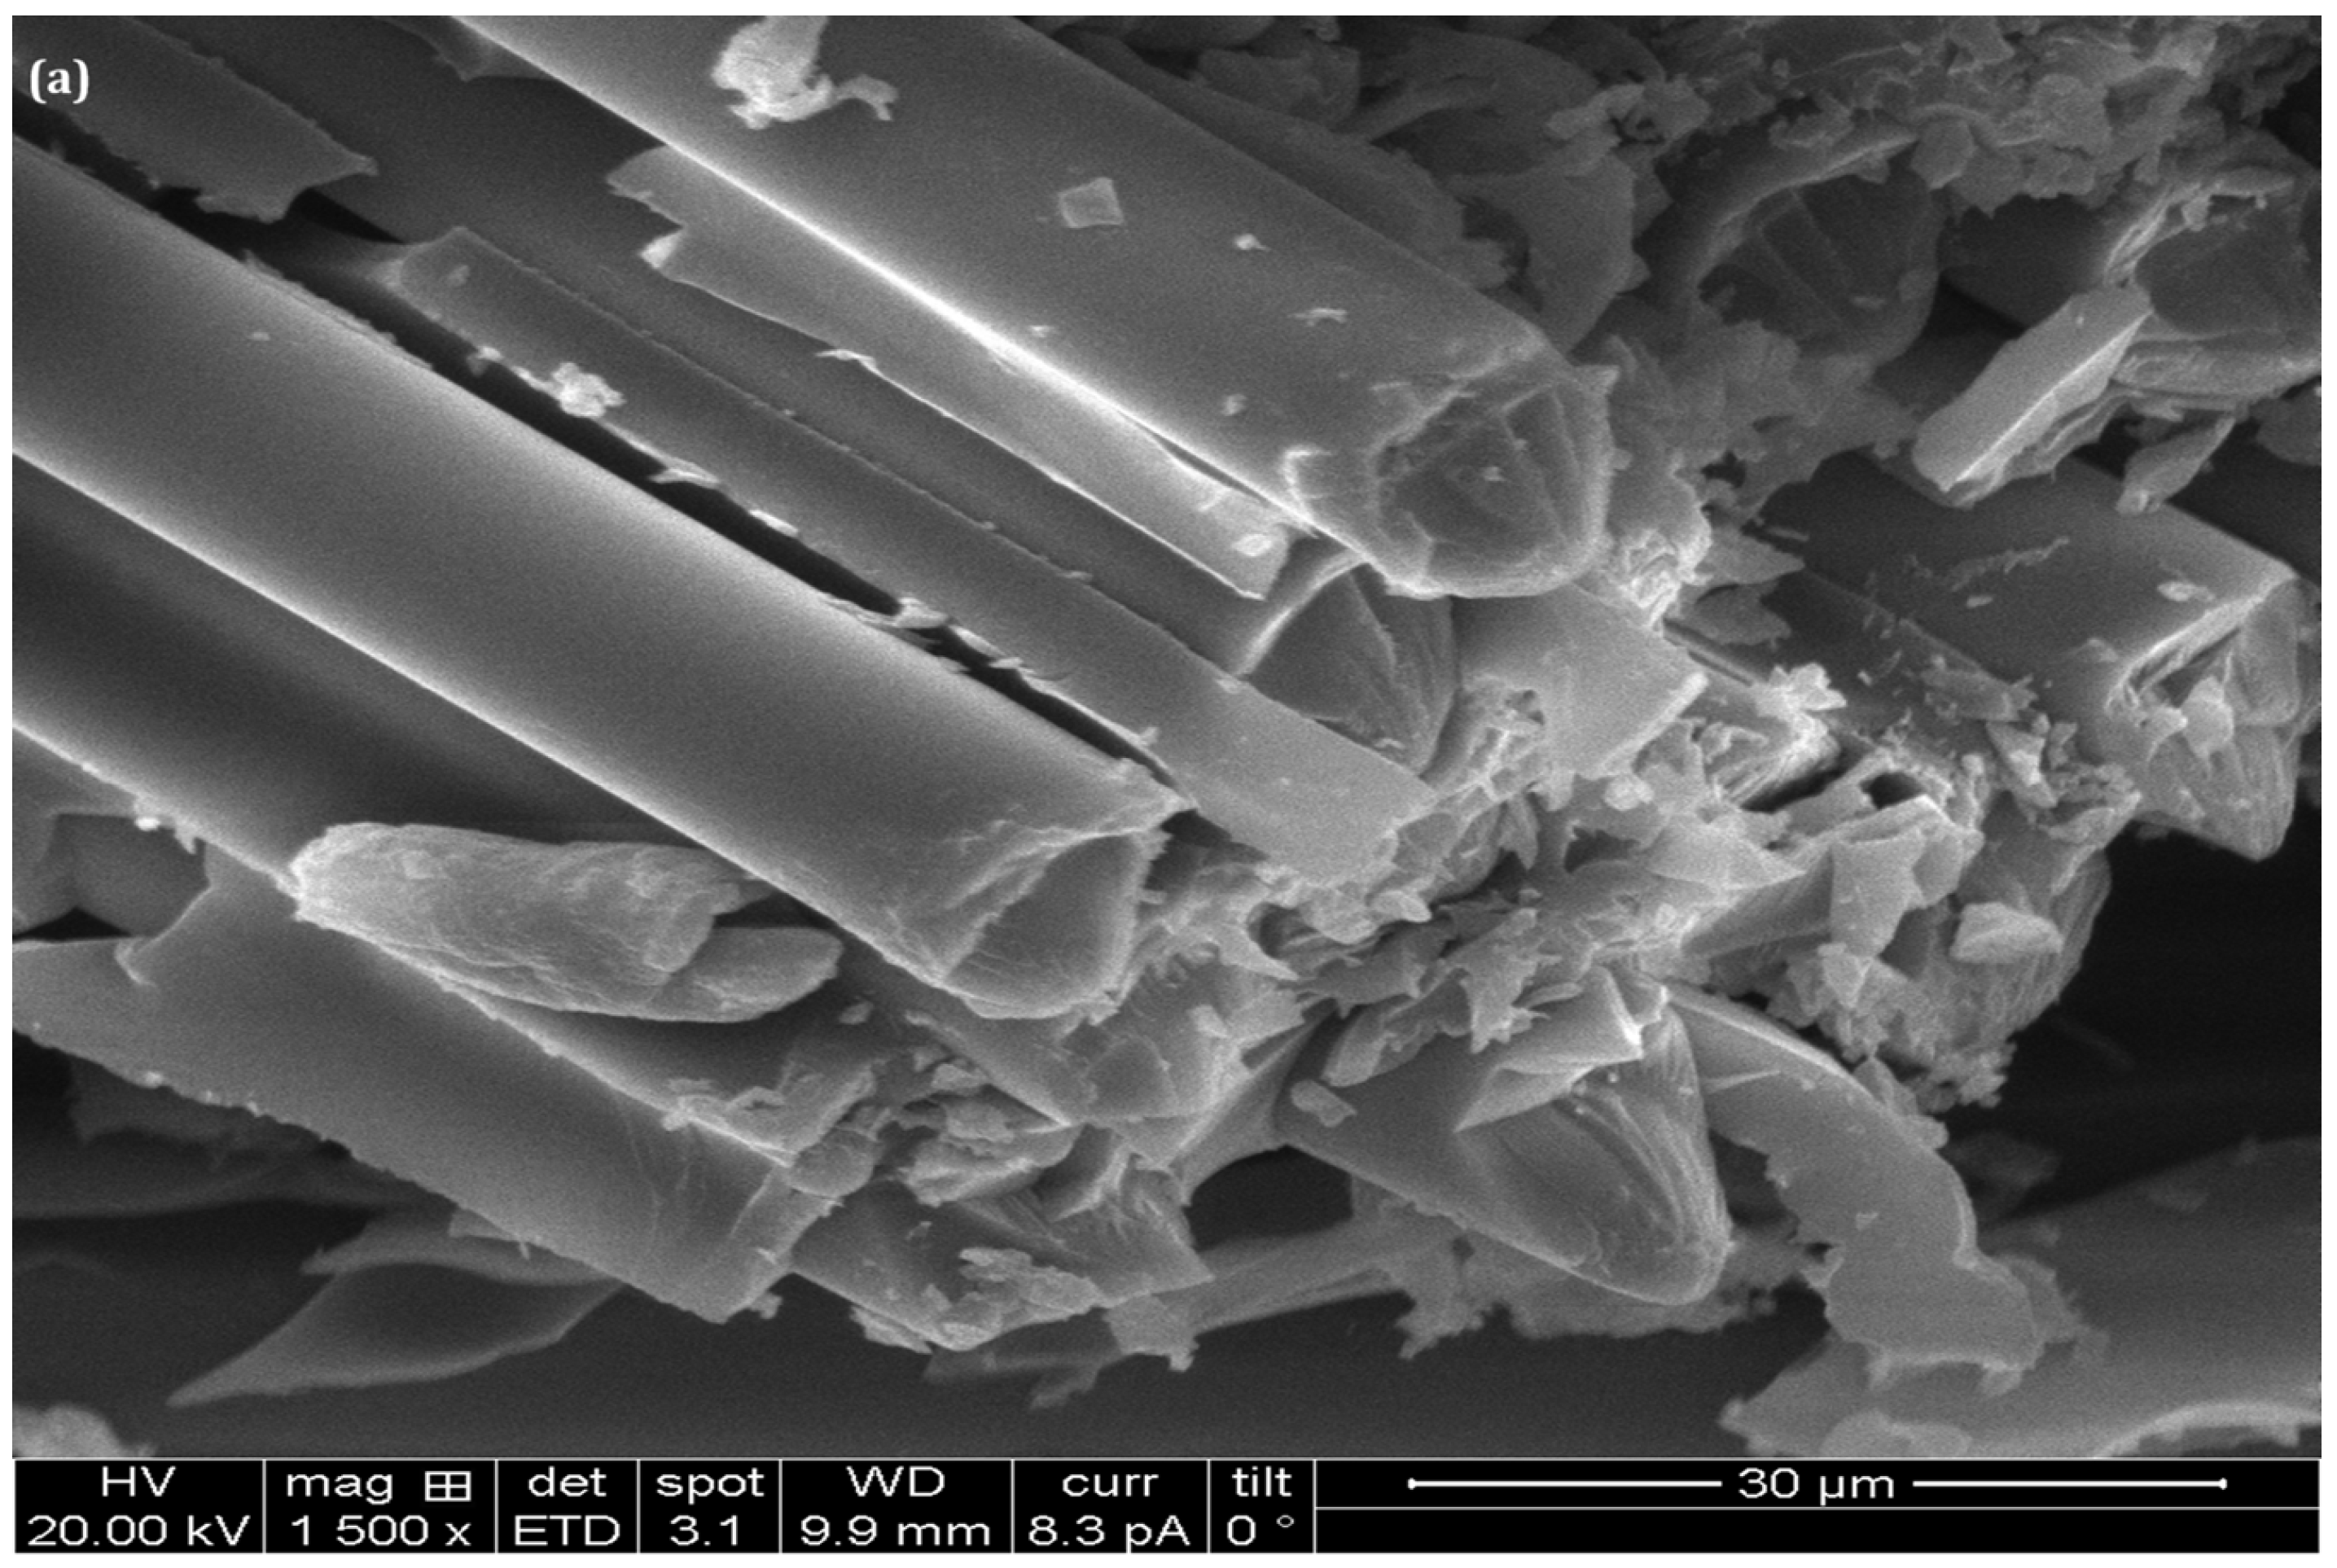
Figure 14a–c depict photomicrographs of the fracture surfaces of GF/Ep that were subjected to Izod impact testing with and without nanofillers. The variations in fracture morphology demonstrate how impact resistance is impacted by nano-reinforcements. Significant fiber pull-out is visible in the impact-failed GF/Ep composite (H0) photomicrograph in Figure 14a, suggesting a weak interfacial bond between the GFs and the epoxy matrix. Smooth fiber surfaces are a sign that a brittle fracture occurred because the matrix was unable to adequately transmit the impact energy to the fibers. Moreover, the limited plastic deformation indicates a low energy absorption failure mode that is primarily brittle. Figure 14b displays the impact-failed GF/Ep with 4 wt.% nS (H2) composite. It is evident that the addition of nS improves matrix toughness, leading to a rougher fracture morphology and more noticeable matrix deformation. Mechanisms for energy dissipation and crack deflection are seen, suggesting increased impact resistance. Additionally, while some fibers are still pulled out, fiber debonding is decreased due to increased fiber–matrix adhesion.
Figure 14c reveals the impact-failed samples H3, where the composite is made up of GF/Ep with 2 wt.% nS and 2 wt.% nHap. The addition of nHap further improves impact resistance by producing a highly textured fracture surface and extensive plastic deformation. Further impact energy absorption before failure may occur in the composite when matrix bridging and fiber breakage are present. The toughening mechanisms of crack pinning, micro-crack formation, and crack deflection are clearly visible in contrast to the fractographs displayed in Figure 14a,b. The enhanced fiber–matrix adhesion results in a more ductile fracture mode by reducing fiber pull-out. With nHap offering the most notable enhancements, this analysis demonstrates that nano-reinforcements improve the impact resistance of GF/Ep composites.
4. Conclusions
This research examines the influence of silica and hydroxyapatite nanofiller incorporation on the microstructure, mechanical properties, and failure morphology of glass fiber/epoxy (GF/Ep) composites. The subsequent discussion details the effects of varying nanofiller loading, and the primary findings are summarized below.
- The microstructural analysis displayed a reduced number of voids and a more or less evenly spaced distribution of nanofillers, demonstrating better matrix–reinforcement bonding.
- FTIR analysis suggests that the enhanced mechanical properties observed in the nS and nHap-filled GF/Ep are due to the formation of a strong Si-O-Si network and the potential for increased interfacial adhesion through stronger hydrogen bonding between the nanofillers and the epoxy matrix.
- The addition of small weight fractions of nS particles to the composite samples improved their modulus, strength, and hardness. Nonetheless, impact strength was marginally increased by the addition of a small amount of nS.
- The addition of nS considerably improved the tensile strength and tensile modulus of the GF/Ep composites. Of these, the composite with 4 wt.% nS (sample H2) had the best tensile characteristics.
- Comparing the GF-reinforced polymer hybrid nanocomposite with an unfilled GF/Ep composite shows that the ILSS is improved by adding nS and nHap fillers to the epoxy. This could be due to improved nanofiller dispersion, which tends to create a connection between two neighboring layers in the composite structure, enhancing the shear strength as load-bearing capacity increases along the shear direction.
- Adding nS and nHap to GF/Ep composites is an effective way of significantly increasing their impact strength, particularly when added in small amounts. Improved energy dissipation and crack deflection mechanisms are responsible for this effect.
- Through their positive effects on the mechanical and microstructural properties of GF/Ep composites, the study demonstrates the potential of dual nanofillers (nS and nHap) for high-performance applications across a variety of industries.
Author Contributions
P.C. and R.V. contributed to literature development and conceptualization of the presented data. S.D.C. and K.R. (Kiran Raveendra) were responsible for methodology, formal analysis, data investigation, and resource acquisition. K.R. (Kiran Raveendra) and A.P.B. undertook the original drafting, review, editing, validation, and visualization. S.B., D.M.G., R.V.K., D.G.P. and K.R. (K. Raju) provided supervision, guaranteeing research accuracy and the integrity of the manuscript. All authors participated in the review and revision process, enhancing the final manuscript. All authors have read and agreed to the published version of the manuscript.
Funding
This research did not receive any specific grant from funding agencies in the public, commercial, or not-for-profit sectors in India. This work was partially supported by the GeoBioTec Research Unit, through the strategic projects UIDB/04035/2020 (https://doi.org/10.54499/UIDB/04035/2020) and UIDP/04035/2020 (https://doi.org/10.54499/UIDP/04035/2020), funded by the Fundação para a Ciência e a Tecnologia, IP/MCTES through national funds (PIDDAC) to D.G.P.
Data Availability Statement
The original contributions presented in this study are included in the article. Further inquiries can be directed to the corresponding authors.
Acknowledgments
The authors express their gratitude to The National Institute of Engineering, Mysuru-570008, India, for providing the infrastructure and instrumentation facilities.
Conflicts of Interest
The authors declare no conflicts of interest. The funders had no role in the design of the study; in the collection, analyses, or interpretation of data; in the writing of the manuscript; or in the decision to publish the results.
References
- Kim, H.-J.; Kim, W.-J.; Kim, S.-H. A study on the insulation of the termination for HTS cable in liquid nitrogen. J. Supercond. Nov. Magn. 2014, 28, 615–618. [Google Scholar] [CrossRef]
- Zaman, I.; Manshoor, B.; Khalid, A.; Araby, S. From clay to graphene for polymer nanocomposites—A survey. J. Polym. Res. 2014, 21, 429. [Google Scholar] [CrossRef]
- Akderya, T.; Çevik, M. Investigation of thermal-oil environmental ageing effect on mechanical and thermal behaviours of E-glass fibre/epoxy composites. J. Polym. Res. 2018, 25, 214. [Google Scholar] [CrossRef]
- Bheemappa, S.; Gurumurthy, H. Recent advances in fabrication and characterization of nanofiller filled epoxy nanocomposites. In Trends in Fabrication of Polymers and Polymer Composites; AIP Publishing LLC: Melville, NY, USA, 2022; pp. 1–40. [Google Scholar]
- Ortiz, R.A.; Valdez, A.E.G.; Padilla, E.E.G.; Flores, R.A.; Muñoz, J.F.E. Development of a photocurable glass-fiber reinforced epoxy-amine/thiol-ene composite. J. Polym. Res. 2016, 23, 30. [Google Scholar] [CrossRef]
- Xu, M.; Yang, X.; Zhao, R.; Liu, X. Copolymerizing behavior and processability of benzoxazine/epoxy systems and their applications for glass fiber composite laminates. J. Appl. Polym. Sci. 2012, 128, 1176–1184. [Google Scholar] [CrossRef]
- Boobalan, V.; Sathish, T. Evaluation of mechanical, morphological, and dynamic mechanical properties on basalt/E-glass fiber/epoxy modified with MWCNTs + SiO2 hybrid nanocomposites. J. Polym. Res. 2024, 31, 180. [Google Scholar] [CrossRef]
- Perumal, K.P.S.; Selvarajan, L.; Manikandan, K.P.; Velmurugan, C. Mechanical, tribological, and surface morphological studies on the effects of hybrid ilmenite and silicon dioxide fillers on glass fibre reinforced epoxy composites. J. Mech. Behav. Biomed. Mater. 2023, 146, 106095. [Google Scholar] [CrossRef]
- Saberian, M.H.; Ghasemi, F.A.; Ghasemi, I.; Bagheri, M.S. Morphology, mechanical behavior, and prediction of A-glass/SiO2/epoxy nanocomposite using response surface methodology. J. Elastomers Plast. 2018, 51, 669–683. [Google Scholar] [CrossRef]
- Shamim Hasan, A.H.; Chowdhury, M.A.; Almahri, A.; Kowser, M.A.; Alam, M.S.; Shuvho, M.B.; Alruwais, R.S.; Hossain, N.; Rahman, M.R.; Rahman, M.M. Physical, thermal, and mechanical properties of Al2O3/SiO2 infused jute/glass fiber resin composite materials in relation to viscosity. Polym. Compos. 2022, 43, 3971–3982. [Google Scholar] [CrossRef]
- Uzay, Ç. Investigation of physical, mechanical, and thermal properties of glass fiber reinforced polymer composites strengthened with KH550 and KH570 silane-coated silicon dioxide nanoparticles. J. Compos. Mater. 2022, 56, 2995–3011. [Google Scholar] [CrossRef]
- Agrawal, M.; Gupta, M.; Prabhakaran, R.T.D.; Mahajan, P. A comparative study of static and fatigue performance of glass and basalt fiber reinforced epoxy composites. Polym. Compos. 2023, 45, 3551–3565. [Google Scholar] [CrossRef]
- Demircan, G.; Özen, M.; Kisa, M. Cam fiber takviyeliepoksikompozitlerifarkliyüklemehizlarindaeğilmeözellikleri. Deu Muhendis. Fak. Fen Ve Muhendis. 2020, 22, 271–276. [Google Scholar] [CrossRef]
- Kabir, M.M.; Mustak, R.; Sadik, M.M. Effect of Bio-filler on Various Properties of Glass Fiber Reinforced Epoxy Composites. Hybrid Adv. 2025, 18, 100448. [Google Scholar] [CrossRef]
- Vaddar, L.; Thatti, B.; Reddy, B.R.; Chittineni, S.; Govind, N.; Vijay, M.; Anjinappa, C.; Razak, A.; Saleel, C.A. Glass fiber-epoxy composites with carbon nanotube fillers for enhancing properties in structure modeling and analysis using artificial intelligence technique. ACS Omega 2023, 8, 23528–23544. [Google Scholar] [CrossRef]
- Mathivanan, N.R.; Jerald, J. Experimental investigation of low-velocity impact characteristics of woven glass fiber epoxy matrix composite laminates of EP3 grade. Mater. Des. 2010, 31, 4553–4560. [Google Scholar] [CrossRef]
- Uflyand, I.E.; Irzhak, V.I. Recent advances in the study of structure and properties of fiber composites with an epoxy matrix. J. Polym. Res. 2021, 28, 440. [Google Scholar] [CrossRef]
- Sethi, S.; Ray, B.C. Environmental effects on fibre reinforced polymeric composites: Evolving reasons and remarks on interfacial strength and stability. Adv. Colloid Interface Sci. 2014, 217, 43–67. [Google Scholar] [CrossRef]
- Kumar, N.; Singh, A. Study the effect of fiber orientation on mechanical properties of bidirectional basalt fiber reinforced epoxy composites. Mater. Today Proc. 2021, 39, 1581–1587. [Google Scholar] [CrossRef]
- Ebrahimnezhad-Khaljiri, H.; Eslami-Farsani, R. The tensile properties and interlaminar shear strength of microcapsules-glass fibers/epoxy self-healable composites. Eng. Fract. Mech. 2020, 230, 106937. [Google Scholar] [CrossRef]
- Sundarakannan, R.; Balamurugan, K.; Jyothi, Y.; Arumugaprabu, V.; Sathish, T.; Mahmoud, Z.; Yousef, E.S.; Basheer, D.; Shaik, S. Importance of Fiber-/Nanofiller-Based Polymer Composites in Mechanical and Erosion Performance: A Review. J. Nanomater. 2023, 2023, 3528977. [Google Scholar] [CrossRef]
- Yang, T.; Lu, S.; Song, D.; Zhu, X.; Almira, I.; Liu, J.; Zhu, Y. Effect of Nanofiller on the Mechanical Properties of Carbon Fiber/Epoxy Composites under Different Aging Conditions. Materials 2021, 14, 7810. [Google Scholar] [CrossRef] [PubMed]
- Zhang, W.; Deng, X.; Sui, G.; Yang, X. Improving interfacial and mechanical properties of carbon nanotube-sized carbon fiber/epoxy composites. Carbon 2019, 145, 629–639. [Google Scholar] [CrossRef]
- Megahed, M.; Sakr, A.S.; Badawy, A.A.M.; Seleem, M.H. Assessment of the performance of aluminum, copper, and graphene nanometer fillers filled woven glass fiber/epoxy composites. J. Polym. Res. 2024, 31, 29. [Google Scholar] [CrossRef]
- Nag, M.K.; Kumar, P. Design, development and effect evaluation of silica nanoparticles on the physical, mechanical, and tribological behaviour of jute/palmyra fiber-reinforced hybrid nanocomposites. J. Mech. Sci. Technol. 2024, 38, 6075–6084. [Google Scholar] [CrossRef]
- Ayyanar, C.B.; Marimuthu, K.; Sridhar, N.; Mugilan, T.; Alqarni, S.A.; Katowah, D.F.; Sanjay, M.R.; Siengchin, S. Mechanical and Materialistic Characterization of Poly Lactic Acid/Zeolite/Hydroxyapatite Composites. J. Inorg. Organomet. Polym. Mater. 2023, 33, 2743–2751. [Google Scholar] [CrossRef]
- Wang, Y.; Desroches, G.J.; Macfarlane, R.J. Ordered polymer composite materials: Challenges and opportunities. Nanoscale 2021, 13, 426–443. [Google Scholar] [CrossRef]
- Wu, C.; Xu, F.; Wang, H.; Liu, H.; Yan, F.; Ma, C. Manufacturing technologies of polymer composites—A review. Polymers 2023, 15, 712. [Google Scholar] [CrossRef]
- Alzahrani, M.M.; Alamry, K.A.; Hussein, M.A. Recent advances of Fiber-reinforced polymer composites for defense innovations. Results Chem. 2025, 15, 102199. [Google Scholar] [CrossRef]
- Meyer, R. Handbook of Pultrusion Technology; Springer Science & Business Media: Berlin/Heidelberg, Germany, 2012. [Google Scholar]
- Fairuz, A.M.; Sapuan, S.M.; Zainudin, E.S.; Jaafar, C.A.N. Effect of filler loading on mechanical properties of pultruded kenaf fibre reinforced vinyl ester composites. J. Eng. Sci. 2016, 10, 1931–1942. [Google Scholar] [CrossRef]
- Nosbi, N.; Akil, H.M.; Ishak, Z.A.M.; Bakar, A.A. Effect of water absorption on the mechanical properties of pultruded kenaf fibre reinforced polyester composites. Adv. Compos. Lett. 2011, 20, 096369351102000103. [Google Scholar] [CrossRef]
- Akil, H.M.; Santulli, C.; Sarasini, F.; Tirillo, J.; Valente, T. Environmental effects on the mechanical behaviour of pultruded jute/glass fibre-reinforced polyester hybrid composites. Compos. Sci. Technol. 2014, 94, 62–70. [Google Scholar] [CrossRef]
- Safiee, S.; Akil, H.M.; Mazuki, A.A.M.; Ishak, Z.A.M.; Bakar, A.A. Properties of pultruded jute fiber reinforced unsaturated polyester composites. Adv. Compos. Mater. 2011, 20, 231–244. [Google Scholar] [CrossRef]
- Zamri, M.H.; Akil, H.M.; Ishak, Z.A.M.; Abu, B.A. Effect of different fiber loadings and sizes on pultruded kenaf fiber reinforced unsaturated polyester composites. Polym. Compos. 2015, 36, 1224–1229. [Google Scholar] [CrossRef]
- Ashraf, M.A.; Peng, W.; Zare, Y.; Rhee, K.Y. Effects of Size and Aggregation/Agglomeration of Nanoparticles on the Interfacial/Interphase Properties and Tensile Strength of Polymer Nanocomposites. Nanoscale Res. Lett. 2018, 13, 214. [Google Scholar] [CrossRef]
- Hong, R.Y.; Chen, Q. Dispersion of inorganic nanoparticles in polymer matrices: Challenges and solutions. In Organic-Inorganic Hybrid Nanomaterials; Springer: Cham, Switzerland, 2014; pp. 1–38. [Google Scholar]
- Kim, T.; Kwon, S.-H.; Kim, H.J.; Lim, C.-S.; Chung, I.; Lee, W.-K.; Seo, B. Effect of the Surface Modification of Silica Nanoparticles on the Viscosity and Mechanical Properties of Silica/Epoxy Nanocomposites. Compos. Interfaces 2022, 29, 1573–1590. [Google Scholar] [CrossRef]
- Akhtar, K.; Pervez, C.; Zubair, N.; Khalid, H. Calcium hydroxyapatite nanoparticles as a reinforcement filler in dental resin nanocomposite. J. Mater. Sci. Mater. Med. 2021, 32, 129. [Google Scholar] [CrossRef]
- Suresha, B.; Saini, M.S. Fabrication and mechanical characterization of carbon fabric reinforced epoxy with alumina and molybdenum disulfide fillers. Int. J. Comput. Aided Eng. Technol. 2018, 10, 89. [Google Scholar] [CrossRef]
- Lee, D.W.; Yoo, B.R. Advanced silica/polymer composites: Materials and applications. J. Ind. Eng. Chem. 2016, 38, 1–12. [Google Scholar] [CrossRef]
- Suresha, B.; Divya, G.S.; Hemanth, G.; Somashekar, H.M. Physico-Mechanical Properties of Nano Silica-Filled Epoxy-Based Mono and Hybrid Composites for Structural Applications. Silicon 2020, 13, 2319–2335. [Google Scholar] [CrossRef]
- Aramendiz, J.; Imqam, A. Silica and graphene oxide nanoparticle formulation to improve thermal stability and inhibition capabilities of water-based drilling fluid applied to woodford shale. SPE Drill. Complet. 2020, 35, 164–179. [Google Scholar] [CrossRef]
- Sobczak-Kupiec, A.; Drabczyk, A.; Florkiewicz, W.; Głąb, M.; Kudłacik-Kramarczyk, S.; Słota, D.; Tomala, A.; Tyliszczak, B. Review of the applications of biomedical compositions containing hydroxyapatite and collagen modified by bioactive components. Materials 2021, 14, 2096. [Google Scholar] [CrossRef] [PubMed]
- ASTM D2240-15; Standard Test Method for Rubber Property—Durometer Hardness. ASTM International: West Conshohocken, PA, USA, 2021.
- ASTM D638-14; Standard Test Method for Tensile Properties of Plastics Trans. ASTM International: West Conshohocken, PA, USA, 2014.
- ASTM D2344/D2344M-22; Standard Test Method for Short-Beam Strength of Polymer Matrix Composite Materials and Their Laminates. ASTM International: West Conshohocken, PA, USA, 2022.
- ASTM D790-17; Standard Test Methods for Flexural Properties of Unreinforced and Reinforced Plastics and Electrical Insulating Materials. ASTM International: West Conshohocken, PA, USA, 2017.
- ASTM D256-23; Standard Test Methods for Determining the Izod Pendulum Impact Resistance of Plastics. ASTM International: West Conshohocken, PA, USA, 2023.
- Zhang, W.; Dehghani-Sanij, A.A.; Blackburn, R.S. IR study on hydrogen bonding in epoxy resin–silica nanocomposites. Progress Nat. Sci. 2008, 18, 801–805. [Google Scholar] [CrossRef]
- Jung, U.; Kim, Y.S.; Suhr, J.; Lee, H.S.; Kim, J. Enhancing adhesion strength via synergic effect of atmospheric pressure plasma and silane coupling agent. Appl. Surf. Sci. 2023, 40, 158227. [Google Scholar] [CrossRef]
- Darshan, S.M.; Suresha, B.; Harshavardhan, B.; Vanarotti, M.B.; Waddar, S.; Thomas, S.; Xavier, L.F. Mechanical and Wear Behavior of Halloysite Nanotubes Filled Silk/Basalt Hybrid Composites Using Response Surface Methodology. In Proceedings of the International Symposium on Lightweight and Sustainable Polymeric Materials, Bangkok, Thailand, 17 February 2023; Springer Proceedings in Materials; Springer: Singapore, 2023; pp. 387–402. [Google Scholar]
- Shahabaz, S.M.; Mehrotra, P.; Kalita, H.; Sharma, S.; Naik, N.; Noronha, D.J.; Shetty, N. Effect of Al2O3 and SiC Nano-Fillers on the Mechanical Properties of Carbon Fiber-Reinforced Epoxy Hybrid Composites. J. Compos. Sci. 2023, 7, 133. [Google Scholar] [CrossRef]
- Shahrajabian, H.; Hatami, H.; Rafiei, M. Improvement of mechanical and wear properties of epoxy/glass fiber/Titanium Carbide+Titaniumdiborides hybrid composites by adding clay nanoparticles. J. Reinf. Plast. Compos. 2023, 44, 73–84. [Google Scholar] [CrossRef]
- Rathod, V.T.; Kumar, J.S.; Jain, A. Polymer and ceramic nanocomposites for aerospace applications. Appl. Nanosci. 2017, 7, 519–548. [Google Scholar] [CrossRef]
- Cui, X.; Liu, J.; Liu, H.; Wu, G. Enhanced interfacial strength and mechanical properties of carbon fiber composites by introducing functionalized silica nanoparticles into the interface. J. Adhes. Sci. Technol. 2018, 33, 479–492. [Google Scholar] [CrossRef]
- Li, H.; Liu, F.; Tian, H.; Wang, C.; Guo, Z.; Liu, P.; Peng, Z.; Wang, Q. Synergetic enhancement of mechanical and electrical strength in epoxy/silica nanocomposites via chemically-bonded interface. Compos. Sci. Technol. 2018, 167, 539–546. [Google Scholar] [CrossRef]
- Bantz, C.; Koshkina, O.; Lang, T.; Galla, H.-J.; Kirkpatrick, C.J.; Stauber, R.H.; Maskos, M. The surface properties of nanoparticles determine the agglomeration state and the size of the particles under physiological conditions. Beilstein J. Nanotechnol. 2014, 5, 1774–1786. [Google Scholar] [CrossRef]
- Conradi, M.; Zorko, M.; Kocijan, A.; Verpoest, I. Mechanical properties of epoxy composites reinforced with a low volume fraction of nanosilica fillers. Mater. Chem. Phys. 2013, 137, 910–915. [Google Scholar] [CrossRef]
- Sadasivuni, K.K.; Saha, P.; Adhikari, J.; Deshmukh, K.; Ahamed, M.B.; Cabibihan, J. Recent advances in mechanical properties of biopolymer composites: A review. Polym. Compos. 2019, 41, 32–59. [Google Scholar] [CrossRef]
- Verma, S.; Sharma, N. Evaluating the mechanical properties of novel HAp reinforced polyaryletherketonebiocomposites via molecular dynamics simulation. Mater. Chem. Phys. 2023, 307, 128106. [Google Scholar] [CrossRef]
- Jose, S.; George, J.S.; Jacob, T.A.; Vijayan, P.P.; Bhanu, A.V.A.; Nedumpillil, N.N.; Thomas, S. Nanosilica incorporated coarse wool-epoxy hybrid biocomposites with improved physico-mechanical properties. Front. Mater. 2023, 10, 1140602. [Google Scholar] [CrossRef]
- Uniyal, P.; Gaur, P.; Yadav, J.; Bhalla, N.A.; Khan, T.; Junaedi, H.; Sebaey, T.A. A Comprehensive Review on the Role of Nanosilica as a Toughening Agent for Enhanced Epoxy Composites for Aerospace Applications. ACS Omega 2025, 10, 15810–15839. [Google Scholar] [CrossRef]
- Afolabi, O.A.; Ndou, N. Synergy of hybrid fillers for emerging composite and nanocomposite materials—A review. Polymers 2023, 16, 1907. [Google Scholar] [CrossRef]
- Klimek, L.; Kopacz, K.; Śmielak, B.; Kula, Z. An evaluation of the mechanical properties of a hybrid composite containing hydroxyapatite. Materials 2023, 16, 4548. [Google Scholar] [CrossRef]
- Muzammil, S.B.; Kumar, P.V.; Shivanand, H.K. Studies on mechanical behaviour of E-Glass- Kevlar fiber reinforced epoxy hybrid composites with nano integration of functionalized MWCNTs. J. Eng. Res. Appl. 2019, 9, 80–87. [Google Scholar]
- Cheon, J.; Kim, M. Impact resistance and interlaminar shear strength enhancement of carbon fiber reinforced thermoplastic composites by introducing MWCNT-anchored carbon fiber. Compos. Part. B Eng. 2021, 217, 108872. [Google Scholar] [CrossRef]
- Zhang, Q.; Wu, G.; Xie, F.; Li, N.; Huang, Y.; Liu, L. Mechanical properties of carbon fiber composites modified with nano-SiO2in the interphase. J. Adhes. Sci. Technol. 2014, 28, 2154–2166. [Google Scholar] [CrossRef]
- Li, Y.; Swartz, M.L.; Phillips, R.W.; Moore, B.K.; Roberts, T.A. Materials Science Effect of Filler Content and Size on Properties of Composites. J. Dent. Res. 1985, 64, 1396–1403. [Google Scholar] [CrossRef]
- Montes, M.A.J.R.; De Goes, M.F.; Da Cunha, M.R.B.; Soares, A.B. A morphological and tensile bond strength evaluation of an unfilled adhesive with low-viscosity composites and a filled adhesive in one and two coats. J. Dent. 2001, 29, 435–441. [Google Scholar] [CrossRef] [PubMed]
- Ikejima, I.; Nomoto, R.; McCabe, J.F. Shear punch strength and flexural strength of model composites with varying filler volume fraction, particle size and silanation. Dent. Mater. 2003, 19, 206–211. [Google Scholar] [CrossRef] [PubMed]
- Nunes, M.; Swift, E.; Perdigão, J. Effects of adhesive composition on microtensile bond strength to human dentin. Am. J. Dent. 2001, 14, 340–343. [Google Scholar] [PubMed]
- Chen, J.; Zhao, D.; Jin, X.; Wang, C.; Wang, D.; Ge, H. Modifying glass fibers with graphene oxide: Towards high-performance polymer composites. Compos. Sci. Technol. 2014, 97, 41–45. [Google Scholar] [CrossRef]
- Sarr, M.M.; Inoue, H.; Kosaka, T. Study on the improvement of interfacial strength between glass fiber and matrix resin by grafting cellulose nanofibers. Compos. Sci. Technol. 2021, 211, 108853. [Google Scholar] [CrossRef]
- Siddiqui, U.; Khalid, H.; Ghafoor, S.; Javaid, A.; Asif, A.; Khan, A.S. Analyses on mechanical and physical performances of nano-apatite grafted glass fibers based dental composites. Mater. Chem. Phys. 2020, 263, 124188. [Google Scholar] [CrossRef]
- Rajak, D.; Pagar, D.; Menezes, P.; Linul, E. Fiber-Reinforced Polymer Composites: Manufacturing, Properties, and Applications. Polymers 2019, 11, 1667. [Google Scholar] [CrossRef]
- Raju, B.; Suresha, B.; Swamy, R.P.; Bharath, K.N. The effect of silicon dioxide filler on the wear resistance of glass fabric reinforced epoxy composites. Adv. Polym. Sci. Technol. Int. J. 2012, 2, 51–57. [Google Scholar]
- Anjum, N.; Prasad, S.L.A.; Suresha, B. Role of Silicon Dioxide Filler on Mechanical and Dry Sliding Wear Behaviour of Glass-Epoxy Composites. Adv. Tribol. 2013, 2013, 324952. [Google Scholar] [CrossRef]


Disclaimer/Publisher’s Note: The statements, opinions and data contained in all publications are solely those of the individual author(s) and contributor(s) and not of MDPI and/or the editor(s). MDPI and/or the editor(s) disclaim responsibility for any injury to people or property resulting from any ideas, methods, instructions or products referred to in the content. |
© 2025 by the authors. Licensee MDPI, Basel, Switzerland. This article is an open access article distributed under the terms and conditions of the Creative Commons Attribution (CC BY) license (https://creativecommons.org/licenses/by/4.0/).