Article

Design and Analysis of Natural Fiber-Reinforced Jute Woven Composite RVEs Using Numerical and Statistical Methods

Faculty of Mechanical Engineering and Informatics, University of Miskolc, H-3515 Miskolc, Hungary
*
Author to whom correspondence should be addressed.
J. Compos. Sci. 2025, 9(6), 283; https://doi.org/10.3390/jcs9060283
Submission received: 8 May 2025 / Revised: 29 May 2025 / Accepted: 30 May 2025 / Published: 31 May 2025

Abstract

:
Woven composites and natural fiber-reinforced composites both have widespread applications in various industries due to their appealing load-carrying capacity and performance compared to conventionally manufactured composites, such as polymeric composites. Representative volume element (RVE) generation is one of the most effective and widely adopted methods for estimating mechanical performance in current research. This study aims to explore the effects of three significant factors in woven composite RVEs: yarn spacing (from 0.5 mm to 1.5 mm), fabric thickness (from 0.2 to 0.5 mm), and shear angle (from 3.5 to 15 degrees) through finite element methods and statistical analysis to understand their effectiveness in the elastic moduli’s. The validation of this research has been conducted using available literature. The generation of representative volume elements (RVEs) and the calculation of elastic moduli were performed using ANSYS-19, including the material designer feature. The experimental design was carried out using Design-Expert software version 13, which used response surface methodology. The materials selected for this study were jute fiber and epoxy. After obtaining the elastic moduli from the ANSYS material designer, three responses were considered: longitudinal Young’s modulus (E11), in-plane shear modulus (G12), and major Poisson’s ratio (V12). ANOVA (Analysis of Variance) and 3D contour graphs were generated to further analyze and correlate the effects of the selected materials on these responses. These investigations revealed that in comparison to twill structure, plain structure in natural fiber-reinforced woven composites could be a good alternative. Additionally, the findings highlighted that yarn spacing and fabric thickness significantly influence the considered moduli in plain-weave NFRC material RVEs. However, in twill-woven composite RVEs, the effects of yarn spacing, fabric thickness, and shear angle were found to be considerable. Moreover, statistical analysis has found the best combinations for both plain and twill structures, while the yarn spacing was 1 mm, the shear angle was 9.25 degrees, and the fabric thickness was 0.35 mm.

1. Introduction

Natural fiber-reinforced composites (NFRCs) have gained significant attention in various industries, such as automotive, building and construction, and biomedical, due to their advantageous mechanical properties, including availability, high strength-to-weight ratio, sustainability, and recyclability [1]. NFRC materials reduce carbon emissions, support a circular economy, and provide sustainable solutions for a better environment for future generations. Since the beginning of the Industrial Revolution, numerous conventional and advanced manufacturing techniques have been developed. Among these, three-dimensional printing (3DP), also known as additive manufacturing (AM), has gained significant attention in modern manufacturing industries [2]. However, when it comes to mechanical properties, traditionally fabricated composites or parts typically demonstrate better performance, especially in terms of mechanical strength, than those produced using 3DP [3]. Based on the type of reinforcement material, composite materials are classified as natural fiber-reinforced composites, polymeric composites, and so on. However, based on the fabrication process, composite materials are categorized into various types, including unidirectional composites, particulate composites, woven composites, bidirectional composites, and hybrid composites [4,5]. In woven composites, the structures can be complex in terms of dimensions and weaving patterns. They are typically classified as plain or twill weaves. Plain weaves are structured with a 1 × 1 thread ratio, while twill weaves follow a 2 × 2 pattern in both the warp and weft directions [6].
To calculate the mechanical properties of woven composite RVEs without conducting solid experiments, several methods have been developed, including theoretical approaches and finite element methods (FEMs). Compared to solid experiments, finite element methods and theoretical approaches are sufficient to predict the mechanical properties of composite materials [5]. Using the finite element method, the generation of a representative volume element (RVE) is one of the most straightforward techniques for estimating mechanical properties, particularly the elastic moduli, including Young’s modulus (longitudinal and transverse), shear modulus (in-plane and out-of-plane), and Poisson’s ratio (major and minor) [7]. In both recent and earlier studies, significant research has been conducted on the RVE of woven composites. For example, earlier investigations employed the finite element method (FEM) to generate woven composite RVEs, considering the RVE size and its effects on local and global strain. These studies highlighted the significant role of RVE size in influencing the response of both local and global strains [8]. Apart from RVE size, several factors can significantly influence the elastic moduli of woven composites, including fiber volume fraction, yarn fiber volume fraction, fabric thickness, yarn spacing, and shear angle [6]. Fiber volume fraction refers to the proportion of fibers used to reinforce composite materials. It plays a crucial role in determining the mechanical behavior of these composites, affecting characteristics such as ductility and brittleness after fabrication. A recent study examined the effects of fiber volume fraction on the ballistic performance of woven composite representative volume elements (RVEs). The findings indicated that higher fiber volume fractions generally resulted in better energy absorption and performance outcomes [9]. However, this trend does not apply in all situations. For instance, the present study revealed that excessively high fiber volume fractions can make composites too stiff, leading to premature failure. This suggests that lower fiber volume fractions, ranging from 0.1 to 0.5, may be more favorable for achieving optimal performance [10]. Similarly to fiber volume fraction, yarn fiber volume fraction can significantly affect the elastic moduli of materials. The key distinction between the two is that the yarn fiber volume fraction refers specifically to the proportion of fiber contained within the yarn, whereas the fiber volume fraction encompasses the total fiber amount throughout the entire woven composite [11]. Although the yarn fiber volume fraction typically ranges from 0.45 to 0.65, optimal outcomes are generally achieved at higher fractions [12]. Yarn spacing is also a crucial factor to consider in woven composites, as it can significantly impact the elastic moduli. Yarn spacing refers to the distance between two yarns in the representative volume element (RVE) of woven composites. A recent study comparing different yarn spacings in woven composite RVEs found that the elastic moduli decreased as yarn spacing increased from 1 mm to 3 mm. However, this trend does not hold for every increment. Specifically, while the elastic moduli decreased when yarn spacing increased from 1 mm to 2.5 mm, there was a noticeable increase in elastic moduli at a spacing of 3 mm [13]. In woven composites, whether they are plain or have more complex structures, the shear angle plays a crucial role in influencing the elastic moduli. The shear angle reflects the angle formed between the two yarns—warp and weft—during the manufacturing process of the woven composites [13,14]. This angle can range from −45 degrees to 45 degrees. However, optimal elastic moduli in woven composites RVE are typically achieved within the lower angle range [11,13,14]. The fabric thickness in the RVE refers to the thickness of the woven composites, which can also have a significant influence on their properties [6]. However, this parameter has not been extensively discussed in recent studies.
Apart from the aforementioned numerical analyses, several recent and earlier studies have developed theoretical methods, which were later compared with numerical and experimental results to predict the elastic properties [15,16,17,18,19]. This earlier study most likely first predicted the elastic modulus of E-glass woven composites by designing a new analytical model, which was later compared with Hashin’s concentric cylinder and Halpin–Tsai models. Both models accurately predicted all outcomes without any significant discrepancies [15]. Later, the Mori–Tanaka model and the finite element method were employed, and experimental outcomes were compared in this research. This investigation also revealed that the finite element method, the theoretical method, and experiments can be rigorous tools to predict the outcomes in the RVEs of woven composites [16]. Similarly to the aforementioned studies, some newly developed theoretical models, namely the stochastic fracture model [17], data-driven reduced-order models [18], and the continuum model [19], have been developed in recent years, which have also been validated against the numerical and experimental outcomes in woven composites RVE.
Numerous recent studies have employed various statistical methods to optimize material properties or identify the best combinations of influencing factors. These methods are beneficial because they allow for the design of experiments based on input parameters while simultaneously considering multiple variables and outcomes within a unified framework. Furthermore, they enable the prediction of optimal results by comparing the effects of the selected parameters [5,20,21,22]. To enhance the outcomes of RVE simulations, a recent study incorporated artificial intelligence-based statistical analysis on random RVEs by employing geometric descriptors and statistical functions [23]. Similarly, an earlier study adopted a statistical approach by considering the density of the RVE as a key variable to improve prediction efficiency [24]. One of the main advantages of using statistical analysis to predict the elastic moduli of an RVE is its ability to generate multiple variables, which can be optimized to enhance predictive accuracy. For instance, previous research explored different RVE sizes and achieved precise estimations of thermal and mechanical properties by applying the integral range approach [25]. However, a key limitation remains in establishing robust correlations among RVE variables, and accurately estimating optimal parameters in the optimization process continues to pose challenges, particularly in the context of woven composites.
It is undoubtedly true that, in recent years, significant research has focused on the development of woven composites by investigating their elastic moduli through numerical and theoretical methods, particularly finite element analysis, often using various types of polymer fibers. Although these studies have provided valuable insights, they have primarily focused on parametric analyses without incorporating a comprehensive statistical approach. This represents a notable gap in the existing body of research. To address this limitation, the present study examines the effects of three key parameters—yarn spacing, shear angle, and fabric thickness—on the mechanical behavior of woven composites. These parameters are analyzed while maintaining other influential factors, such as fiber volume fraction and yarn fiber volume fraction, at constant levels. By employing a statistical framework, this study aims to offer a more holistic understanding of how these parameters interact and contribute to the overall performance of woven composites (plain and twill structures), which are numerically embedded by jute fiber and epoxy matrix.

2. Finite Element Modeling Setup, Material Properties, and Design of Experiment

All numerical investigations were conducted using ANSYS version 19 FEM software, specifically within the Material Designer tool. First, the material properties of both the fiber and the matrix were defined and added to the material library. These properties were then assigned to the Material Designer to initiate the simulation setup. The fiber volume fraction and yarn fiber volume fraction were kept constant at 0.325 and 0.65, respectively, based on values reported in the literature. Other parameters—yarn spacing, shear angle, and fabric thickness—were varied and defined within the Material Designer interface. The weave structure was also specified at this stage. Following the geometry definition, the repeat count and algorithm were selected. The lenticular algorithm was chosen for this investigation as it produces more accurate and reliable results for woven composite modeling.
Mesh generation in finite element method (FEM) analysis, particularly for representative volume elements (RVEs), is a complex and critical task. Different FEM approaches employ various mesh generation techniques. For instance, in one study, a high-resolution mesh was generated in ABAQUS to achieve more accurate results for the RVE [26]. Considering this complexity, the present research utilized conformal and periodic meshing for all RVEs using the Material Designer tool. Although Material Designer also provides a block meshing option, periodic meshing offers a more refined structure and facilitates property estimation with fewer complications. Moreover, a significant limitation of block meshing is that the Material Designer is unable to properly mesh all the edges of the RVE using this technique. For these reasons, periodic and conformal meshing techniques were adopted in all RVE simulations. The mesh size is set to 0.2 mm, and it was observed that varying the mesh size does not significantly impact the outcomes, especially in the microscale virtual domain. In addition, the cell type is triangular by default. Subsequently, boundary conditions, which are provided by default in Material Designer, were applied. Finally, simulations were run with the constant material output option selected to compute the effective material properties.
Figure 1a illustrates the shear angle to provide insights into the deformation characteristics of woven jute composite RVEs. Figure 1b presents the multiscale approach of the composites, describing the transition from the microscale to the actual plain weave structure. In Figure 1c, yarn spacing is shown in a plain-weave-structure RVE with a spacing of 1.5 mm; here, the repeat count is set to 2 for improved visualization. Figure 1d displays the woven jute composites’ twill-weave RVE structure. Figure 1e,f provide a microscale representation of the twill composite captured through scanning electron microscopy. Following this, the difference in fabric thickness in NFRC-woven composites is depicted in Figure 1g,h, showing real structural variations. However, in Figure 1i, a meshed twill RVE was presented, subjected to both conformal and block meshing. Finally, the material properties of the jute fiber and epoxy matrix are listed in Table 1. The material properties are taken as isotropic from the literature [5].
The design of the experiments (DOEs) is conducted using Design Expert software version 13. After defining the input variables in the software, the response surface methodology has been selected. Later, the chosen design type was a central composite with a quadratic model. The runs mean the number of experiments is determined as 30 by selecting no blocks. The design of the experiment is given in Table 2.
Although periodic boundary conditions are a default feature in ANSYS Material Designer, they are explicitly presented and discussed in this research [13]. These boundary conditions are primarily applied along the three principal directions or planes of the woven composites: a, b, and c, and discussed in Equations (1)–(7).
The boundary conditions used to predict the longitudinal elastic moduli of woven composites are as follows:
u11(a,b,0) = u22(a,b,0) = u33(a,b,0), u11(a,b,x) = ∂aa
u11(0,b,c) = u22(a,0,c) = u33(a,b,0), u22(a,x,c) = ∂bb
Similarly, in the c plane, the boundary conditions are as follows:
u11(0,b,c) = u22(a,0,c) = u33(a,b,0), u33(a,b,x) = ∂cc
For the in-plane and out-of-plane shear moduli (G12, G23, and G13), the periodic boundary conditions are provided below.
u11(a,0,c) = u22(a,0,c) = u33(a,0,c) = 0, u11(a,x,c) = ∂l
u11(a,b,0) = u22(a,b,0) = u33(a,b,0) = 0, u22(a,b,x) = ∂t
u11(a,0,c) = u22(a,0,c) = u33(a,b,0) = 0, u22(x,b,c) = ∂l
However, for both major and minor Poisson’s ratios, the following equations are used:
υ = −∂εtrans/∂εaxial

3. Model Validations

The numerical validation in this study was performed by comparing the results obtained from ANSYS Material Designer with those from widely used theoretical models—namely the Mori–Tanaka model and the self-consistent model—as well as available experimental data. Due to the limited number of studies specifically focused on woven composites RVE, the validation was carried out using unidirectional composite material RVE as a reference. This comparison incorporated both numerical and experimental results, with simulations conducted using ANSYS Material Designer [28]. The primary objective of this validation was to demonstrate the capability of ANSYS Material Designer to accurately predict the representative volume element (RVE) behavior of composite materials. To ensure scientific rigor, fiber volume fractions of 0.3, 0.4, 0.5, 0.6, and 0.7 were considered for a carbon–epoxy-based unidirectional composite, and the corresponding elastic properties—E11, G12, and ν12—were evaluated. It is also noteworthy that the entire validation process followed the finite element setup previously described in the Finite Element Setup section.
The resulting elastic moduli were plotted as bar graphs in Figure 2a–c and compared with both theoretical predictions and experimental values. The results revealed a maximum deviation of only 0–5%, which falls well within the acceptable range for numerical simulations [29]. These minimal discrepancies confirm that ANSYS Material Designer is a reliable and efficient tool for predicting the mechanical properties of composite materials RVE. It provides a practical alternative to experimental testing, reducing both complexity and computation time while maintaining high accuracy.

4. Results and Discussions

4.1. Overall Outcomes for Plain and Twill Jute Composite RVEs

After performing simulations based on the design of experiments (DOEs), the results are presented in Table 3. It can be observed that, for all the considered elastic moduli, both the highest and lowest values are obtained from the same DOE configurations for both plain and twill jute composites. This indicates a strong correlation between the selected input variables and the resulting mechanical properties. In Table 3, the highest modulus values are achieved in DOE-1, where the input variables are a shear angle of 9.25 degrees, yarn spacing of 1 mm, and fabric thickness of 0.1 mm. In contrast, the lowest values for both types of woven composites are found in the DOE-10 with a shear angle of 15 degrees, yarn spacing of 0.5 mm, and fabric thickness of 0.5 mm. From these two DOE cases, it can be postulated that a lower shear angle leads to improved mechanical performance. This is likely because a higher shear angle alters the fiber orientation relative to the loading direction, thereby reducing the composite’s stiffness [13]. In contrast, at lower shear angles, the fibers remain more aligned with the direction of the applied load, enhancing their load-bearing efficiency. Regarding yarn spacing, moderate values appear to be more effective. For instance, a comparison between DOE-1 and DOE-10 shows that better modulus values are obtained at a yarn spacing of 1 mm rather than 0.5 mm. This is likely due to improved matrix distribution at larger yarn spacing, which helps reduce voids and enhances the composite’s stiffness. In terms of fabric thickness, the lowest value considered—0.1 mm—results in the best modulus values. This can be attributed to a more uniform compaction of the composite, which enables better stress distribution across the material and improves overall stiffness. Further explanations and detailed reasoning are provided below.

4.2. Analysis of Variance (ANOVA) Investigation for Plain Jute Composite

After obtaining the results, this research employed a widely used statistical method, namely Analysis of Variance (ANOVA), for all the considered outcomes, following the methodology outlined in the literature [10]. The aim of this analysis is to determine the significance of the variables for each response. A confidence level of 95% was adopted, meaning that if the p-value is less than 0.05, the corresponding variable is considered statistically significant for that particular response. The longitudinal Young’s modulus (E11) of the plain-woven jute composite is presented in the table. As shown in Table 4, the p-values for the variables yarn spacing and fabric thickness in relation to E11 are both less than 0.05. This indicates that yarn spacing and fabric thickness are significant factors influencing the E11 of the plain-woven jute composite. However, the shear angle is insignificant for E11. This is possibly because, in this composite, the interlacing of yarns at the selected shear angle results in tight crimping and constraint, which inherently minimizes shear deformation. As a result, the shear angle yields an insignificant p-value. Furthermore, the percentage contribution (PC%) of each variable was calculated. For E11, the PC% values are 0.85% for shear angle, 15.67% for yarn spacing, and 12.83% for fabric thickness, respectively. From Table 4, Table 5, Table 6, Table 7, Table 8 and Table 9, SS represents the Sum of Squares, df is the Degrees of Freedom, MS is the Mean Square, while the F-value and p-value represent Fisher’s test statistic and the probability value, respectively.
Table 5 presents the ANOVA analysis and percentage contribution (PC%) for the in-plane shear modulus (G12) of the plain-woven jute composite. The table shows that, similar to the results for E11, yarn spacing and fabric thickness are also significant parameters for G12. However, the shear angle does not significantly influence either response. The PC% values for this response are as follows: shear angle—23%, yarn spacing—18.46%, and fabric thickness—15.33%.
In Table 6, a similar trend is observed for the major Poisson’s ratio (V12), consistent with the results for E11 and G12. This indicates that yarn spacing and fabric thickness are also crucial parameters for V12. Additionally, the shear angle again shows no significant influence on the response. The PC% values for V12 in the plain-woven jute composites are shear angle—0.13%, yarn spacing—24.59%, and fabric thickness—21.31%. From Table 4, Table 5 and Table 6, it can be concluded that all responses exhibit a similar trend in terms of variable influence.

4.3. Analysis of Variance (ANOVA) Investigation for Twill Jute Composite

Similarly to the plain-woven jute composite, ANOVA was also conducted on the elastic moduli of the twill-woven jute composite, using a 95% confidence level. The results for the longitudinal Young’s modulus (E11) are presented in Table 7. As shown in Table 7, the p-values for all considered variables—shear angle, yarn spacing, and fabric thickness—are less than 0.05, indicating that each variable significantly affects E11. In terms of percentage contributions, yarn spacing shows the highest influence at 48.05%, followed by fabric thickness at 34.29% and shear angle at 6.31%. A possible explanation for these results is that the twill weave has a more complex structure compared to the plain weave, which may significantly influence the mechanical properties of the composite.
In Table 8, the ANOVA analysis is presented for the in-plane shear modulus (G12) of the twill-woven jute composite. Similarly to the findings for E11, the p-values for all considered variables—shear angle, yarn spacing, and fabric thickness—are less than 0.05, indicating that each has a statistically significant effect on G12. Furthermore, the percentage contributions (PC%) for G12 demonstrate a consistent trend like E11, shear angle contributes 0.59%, yarn spacing contributes 49.95%, and fabric thickness contributes 42.44%. This highlights that yarn spacing and fabric thickness are the dominant factors influencing the in-plane shear modulus in the twill-woven jute composite.
In Table 9, the ANOVA analysis for the major Poisson’s ratio (V12) of the twill-woven jute composite is presented. From the table, it can be observed that the p-values for all variables—shear angle, yarn spacing, and fabric thickness—are less than 0.05, indicating that each variable has a statistically significant effect on V12, like E11 and G12. However, in terms of percentage contribution (PC%), the shear angle shows no measurable influence, while yarn spacing provides the highest contribution at 52.63%, followed by fabric thickness at 42.11%.

4.4. Three-Dimensional Contour Graph Analysis for Plain Jute Composite

To further correlate the ANOVA analysis with the considered parameters and responses, the 3D contour graph analysis has been conducted. Figure 3 illustrates the contour graph for E11, considering all the variables. As shown in Figure 3a, yarn spacing exhibits an inclined surface, indicating that an increase in yarn spacing significantly enhances Young’s modulus. However, an increase in fabric thickness may lead to an increase in response as shown in Figure 3b. Aside from these two variables, the shear angle does not show any notable interaction point. Overall, the observed outcomes and the percentage of contribution (PC%) follow a similar pattern, further supporting the correlation between the variables and responses in this analysis.
In Figure 4, the 3D contour graph analysis is presented. A similar pattern to that of E11 has been observed for G12. For instance, the graph shows an inclined surface with respect to yarn spacing, indicating that an increase in yarn spacing can lead to an increase in the shear modulus. Fabric thickness also exhibits an inclined surface toward the shear modulus, reflecting its correlation with this response. However, the shear angle has a negligible effect. Overall, the ANOVA results and the 3D contour analysis reveal consistent observations.
In Figure 5, the 3D contour plot for Poisson’s ratio (V12) is presented. The graph appears mostly flat; however, a slight gradient can be observed along the yarn spacing and fabric thickness axes. In contrast, the shear angle does not show any significant effect. Overall, similar to the trends observed in E11 and G12, V12 also demonstrates a consistent and satisfactory correlation with the input variables.

4.5. Three-Dimensional Contour Graph Analysis for Twill Jute Composite

Similarly to the plain jute composite, a 3D contour graph analysis has been conducted for the twill jute composite, as presented in Figure 6. In Figure 6a,b, it can be observed that the highest value of E11 is obtained when both the shear angle and yarn spacing are low.
This can be attributed to the fact that as the shear angle increases, the yarns become more misaligned, resulting in a reduction in the effective elastic modulus. Similarly, greater yarn spacing reduces the number of fibers per unit area, which significantly decreases E11. The graph clearly demonstrates that lower yarn spacing leads to an increase in E11. Furthermore, with respect to fabric thickness, an increase in thickness results in a significant rise in E11. Thicker fabrics contain more fibers, which contributes to the improved or increased value of E11.
In Figure 7a,b, 3D contour graph analyses are presented to illustrate the correlations among all variables. In Figure 7a, it can be observed that the shear modulus (G12) increases as both the shear angle and yarn spacing decrease. However, in Figure 7b, an increase in fabric thickness significantly enhances the shear modulus in the twill-woven jute composite.
In Figure 8a, the shear angle and yarn spacing exhibit a linear trend with Poisson’s ratio (V12) for the twill woven composite. It is evident from the figure that V12 increases with increasing shear angle and yarn spacing. However, in Figure 8b, fabric thickness shows only a minor influence, although a slight upward trend in V12 is still observed with increasing fabric thickness.

5. Numerical Predictions and Optimizations

After comparing all outcomes using statistical methods such as ANOVA and 3D contour graph analysis, numerical predictions and simulations were conducted to validate the predicted variable responses and compare them with actual simulation results. Table 10 presents the optimized variables and their corresponding responses for the plain-woven jute composite, along with their difference. The differences between predicted and confirmed values range from 0% to 3%, which is within an acceptable margin of error. For this composite, the optimal combination of parameters is achieved at a shear angle of 9.25 degrees, yarn spacing of 1.0 mm, and fabric thickness of 0.35 mm.
Similarly, a prediction analysis was also conducted for the twill-woven jute composites. The optimized variables were found to be a shear angle of 9.25 degrees, yarn spacing of 1.0 mm, and fabric thickness of 0.35 mm—identical to those of the plain-woven jute composite. Table 11 presents the optimized parameters, corresponding outcomes, and their differences. For the twill-woven composite, the differences between predicted and confirmed values were negligible, all falling below 1%.

6. Future Research Scope

This study aims to investigate the elastic moduli of natural fiber-reinforced jute composites using statistical and numerical methods, considering key manufacturing parameters such as shear angle, fabric thickness, and yarn spacing. The authors also recognize several promising directions for future research, particularly relevant to microscale investigations. The potential areas for future research are outlined below:
This research only investigated the plain- and twill-type-woven composite RVE using the ANSYS-19 material designer. Future research could involve solid experimentations and compare them with numerical and theoretical approaches to improve the elastic properties of woven or braided composites embedded in natural fibers.
This investigation analyzed only the interactions between the considered variables and responses. However, the interfacial bonding between fibers and the matrix could be further explored by examining different volume fractions through solid experimentations.
Environmental factors, such as humidity, temperature, and moisture, can significantly affect the mechanical performance of jute composites. Although this study focused on the mechanical properties of jute-woven composites, future research could explore the impact of these environmental factors through real experiments.
The study only considered two regular types of woven composite, namely plain and twill. However, a future comparative analysis can be generated numerically and experimentally with other types of woven structures, namely satin, multiaxial, hybrid, and so on, which would be embedded with natural fibers.

7. Conclusions

Natural fiber-reinforced composite materials have attracted significant attention in both the contemporary composite industry and academic research due to their potential to promote sustainability, renewability, and a reduced carbon footprint, along with offering low fabrication costs. Accordingly, plain- and twill-woven jute composites represent promising alternatives to conventional synthetic or polymeric composites, particularly for real-life applications where environmental sustainability is a primary concern. In this study, a series of numerical simulations were conducted to optimize key processing parameters and achieve the most favorable performance outcomes. These optimized parameters provide valuable insights for future researchers and manufacturers, helping to elucidate the significance and effects of the variables considered and guiding their application during the fabrication process. The main findings of the study are summarized below:
ANSYS Material Designer effectively predicted the elastic moduli of both plain- and twill-woven jute composites RVEs without complications and with minimal computational time. Therefore, this robust tool can be reliably used to determine key parameters for jute woven composites RVEs prior to the manufacturing process.
The plain-woven jute composite yielded superior outcomes across all DOE cases compared to the twill-woven composite. Interestingly, the highest and lowest outcomes for both composites were observed within the same DOE cases, indicating strong correlations among the considered responses. Despite their structural differences, both composites exhibited their maximum and minimum values in DOE-1 and DOE-10, respectively.
ANOVA for the plain-woven composite, yarn spacing, and fabric thickness was found to significantly influence the elastic moduli, while the shear angle showed minimal impact. Conversely, in the twill-woven composite, all three parameters—shear angle, yarn spacing, and fabric thickness—played critical roles in affecting the elastic properties.
Based on the percentage contribution (PC%) analysis of the variables to the responses, it was observed that, in the plain-woven jute composite, the considered variables contributed approximately 0–24% to the overall responses. In contrast, the twill-woven jute composite exhibited significantly higher contributions, ranging from 0 to 53%.
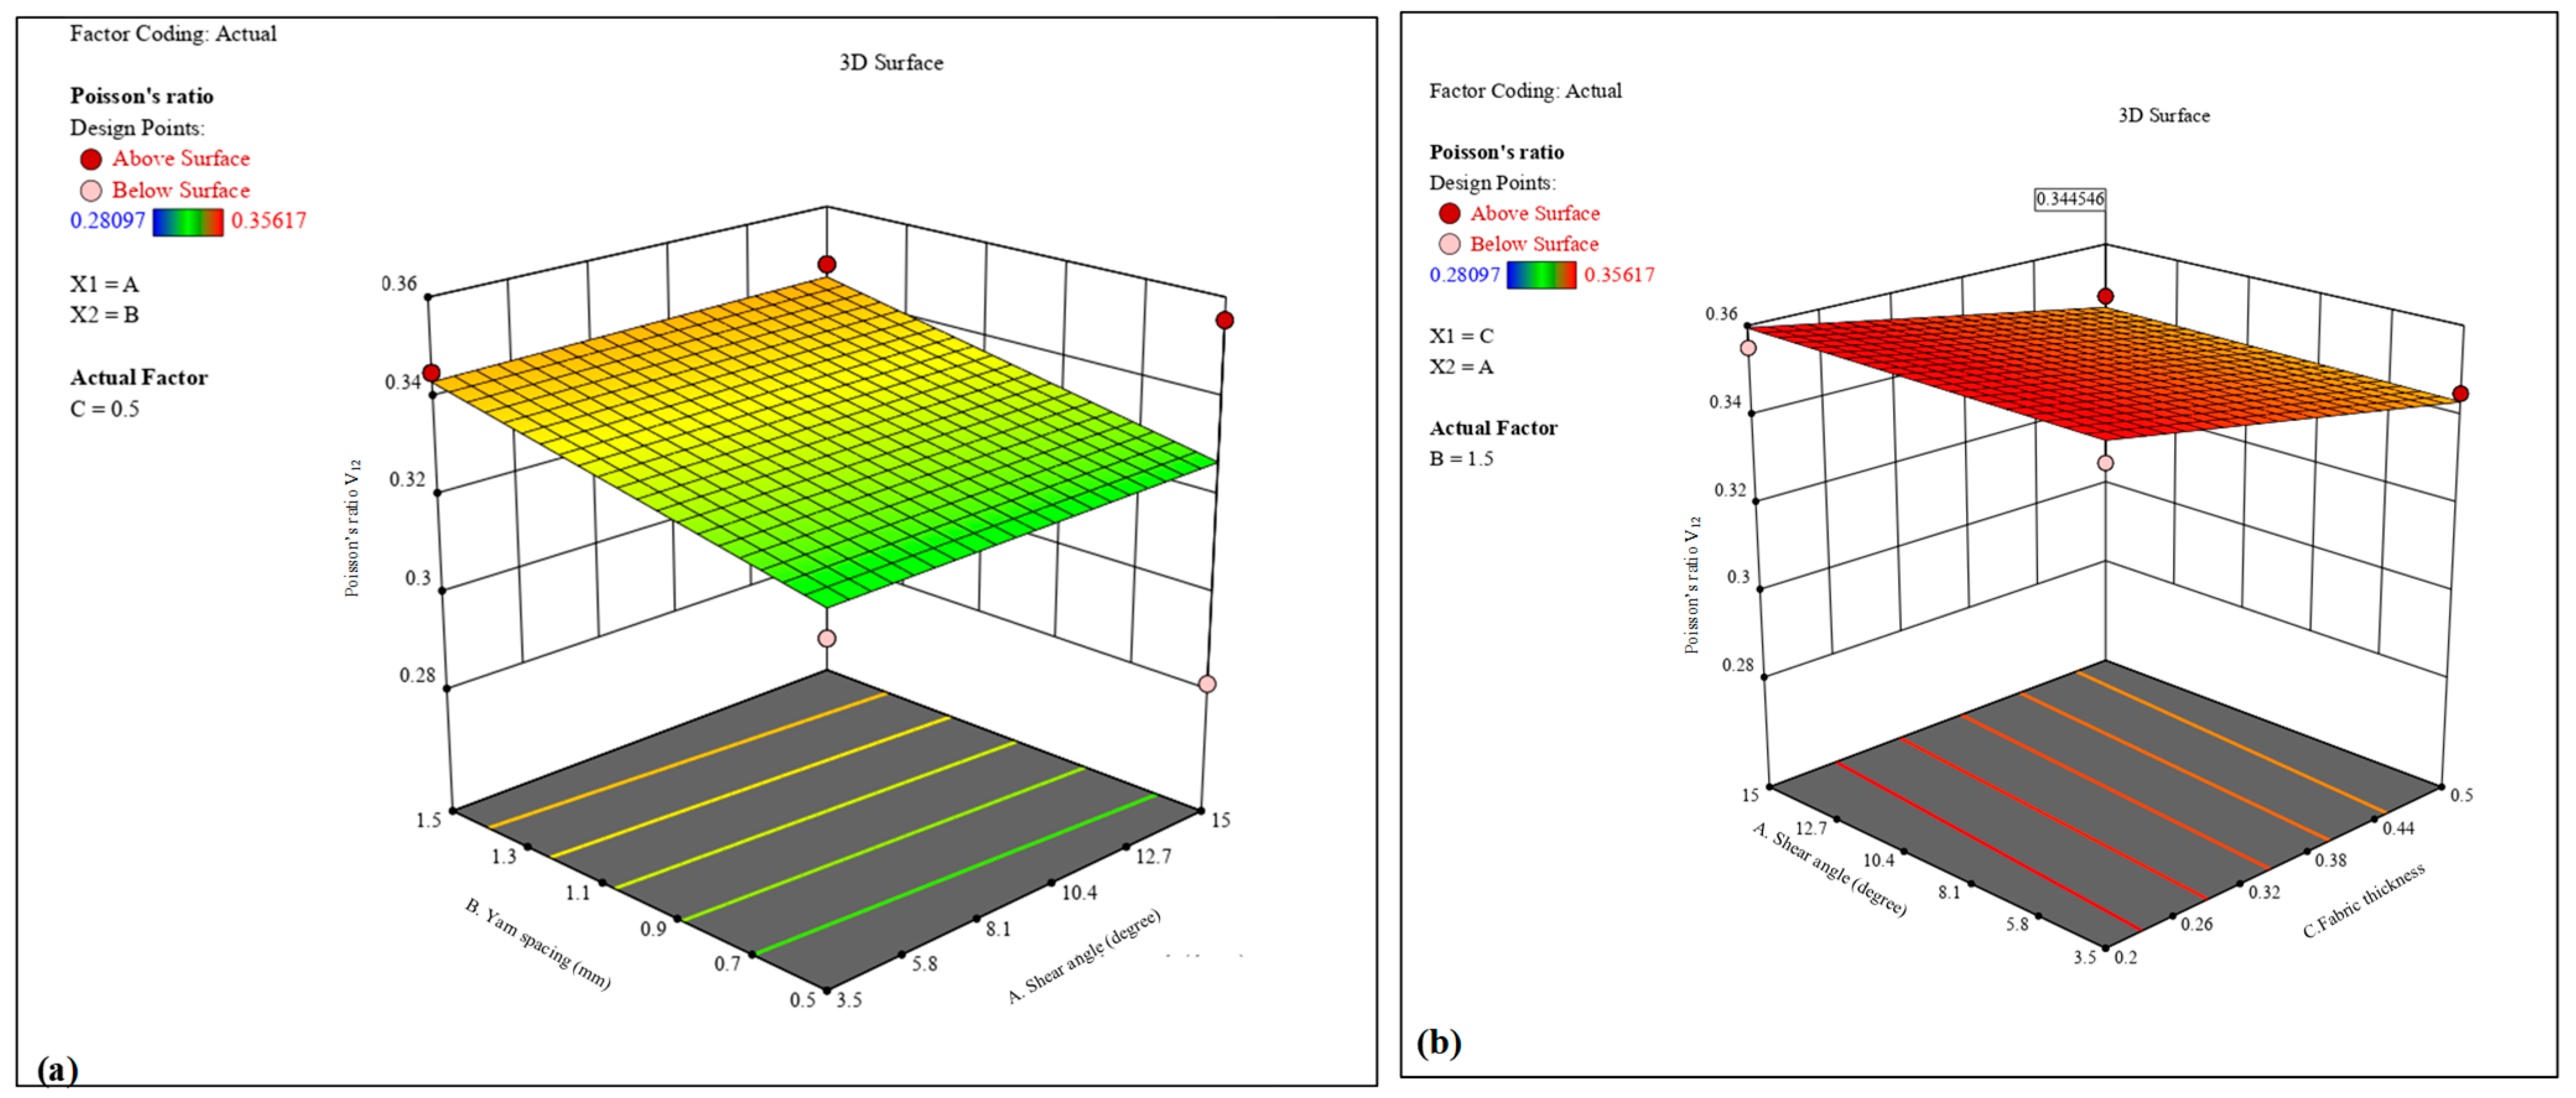
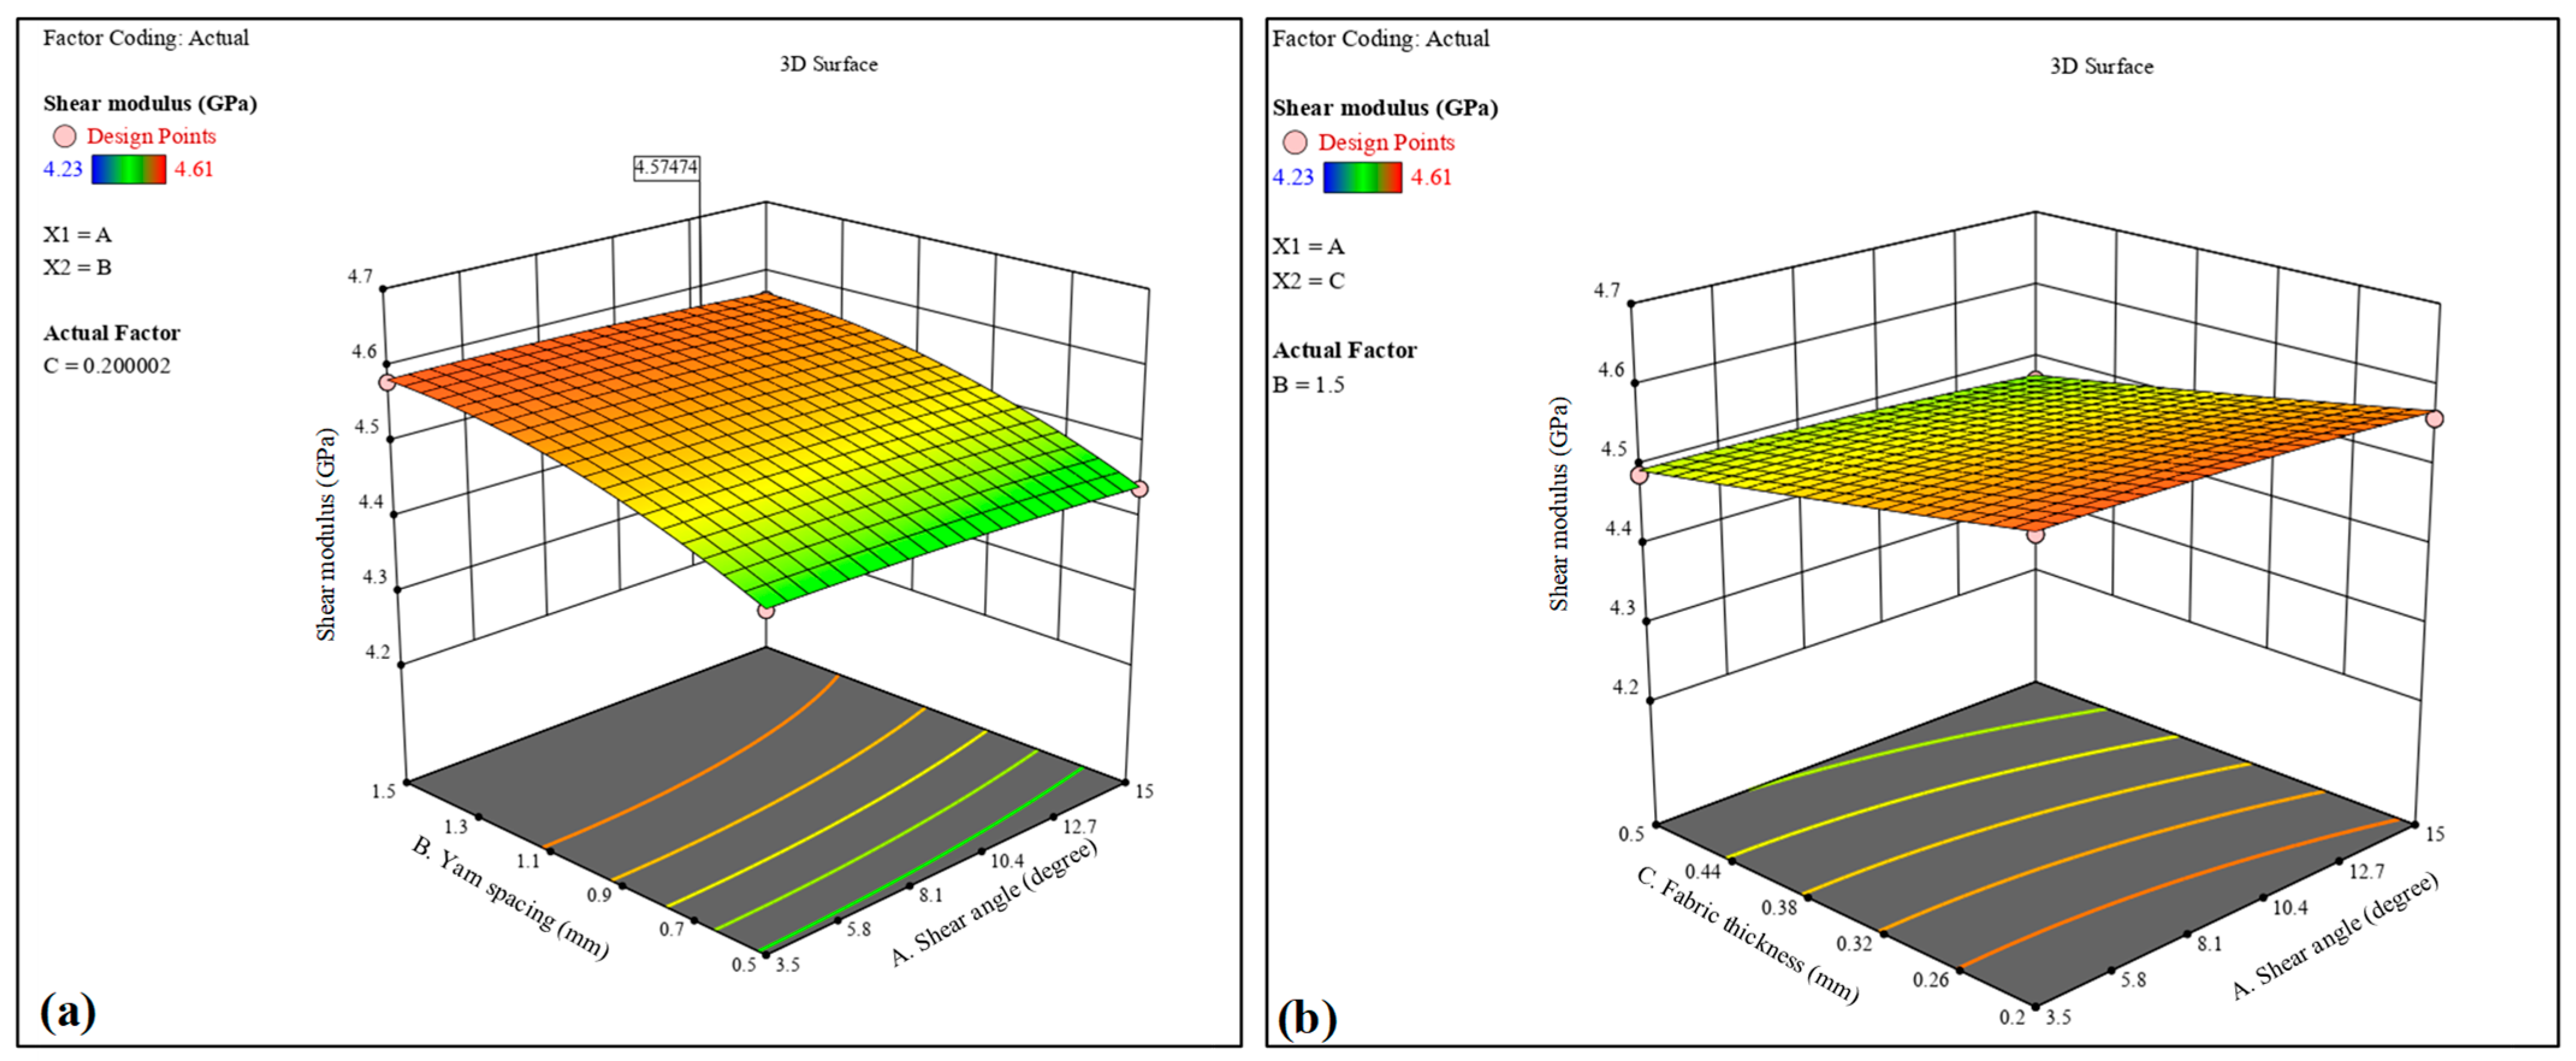
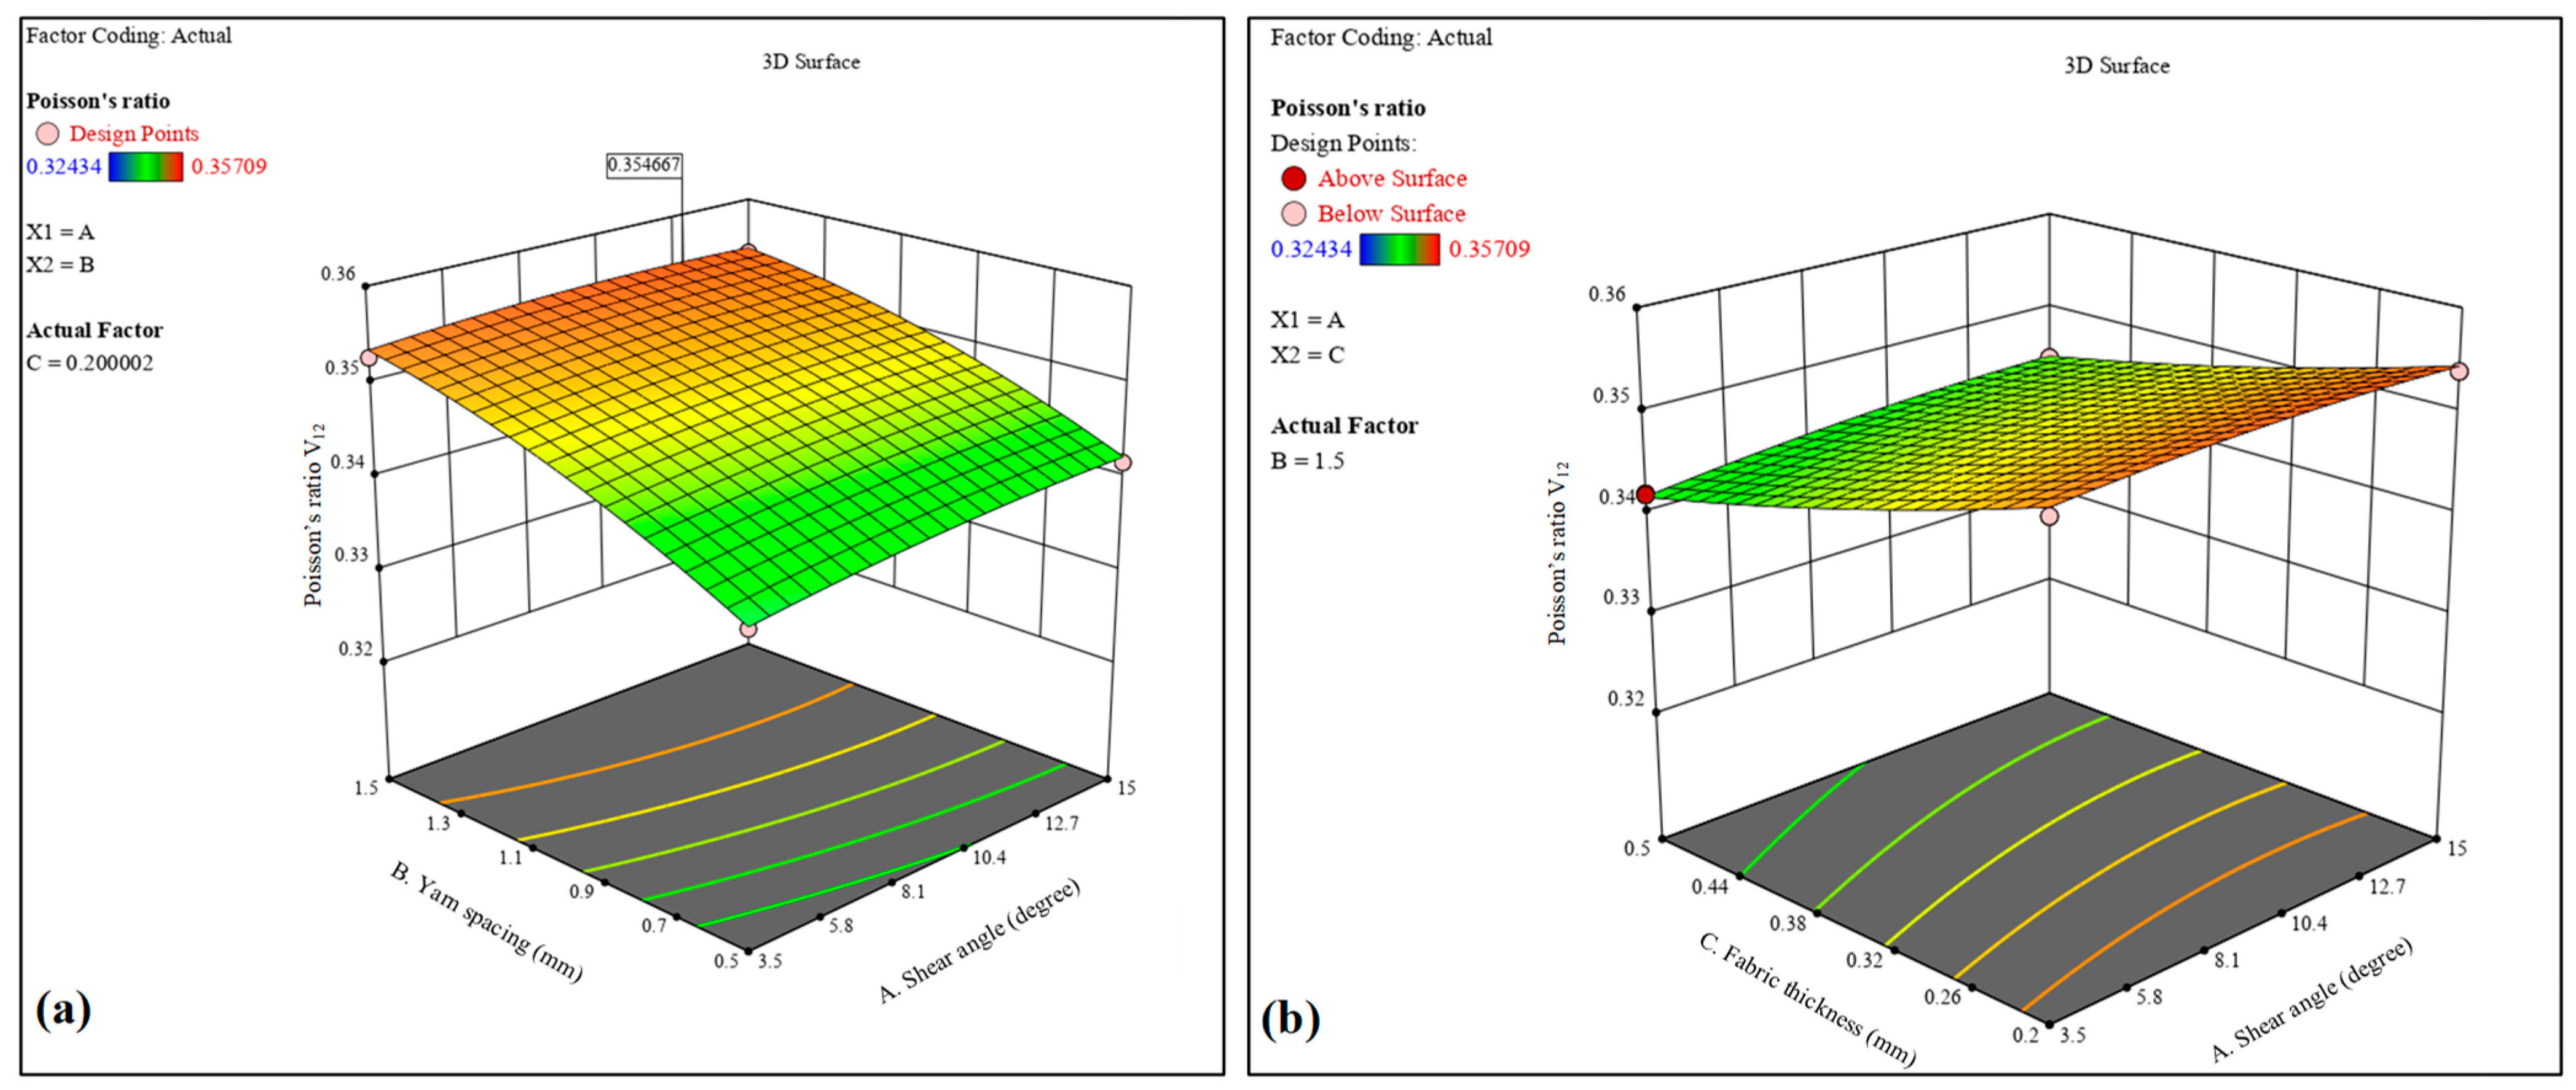
The 3D contour analysis further supports the ANOVA results by illustrating the relationships between each response and the corresponding variables. Consistent and logical trends were validated through this analysis. Overall, it was observed that yarn spacing and fabric thickness exhibit significant surface interactions with all elastic moduli in both plain- and twill-woven composites. In contrast, the shear angle demonstrated negligible interaction effects across all responses.
The optimized outcomes for both plain- and twill-woven jute composites were obtained at a shear angle of 9.25 degrees, yarn spacing of 1.0 mm, and fabric thickness of 0.35 mm. For the plain-woven composite, the optimized properties were E11—11.10 GPa, G12—4.4 GPa, and V12—0.34. In the case of the twill-woven composite, the optimized results were E11—11.54 GPa, G12—4.47 GPa, and V12—0.34. The differences between the software predictions and numerical confirmations were minimal in both cases, indicating the high accuracy of the prediction method.

Author Contributions

Conceptualization, J.S. and G.V.; methodology, J.S. and G.V.; software, J.S. and G.V.; validation, J.S.; formal analysis, J.S.; investigation, J.S. and G.V.; resources, J.S. and G.V.; data curation, J.S. and G.V.; writing—original draft preparation, J.S.; writing—review and editing, J.S. and G.V.; supervision, G.V.; project administration, J.S. and G.V.; funding acquisition. All authors have read and agreed to the published version of the manuscript.

Funding

This research received no external funding.

Data Availability Statement

All data have been shown in the paper.

Conflicts of Interest

The authors declare no conflicts of interest.

References

  1. Wang, Y.; Sultana, J.; Rahman, M.M.; Ahmed, A.; Azam, A.; Mushtaq, R.T.; Rehman, M. A Sustainable and Biodegradable Building Block: Review on Mechanical Properties of Bamboo Fibre Reinforced PLA Polymer Composites and Their Emerging Applications. Fibers Polym. 2022, 23, 3317–3342. [Google Scholar] [CrossRef]
  2. Hasan, K.M.F.; Rahman, M.M.; Rima, F.K.; Sultana, J.; Taher, M.A.; Horváth, P.G.; Garab, J.; Bejó, L.; Alpár, T. Sustainable Prospects of Lignocellulosic Wood and Natural Fiber-Based Materials in 3D and 4D Printing; Springer International Publishing: Berlin/Heidelberg, Germany, 2025; Volume 8, ISBN 4211402501. [Google Scholar]
  3. Mazedur, R.M.; Bin, R.S.; Jakiya, S.; Zillur, R.M. Additive Manufacturing Techniques, Their Challenges, and Additively Manufactured Composites for Advanced Engineering Applications; Elsevier: Amsterdam, The Netherlands, 2024. [Google Scholar]
  4. Yao, J.; Zhou, Z.; Zhou, H. Highway Engineering Composite Material and Its Application; Springer: Singapore, 2019; ISBN 9789811360688. [Google Scholar]
  5. Rahman, M.M.; Sultana, J. Design and Optimization of Natural Fiber Reinforced Hybrid Composite RVE: A Finite Element Analysis. In Proceedings of the 2023 International Conference on Engineering, Science and Advanced Technology (ICESAT), Mosul, Iraq, 21–22 June 2023; pp. 204–209. [Google Scholar] [CrossRef]
  6. Canonsburg, A.D. Material Designer User’s Guide; ANSYS: Canonsburg, PA, USA, 2024. [Google Scholar]
  7. Rayhan, S.B.; Rahman, M.M. Modeling Elastic Properties of Unidirectional Composite Materials Using Ansys Material Designer. Procedia Struct. Integr. 2020, 28, 1892–1900. [Google Scholar] [CrossRef]
  8. Koohbor, B.; Ravindran, S.; Kidane, A. Experimental Determination of Representative Volume Element (RVE) Size in Woven Composites. Opt. Lasers Eng. 2017, 90, 59–71. [Google Scholar] [CrossRef]
  9. Shi, X.; Sun, Y.; Xu, J.; Chen, L.; Zhang, C.; Zhang, G. Effect of Fiber Fraction on Ballistic Impact Behavior of 3D Woven Composites. Polymers 2023, 15, 1170. [Google Scholar] [CrossRef]
  10. Sultana, J.; Rahman, M.M.; Wang, Y.; Ahmed, A.; Xiaohu, C. Influences of 3D Printing Parameters on the Mechanical Properties of Wood PLA Filament: An Experimental Analysis by Taguchi Method. Prog. Addit. Manuf. 2023, 9, 1239–1251. [Google Scholar] [CrossRef]
  11. Arikan, V. The Influence of Yarn Fiber Volume Fraction, Shear Angle, and Yarn Spacing on Crack Propagation Resistance of Plain-Woven Fabric-Reinforced Epoxy Composites. Polym. Compos. 2023, 44, 5608–5618. [Google Scholar] [CrossRef]
  12. Yu, X.; Wang, H.; Wang, Z. Analysis of Yarn Fiber Volume Fraction in Textile Composites Using Scanning Electron Microscopy and X-Ray Micro-Computed Tomography. J. Reinf. Plast. Compos. 2019, 38, 199–210. [Google Scholar] [CrossRef]
  13. Haddouch, I.; Mouallif, I.; Zhouri, O.; Benhamou, M.; Hindi, Z. Numerical Study of the Impact of Shear Angle, Yarn Spacing and Yarn Fiber Volume Fraction on Effective Elastic Properties of Plan-Woven Composite. Mater. Today Commun. 2024, 39, 109171. [Google Scholar] [CrossRef]
  14. Pierce, R.S.; Falzon, B.G.; Thompson, M.C.; Boman, R.; Kingdom, U. Contributions to the Process Modelling of Resin Infusion Under Flexible Tooling (Rift) Manufacturing for Composite. In Proceedings of the 19th International Conference on Composite Materials, Montréal, QC, Canada, 28 July–2 August 2013. [Google Scholar]
  15. Jekabsons, N.; Varna, J. An Evaluation of Different Models for Prediction of Elastic Properties of Woven Composites. Compos. Part B 2000, 31, 7–20. [Google Scholar]
  16. Udhayaraman, R.; Mulay, S.S. Multi-Scale Damage Framework for Textile Composites: Application to Plain Woven Composite. Eur. J. Mech./A Solids 2019, 77, 103809. [Google Scholar] [CrossRef]
  17. Zhou, L.; Chen, M.; Liu, C.; Wu, H. A Multi-Scale Stochastic Fracture Model for Characterizing the Tensile Behavior of 2D Woven Composites. Compos. Struct. 2018, 204, 536–547. [Google Scholar] [CrossRef]
  18. Wu, L.; Adam, L.; Noels, L. Micro-Mechanics and Data-Driven Based Reduced Order Models for Multi-Scale Analyses of Woven Composites. Compos. Struct. 2021, 270, 114058. [Google Scholar] [CrossRef]
  19. Madke, R.R.; Chowdhury, R. A Multiscale Continuum Model for Inelastic Behavior of Woven Composite. Compos. Struct. 2019, 226, 111267. [Google Scholar] [CrossRef]
  20. Ghani, J.A.; Choudhury, I.A.; Hassan, H.H. Application of Taguchi Method in the Optimization of End Milling Parameters. J. Mater. Process. Tecnol. 2004, 145, 84–92. [Google Scholar] [CrossRef]
  21. Jerold, S.; Chelladurai, S.; Murugan, K.; Pratip, A.; Upadhyaya, M.; Narasimharaj, V.; Gnanasekaran, S. Materials Today: Proceedings Optimization of Process Parameters Using Response Surface Methodology: A Review. Mater. Today Proc. 2021, 37, 1301–1304. [Google Scholar] [CrossRef]
  22. Myers, R.H.; Myers, R.H. Response Surface Methodology—Current Status and Future Directions. J. Qual. Technol. 2018, 31, 30–44. [Google Scholar] [CrossRef]
  23. Balasubramani, N.K.; Zhang, B.; Chowdhury, N.T.; Mukkavilli, A.; Suter, M.; Pearce, G.M. Micro-Mechanical Analysis on Random RVE Size and Shape in Multiscale Finite Element Modelling of Unidirectional FRP Composites. Compos. Struct. 2022, 282, 115081. [Google Scholar] [CrossRef]
  24. Schwarze, C.; Darvishi Kamachali, R.; Kühbach, M.; Mießen, C.; Tegeler, M.; Barrales-Mora, L.; Steinbach, I.; Gottstein, G. Computationally Efficient Phase-Field Simulation Studies Using RVE Sampling and Statistical Analysis. Comput. Mater. Sci. 2018, 147, 204–216. [Google Scholar] [CrossRef]
  25. Kanit, T.; Forest, S.; Galliet, I.; Mounoury, V.; Jeulin, D. Determination of the Size of the Representative Volume Element for Random Composites: Statistical and Numerical Approach. Int. J. Solids Struct. 2003, 40, 3647–3679. [Google Scholar] [CrossRef]
  26. Kamiński, M.; Ostrowski, P. Homogenization of Heat Transfer in Fibrous Composite with Stochastic Interface Defects. Compos. Struct. 2021, 261, 113555. [Google Scholar] [CrossRef]
  27. Sun, Q.; Zhou, G.; Meng, Z.; Jain, M.; Su, X. An Integrated Computational Materials Engineering Framework to Analyze the Failure Behaviors of Carbon Fiber Reinforced Polymer Composites for Lightweight Vehicle Applications. Compos. Sci. Technol. 2021, 202, 108560. [Google Scholar] [CrossRef] [PubMed]
  28. Younes, R.; Hallal, A.; Fardoun, F.; Chehade, F.H. Comparative Review Study on Elastic Properties Modeling for Unidirectional Composite Materials. In Composites and Their Properties; INTECH Open Access Publisher: London, UK, 2012. [Google Scholar]
  29. Rayhan, S.B.; Rahman, M.M.; Sultana, J.; Szávai, S.; Varga, G. Finite Element and Machine Learning-Based Prediction of Buckling Strength in Additively Manufactured Lattice Stiffened Panels. Metals 2025, 15, 81. [Google Scholar] [CrossRef]
Figure 1. (a) Shear angles in both plain- and twill-woven composite RVEs [13]; (b) multiscale representation of the actual structure of a plain weave-woven composite [15]; (c) realistic depiction of yarn spacing in plain weave-woven composites RVEs of NFRCs; (d) twill-structure RVE of NFRC; (e,f) scanning electron micrographs of twill-composite RVE [27]; (g,h) variations in fabric thickness at 0.1 mm and 0.5 mm, (i) meshed RVE of a twill-composite RVE.
Jcs 09 00283 g001
Figure 2. (a) Comparison of longitudinal Young’s modulus (E11) obtained from experimental results, ANSYS Material Designer, and the Mori–Tanaka (M-T) model; (b) comparison of in-plane shear modulus (G12) from experimental data, Material Designer, and the M-T model; (c) comparison of major Poisson’s ratio (ν12) from Material Designer, the M-T model, and the self-consistent model.
Jcs 09 00283 g002
Figure 3. (a) Three-dimensional surface contour plot showing the effect of yarn spacing and shear angle on Young’s modulus (E11) for the plain-woven jute composite. (b) Three-dimensional surface contour plot showing the effect of fabric thickness and shear angle on shear modulus (E11) for the plain-woven jute composite.
Jcs 09 00283 g003
Figure 4. (a) Three-dimensional surface contour plot showing the effect of yarn spacing and shear angle on shear modulus (G12) for the twill-woven jute composite. (b) Three-dimensional surface contour plot showing the effect of fabric thickness and shear angle on shear modulus (G12) for the twill-woven jute composite.
Jcs 09 00283 g004
Figure 5. (a) Three-dimensional surface contour plot showing the effect of yarn spacing and shear angle on Poisson’s ratio (ν12) for the plain-woven jute composite. (b) Three-dimensional surface contour plot showing the effect of fabric thickness and shear angle on Poisson’s ratio (ν12) for the plain-woven jute composite.
Jcs 09 00283 g005
Figure 6. (a) Three-dimensional surface contour plot showing the effect of yarn spacing and shear angle on Young’s modulus (E11) for the twill-woven jute composite. (b) Three-dimensional surface contour plot showing the effect of fabric thickness and shear angle on shear modulus (E11) for the twill-woven jute composite.
Jcs 09 00283 g006
Figure 7. (a) Three-dimensional surface contour plot showing the effect of yarn spacing and shear angle on shear modulus (G12) for the twill-woven jute composite. (b) Three-dimensional surface contour plot showing the effect of fabric thickness and shear angle on shear modulus (G12) for the twill-woven jute composite.
Jcs 09 00283 g007
Figure 8. (a) Three-dimensional surface contour plot showing the effect of yarn spacing and shear angle on Poisson’s ratio (ν12) for the twill-woven jute composite. (b) Three-dimensional surface contour plot showing the effect of fabric thickness and shear angle on Poisson’s ratio (ν12) for the twill-woven jute composite.
Jcs 09 00283 g008
Table 1. Material properties of jute fiber and epoxy matrix.
Moduli’sJuteEpoxy
Modulus of elasticity20 GPa5.35 GPa
Poisson’s ratio0.380.25
Table 2. The design of the experiment for NFRC materials of plain- and twill-woven composite.
Input VariablesUnit−1 Level+1 Level
Shear angleDegree3.515
Yarn spacingmm0.51.5
Fabric thicknessmm0.20.5
Table 3. Numerical results and elastic moduli of plain and twill jute composites.
Plain Weave Jute CompositeTwill Weave Jute Composite
RunShear Angle (Degrees)Yarn Spacing (mm)Fabric Thickness (mm)E11 (GPa)G12 (GPa)V12E11 (GPa)G12 (GPa)V12
19.2510.1124.610.3561712.14.610.35709
23.50.50.211.54.480.3418711.34.460.33873
33.51.50.211.94.590.3538511.84.580.35267
49.2510.3511.74.590.3459111.54.470.34294
53.50.50.510.74.220.3203910.54.260.32435
69.250.750.3511.54.440.3405211.34.420.33798
73.51.50.211.94.590.3538511.84.580.35266
89.2510.3511.74.490.3458711.54.470.34294
9151.50.211.24.480.35514124.560.35394
10150.50.57.453.140.2809710.84.230.32999
113.50.50.510.074.220.3203810.54.260.32434
123.51.50.511.64.510.3451111.54.490.34208
139.2510.3511.74.490.3458711.64.470.34296
143.50.50.211.54.480.3418711.44.460.33874
159.2520.3511.94.570.3533611.94.560.35176
169.2510.3511.74.490.3458911.64.480.34297
17151.50.511.84.490.3473411.84.470.34463
18150.50.211.74.450.3442711.64.440.3417
199.2510.3511.74.490.345911.64.470.34293
209.2510.3511.74.490.345911.64.470.34293
219.2510.6511.24.350.33276114.340.33241
22151.50.511.84.490.3473211.84.470.34463
239.2510.3511.74.490.3458911.74.470.34293
24150.50.211.74.450.3442711.64.440.34169
25151.50.211.24.580.35514124.560.35395
263.510.3511.64.50.3442811.44.480.3412
273.51.50.511.64.510.3451211.64.490.34197
2820.7510.3511.94.470.3463211.74.450.34406
29150.50.511.24.350.355510.84.230.32999
309.2510.3511.74.490.345911.64.470.34292
Table 4. ANOVA analysis in E11 for plain-woven jute composite.
E11 (GPa)
SourceSSdfMSF-Valuep-ValuePC (%)Conditions
Model6.0932.033.60.0267
A-shear Angle0.17610.1760.31230.58110.85%not significant
B-Yarn Spacing3.2513.255.760.023815.67%significant
C-Fabric Thickness2.6612.664.720.039212.83%significant
Residual14.65260.5636
Lack of Fit7.42110.67491.40.2673
Pure Error7.23150.482
Cor Total20.7429
Table 5. ANOVA in G12 for plain-woven jute composite.
G12 (GPa)
SourceSSdfMSF-Valuep-ValuePC (%)Conditions
Model0.734230.24475.120.0064
A-Shear Angle0.063910.06391.340.25793.23%not significant
B-Yarn Spacing0.365610.36567.650.010318.46%significant
C-Fabric Thickness0.303610.30366.350.018215.33%significant
Residual1.24260.0478
Lack of Fit0.4962110.04510.90730.5558
Pure Error0.7458150.0497
Cor Total1.9829
Table 6. ANOVA in V12 for plain-woven jute composite.
V12
SourceSSdfMSF-Valuep-ValuePC (%)Conditions
Model0.002830.00097.420.001
A-Shear Angle8.21 × 10−618.21 × 10−60.06520.80050.13%Not significant
B-Yarn Spacing0.001510.001512.060.001824.59%significant
C-Fabric Thickness0.001310.001310.120.003821.31%significant
Residual0.0033260.0001
Lack of Fit0.00051100.24460.9884
Pure Error0.0028150.0002
Cor Total0.006129
Table 7. ANOVA in E11 for twill-woven jute composite.
E11 (GPa)
SourceSSdfMSF-Valuep-ValuePC (%)Conditions
Model4.8290.5352200.83<0.0001
A-Shear Angle0.307210.3072115.3<0.00016.31%significant
B-Yarn Spacing2.3412.34878.23<0.000148.05%significant
C-Fabric Thickness1.6711.67625.52<0.000134.29%significant
Residual0.0533200.0027
Lack of Fit0.014550.00291.130.3886
Pure Error0.0387150.0026
Cor Total4.8729
Table 8. ANOVA in G12 for twill-woven jute composite.
G12 (GPa)
SourceSSdfMSF-Valuep-ValuePC (%)Conditions
Model0.28590.0317472.91<0.0001
A-Shear Angle0.001710.001725.23<0.00010.59%significant
B-Yarn Spacing0.14310.1432135.89<0.000149.95%significant
C-Fabric Thickness0.121510.12151814.39<0.000142.44%significant
Residual0.0013200.0001
Lack of Fit0.001350.000342.91<0.0001
Pure Error0.0001155.83 × 10−6
Cor Total0.286329
Table 9. ANOVA in V12 for twill-woven jute composite.
V12
SourceSSdfMSF-Valuep-ValuePC (%)Conditions
A-Shear Angle01088.34<0.00010%significant
B-Yarn Spacing0.00110.0011773.28<0.000152.63%significant
C-Fabric Thickness0.000810.00081536.98<0.000142.11%significant
Residual0205.40 × 10−7
Lack of Fit052.16 × 10−63901.03<0.0001
Pure Error8.30 × 10−9155.53 × 10−10
Cor Total0.001929
Table 10. Numerical predictions and optimized outcomes for the plain-woven jute composite.
Predicted VariablesValuesResponsesPredicted ValuesConfirmationsDifference
Shear angle9.25Young’s modulus (E11 GPa)11.40 GPa11.10 GPa2.63%
Yarn spacing1.0 mmShear modulus (G12 GPa)4.43 GPa4.4 GPa0.68%
Fabric thickness0.35 mmPoisson’s ration (V12)0.340.340.0%
Table 11. Numerical predictions and optimized outcomes for the twill-woven jute composite.
Predicted VariablesValuesResponsesPredicted ValuesConfirmationsDifference
Shear angle9.25Young’s modulus (E11 GPa)11.58 GPa11.54 GPa0.35%
Yarn spacing1.0 mmShear modulus (G12 GPa)4.47 GPa4.47 GPa0.0%
Fabric thickness0.35 mmPoisson’s ration (V12)0.340.340.0%
Disclaimer/Publisher’s Note: The statements, opinions and data contained in all publications are solely those of the individual author(s) and contributor(s) and not of MDPI and/or the editor(s). MDPI and/or the editor(s) disclaim responsibility for any injury to people or property resulting from any ideas, methods, instructions or products referred to in the content.

