Article

Influence of Various Crack Widths in RC Bridge Decks on the Initiation of Chloride-Induced Corrosion

Department of Civil Engineering, Toronto Metropolitan University, Toronto, ON M5B 2K3, Canada
*
Author to whom correspondence should be addressed.
J. Compos. Sci. 2025, 9(5), 242; https://doi.org/10.3390/jcs9050242
Submission received: 19 March 2025 / Revised: 7 May 2025 / Accepted: 9 May 2025 / Published: 14 May 2025

Abstract

This study investigates the influence of crack width on the time to chloride-induced corrosion initiation in reinforced concrete (RC) bridge decks, incorporating climate change projections through the year 2100 under IPCC scenarios (RCP2.6 and RCP8.5). A probabilistic modelling approach using Monte Carlo simulations (MCSs) was applied to assess corrosion initiation across a range of environmental and structural conditions, including normal and high-performance concrete (HPC), varying concrete cover depths, and the use of supplementary cementing materials (SCMs). The results indicate that increasing the crack width significantly accelerates chloride ingress, reducing the time to corrosion initiation by up to 41% compared with that under uncracked conditions. HPC demonstrated superior durability, delaying corrosion initiation by nearly twice as long as normal concrete under identical chloride exposure. Elevated temperatures projected under high-emission scenarios further reduce service life by increasing chloride diffusion rates. Polynomial regression models were developed to relate crack width and concrete cover to corrosion initiation time, offering practical tools for durability-based design and service life prediction. These findings highlight the importance of enhanced crack control, climate-adaptive material selection, and updated durability standards to improve the resilience of RC bridge infrastructure in the face of climate change.

1. Introduction

Reinforced concrete (RC) bridges in cold-climate regions, such as North America, face significant deterioration due to chloride-induced corrosion caused by deicing agents. Chloride ions, which originate from internal sources (e.g., aggregates or mixing water) or external sources (e.g., deicing salts), penetrate concrete and initiate corrosion, an electrochemical process requiring an anode, a cathode, and conductive pathways [1,2,3,4,5]. This study assumes that ionic diffusion is the primary mechanism for chloride ingress.
The inherent alkalinity of concrete (pH 12.5–13.5) provides a passivating layer that protects steel reinforcement from corrosion [6,7]. However, this protection can be compromised by carbonation or localized pitting due to chloride-induced potential differentials. Tuutti [8] conceptualized corrosion as a two-stage process: initiation, where steel remains passive, and propagation, where corrosion products accumulate, causing cracking and spalling. The initiation period depends on the concrete cover depth and chloride concentration, whereas propagation is influenced by oxygen diffusion and temperature [8,9].
Chloride-induced corrosion reduces the cross-sectional area of rebar, diminishes the load-carrying capacity, and weakens the bond strength between steel and concrete, leading to structural damage [10,11,12,13,14]. Current corrosion mitigation strategies include low water-to-cement ratios, supplementary cementing materials (SCMs), and adequate concrete cover [15,16].
Recent studies have highlighted the importance of incorporating ground granulated blast furnace slag (GGBS) and macrosynthetic fibres to increase chloride resistance. For example, Cheng et al. [17] demonstrated that while GGBS may initially reduce early strength, it significantly improves long-term resistance to chloride penetration. Although synthetic fibres do not directly improve chloride resistance in uncracked concrete, they help maintain structural integrity by bridging cracks, thus indirectly limiting chloride ingress over time (Djerbi et al. [18]).
Environmental factors such as temperature and humidity significantly influence chloride transport, with higher temperatures accelerating ionic mobility and higher humidity enabling diffusion through capillary pores [19,20,21,22,23,24,25]. Notably, Akduman and Öztürk [26] demonstrated that structural integrity is particularly compromised in cracked RC elements under seismic loads. Cracking in RC elements further shortens the corrosion initiation time. Liu et al. [27] developed a chloride diffusion model for cracked concrete slabs that considers the surface chloride concentration, binding effects, time dependence, temperature, humidity, and crack width.
Recent experimental and numerical investigations have reinforced the critical role of crack geometry, including tortuosity, depth, and orientation, in influencing chloride penetration. Wang et al. [28] quantified crack density, orientation, and tortuosity and reported that these parameters substantially impact effective chloride diffusivity. Their findings highlighted that the effective crack width and density better correlate with chloride ingress than do the nominal values alone. Wang et al. [29] further supported this with simulations showing that tortuous cracks, especially those with narrow sections, slow chloride transport more effectively than straight cracks of equal depth.
Increasing the concrete compressive strength from 30 to 50 MPa reduces the probability of corrosion by approximately 70%, according to Félix et al. [30], resulting in a concrete structure that aligns with the durability limit state design criteria. Zhang et al. [31] conducted both an experimental program and probabilistic modelling to evaluate non-uniform corrosion patterns in steel rebars. Their findings revealed that nonuniformity is more pronounced in smaller-diameter rebars across varying corrosion levels, whereas larger-diameter rebars exhibited only slight variation. Shao et al. [32] developed a prediction model for crack propagation in RC piles subjected to localized chloride-induced corrosion, particularly in marine environments. Their study also identified the maximum degree of corrosion of RC piles on the basis of crack limitation criteria.
Despite the use of crack width limits in design codes such as the Canadian Highway Bridge Design Code (CHBDC) and Eurocode 2, studies by Djerbi et al. [18], Takewaka et al. [33], and Amleh et al. [34] have shown that even small cracks (0.1–0.3 mm) can drastically increase diffusion coefficients, leading to premature corrosion initiation. Questions remain about the adequacy of these limits under projected climate change.
Moreover, climate change presents new challenges for infrastructure durability. According to the IPCC’s [35] Representative Concentration Pathways (RCP2.6 and RCP8.5) and Canada’s Changing Climate Report [36], significant increases in annual maximum temperature and shifts in humidity patterns are expected over the coming decades. These changes can accelerate ionic mobility and moisture movement in concrete, increasing the rate of chloride ingress and reducing service life [36,37,38]. Despite growing awareness, most prior studies either neglected climate considerations or analyzed them in isolation without integrating them into probabilistic service life models.
High-performance concrete (HPC), particularly when blended with SCMs such as silica fume and fly ash, has been shown to enhance durability by reducing porosity and improving resistance to chloride penetration [37,38,39,40]. However, while several studies have confirmed the benefits of SCMs under static environmental conditions, few studies have explored how SCMs perform under dynamic climatic influences, especially when crack width is introduced as a variable.
Research Gap and Objectives: Despite advances in chloride diffusion modelling, crack width sensitivity analysis, and climate adaptation frameworks, few studies provide a comprehensive, probabilistic assessment of chloride-induced corrosion initiation that concurrently considers crack width, HPC/SCM use, cover thickness, and evolving climate conditions. Moreover, validated predictive models capable of quantifying corrosion risk under these combined variables are lacking.
This study addresses these gaps by developing a Monte Carlo simulation–based probabilistic model that integrates structural parameters (crack width, concrete cover, SCMs) and environmental variables (temperature and humidity projections) to evaluate the time to corrosion initiation for RC bridge decks. The model is validated via field and experimental data from the literature and offers practical insights for climate-resilient infrastructure design and assessment.

2. Framework and Research Methodology Modelling

This study systematically evaluated the impact of climate change on the probability of chloride-induced corrosion initiation (PCI) in normal reinforced concrete (NC) and HPC bridge decks. A multifaceted methodology was used, integrating probabilistic modelling, experimental data obtained from published research papers, and climate projections to assess the combined effects of structural and environmental variables on corrosion initiation under evolving climatic conditions.
The analysis focused on two types of RC bridge decks, NC and HPC, with a consistent concrete cover depth of 70 mm. The chloride diffusion coefficient, a key parameter, was adjusted to account for variations in the maximum temperature and relative humidity. Climate projections from the CCCR and the IPCC’s representative concentration pathways (RCP2.6 and RCP8.5) were used to model the environmental conditions in Toronto until 2100. Toronto was selected as a representative example of a cold climate region where deicing salts are extensively used.

2.1. Overview of the Modelling Approach

The methodology comprises the following steps:
  • Integration of Climate Projections: Climate data from the CCCR and IPCC RCP scenarios were incorporated to simulate future environmental conditions. These projections were used to adjust the chloride diffusion coefficient on the basis of the maximum temperature and RH.
  • Monte Carlo simulation for probabilistic modelling: MCS was used to assess the variability in the time to corrosion initiation by randomly sampling key input parameters (assessing the PCI under stochastic environmental and structural conditions). For each scenario, 100,000 simulations were performed to account for the variability in key parameters, including the chloride surface concentration (Cs), the concrete cover thickness (x), and the chloride threshold levels (Cth).
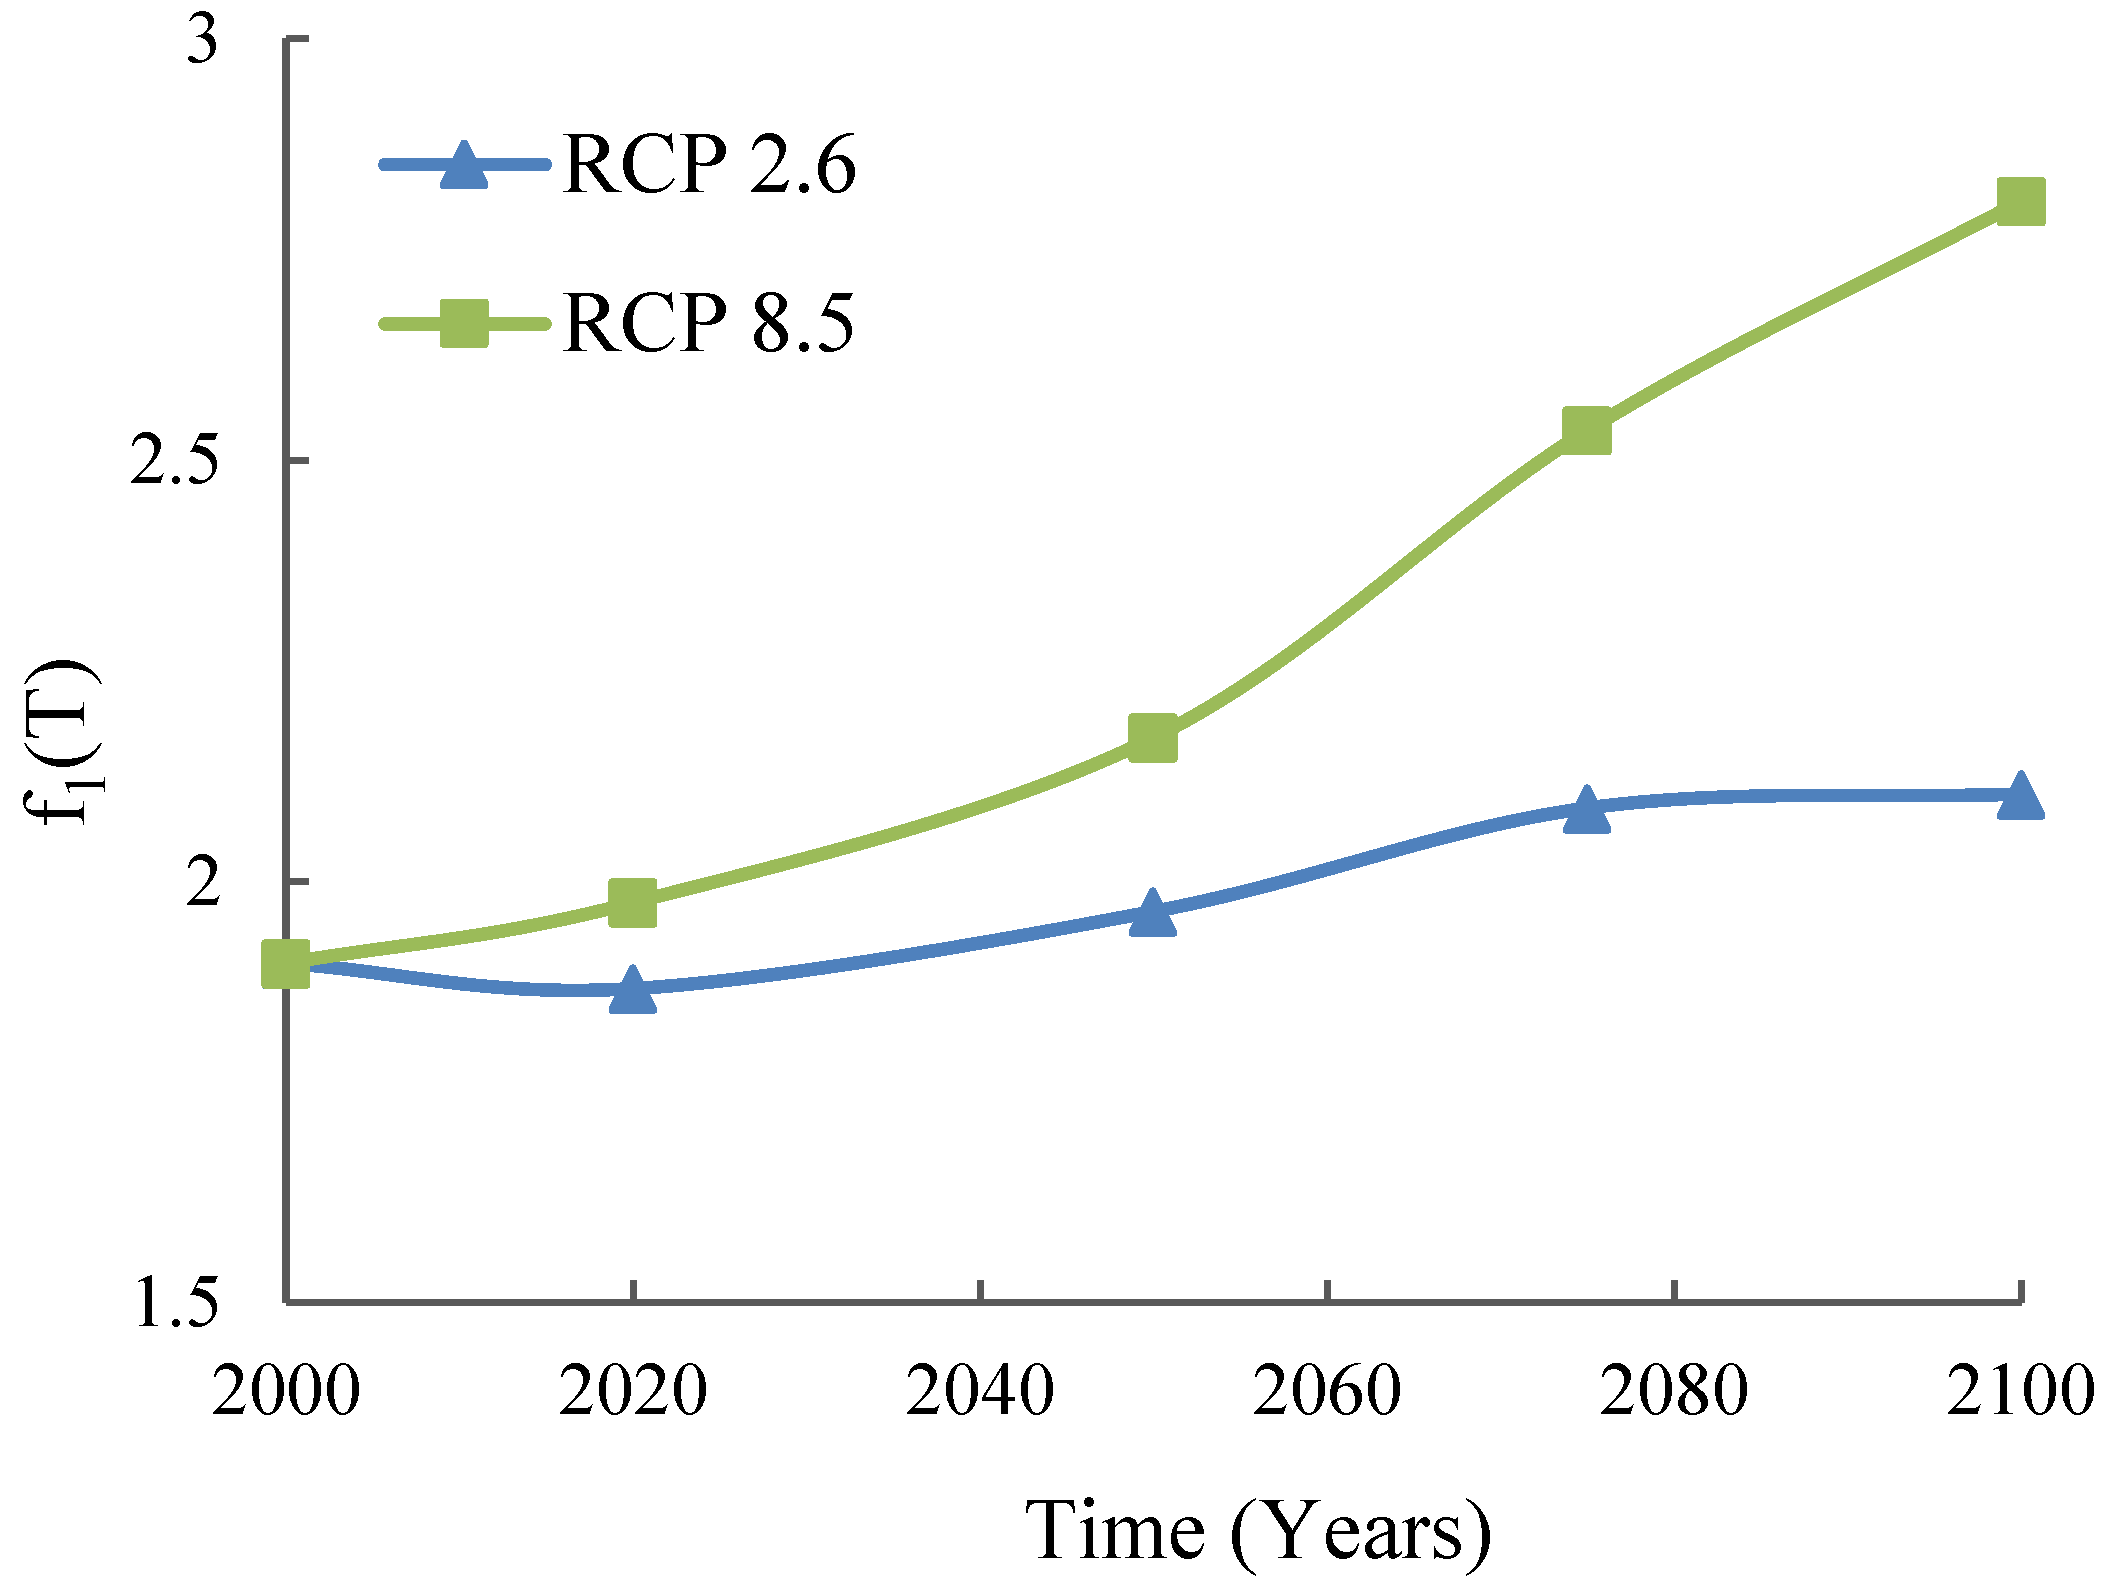
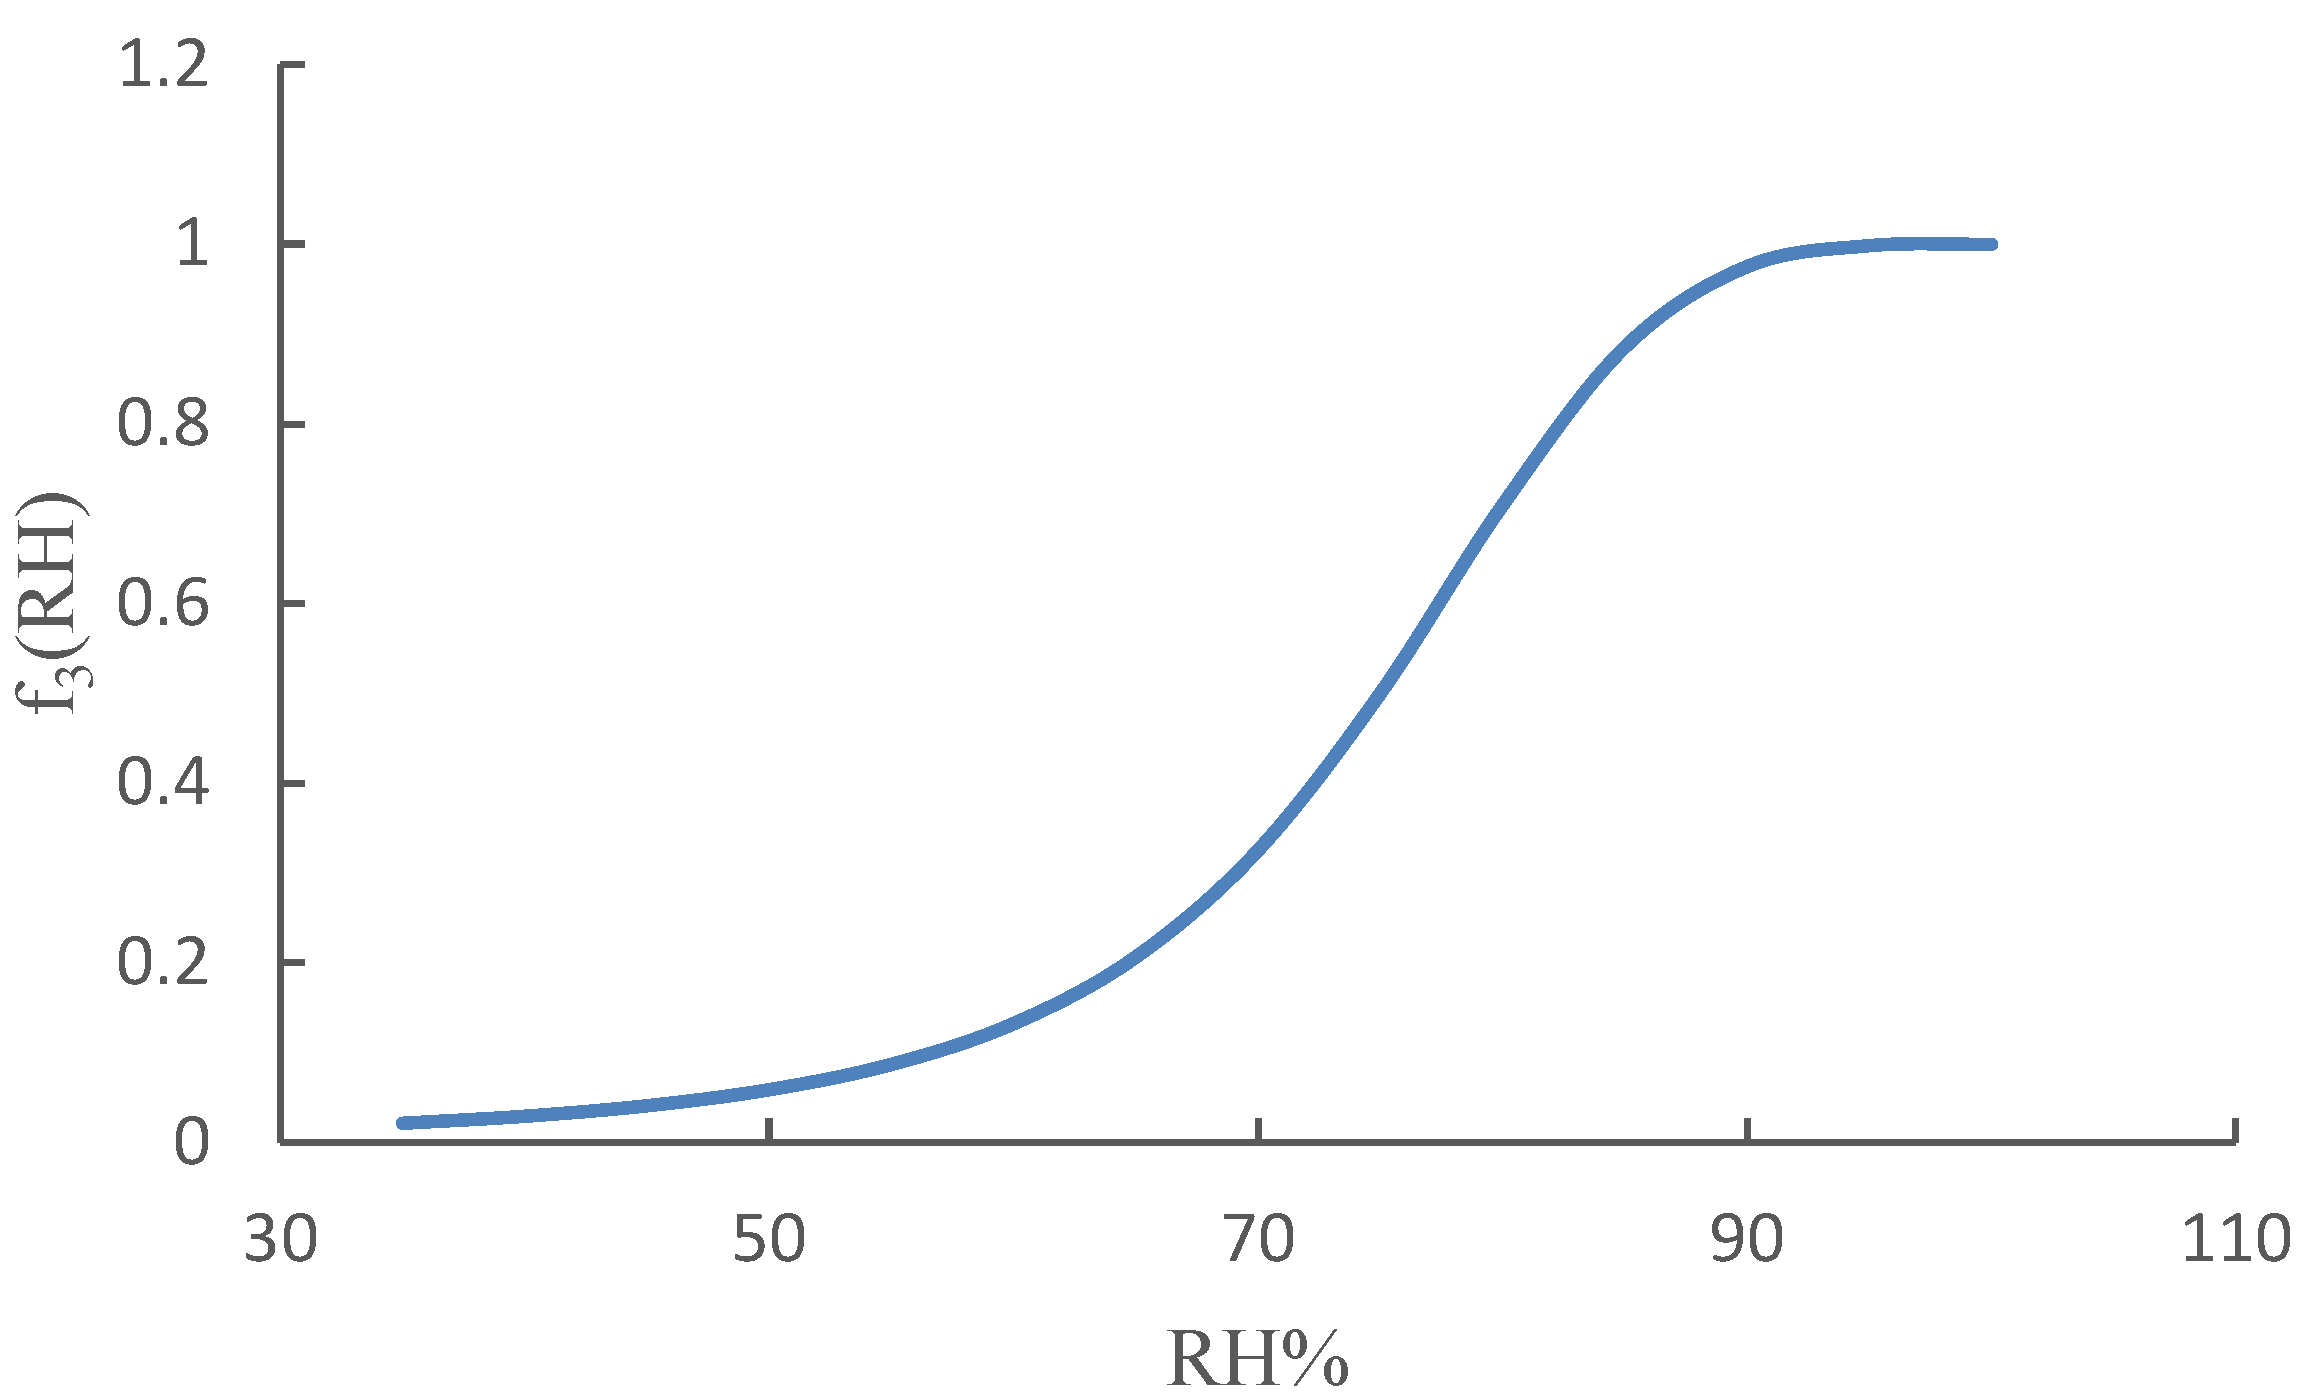
  • Correction of the Chloride Diffusion Coefficient: The chloride diffusion coefficient (D) was adjusted to reflect the effects of temperature, maturation time, and relative humidity via an adaptation of Saetta et al.’s [41] approach.
  • Modelling of Chloride Ingress: Chloride ingress was modelled via Fick’s second law of diffusion for uncracked concrete. For cracked concrete, the diffusion coefficient (Dcc) was partitioned into contributions from uncracked and cracked regions, as described by Djerbi et al. [18] and Takewaka et al. [33]. The influence of crack width (0.1 mm to 0.35 mm) on corrosion initiation time was evaluated via polynomial relationships derived from regression analyses.
  • Model Validation: The probabilistic model is validated by existing field and experimental data [42,43,44]. The simulated corrosion initiation times for NC and HPC decks under uncracked and cracked conditions are compared with those reported in published studies.
  • Analysis of Environmental Parameters: A comparative analysis was performed to independently assess the influences of temperature and relative humidity on the PCI.
  • Evaluation of Supplementary Cementing Materials: The model incorporated the mitigating role of SCMs in reducing chloride diffusion and extending corrosion-free service life.

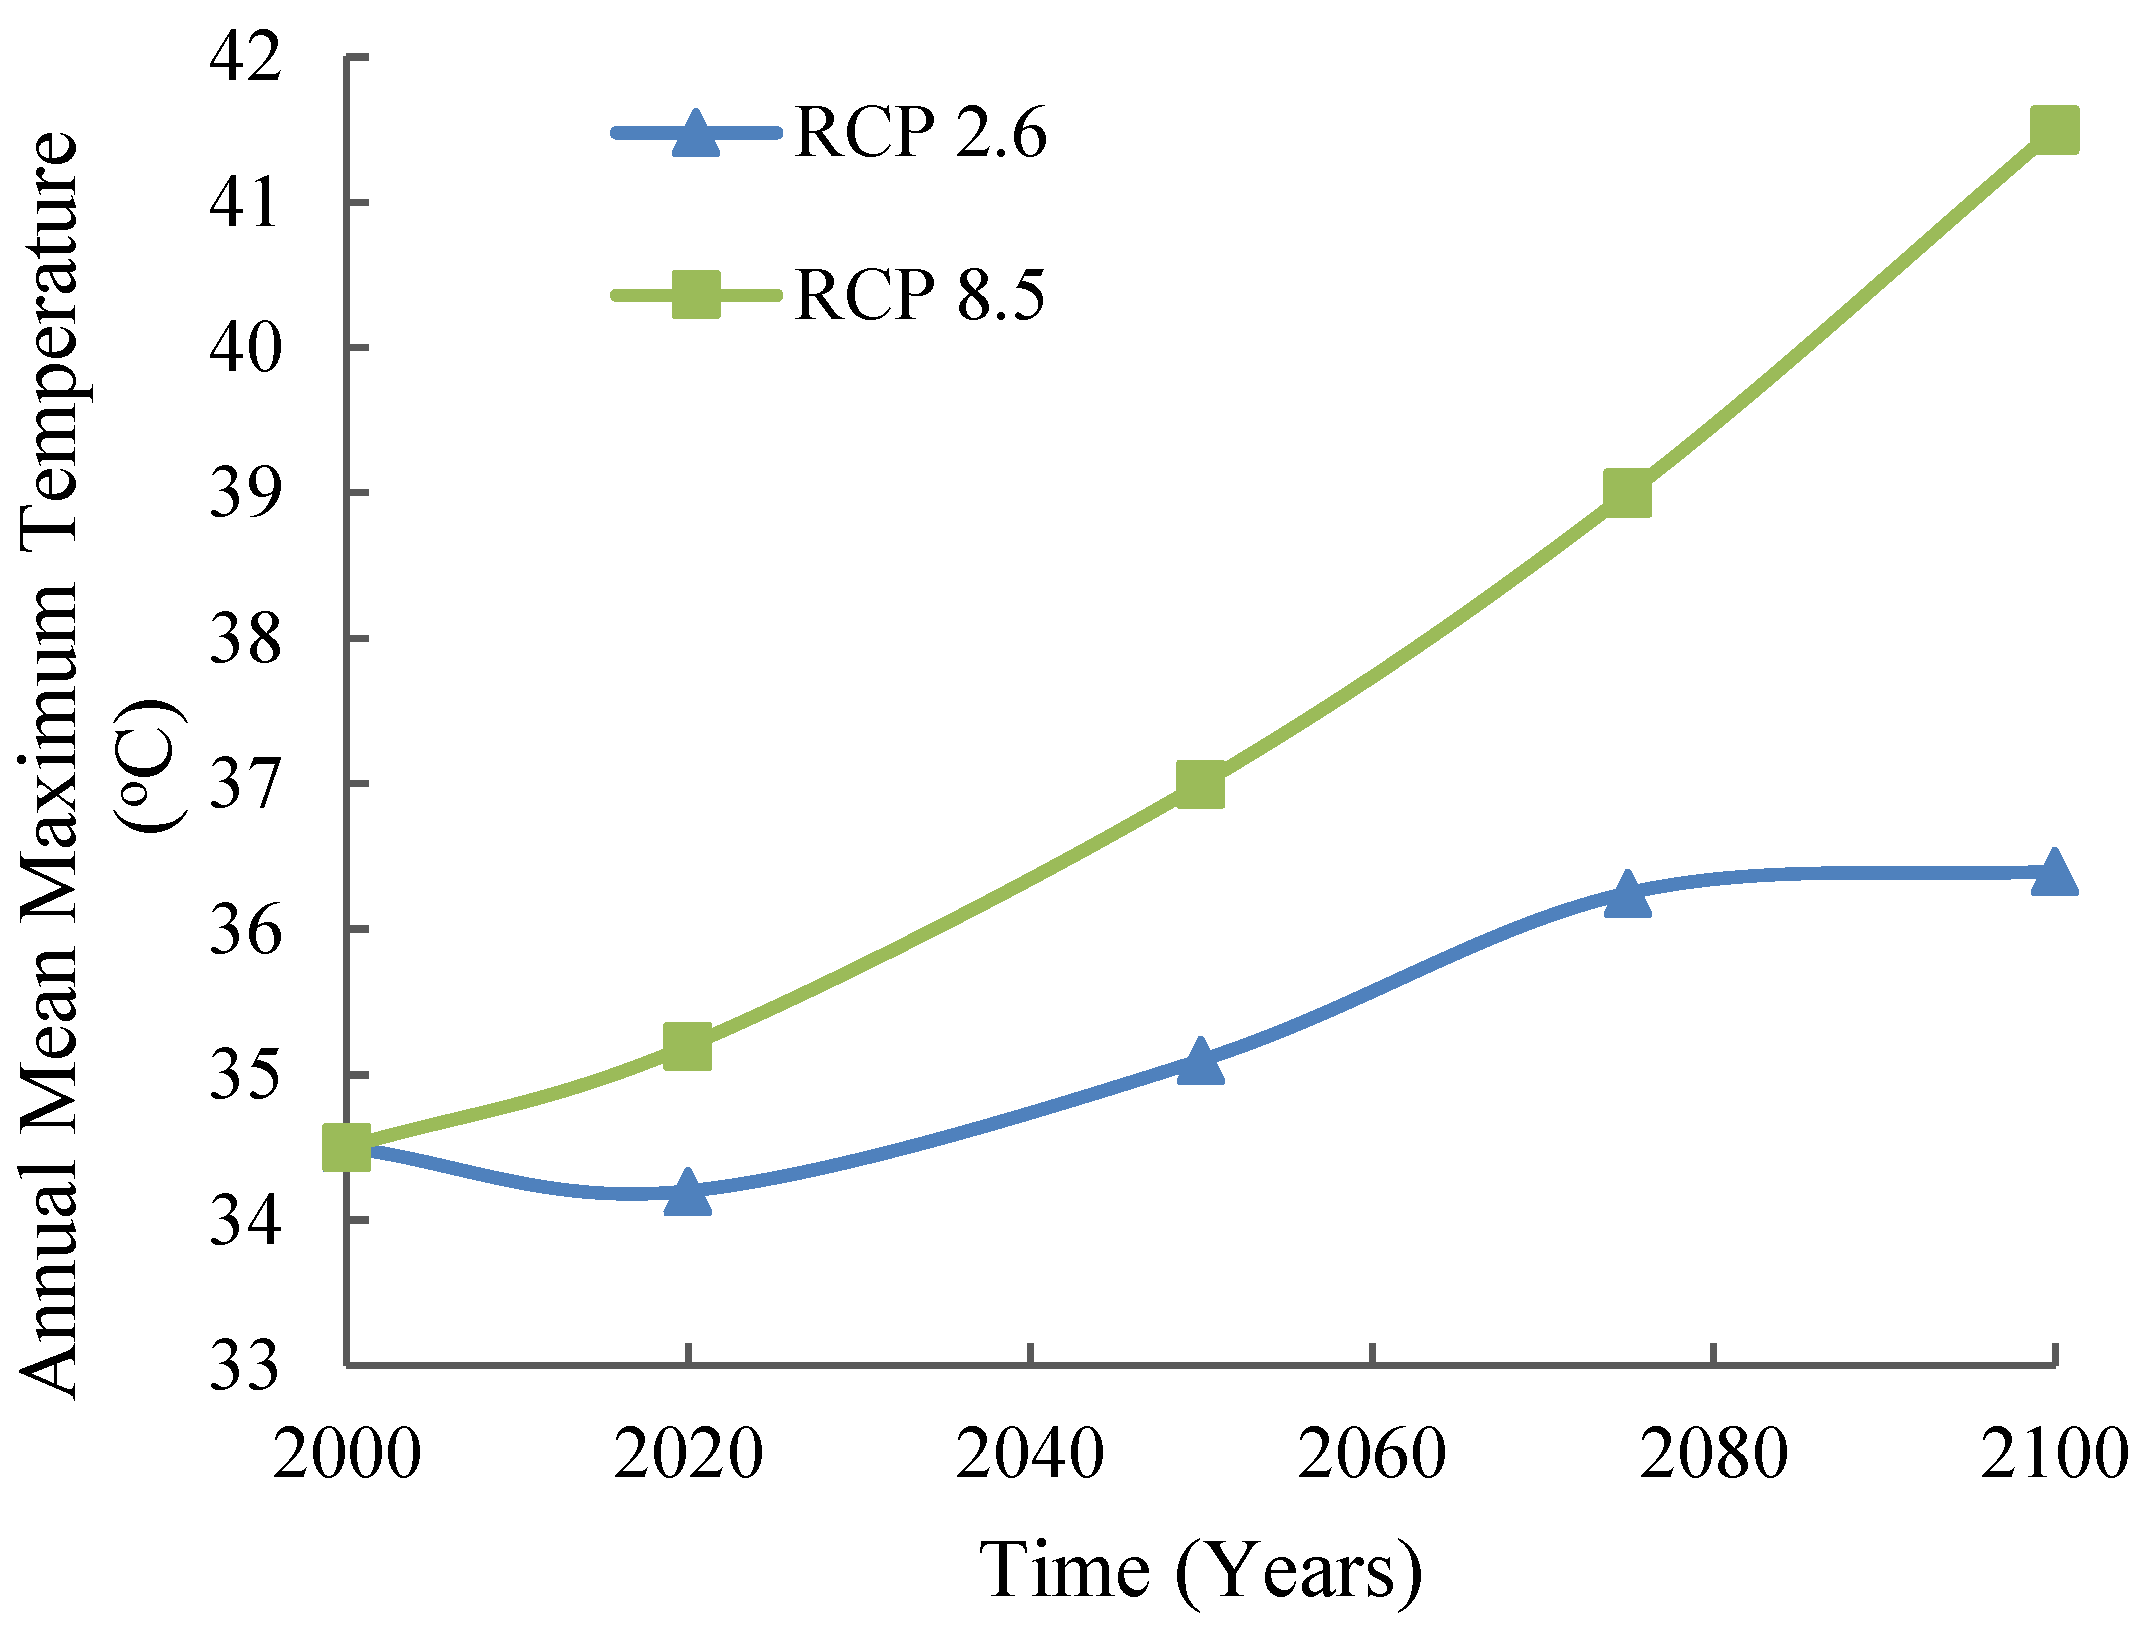
2.2. Projection of the Maximum Temperature for Toronto Under Different Climate Scenarios

The Canada Changing Climate Report [36] provides projections for the annual maximum temperature in Toronto under different RCPs. Using publicly available data from the CCCR, Figure 1 was generated, which illustrates these temperature projections for two key climate scenarios:
  • RCP2.6 (Low-Emission Scenario): This scenario reflects aggressive mitigation strategies to limit the rise in global temperature. Under RCP2.6, Toronto’s maximum annual temperature will reach 36.4 °C by 2100.
  • RCP8.5 (High-Emission Scenario): This scenario represents a future with continued high energy consumption and limited climate action. Under RCP8.5, Toronto’s maximum annual temperature could rise to 41.7 °C by 2100.
These projections, which are based on Toronto’s geographic coordinates (43.7417° N, 79.3733° W), provide critical insights for evaluating the long-term durability of RC bridge decks. Specifically, they inform the assessment of chloride ingress and corrosion initiation risks in a warming climate. These changes likely accelerate chloride ion diffusion, as established by previous studies [20,35]. An elevated temperature increases the kinetic energy of ions, reducing the time to corrosion initiation.

2.3. Performance Function for Chloride-Induced Corrosion Initiation

The MCS method is widely used to evaluate the probability of chloride-induced corrosion initiation, as demonstrated in previous studies [45,46,47,48,49]. MCS is a numerical approach that solves problems by simulating random variables, requiring the generation of numerous random values for each variable [50,51,52,53]. As outlined in the methodology section, MCS was applied with 100,000 simulations to estimate the probability of chloride-induced corrosion initiation under varying environmental and structural conditions.
The chloride concentration at the steel depth C(x,t) for a given concrete cover depth (x) and exposure time (t) was calculated via Equation (1) [48,54]. The apparent chloride diffusion coefficient (D) used in this model is assumed to be constant:
C x , t = C s 1 erf x 2 D × t
The performance function, which represents the difference between resistance and loading, is defined by Equation (2). Corrosion initiation occurs when the chloride concentration exceeds the threshold:
g(Cs, x, Cth) = CthCx,t (Cs, Dc, x, t)
where g(Cs, x, Cth) = 0 (represents the limit state); g(Cs, x, Cth) > 0 (uncorroded state); and g(Cs, x, Cth) < 0 (corrosion state).
The performance function incorporates three random variables: the concrete cover thickness (x), surface chloride concentration (Cs), and chloride threshold (Cth). Additionally, the corrected diffusion coefficient (Dc) accounts for the effects of the maximum temperature and relative humidity, as illustrated in the modified performance function, Equation (3):
g C s ,     x , C t h = C t h C s 1 erf x 2 D c × t
where Dc reflects the influence of temperature and humidity on chloride diffusion.

2.4. Corrected Chloride Diffusion Coefficient (Dc)

The method for calculating the corrected chloride diffusion coefficient (Dc) considers the influences of the maximum temperature, equivalent maturation time, and relative humidity, as detailed in Amleh et al. [34]. This approach is adapted to evaluate the impact of environmental factors on the probability of corrosion initiation in RC bridge decks under changing climate conditions. The corrected diffusion coefficient, Dc, is defined following Saetta et al. [41] in Equation (4):
D c = D × f 1 T × f 2 t e × f 3 R H
where D (m2/s) and Dc (m2/s) are the chloride diffusion coefficient and the corrected chloride diffusion coefficient, respectively, and f1(T), f2(te), and f3(RH) are correction factors accounting for the effects of temperature, maturation time, and relative humidity, respectively. The correction factors used in Equations (4)–(7) are adopted from Saetta et al. [41] and Bazant and Najjar [43] and have been validated in multiple studies on concrete durability. The temperature factor, shown in Equation (5), is derived from the Arrhenius equation, a standard approach for modelling thermally activated diffusion. The maturation time correction in Equation (6) reflects the decrease in diffusivity due to continued hydration, whereas the RH correction in Equation (7) accounts for the sharp reduction in ionic transport below the critical humidity threshold (~75%). These models are widely accepted and provide a reliable framework for estimating the chloride diffusion coefficient under varying climatic conditions.
The correction factors are defined as follows:
f 1 T = Exp E a R 1 T 1 1 T 2  
f 2 t e = ξ + 1 ξ 28 t e 1 2  
f 3 R H = 1 + 1 R H 4 1 R H c 4 1  
where T1 is the reference temperature (296 K), T2 is the desired temperature measured in Kelvin (K), Ea is the activation energy of diffusion (KJ/mol) related to the water-to-cement ratio used in the concrete mixture (i.e., for a water-to-cement ratio of 0.4, the corresponding (Ea) is 41.8 KJ/mol) according to Page et al. [42], R is the gas constant (8.314 × 10⁻³ kJ/Kmol), and te is the actual time of exposure to chloride (days) according to Saetta et al. [41]. ξ is a parameter that measures how much the diffusivity decreases with time, varies from 0 to 1, and is assumed to be near 1 for concrete with a low water-to-cement ratio. The RHc is equal to 75%, according to Bazant and Najjar [43], and RH is the current relative humidity.
Figure 2 and Figure 3 illustrate the influences of temperature and relative humidity correction factors over time under different RCP scenarios (RCP2.6 and RCP8.5). These figures, adapted from Amleh et al. [34], visually represent how climate change affects chloride transport mechanisms in RC bridge decks.
The projections in Figure 2 highlight the increased risk of accelerated corrosion in RC bridge decks under climate change. The higher projected temperatures, especially under RCP8.5, are expected to increase chloride ion mobility. These results align with findings of Andrade and Castillo [19], who also noted increased PCI under elevated temperatures. The factor that represents the effect of the relative humidity is shown in Figure 3.
Figure 3 shows the strong nonlinear relationship between relative humidity and the correction factor f3(RH). As the RH increases beyond 70%, the diffusion factor increases sharply, indicating significantly higher rates of chloride ingress. These results align with findings of [20,21,22,23]. At relative humidity levels below 50%, the correction factors are significantly lower than those at values between 55% and 100%. This highlights the importance of maintaining adequate moisture conditions in RC structures to mitigate chloride penetration and enhance durability.

2.5. Probabilistic Approach for Climate-Related Corrosion Initiation Assessment

A probabilistic approach, previously applied to RC bridge decks with different chloride diffusion coefficients [34], is utilized to assess the impacts of climate on corrosion initiation. The analysis compares NC and HPC, as summarized in Table 1. The NC deck has a cement content of 460 kg/m3, whereas the HPC deck incorporates 10% silica fume as a partial replacement, resulting in a lower chloride diffusion coefficient of 6.34 × 10⁻¹³ m2/s [44]. According to CSA A23.1-14 [55], the upper limit for the chloride threshold in RC structures is 0.15% of the cement weight. The surface chloride concentration varies regionally, ranging from 0 to 25 kg/m3. Weyers et al. [56] classified corrosive environments into four categories on the basis of surface chloride concentration: light, moderate, heavy, and severe exposures. This study assumes a chloride concentration (Cs) of 6 kg/m3, representing deicing salt exposure, which is consistent with values reported by [57,58].
The key random variables in the model (Cs, x, and Cth) were assumed to follow a log-normal distribution. This choice is supported by previous probabilistic studies on concrete durability [48,59,60], as the log-normal distribution effectively captures the natural variability of chloride ingress and corrosion processes due to their natural skewness and nonnegativity.
A mean Cth of 0.7 kg/m3 was adopted on the basis of CSA A23.1-14 and previous field studies [31,59,61]. However, to reflect the natural variability in corrosion initiation thresholds due to differences in cement type, SCMs, and environmental exposure, Cth is treated as a random variable in this study. Specifically, it follows a log-normal distribution with a coefficient of variation of 20%, which is consistent with the experimental data reported by [34,48]. This probabilistic modelling ensures a more accurate representation of corrosion initiation risk across a range of real-world conditions. The chloride concentration at the steel depth defined in Equation (1) was used to simulate the probability of corrosion initiation, accounting for the variability in the concrete cover, surface chloride concentration, threshold values, and chloride diffusion coefficients. This model was validated against previously published experimental and field data for both NC and HPC decks, which strongly agreed with the corrosion initiation timelines reported by [34,61].
The coefficient of variation (COV) for the chloride concentration is assumed to be 30%, as suggested by [59], Saassouh and Lounis [48], and Amleh et al. [34], ensuring realistic modelling of chloride ingress variability. The model’s parameter values, distributions, and exposure conditions are consistent with those of previous studies, enabling direct comparative analysis of corrosion initiation probabilities under different environmental and material conditions.
Table 1 summarizes the mean values, COVs, and distribution types for critical variables such as Cs, x, and Cth for the NC and HPC bridge decks, providing transparency and reproducibility for the probabilistic model.
This table provides a comprehensive reference for understanding the variability in key parameters affecting chloride ingress and corrosion initiation. The use of field data from multiple studies ensures that the probabilistic approach used in this research reflects real-world conditions encountered in RC bridge decks subjected to chloride exposure. The statistical parameters reflect realistic field conditions. The high COV for Cs (30%) captures environmental variability, whereas lower COVs for x and Cth ensure practical design. The NC and HPC diffusion coefficients indicate the performance advantage of SCM-modified concrete.

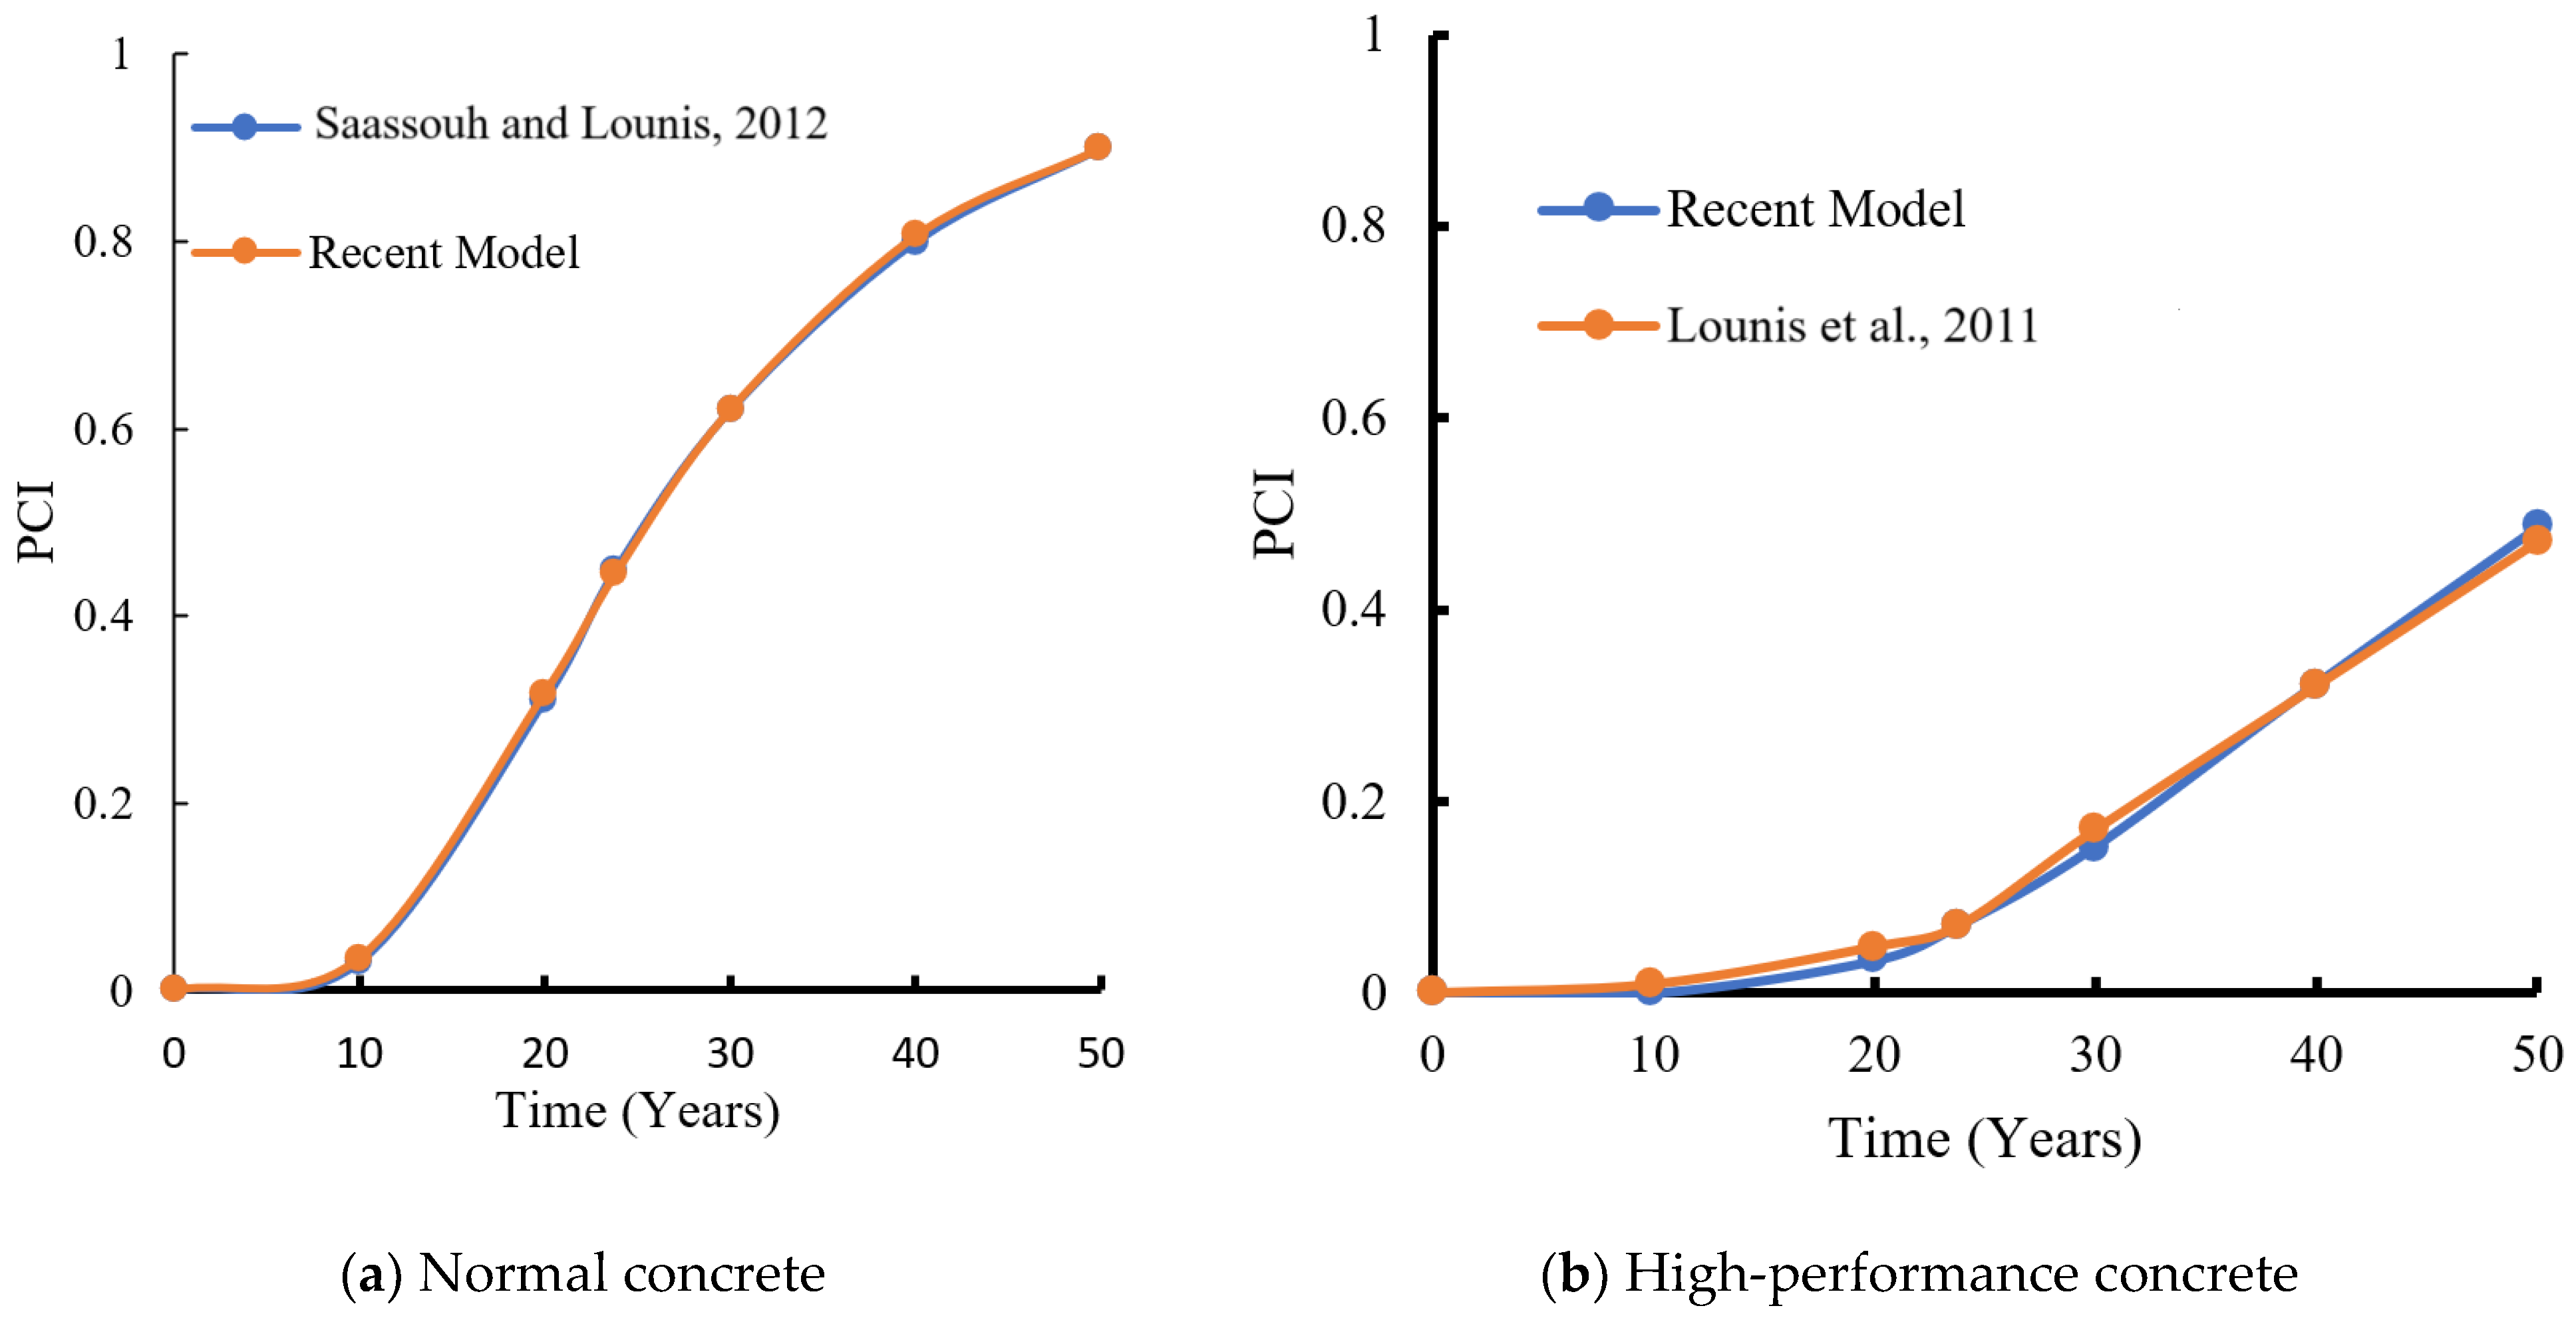
2.6. Validation of the Chloride-Induced Corrosion Initiation Model

To ensure the reliability of the current probabilistic model, we employed a validation procedure that replicates the approach previously used and published by Amleh et al. [34]. The current model adopts the same validation parameters and outputs as in [34], where for NC bridge decks, a 45% probability of corrosion initiation was predicted at approximately 23.8 years, closely aligning with the 24-year estimate reported in earlier field-based studies (Figure 4a). However, for HPC decks, the model predicted a 15.5% probability of corrosion at 30 years, which is consistent with the 16.9% benchmark previously reported by [60] (Figure 4b). The higher PCI in the NC reinforces the enhanced durability of the HPC.
As such, Figure 4a,b presented in this work are reused with permission from the previously published validation results [34] to reaffirm the robustness and reproducibility of the probabilistic modelling framework across different concrete types. These results demonstrate that the model is capable of capturing corrosion initiation timelines with high fidelity under various exposure and material scenarios.
The demonstrated agreement with established findings reinforces the validity of the assumed diffusion parameters and confirms the suitability of the model for simulating chloride ingress in RC infrastructure. Future research could expand this validation by incorporating field calibration using long-term monitoring datasets.

3. Results and Discussion

This section presents the simulation outputs, climate data visualizations, and PCI comparisons between concrete types, chloride concentrations, crack widths, and environmental scenarios.

3.1. Impact of the Maximum Temperature and Relative Humidity on the PCI

This section evaluates how the maximum temperature and relative humidity influence the PCI in RC bridge decks made of NC and HPC. Both deck types were modelled with a 70 mm concrete cover and a surface chloride concentration of 6 kg/m3. Two scenarios were examined: the temperature scenario, where the maximum temperature ranged from 25 °C to 45 °C, and the humidity scenario, where the relative humidity (RH) ranged from 60% to 75%, while the temperature was held constant.
Figure 5a shows that the PCI increases substantially in both NC and HPC as the temperature increases from 40 °C to 45 °C, particularly under the RCP8.5 scenario. These results align with the findings of Andrade and Castillo [19,22], who demonstrated that elevated temperatures significantly increase ionic mobility, thereby accelerating chloride ingress and reducing the time to corrosion initiation.
Figure 5b shows that the RH significantly affects the PCI in NC, with the probability increasing from near zero to approximately 0.5 as the RH increases from 60% to 75%. Higher humidity enhances chloride transport, accelerating corrosion onset. In contrast, HPC shows minimal sensitivity to RH in the same range because of its dense microstructure and lower diffusivity, which impedes moisture-driven chloride ingress. This trend is consistent with previous studies by Djerbi et al. [18] and Wang et al. [28], which reported that higher relative humidity levels enhance capillary absorption and diffusion, facilitating chloride penetration into RC structures.
Collectively, these results emphasize the importance of climate-adjusted material selection in bridge design and demonstrate the superior climate resilience of HPC, especially in environments experiencing both warming and increased humidity due to climate change. Climate-adapted material selection, especially the use of HPC, is therefore critical for extending service life and enhancing durability in future RC infrastructure.

3.2. Chloride-Induced Corrosion Initiation in Uncracked and Cracked Concrete

3.2.1. Corrosion Initiation Model and Assumptions

The time to corrosion initiation (Ti) was calculated via Equation (8) from Saassouh and Lounis [48], assuming a chloride threshold of 0.7 kg/m3. Although the corrosion initiation time is obtained through an empirical model (Equation (8)) rather than direct experimental measurements, the model’s accuracy has been verified by comparison with published field studies for NC and HPC decks, as illustrated in Section 2.5. These comparisons confirm that the model, although empirical, is capable of providing realistic projections under field-relevant conditions. Future work may incorporate long-term field monitoring for further refinement. The chloride diffusion coefficients used were 1.27 × 10⁻¹² m2/s for NC [34] and 6.342 × 10⁻¹³ m2/s for HPC [60]. The concrete cover thickness varied between 35 mm and 75 mm, with surface chloride concentrations of 3 kg/m3 and 6 kg/m3 applied to assess corrosion initiation times for uncracked and cracked concrete. Additional validation was conducted using input parameters derived from the Dickson RC bridge deck, as reported by Lounis and Mirza [61]. Future work may incorporate long-term field monitoring to refine the model further.
T i = x 2 4 × D × e r f 1 1 C t h C s 2
where D is the chloride diffusion coefficient (m2/s), Cs is the surface chloride concentration (kg/m3), x is the concrete cover thickness (m), and Cth is the chloride threshold (kg/m3).
Chloride diffusion is influenced by crack width (w), which affects the diffusion coefficient Dcr; experimental studies have shown that Dcr varies with crack width and is independent of material properties [18,33,62]. Djerbi et al. [18] established a direct correlation between crack width and Dcr, as expressed in Equation (9) and illustrated in Figure 6.
D c r 2 × 10 11 w 4 × 10 10   30   μ m w 80   μ m   D c r 14 × 10 10   w > 80   μ m  
This figure shows that the diffusion coefficient Dcr increases nonlinearly with crack width, plateauing at approximately 90 μm. The sharp increase in diffusion for crack widths exceeding 40 μm suggests a significant increase in the chloride ingress potential as microcracks grow, accelerating corrosion initiation. These findings agree with experimental observations by Djerbi et al. [18], who also reported an exponential increase in chloride diffusivity with increasing crack width. The plateau observed above 80 μm implies that beyond a certain threshold, additional increases in width contribute minimally to chloride transport, possibly owing to saturation or transport limitations. This trend reinforces the critical role of crack control in service-life design and the necessity of integrating crack-induced permeability variations into durability models.
Prediction of corrosion initiation in cracked concrete—In the case of cracked concrete, the time to corrosion initiation (Ti) is determined by modifying Equation (8), replacing D with the chloride diffusion coefficient for cracked concrete (Dcc) with a lower limit of 30   μ m and an upper limit of 80  μ m According to Wang et al. [29], which accounts for both cracked and uncracked areas, as expressed in Equation (10):
T i = x 2 4 × D c c × e r f 1 1 C t h C s 2
where Dcc is the total diffusion coefficient for cracked concrete, expressed as:
D c c = ( A × D a ) + ( A c r × D c r ) ( A + A c r )
where A is the area of uncracked concrete (mm2); Da is the apparent chloride diffusion coefficient (m2/s); Dcr is the value of the chloride diffusion coefficient inside the crack (m2/s); and Acr is the area of the crack (mm2).
The empirical equations developed by [24] were used to estimate the apparent chloride diffusion coefficient (Da) for the NRC, both with and without SCMs. These equations were derived from regression analysis of 415 samples (without SCMs) and 139 samples (with SCMs), as presented in Equations (12) and (13). For a water-to-binder ratio (w/b) of 0.4, the apparent chloride diffusion coefficient is 2.074 × 10⁻¹² m2/s for the concrete without the SCM (Equation (12)). In contrast, Da is 1.36 × 10⁻¹² m2/s for concrete with the SCM, according to Equation (13).
D a = 10 6.77 × w b 2 + 10.10 × w b 14.64 w i t h o u t   S C M
D a = 10 0.79 × w b 2 + 3.40 × w b 13.10 w i t h   S C M
The maximum crack spacing (Sr,max) is calculated via Eurocode 2 (2004):
S r ,   m a x = 3.4 × c + 0.425 × k 1 × k 2 × ρ p ,   e f f    
where c is the concrete cover to the reinforcement (mm); k1 is the bond coefficient (k1 = 0.8 for high-bond bars and k1 = 1.6 for bars with an effectively plain surface); k2 is the strain distribution coefficient (k2 = 0.5 for bending and k2 = 1.0 for pure tension); ϕ is the bar diameter (mm); ρp,eff is the effective reinforcement ratio As/Ac,eff; and Ac,eff = effective tension area (mm2), i.e., Ac,eff is the area of concrete surrounding the tension reinforcement at depth, hc,ef (mm), where hc,ef is less than 2.5 × (h−d), (h−x)/3 or h/2.
The chloride diffusion coefficients for the cracked concrete versus the corresponding crack width for the RC bridge deck are computed on the basis of an RC deck thickness of 300 mm for an existing RC bridge. In addition, the diameter (ϕ) of the main steel bars used for the RC bridge deck is assumed to be 25 M, with a high bond coefficient for steel reinforcement.

3.2.2. Time to Corrosion Initiation for Uncracked Concrete

The time to corrosion initiation (Ti) was computed for concrete cover thicknesses ranging from 35 mm to 75 mm via Equation (8). For a 70 mm cover and a chloride concentration of 6 kg/m3, Ti was estimated at 25 years for NC and 50 years for HPC. These results demonstrate that HPC delays corrosion initiation by approximately twice as long as does NC under identical conditions. The relationship between the concrete cover thickness and Ti follows a second-degree polynomial function, as illustrated in Figure 7 and Table 2.
Figure 7 highlights how increasing the concrete cover depth (CV) significantly extends the time to corrosion initiation, with higher chloride concentrations accelerating corrosion. Figure 7a (NC) shows that increasing the cover from 35 mm to 75 mm can delay corrosion from approximately 6–35 years at Cs = 6 kg/m3 and from 10 to 50 years at Cs = 3 kg/m3. Figure 7b (HPC) demonstrates even more pronounced longevity, with corrosion delayed to nearly 95 years under favourable conditions, emphasizing the durability advantage of HPC.
The quadratic regression models with R2 = 1 confirm an excellent fit, indicating a strong, nonlinear dependence of Ti on CV. These results validate design strategies that recommend increased cover for enhanced durability and align with durability code guidelines and past research, such as that of [48]. The performance gap between NC and HPC also underscores the benefit of using SCMs in chloride-prone environments.
Table 2 presents regression-based polynomial equations that estimate Ti as a function of CV for both NC and HPC under two chloride exposure scenarios. The equations reveal a nonlinear relationship between cover depth and Ti, with all the models showing an excellent fit to the data (as illustrated in Figure 7, with R2 = 1).
The equations indicate that higher surface chloride concentrations (Cs = 6 kg/m3) significantly reduce Ti for both NC and HPC. Comparatively, the HPC models have higher coefficients, showing a steeper increase in Ti with increasing cover depth, reflecting the lower diffusivity and better corrosion resistance of the HPC. For example, the HPC equation at Cs = 3 kg/m3 has nearly double the quadratic coefficient of the NC counterpart, emphasizing the greater effectiveness of HPC in delaying corrosion even in aggressive chloride environments. These equations offer a practical tool for durability-based design, enabling engineers to estimate the expected service life and optimize cover depths according to the material type and exposure severity, as supported by earlier probabilistic modelling studies, such as those by Lounis et al. [44].

3.2.3. Lag Time Due to Chloride Concentration Differences

“Lag time” refers to the delay in the onset of corrosion initiation when concrete is exposed to lower chloride concentrations than in more aggressive environments. It quantifies the additional time gained before corrosion begins under less severe chloride exposure. The lag time, denoted as TLag, was calculated via Equation (15):
Ti,Lag = Ti,low Ti,high
where Ti,Lag is the lag time in corrosion initiation due to the application of various chloride concentrations (in years); Ti,low is the time of corrosion initiation due to the application of low chloride concentrations (in years); and Ti,high is the time of corrosion initiation due to the application of high chloride concentrations (in years).
Figure 8 shows the lag time in corrosion initiation due to different chloride concentrations for both normal and high-performance concrete RC bridge decks.
The lag time increases nonlinearly as the concrete cover thickness increases. For NC and Ti, the lag ranged from 4.6 years at 35 mm cover to 21 years at 75 mm cover. Moreover, for HPC and Ti, the lag ranged from 9 years at 35 mm cover to 42 years at 75 mm cover. These results highlight the significant impact of the concrete cover thickness on delaying corrosion initiation, particularly for HPC (Figure 8).
Figure 8 illustrates how increasing the CV results in a longer lag time before the onset of corrosion, particularly when comparing scenarios with different chloride concentrations. The lag time here reflects the additional protection provided by increased cover depth in slowing chloride ingress. The HPC consistently outperforms the NC across all cover depths, with a lag time advantage ranging from approximately 8 to over 25 years, depending on the cover thickness. This underscores the superior resistance of HPC to chloride diffusion due to its denser microstructure. The relationship between lag time and CV is nonlinear, suggesting diminishing returns at greater cover depths—a trend that is consistent with diffusion theory. These results are in line with studies by Andrade et al. [11] and Berke and Hicks [57], who emphasized the critical role of cover thickness in prolonging the service life of reinforced concrete elements. These findings reinforce the importance of designing adequate covers on the basis of the environmental exposure class and concrete type, especially in structures subject to chloride-laden environments such as marine and deicing conditions.

3.2.4. Cracked vs. Uncracked Concrete Performance

Like in uncracked concrete, Ti increases nonlinearly with increasing concrete cover thickness. This study evaluated an RC bridge deck subjected to a chloride concentration of 6 kg/m3, with a crack width of 0.25 mm, which is the maximum allowable crack width for an RC bridge deck subjected to deicing salts, as per the CHBDC, as illustrated in Figure 9a. For cracked concrete, Ti increased from 1.2 years to 11 years for concrete without SCMs and from 1.4 years to 14 years for concrete with SCMs as the cover increased from 30 mm to 75 mm (Figure 9a). In contrast, for the uncracked concrete, Ti increased from 2.8 years to 17.5 years for the concrete without the SCM and from 4.3 years to 26.6 years for the concrete with the SCM (Figure 9b).
These findings indicate that the HPC with SCM provides superior durability, significantly delaying corrosion initiation compared with that of normal concrete. Cracked concrete initiates corrosion earlier than does uncracked concrete, even with the same cover thickness. The relationship between the concrete cover thickness (30 mm to 75 mm) and Ti follows a second-degree polynomial function for cracked and uncracked concrete, regardless of SCM inclusion (see Figure 9 and Table 3).
Table 3 presents polynomial equations that estimate the time to corrosion initiation, Ti, as a function of CV for both cracked (w = 0.25 mm) and uncracked reinforced concrete, with and without SCMS. The results highlight several important trends:
  • Compared with the uncracked concrete, the cracked concrete has substantially lower Ti values across all the cases. For example, in SCM-modified concrete, cracking reduces the quadratic coefficient from 0.0047 to 0.0037 and introduces a significant negative linear term, reflecting the sharp decline in corrosion resistance due to cracking.
  • The presence of SCMs enhances durability in both cracked and uncracked cases, with higher polynomial coefficients and intercepts. This is consistent with the literature (e.g., Cheng et al. [17], Hassan et al. [46]), which shows that SCMs reduce pore connectivity and chloride ingress.
  • For concrete without SCMs, the Ti values are the lowest, particularly under cracked conditions, emphasizing the compounding negative effects of cracking and the absence of SCMs on long-term durability.
These equations are practical predictive tools for engineers evaluating service life under realistic cracking scenarios. These findings further reinforce the necessity of SCM use and crack control in chloride-exposed environments for extending the lifespan of RC structures.
Figure 9a,b shows that cracks sharply reduce Ti. For a 0.25 mm crack width (CHBDC limit), Ti in the NC decreased to ~11 years at a 75 mm cover, whereas it was ~18 years for the uncracked concrete. The HPC had Ti values of ~14 years (cracked) and ~26.6 years (uncracked).
The effect of SCM use is pronounced in both cases, with SCM-enhanced concrete outperforming its non-modified counterpart by more than 30%. These findings align with those of [17,46,63], who documented the effectiveness of SCMs in reducing chloride permeability and the critical influence of cracks on accelerating deterioration. The figure confirms that SCMs and adequate cover ensure long-term durability in chloride-prone environments, especially where cracking is likely.

3.2.5. Lag Time: Cracked vs. Uncracked

The lag time in corrosion initiation (Ti,Lag) represents the difference in initiation times between uncracked and cracked concrete with a crack width of 0.25 mm for the same concrete cover. Figure 10 illustrates the variation in TLag for different concrete types and cover thicknesses. The lag time increases linearly with cover depth, indicating that a thicker cover provides proportionally greater protection, regardless of the type of concrete. Figure 10 shows that the presence of a crack reduces Ti by 1.6–6.5 years in NC and 3–12.6 years in HPC as the cover increases from 30 mm to 75 mm. This trend reinforces the importance of strict crack width control, even when durable materials such as HPC are used.
These results emphasize that cracks significantly accelerate corrosion initiation, even when SCMs are incorporated. Furthermore, the gap between cracked and uncracked concrete widened with increasing concrete cover thickness, reinforcing the importance of controlling crack formation in RC bridge decks.

3.3. Effect of Crack Width on Chloride Diffusion and Corrosion Initiation

3.3.1. Influence of the Crack Width on the Diffusion Coefficient

The diffusion coefficient Dcc for cracked RC bridge decks was calculated via Equation (11) (see Figure 11). In both Figure 11a (with the SCM) and Figure 11b (without the SCM), the diffusion coefficient increases linearly with crack width (CW), confirming that even small cracks (e.g., 0.1 mm) significantly impact chloride transport, especially at lower cover depths. For any given crack width, a higher concrete cover reduces Dcc, as shown by the downwards shift in lines from CV = 40 mm to 70 mm. This highlights the combined benefit of both crack control and sufficient cover thickness in mitigating chloride ingress. Compared with the concrete without SCMs, the SCM-modified concrete (Figure 11a) consistently has lower diffusion values across all the conditions (Figure 11b), indicating its superior ability to limit chloride transport even in the presence of cracking. Moreover, polynomial equations were derived to quantify the relationship between CW and Dcc for various concrete covers and types, as presented in Table 4. These results align with those of Djerbi et al. [18] and Wang et al. [29], who emphasized the exponential influence of crack width on diffusivity and the mitigating effect of SCMs. The chart reinforces that crack width and cover depth must be considered simultaneously in design and that SCMs significantly improve cracked concrete durability, especially in aggressive environments such as marine or deicing zones.

3.3.2. Time to Corrosion Initiation Based on Crack Width

The impact of various crack widths (CWs) (0.1 mm to 0.35 mm) on Ti was evaluated for RC bridge decks exposed to 6 kg/m3 chloride. The study analyzed different concrete covers (40 mm, 60 mm, and 70 mm) for concrete with and without SCM, as illustrated in Figure 12. In both cases, with and without the SCM, Ti decreases nonlinearly with increasing CW, with the steepest decline observed at lower cover depths (e.g., CV = 40 mm). This reflects the heightened vulnerability of shallower covers to crack-induced chloride ingress. For a 70 mm cover, increasing the crack width from 0.1 mm to 0.35 mm reduced Ti from 12.2 years to 8.1 years for concrete without SCM and from 17 years to 10 years for concrete with SCM. The crack width of 0.35 mm reduced Ti by a factor of 0.66 for the concrete without the SCM and 0.59 for the concrete with the SCM. These findings indicate that larger cracks significantly accelerate corrosion initiation, even in HPC with SCM. Figure 12 and Table 5 further illustrate that the crack width and corrosion initiation time relationship follows a second-degree polynomial function with an R2 value of 0.999, confirming a perfect fit for concrete with and without SCM.
The quadratic form of the equations shown in Table 5 reflects a nonlinear deterioration process, with Ti decreasing as CW increases, which is consistent with the observed trends in Figure 12. At each cover level, concrete with SCMs consistently shows greater interceptions and a less severe decline, confirming its greater resistance to chloride ingress even under cracking. For example, at CV = 70 mm and CW = 0.25 mm, the SCM model predicts a significantly higher Ti than the non-SCM model because of both higher constant terms and reduced negative coefficients. The equations demonstrate how increased cover depth attenuates the negative effect of cracking, particularly for SCM-modified concrete. For example, at CV = 40 mm, the Ti values decrease quickly with crack width, but at 70 mm, the decrease is more gradual.

3.3.3. Practical Implications for Cover Design and SCM Use

The findings from this study underscore the critical importance of controlling crack width in both normal and high-performance concrete to preserve durability in chloride-exposed environments. Even when SCMs are incorporated, cracks significantly accelerate chloride ingress, reducing the time to corrosion initiation by up to 40% for a 0.25 mm crack, highlighting the limitations of relying solely on material performance. The use of SCMs, however, consistently enhances durability by lowering the diffusion coefficient and mitigating the severity of crack-induced corrosion. Additionally, the time to corrosion initiation exhibited a second-degree polynomial relationship with both crack width and cover depth. These equations, validated by regression analysis with excellent predictive fit (R2 ≈ 1), provide engineers with practical tools to estimate service life and optimize cover design on the basis of material type and exposure severity. These results align with prior research by Djerbi et al. [18] and Berke and Hicks [57], who emphasized the exponential impact of cracks on chloride transport and the vital role of SCMs in enhancing durability. Overall, a combined approach of SCM selection and robust crack control measures is essential for designing climate-resilient RC infrastructures.

4. Conclusions

This study developed a probabilistic modelling framework to assess the time to chloride-induced corrosion initiation in RC bridge decks, considering the effects of crack width, SCMs, concrete cover depth, and long-term climate change projections (RCP2.6 and RCP8.5) for Toronto. Monte Carlo simulations were used to quantify the influence of variable environmental and structural parameters on the PCI.
The following key findings were observed:
  • The crack width significantly accelerates corrosion initiation. For a 0.25 mm crack (maximum allowed by CHBDC for exposure to deicing salts), the corrosion initiation time is reduced by 34–41%, with a greater reduction in unmodified normal concrete (NC) than in SCM-enhanced concrete.
  • High-performance concrete (HPC) with SCMs offers superior durability, nearly doubling the corrosion initiation time compared with that of NC under identical exposure. HPC also demonstrates reduced sensitivity to humidity due to its dense microstructure.
  • Temperature has a dominant influence on the PCI. Under the RCP8.5 scenario, projected increases in maximum temperatures (40–45 °C) sharply reduce service life in both NC and HPC. In contrast, relative humidity (60–75%) had a minimal effect on the HPC but significantly worsened the PCI in NC.
  • Both the crack width and cover depth affect the PCI in a nonlinear manner. The corrosion initiation time follows a second-degree polynomial relationship with respect to both parameters, enabling accurate service life estimation. Increased cover improves durability but shows diminishing returns beyond 70 mm.
  • Polynomial equations developed for various parameters (e.g., crack width, chloride concentration, and SCM use) provide a scalable tool for predicting corrosion initiation, offering actionable insights for engineers and code developers.

5. Study Limitations

While this study provides a comprehensive probabilistic framework for assessing chloride-induced corrosion in RC bridge decks, several limitations exist. The model relies on literature-based parameters and validated simulations without direct field calibration, which may affect site-specific accuracy. The analysis focused solely on chloride-induced corrosion, excluding other deterioration mechanisms like carbonation, freeze–thaw cycles, and mechanical loading effects. Assumptions of uniform crack geometry and environmental exposure also simplify the complex conditions found in real bridges.
Future Work: Future studies should incorporate long-term field monitoring data to enhance model accuracy across diverse climates and structures. Expanding the framework to include combined degradation mechanisms and exploring the performance of advanced materials, such as new SCMs and low-carbon binders, will support sustainable infrastructure design. Additionally, modelling stochastic crack morphology and dynamic environmental loads will improve the realism and applicability of durability predictions. Despite these limitations, the findings of this study offer valuable insights that can inform design improvements, material selection, and maintenance strategies for enhancing the durability of RC bridge infrastructure under future climate conditions.

6. Practical Implications

The findings of this study offer several practical implications for the design, maintenance, and management of RC bridge infrastructure, particularly under future climate change scenarios:
  • Durability-Based Design Updates: The study highlights the need to revise current crack width limits and concrete cover requirements in bridge design codes, such as the CHBDC, to account for accelerated chloride ingress under elevated temperatures and humidity projections.
  • Material Selection Strategies: The superior performance of HPC observed under cracked conditions and variable climates suggests that incorporating SCMs such as silica fume or fly ash should be encouraged in future infrastructure projects to enhance durability and service life.
  • Crack Control as a Priority: The strong influence of crack width on corrosion initiation underscores the importance of stringent crack control measures during construction and inspection. Design specifications should prioritize minimizing crack formation, particularly in regions exposed to deicing salts and climate change effects.
  • Climate-Resilient Infrastructure Planning: By integrating probabilistic modelling with climate projections (RCP2.6 and RCP8.5), this study provides a scalable framework for evaluating the long-term performance of RC bridge decks. These tools can assist infrastructure owners and policymakers in prioritizing rehabilitation strategies and allocating maintenance resources more effectively.
  • Future Asset Management Systems: The probabilistic models developed can be incorporated into bridge management systems to better predict future maintenance needs, optimize intervention timing, and reduce life-cycle costs associated with corrosion-induced deterioration.
These practical implications emphasize the need for a proactive approach to infrastructure resilience that incorporates both material innovation and climate-adaptive design strategies.

Author Contributions

Conceptualization: L.A.; methodology: M.H.; software: M.H.; validation: M.H. and L.A.; formal analysis: M.H.; investigation: L.A.; resources: M.H.; data curation: M.H. and L.A.; writing—original draft preparation: L.A. and M.H.; writing—review and editing: L.A.; visualization: L.A.; supervision: L.A.; project administration: L.A.; funding acquisition: L.A. All authors have read and agreed to the published version of the manuscript.

Funding

This project was funded by the National Research Council of Canada under the Methodologies and Guidelines for Design and Evaluation of Highway Bridge in a Changing Climate Project managed by NRC (121491807RP0457).

Data Availability Statement

The authors confirm that the data supporting the findings of this study are available within the article. However, additional data can be provided upon reasonable request.

Conflicts of Interest

The authors declare no conflicts of interest.

References

  1. Uhlig, H. Corrosion, and Corrosion Control; John Wiley & Sons Inc.: Hoboken, NJ, USA, 1963; Volume 67. [Google Scholar] [CrossRef]
  2. Hansson, C.M. An introduction to corrosion of engineering materials. In Corrosion of Steel in Concrete; Poursaee, A., Ed.; Elsevier: Amsterdam, The Netherlands, 2016. [Google Scholar]
  3. Revie, R.W.; Uhlig, H.H. Corrosion, and Corrosion Control: An Introduction to Corrosion Science and Engineering; John Wiley & Sons: Hoboken, NJ, USA, 2008; ISBN 9780470277270. [Google Scholar] [CrossRef]
  4. Mehta, P.K.; Monteiro, P.J.M. Concrete Microstructure, Properties and Materials; McGraw Hill Professional: New York, NY, USA, 2006; pp. 177–178. [Google Scholar]
  5. Qu, F.; Zhang, J.; Liu, G.; Zhao, S. Experimental Study on Chloride Ion Diffusion in Concrete Affected by Exposure Conditions. Materials 2022, 15, 2917. [Google Scholar] [CrossRef]
  6. Bier, T.; Kropp, J.; Hilsdorf, H. Formation of silica gel during carbonation of cementitious systems containing slag cement. In Proceedings of the 3rd International Conference Fly Ash, Silica Fume, Slag and Natural Pozzolans in Concrete, Trondheim, Norway, 18–23 June 1989; American Concrete Institute: Farmington Hills, MI, USA, 1989. [Google Scholar]
  7. Balestra, C.E.T.; Reichert, T.A.; Pansera, W.A.; Savaris, G. Evaluation of chloride ion penetration through concrete surface electrical resistivity of field naturally degraded structures present in marine environment. Constr. Build. Mater. 2020, 230, 116979. [Google Scholar] [CrossRef]
  8. Tuutti, K. Corrosion of Steel in Concrete. Ph.D. Thesis, Division of Building Materials, Swedish Cement and Concrete Research Institute, Stockholm, Sweden, 1982; p. 469. [Google Scholar]
  9. López, W.; González, J. Influence of the degree of pore saturation on the resistivity of concrete and the corrosion rate of steel reinforcement. Cem. Concr. Res. 1993, 23, 368–376. [Google Scholar] [CrossRef]
  10. Al-Sulaimani, G.J.; Kaleemullah, M.; Basunbul, I.A. Rasheeduzzafar. Influence of Corrosion and Cracking on Bond Behavior and Strength of Reinforced Concrete Members. ACI Struct. J. 1990, 87, 220–231. [Google Scholar] [CrossRef]
  11. Andrade, C.; Alonso, C. Durability design based on models for corrosion rates. In The Modelling of Microstructure and Its Potential for Studying Transport Properties and Durability; Springer: Dordrecht, The Netherlands, 1996; pp. 473–492. [Google Scholar]
  12. Amleh, L.; Mirza, S. Corrosion Influence on Bond between Steel and Concrete. ACI Struct. J. 1999, 96, 415–423. [Google Scholar] [CrossRef]
  13. Cabrera, J.G.; Ghoddoussi, P. The Effect of Reinforcement Corrosion on the Strength of the Steel/Concrete Bond. In Proceedings of the International Conference Bond in Concrete from Research to Practice: Proceedings Topics, Riga, Latvia, 15–17 October 1992; CEB: Mumbai, India, 2001; pp. 11–24. [Google Scholar]
  14. Amleh, L.; Ghosh, A. Modeling the effect of corrosion on bond strength at the steel-concrete interface with finite-element analysis. Can. J. Civ. Eng. 2006, 33, 673–682. [Google Scholar] [CrossRef]
  15. Lothenbach, B.; Scrivener, K.; Hooton, R.D. Supplementary cementitious materials. Cem. Concr. Res. 2011, 41, 1244–1256. [Google Scholar] [CrossRef]
  16. Thomas, M.D.A.; Hooton, R.D.; Scott, A.; Zibara, H. The effect of supplementary cementitious materials on chloride binding in hardened cement paste. Cem. Concr. Res. 2012, 42, 1–7. [Google Scholar] [CrossRef]
  17. Cheng, S.; Shen, L.; Chen, W.; Zhu, H.; You, P.; Chen, L. Mechanical Properties and Chloride Penetration Resistance of Concrete Combined with Ground Granulate Blast Furnace Slag and Macro Synthetic Fiber. Materials 2024, 17, 4735. [Google Scholar] [CrossRef]
  18. Djerbi, A.; Bonnet, S.; Khelidj, A.; Baroghel-bouny, V. Influence of traversing crack on chloride diffusion into concrete. Cem. Concr. Res. 2008, 38, 877–883. [Google Scholar] [CrossRef]
  19. Andrade, C.; Castillo, A. Evolution of reinforcement corrosion due to climatic variations. Mater. Corros. 2003, 54, 379–386. [Google Scholar] [CrossRef]
  20. Yuan, Y.; Jiang, J. Prediction of temperature response in concrete in a natural climate environment. Constr. Build. Mater. 2011, 25, 3159–3167. [Google Scholar] [CrossRef]
  21. Lindvall, A. Duracrete- Probabilistic Performance-Based Durability Design of the Concrete Structure, 1st ed.; Chalmers University of Technology: Gothenburg, Sweden, 1999. [Google Scholar]
  22. Bastidas-Arteaga, E.; Chateauneuf, A.; Sanchez-Silva, M.; Bressolette, P.; Schoefs, F. Influence of weather and global warming in chloride ingress into concrete: A stochastic approach. Struct. Saf. 2010, 32, 238–249. [Google Scholar] [CrossRef]
  23. Yuan, Q.; Shi, C.; De Schutter, G.; Audenaert, K. Effect of temperature on the transport of chloride ions in concrete. In Concrete Repair, Rehabilitation, and Retrofitting II; Taylor & Francis Group: London, UK, 2008; pp. 159–160. [Google Scholar]
  24. Maeda, S.; Takewaka, K.; Yamaguchi, T. Quantification of Chloride Diffusion Process into Concrete Under Marine Environment. Proc. Jpn. Soc. Civ. Engineers 2004, 63, 109–120. [Google Scholar]
  25. Zhang, J.; Gao, Y.; Han, Y. Interior humidity of concrete under dry-wet cycles. J. Mater. Civ. Eng. 2012, 24, 289–298. [Google Scholar] [CrossRef]
  26. Akduman, S.; Öztürk, H. Effect of Reinforcement Corrosion on Structural Behavior in Reinforced Concrete Structures According to Initiation and Propagation Periods. Buildings 2024, 14, 4026. [Google Scholar] [CrossRef]
  27. Liu, X.; Li, H.; Qi, M.; Yang, Y.; Zhu, Z.; Yu, Z. Experimental Study on the Influence of Transverse Crack on Chloride Ingress in Concrete Slab Track of High-Speed Railway. Materials 2023, 16, 3524. [Google Scholar] [CrossRef]
  28. Wang, X.-Y.; Zhang, L.-N. Simulation of Chloride Diffusion in Cracked Concrete with Different Crack Patterns. Adv. Mater. Sci. Eng. 2016, 2016, 1075452. [Google Scholar] [CrossRef]
  29. Wang, Q.; Zhang, G.; Tong, Y.; Gu, C. A Numerical Study on Chloride Diffusion in Cracked Concrete. Crystals 2021, 11, 742. [Google Scholar] [CrossRef]
  30. Félix, E.F.; Falcão, I.d.S.; dos Santos, L.G.; Carrazedo, R.; Possan, E. A Monte Carlo-Based Approach to Assess the Reinforcement Depassivation Probability of RC Structures: Simulation and Analysis. Buildings 2023, 13, 993. [Google Scholar] [CrossRef]
  31. Zhang, Q.; Guo, X.; Zhao, H.; Hu, D.; Gu, X.; Li, R. A probabilistic stress-strain relationship model for steel bars including the non-uniform corrosion effects in chloride environments. Case Stud. Constr. Mater. 2025, 22, e04262. [Google Scholar] [CrossRef]
  32. Shao, W.; He, X.; Shi, D.; Zhu, W. Prediction of Crack Width in RC Piles Exposed to Local Corrosion in Chloride Environment. Materials 2023, 16, 6403. [Google Scholar] [CrossRef]
  33. Takewaka, K.; Yamaguchi, T.; Maeda, S. Simulation model for deterioration of concrete structures due to chloride attack. J. Adv. Concr. Technol. 2005, 1, 139–146. [Google Scholar] [CrossRef]
  34. Amleh, L.; Hassan, M.; Hussein, L. Influence of Climate Change on the Probability of Chloride-Induced Corrosion Initiation for RC Bridge Decks Made of Geopolymer Concrete. Sustainability 2024, 16, 8200. [Google Scholar] [CrossRef]
  35. IPCC. Climate Change 2021: The Physical Science Basis. Contribution of Working Group I to the Sixth Assessment Report of the Intergovernmental Panel on Climate Change; Cambridge University Press: Cambridge, UK, 2021. [Google Scholar]
  36. Bush, E.; Lemmen, D.S. (Eds.) Canada Changing Climate Report 2019; CCCR: Ottawa, ON, Canada, 2019. [Google Scholar]
  37. Pan, Z.; Li, T.; Ruan, X. Effect of Seasonal Characteristics of Temperature and Relative Humidity on Chloride Diffusion Process in Concrete: A Preliminary Theoretical Study. Sustainability 2019, 11, 6330. [Google Scholar] [CrossRef]
  38. Wang, X.; Stewart, M.G.; Nguyen, M.N. Impact of Climate Change on Corrosion and Damage to Concrete Infrastructure in Australia. Clim. Change 2011, 110, 941–957. [Google Scholar] [CrossRef]
  39. Fode, T.A.; Chande Jande, Y.A.; Kivevele, T. Effects of different supplementary cementitious materials on durability and mechanical properties of cement composite—Comprehensive review. Heliyon 2023, 9, e17924. [Google Scholar] [CrossRef] [PubMed]
  40. Raghav, M.; Park, T.; Yang, H.-M.; Lee, S.-Y.; Karthick, S.; Lee, H.-S. Review of the Effects of Supplementary Cementitious Materials and Chemical Additives on the Physical, Mechanical and Durability Properties of Hydraulic Concrete. Materials 2021, 14, 7270. [Google Scholar] [CrossRef] [PubMed]
  41. Saetta, A.V.; Scotta, R.V.; Vitaliani, R.V. Analysis of chloride diffusion into partially saturated concrete. ACI Mater. J. 1993, 90, 441–451. [Google Scholar]
  42. Page, C.L.; Short, N.R.; El Tarras, A. Diffusion of chloride ions in hardened cement pastes. Cem. Concr. Res. 1981, 11, 395–406. [Google Scholar] [CrossRef]
  43. Bazant, Z.P.; Najjar, L.J. Drying of concrete as a nonlinear diffusion problem. Cem. Concr. Res. 1971, 1, 461–473. [Google Scholar] [CrossRef]
  44. Lounis, Z.; Saassouh, B.; Zhang, J. Probability-Based Modeling of Chloride-Induced Corrosion in Concrete Structures Including Parameters Correlation. In Applications of Statistics and Probability in Civil Engineering; National Research Council Canada: Ottawa, ON, Canada, 2011; pp. 1206–1212. [Google Scholar]
  45. Alinaghimaddah, S.; Shayanfar, M.A.; Bagha, M.G. Effect of distance from the sea on reinforced concrete chloride corrosion probability. AUT J. Civ. Eng. 2020, 4, 199–208. [Google Scholar] [CrossRef]
  46. Hassan, M.; Amleh, L.; Othman, H. Effect of Different Cement Content and Water Cement Ratio on Carbonation Depth and Probability of Carbonation Induced Corrosion for Concrete. Cem. Wapno Beton 2022, 27, 126–143. [Google Scholar] [CrossRef]
  47. Hassan, M.; Amleh, L. Influence of Climate Change on Probability of Carbonation-Induced Corrosion Initiation. Period. Polytech. Civ. Eng. 2024, 68, 57–67. [Google Scholar] [CrossRef]
  48. Saassouh, B.; Lounis, Z. Probabilistic modeling of chloride-induced corrosion in concrete structures using first- and second-order reliability methods. Cem. Concr. Compos. 2012, 34, 1082–1093. [Google Scholar] [CrossRef]
  49. Hassan, M.; Amleh, L.; Hussein, L. Projection of the Carbonation Depths and its Probability of Corrosion Initiation for the Uncracked and Cracked Concrete. Int. Rev. Civ. Eng. (IRECE) 2024, 15, 381–398. [Google Scholar] [CrossRef]
  50. Kroese, D.P.; Brereton, T.; Taimre, T.; Botev, Z.I. Why the Monte Carlo method is so important today. Wiley Interdiscip. Rev. Comput. Stat. 2014, 6, 386–392. [Google Scholar] [CrossRef]
  51. Choi, S.K.; Grandhi, R.V.; Canfield, R.A. Reliability-Based Structural Design; Springer: New York, NY, USA, 2007. [Google Scholar]
  52. Sobol, I.M. A Primer for the Monte Carlo Method; CRC Press: Boca Raton, FL, USA, 1994. [Google Scholar]
  53. Kalos, M.H.; Whitlock, P.A. Monte Carlo Methods, 2nd ed.; John Wiley and Sons: New York, NY, USA, 2008. [Google Scholar]
  54. Costa, A.; Appleton, J. Chloride penetration into concrete in the marine environment Part I: Main parameters affecting chloride penetration. Mater. Struct. 1999, 32, 252–259. [Google Scholar] [CrossRef]
  55. CSA S6:19; Canadian Highway Bridge Design Code. CSA Group: Toronto, ON, Canada, 2019.
  56. Weyers, R.; Prowell, B.; Sprinkel, M.; Vorster, M. Concrete Bridge Protection, Repair, and Rehabilitation Relative to Reinforcement Corrosion: A Methods Application Manual; SHRP-S-360; National Research Council: Ottawa, ON, Canada, 1993. [Google Scholar]
  57. Berke, N.; Hicks, M. Predicting chloride profiles in concrete. Corrosion 1994, 50, 234–239. [Google Scholar] [CrossRef]
  58. Amey, S.; Johnson, D.; Miltenberger, M.; Farzam, K. Predicting the service life of concrete marine structures: An environmental methodology. ACI Struct. J. 1998, 95, 205–214. [Google Scholar] [CrossRef]
  59. Bentz, E. Probabilistic modeling of service life for structures subjected to chlorides. ACI Mater. J. 2003, 100, 391–397. [Google Scholar] [CrossRef]
  60. Lounis, Z.; Daigle, L. Reliability-based decision support tool for life cycle design and management of highway bridge decks. In Proceedings of the Annual Conference of the Transportation Association of Canada (TAC), Toronto, ON, Canada, 21–24 September 2008; pp. 1–19. [Google Scholar]
  61. Rodriguez, O.G.; Hooton, D.R. Influence of cracks on chloride ingress into concrete. ACI Mater. J. 2003, 100, 120–126. [Google Scholar]
  62. Lounis, Z.; Mirza, M.S. Reliability-based Service Life Prediction of Deteriorating Concrete Structures. In Concrete Under Severe Conditions; Banthia, N., Ed.; National Research Council: Ottawa, ON, Canada, 2001; pp. 965–972. [Google Scholar]
  63. Ghoddousi, P.; Salehi, A.M.; Shirzadi Javid, A.A.; Etebari Ghasbeh, M.A.; Sajjadi, S. Evaluation of Concrete Bulk Resistivity as the Key Performance Index for Chloride Transport in Concrete and Rate of Hydration. Int. J. Civ. Eng. 2022, 21, 507–522. [Google Scholar] [CrossRef]
Figure 1. Projection of annual maximum temperature for Toronto under different RCPs.
Jcs 09 00242 g001
Figure 2. Influence of the maximum temperature diffusion factor over time at different RCPs for Toronto city.
Jcs 09 00242 g002
Figure 3. Effect of the relative humidity on the diffusion factor.
Jcs 09 00242 g003
Figure 4. Validation of the recent chloride-induced corrosion initiation model for RC bridge decks made with (a) normal concrete and (b) high-performance concrete, compared against models by Saassouh and Lounis [48] and Lounis et al. [44], respectively.
Jcs 09 00242 g004
Figure 5. Impact of climatic conditions on the PCI models for RC bridge decks with 70 mm concrete covers at year 50, (a) Maximum temperature and (b) Relative humidity.
Jcs 09 00242 g005
Figure 6. Relationship between crack width and diffusion coefficient in cracked concrete.
Jcs 09 00242 g006
Figure 7. Time to corrosion initiation for different concrete covers and chloride concentrations for the uncracked concrete, (a) Normal Concrete and (b) High-performance concrete.
Jcs 09 00242 g007
Figure 8. Effect of the concrete cover on the lag time in corrosion initiation due to different chloride concentrations in the uncracked RC bridge deck.
Jcs 09 00242 g008
Figure 9. Effect of the concrete cover on the corrosion initiation time, (a) cracked concrete (w = 0.25 mm) and (b) Uncracked concrete.
Jcs 09 00242 g009
Figure 10. Lag in corrosion initiation between cracked concrete (w = 0.25 mm) and uncracked concrete at different cover thicknesses.
Jcs 09 00242 g010
Figure 11. The diffusion coefficient for cracked concrete of the RC bridge deck versus various crack widths at different concrete covers, (a) concrete with SCM and (b) concrete without SCM.
Jcs 09 00242 g011
Figure 12. Effect of crack width on the corrosion initiation time.
Jcs 09 00242 g012
Table 1. Statistical properties of random variables for RC bridges subjected to chlorides.
Random VariablesMean Value (μ)Coefficient of Variation (COV)Distribution
Chloride Concentration (Cs) (kg/m3)630%Log-normal
Concrete Cover (x) (mm)7020%
Chloride threshold (Cth) (kg/m3)0.720%
D (m2/s) for NC1.27 × 10−1225%
D (m2/s) for HPC6.342 × 10−1325%
Table 2. Polynomial Equations (with R2 = 1) for Predicting Ti for Uncracked Concrete.
Concrete TypeCs = 3 kg/m3Cs = 6 kg/m3
NCTi = 0.0088 (CV)2 – 7 × 10⁻⁶(CV) + 0.0002Ti = 0.0051 (CV)2 − 0.0015 × (CV) + 0.0629
HPCTi = 0.0176 (CV)2 – 8 × 10⁻⁶(CV) + 0.0002Ti = 0.0102 (CV)2 − 2 × 10⁻⁶(CV) + 7 × 10⁻⁵
Table 3. Polynomial equations (with R2 = 1) for predicting Ti in cracked and uncracked concrete.
Concrete TypeCracked Concrete (w = 0.25 mm)Uncracked Concrete
SCMTi = 0.0037 (CV)2 − 0.1118 (CV) + 1.4843Ti = 0.0047 (CV)2 − 5 × 10⁻⁷ (CV) + 4 × 10⁻⁵
without SCMTi = 0.0027 (CV)2 − 0.0677 (CV) + 0.8386Ti = 0.0031 × (CV)2 + 2 × 10⁻⁶ × (CV) – 7 × 10⁻⁵
Table 4. Polynomial equations (with R2 = 1) for predicting the diffusion coefficient for cracked concrete (Dcc) at various crack widths.
Concrete Cover (mm)Types of Concrete Used for the RC Bridge Deck
Concrete with SCMConcrete Without SCM
40Dcc = −8 × 10⁻²⁵·(CW)2 + 8 × 10⁻¹²·(CW) + 1 × 10⁻¹²Dcc = −4 × 10⁻²⁵ (CW)2 + 8 × 10⁻¹² (CW) + 2 × 10⁻¹²
50Dcc = 4 × 10⁻²⁵ (CW)2 + 7 × 10⁻¹² (CW) + 1 × 10⁻¹²Dcc = 7 × 10⁻¹² × (CW) +2 × 10⁻¹²
60Dcc = 6 × 10⁻¹² (CW) + 1x10⁻¹²Dcc = 4 × 10⁻²⁵ (CW)2 + 6 × 10⁻¹² (CW) +2 × 10⁻¹²
70Dcc = 4 × 10⁻²⁵ (CW)2 + 5 × 10⁻¹² (CW) + 1 × 10⁻¹²Dcc = −4 × 10⁻²⁵ (CW)2 + 5 × 10⁻¹² (CW) +2 × 10⁻¹²
Table 5. Polynomial equations (with R2 = 0.99) for predicting Ti in cracked vs. uncracked concrete.
Concrete Cover (mm)Without SCMWith SCM
40Ti = 12.638(CW)2 − 11.531(CW) + 4.5521Ti = 23.875(CW)2 − 19.705(CW) + 6.3891
60Ti = 21.821(CW)2 − 22.149(CW) + 10.665Ti = 45.579(CW)2 − 40.709(CW) +15.424
70Ti = 26.179(CW)2 − 27.910(CW) + 14.675Ti = 56.836(CW)2 − 52.681(CW) + 21.430
The CW is the crack width, which ranges from 0.1 mm to 0.35 mm, and Ti is the time of corrosion initiation (years).
Disclaimer/Publisher’s Note: The statements, opinions and data contained in all publications are solely those of the individual author(s) and contributor(s) and not of MDPI and/or the editor(s). MDPI and/or the editor(s) disclaim responsibility for any injury to people or property resulting from any ideas, methods, instructions or products referred to in the content.

