Article

Performance Evaluation of Current Design Models in Predicting Shear Resistance of UHPC Girders

Civil Engineering Department, Faculty of Engineering, The Hashemite University, Zarqa 13133, Jordan
*
Author to whom correspondence should be addressed.
J. Compos. Sci. 2025, 9(5), 211; https://doi.org/10.3390/jcs9050211
Submission received: 21 March 2025 / Revised: 22 April 2025 / Accepted: 24 April 2025 / Published: 27 April 2025

Abstract

:
This manuscript delivers a comprehensive evaluation of five different ultra-high-performance concrete (UHPC) shear resistance models: FHWA-HRT-23-077 (2023), ePCI report (2021), French Standard NF-P-18-710 (2016), Canadian Standards A23.3-04 (2004), and Modified Eurocode2/German DAfStb (2023). The models differ in accounting for the steel fiber and shear reinforcement contribution and determining the angle of inclination of the diagonal compression strut. The evaluation was carried out using an experimental database of 198 UHPC specimens and focused on accuracy, conservatism, and ease of use for each considered model. The database included beams with prestressed and steel reinforcement, different shear reinforcement ratios, and a wide range of geometrical and material properties. In order to apply the FHWA method, a utilization tensile stress (ft,loc) prediction equation was developed. Generally, the FHWA method showed superior performance to the other models in terms of statistical measures and consistent prediction conservatism across variable ranges. Although the ePCI methods yielded the highest conservatism, it can be said that the ePCI, AFGC, and CSA methods showed similar behavior with different degrees of conservatism. The DAfStb method showed the lowest prediction accuracy and the greatest scatter of data. Except for the FHWA method, all methods showed a reduction in conservatism at a high transverse reinforcement ratio.

1. Introduction

Ultra-high-performance concrete (UHPC) has been a research subject for over two decades [1]. UHPC is a dense concrete mixture of a high amount of cement, fine aggregate, steel fibers, and reactive powder additives such as pozzolana, fly ash, superplasticizer, and silica fume [2,3]. The water–cement ratio usually ranges between 0.15 and 0.25 [4]. This mixture results in improved properties comprising high post-cracking tensile strength [1], high compressive strength, high ductility, and less wide cracks [3]. The UHPC mixture can be designed to achieve strain-hardening performance under tension [5]. The tensile behavior primarily depends on the fibers’ volume fraction, geometry, distribution, and orientation [6,7].
Recently, UHPC has garnered significant attention in bridge construction, which caused it to be called a “Game Changer” in this field due to the ability to design smaller cross-sectional members and longer spans, with less reinforcement and less cost [8], and the ability to design I-girders with very thin webs [5].
Although significant enthusiasm exists for incorporating ultra-high-performance concrete (UHPC) into bridge superstructures, as highlighted in recent research, its application has primarily been confined to smaller projects. This limitation stems from the absence of structural design models validated through extensive experimental testing, particularly regarding shear resistance. Numerous researchers have concentrated on examining the shear behavior of UHPC via experimental methods [9,10,11,12,13,14,15,16,17,18,19]. These studies have investigated various factors, including cross-sectional geometry, prestressing effects, fiber content, shear span-to-depth ratio, the inclusion of shear reinforcement, and reinforcement ratio.
The results of these studies revealed that the primary factors affecting shear failure were the post-cracking tensile strength and strain capacity of UHPC, rather than the compression strut’s crushing. Failure typically initiates when a major crack extends through the girder’s depth, subsequently leading to fiber pull-out along the principal diagonal crack [15]. An adequate amount of steel fibers within the UHPC matrix contributes to a tensile-strain-hardening behavior after initial cracking, which helps to prevent brittle failure. This property allows for the development of multiple closely spaced cracks even without transverse reinforcement. Furthermore, test results showed that steel fibers can replace or be combined with conventional shear reinforcement [16]. The combined presence of shear reinforcement, prestressing, and steel fibers enhances shear resistance, with their contributions being additive. That study also concluded that the contribution of transverse reinforcement is influenced by the strain capacity of UHPC, where higher strain capacity will enable the transverse reinforcement to exhibit more tensile stress up to yielding [5]. It has also been shown that higher axial stress due to prestressing will increase the shear capacity and reduce the cracking angle.
As shear theories for conventional concrete are not suitable for UHPC [20], several proposed shear models were proposed specifically for UHPC in Europe and North America. The main differences among the proposed models lie in how to account for the tensile strength of UHPC [13].
Previous attempts were made to evaluate the shear capacity and the behavior of UHPC, or composite materials generally, using statistical methods. Kodsy et al. [21] evaluated different UHPC shear prediction models on the basis of standard deviation, average strength ratio (experimental-to-predicted), and plotting ratio versus other variables. On the other hand, machine learning algorithms have also been utilized by Hematibahar et al. [22] and Haruna et al. [23] to generate prediction models for the mechanical properties of UHPC and to evaluate their reliability, respectively. It should be noted that, regardless of the method used in developing a prediction model for shear strength, adopting an extensive and reliable experimental database is very important.
In this study, a statistical evaluation of the shear resistance models proposed for UHPC was conducted. The evaluated models were FHWA-HRT-23-077, 2023 [24], ePCI report, 2022 [25], French Standard NF P 18-710, 2016 [26], Canadian model A23.3-04, 2004 [27], and Modification Eurocode 2/German DAfStb method, 2023 [28]. The statistical evaluation was performed to assess the prediction accuracy, conservatism, and ease of use for each of the design codes in predicting the capacity of 198 specimens compiled from the literature. The experimental database included specimens with and without prestressing reinforcement, and with and without shear reinforcement, and different cross-sectional geometries with a wide range of variables.

2. Shear Resistance According to Various Prediction Models

In the last two decades, worldwide standards have adopted different shear resistance models for UHPC. Despite the fact that most models are based on a modification of the modified compression field theory (MCFT), different assumptions were made in them and they were calibrated using limited and different experimental databases. These methods include FHWA-HRT-23-077 [24], ePCI report [25], French Standard NF P 18-710 [26], Canadian model A23.3-04 [27], and Modification Eurocode 2/German DAfStb method [28]. This section discusses each of the mentioned methods in detail.

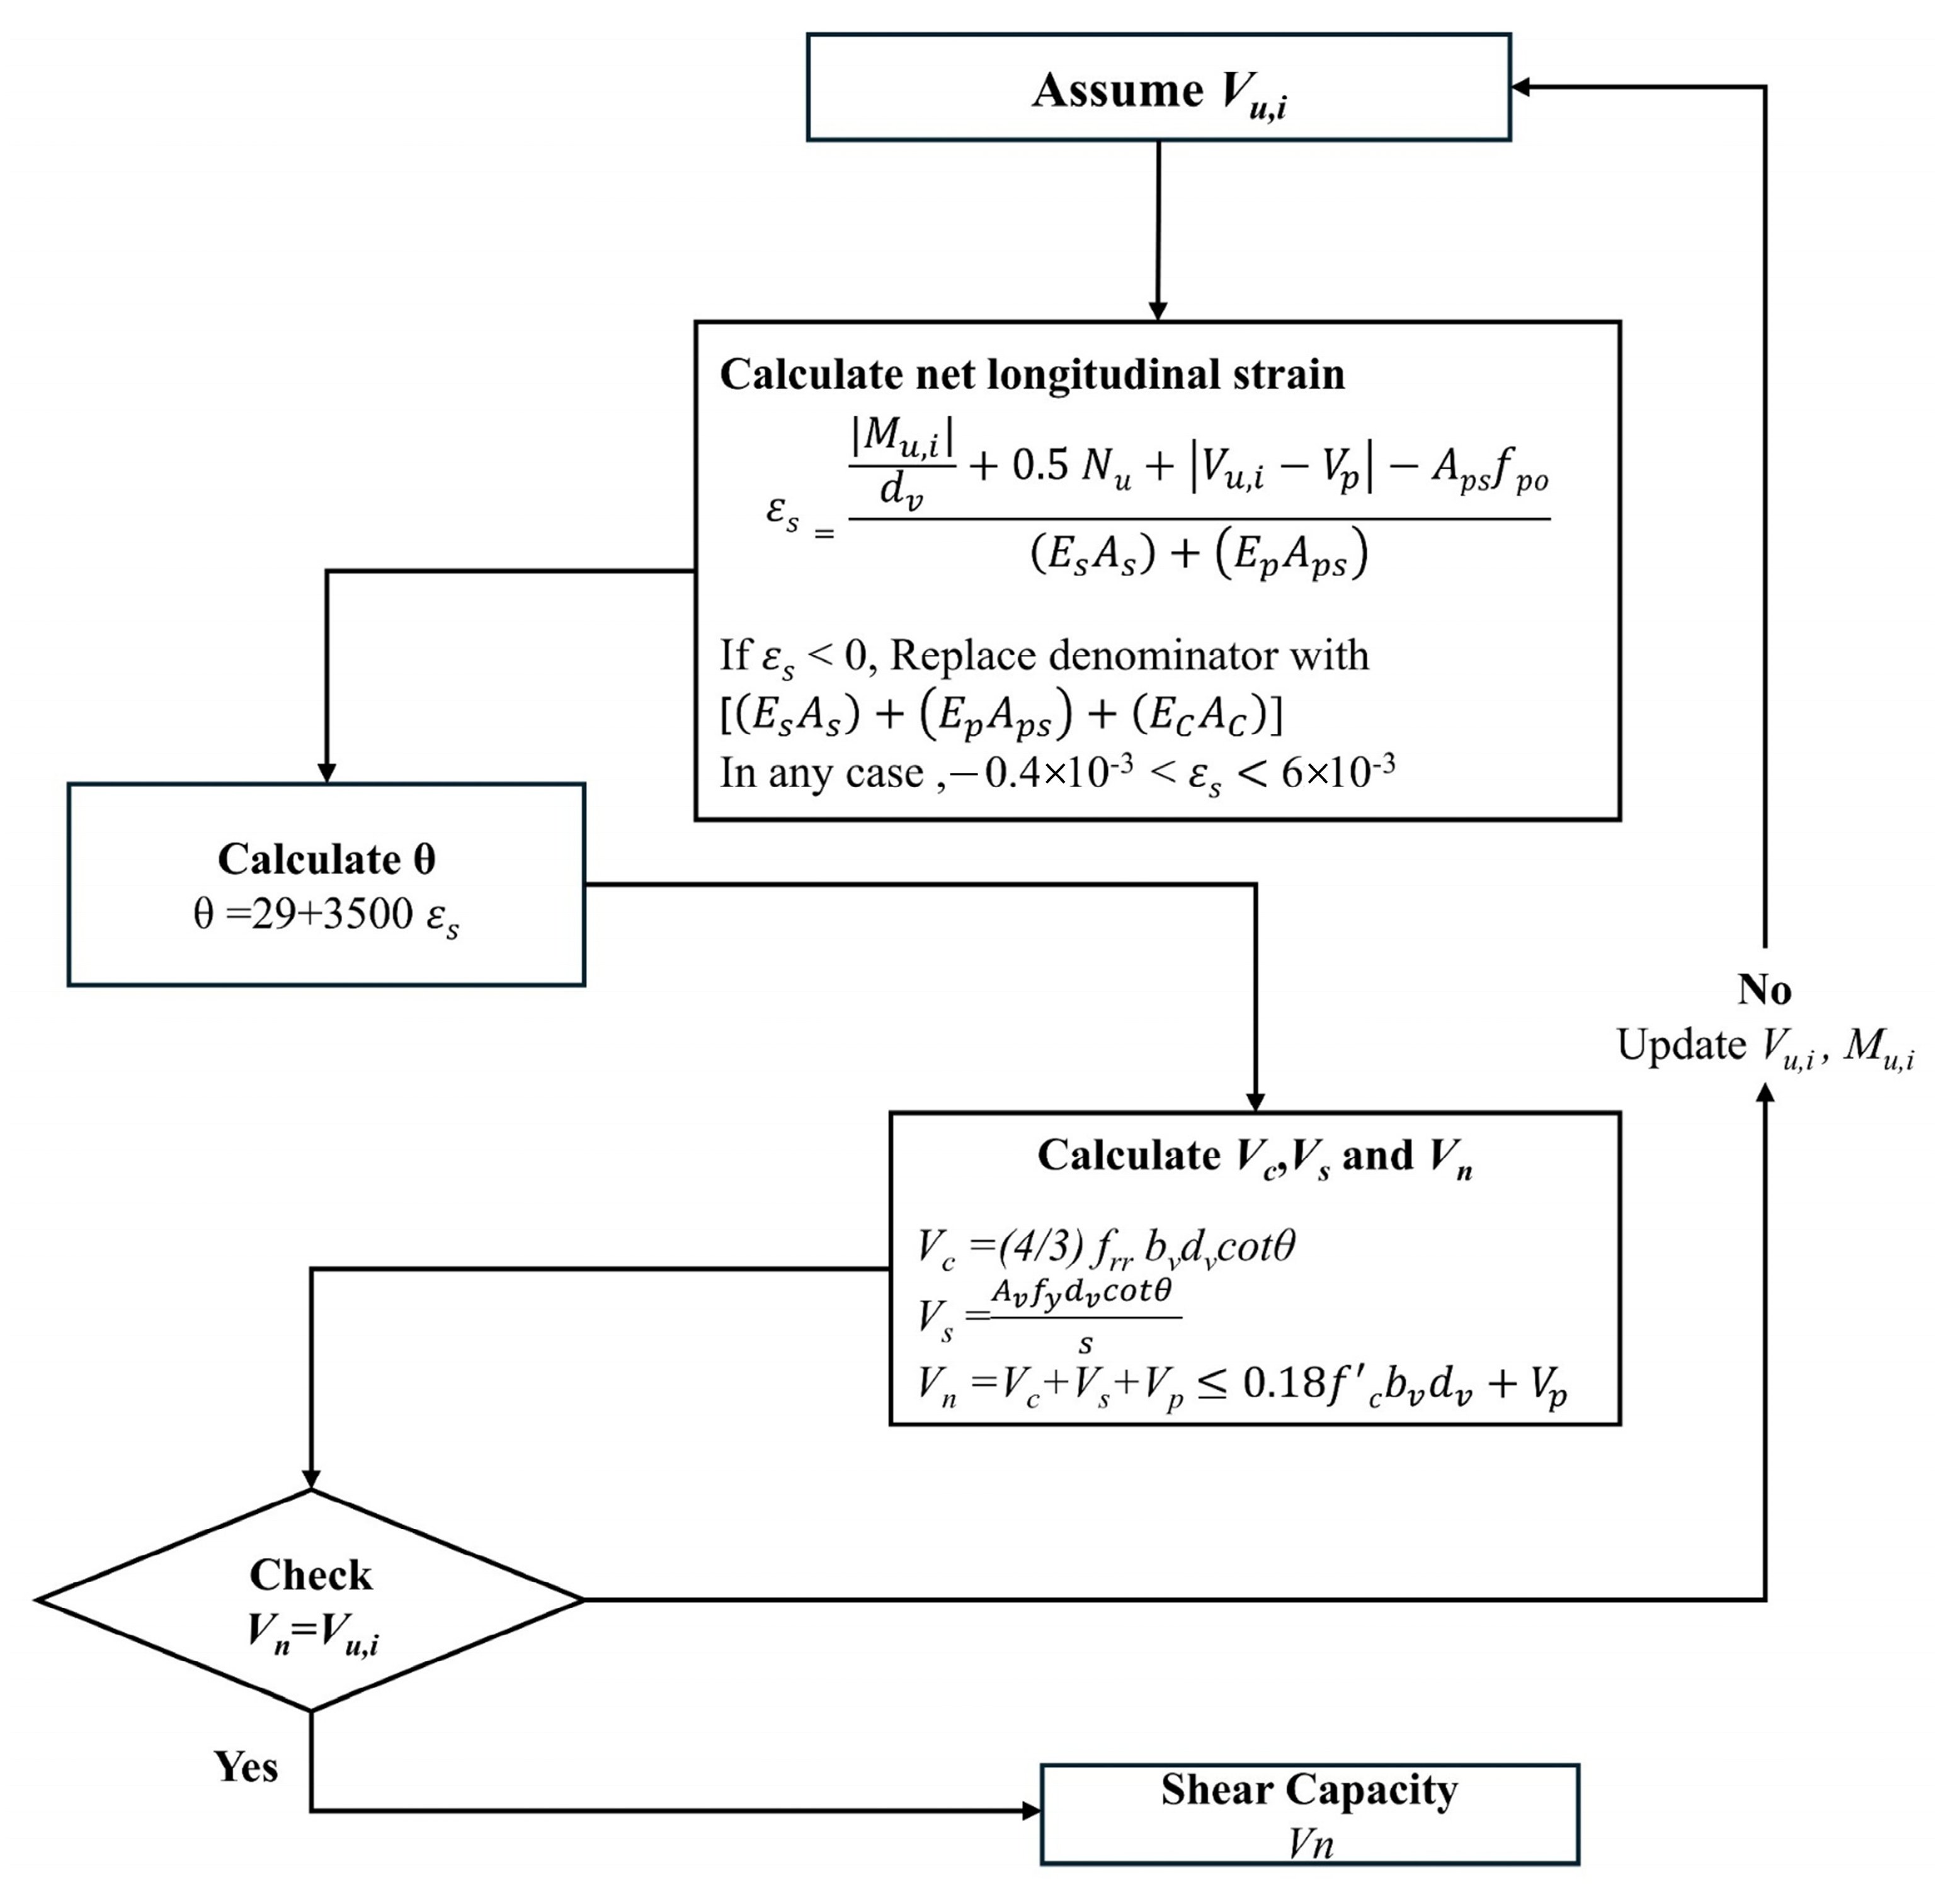
2.1. FHWA-HRT-23-077, 2023

In 2023, the Federal Highway Administration (FHWA) published the FHWA-HRT-23-077 document “Structural Design with Ultra-High Performance Concrete” [24]. The shear model adopted in the document is based on the MCFT principles, with a modification to the material constitutive models to apply to UHPC behavior. The model was originally based on a Garybel and El-Helo study [5] in 2022 and was recently adopted also by the AASHTO in 2024 [29]. This method will be referred to as the FHWA method in this study.
The nominal shear resistance of a UHPC member (Vn) according to the FHWA is given in Equation (1), representing the combined contributions of the UHPC tensile strength (VUHPC) as in Equation (2), shear reinforcement (Vs) as in Equation (3), and the vertical component of prestressing force resisting vertical shear (Vp).
V n = V U H P C + V s + V p 0.25 f c b v d v + V p
V U H P C = γ u f t , l o c b v d v c o t θ
V S = A v f v , α d v c o t θ   s
where bv is the effective web width (mm), dv is the effective depth in resisting shear forces (mm), γu is a reduction factor that takes into consideration the variability in tensile capacity of UHPC (less than or equal to 1.0), ft,loc, fv,α are the localization tensile strength (MPa) and uniaxial stress in the transverse steel reinforcement at nominal shear resistance (MPa), respectively, Av is the area of transverse reinforcement (mm2), θ is the angle of inclination of diagonal strut (degree), and s is the spacing of shear (mm).
If the beam girder has no shear reinforcement, the angle of the compression strut θ can be determined directly by solving Equation (4) with one unknown. However, if the girder has shear reinforcement, θ and the stress in shear reinforcement fv,α are determined iteratively by solving Equations (4)–(7) (see Figure A1). The ft, loc and εt,loc should be evaluated using direct tension testing according to AASHTO T-397 [30]. εs, in Equations (4) and (6), is the longitudinal strain at the level of reinforcement and is calculated according to Equation (8). If the value of εs calculated from Equation (8) is negative or is positive and less than the elastic tensile strain, εt,cr, the value should be determined again following Equation (9).
γ u ε t , l o c = ε s 2 ( 1 + cot 2 θ ) + 2 f t , l o c E c cot 4 θ + 2 ρ v , α f v , α E c cot 2 θ ( 1 + cot 2 θ )    
ε 2 = 2 f t , l o c E c cot 2 θ 2 ρ v , α f v , α E c ( 1 + cot 2 θ )  
ε v = γ u ε t , l o c 0.5 ε s + ε 2
f v , α = E c ε v sin α f y  
ε s = | M u | d v + 0.5 N u + V u V p A p s f p o γ u f t , l o c A c t E s A s + E p A p s
ε s = | M u | d v + 0.5 N u + V u V p A p s f p o E s A s + E p A p s + E c A c t
where |Mu| is the absolute value of the factored moment at the critical section (N.mm), Nu is the factored axial force at the design section (N), Vu is the design shear load at the critical section (kN), and Aps, As, and Act are the area of prestressing reinforcement, non-prestressed steel reinforcement, and UHPC in the flexural-tension side (mm2), respectively. fpo is taken as the modulus of elasticity of prestressing steel multiplied by the locked-in difference in strain between the prestressing reinforcement and the surrounding concrete and can be taken as 0.7 of the ultimate tensile strength of the prestressing reinforcement (MPa), and Es and Ep are the moduli of elasticity of non-prestressed and prestressing steel (MPa), respectively. ε2 is the diagonal compressive strain in the section, and εv is the vertical strain in transverse reinforcement at the design section. It is noteworthy that the elastic modulus of the concrete (Ec) is calculated according to the FHWA report [24].
The FHWA report specifies a minimum UHPC compressive strength of 120.6 MPa, minimum effective cracking strength of 5.2 MPa, and minimum crack utilization strain of 0.0025.

2.2. ePCI-UHPC, 2021

In 2021, a research and development program for utilizing UHPC in bridges by Tadros et al. [25] proposed a shear model that is an adaptation of the current AASHTO provisions. This method will be referred to as the ePCI method in this study. The shear strength of the UHPC beam consists of shear resistance provided by tensile stresses in UHPC (Vcf) in Equation (10), shear resistance proved by shear reinforcement (Vs) in Equation (11), and the vertical component of prestressing force opposite to the direction of the applied shear force (Vp). Consequently, the shear capacity of the UHPC beam (Vn) is given in Equation (12). Despite the procedure including the contribution of shear reinforcement with the assumption of yielding stress, the authors discouraged the use of shear reinforcement due to the potential fiber disruption.
V c f =   4 3   f r r   b v   d v   c o t θ
V s = A v f y d v s   c o t θ
V n   =   V c f   +   V s   +   V p
where frr is the residual tensile strength of UHPC and preferably taken as 5.2 (MPa) for UHPC to meet minimum PCI-UHPC tensile properties requirements. The crack angle is estimated according to Equation (13). The longitudinal strain εs is calculated according to Equations (14) (for positive values) and (15) (for negative values) and is bounded by −0.40 × 10⁻³ in compression and 6.0 × 10⁻³ in tension, and other parameters are similar to what was described before. The ePCI method specifies a minimum compressive strength of 124 MPa, and a 10 MPA minimum tensile strength.
θ = 29 °   +   3500 ε s
ε s = M u d v + V u V p A p s f p o E s A s + ( E p A p s ) 0.0
ε s = M u d v + V u V p A p s f p o E s A s + E p A p s + E C A C t 0.0

2.3. French Standard, NF P 18-710, 2016

The UHPC shear model French Standard model (AFGC) is similar to a simplified version of the MCFT. This method will be referred to as the AFGC method in this study. According to the French Standard model [26], the shear resistance of a UHPC member (VRd) is the combined resistance of three terms: concrete (VRd,c), steel fibers (VRd,f), and shear reinforcement (VRd,s), as shown in Equations (16)–(21).
VRd = VRd,c + VRd,f + VRd,s
V R d , c = 0.24 γ c f γ E   K   f c k   b v   z , for prestressed 0.18 γ c f γ E   K   f c k   b v   h ,   for non-prestressed
  K = 1 + 3 σ c p f c k
σ c p = N E d A c 0.4 f c k
VRd,f = Afv σRd,f cot θ
V Rd , s = A s s   z   f y   cot   θ
where the comprehensive safety factor γcf γE shall be 1.5 at the design stage. fck represents the compressive strength of UHPC (MPa). The term z represents the lever arm of the internal forces and is taken as z = 0.9 d (mm). The prestressing improvement factor k is determined by the external load or prestressing NEd. σRd,f is the mean value of the post-cracking strength along the shear crack. Afv is the cross-section of the inclined area on which the fibers act. The inclination of the shear crack θ is fixed as the minimum value of 30. The minimum compressive and tensile strengths are 150 and 5 MPa, respectively.

2.4. Canadian Standard CSA A23.3-04

The Canadian Highway Bridge Design Code also adopts a modification of the MCFT for the shear design of UHPC. This method will be referred to as the CSA method in this study. According to the Canadian code [27], the shear strength of a member (Vr) in Equation (22) is taken as the combination of the concrete component (Vc) in Equation (23), the shear reinforcement component (Vs) as in Equation (24), and the vertical component of prestressing force (Vp).
Vr = Vc + Vs + Vp
V c   =   φ c   λ   β f c   b v d v
V s   =   A v φ s f y d v s c o t θ
B = 0.4 1 + 1500 ε x 1300 1000 + s z e
θ = 29 ° + 7000 ε x  
where φc is the resistance factor for concrete take = 1.0, λ is a factor to account for low-density concrete = 1.0, β is a factor representing the strain and the size effect and determined according to Equation (25), f’c is the concrete cylinder strength (MPa), φs is the resistance factor for reinforcing steel take = 1.0, fy is the yield strength of the reinforcement (MPa), sze is the influence of aggregate size, and θ is the angle of average principal compression in the beam with respect to the longitudinal axis (degree), determined by Equation (26). To determine θ, the longitudinal strain at mid-depth of the member due to factored loads, εs, is required (Equation (27)).
ε s = M u d v + V u V p + 0.5 N u A p s f p o 2 ( A s E s + A p E p )     0.003
If the value of εs calculated from Equation (27) is negative, the value shall be recalculated with the denominator replaced by 2(EsAs + EpAp + EcAct). εs shall not be taken as less than—0.2 × 10⁻³. It should be noted that fy shall not exceed 500 MPa except for prestressing reinforcement and the minimum compressive strength is 120 MPa.

2.5. Eurocode 2 and German DAfStb Guideline, 2022

A modified procedure to determine the shear capacity of UHPC following the Eurocode 2 and the German DAfStb Guideline was presented in a Metje and Leutbecher study [28]. This method will be referred to as the DAfStb method in this study. Similar to previous concepts, the shear design resistance in this method is determined by combining contributions from three components, the shear resistance of a UHPC member (VRd,c) as in Equations (28)–(31), shear resistance provided by the fibers (VfRd,f), and shear resistance provided by the shear reinforcement (VRd,s), as shown in Table 1 and Equations (32) and (33). The minimum compressive and tensile strengths are 150 and 8.5 MPa, respectively.
  V R d , c = 0.15 γ c k 100 ρ l f c k 1 3 + 0.12 σ c p   b v d v
k = 1 + 200 / d   2.0
ρ l = A s b w d v 0.06
σ c p = N E d A c < 0.2 f c d
f c f t d = α C F   f c f t k / γ C F
f c f t k = k F f c f t 0
where fck and fcd are the characteristics and the design value of the compressive cylinder strength, respectively; γC and γCF are the partial factors for concrete and post-cracking tensile strength, respectively; h is the height of the cross-section; and ηF is a coefficient considering the shape of the shear crack (ηF = 1.0 for members with I-shaped cross-section and ηF = 0.7 for members with compact cross-section). αCF is a coefficient taking account of long-term effects on the post-cracking strength, κF is a factor considering the orientation of the fibers (κF = 1.0 for I-shape cross-sections and κF = 0.5 for compact cross-sections), and fcft0 is the reference value of the post-cracking tensile strength evaluated by testing.
As shown in Table 1, the fiber contribution is considered to correspond to a θ = 45° (cot θ = 1.0) when the shear span-to-depth ratio a/d is greater than or equal to 2 and the stirrup contribution with θ calculated according to Table 1. For members with short shear spans (a/d less than 2.0), the fiber contribution is considered effective over the minimum of h or 0.75 a, and only stirrups within 0.75 a are considered.

2.6. Summary of the Prediction Models

The differences and similarities between the mentioned UHPC shear models can be summarized in the following points:
-
Generally, the mentioned models agree that the shear resistance is composed of contributions from the tensile resistance of concrete, fibers, shear reinforcement, and prestressing. However, the FHWA, ePCI, and CSA methods have one term for the tensile resistance of concrete and steel fibers combined, while the AFGC and the DAfStb methods have separate terms for each.
-
It is worth mentioning that the FHWA method adopts the concept of localization tensile stress for the tensile resistance of concrete, which should be evaluated experimentally. The ePCI method adopts a fixed minimum residual tensile stress for UHPC (frr = 5.2 MPa). In the other codes, the tensile stress is related to the compressive strength of UHPC.
-
Regarding the inclination angle of the compression strut θ, the FHWA method adopts an iterative solution to determine it, while the ePCI and the CSA method adopt a similar equation form. In the three methods, the angle depends on the strain of the longitudinal reinforcement, εs. The AFGC method adopts a fixed minimum angle of 30 degrees. However, the DAfStb method includes the effect of the shear span-to-depth ratio on the inclination angle θ.
-
In the shear reinforcement contributions, all methods assume yielding stress in the shear reinforcement except for the FHWA method, where an iterative solution is required to determine the stress in the shear reinforcement.
-
In the FHWA, ePCI, and CSA methods, the effect of the prestressing level on the shear capacity of UHPC is included in determining the strain of the longitudinal reinforcement, εs, and as a vertical component resisting vertical shear, Vp. In the AFGC and the DAfStb methods, the prestressing level is included in the concrete contribution equation ( σ c p ).

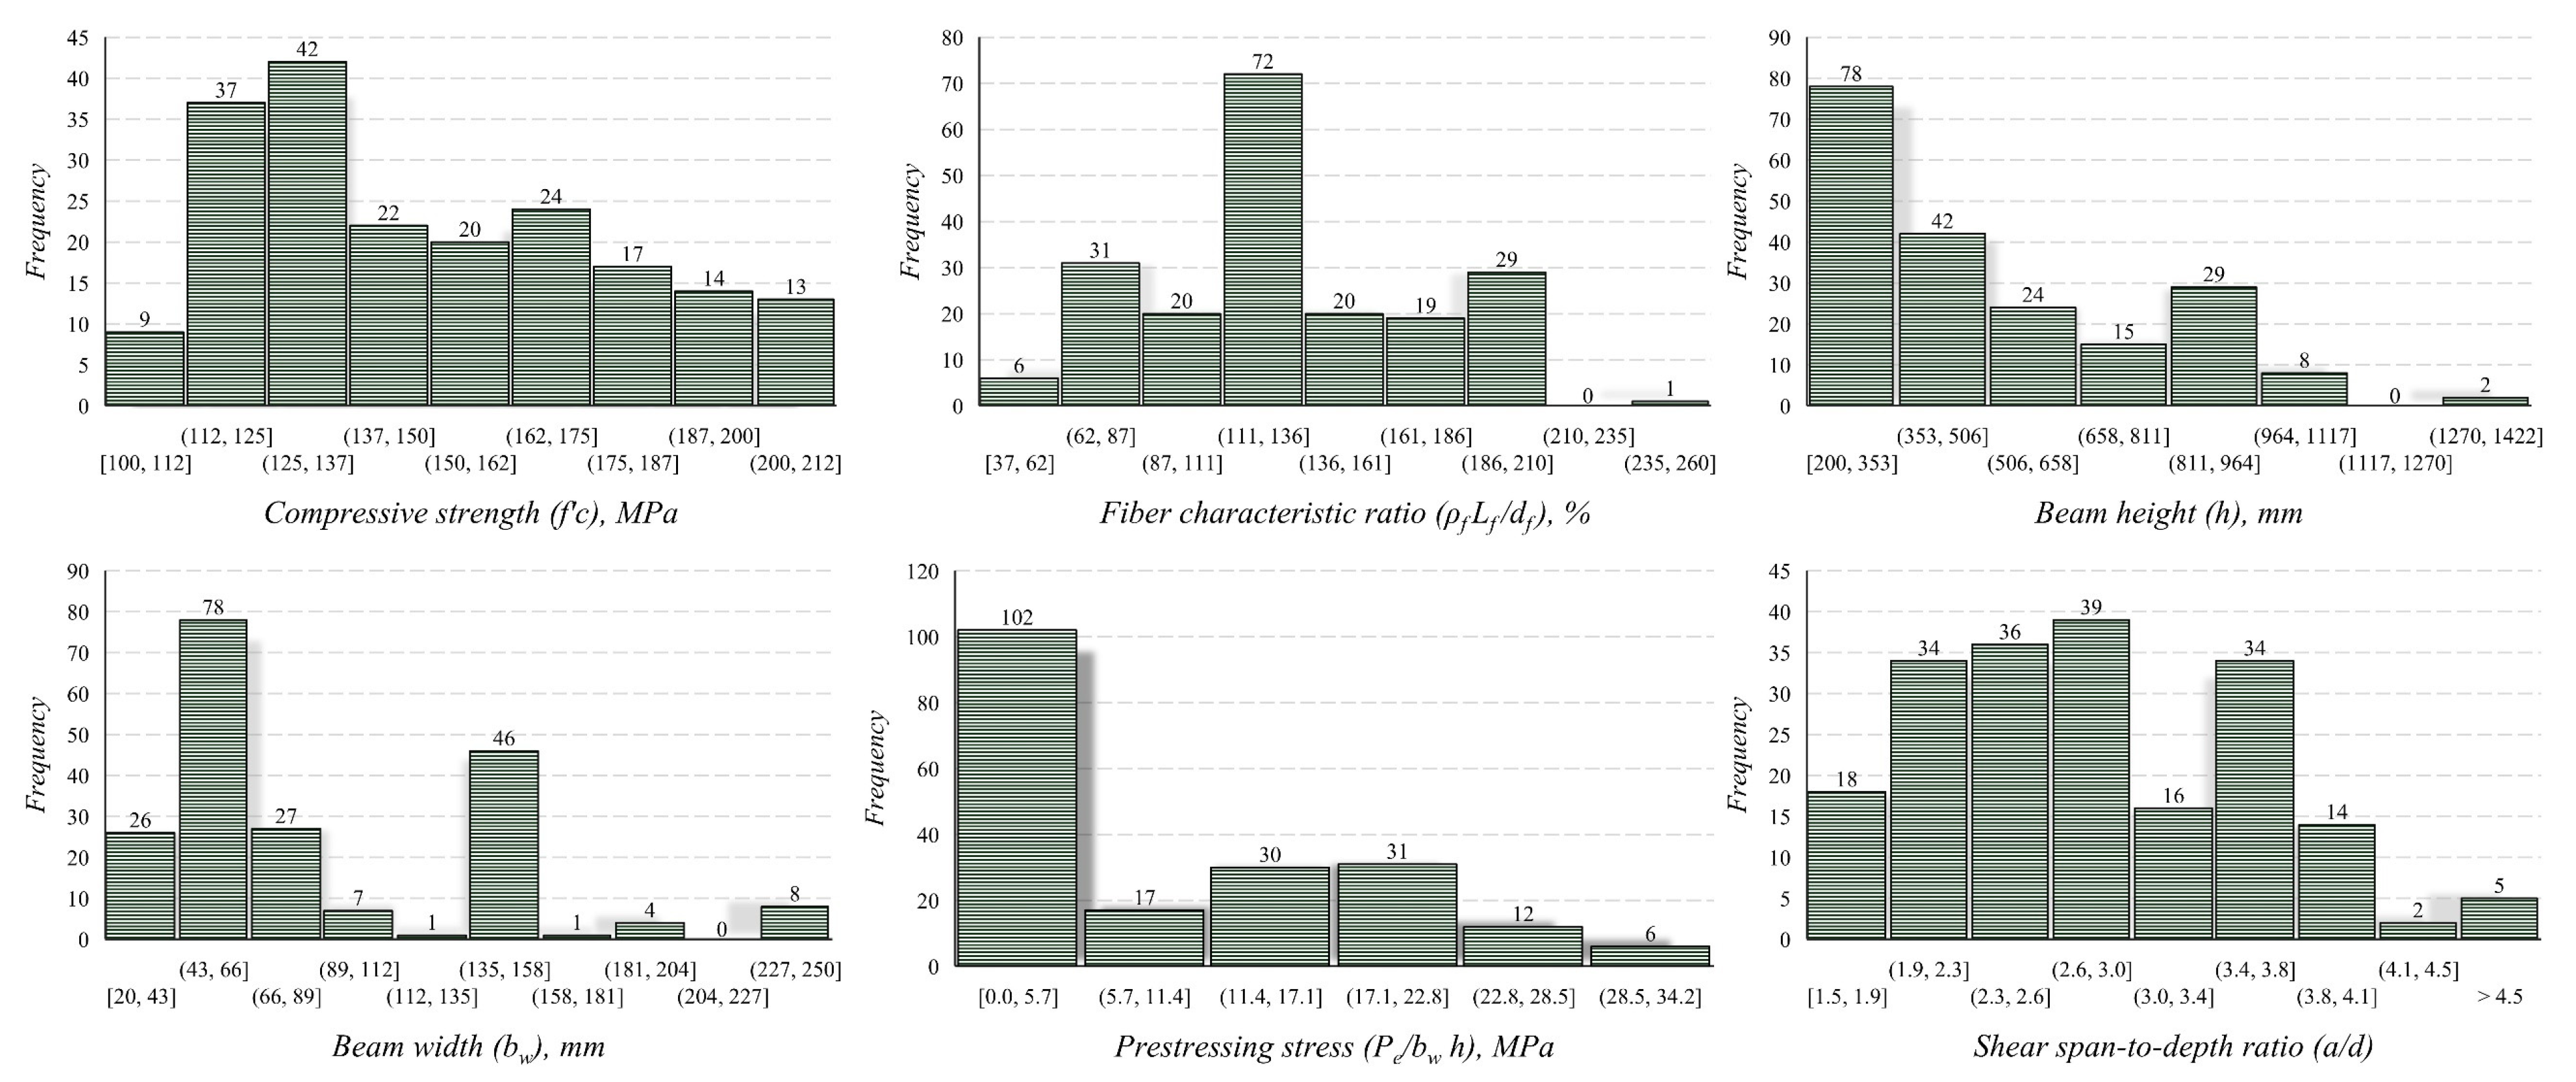
3. Database Analysis

To evaluate the effectiveness of the UHPC shear design models discussed earlier, a comprehensive review of the existing literature was carried out to assemble a database of experimental tests of UHPC beams subjected to shear. Only those specimens that failed in shear loading with dominant shear crack were considered. The database was further refined to include beams with a shear span-to-depth ratio (a/d) of 1.5 or higher, while excluding any specimens that incorporated coarse aggregate in their mix design. In addition, only specimens with steel fiber were included as the FHWA and the ePCI methods define UHPC as a mixture that exhibits strain-hardening and they do not have a separate term for steel fibers’ contribution. The literature included a total of 198 specimens from 28 references [5,9,10,11,12,13,18,25,27,31,32,33,34,35,36,37,38,39,40,41,42,43,44,45,46,47,48,49,50] (Table 2). It should be noted that only specimens with complete information were included. In addition, the reason for excluding specimens with coarse aggregate is that UHPC usually does not contain coarse aggregate, to reduce the friction in the mix and to achieve a dense, compact, and more flowable mix.
In the compiled database, 101 specimens were prestressed, and the remainder were non-prestressed. All shear-tested prestressed specimens in the literature had a straight prestressing profile because UHPC members tend to have thin webs where inclined strands are difficult to achieve. In terms of shear reinforcement, 82 specimens included shear reinforcement, while the remainder did not. Specimens in the database included I-shaped (72%), rectangular (25%), T-shaped (2%), and box (1%) sections. Figure 1 is a graphical illustration of the content of the experimental database.
For every specimen included in the database, the collected data encompassed sectional information and reported the compressive strength of the concrete, details of non-prestressed and prestressed reinforcement, volume and aspect ratios of steel fibers, shear reinforcement information (where applicable), shear span-to-depth ratio (a/d), and the experimentally measured shear capacity (Vexp). Figure 2 illustrates the distribution of selected variables within the compiled database. The database encompassed a broad spectrum of variables, which is essential for thorough model assessment. It is worth noting that the majority of specimens featured a fiber volume ranging between 1.5% and 2.5%, and none contained coarse aggregate. From Figure 2 it can be seen that 26 specimens had a very thin web with 20 to 40 mm thicknesses. As shown in Figure 2, specimens with shear span-to-depth ratios less than 1.5 were excluded to avoid deep beam behavior. In addition, most of the specimens had a compressive strength greater than 125 MPa. The elastic modulus for all specimens in the database was calculated using the empirical equations proposed in the FHWA report [24] (Equation (34)).
E c = 9100   f c 0.33   [ MPa ]

4. Localization Tensile Stress and Strain for the FHWA Method

Determining the nominal capacities for beams in the database according to the FHWA requires experimentally obtaining the crack localization strength (ft,loc) and strain (εt,loc) through direct tension testing. According to the FHWA, the definition of crack localization strength ft, loc is “the tensile stress value at which the tensile stress continuously decreases with increasing strain” (Figure 3). These values are associated with shear failure that is triggered by a localized and dominant crack developing from existing closely spaced cracks. However, these parameters were not provided in most of the surveyed database.
Therefore, the authors aimed to develop a prediction equation for the localization strength. Consequently, a secondary database for the direct tension test of UHPC was surveyed. It contained 76 tests from eight different studies [5,51,52,53,54,55,56,57] with different variables, including concrete and fiber characteristics. The secondary database is shown in Table 3. Correlation analysis revealed that the localization strength exhibits a predominantly linear relationship with both the compressive strength (f’c) and the fiber characteristic ratio (Vf lf/df). Based on this finding, a linear equation was developed to predict the localization strength, as presented in Equation (35). The developed model demonstrated a coefficient of variation (CoV) of 16.1% and a root mean square error (RMSE) of 1.49 MPa, indicating a reasonable level of accuracy. It is important to highlight that Equation (35) is valid only within the variable ranges specified in Table 2. Additionally, the term Vf lf/df is expressed in its original form and not converted into a percentage.
ft, loc = 0.279 + 0.035f′c + 3.40Vf lf/df
The localization strength for the 198 shear specimens in the database was determined according to Equation (35). Regarding the utilization strain, a fixed value of εt,loc = 0.004 was assumed for all specimens, as all specimens in Table 3 had εt,loc close to 0.004.

5. Performance and Comparison of Prediction Models

To evaluate the performance of the prediction models discussed in the previous sections, the nominal shear capacities of the UHPC girders in the experimental database were determined according to each of them (see Appendix A for FHWA method and ePCI method calculation flowcharts). In all models, all partial safety factors were set to 1.0 for the purpose of comparative analysis.
The experimental versus predicted capacities were plotted for each prediction model in Figure 4. The statistical measures for each model, including the average (Avg.), standard deviation (SD), CoV, and relative root mean square error (RRMSE) for the shear strength ratio (Vexp/Vpred), are summarized in Table 4. In addition, the statistics based on reinforcement type are presented in Table 5.
Generally, all models yielded a safe average shear strength ratio Vexp/Vpred. The ePCI method resulted in the highest average shear strength ratio of 1.58, while the FHWA method yielded the lowest average of 1.19. The ePCI method resulted in 28 specimens with a shear strength ratio > 2.0 and no specimens falling below 0.75. This is expected due to adopting a conservative constant shear stress of 5.2 MPa. The FHWA method resulted in the lowest standard deviation and coefficient of variation, reflecting the data’s lowest scatter (highest prediction accuracy), which also can be seen in Figure 4a. Table 5 also indicates a lower CoV for prestressed members compared to non-prestressed members for both models. It should be noted that high conservatism can lead to an uneconomical design.
The DAfStb method showed the highest standard deviation and CoV, indicating the lowest prediction accuracy and the greatest scatter of the data. This method also accounted for the largest number of specimens having shear strength ratios above 2.0 and below 0.75. The AFGC and CSA shear methods, on the other hand, demonstrated similar statistical performance. Overall, methods derived from MCFT exhibited better performance in predicting shear strength compared with models that take the effect of steel fiber reinforcement contribution separately, or models that do not take into account the angle of the compression strut.
For a further look at the performance of the prediction models, the shear strength ratios were drawn with respect to geometrical properties (h, bw, a/d) in Figure 5, and with respect to concrete and reinforcing properties (f’c, ρv, P/A) in Figure 6. The slopes of the trendlines in the figures reflect the conservatism level across the variables’ ranges.
With respect to the geometrical properties (Figure 5), it can be seen that the FHWA method yielded relatively flat trendlines, indicating more consistent predictions across variables compared to other models. In addition, the DAfStb method showed a reduction in conservatism at high values of h and a/d. The ePCI, AFGC, and CSA methods showed similar behavior across all variables.
Regarding the concrete and the reinforcing properties (Figure 6), the FHWA method still shows consistent prediction accuracy with relatively flat trendlines compared to other methods. Additionally, the DAfStb method still shows a reduction in conservatism at high values of the variables. Finally, it can be seen that all methods, except for the FHWA method, show a reduction in conservatism at a high transverse reinforcement ratio. This can be attributed to their adopting yield stress for transverse reinforcement compared to the FHWA method which assesses the transverse reinforcement strain and stress.

6. Conclusions

This paper aims to define and evaluate the performance of five UHPC shear design models: the FHWA, ePCI, AFGC, CSA, and DAfStb methods. The evaluation was carried out using a detailed experimental database from 28 different experimental programs published in the literature. The database included 198 specimens, from which 51% of the specimens were prestressed and 34% of the specimens had shear reinforcement. In addition, all specimens had steel fiber and fine aggregate in their UHPC mix. The following conclusions can be drawn:
  • The FHWA, ePCI, and CSA methods are based on modifications of the MCFT. On the other hand, the AFGC and DAfStb methods were shown to have separate terms for the concrete and steel fiber tensile contributions. The angle of inclination of the diagonal compressive strut (θ) in the FHWA, ePCI, and CSA methods is determined using the strain of the longitudinal reinforcement (εs), while the AFGC method uses a fixed minimum angle of 30°, and the DAfStb method incorporates the span-to-depth ratio (a/d). In addition, it was shown that all methods assume yielding stress in shear reinforcement except for the FHWA method, which determines the strain of the shear reinforcement.
  • To determine the shear capacity according to the FHWA procedure, the localization strength and strain (ftloc, εt,loc) must be determined experimentally. Conversely, ftloc and εt,loc had not been determined for most of the specimens in the database. For that reason, a prediction model ft,loc was developed based on the concrete and steel fiber properties. Regarding the localization strain, a fixed value was assumed (εt,loc =0.004) for all specimens.
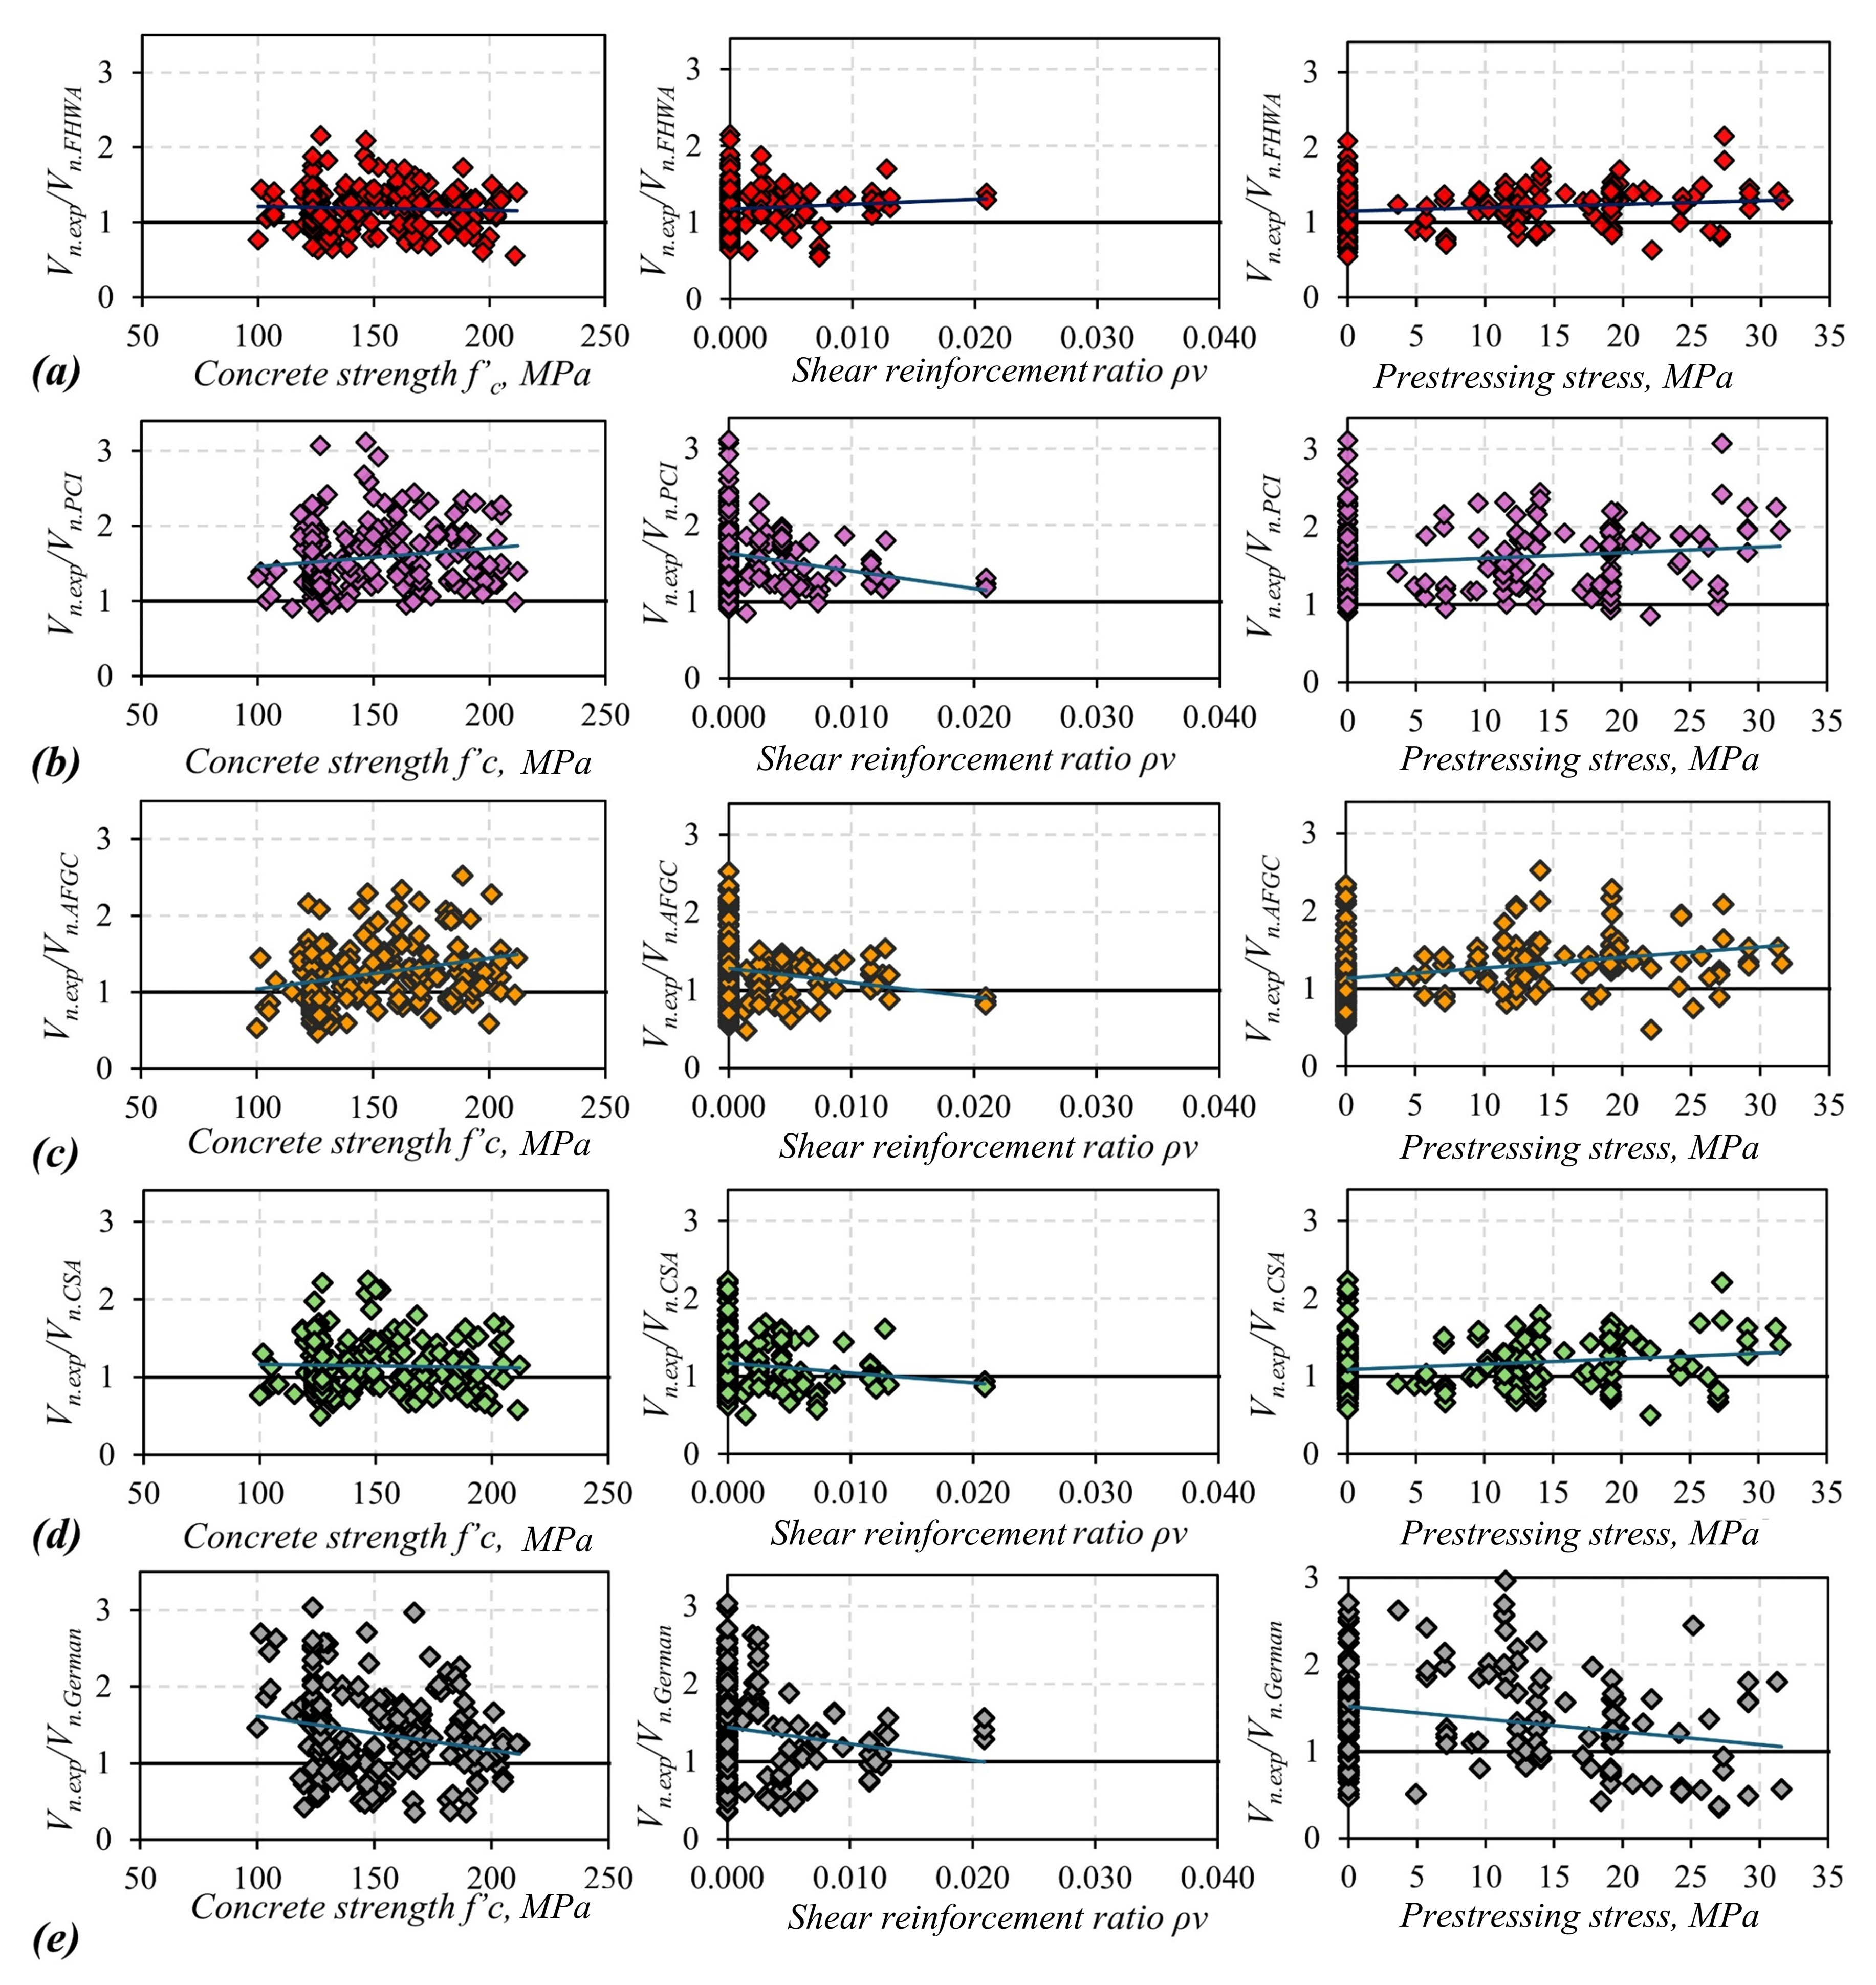
  • The FHWA method showed a superior performance compared to other models in terms of statistical measures and consistent prediction conservatism across variables ranges. The FHWA method resulted in an Avg. of 1.19, SD of 0.29, and RRMSE of 35.7% for the strength ratios (Vexp/Vpred.). Out of 198 specimens, only 14 had a shear strength ratio of either more than 2.0 or below 0.75.
  • The ePCI method showed the highest conservatism with an Avg. of 1.58 due to limiting the UHPC residual tensile strength to 5.2 MPa. The ePCI method resulted in 28 specimens with a shear strength ratio > 2.0 and no specimens falling below 0.75.
  • The DAfStb method showed the highest SD and CoV, indicating the lowest prediction accuracy and the greatest scatter of the data. This method also accounted for the largest number of specimens having shear strength ratios above 2.0 and below 0.75. In addition, this method showed a reduction in conservatism at high geometrical or material properties values, including the shear span-to-depth ratio.
  • It can be said that the ePCI, AFGC, and CSA methods showed similar behavior with different degrees of conservatism; they resulted in Avg. shear strength ratios of 1.58, 1.24, and 1.14, respectively.
  • Except for the FHWA method, all methods showed a reduction in conservatism at a high transverse reinforcement ratio. This can be attributed to adopting yield stress for transverse reinforcement compared to the FHWA method which checks its strain.

Author Contributions

Conceptualization, A.T. and H.A.; methodology, A.T., A.A., G.A., R.A.-M. and E.S.; validation, A.T., A.A., G.A., R.A.-M. and E.S.; formal analysis, A.T. and H.A.; investigation, A.T. and H.A.; resources, A.T., A.A. and G.A.; data curation, H.A.; writing—original draft preparation, A.T. and H.A.; writing—review and editing, A.A., G.A., R.A.-M. and E.S.; visualization, A.T. and H.A.; supervision, A.T., A.A., G.A., R.A.-M. and E.S. All authors have read and agreed to the published version of the manuscript.

Funding

This research received no external funding.

Data Availability Statement

Data will be available upon request from the authors.

Conflicts of Interest

The authors declare no conflicts of interest.

Appendix A

Figure A1. Flowchart for determining shear capacity of UHPC members according to FHWA Shear Provision.
Jcs 09 00211 g0a1
Figure A2. Flowchart for determining shear capacity of UHPC members according to ePCI method.
Jcs 09 00211 g0a2

References

  1. Resplendino, J. Introduction: What is a UHPFRC? In Designing and Building with UHPFRC; Wiley-ISTE: London, UK, 2011; pp. 3–14. [Google Scholar]
  2. Graybeal, B.; Brühwiler, E.; Kim, B.S.; Toutlemonde, F.; Voo, Y.L.; Zaghi, A. International perspective on UHPC in bridge engineering. J. Bridge Eng. 2020, 25, 04020094. [Google Scholar] [CrossRef]
  3. Buttignol, T.E.T.; Sousa, J.L.A.O.; Bittencourt, T.N. Ultra High-Performance Fiber-Reinforced Concrete (UHPFRC): A review of material properties and design procedures. Rev. IBRACON Estrut. Mater. 2017, 10, 957–971. [Google Scholar] [CrossRef]
  4. ACI Committee 239. Ultra-High-Performance Concrete: An Emerging Technology Report; (ACI 239R-18); American Concrete Institute: Farmington Hills, MI, USA, 2018. [Google Scholar]
  5. El-Helou, R.G.; Graybeal, B.A. Shear behavior of ultrahigh-performance concrete pretensioned bridge girders. J. Struct. Eng. 2022, 148, 04022017. [Google Scholar] [CrossRef]
  6. Wille, K.; Tue, N.V.; Parra-Montesinos, G.J. Fiber distribution and orientation in UHP-FRC beams and their effect on backward analysis. Mater. Struct. 2014, 47, 1825–1838. [Google Scholar] [CrossRef]
  7. Barros, J.A.O.; Antunes, J.A.B. Experimental characterization of the flexural behaviour of steel fibre reinforced concrete according to RILEM TC 162-TDF recommendations. RILEM TC 2003, 162, 77–89. [Google Scholar]
  8. Morcous, G.; Maguire, M.; Tadros, M.K. Shear capacity of ultra-high-performance concrete I-girders with orthogonal welded wire reinforcement. Spec. Publ. 2009, 265, 511–532. [Google Scholar]
  9. Baby, F.; Billo, J.; Renaud, J.C.; Massotte, C.; Marchand, P.; Toutlemonde, F.; Lussou, P. Shear resistance of ultra high performance fibre-reinforced concrete I-beams. In Fracture Mechanics of Concrete and Concrete Structures-High Performance, Fiber Reinforced Concrete, Special Loadings and Structural Applications; Korea Concrete Institute: Seoul, Republic of Korea, 2010; pp. 1411–1417. [Google Scholar]
  10. Yang, I.H.; Joh, C.; Kim, B.S. Shear behaviour of ultra-high-performance fibre-reinforced concrete beams without stirrups. Mag. Concr. Res. 2012, 64, 979–993. [Google Scholar] [CrossRef]
  11. Baby, F.; Marchand, P.; Toutlemonde, F. Shear behavior of ultrahigh performance fiber-reinforced concrete beams. I: Experimental investigation. J. Struct. Eng. 2014, 140, 04013111. [Google Scholar] [CrossRef]
  12. Zheng, H.; Fang, Z. Experimental study on shear behavior of prestressed ultra-high performance concrete I-girders. IABSE Symp. Rep. 2016, 106, 775–785. [Google Scholar]
  13. Jin, L.Z.; Chen, X.; Fu, F.; Deng, X.F.; Qian, K. Shear strength of fibre-reinforced reactive powder concrete I-shaped beam without stirrups. Mag. Concr. Res. 2020, 72, 1112–1124. [Google Scholar] [CrossRef]
  14. Pourbaba, M.; Sadaghian, H.; Mirmiran, A. A comparative study of flexural and shear behavior of ultra-high-performance fiber-reinforced concrete beams. Adv. Struct. Eng. 2019, 22, 1727–1738. [Google Scholar] [CrossRef]
  15. Ţibea, C.; Bompa, D.V. Ultimate shear response of ultra-high-performance steel fibre-reinforced concrete elements. Arch. Civ. Mech. Eng. 2020, 20, 49. [Google Scholar] [CrossRef]
  16. Metje, K.; Leutbecher, T. Experimental investigations on the shear bearing behavior of prestressed ultra—High performance fiber—Reinforced concrete beams with compact cross—Section. Struct. Concr. 2021, 22, 3746–3762. [Google Scholar] [CrossRef]
  17. Feng, J.; Li, P.; Wu, J.; Jiang, H.; Tian, Y.; Sun, X. Shear behavior of externally prestressed UHPC beams without stirrups. Case Stud. Constr. Mater. 2023, 18, e01766. [Google Scholar] [CrossRef]
  18. Li, P.; Cheng, Q.; Chen, N.; Tian, Y.; Fang, J.; Jiang, H. Experimental Study on Shear Behavior of Non-Stirrup Ultra-High Performance Concrete Beams. Materials 2023, 16, 4177. [Google Scholar] [CrossRef]
  19. Ahmed, F.B.; Biswas, R.K.; Sen, D.; Tasnim, S. Flexural and Shear Strengthening of Reinforced-Concrete Beams with Ultra-High-Performance Concrete (UHPC). Constr. Mater. 2024, 4, 468–492. [Google Scholar] [CrossRef]
  20. Binard, J.P. UHPC: A game-changing material for PCI bridge producers. PCI J. 2017, 62, 34–46. [Google Scholar] [CrossRef]
  21. Kodsy, A.; Morcous, G. Shear strength of ultra-high-performance concrete (UHPC) beams without transverse reinforcement: Prediction models and test data. Materials 2022, 15, 4794. [Google Scholar] [CrossRef]
  22. Hematibahar, M.; Kharun, M.; Beskopylny, A.N.; Stel’makh, S.A.; Shcherban’, E.M.; Razveeva, I. Analysis of models to predict mechanical properties of high-performance and ultra-high-performance concrete using machine learning. J. Compos. Sci. 2024, 8, 287. [Google Scholar] [CrossRef]
  23. Haruna, S.I.; Ibrahim, Y.E.; Umar, I.K. Machine Learning Approach for Prediction and Reliability Analysis of Failure Strength of U-Shaped Concrete Samples Joined with UHPC and PUC Composites. J. Compos. Sci. 2025, 9, 23. [Google Scholar] [CrossRef]
  24. Graybeal, B.A.; El-Helou, R. Structural Design with Ultra-High Performance Concrete; FHWA-HRT-23-077; U.S. Department of Transportation, Federal Highway Administration, Office of Infrastructure Research and Development: Washington, DC, USA, 2023.
  25. Tadros, M.; Lawler, J.; Abo El-Khier, M.; Gee, D.; Kurt, A.; Lucier, G.; Wagner, E. Implementation of ultra-high-performance concrete in long-span precast pretensioned elements for concrete buildings and bridges. PCI J. 2021. [Google Scholar]
  26. Toutlemonde, F.; Kretz, T.; Généreux, G.; Resplendino, J.; Pillard, W.; Guérinet, M.; Rougeau, P. French Standards for Ultra-High Performance Fiber-Reinforced Concrete (UHPFRC). In High Tech Concrete: Where Technology and Engineering Meet; Springer: Cham, Switzerland, 2018; pp. 1601–1609. [Google Scholar]
  27. CSA. Design of Concrete Structures; A23.3-04; Canadian Standards Association: Rexdale, ON, Canada, 2004; p. 232. [Google Scholar]
  28. Metje, K.; Leutbecher, T. Verification of the shear resistance of UHPFRC beams–Design method for the German DAfStb Guideline and database evaluation. Eng. Struct. 2023, 277, 115439. [Google Scholar] [CrossRef]
  29. Guide Specifications for Structural Design with Ultra-High Performance Concrete, 1st ed.; American Association of State Highway and Transportation Officials (AASHTO): Washington, DC, USA, 2024.
  30. AASHTO. Standard Method of Test for Uniaxial Tensile Response of Ultra-High-Performance Concrete; T 397; American Association of State Highway and Transportation Officials: Washington, DC, USA, 2022. [Google Scholar]
  31. Voo, Y.L.; Poon, W.K.; Foster, S.J. Shear strength of steel fiber-reinforced ultrahigh-performance concrete beams without stirrups. J. Struct. Eng. 2010, 136, 1393–1400. [Google Scholar] [CrossRef]
  32. Voo, Y.L.; Foster, S.J.; Gilbert, R.I. Shear strength of fiber reinforced reactive powder concrete prestressed girders without stirrups. J. Adv. Concr. Technol. 2006, 4, 123–132. [Google Scholar] [CrossRef]
  33. Graybeal, B.A. Material Property Characterization of Ultra-High Performance Concrete; FHWA-HRT-06-103; U.S. Federal Highway Administration, Office of Infrastructure Research and Development: Washington, DC, USA, 2006.
  34. Yao, D.; Jia, J.; Wu, F.; Yu, F. Shear performance of prestressed ultra-high strength concrete encased steel beams. Constr. Build. Mater. 2014, 52, 194–201. [Google Scholar] [CrossRef]
  35. Kurt, A. Implementation of Ultra-High Performance Concrete in Long-Span Precast Pretensioned Structural Elements for Buildings. Ph.D. Thesis, North Carolina State University, Raleigh, NC, USA, 2021. [Google Scholar]
  36. Lakavath, C.; Prakash, S.S. Influence of fiber dosage, fiber type, and level of prestressing on the shear behavior of UHPFRC I-girders. Eng. Struct. 2024, 300, 117146. [Google Scholar] [CrossRef]
  37. Feng, W.; Feng, H.; Zhou, Z.; Shi, X. Analysis of the shear capacity of ultrahigh performance concrete beams based on the modified compression field theory. Adv. Mater. Sci. Eng. 2021, 2021, 5569733. [Google Scholar] [CrossRef]
  38. Schramm, N.; Fischer, O. Querkraftversuche an profilierten Spannbetonträgern aus UHPFRC. Beton Stahlbetonbau 2019, 114, 641–652. [Google Scholar] [CrossRef]
  39. Wipf, T.J.; Phares, B.M.; Sritharan, S.; Degen, B.E.; Giesmann, M.T. Design and Evaluation of a Single-Span Bridge Using Ultra-High Performance Concrete; IHRB Project TR-529; Iowa State University, Institute for Transportation: Ames, IA, USA, 2009. [Google Scholar]
  40. Lim, W.Y.; Hong, S.G. Shear tests for ultra-high performance fiber reinforced concrete (UHPFRC) beams with shear reinforcement. Int. J. Concr. Struct. Mater. 2016, 10, 177–188. [Google Scholar] [CrossRef]
  41. Mészöly, T.; Randl, N. Shear behavior of fiber-reinforced ultra-high performance concrete beams. Eng. Struct. 2018, 168, 119–127. [Google Scholar] [CrossRef]
  42. Son, J.; Beak, B.; Choi, C. Experimental study on shear strength for ultra-high performance concrete beam. In Proceedings of the 18th International Conference on Composites Materials (ICCM-18), Jeju, Republic of Korea, 21–26 August 2011. [Google Scholar]
  43. Cao, X.; Deng, X.; Jin, L.Z.; Fu, F.; Qian, K. Experimental study on shear capacity of cementitious composite RPC beams using high strength steel. Proc. Inst. Civil Eng. Struct. Build. 2019, 174, 276–291. [Google Scholar] [CrossRef]
  44. Wu, X.; Han, S.M. First diagonal cracking and ultimate shear of I-shaped reinforced girders of ultra-high performance fiber reinforced concrete without stirrup. Int. J. Concr. Struct. Mater. 2009, 3, 47–56. [Google Scholar] [CrossRef]
  45. Pansuk, W.; Nguyen, T.N.; Sato, Y.; Den Uijl, J.A.; Walraven, J.C. Shear capacity of high performance fiber reinforced concrete I-beams. Constr. Build. Mater. 2017, 157, 182–193. [Google Scholar] [CrossRef]
  46. Yang, J.; Doh, J.H.; Yan, K.; Zhang, X. Experimental investigation and prediction of shear capacity for UHPC beams. Case Stud. Constr. Mater. 2022, 16, e01097. [Google Scholar] [CrossRef]
  47. Wang, Q.; Song, H.L.; Lu, C.L.; Jin, L.Z. Shear performance of reinforced ultra-high performance concrete rectangular section beams. Structures 2020, 27, 1184–1194. [Google Scholar] [CrossRef]
  48. Lee, J.H.; Hong, S.G. Shear strength of ultra-high performance fiber-reinforced concrete (UHPFRC) I-shaped beams without stirrup. J. Korea Concr. Inst. 2017, 29, 53–64. [Google Scholar] [CrossRef]
  49. Telleen, K.; Noshiravani, T.; Galrito, R.; Brühwiler, E. Experimental investigation into the shear resistance of a reinforced UHPFRC web element. In Proceedings of the 8th fib PhD Symposium in Kgs, Lyngby, Denmark, 20–23 June 2010. [Google Scholar]
  50. Thiemicke, J. Zum Querkrafttragverhalten von UHPC-Balken Mit Kombinierter Bewehrung aus Stahlfasern und Stabstahl; Kassel University Press GmbH: Kassel, Germany, 2015; Volume 25. [Google Scholar]
  51. El-Helou, R.G.; Haber, Z.B.; Graybeal, B.A. Mechanical behavior and design properties of ultra-high-performance concrete. ACI Mater. J. 2022, 119, 1. [Google Scholar]
  52. Yavaş, A.; Hasgul, U.; Turker, K.; Birol, T. Effective fiber type investigation on the shear behavior of ultra-high-performance fiber-reinforced concrete beams. Adv. Struct. Eng. 2019, 22, 1591–1605. [Google Scholar] [CrossRef]
  53. Valentim, D.B.; Aaleti, S.; Kreger, M. Evaluation of test methods to characterize tensile strength of ultra-high-performance concrete. ACI Mater. J. 2022, 119, 4. [Google Scholar]
  54. Haber, Z.B.; De la Varga, I.; Graybeal, B.A.; Nakashoji, B.; El-Helou, R. Properties and Behavior of UHPC-Class Materials; FHWA-HRT-18-036; United States Federal Highway Administration. Office of Infrastructure Research and Development: McLean, VA, USA, 2018.
  55. Chen, S.; Zhang, R.; Jia, L.J.; Wang, J.Y. Flexural behaviour of rebar-reinforced ultra-high-performance concrete beams. Mag. Concr. Res. 2018, 70, 997–1015. [Google Scholar] [CrossRef]
  56. Yoo, D.Y.; Sohn, H.K.; Borges, P.H.; Fediuk, R.; Kim, S. Enhancing the tensile performance of ultra-high-performance concrete through strategic use of novel half-hooked steel fibers. J. Mater. Res. Technol. 2020, 9, 2914–2925. [Google Scholar] [CrossRef]
  57. Yoo, D.Y.; Banthia, N.; Yoon, Y.S. Experimental and numerical study on flexural behavior of UHPFRC beams with low reinforcement ratios. Can. J. Civ. Eng. 2017, 44, 18–28. [Google Scholar] [CrossRef]
Figure 1. Experimental database according to: (a) reinforcement, (b) shear reinforcement, and (c) cross-section type.
Jcs 09 00211 g001
Figure 2. Material and geometric properties of UHPC girders in the compiled database.
Jcs 09 00211 g002
Figure 3. Stress–strain behavior of UHPC under direct tension [5].
Jcs 09 00211 g003
Figure 4. Measured versus predicted shear strength according to prediction models: (a) FHWA, (b) ePCI, (c) French, (d) Canadian, and (e) DafStb methods.
Jcs 09 00211 g004
Figure 5. Shear strength ratios for all models with respect to geometrical properties (h, bw, a/d): (a) FHWA, (b) ePCI, (c) French, (d) Canadian, and (e) DAfStb models.
Jcs 09 00211 g005
Figure 6. Shear strength ratios for all models with respect to concrete and reinforcing properties (f’c, ρv, P/A): (a) FHWA, (b) ePCI, (c) French, (d) Canadian, and (e) DAfStb models.
Jcs 09 00211 g006
Table 1. Contributions of fibers and shear reinforcement according to the DAfStb method.
Shear Spana/d ≥ 20.5 ≤ a/d < 2
Fiber contribution V R d , f = b v h η f f c f t d V R d , f + V R d , s = ( min 0.75 a ,   h )   b v η f f c f t d + A v   f y w d
Stirrup contribution V R d , s = A v s z   f y w d cot θ
cot θ = 1.2 + 2.4 σ c p f c d 1.0
Table 2. UHPC beam database.
Reference# of TestsSectionf’c (MPa) Vf lf/dfa/dh (mm) bw (mm) Aps (mm2)
[11]9I-shaped203–205130–1672.538065900
[31]8I-shaped125–14075–1503.265050840
[32]6I-shaped150–17082–1633.3650501680
[13]3I-shaped103–10548.8240070280
[10]8I-shaped168–18965–1302.5–3.470040, 501680
[33]3I-shaped193.0130.02.5, 2.89101522230
[12]6I-shaped125–127120.001.1, 2, 330050420
[5]6I-shaped137–160130.03.1–3.9889, 109276.2, 101.64560
[25]13I-shaped126–155125, 159, 1901.2–3.4863.650–1013640
[9]5I-shaped195–21297–1002.5–8.538065840
[34]3Rectangle108.2751.5–2.5340160140
[35]15I, box-shaped118–155130, 160, 1902.5–4800–150050–1521680
[44]7I-shaped128–14540, 75, 65, 1001.6050065372
[37]2I-shaped126.01301.1–3.360070280
[38]10I-shaped152–18977, 1473.0–3.5600–1000401115
[39]1I-shaped173.21632.5010671146580
[40]1Rectangle166.9131.2532901500
[41]13I-shaped160–18875, 1503.25350600
[42]2Rectangle100, 2008023502000
[43]31T-shaped, Rectangle115–12565, 130, 1951.5–3.02501500
[44]8I-shaped144–15265.0, 130.0, 1954–8.0380, 460500
[27]2I-shaped147.6952, 1301.6–3220, 400500
[18]3Rectangle1402001.233002000
[46]8Rectangle130–152172.251.5–3.03502500
[47]11Rectangle127, 13165, 130, 195, 2601.5–2.32501500
[48]9I-shaped160–17097.52.5, 3.5520, 700400
[49]2I-shaped1501952.8200200
[50]3I-shaped198–21137.1, 74.24330300
Average--149.58130.22.8517.191.11709.6
Max.--21226081422.42506580
Min.--10037.11.520020140
Table 3. UHPC direct tension database for the proposed Equation (35).
ReferenceNo. of SpecimensVf lf/df (%) f’c (MPa) ftloc (MPa)
[51]3186.70–260.084.8–170.36.4–12.5
[5]6130.0137.0–160.08.6–11.5
[52]854.5–121.9129.0–140.05.0–9.4
[53]1262.5171.0–195.06.9–11.9
[54]586.7–130.093.8–148.06.4–12.5
[55]4130.0126.011.9
[56]6130.0–290.0150.015.1–15.7
[57]4130.0196.512.2
Table 4. Summary of evaluation statistics of prediction models.
Prediction ModelVexp/Vpred.
Avg.
Vexp/Vpred.
SD.
Vexp/Vpred.
CoV (%)
Vexp/Vpred.
RRMSE (%)
Vexp/Vpred.
>2
Vexp/Vpred.
<0.75
FHWA method [24]1.190.2924.635.7211
ePCI method [25]1.580.4327.455.1280
AFGC method [26]1.240.4435.537.91320
CSA method [27]1.140.3429.538.6515
DAfStb method [28]1.400.5539.659.72823
Table 5. Evaluation statistics for prediction models based on reinforcement.
Non-Prestressed (n = 97)Prestressed (n = 101)
No Av (n = 60)With Av (n = 37)No Av (n = 72)With Av (n = 29)
MethodAvg.CoV %<0.75Avg.CoV %<0.75Avg.CoV %<0.75Avg.CoV. %<0.75
FHWA [24]1.1729.451.1822.331.1923.921.2715.81
ePCI [25]1.6430.301.4019.101.6528.401.5418.90
AFGC [26]1.1948.6140.9721.651.4226.801.2516.11
CSA [27]1.2031.740.9422.231.1528.971.2522.11
DAfStb [28]1.4038.361.5428.011.4839.271.0148.59
Disclaimer/Publisher’s Note: The statements, opinions and data contained in all publications are solely those of the individual author(s) and contributor(s) and not of MDPI and/or the editor(s). MDPI and/or the editor(s) disclaim responsibility for any injury to people or property resulting from any ideas, methods, instructions or products referred to in the content.

