Article

Effects of Matrix Properties on the Interfacial Shear Strength Between Carbon Fiber and Various Thermoplastic Polymers, and Their Influence on the Mechanical Properties of Composites

Department of Biomedical Engineering, Doshisha University, Kyotanabe 610-0394, Japan
*
Author to whom correspondence should be addressed.
J. Compos. Sci. 2025, 9(4), 174; https://doi.org/10.3390/jcs9040174
Submission received: 10 February 2025 / Revised: 22 March 2025 / Accepted: 31 March 2025 / Published: 2 April 2025
(This article belongs to the Special Issue Carbon Fiber Composites, 4th Edition)

Abstract

:
Although fiber–matrix interfacial strengths, which affect the mechanical properties of fiber-reinforced plastics (FRPs), are considered to be determined by complex factors, few studies have systematically evaluated the relationship between the matrix properties and the fiber–matrix interfacial shear strength. In this study, the properties of various thermoplastics were measured, and the matrix tightening stress that constricts the fiber was simulated using finite element method (FEM) analysis. The relationships between the fiber–matrix interfacial shear strength and the matrix properties were clarified. The mechanical properties of carbon fiber reinforced thermoplastic (CFRTP) laminates were also evaluated, and the relationships between the fiber–matrix interfacial shear strength and the mechanical properties of CFRTP laminates were examined. The fiber–matrix interfacial shear strength showed a positive correlation with the matrix tightening stress tightening the fiber in the radial direction, as well as with matrix density, tensile strength, modulus, and melting temperature, while a negative correlation was found with the coefficient of linear expansion of the matrix. A higher fiber–matrix interfacial shear strength can be achieved by using a matrix with higher density, even without direct evaluation of the fiber–matrix interfacial strength, as the fiber–matrix interfacial shear strength showed a strong positive correlation with matrix density. Furthermore, the mechanical properties of CFRTP laminates were enhanced when matrices with higher fiber–matrix interfacial shear strength were used.

1. Introduction

In recent years, various initiatives have been undertaken worldwide to reduce greenhouse gas emissions. In the transportation sector, there is an increasing demand to lower carbon dioxide emissions during both the manufacture and operation of automobiles and aircraft. One effective approach to address this issue is the lightening of vehicle and aircraft structures [1,2,3,4]. Therefore, the use of fiber reinforced plastics (FRPs), which offer superior specific strength and specific stiffness compared to metal, is gaining significant attention [5,6,7]. Among these materials, carbon fiber reinforced thermoplastics (CFRTPs), which use carbon fiber as the reinforcing fiber and thermoplastic polymers as the matrix, are particularly promising due to their excellent productivity and recyclability [8,9,10]. The mechanical properties of FRP are influenced not only by the strength of the fiber and the matrix, but also by the fiber–matrix interfacial strength [11,12,13,14,15]. Therefore, evaluating the strength of the fiber–matrix interface is essential. Numerous studies have evaluated the fiber–matrix interfacial strength using various methods, such as the microdroplet test, single fiber pull-out test, push-out test, and fragmentation test. Among these, the microdroplet test, which determines fiber–matrix interfacial shear strength by measuring the load required to debond a matrix droplet from a single fiber, is widely used because it is relatively simple to prepare the test specimen, and the measured fiber–matrix interfacial shear strength closely aligns with the simulated value [16]. Previous studies have demonstrated that fiber–matrix interfacial shear strength can be enhanced by increasing the molecular weight of the thermoplastic epoxy, which can be controlled through molding conditions [17]. Another study reported that the matrix tightening stress, which constricts the fiber in the microdroplet test, can be calculated based on the modulus, coefficient of thermal expansion, Poisson’s ratio of the matrix and fiber, and the melting temperature of the matrix [18]. Furthermore, a study using carbon fiber and a silica (SiO2)-modified matrix in single-fiber pull-out tests revealed that increasing SiO2 content leads to a higher interfacial shear strength due to enhanced matrix tightening stress on the fiber [19]. Another study, which evaluated the physical bonding factors responsible for fiber–matrix interfacial shear strength using glass fiber as the reinforcing fiber and polyamide as the matrix, reported that physical bonding at the fiber–matrix interface shear strength is positively correlated with the density of the polyamide [20]. In addition, numerous studies have focused on the effects of fiber–matrix interfacial shear strength on the mechanical properties of FRP, which are considered to be determined by complex factors. However, few studies have systematically examined the relationship between the matrix properties and the fiber–matrix interfacial shear strength.
This study aims to clarify the correlation between matrix properties, the matrix tightening stress affected by the matrix on the fiber in the microdroplet test, and the fiber–matrix interfacial shear strength. The properties of various thermoplastics widely used in industrial applications were measured, and the matrix tightening stress that constricts the carbon fiber was simulated by finite element method (FEM) analysis. The relationships between fiber–matrix interfacial shear strength, obtained by the microdroplet test, and matrix properties were clarified. The mechanical properties of CFRTP laminates were also evaluated using a short-beam three-point bending test and a three-point bending test to examine the correlations between fiber–matrix interfacial shear strength and the mechanical properties of CFRTP laminates.

2. Materials and Methods

2.1. Materials

Polyamide 6 (PA6, 1015B, UBE Corporation, Tokyo, Japan), Polyamide 66 (PA66, LeonaTM, grade: 1300, Asahi Kasei Corp., Tokyo, Japan), Polyamide 12 (PA12, 3014U, UBE Corporation, Tokyo, Japan), and Polypropylene (PP, MA3, Japan Polypropylene Corporation, Tokyo, Japan) were used for the microdroplet test and matrix property evaluation. Spread PAN-based carbon fiber (24K, Nippon Tokushu Fabric Inc., Fukui, Japan) was used for the microdroplet test. The sizing agent was removed from the spread carbon fiber by heat treatment at 370 °C for 30 min in an argon atmosphere using a chemical vapor deposition system (MPCVD-70, Microphase Co., Ltd., Ibaraki, Japan). This treated fiber is hereafter referred to as Unsized-CF. For the matrix of CFRTP laminates, PA6 (1015B, UBE Corporation, Tokyo, Japan), PA66 (LeonaTM, grade: 1300, Asahi Kasei Corp., Tokyo, Japan), PA12 (3014U, UBE Corporation, Tokyo, Japan), and PP (SA03, Japan Polypropylene Corporation, Tokyo, Japan) were processed into nonwoven fabrics or films. Specifically, PA6 nonwoven fabric (43.5 g/m2), PA66 film (189.2 g/m2), PA12 nonwoven fabric (42.0 g/m2), and PP nonwoven fabric (50.5 g/m2) were used. Plain weave carbon fiber (T300 grade, 200 g/m2, Japan Composite Materials, Hyogo, Japan) was used as the reinforcement. The sizing agent was removed from the plain weave carbon fiber by heat treatment at 370 °C for 5 h in an argon atmosphere using a gas displacement electric furnace (FO811, Yamato Scientific Co., Ltd., Tokyo, Japan). This treated plain weave carbon fiber is hereafter referred to as Unsized-CFW. All matrix samples in this study were subjected to drying treatment at 80 °C under a vacuum environment prior to experimentation and evaluation to eliminate the effects of moisture absorption by the matrix.

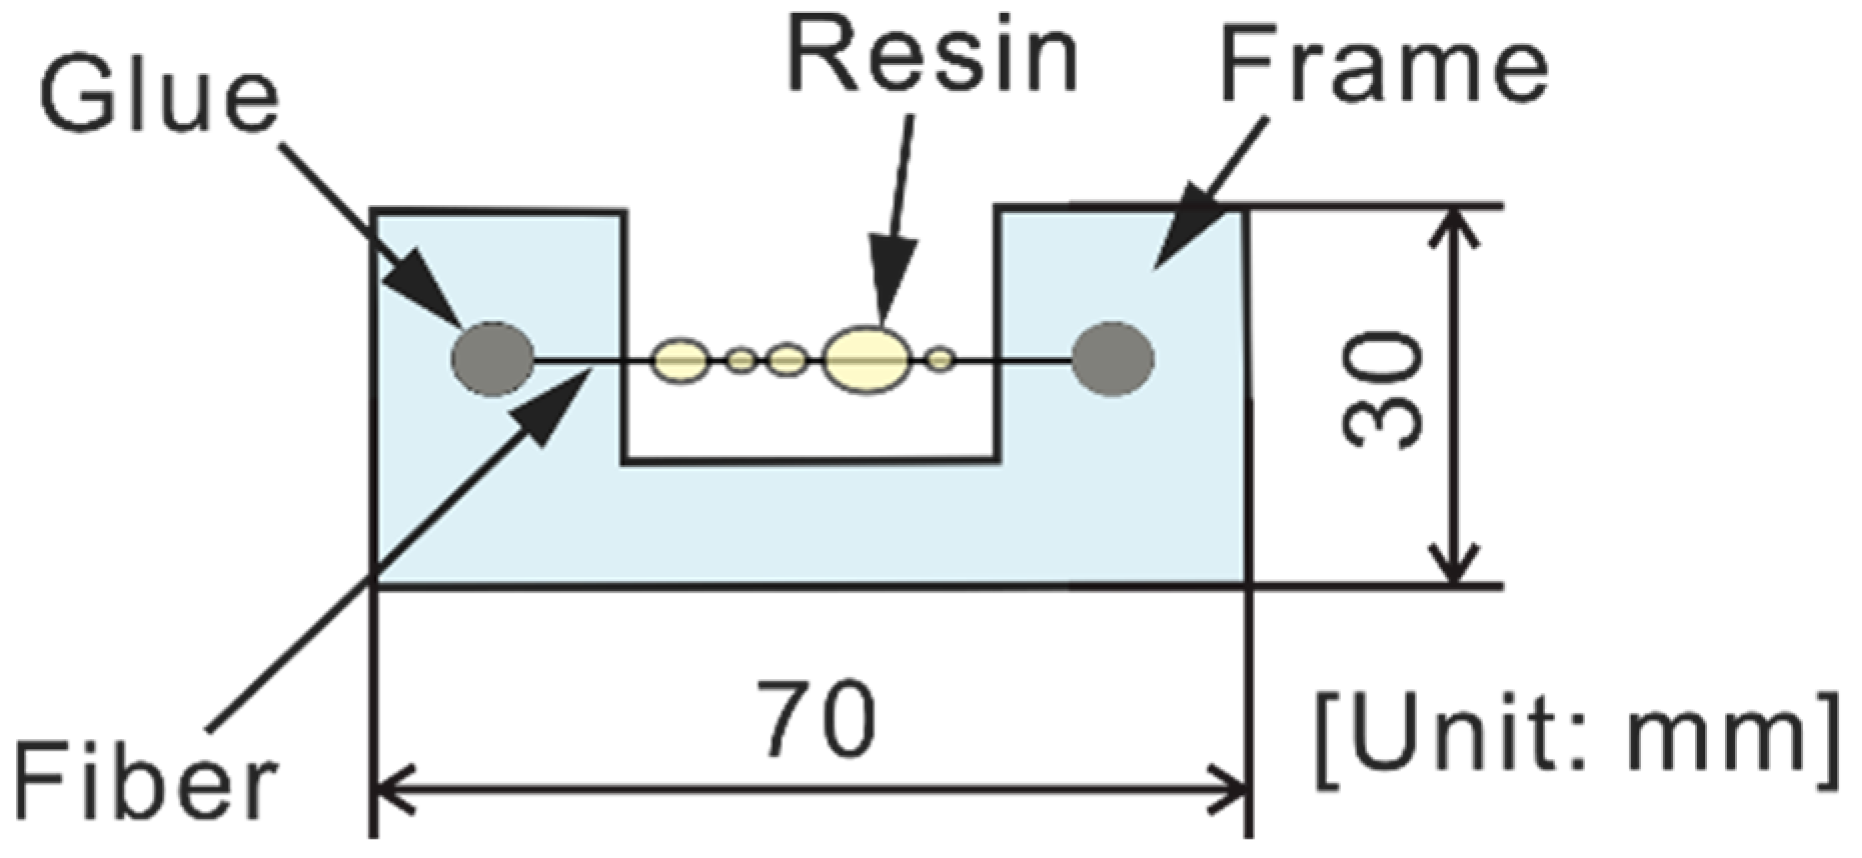
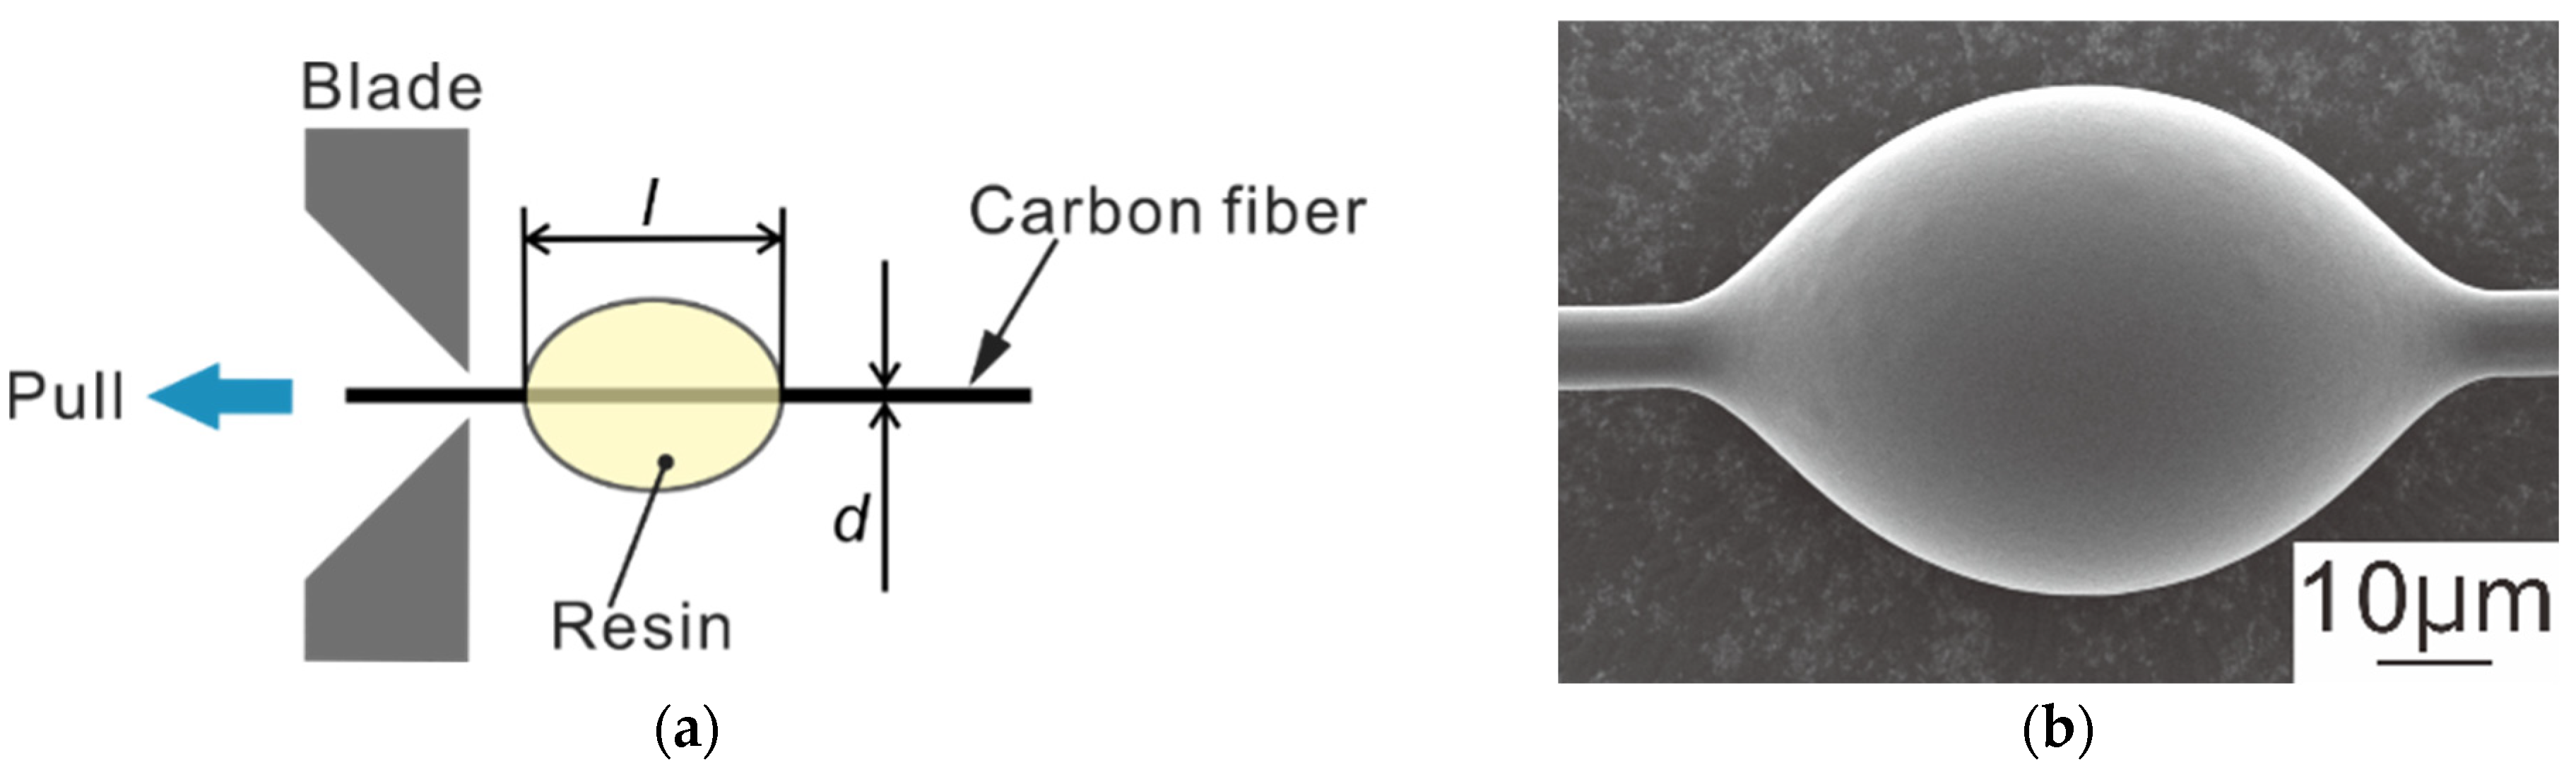
2.2. Microdroplet Test

The fiber–matrix interfacial shear strength τ f was evaluated using the microdroplet test. Figure 1 shows a schematic diagram of a microdroplet test specimen. The microdroplet test specimens were prepared by dipping the Unsized-CF, fixed on a frame, into a molten matrix using a high-speed dip coater (DC-4300, Aiden Corp., Hyogo, Japan). The matrix was melted on a temperature-controlled hot plate (PH131B-PCC10A, MSA Factory Co., Ltd., Tokyo, Japan) at 250 °C, 287 °C, 202 °C, and 240 °C for PA6, PA66, PA12, and PP, respectively. Unsized-CF was immersed in the molten matrix for 10 s with a withdrawal speed of 500 µm/s [19]. Figure 2 shows a schematic drawing of the microdroplet test and a scanning electron microscope (SEM) image of the matrix droplet. The interfacial shear strength was measured using an equipment of evaluating the interfacial properties of composite material (HM410, load cell capacity: 5 N, Tohei Sangyo Co., Ltd., Tokyo, Japan). Tests were conducted at a displacement rate of 2.0 µm/s with the blade tip positioned perpendicular to the fiber axis. The fiber–matrix interfacial shear strength τ f was calculated using Equation (1), where F m a x is the maximum debonding load during the microdroplet test, l is the embedded length, and d is the fiber diameter measured by SEM (JSM-6390LT, JEOL Ltd., Tokyo, Japan). The measured carbon fiber diameter ranged from 6.3 to 7.5 µm, and the embedded lengths were 58.0 to 73.5 µm for PA6, 55.0 to 66.0 µm for PA66, 62.8 to 82.7 µm for PA12, and 63.1 to 103.2 µm for PP.
τ f = F m a x π d l

2.3. Evaluation of Matrix Properties

2.3.1. Tensile Test

The tensile strength σ d and modulus E d of the matrices were measured for specimens prepared by injection molding using an injection-press hybrid molding machine (STIP05-05, SATOH MACHINERY WORKS Co., Ltd., Aichi, Japan). Tensile tests were conducted using a precision universal testing machine (Autograph AG-100kNX, SHIMADZU CORPORATION, Kyoto, Japan) at a displacement rate of 1.0 mm/s with a gauge length of 70 mm. The elongation of each specimen was measured using a video extensometer.

2.3.2. Thermal Analysis

The melting temperature T m of each matrix was measured using a differential scanning calorimeter (DSC-60, SHIMADZU CORPORATION, Kyoto, Japan) at a heating rate of 10 °C/min under atmospheric conditions.
The coefficient of linear expansion α of each matrix was measured using a thermomechanical analyzer (TMA-60, SHIMADZU CORPORATION, Kyoto, Japan). Injection-molded specimens (11 mm × 6 mm × 6 mm) were tested under atmospheric conditions at a heating rate of 10 °C/min with an initial load of 50 gf (490 mN). The temperature ranges were 30 °C to 190 °C for PA6, 30 °C to 230 °C for PA66, 30 °C to 150 °C for PA12, and 30 °C to 130 °C for PP, as shown in Table 1. The coefficient of linear expansion α was calculated using Equation (2), where Δ L is the dimensional change at the highest 10 °C interval in the solid phase. The temperature ranges were 180 °C to 190 °C for PA6, 220 °C to 230 °C for PA66, 140 °C to 150 °C for PA12, and 120 °C to 130 °C for PP. L 0 is the initial dimension at the lower temperature of each interval, and Δ T is 10 °C.
α = Δ L L 0 Δ T

2.3.3. Measurement of Matrix Density

The matrix density ρ was measured using an automatic gas pycnometer for true density (ULTRAPYC-1200e, Quantachrome Instruments Japan, Inc., Kanagawa, Japan) based on the gas displacement method with helium gas.

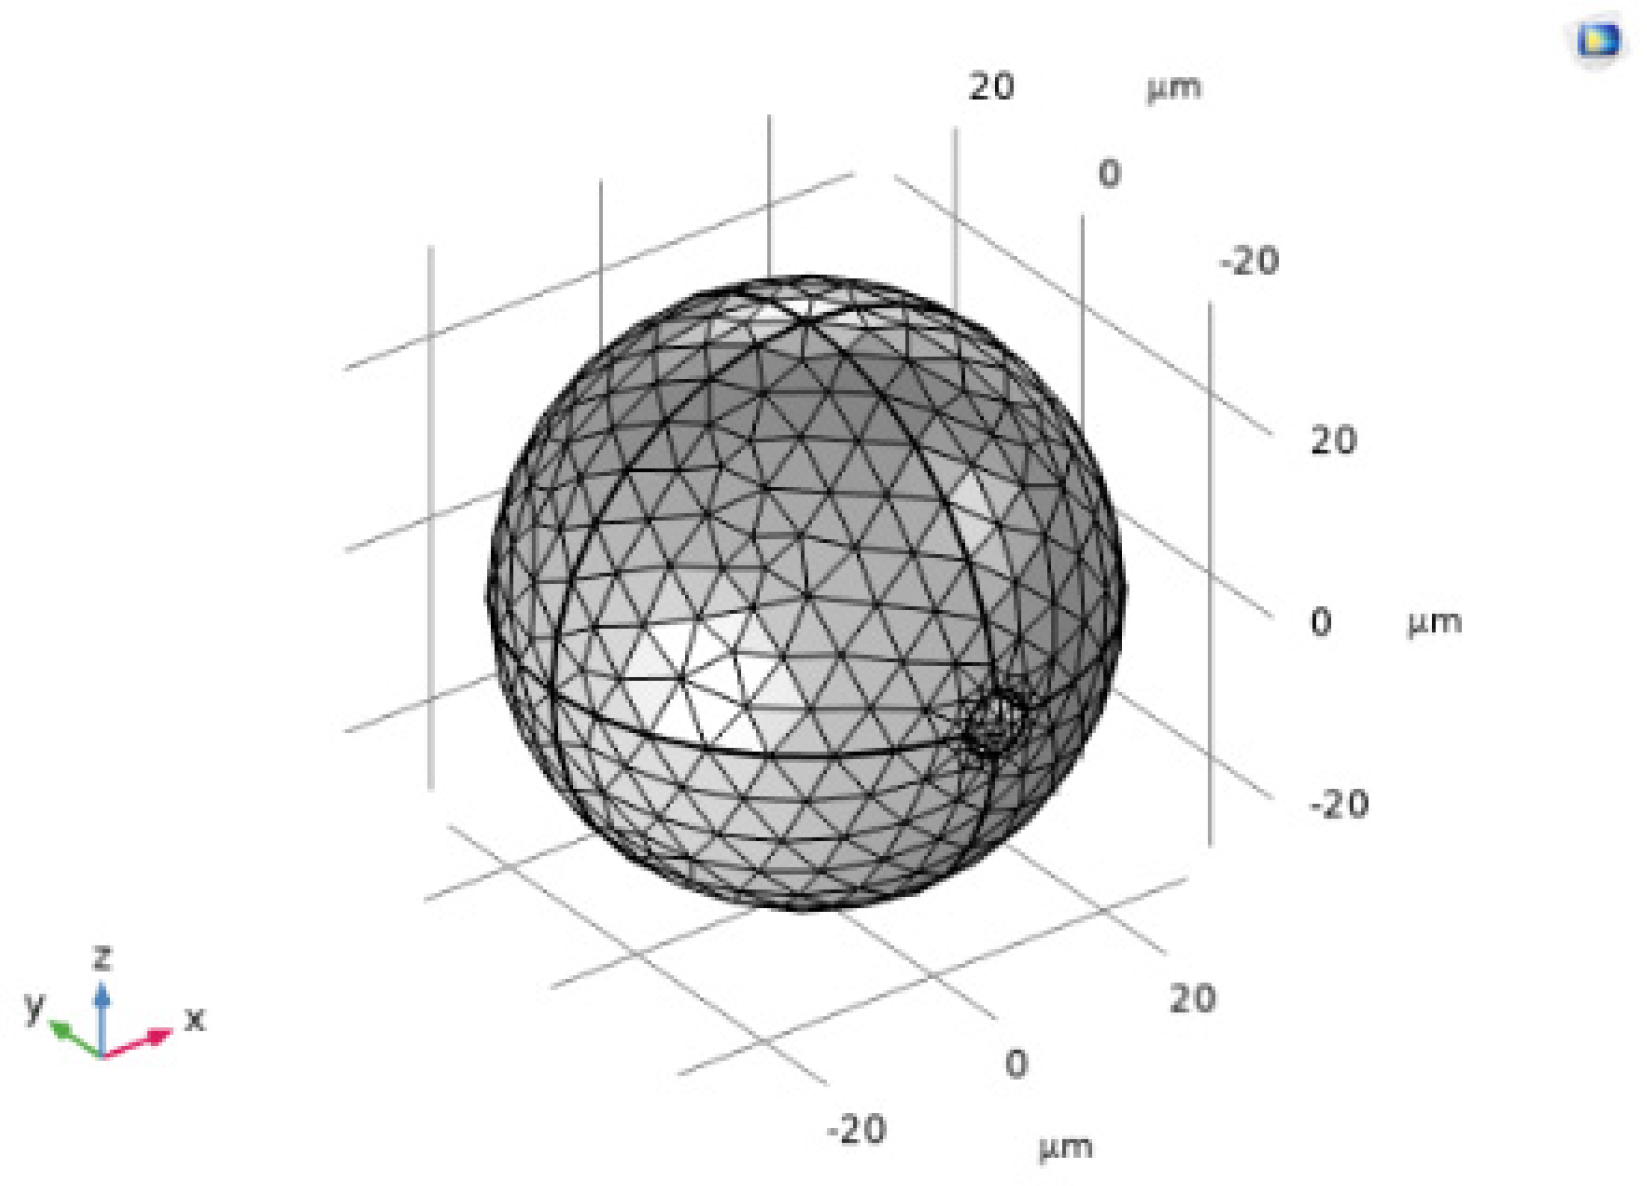
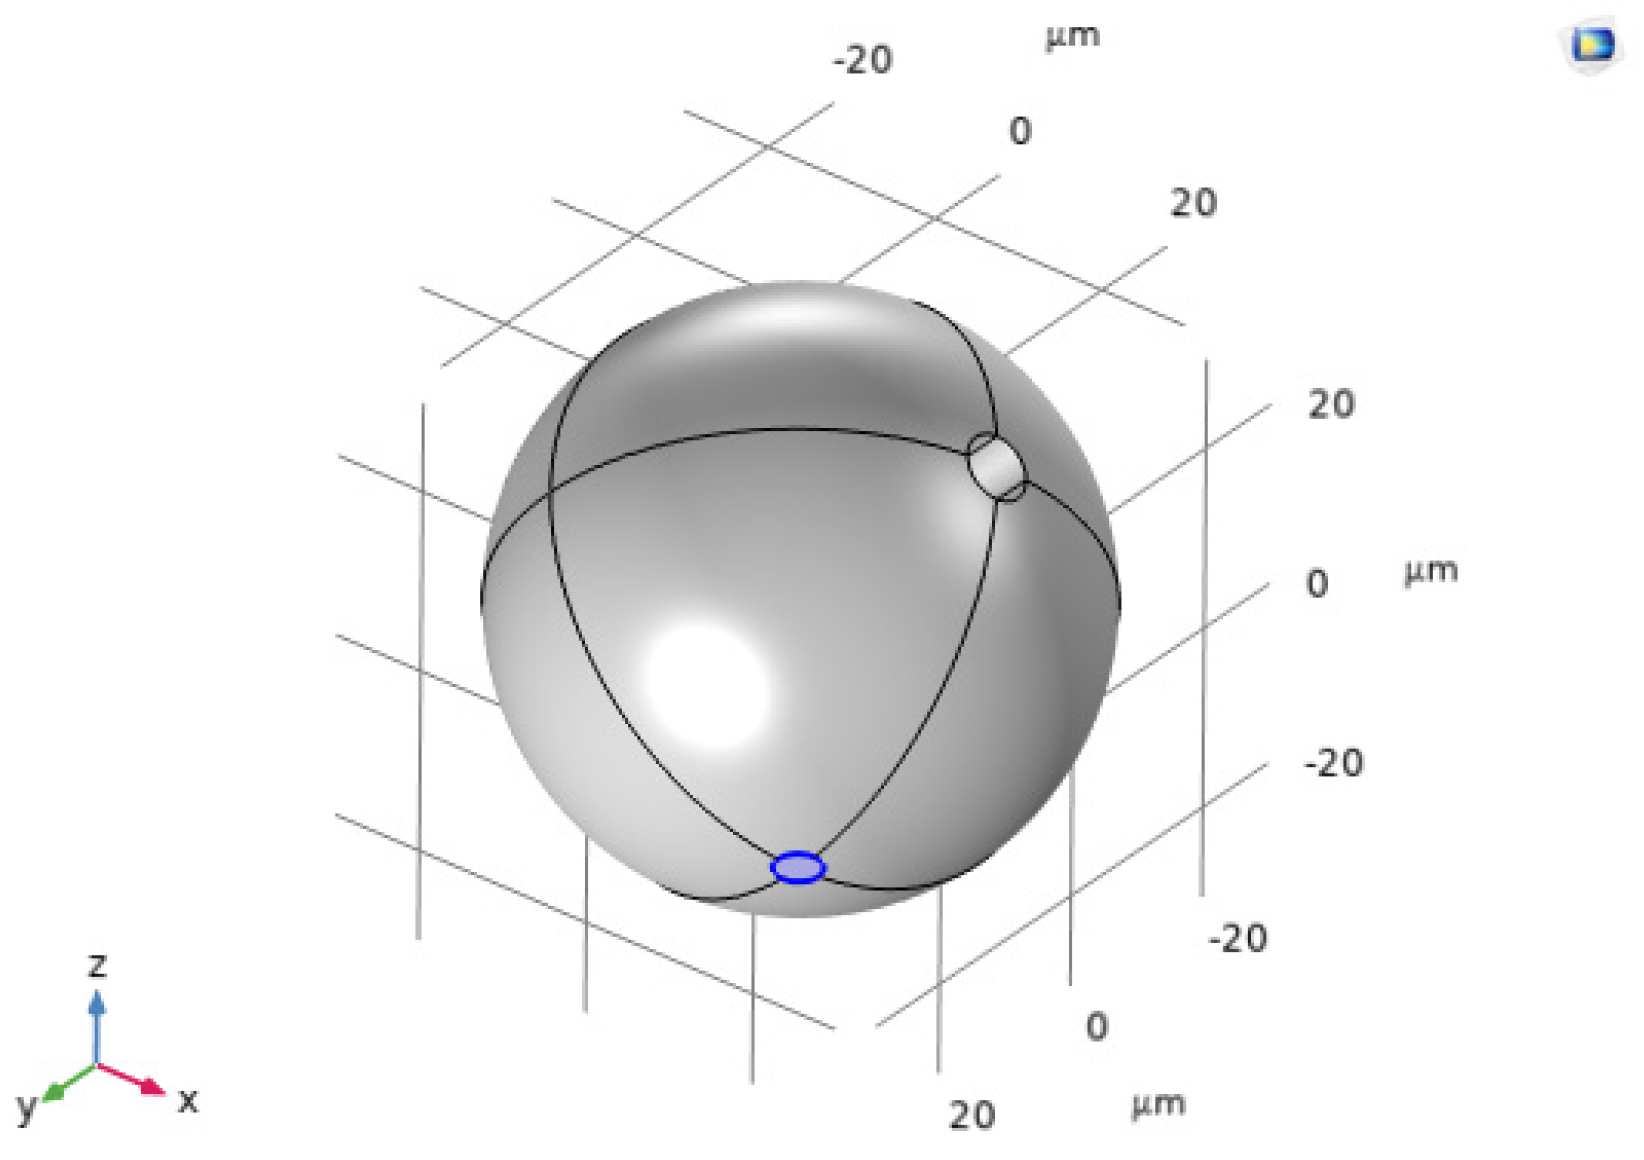
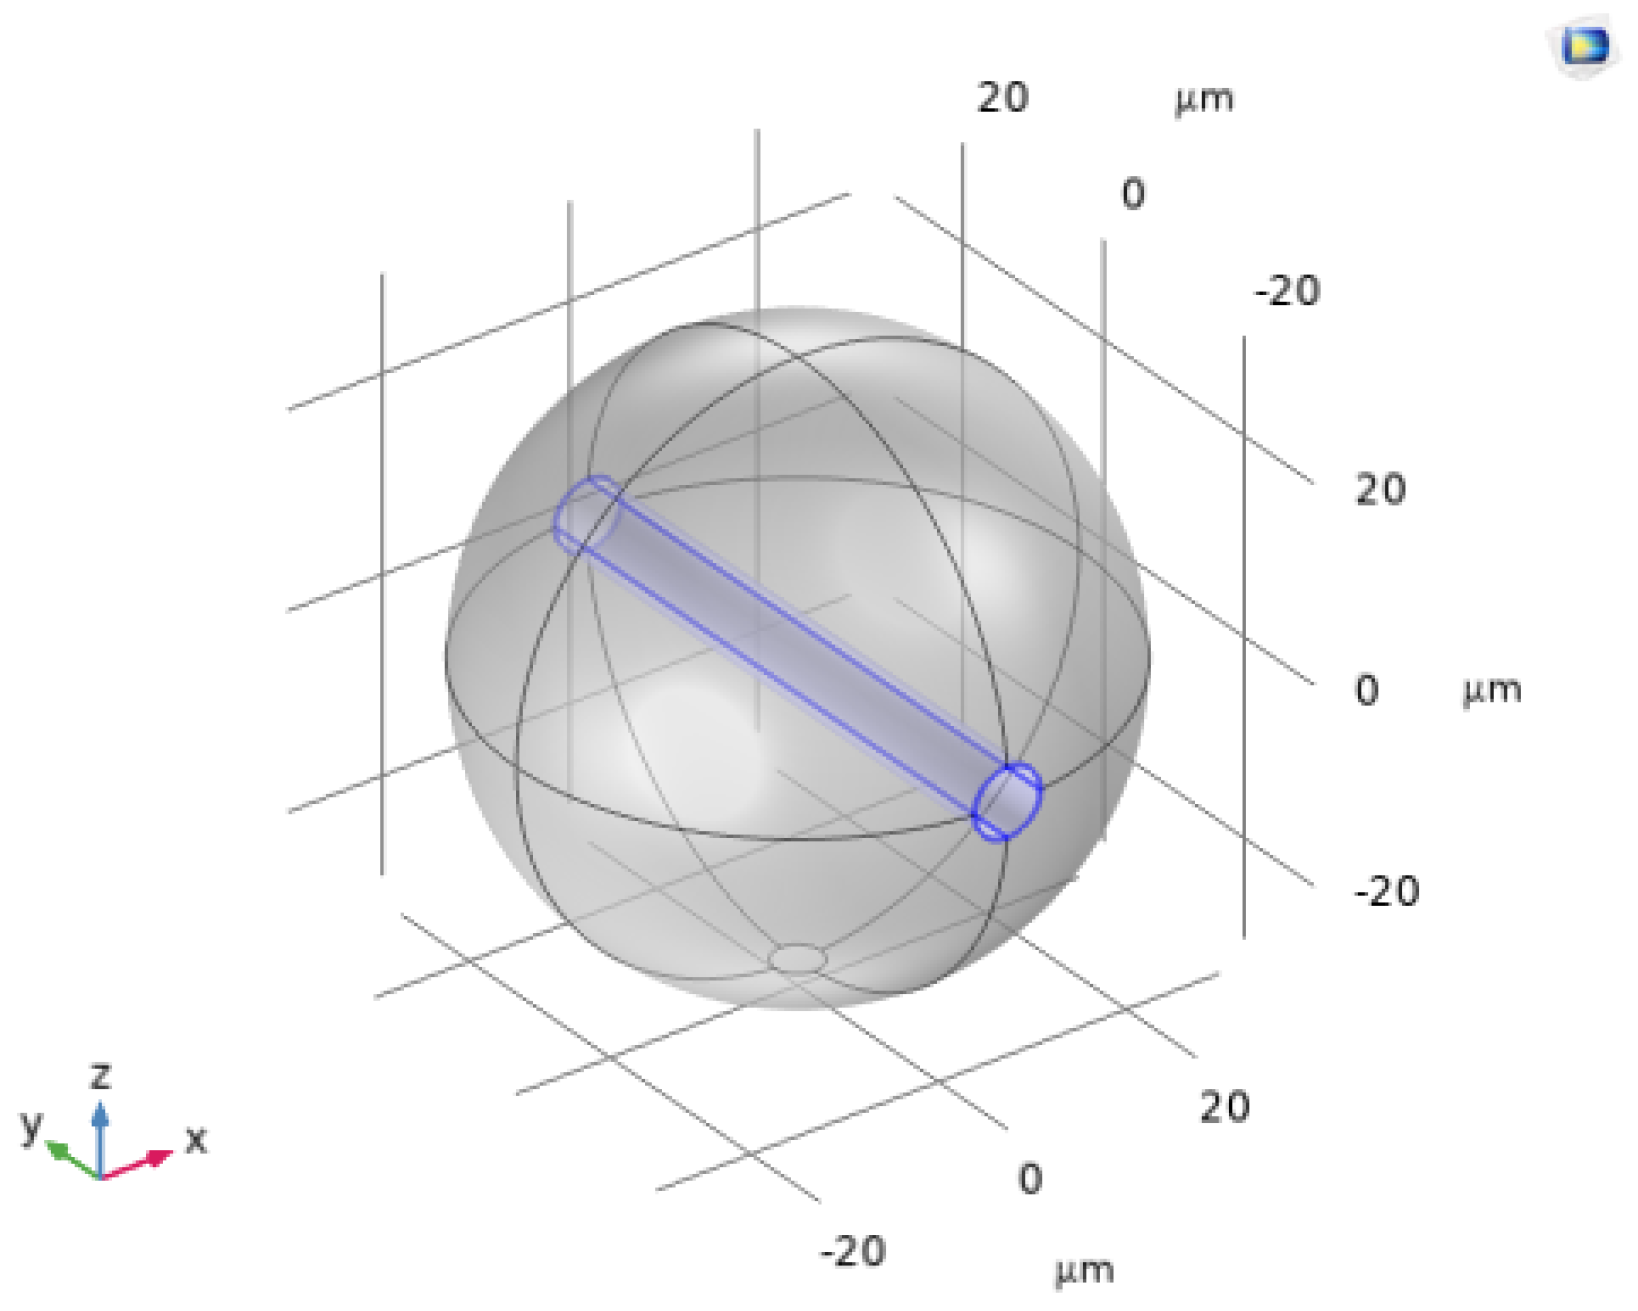
2.3.4. FEM Analysis of Matrix Tightening Stress

FEM analysis was performed using the structural mechanics module and heat transfer module of the COMSOL Multiphysics® 6.2 (Stockholm, Sweden) to estimate the matrix tightening stress q 0 on carbon fiber caused by the thermal shrinkage of the matrix in the microdroplet test. Figure 3 shows the analytical model. The matrix droplet was modeled as a sphere with a diameter of 60 µm and a cylindrical hole with a diameter of 7 µm. A fixed constraint was applied to a small region on the bottom surface, as shown in Figure 4, and the model contained 13,845 elements. In this analysis, the carbon fiber was assumed to be a rigid body due to its significantly greater modulus compared to the matrices. The matrix tightening stress q 0 was defined as the boundary stress required to restore the diameter of the thermally shrunk hole to its original size of 7 µm. The boundary load was applied to the inner surface of the cylindrical hole, as shown in Figure 5. The initial temperature of each matrix was set to its measured melting temperature, 223 °C for PA6, 264 °C for PA66, 180 °C for PA12, and 168 °C for PP, and each was then cooled to room temperature (25 °C). The modulus and coefficient of linear expansion of each matrix used in this analysis were based on experimentally obtained values, and a uniform Poisson’s ratio of 0.35 was used for all matrices. With the coefficient of linear expansion changing according to the temperature range, a coefficient of linear expansion calculated for every 10 °C interval was used, based on the results obtained in Section 2.3.2.

2.4. Molding of CFRTP Laminates

CFRTP laminates were molded using an injection-press hybrid molding machine with Unsized-CFW as reinforcement and nonwoven fabric or film as matrices. The matrix materials were placed between the Unsized-CFW layers and on the outermost surfaces to achieve a fiber volume fraction V f of 50%. The upper/lower mold temperatures were set to 280 °C/290 °C for PA6, 290 °C/300 °C for PA66, 230 °C/240 °C for PA12, and 230 °C/240 °C for PP. The molding process consisted of 4 min of preheating without pressure followed by 10 min of molding at 3 MPa. For PA6, PA12, and PP, after the initial 4 min of preheating, an additional 4 min of preheating under vacuum conditions was applied.

2.5. Evaluation of the Mechanical Properties of CFRTP Laminates

Interlaminar shear strength τ l , bending strength σ b and bending modulus E b of the CFRTP laminates were evaluated by a short-beam three-point bending test and a three-point bending test. The short-beam three-point bending tests were conducted according to JIS K 7057 using specimens with dimensions of 20 mm × 10 mm × 2 mm, which were cut from each CFRTP laminate at a displacement rate of 1.0 mm/min with a 10 mm span length. The three-point bending tests were conducted according to JIS K 7074 using specimens with dimensions of 100 mm × 15 mm × 2 mm, which were cut from each CFRTP laminate at a displacement rate of 5.0 mm/min with an 80 mm span length. A precision universal testing machine (Autograph AGXTM-V2, SHIMADZU CORPORATION, Kyoto, Japan) was used for both tests. The side surface of the specimen was observed using a digital microscope (VHX-5000, KEYENCE CORPORATION, Osaka, Japan) during the tests, and the fracture surfaces were examined using SEM.

3. Results and Discussion of Interfacial Shear Strength

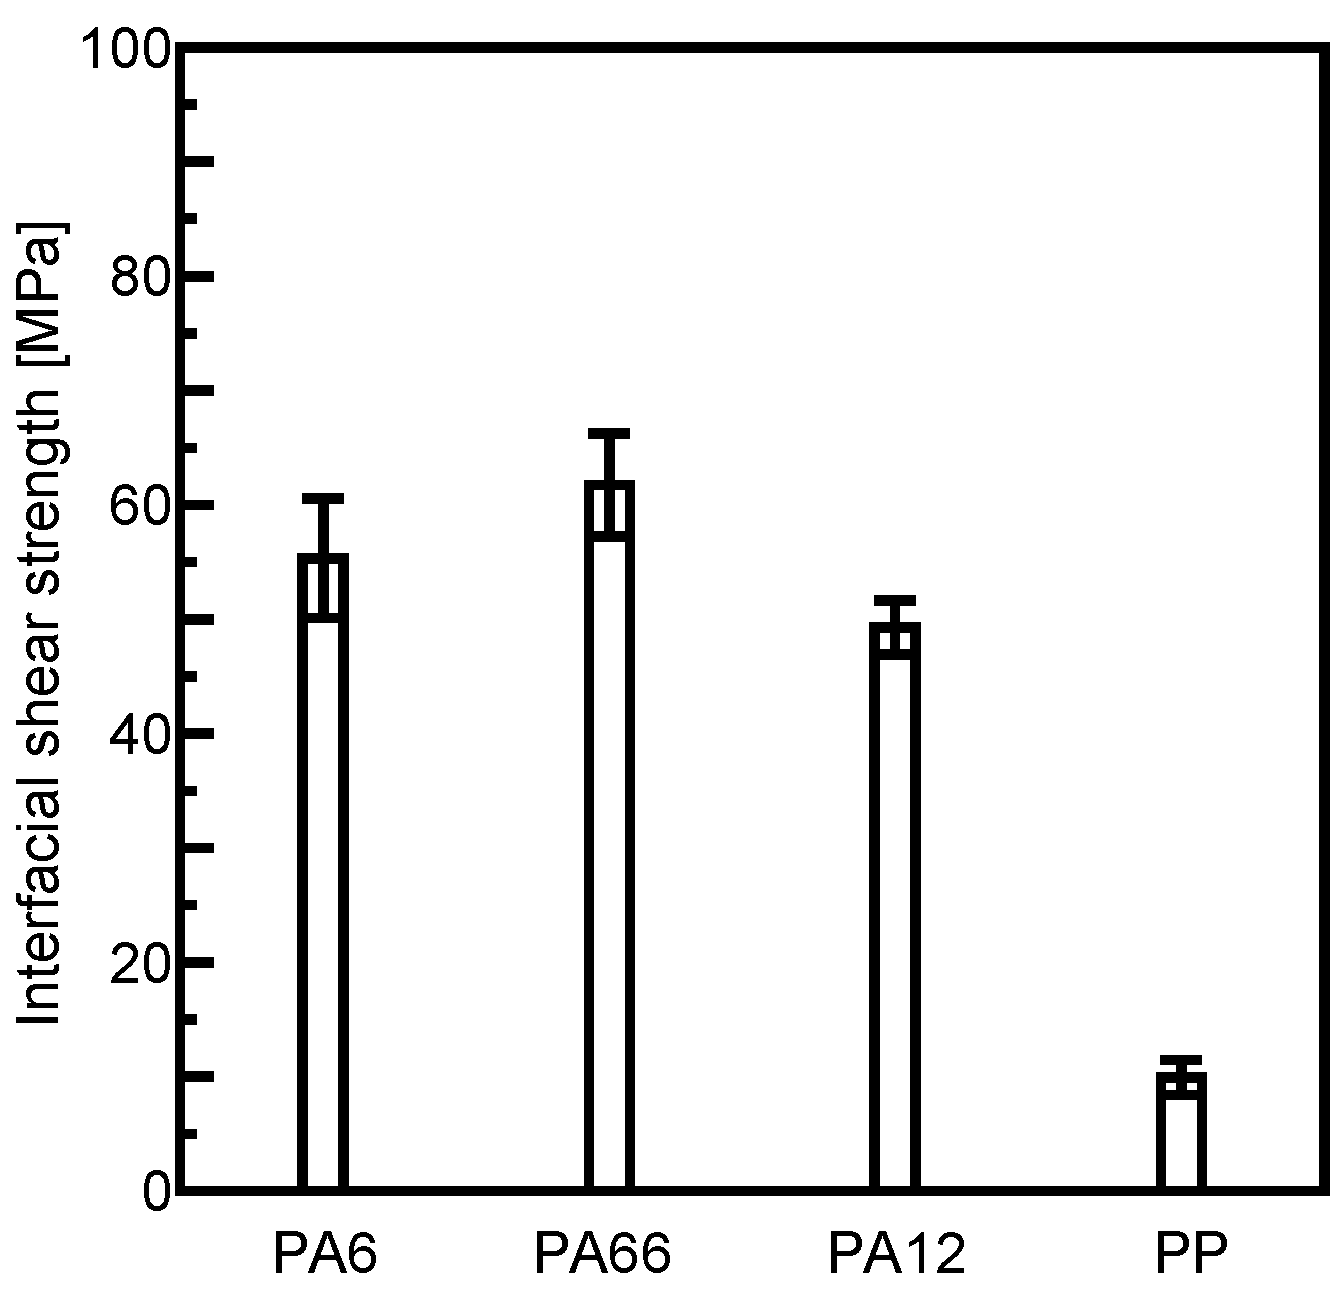
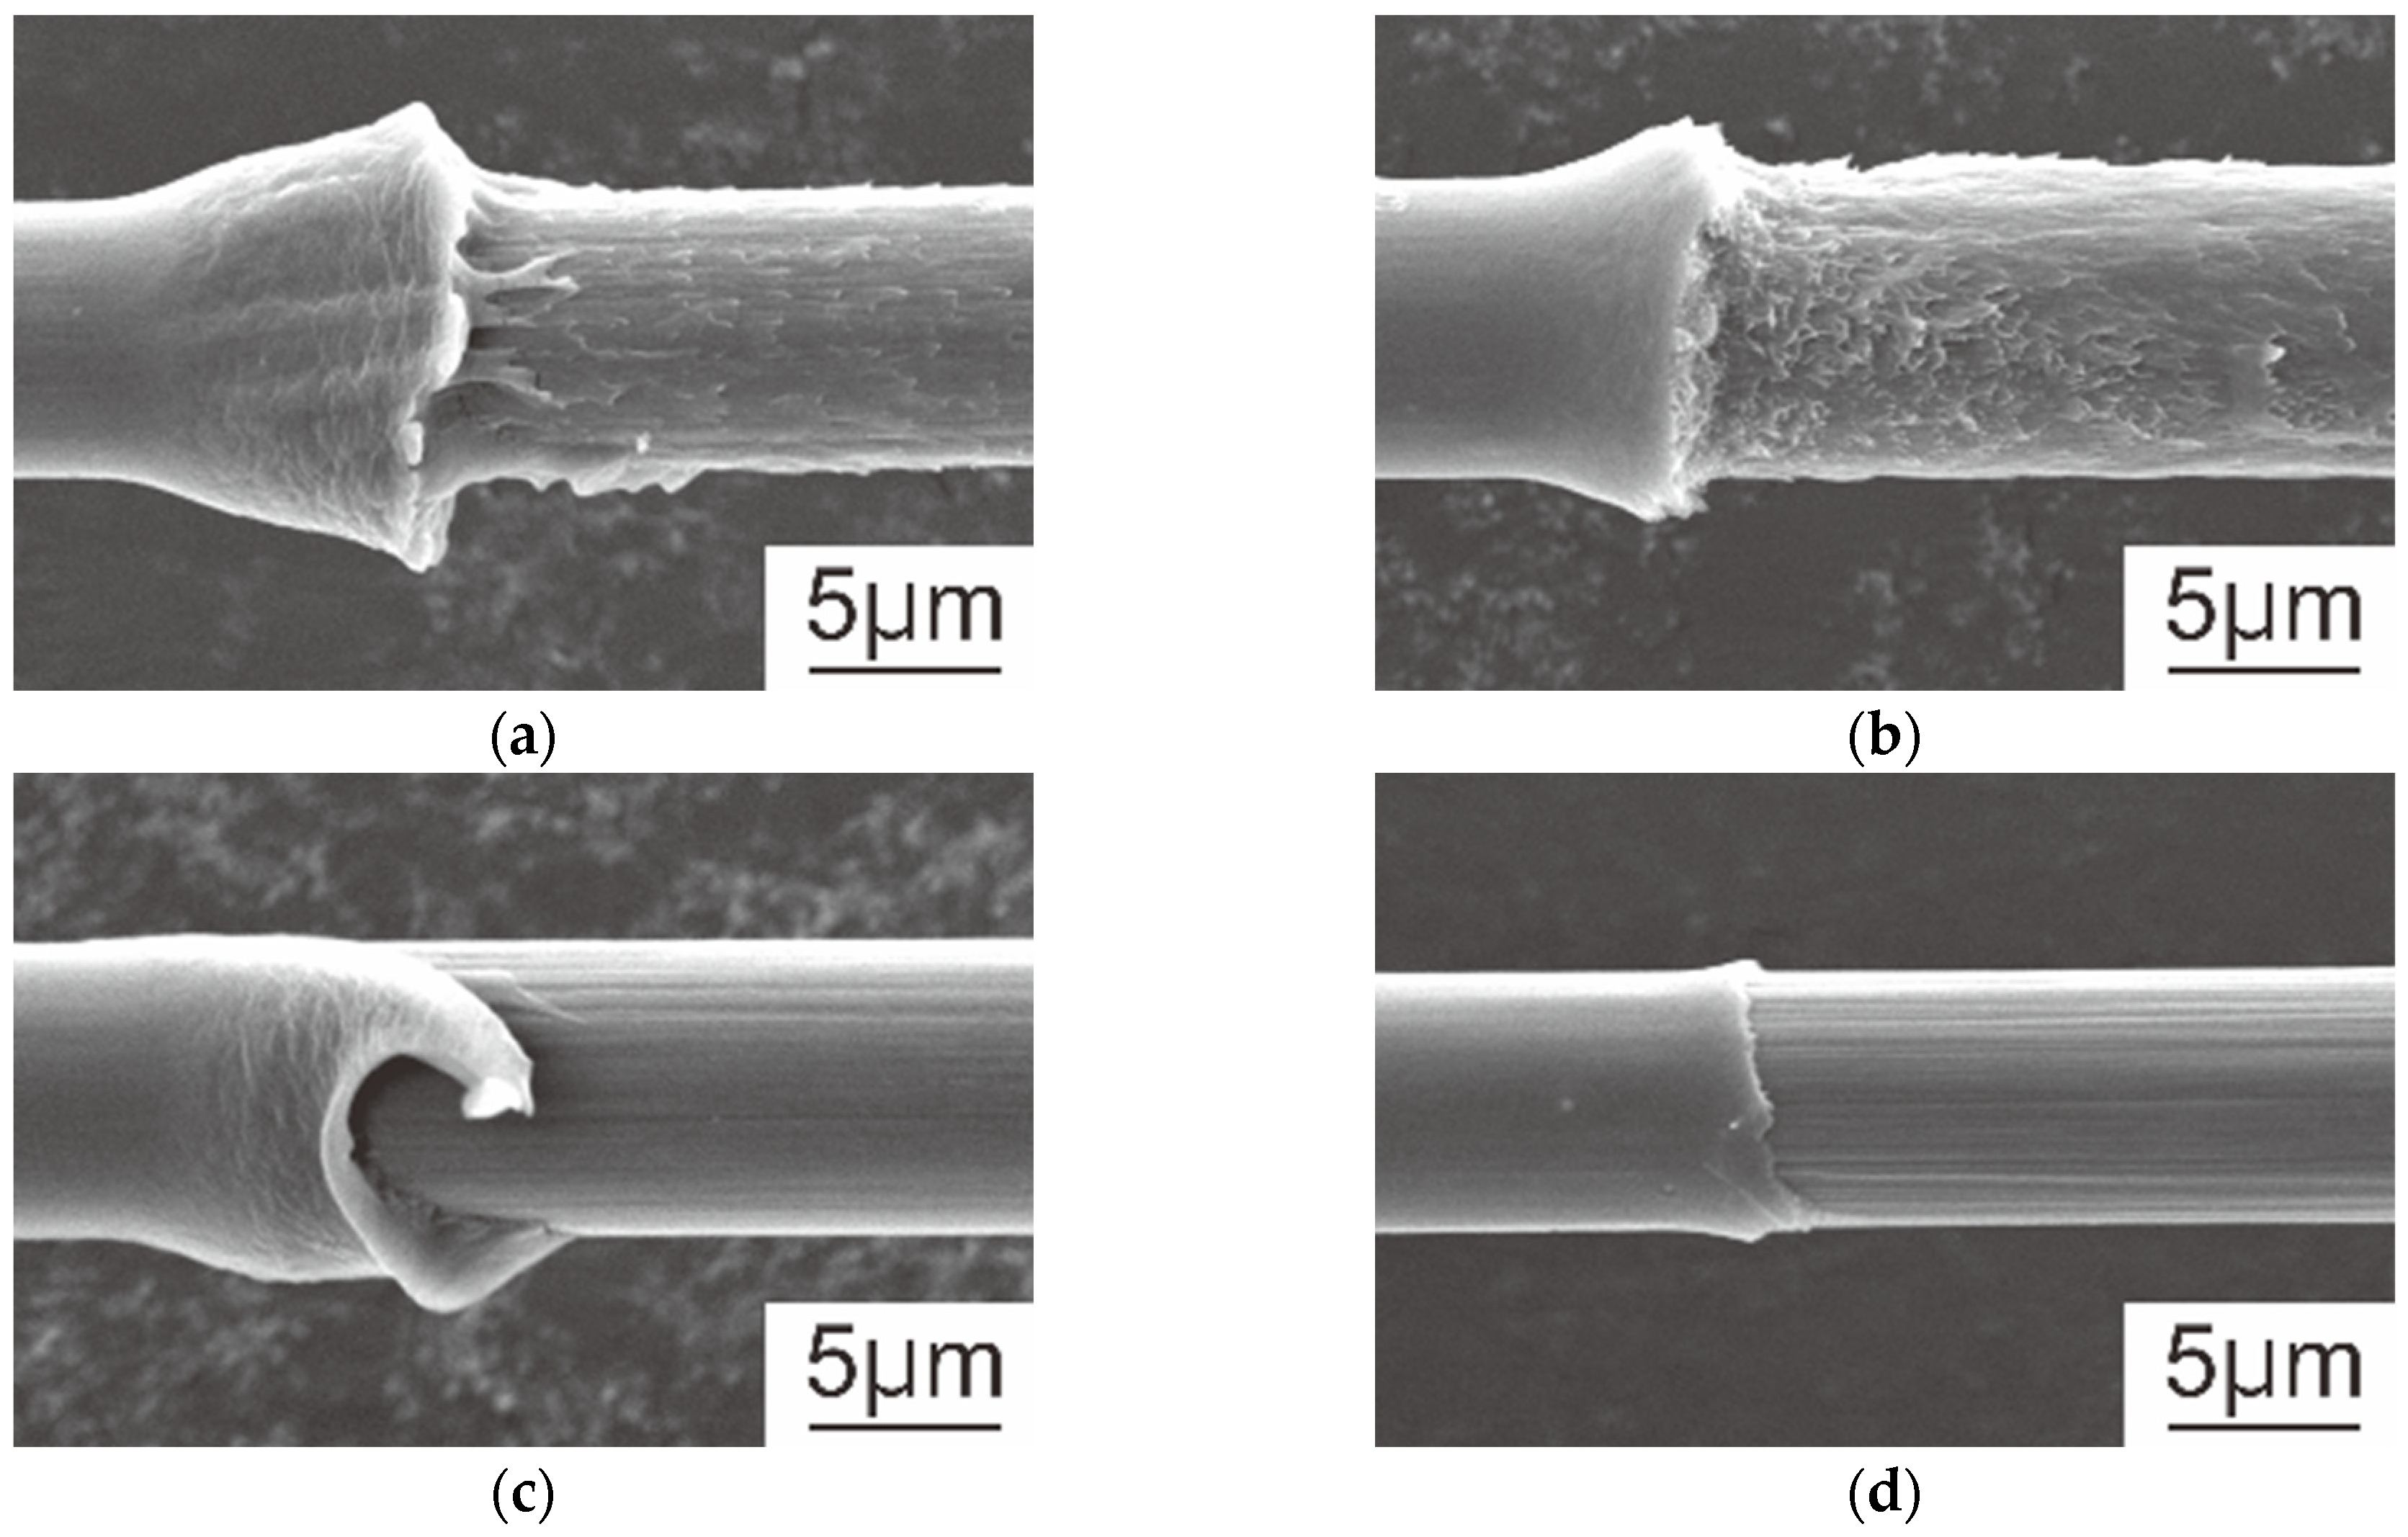
3.1. Microdroplet Test

Figure 6 shows the fiber–matrix interfacial shear strength τ f obtained by the microdroplet test. PA66 exhibited the highest fiber–matrix interfacial shear strength, followed by PA6, PA12, and PP. Figure 7 shows SEM images of the carbon fiber surface after the microdroplet test. The fractures of PA6 and PA66 occurred within the matrix near the carbon fiber, as indicated by the presence of matrix adhesion on the carbon fiber surface. In contrast, the fractures of PA12 and PP occurred at the fiber–matrix interface, where striated surface irregularities were observed on the carbon fiber surface. It has been reported that removing the sizing agent from the carbon fiber surface increases the proportion of C=O and COO groups [21], enabling the formation of chemical bonds or hydrogen bonds between the matrices and the oxygen-containing functional group on the carbon fiber surface [14,22,23]. This explains the higher fiber–matrix interfacial shear strength in PA6, PA66, and PA12 compared to PP.

3.2. Evaluation of Matrix Properties

The relationships between various matrix properties and the fiber–matrix interfacial shear strength were systematically investigated. Figure 8 shows the relationship between the tensile strength σ d of the matrix and the fiber–matrix interfacial shear strength τ f , which showed a positive correlation with the tensile strength σ d of the matrix with a correlation coefficient of 0.85. PA66 showed the highest tensile strength σ d of the matrix, followed by PA6, PA12, and PP. A similar trend was observed for the modulus E d of the matrix, which also exhibited a positive correlation (r = 0.72) with the fiber–matrix interfacial shear strength τ f , as shown in Figure 9. The fiber–matrix interfacial shear strength τ f showed a positive correlation with the melting temperature T m of the matrix, with a correlation coefficient of 0.79 (presented in Figure 10). PA66 showed the highest melting temperature T m of the matrix, followed by PA6, PA12, and PP. In contrast, an inverse trend was observed for the coefficient of linear expansion α of the matrix, which exhibited a strong negative correlation (r = −0.98) with the fiber–matrix interfacial shear strength τ f , as shown in Figure 11. PA66 showed the lowest coefficient of linear expansion α of the matrix, followed by PA6, PA12, and PP. The matrix density ρ and the matrix tightening stress q 0 both demonstrated positive correlations with the fiber–matrix interfacial shear strength τ f of r = 0.92 and r = 0.69, respectively, as illustrated in Figure 12 and Figure 13. The highest matrix density ρ was observed in PA6, followed by PA66, PA12, and PP, while PA66 exhibited the highest matrix tightening stress q 0 , followed by PA6, PA12, and PP.

3.3. Relationship Between Fiber–Matrix Interfacial Shear Strength and Matrix Properties

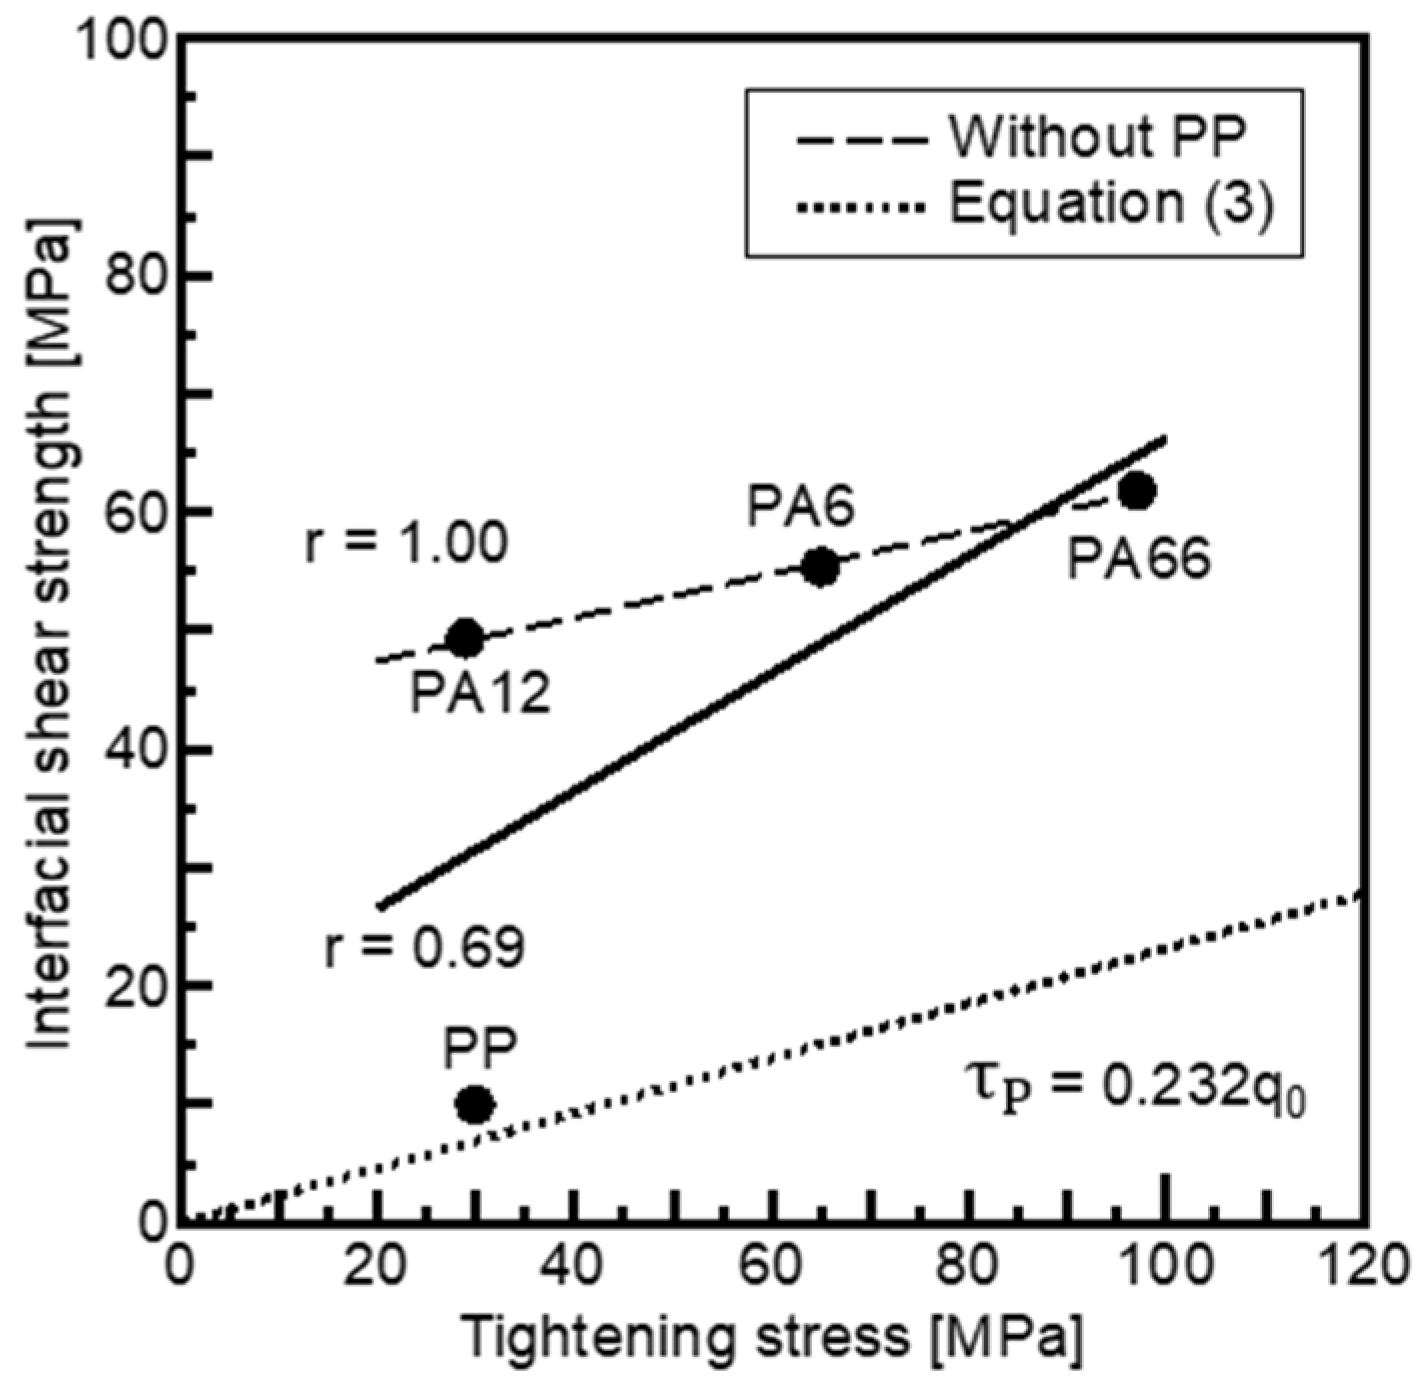
3.3.1. Relationship Between Fiber–Matrix Interfacial Shear Strength and Matrix Tightening Stress

The primary factors contributing to adhesion strength at the fiber–matrix interface are generally considered to be physical bonding, which originates from the matrix tightening stress on the fiber due to residual stress of the matrix [14,20,24,25,26], and chemical bonding between the fiber and the matrix [14,20,27]. A previous study on microdroplet tests using glass fiber and PP revealed that approximately 70% of the fiber–matrix interfacial shear strength at room temperature was attributed to the matrix tightening stress [26]. If this finding can be applied to carbon fiber systems, the physical bonding contribution can be represented by the dotted line in Figure 13. This dotted line passes through the origin and the point (matrix tightening stress of PP, 70% of fiber–matrix interfacial shear strength of PP). The coefficient of 0.232 was calculated based on this relationship. The contribution of physical bonding τ P can be calculated from the matrix tightening stress q 0 of each matrix using Equation (3). Subsequently, the contribution of chemical bonding τ C can be determined by subtracting the physical bonding component τ P .
τ P = 0.232 q 0
Figure 14 presents the relative contributions of physical bonding τ P and chemical bonding τ C for each matrix, assuming that the total fiber–matrix interfacial shear strength τ f is 100%. For PP, physical bonding was the dominant mechanism contributing to the fiber–matrix interfacial shear strength τ f . In contrast, chemical bonding was the primary contributor to the fiber–matrix interfacial shear strength τ f for PA6, PA66, and PA12, attributed to the formation of hydrogen bonds, as described in Section 3.1. These results suggest that physical bonding predominantly governs the fiber–matrix interfacial shear strength in nonpolar matrices, such as PP, which lack the ability to form hydrogen bonds with the fiber. Conversely, chemical bonding is the principal mechanism in polar matrices, such as PA6, PA66, and PA12, which can form hydrogen bonds with the fiber. The dashed line in Figure 13 represents the relationship between the matrix tightening stress q 0 of PA and the fiber–matrix interfacial shear strength τ f , exhibiting a strong positive correlation of 1.00. However, when considering all matrices, including nonpolar PP, the correlation between matrix tightening stress q 0 and fiber–matrix interfacial shear strength τ f is relatively weak.

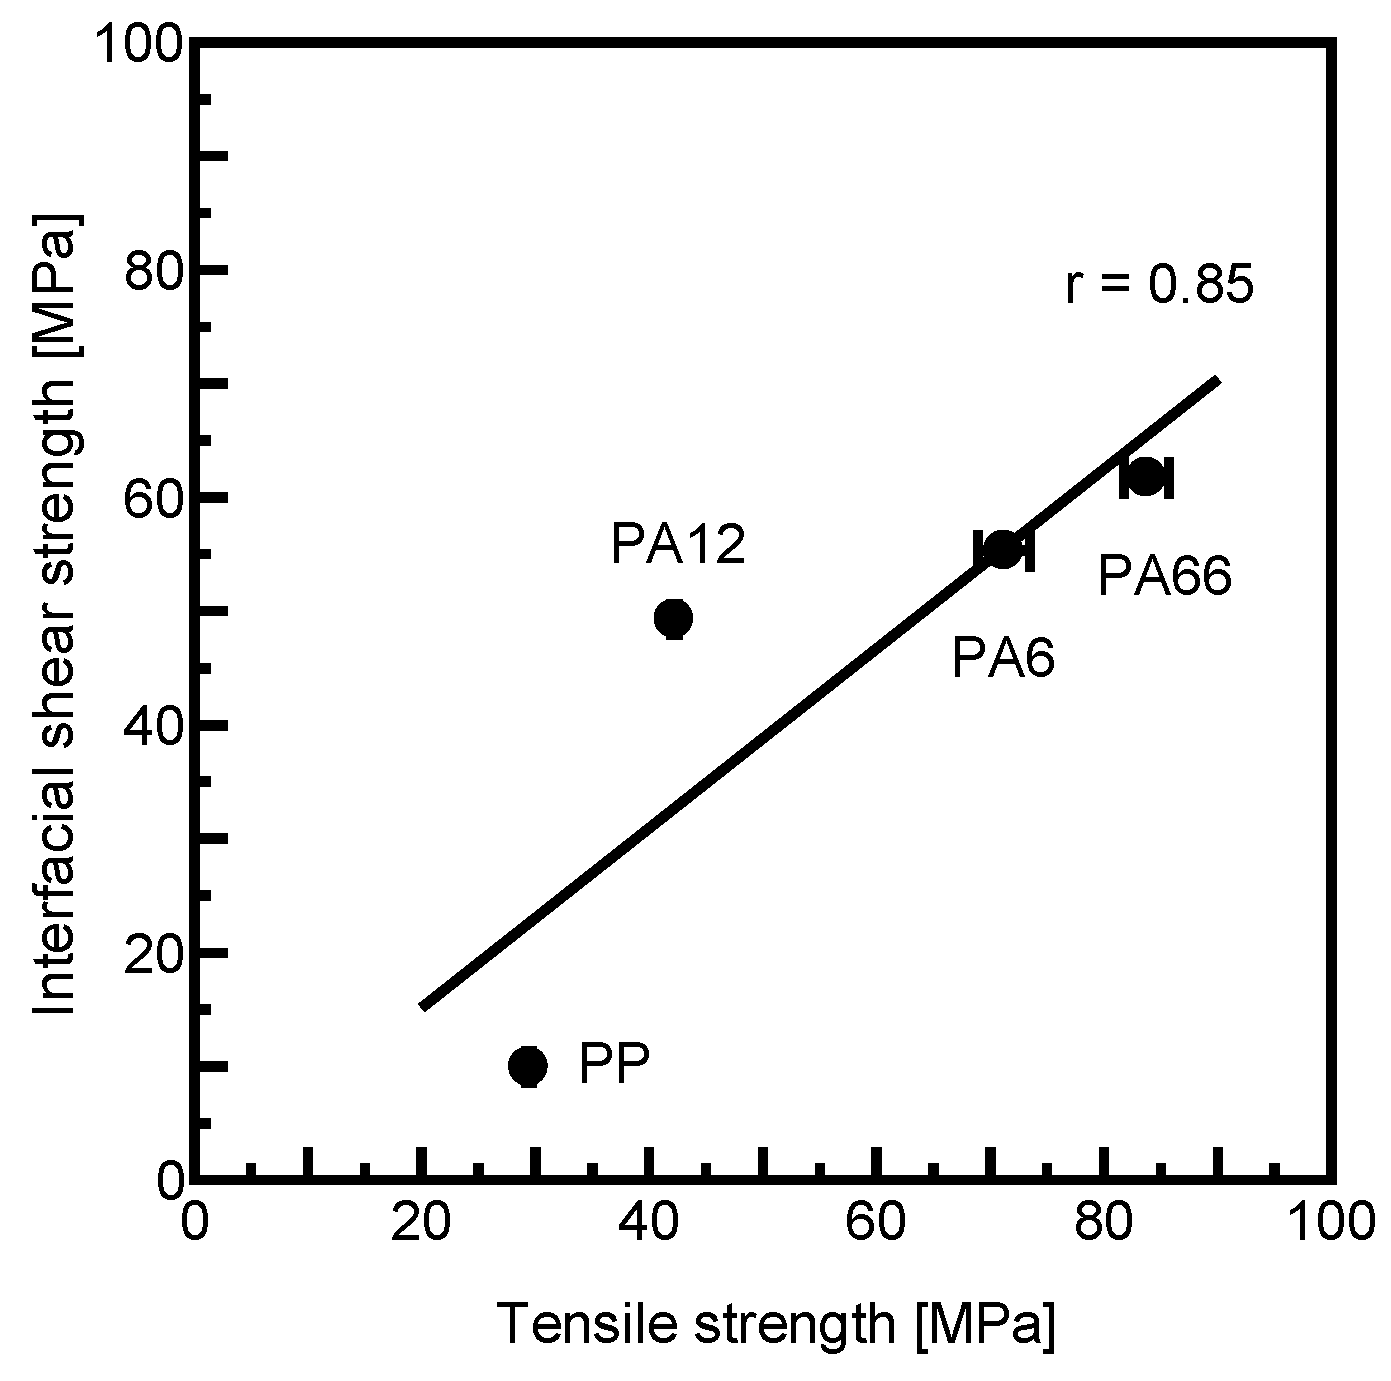
3.3.2. Relationship Between Fiber–Matrix Interfacial Shear Strength and Tensile Strength of Matrix

Since the matrix droplet forms a meniscus, as shown in Figure 2, a crack tends to initiate in the meniscus region due to stress concentration, followed by crack propagation along the fiber–matrix interface. Figure 15 presents the SEM micrograph of the initial crack in a PA66 microdroplet obtained from an interrupted microdroplet test. The observation of crack initiation at the meniscus suggests that the tensile strength of the matrix significantly influences the measured fiber–matrix interfacial shear strength, explaining the positive correlation observed between the tensile strength σ d of the matrix and the fiber–matrix interfacial shear strength τ f shown in Figure 8.

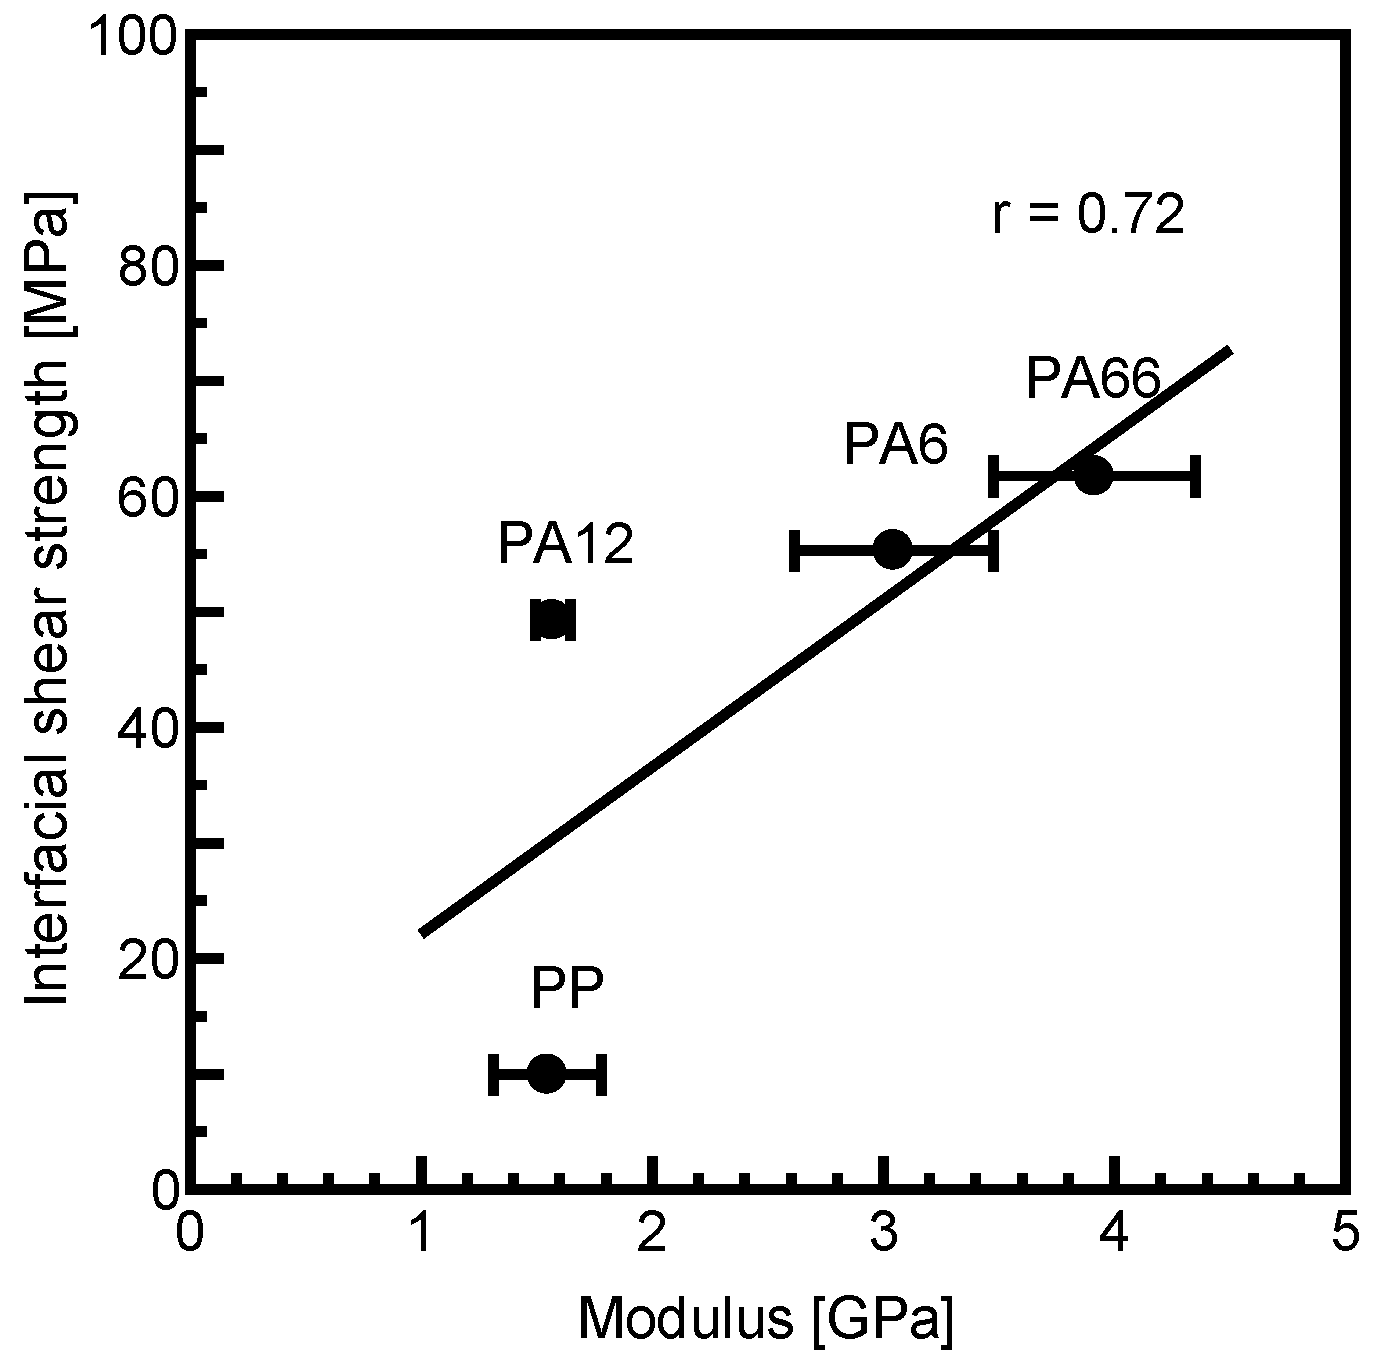
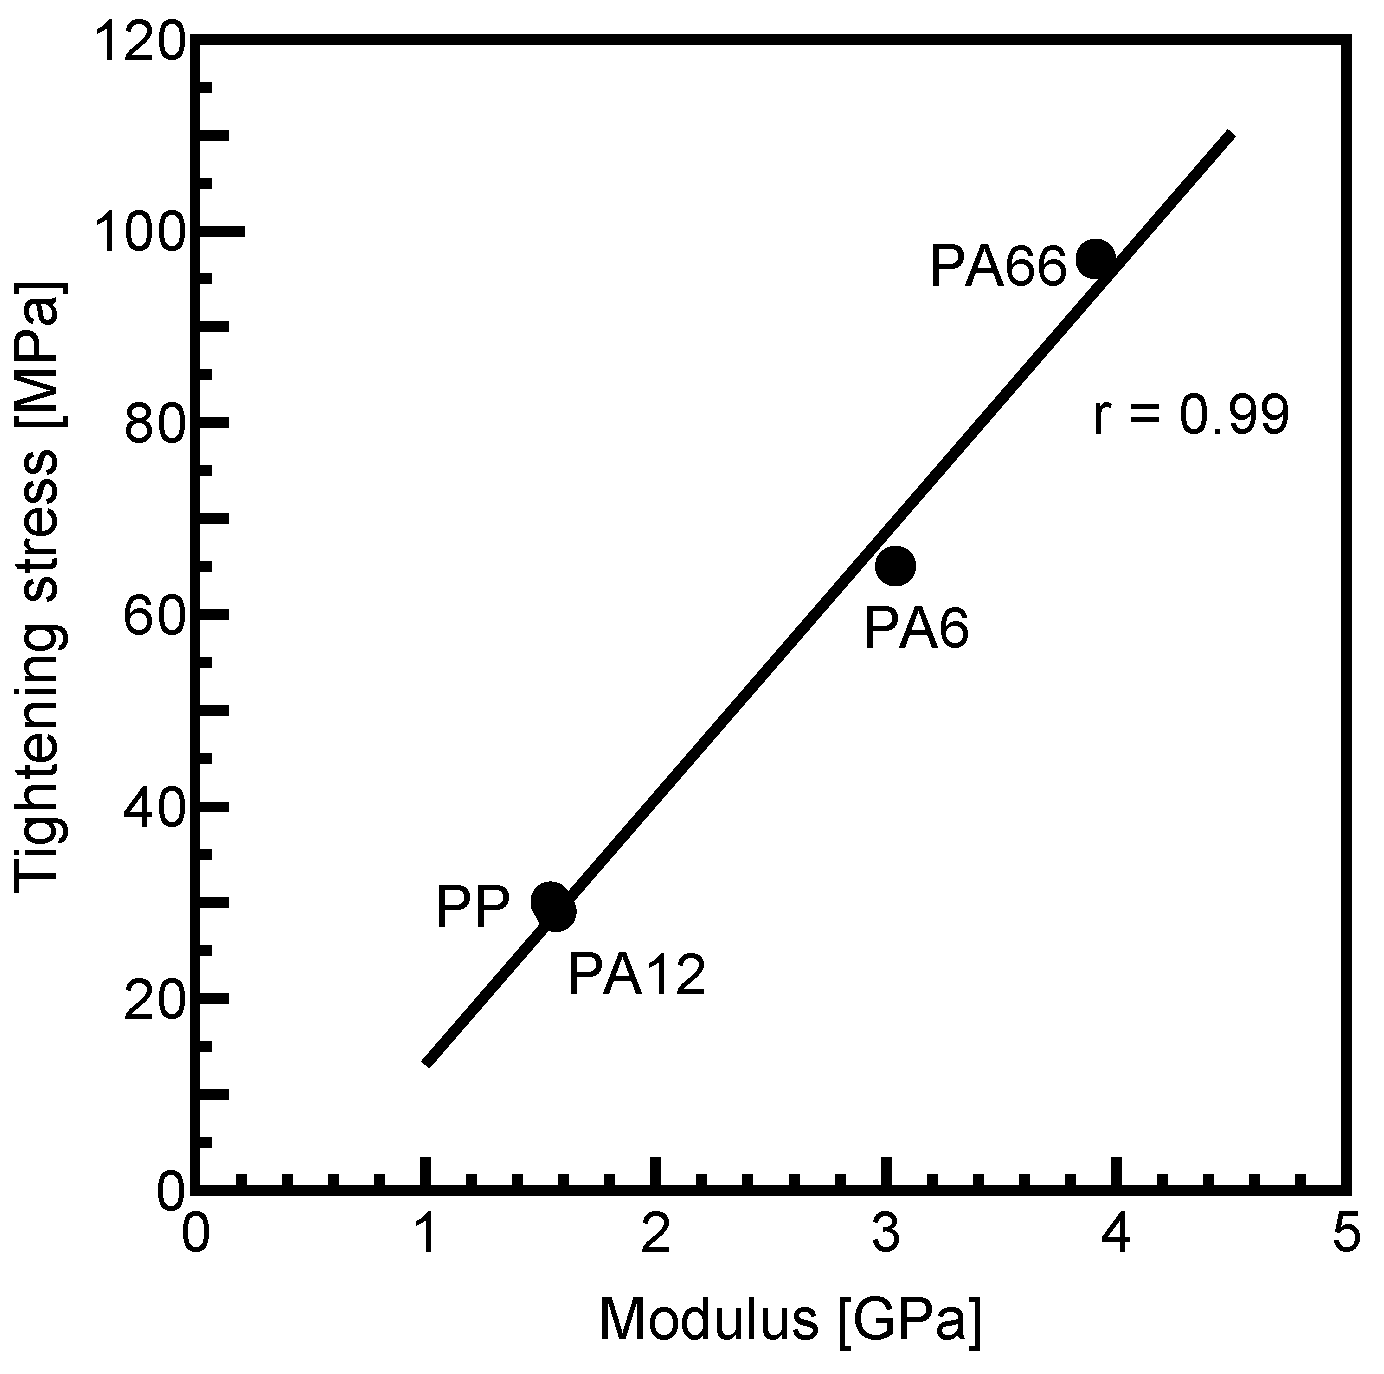
3.3.3. Relationship Between Fiber–Matrix Interfacial Shear Strength and Matrix Modulus

A strong positive correlation of 0.99 was observed between the matrix tightening stress q 0 and the modulus E d of the matrix, as illustrated in Figure 16. One of the methods to improve the mechanical properties of FRPs is the addition of fillers to the matrix. It has been reported that increasing the filler content enhances the modulus of the matrix [28]. Similarly, a study of single-fiber pull-out tests using nanofillers, such as SiO2, alumina, and carbon nanotubes in PP, reported that the fiber–matrix interfacial shear strength is improved by the addition of fillers [29]. Another study reported that increasing the SiO2 content enhances the fiber–matrix interfacial shear strength due to the improved matrix tightening stress [19]. Since the modulus E d of the matrix shows a strong positive correlation with the matrix tightening stress q 0 , it can be concluded that matrices with higher moduli generally provide stronger interfacial adhesion.

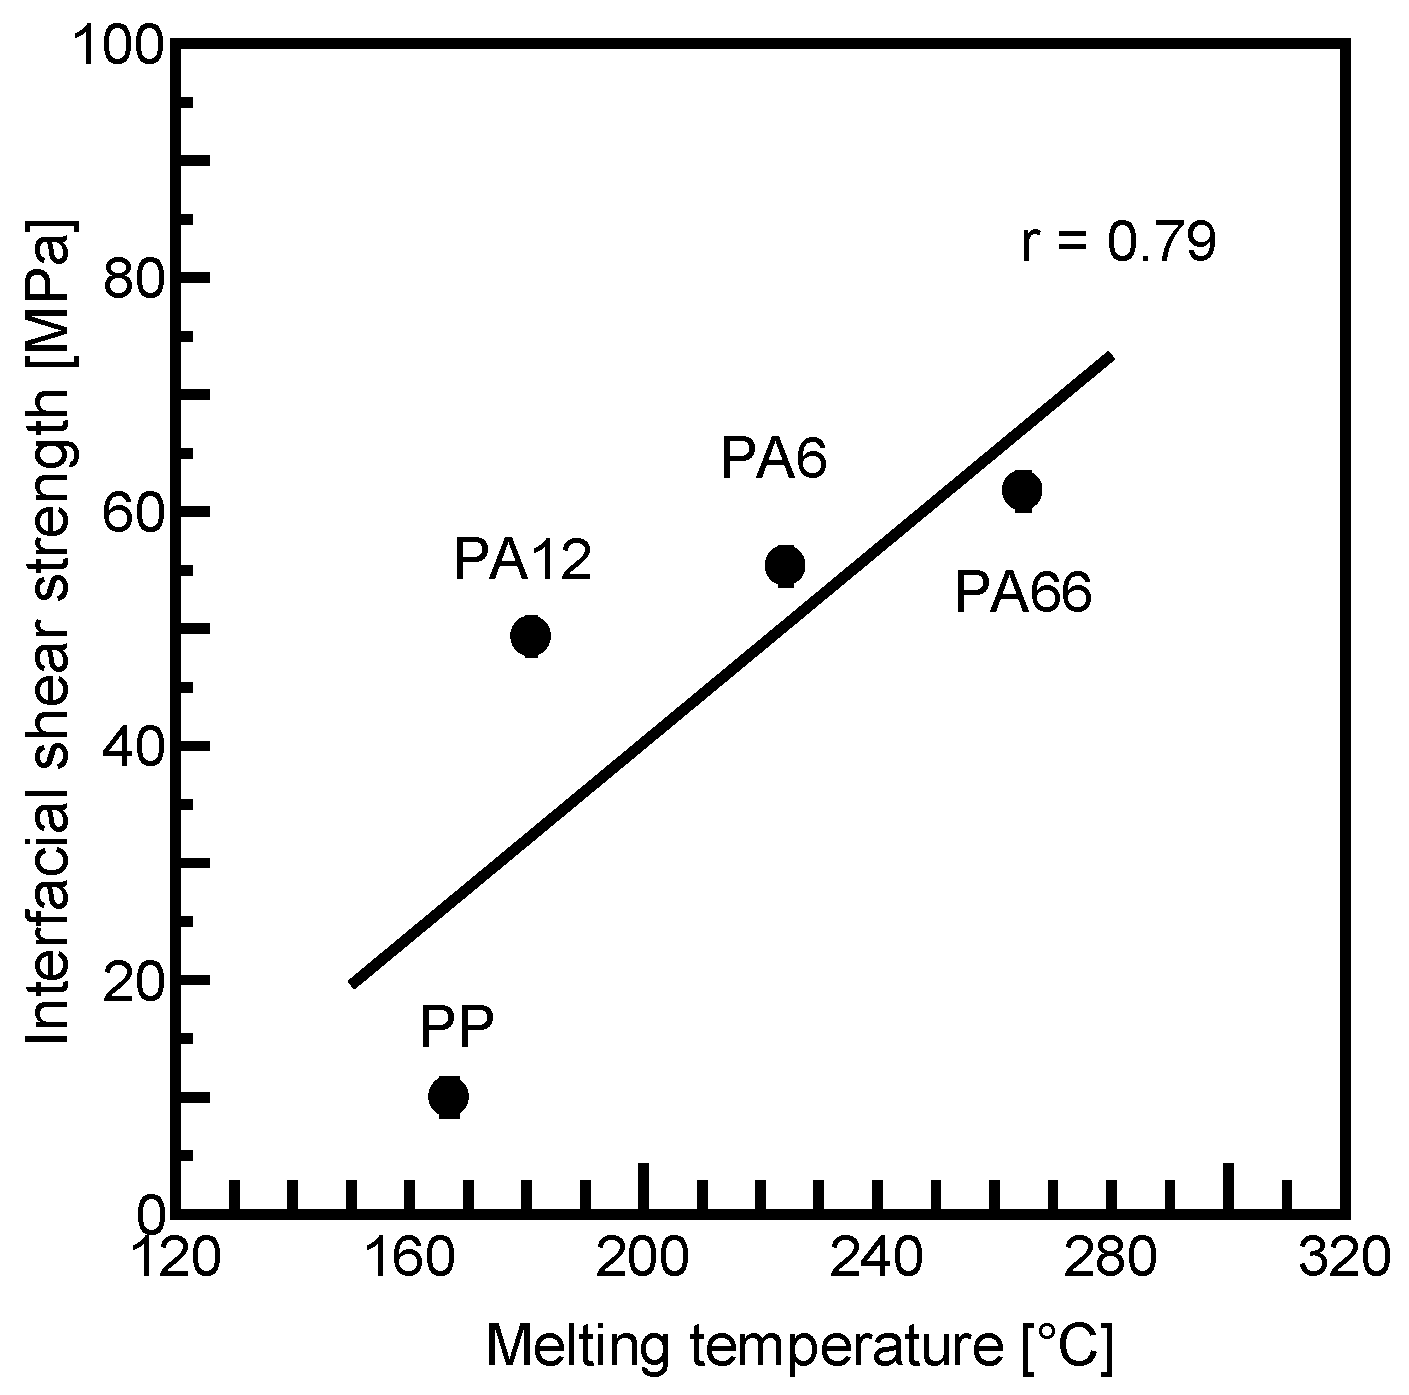
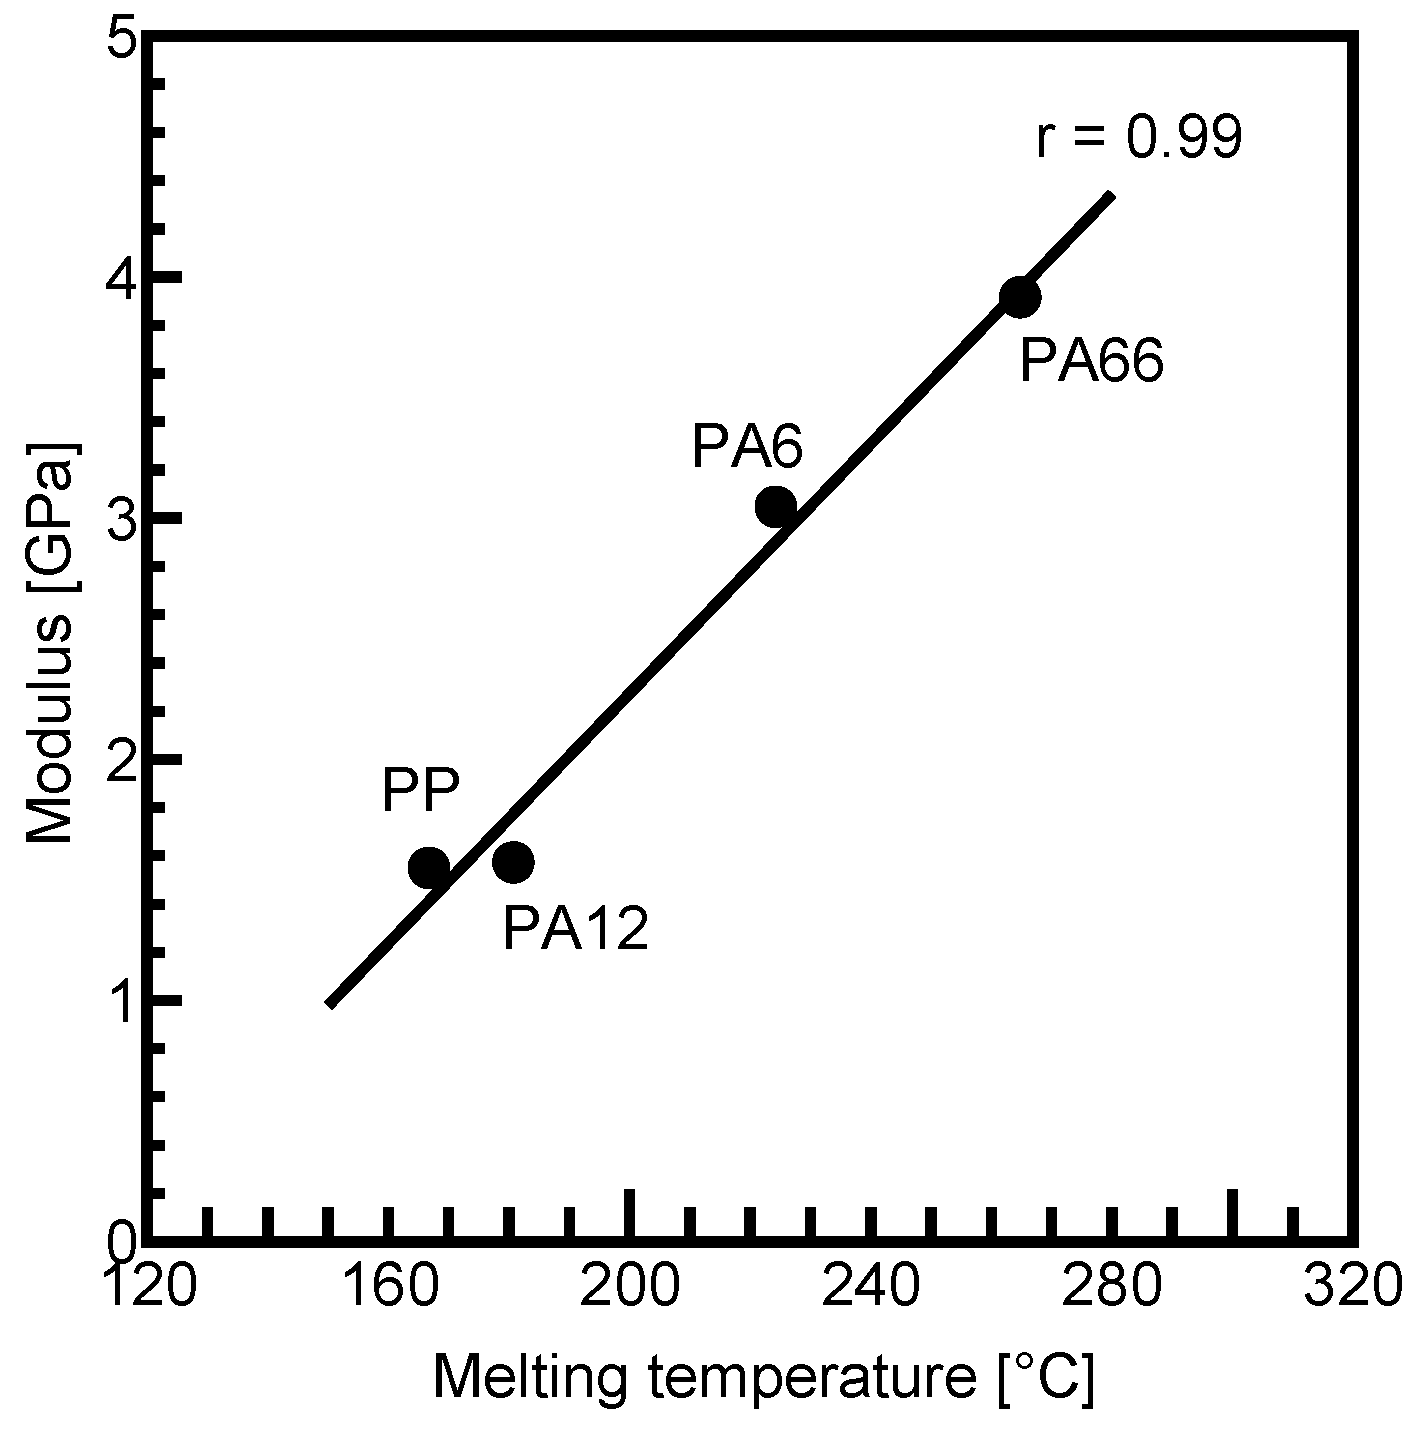
3.3.4. Relationship Between Fiber–Matrix Interfacial Shear Strength and Melting Temperature of Matrix

Figure 17 shows a strong positive correlation of 0.99 between the modulus E d and the melting temperature T m of the matrix. The observed positive correlation between the modulus E d and the melting temperature T m of the matrix, as well as the matrix tightening stress q 0 and the modulus E d of the matrix, as shown in Figure 16 and Figure 17, suggest that matrices with higher melting temperatures typically exhibit higher moduli and consequently higher matrix tightening stresses. This relationship elucidates the positive correlation between the melting temperature T m of the matrix and the fiber–matrix interfacial shear strength τ f shown in Figure 10.

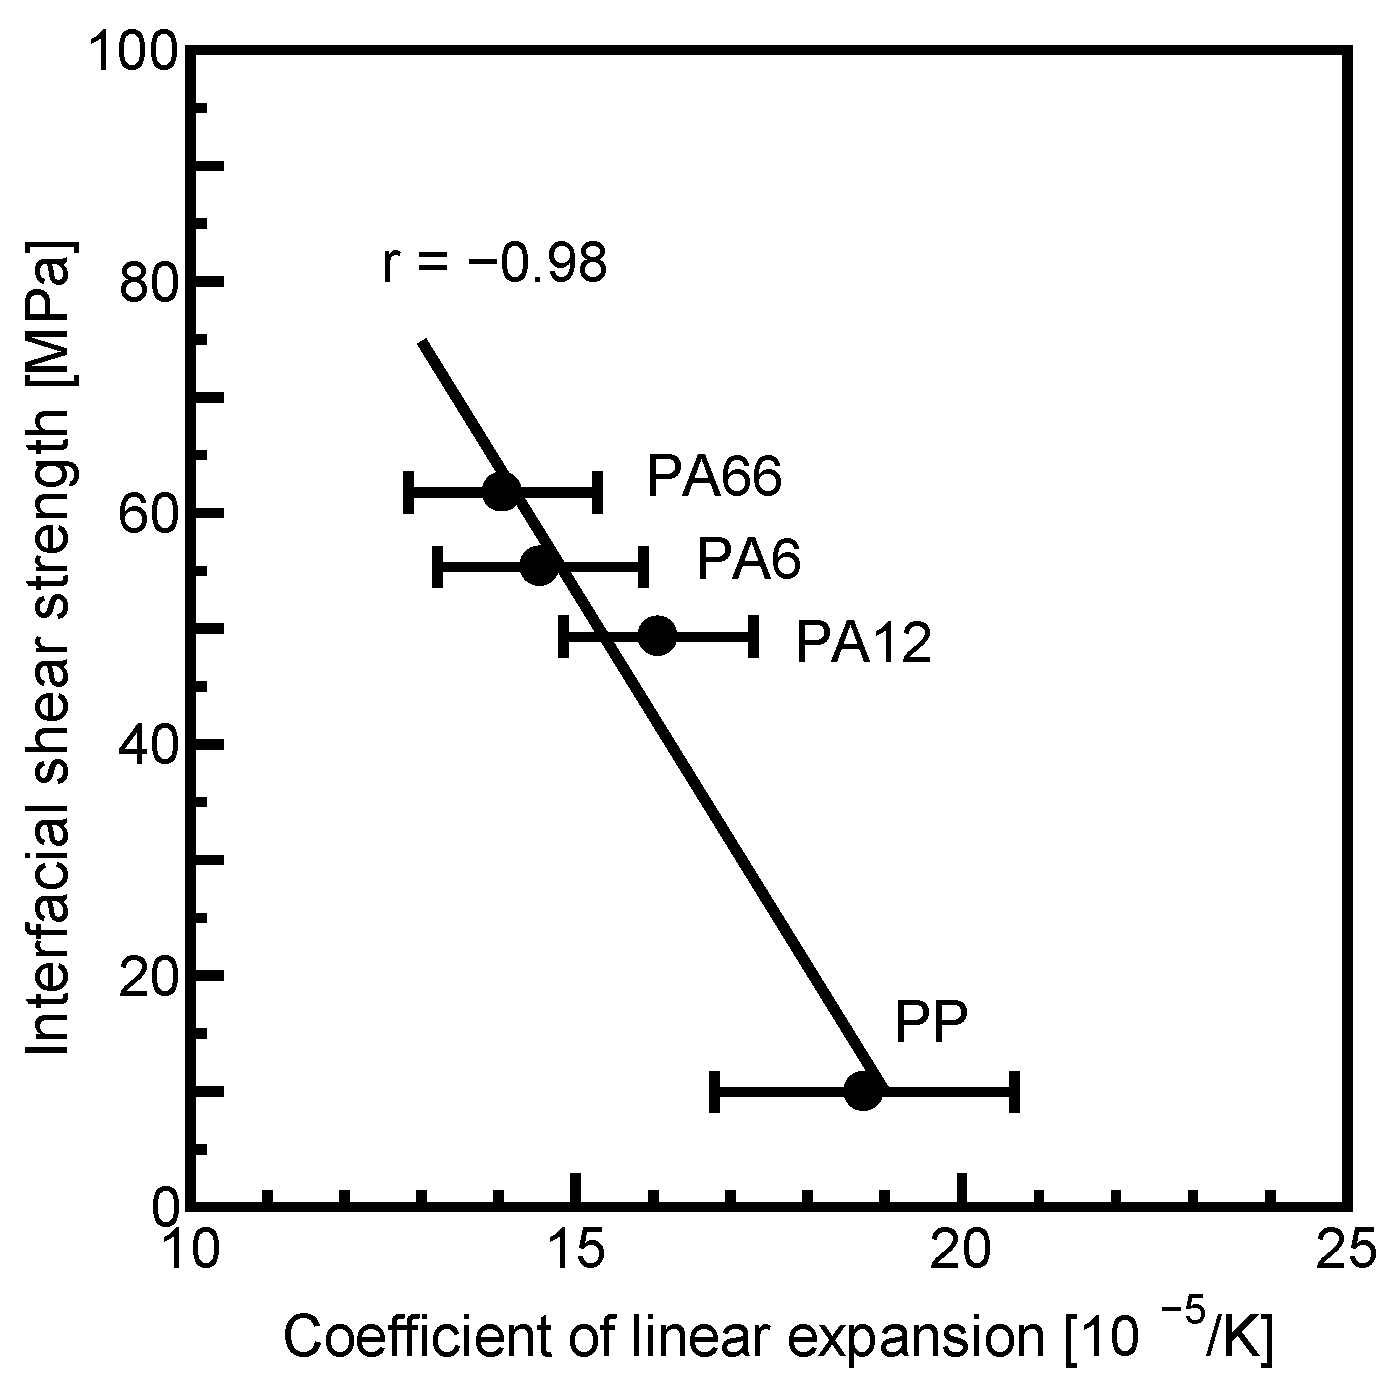
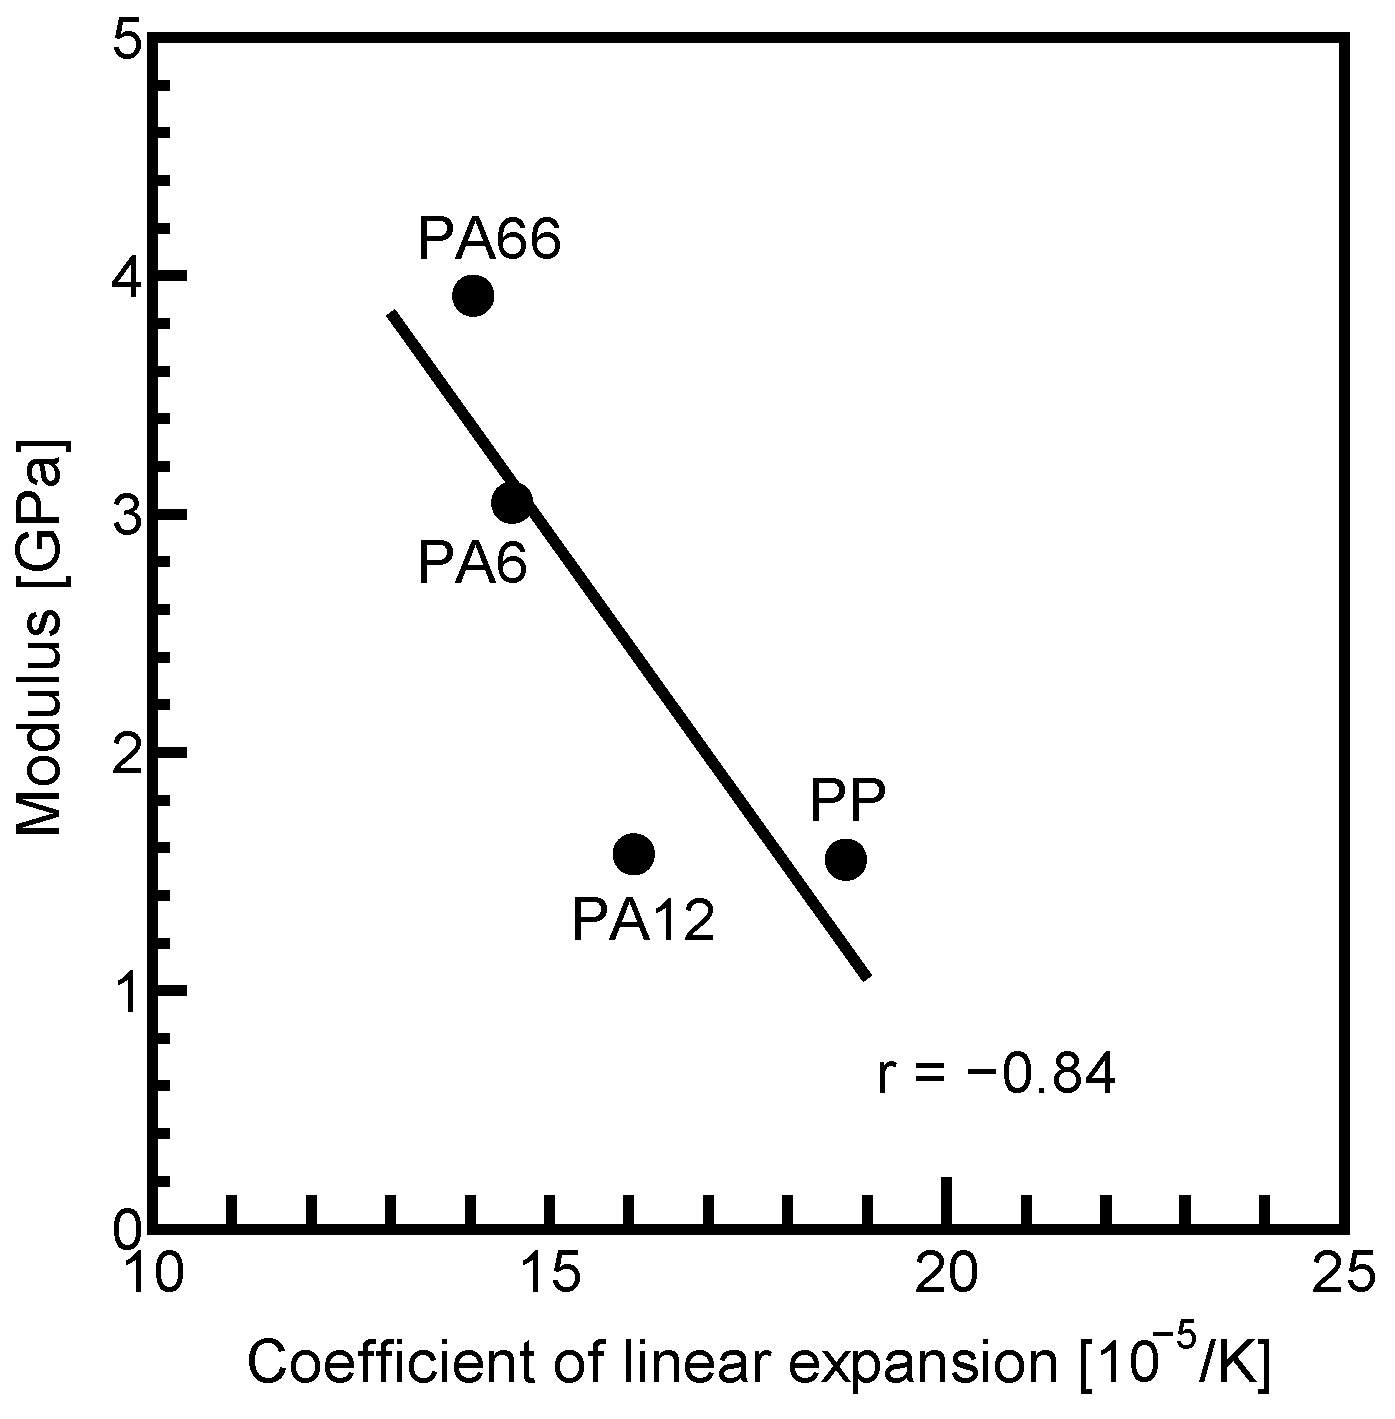
3.3.5. Relationship Between Fiber–Matrix Interfacial Shear Strength and Coefficient of Linear Expansion of Matrix

A significant negative correlation of −0.84 was found between the modulus E d and the coefficient of linear expansion α of the matrix, as shown in Figure 18. This inverse relationship, coupled with the positive correlation between the matrix tightening stress q 0 and the modulus E d of the matrix shown in Figure 16, indicates that matrices with lower coefficients of linear expansion tend to exhibit higher moduli and higher matrix tightening stresses. This explains the negative correlation between the coefficient of linear expansion α of the matrix and the fiber–matrix interfacial shear strength τ f shown in Figure 11.

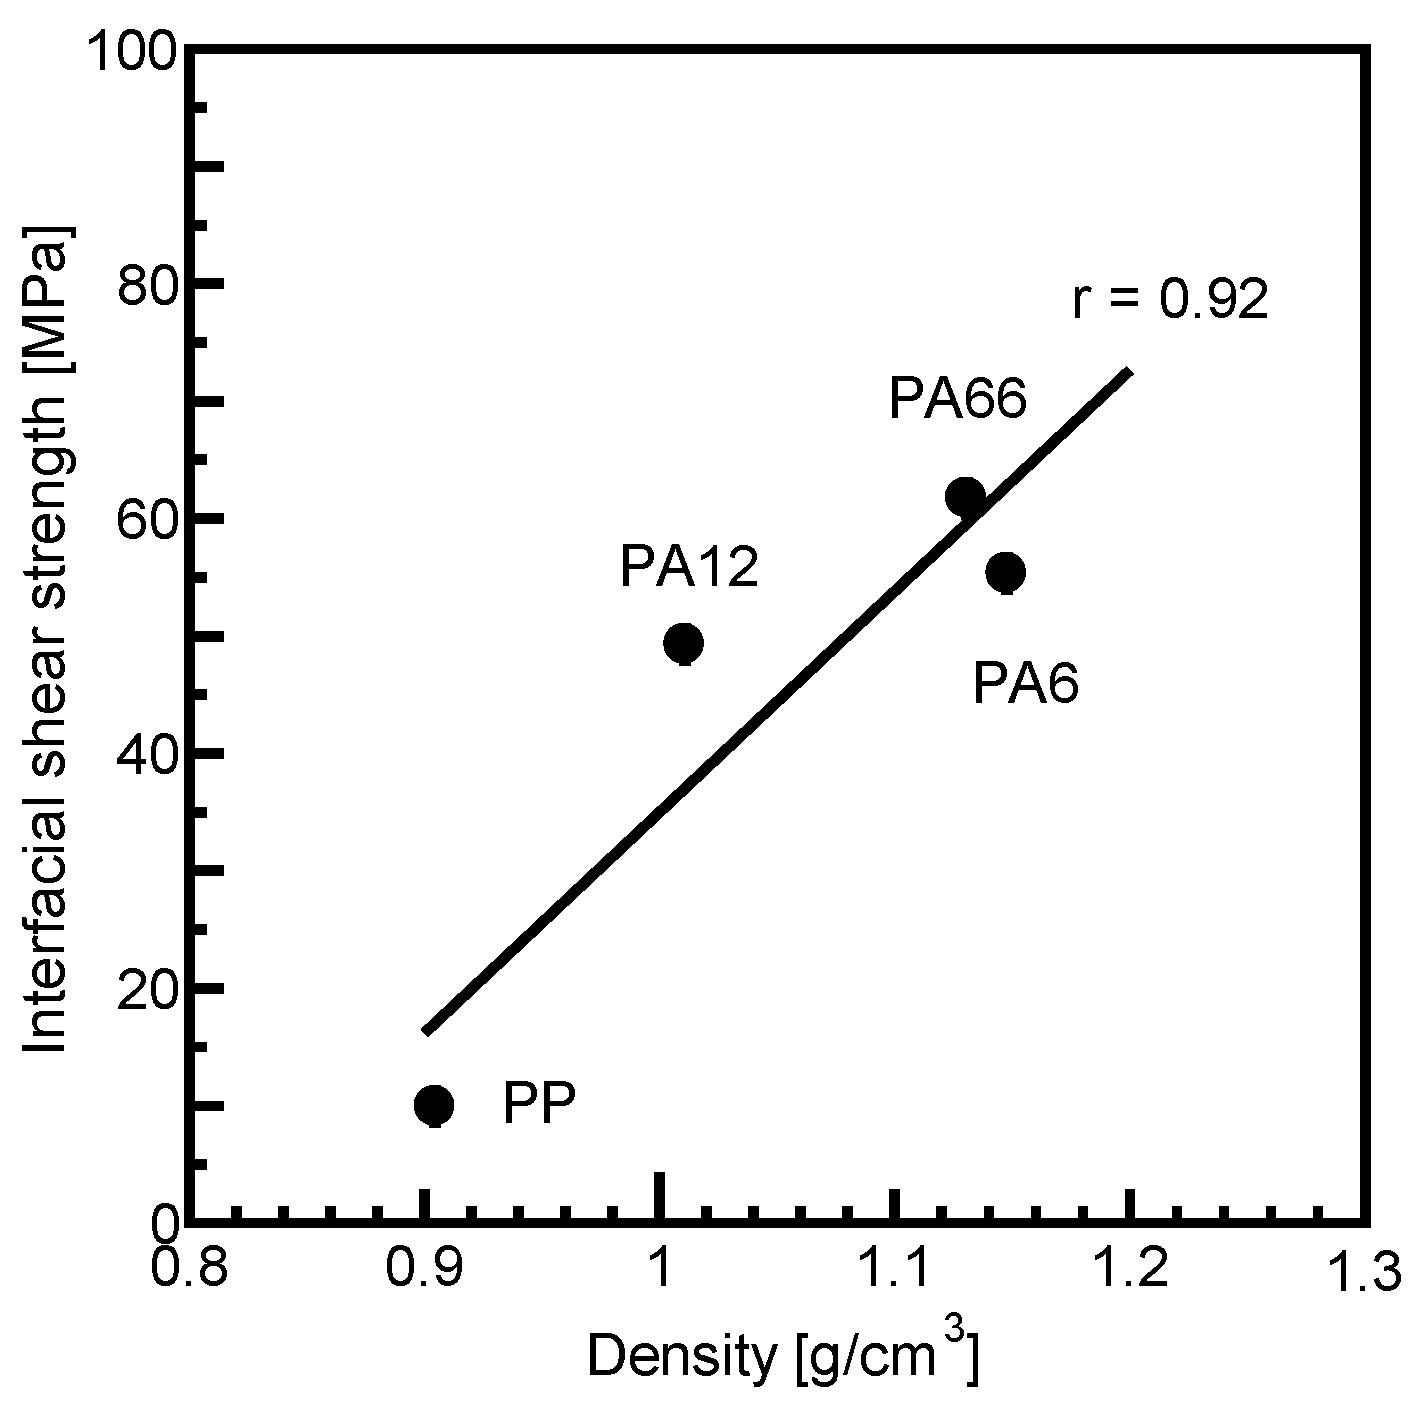
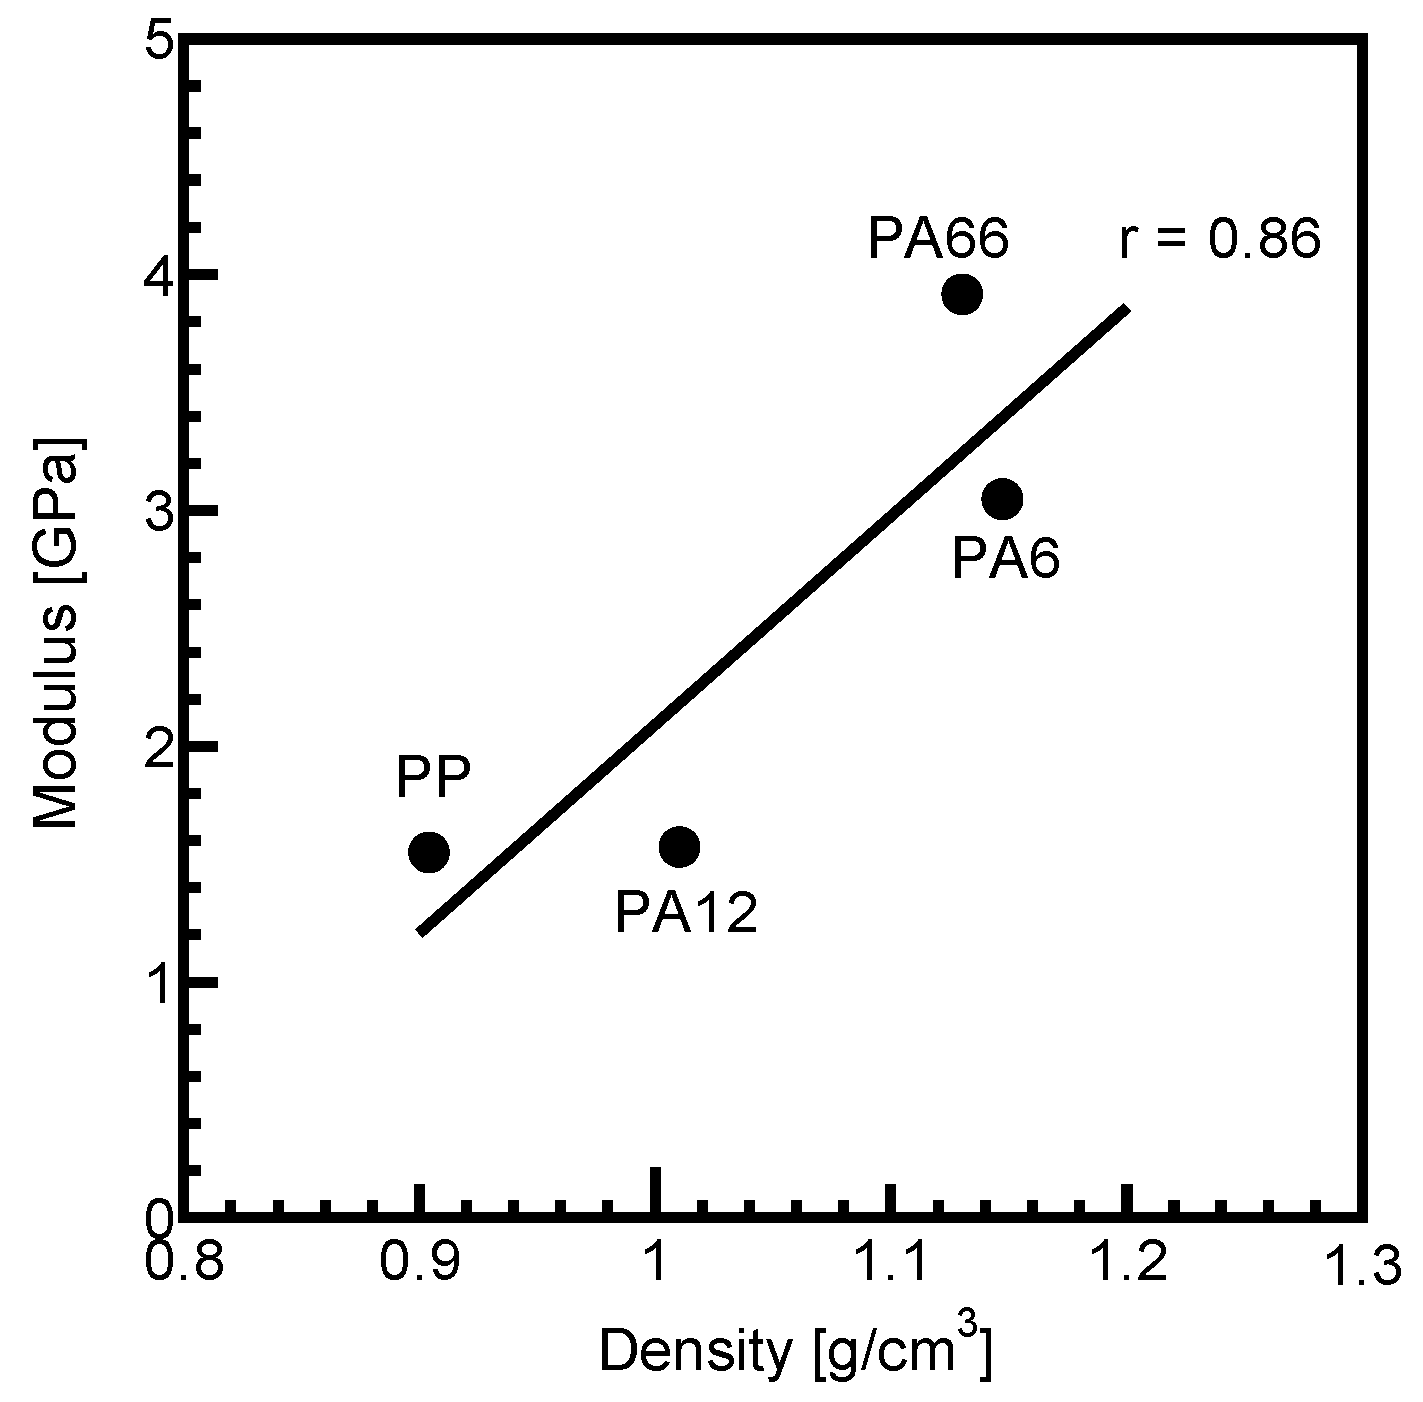
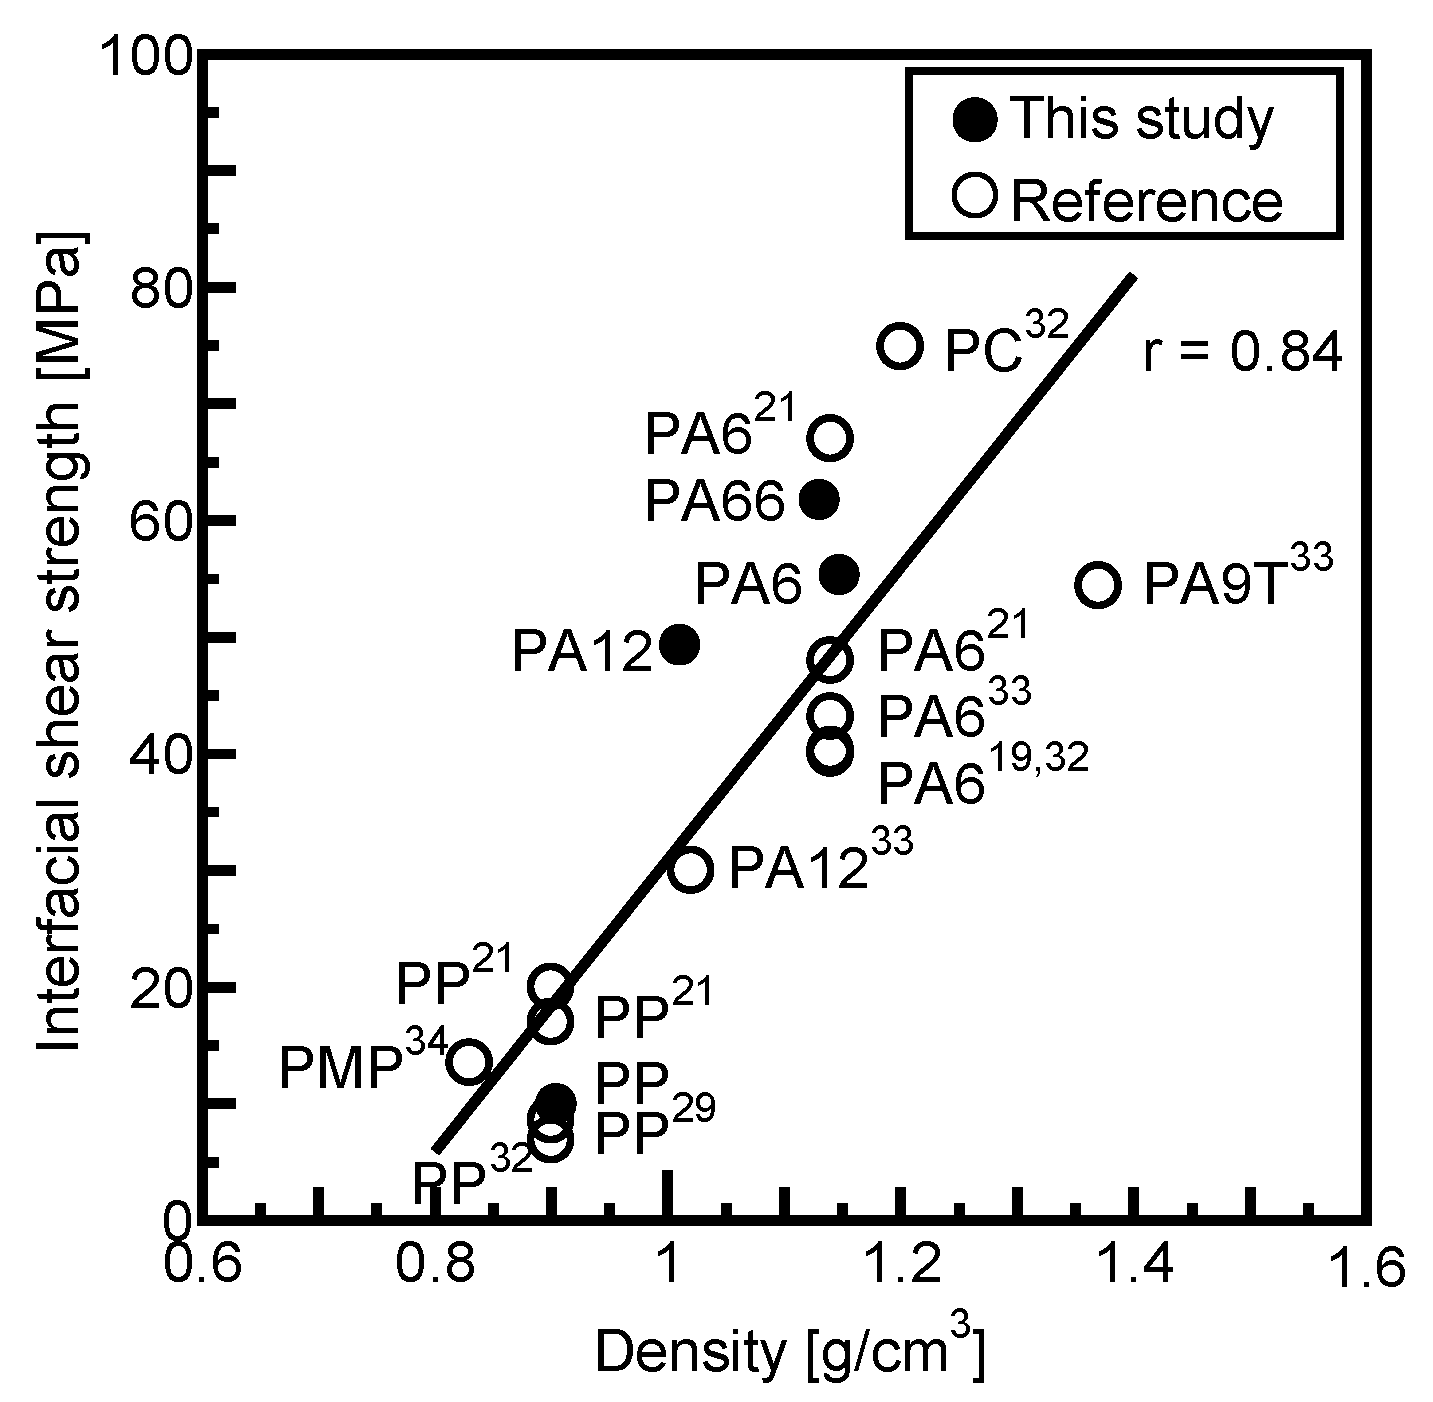
3.3.6. Relationship Between Fiber–Matrix Interfacial Shear Strength and Matrix Density

Figure 19 shows a positive correlation of 0.86 between the modulus E d of the matrix and the matrix density ρ . It has generally been reported that density and modulus show a positive correlation [30]. One previous study has reported that higher matrix density correlates with increased matrix shrinkage and enhanced matrix tightening stress during the cooling process of specimen preparation [31]. The positive correlations between the modulus E d of the matrix and the matrix density ρ , as well as the matrix tightening stress q 0 and the modulus E d of the matrix, shown in Figure 16 and Figure 19, indicate that matrices with higher densities tend to have higher moduli and matrix tightening stresses. This relationship explains the positive correlation between matrix density ρ and fiber–matrix interfacial shear strength τ f shown in Figure 12.
Figure 20 presents a comprehensive analysis of the relationship between fiber–matrix interfacial shear strength and matrix density, incorporating experimental results in this study and data from previous studies [19,21,29,32,33,34]. A robust positive correlation of 0.84 was observed between fiber–matrix interfacial shear strength τ f and matrix density ρ . This suggests that enhanced fiber–matrix interfacial shear strength can be achieved by selecting a matrix with a higher density, providing a practical approach for material selection without requiring a direct evaluation of fiber–matrix interfacial strength.

4. Results and Discussion of Mechanical Properties of CFRTP

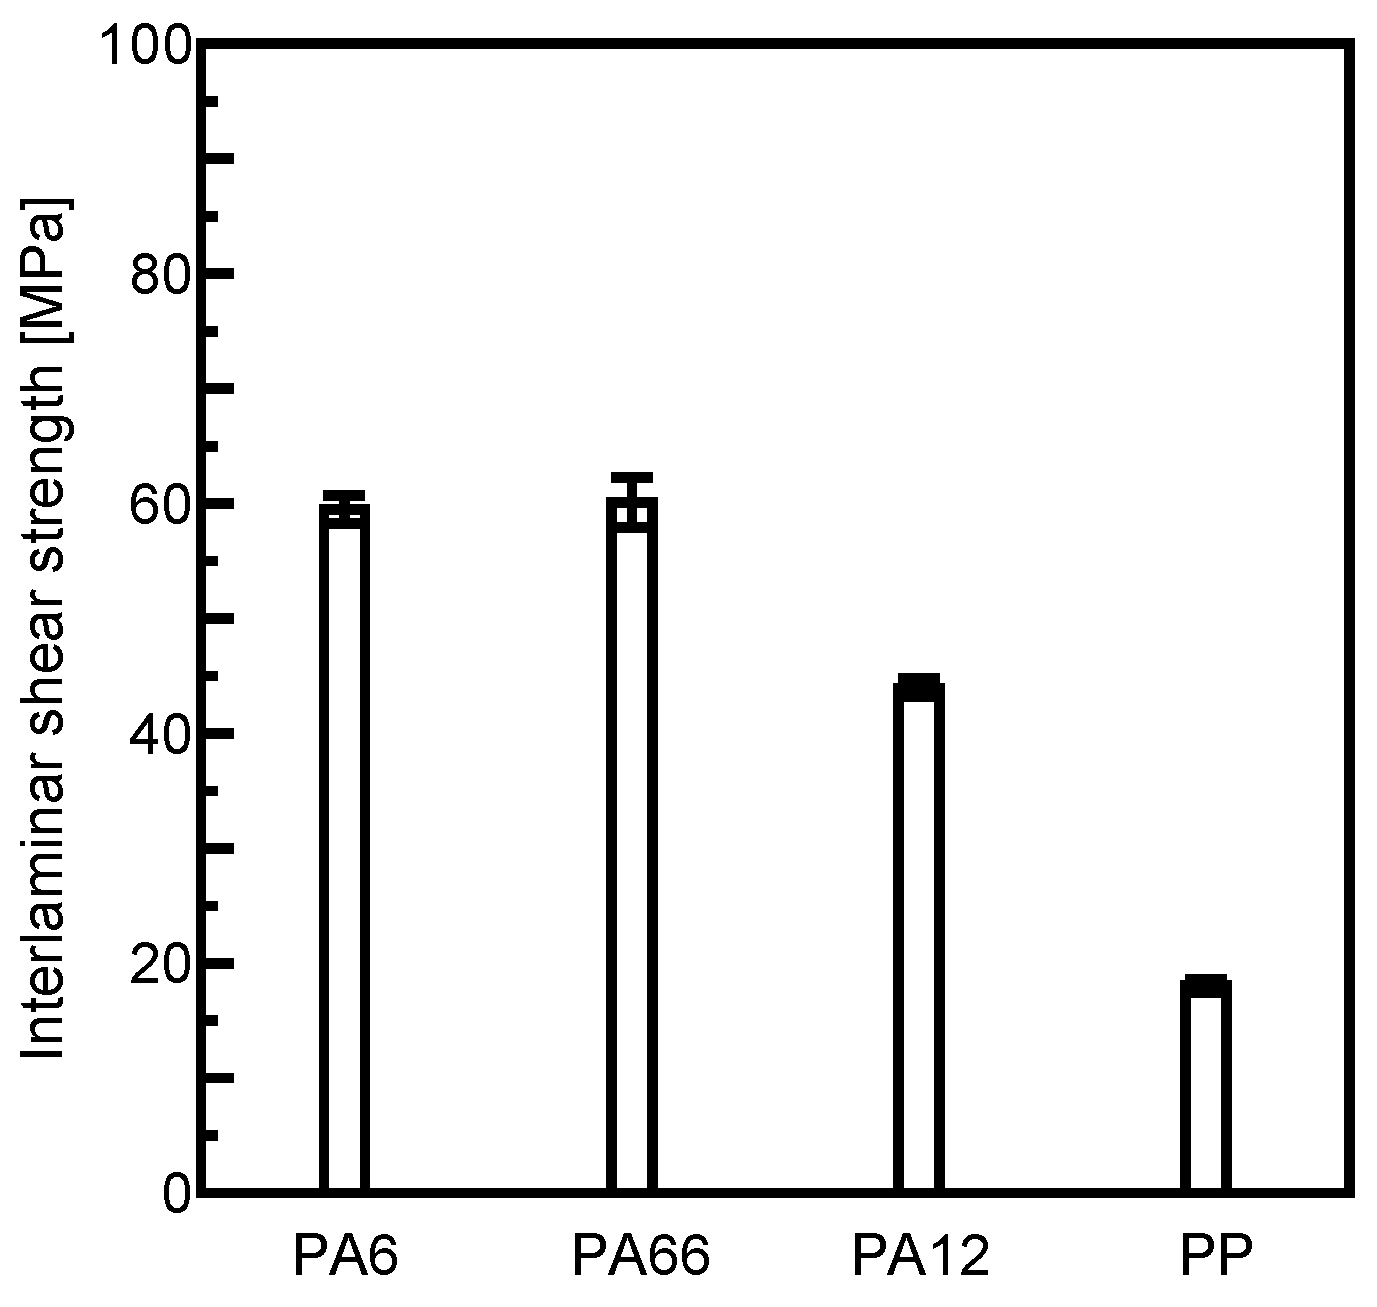
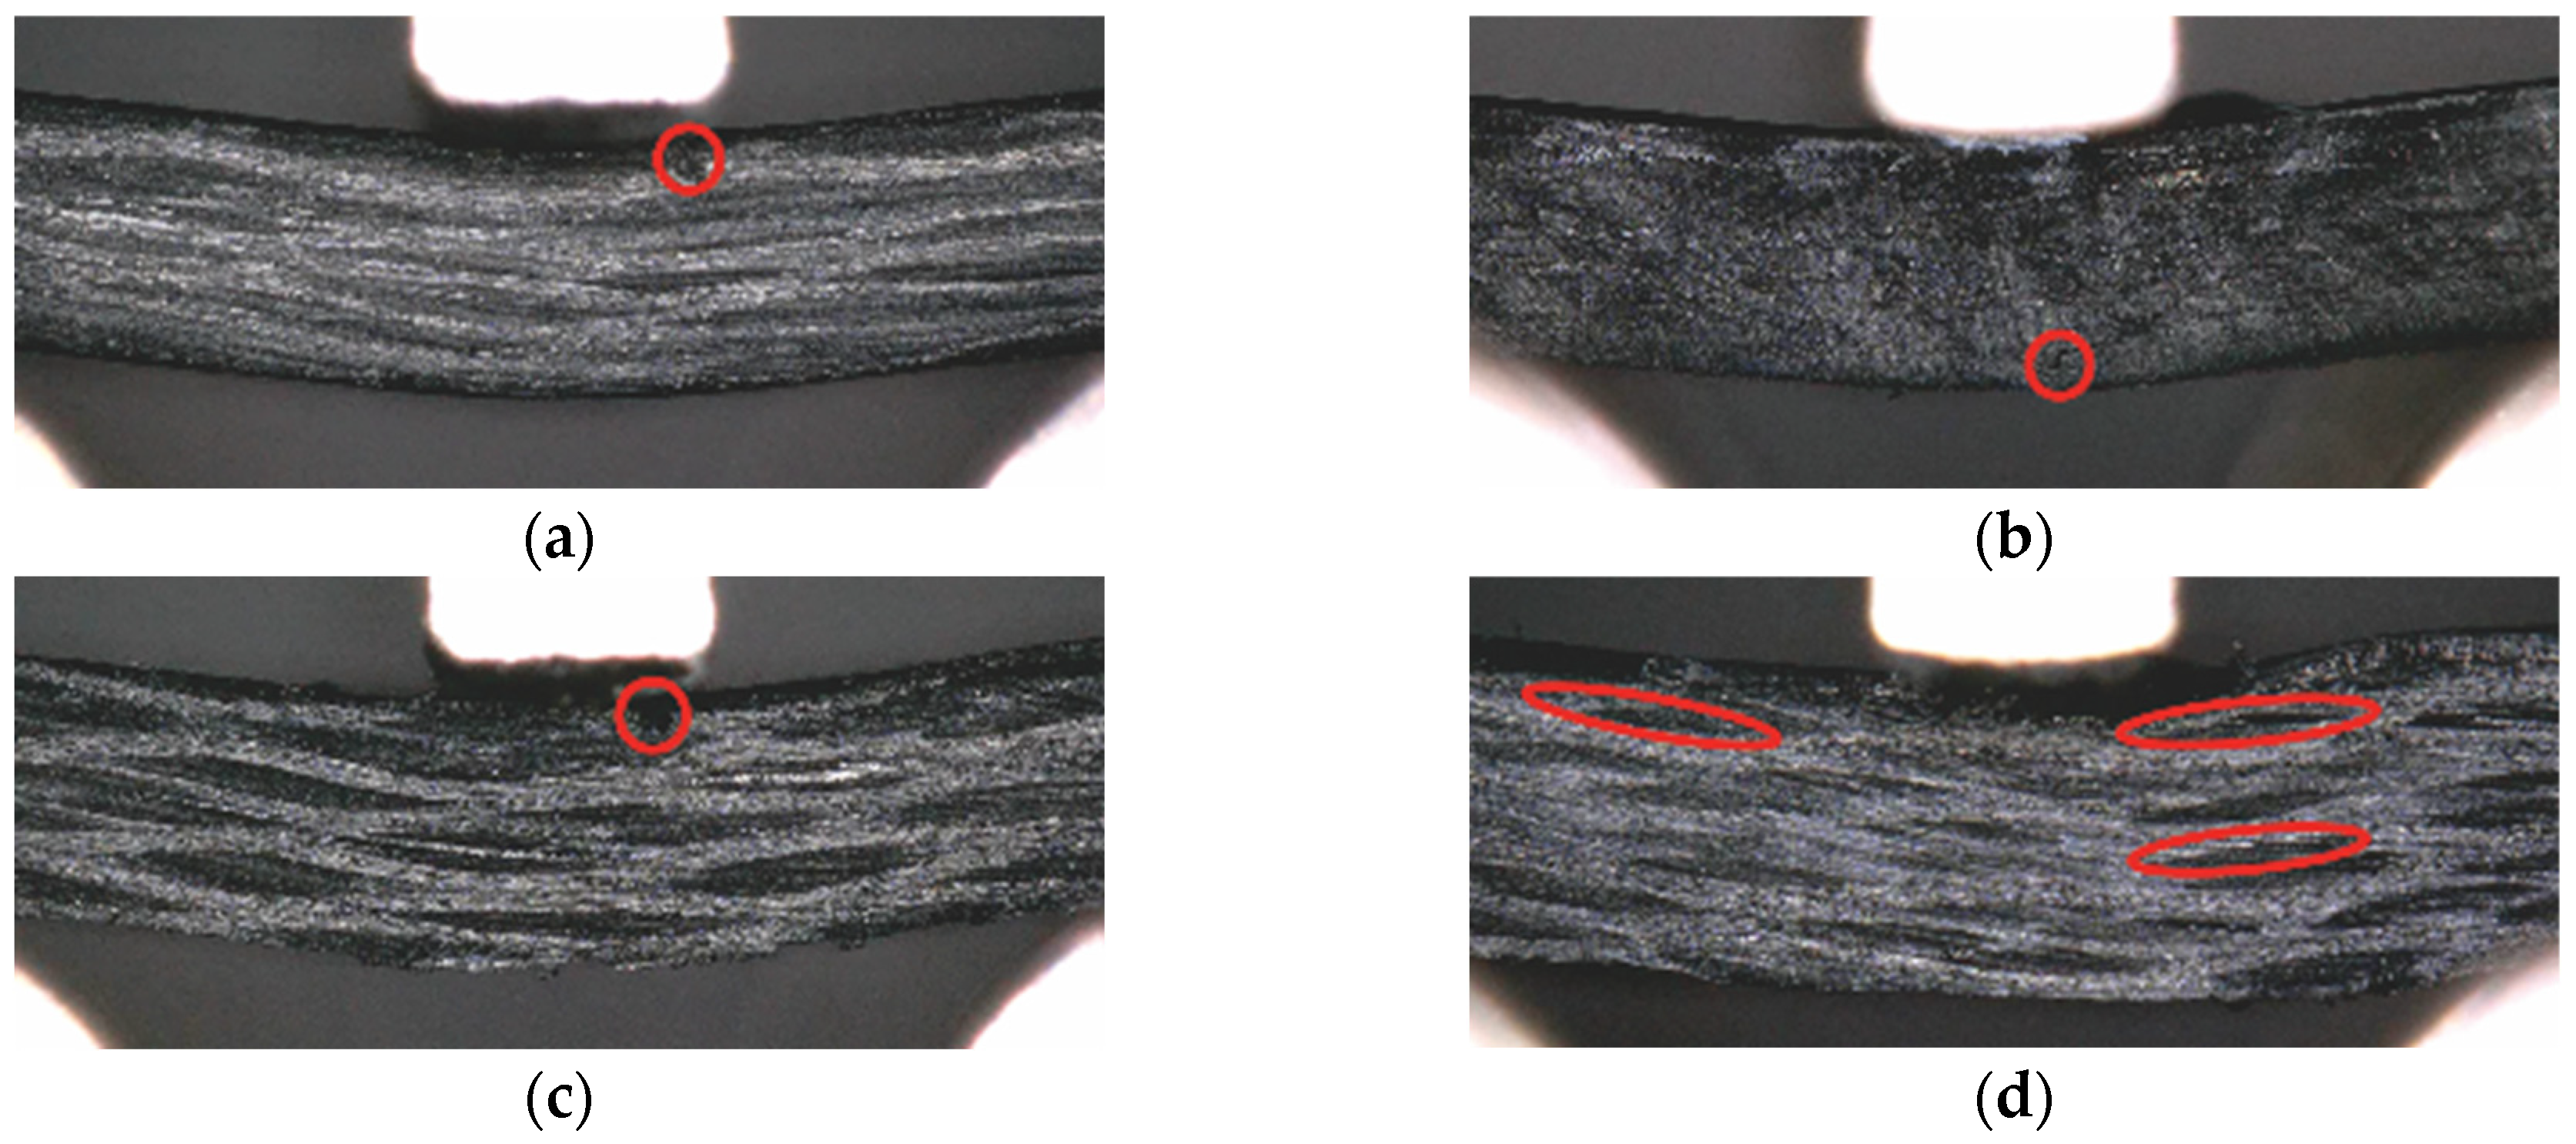
4.1. Short-Beam Three-Point Bending Test

The short-beam three-point bending test is a method for evaluating interlaminar shear strength by maximizing shear stress at the neutral axis of the specimen through a reduced support span length. The failure mechanism in this test is closely related to the fiber–matrix interfacial shear strength, as failure typically occurs at the fiber–matrix interface or in the matrix near the fiber. However, even when conducting interlaminar shear tests according to JIS and ASTM standards, specimens rarely fail due to interlaminar shear and typically show bending failure. Despite this limitation, interlaminar shear strength is conventionally calculated using the bending load data obtained from such tests [35]. This phenomenon is partially attributed to enhanced interlaminar shear strength, especially in thermoplastic composites, where the high resistance to interlaminar failure results in bending failure occurring preferentially.
Figure 21 shows the interlaminar shear strength τ l obtained by the short-beam three-point bending test. PA66 exhibited the highest interlaminar shear strength τ l , followed by PA6, PA12, and PP. Figure 22 shows in situ observations of the short-beam three-point bending test. For PA6, PA66, and PA12 specimens, initial failure was observed in the outermost layer. This behavior can be attributed to their superior fiber–matrix interfacial shear strength, which effectively inhibits crack propagation along the fiber–matrix interface. In these cases, failure occurred in the outermost layers when the local stresses at the compression and tension surfaces exceeded the material’s strength limits, preceding any interlaminar failure. In contrast, PP specimens exhibited initial failure in the interlaminar region, characterized by crack propagation along the fiber–matrix interface, consistent with its lower fiber–matrix interfacial shear strength compared to the other polyamide.
In this study, the interlaminar shear strength τ l was evaluated by the short-beam three-point bending test, showing that bending failure occurred prior to interlaminar shear failure for thermoplastic polymers with high fiber–matrix interfacial shear strength τ f . This suggests that the short-beam three-point bending test can effectively evaluate interlaminar fracture strength in systems with relatively low fiber–matrix interfacial shear strength in which fracture occurs in the interlaminar region. For systems with high interlaminar shear strength, alternative methodologies for evaluating interlaminar fracture strength are needed. Consequently, the interlaminar shear strength obtained by the short-beam three-point bending test should be regarded as a comparative indicator rather than as an absolute material property.

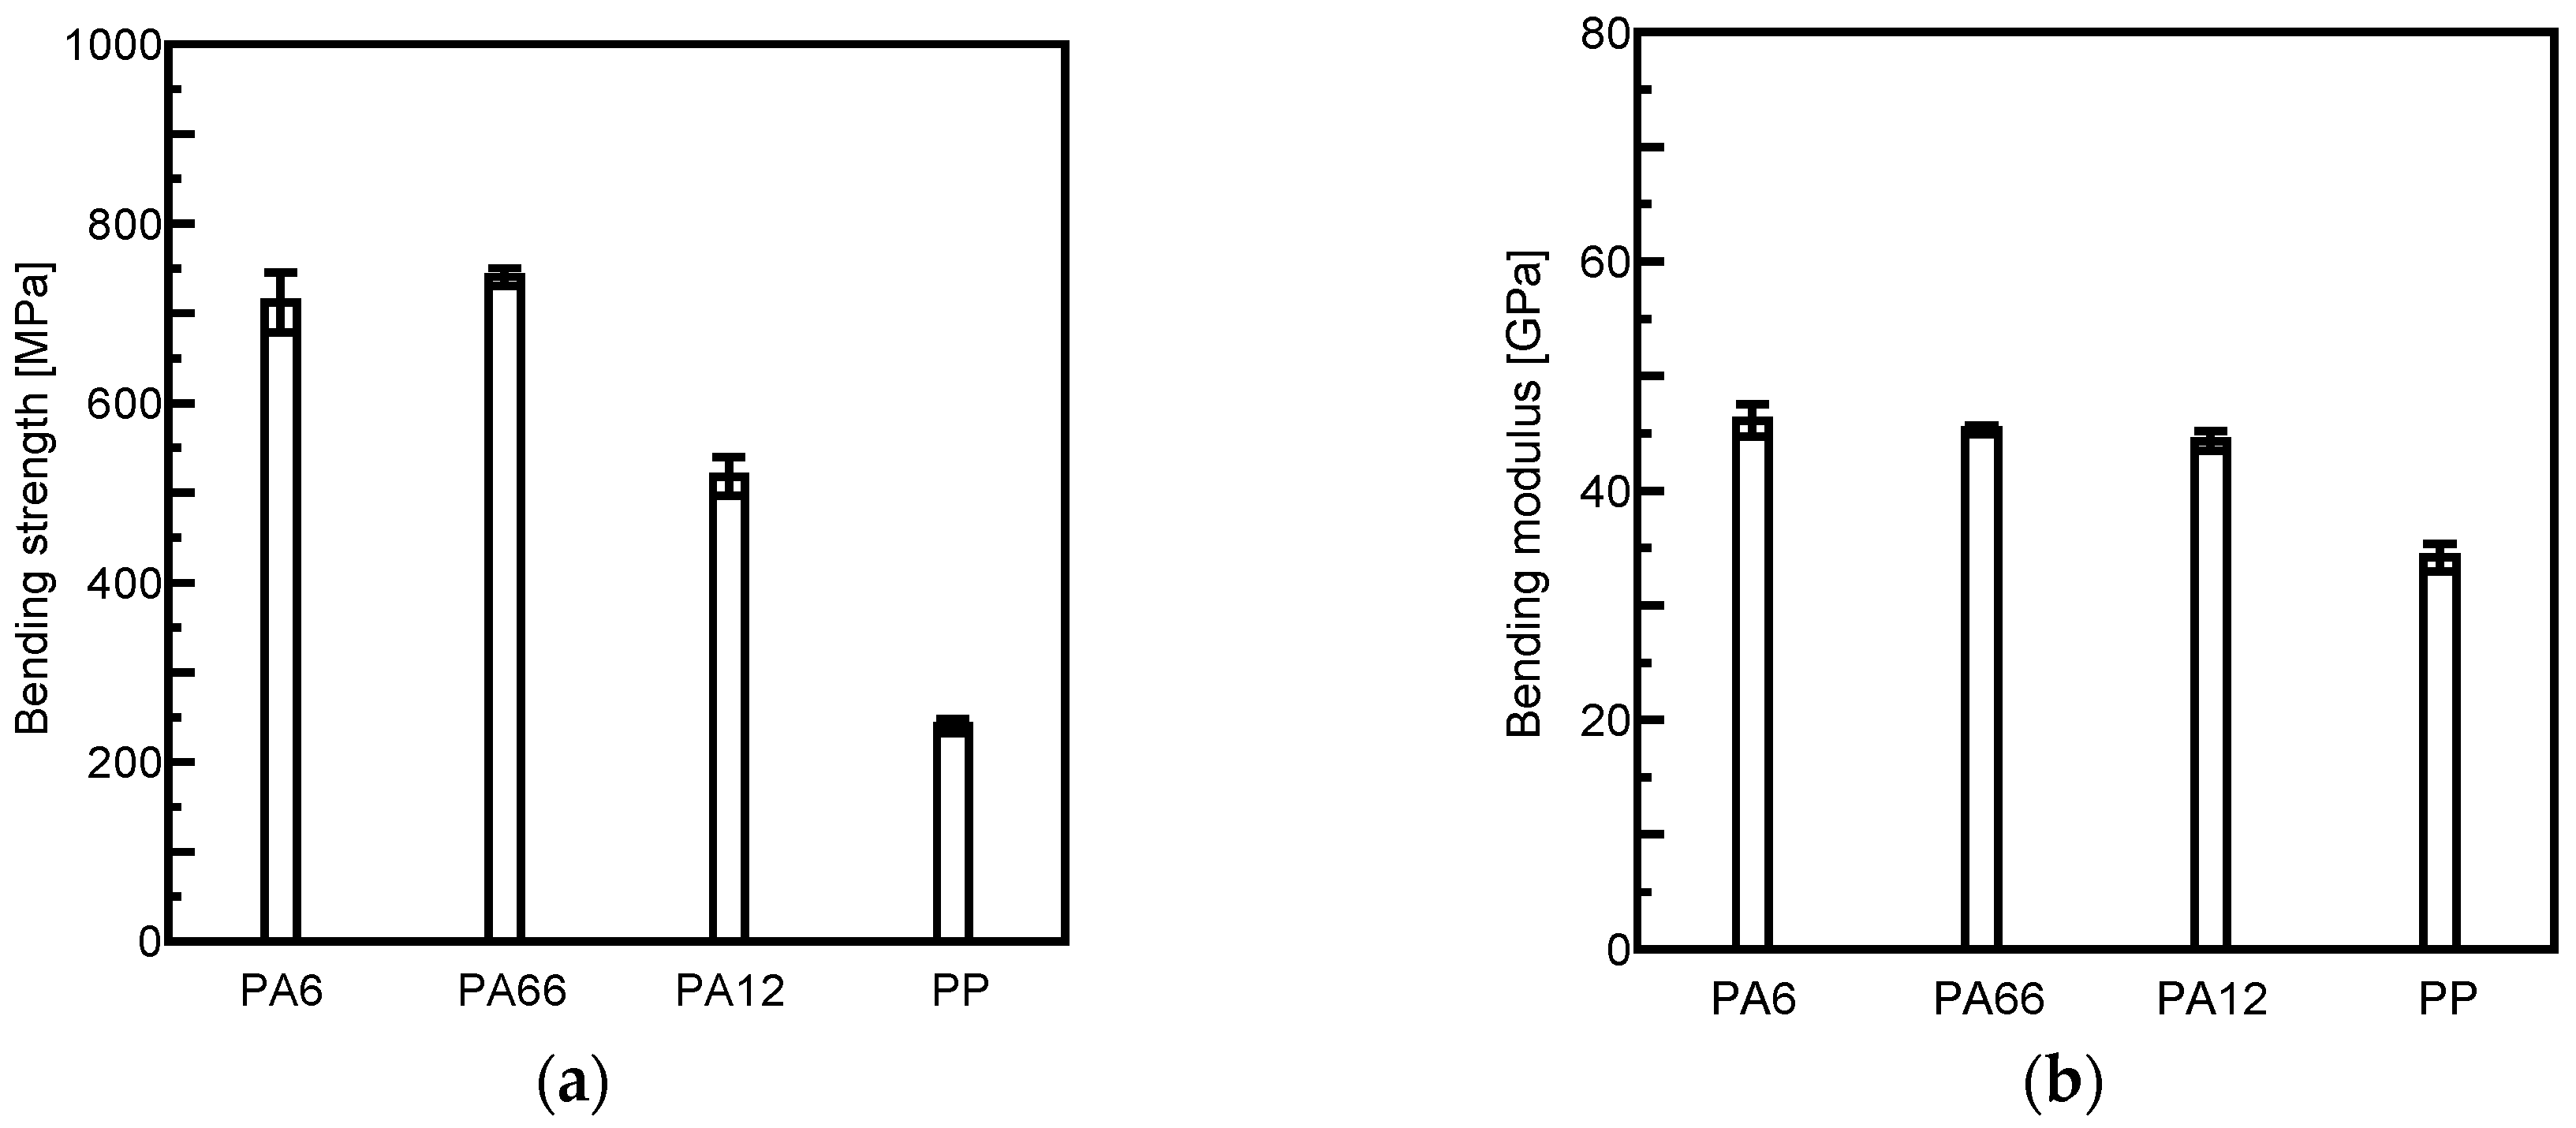
4.2. Three-Point Bending Test

Figure 23 shows the bending strength σ b and the bending modulus E b , obtained by the three-point bending test. PA66 exhibited the highest bending strength σ b , followed by PA6, PA12, and PP, in descending order. The PA6, PA66, and PA12 specimens demonstrated comparable bending moduli E b , while PP specimens exhibited lower values. Figure 24 shows SEM images of the fracture surfaces after the three-point bending test. For the PA6, PA66, and PA12 specimens, fractures occurred predominantly in the matrix region near the carbon fiber, as matrix adhesion was observed on the carbon fiber surface. In contrast, PP specimens exhibited fiber–matrix interfacial fracture, characterized by striated surface patterns on the carbon fibers. These observations corroborate the findings discussed in Section 4.1. The superior fiber–matrix interfacial shear strength in the PA6, PA66, and PA12 specimens effectively inhibited crack propagation along the fiber–matrix interface, resulting in matrix-dominant fractures near the carbon fibers. Conversely, the lower fiber–matrix interfacial shear strength in PP led to crack propagation along the fiber–matrix interface.

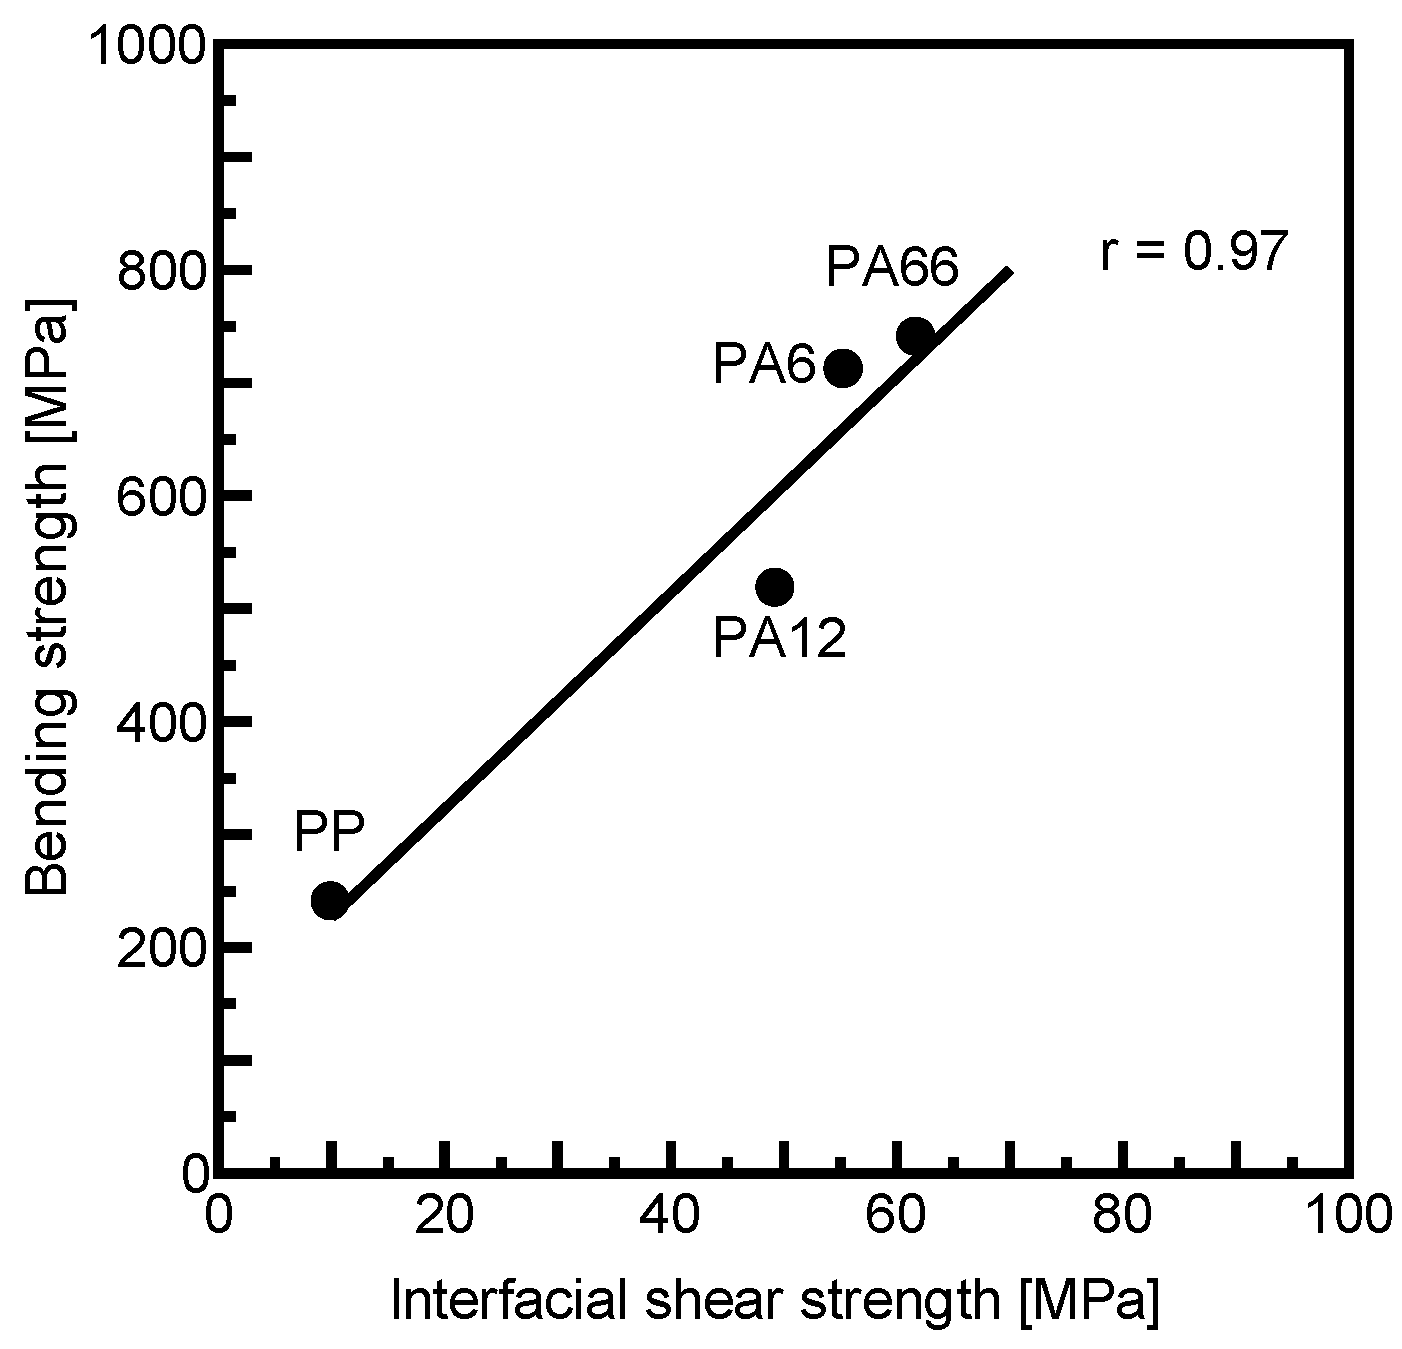
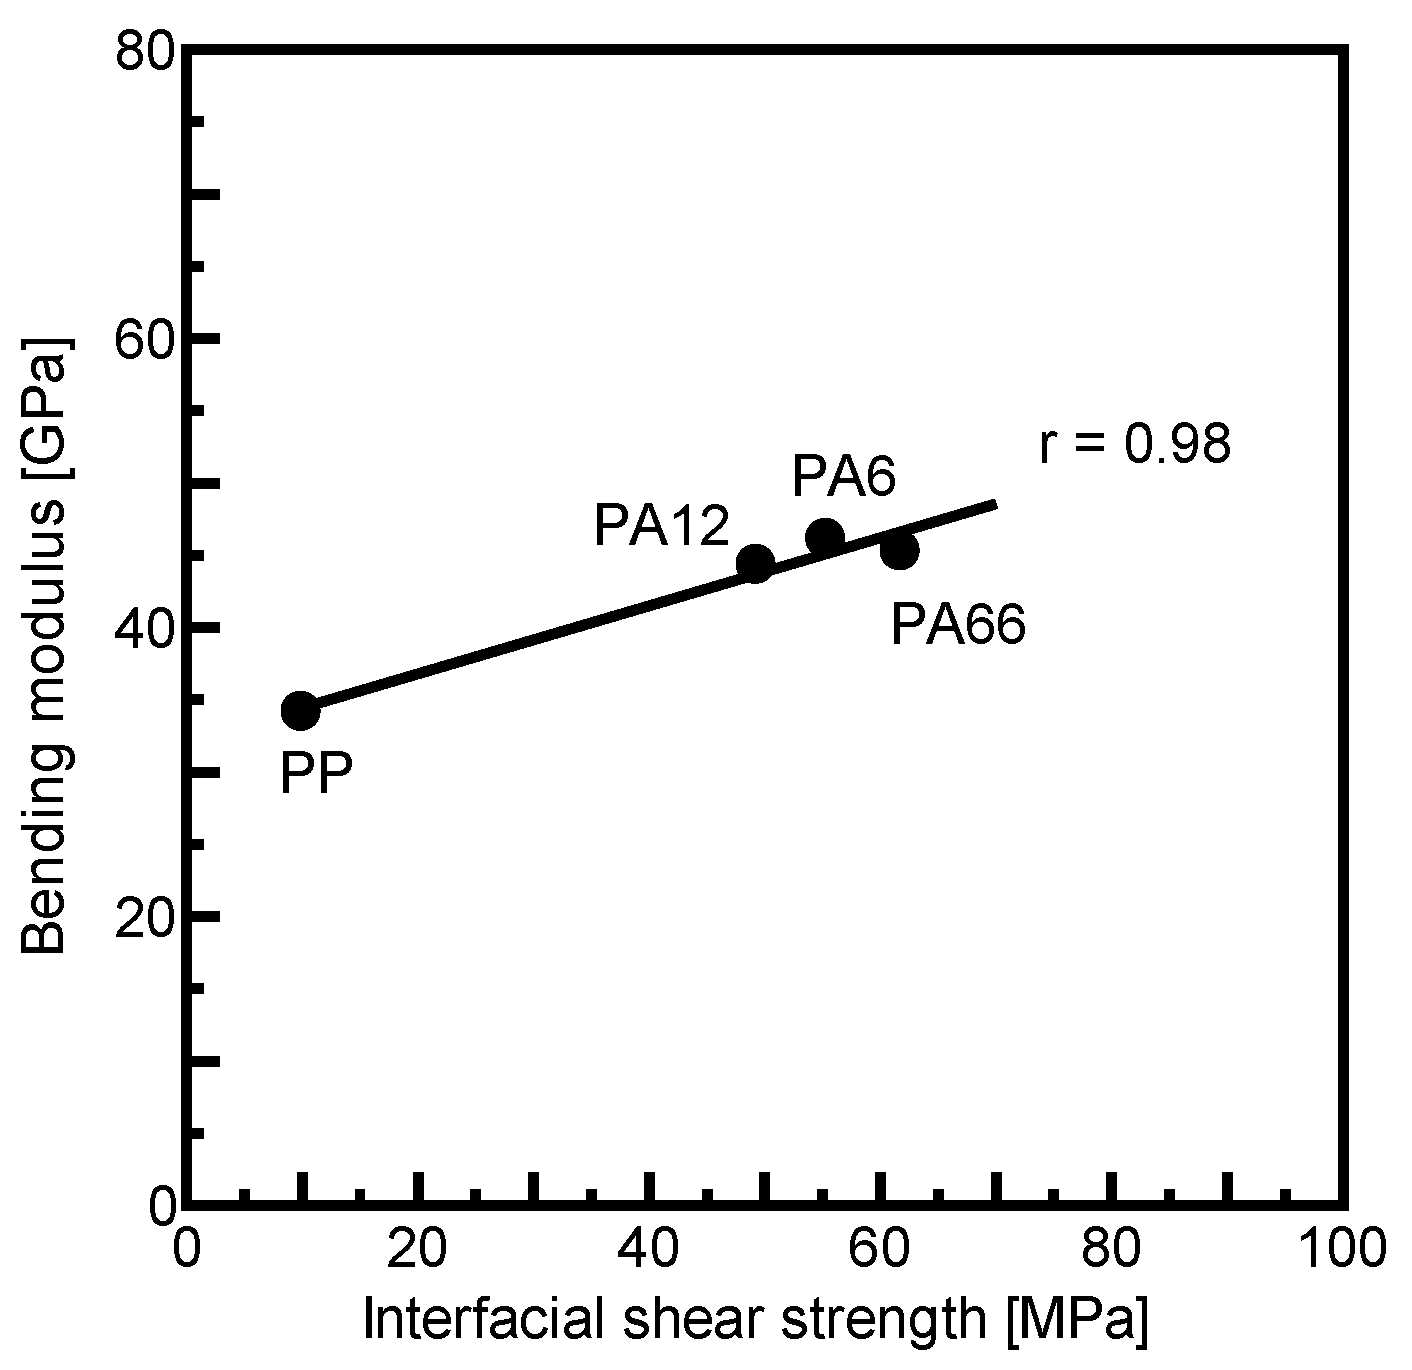
4.3. Relationship Between Mechanical Properties of CFRTP Laminates and Fiber–Matrix Interfacial Strength

Figure 25 illustrates a strong positive correlation coefficient of 0.97 between the bending strength σ b and the fiber–matrix interfacial shear strength τ f . This result aligns with a previous study, which reported that enhanced fiber–matrix interfacial shear strength contributes to superior mechanical properties in laminated composites [17].
Figure 26 shows a strong positive correlation coefficient of 0.98 between the bending modulus E b and the fiber–matrix interfacial shear strength τ f . It has been reported that poor fiber–matrix adhesion results in reduced stress transfer between fiber and matrix [36]. Consistent with this understanding, the lower bending modulus E b in PP specimens can be attributed to reduced stress transfer efficiency resulting from the inferior fiber–matrix interfacial shear strength.
These results demonstrate that fiber–matrix interfacial shear strength plays a critical role in determining the mechanical properties of CFRTP laminates. Enhanced mechanical properties were consistently observed in CFRTP laminates with matrices exhibiting superior fiber–matrix interfacial shear strength.

5. Conclusions

In this study, the properties of various thermoplastics were measured, and the matrix tightening stress acting on the fiber was simulated using finite element method (FEM) analysis. The relationships between the fiber–matrix interfacial shear strength and the matrix properties were clarified. Additionally, the mechanical properties of carbon fiber reinforced thermoplastic (CFRTP) laminates were evaluated by a short-beam three-point bending test and a three-point bending test; their results’ relationships with fiber–matrix interfacial shear strength were examined. The investigation yielded the following conclusions:
  • Fiber–matrix interfacial shear strength exhibited a positive correlation with matrix tightening stress, which constricts the fiber in the radial direction, as well as with matrix density, tensile strength, modulus, and melting temperature of each matrix. In contrast, it showed a negative correlation with the coefficient of linear expansion of the matrices.
  • Higher fiber–matrix interfacial shear strength can be achieved by using a matrix with a higher density, even without direct evaluation of fiber–matrix interfacial strength, as fiber–matrix interfacial shear strength showed a strong positive correlation with matrix density.
  • The mechanical properties of CFRTP laminates were enhanced when matrices with higher fiber–matrix interfacial shear strength were used.

Author Contributions

Conceptualization, K.T.; data curation, R.S.; funding acquisition, K.T.; investigation, R.S.; methodology, K.T.; project administration, K.T.; resources, K.T.; supervision, K.T.; validation, K.T. and R.S.; visualization, R.S.; writing—original draft, R.S.; writing—review and editing, K.T. All authors have read and agreed to the published version of the manuscript.

Funding

This research was partially supported by Individual Research Allowances, Doshisha University.

Data Availability Statement

Data are contained within this article.

Conflicts of Interest

The authors declare no conflicts of interest.

References

  1. Mcauley, W.J. Global Sustainability and Key Needs in Future Automotive Design. Environ. Sci. Technol. 2003, 37, 5414–5416. [Google Scholar] [CrossRef]
  2. Warsen, J.; Krinke, S. The Life Cycle Approach at Volkswagen. ATZ Worldw. 2012, 114, 4–9. [Google Scholar] [CrossRef]
  3. Ishikawa, T.; Amaoka, K.; Masubuchi, Y.; Yamamoto, T.; Yamanaka, A.; Arai, M.; Takahashi, J. Overview of Automotive Structural Composites Technology Developments in Japan. Compos. Sci. Technol. 2018, 155, 221–246. [Google Scholar] [CrossRef]
  4. Sugawara, Z.; Togami, K.; Okabe, R. Approach to Advanced Composite Material Technology to Realize Weight Reduction of Future Aircraft toward Decarbonization of Air Transportation. Mitsubishi Heavy Ind. Tech. Rev. 2022, 59, 4. Available online: https://www.mhi.co.jp/technology/review/en/abstracte-59-4-170.html (accessed on 5 February 2025).
  5. Wazeer, A.; Das, A.; Abeykoon, C.; Sinha, A.; Karmakar, A. Composites for electric vehicles and automotive sector: A review. Green Energy Intell. Transp. 2023, 2, 100043. [Google Scholar] [CrossRef]
  6. Zhang, W.; Xu, J. Advanced lightweight materials for Automobiles: A review. Mater. Des. 2022, 221, 110994. [Google Scholar] [CrossRef]
  7. Siengchin, S. A Review on Lightweight Materials for Defence Applications: Present and Future Developments. Def. Technol. 2023, 24, 1–17. [Google Scholar] [CrossRef]
  8. Verpoest, I. History of Composites Volume 2: The Last 50 Years and the Future. Available online: https://reader.jeccomposites.com/reader/cbe5360b-ec87-405c-92af-a828560cf720?origin=%2Fcatalog%2F50-years-of-composites%2F50-years-of-composites%2Fn2-2023 (accessed on 14 January 2025).
  9. Marsh, G. Reinforced thermoplastics, the next wave? Reinf. Plast. 2014, 58, 24–28. [Google Scholar] [CrossRef]
  10. Mohammadi, H.; Ahmad, Z.; Mazlan, A.S.; Johari, F.A.M.; Siebert, G.; Petrů, M.; Koloor, R.S.S. Lightweight Glass Fiber-Reinforced Polymer Composite for Automotive Bumper Applications: A Review. Polymers 2023, 15, 193. [Google Scholar] [CrossRef]
  11. Kim, J.K.; Mai, Y.W. Engineered Interfaces in Fiber Reinforced Composites; Elsevier Science: Amsterdam, The Netherlands, 1998. [Google Scholar]
  12. Mahboubizadeh, S.; Sadeq, A.; Arzaqi, Z.; Ashkani, O.; Samadoghli, M. Advancements in fiber-reinforced polymer (FRP) composites: An extensive review. Discov. Mater. 2024, 4, 22. [Google Scholar] [CrossRef]
  13. Jesson, A.D.; Watts, F.J. The Interface and Interphase in Polymer Matrix Composites: Effect on Mechanical Properties and Methods for Identification. Polym. Rev. 2012, 52, 321–354. [Google Scholar] [CrossRef]
  14. Li, J. Effect of carbon fiber surface treatment with HNO3 and KOH on the interfacial bonding of PMMA resin composite. Mater. Sci. Pol. 2023, 41, 301–310. [Google Scholar] [CrossRef]
  15. Pawlak, M.A.; Górny, T.; Dopierała, Ł.; Paczos, P. The Use of CFRP for Structural Reinforcement-Literature Review. Metals 2022, 12, 1470. [Google Scholar] [CrossRef]
  16. Ji, X.; Dai, Y.; Zheng, B.L.; Ye, L.; Mai, Y.W. Interface end theory and re-evaluation in interfacial strength test methods. Compos. Interfaces 2003, 10, 567–580. [Google Scholar] [CrossRef]
  17. Nishida, H.; Okubo, K.; Fujii, T.; Carvelli, V. Improvement of Bending Strength of Carbon Fiber/Thermoplastic Epoxy Composites-Effects of Molecular Weight of Epoxy on Carbon Fiber/Matrix Interfacial Strength and Connection of Cracks in Matrix. Open J. Compos. Mater. 2017, 7, 207–217. [Google Scholar] [CrossRef]
  18. Wang, X.; Xu, D.; Liu, H.Y.; Zhou, H.; Mai, Y.W.; Yang, J.; Li, E. Effects of thermal residual stress on interfacial properties of polyphenylene sulphide/carbon fibre (PPS/CF) composite by microbond test. J. Mater. Sci. 2015, 51, 334–343. [Google Scholar] [CrossRef]
  19. Tanaka, K.; Morioka, N.; Kawaguchi, M.; Watanabe, K. Effect of Silica Addition to Resin on Fiber Matrix Interfacial Shear Strength of Carbon Fiber Reinforced Polyamide Resin at High Temperature. J. Soc. Mater. Sci. Jpn. 2022, 71, 501–507. [Google Scholar] [CrossRef]
  20. Aratani, Y.; Kobori, H.; Tanaka, K. Effect of Interfacial Chemical and Physical Bonding on The Interfacial Shear Strength of Glass Fiber/Polyamide Resin and Mechanical Properties of The Composites. J. Soc. Mater. Sci. Jpn. 2023, 72, 697–704. [Google Scholar] [CrossRef]
  21. Tanaka, K.; Okuda, S.; Katayama, T. Effect of Air Oxidation of Carbon Fiber on Interfacial Shear Strength of Carbon Fiber Reinforced Thermoplastics. J. Soc. Mater. Sci. Jpn. 2020, 69, 358–364. [Google Scholar] [CrossRef]
  22. Weng, P.; Prasad, V.; Rao, S.P.; O’Dowd, N.; Murphy, N.; Ivankovic, A.; Scarselli, G. Interfacial properties of carbon fiber-reinforced biobased resin composites by single fiber fragmentation, fiber push-out, and interlaminar shear strength. Polym. Compos. 2024, 45, 3355–3369. [Google Scholar] [CrossRef]
  23. Irisawa, T.; Inagaki, R.; Iida, J.; Iwamura, R.; Ujihara, K.; Kobayashi, S.; Tanabe, Y. The influence of oxygen containing functional groups on carbon fibers for mechanical properties and recyclability of CFRTPs made with in-situ polymerizable polyamide 6. Compos. Part A 2018, 112, 91–99. [Google Scholar] [CrossRef]
  24. Zhao, G.L.; Warrior, A.N.; Long, C.A. A micromechanical study of residual stress and its effect on transverse failure in polymer-matrix composites. Int. J. Solids Struct. 2006, 43, 5449–5467. [Google Scholar] [CrossRef]
  25. Liu, W.B.; Zhang, S.; Hao, L.F.; Jiao, W.C.; Yang, F.; Li, X.F.; Wang, R.G. Interfacial Shear Strength in Carbon Fiber-Reinforced Poly (phthalazinone ether ketone) Composites. Polym. Compos. 2013, 34, 1921–1926. [Google Scholar] [CrossRef]
  26. Thomason, L.J.; Yang, L. Temperature dependence of the interfacial shear strength in glass-fibre polypropylene composites. Compos. Sci. Technol. 2011, 71, 1600–1605. [Google Scholar] [CrossRef]
  27. Herrera-Franco, J.P.; Valadez-González, A. A study of the mechanical properties of short natural-fiber reinforced composites. Compos. Part B 2005, 36, 597–608. [Google Scholar] [CrossRef]
  28. Fu, S.Y.; Feng, X.Q.; Lauke, B.; Mai, Y.W. Effects of particle size, particle/matrix interface adhesion and particle loading on mechanical properties of particulate-polymer composites. Compos. Part B 2008, 39, 933–961. [Google Scholar] [CrossRef]
  29. Arao, Y.; Yumitori, S.; Suzuki, H.; Tanaka, T.; Tanaka, K.; Katayama, T. Mechanical properties of injection-molded carbon fiber/polypropylene composites hybridized with nanofillers. Compos. Part A 2013, 55, 19–26. [Google Scholar] [CrossRef]
  30. Ashby, F.M. Materials Selection in Mechanical Design, 5th ed.; Elsevier: Amsterdam, The Netherlands, 2017. [Google Scholar]
  31. Aratani, Y.; Okuda, S.; Tanaka, K. Effects of Cooling Speed of Specimen at Preparation, Temperature during Test and Sizing agent on Glass Fiber / Polyamide Resin Interfacial Shear Strength. J. Soc. Mater. Sci. Jpn. 2021, 70, 684–689. [Google Scholar] [CrossRef]
  32. Tanaka, K.; Kashihara, H.; Katayama, T. Vacuum Assisted High Speed Compression Molding and Evaluation of Mechanical Properties of Continuous Carbon Fiber Reinforced Polycarbonate Composite. J. Soc. Mater. Sci. Jpn. 2011, 60, 251–258. [Google Scholar] [CrossRef]
  33. Tanaka, K.; Hosoo, N.; Katayama, T. Effects of Temperature on the Fiber Matrix Interfacial Properties of Carbon Fiber Reinforced Highly Heat Resistant Polyamide Resin. J. Soc. Mater. Sci. Jpn. 2017, 66, 746–751. [Google Scholar] [CrossRef]
  34. Yokozeki, T.; Kobayashi, Y.; Arai, H.; Otani, A.; Nakai, A.; Goto, K. Characterization of Mechanical Properties of CFRP Using Thermoplastic Matrix without Moisture Absorption. J. Jpn. Soc. Compos. Mater. 2016, 42, 163–168. [Google Scholar] [CrossRef]
  35. Hirai, M.; Nishijima, S.; Toda, Y. Study on Interlaminar Shear Strength Test Method of Fiber Reinforced Organic Composite Materials. Cryog. Supercond. Soc. Jpn. 2022, 57, 155–159. [Google Scholar] [CrossRef]
  36. Dong, Y.; Zhu, Y.; Zhao, Y.; Liu, F.; Wang, E.; Fu, Y. Enhance interfacial properties of glass fiber/epoxy composites with environment-friendly water-based hybrid sizing agent. Compos. Part A 2017, 102, 357–367. [Google Scholar] [CrossRef]
Figure 1. Schematic drawing of a microdroplet test specimen.
Jcs 09 00174 g001
Figure 2. Schematic drawing of a microdroplet test and SEM image of a matrix droplet: (a) microdroplet test; (b) matrix droplet.
Jcs 09 00174 g002
Figure 3. Analytical model.
Jcs 09 00174 g003
Figure 4. Constraint condition of analytical model.
Jcs 09 00174 g004
Figure 5. Boundary stress of analytical model.
Jcs 09 00174 g005
Figure 6. Interfacial shear strength obtained by microdroplet test. (N = 8, mean ± S.D.)
Jcs 09 00174 g006
Figure 7. SEM images of carbon fiber after microdroplet test: (a) PA6; (b) PA66; (c) PA12; (d) PP.
Jcs 09 00174 g007
Figure 8. Correlation between tensile strength of matrix and interfacial shear strength. (Tensile strength: N = 4, mean ± S.D.).
Jcs 09 00174 g008
Figure 9. Correlation between modulus of matrix and interfacial shear strength. (Modulus: N = 4, mean ± S.D.).
Jcs 09 00174 g009
Figure 10. Correlation between melting temperature of matrix and interfacial shear strength. (Melting temperature: N = 5, mean ± S.D.).
Jcs 09 00174 g010
Figure 11. Correlation between coefficient of linear expansion of matrix and interfacial shear strength. (Coefficient of linear expansion: N = 5, mean ± S.D.).
Jcs 09 00174 g011
Figure 12. Correlation between matrix density and interfacial shear strength. (Density: N = 10, mean ± S.D.).
Jcs 09 00174 g012
Figure 13. Correlation between matrix tightening stress and interfacial shear strength.
Jcs 09 00174 g013
Figure 14. Contribution of physical and chemical bonding to the matrix.
Jcs 09 00174 g014
Figure 15. SEM image of interruption test in microdroplet test.
Jcs 09 00174 g015
Figure 16. Correlation between modulus of matrix and matrix tightening stress.
Jcs 09 00174 g016
Figure 17. Correlation between melting temperature and modulus of matrix.
Jcs 09 00174 g017
Figure 18. Correlation between coefficient of linear expansion and modulus of matrix.
Jcs 09 00174 g018
Figure 19. Correlation between matrix density and modulus of matrix.
Jcs 09 00174 g019
Figure 20. Correlation between matrix density and interfacial shear strength, including data from reference.
Jcs 09 00174 g020
Figure 21. Interlaminar shear strength obtained by short-beam three-point bending test. (N = 10, mean ± S.D.).
Jcs 09 00174 g021
Figure 22. Side view of short-beam three-point bending test: (a) PA6; (b) PA66; (c) PA12; (d) PP.
Jcs 09 00174 g022
Figure 23. Results of three-point bending test: (a) bending strength; (b) bending modulus. (N = 7, mean ± S.D.).
Jcs 09 00174 g023
Figure 24. SEM images of fracture surfaces after three-point bending test: (a) PA6; (b) PA66; (c) PA12; (d) PP.
Jcs 09 00174 g024
Figure 25. Correlation between interfacial shear strength and bending strength.
Jcs 09 00174 g025
Figure 26. Correlation between interfacial shear strength and bending modulus.
Jcs 09 00174 g026
Table 1. Measurement conditions of the coefficient of linear expansion.
PA6PA66PA12PP
EnvironmentUnder atmospheric conditions
Heating rate10 °C/min
Initial load50 gf (490 mN)
Temperature range30 °C to 190 °C30 °C to 230 °C30 °C to 150 °C30 °C to 130 °C
Δ L Dimensional change from
180 °C to 190 °C
Dimensional change from
220 °C to 230 °C
Dimensional change from
140 °C to 150 °C
Dimensional change from
120 °C to 130 °C
L 0 Dimension at 180 °C Dimension at 220 °CDimension at 140 °CDimension at 120 °C
Δ T 10 °C
Disclaimer/Publisher’s Note: The statements, opinions and data contained in all publications are solely those of the individual author(s) and contributor(s) and not of MDPI and/or the editor(s). MDPI and/or the editor(s) disclaim responsibility for any injury to people or property resulting from any ideas, methods, instructions or products referred to in the content.

