Article

Numerical Analysis of the Cyclic Behavior of Reinforced Concrete Columns Incorporating Rubber

1
Civil Engineering Program, High Institute of Engineering and Technology, Arish 48111, Egypt
2
Structural Engineering Department, Zagazig University, Zagazig 44519, Egypt
3
Department of Engineering and Technology, East Texas A&M University, Commerce, TX 76429, USA
*
Author to whom correspondence should be addressed.
J. Compos. Sci. 2025, 9(3), 95; https://doi.org/10.3390/jcs9030095
Submission received: 8 December 2024 / Revised: 9 February 2025 / Accepted: 18 February 2025 / Published: 21 February 2025
(This article belongs to the Special Issue Theoretical and Computational Investigation on Composite Materials)

Abstract

:
A numerical analysis of rubberized reinforced concrete columns’ performance under cyclic loading is presented in this study. Three different concrete blends (M1, M2, and M3) were chosen based on the volume of fine aggregate replaced by varying percentages of crumb rubber (CR) (0%, 10%, and 15%). Under cyclic loads, three groups of rubberized reinforced concrete (RRC) columns with circular, square, and rectangular cross-sections and heights of 1.5 m and 2.0 m were analyzed using the finite element software ABAQUS. The proposed model effectively predicts the behavior of rubberized reinforced concrete columns under cyclic loading. Additionally, these columns demonstrate improved performance in lateral displacement, displacement ductility, and damping ratio, with only a slight reduction in lateral load capacity. For the circular columns with a height of 1.5 m, the displacement ductility increased by 47.8% and 89.0% when the fine aggregates were replaced with 10% and 15% CR, respectively. Similarly, for square columns of the same height, the displacement ductility increased by 18.7% and 26.7% with 10% and 15% CR, respectively. The rectangular specimens exhibited enhancements of 34.74% and 58.95%, respectively. Although the analyzed rubberized reinforced concrete columns experienced slight reductions in the lateral load capacity compared to the non-CR columns, the cyclic damage resistance was notably improved.

1. Introduction

Concrete is among the oldest building materials in the world [1]. The design community is always coming up with new ways to discover substitute materials to make concrete less expensive or more environmentally friendly by lowering its carbon footprint. Most tires are disposed of in landfills, which has a negative impact on the environment. Instead of throwing away such waste, it has been suggested that leftover tire rubber be used to make concrete [2,3]. It has been shown that using tire rubber in cement combinations, road construction, and geotechnical work effectively protects the environment and conserves natural resources, making it a viable disposal option that considers economic and environmental considerations [4,5]. According to previous research [6,7,8], rubber added to concrete aggregates improves the material’s ductility, toughness, energy absorption, and damping ratio.
Reinforced concrete columns are essential for maintaining a building’s structural integrity because they support heavy loads and transfer them to the base. When designing these columns, strength and ductility are equally essential considerations [9]. Failure of a column could cause the entire structure to collapse, partially or completely. It is essential to understand how these columns react to earthquakes in order to ensure that a structure can endure a certain degree of ground shaking.
Previous experimental studies were carried out on the seismic behavior of RCC columns. Hassanli et al. [10] and Elghazouli et al. [11] investigated the behavior of rubberized reinforced concrete columns under cyclic loads. The first shake-table tests were carried out on two large cantilever-reinforced concrete columns by Moustafa et al. [12]. The columns were assessed using a selection of ground motions that were calibrated to a certain design spectrum. The energy loss and lateral drift capability of a rubberized reinforced concrete column were shown to be enhanced. The bar’s fracture occurred later because of the increased energy dissipation. Higher values were noted for viscous damping and hysteresis. These seismic details have been confirmed experimentally and analytically in earlier studies, showing how strict seismic design guidelines for columns can enhance their deformation capacities [13,14], improving the seismic performance of structures. The efficiency of using waste tire rubber in concrete to improve the energy absorption and deformability characteristics of reinforced concrete (RC) columns was examined by Son et al. [15]. Twelve column specimens with cross-sectional measurements of 200 mm by 300 mm and a length of 1600 mm were put through testing. Rubber content (0.5% and 1.0% of the total aggregate weight), rubber particle size (0.6 and 1 mm), and compressive strength (24 and 28 MPa) were the variables considered in their investigation. Rubber in concrete resulted in a somewhat reduced modulus of elasticity and compressive strength, but the curvature ductility rose to 90%, per their test results. Xue and Shinozuka [16] used seismic shaking tables and free vibration to test RCC column specimens that were 500 mm long and 40 mm in cross-sections. Rubber particles measuring 6 mm were added to the concrete mixture to replace 15% of the volume of the fine aggregate. According to free vibration tests, the traditional concrete columns’ average damping ratio was 4.75%, while the rubberized reinforced concrete columns’ value was 7.7%. This represents a roughly 62% increase in damping ratio due to the addition of rubber particles to the mixture.
Several studies have explored various techniques for incorporating CR to enhance the properties of reinforced concrete columns. Ongoing research continues to investigate rubberized reinforced concrete elements; however, limited studies have specifically examined the performance of RRC columns under cyclic loading. To address this gap, this study presents a numerical analysis of RCC columns subjected to cyclic loading. Additionally, it examines the influence of multiple parameters on predicting column behavior. This paper is divided into two parts. The first part details the column modeling simulation using ABAQUS, including descriptions of model geometry, element types, material properties, boundary conditions, contact interactions, and loading conditions. The second part presents a comparison between the finite element model results and experimental data from a previous study. Finally, the behavior of RRC columns under cyclic loads is analyzed and discussed.

2. Finite Element Modeling
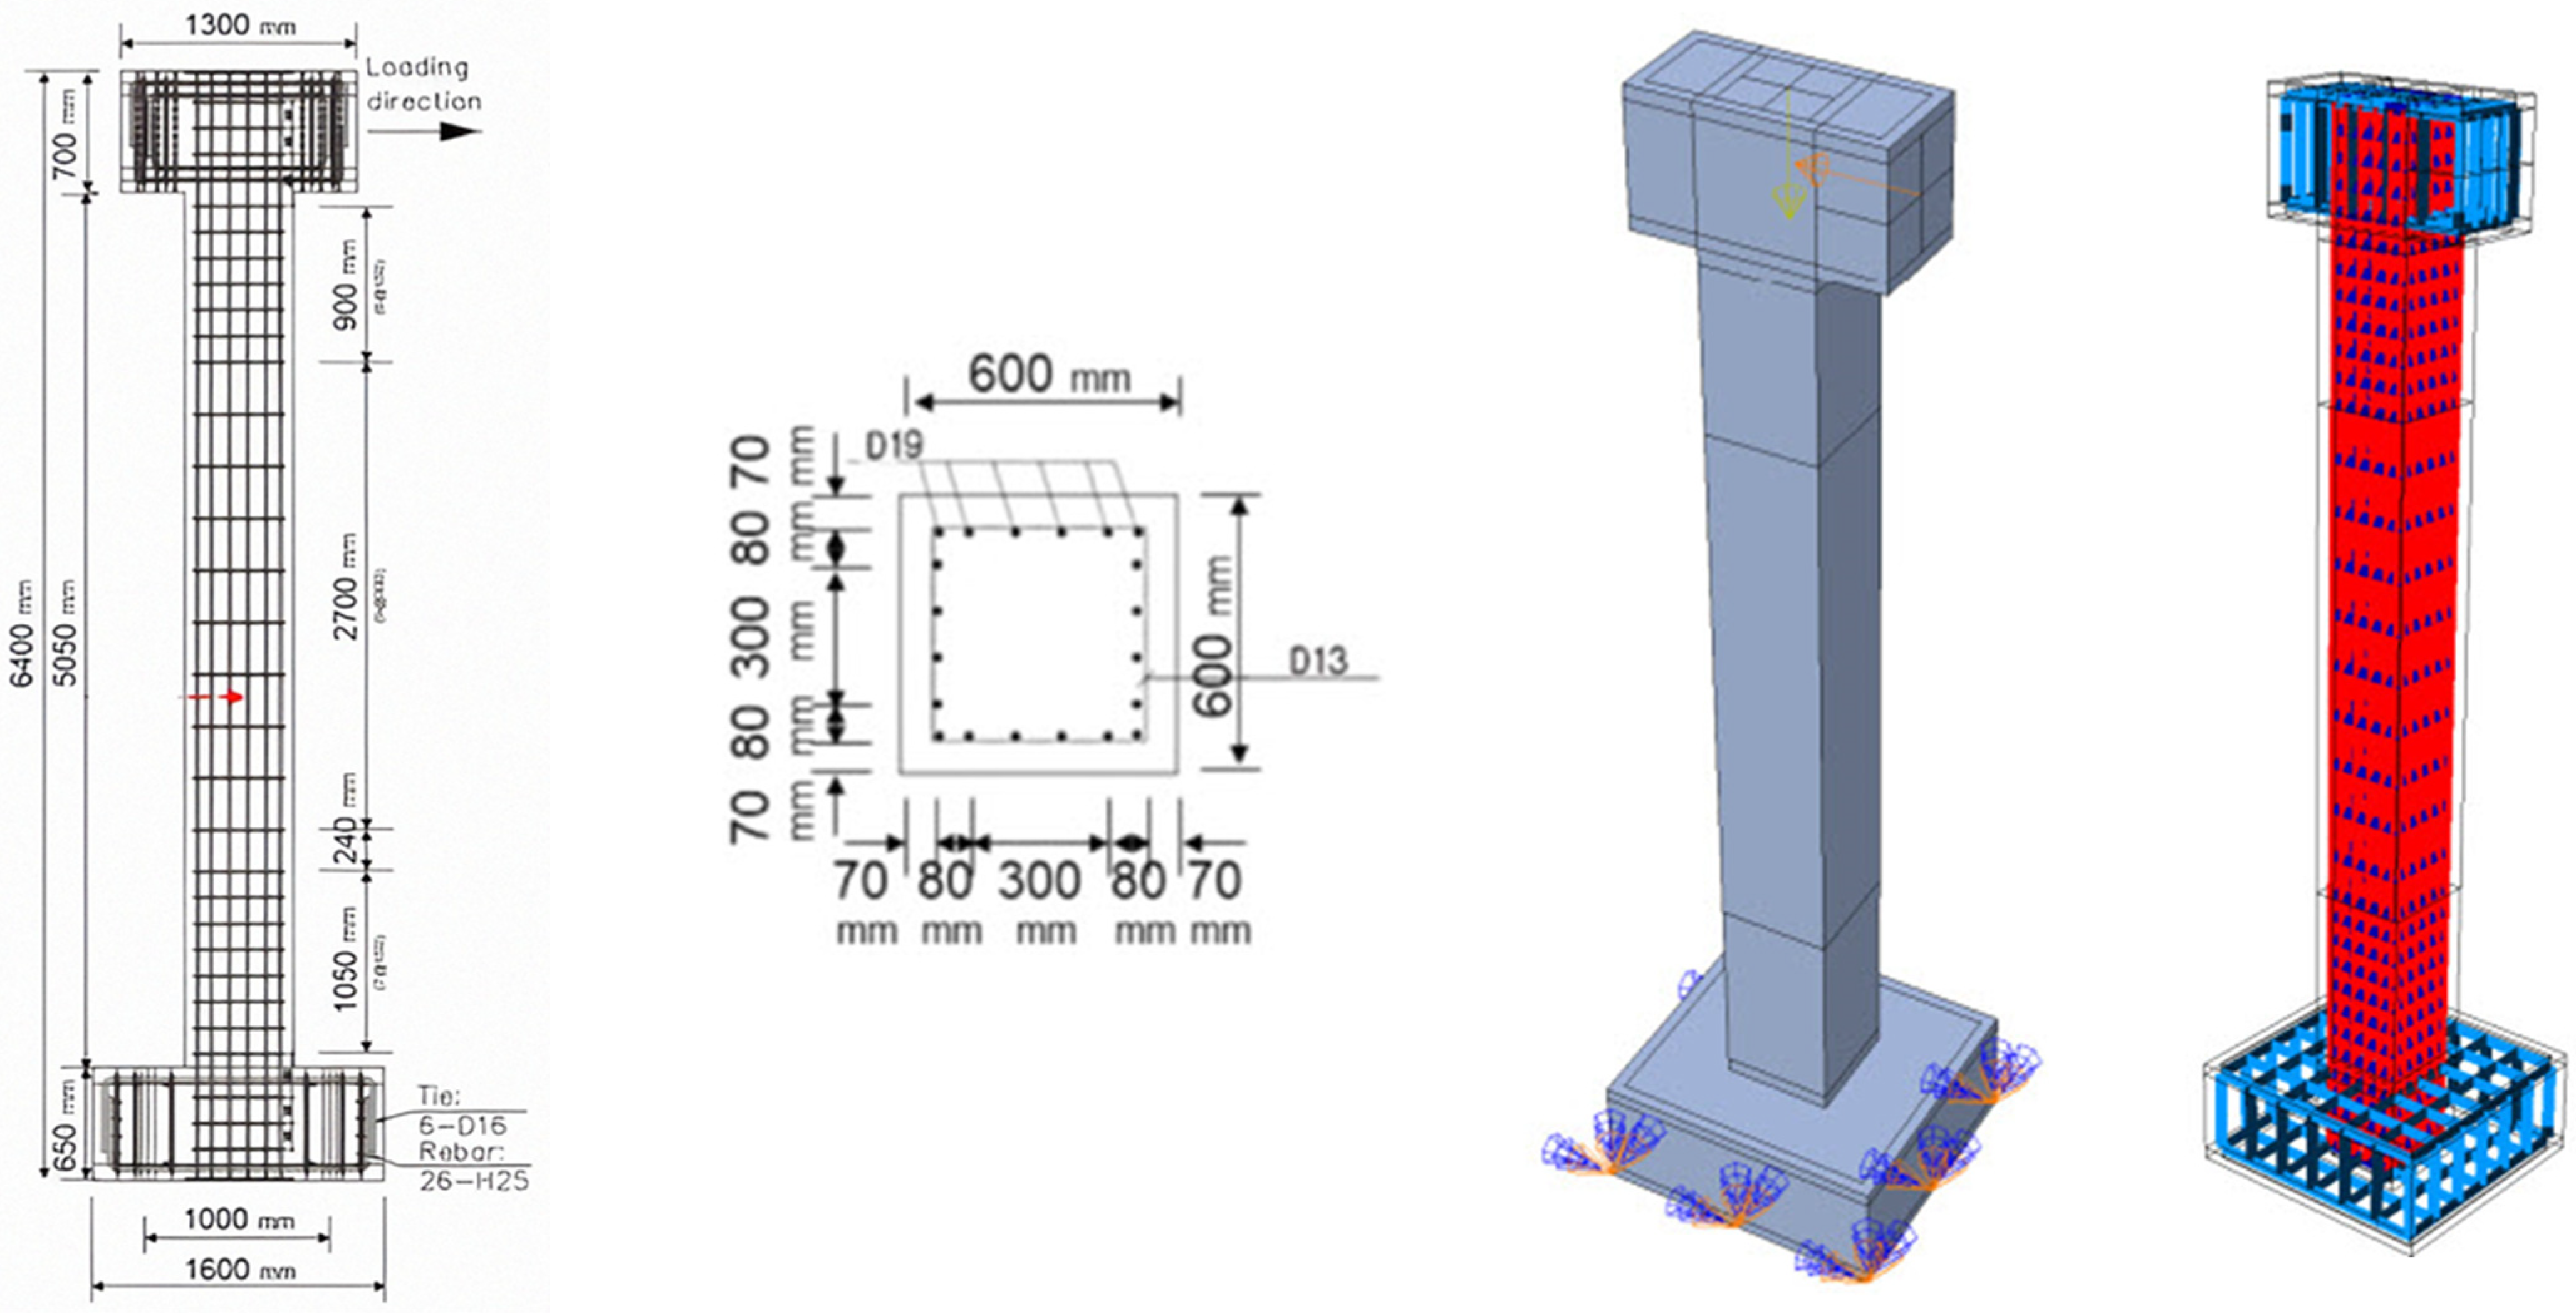
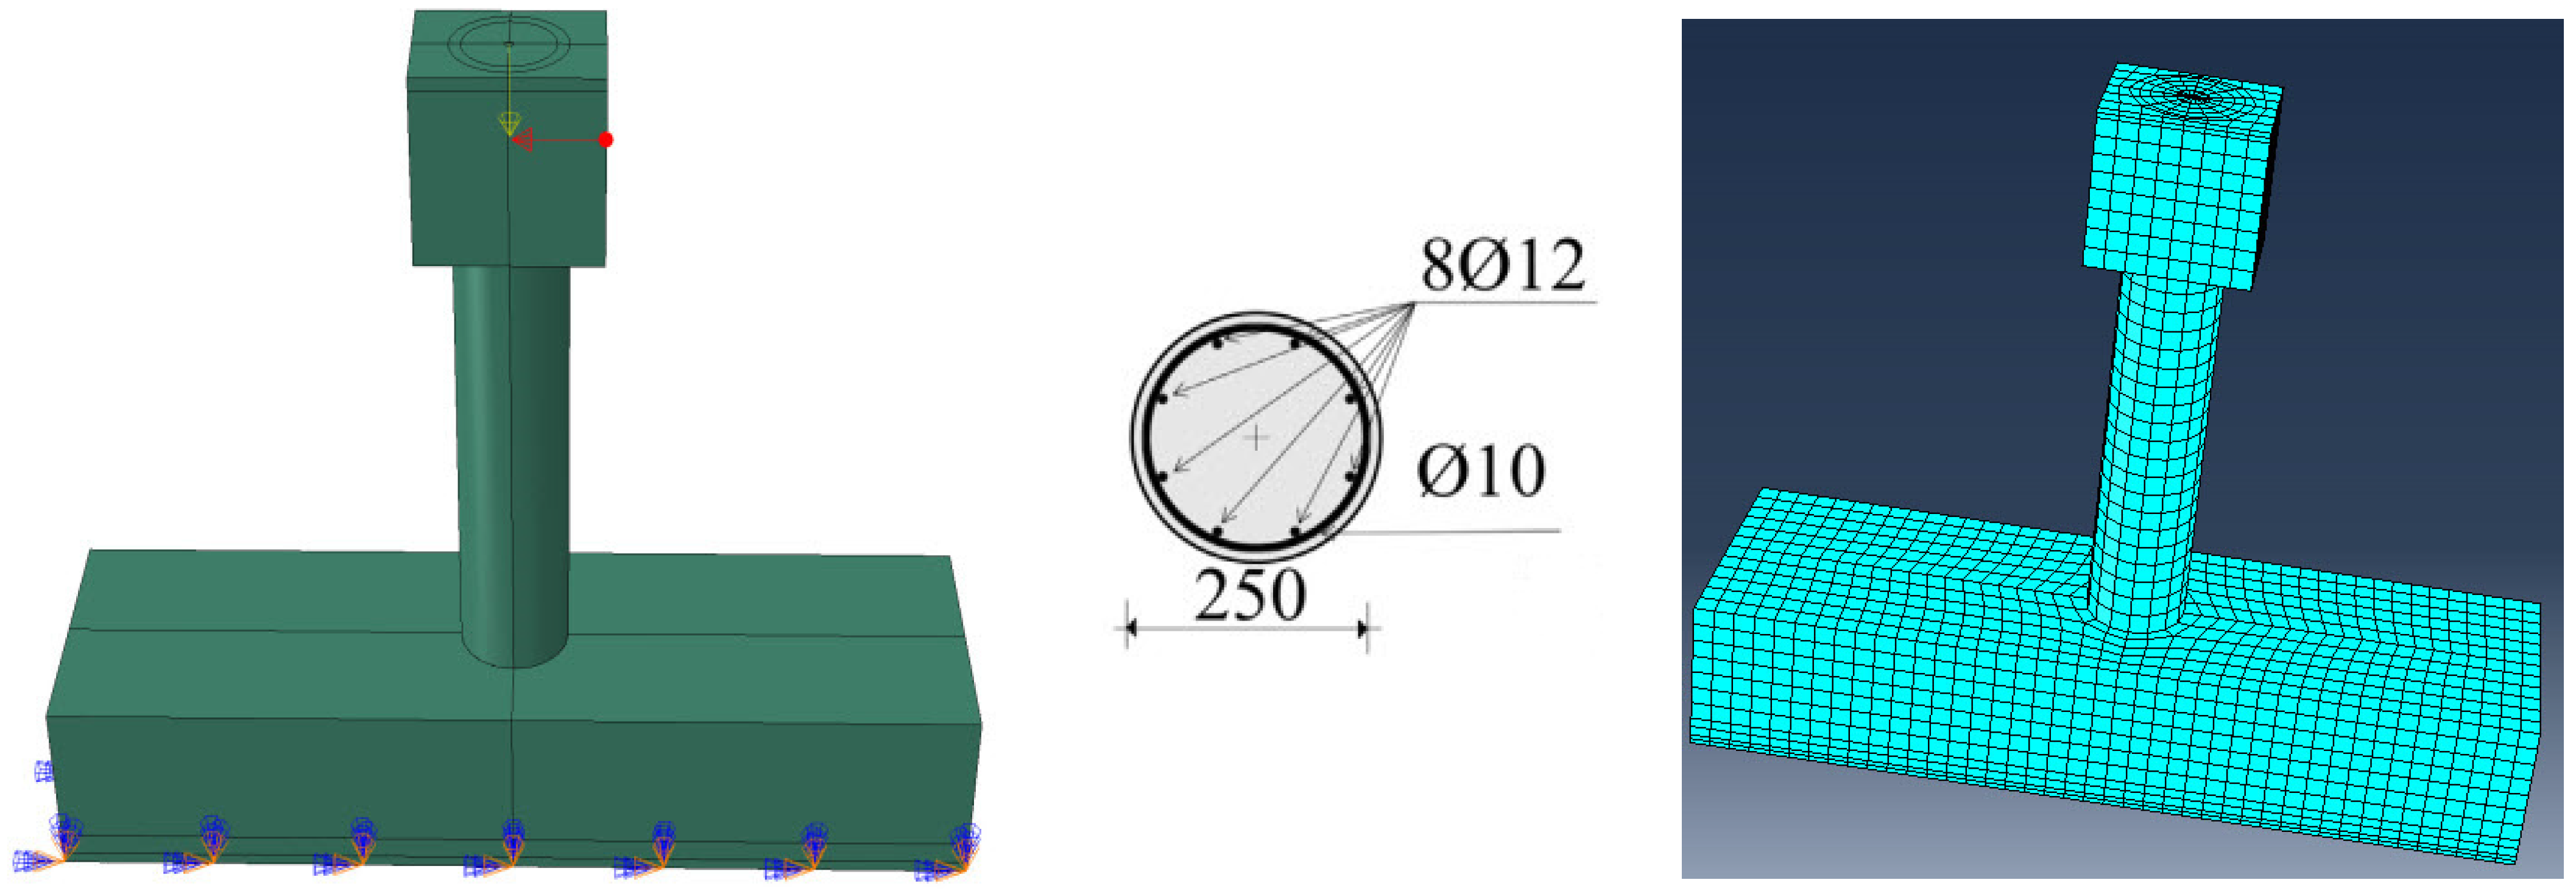
The use of the finite element approach in this work was prompted by its successful application in numerous investigations, including g complex structures or the interaction between structural parts. Material modeling and element types are crucial components of this method’s overall analysis. The numerical analysis was conducted using ABAQUS because of its robust general functions and accuracy, particularly in nonlinear analysis (nonlinear geometry, nonlinear reaction, and nonlinear material characteristics).

2.1. Model Geometry

The FE model was developed for the first set of circular RC column models. As shown in Figure 1, all columns feature a circular cross-section with a diameter of 250 mm. The study included three columns with a height of 1.5 m, incorporating CR replacement levels of 0%, 10%, and 15% for fine aggregates. Similarly, an additional set of three columns with a height of 2.0 m utilizes the same CR replacement percentage. The second group consists of columns with a square cross-section (250 × 250 mm) and CR replacement levels of 0%, 10%, and 15%. These columns have two height variations: 1.5 m and 2.0 m. Figure 2 presents the reinforcement details and dimensions for this group. The third group comprises rectangular columns, as illustrated in Figure 3, with cross-sectional dimensions of 300 × 600 mm. These columns also have heights of 1.5 m and 2.0 m, with CR replacement percentages of 0%, 10%, and 15%. Each rectangular column is reinforced with ten steel bars of 16 mm diameter.
Table 1 presents the specifications of the columns used in the numerical analysis. The column labeling system is structured as follows: The prefix “R” represents the percentage of crumb rubber in the concrete mix, where R0% denotes conventional concrete (without CR), while R10% and R15% indicate rubberized concrete with 10% and 15% CR replacement, respectively. The next letter, “H”, signifies the column height, with H1.5 referring to a 1.5 m column and H2 indicating a 2.0 m column. The final letter denotes the cross-section shape: C for circular, S for square, and R for rectangular columns. For further clarity, Table 1 also includes calculations for the buckling coefficient and applied axial load for all columns. The dimensions, boundary conditions, and reinforcement details were designed in accordance with the Egyptian Code (ECP 203/2020) [17].

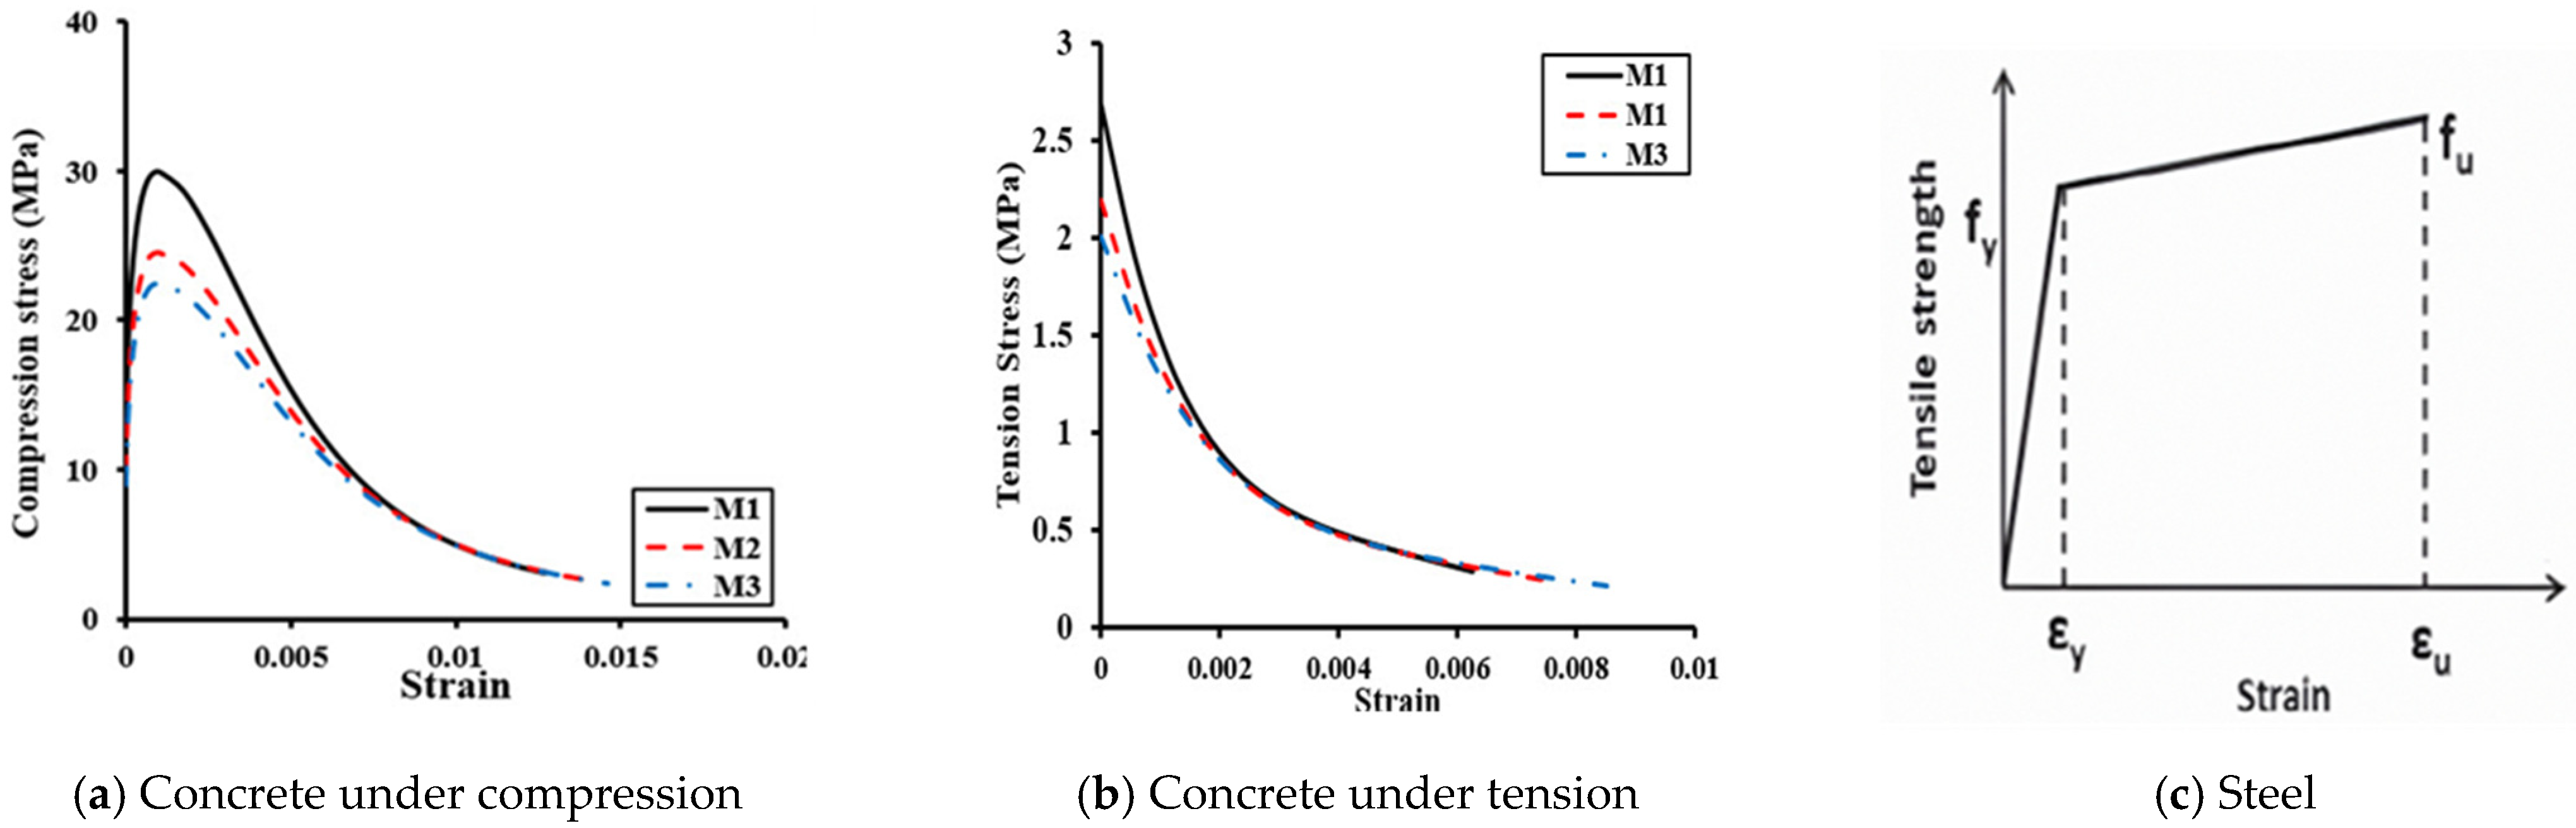
2.2. Material and Element Modeling

The material properties used in this finite element analysis are derived from a previous experimental investigation conducted by the authors as part of this study [18]. Concrete compressive and tensile strengths were determined using standard cubes (180 mm) and cylinders (150 mm in diameter and 300 mm in height). All concrete mixes incorporated coarse aggregates with a nominal maximum size of 38 mm and a specific gravity of 2.78, while medium-sized sand with a specific gravity of 2.54 and a fineness modulus of 2.69 was used as fine aggregate. Tire rubber waste was mechanically ground to produce CR with a specific gravity of 0.95. Two different sizes of CR were mixed in a 1:1 ratio and used in this study, as illustrated in Figure 4. Figure 5 highlights the effects of CR on the mechanical properties of concrete. The inclusion of CR led to reductions in the compressive strength (Fcu), tensile strength (Ftu), and modulus of elasticity (E) [19].
The tri-axial constitutive behavior of concrete was modeled using the concrete damage plasticity (CDP) model in ABAQUS, as illustrated in Figure 6 [18]. This continuum plasticity-based damage model accounts for both tensile and compressive failure mechanisms in concrete. The plastic behavior of concrete was modeled using the following parameters, which were defined in ABAQUS: the flow potential eccentricity (e) that was assumed to be 0.1, the dilation angle (ψ), the von Mises effective stress (q), the hydrostatic pressure (p), the default values of the ratio between the biaxial and uniaxial compressive strength, (fbo/fco = 1.16), and the ratio of the second stress invariant on the tensile meridian to that on the compressive meridian (Kc = 2/3).
The dilation angle (ψ) is a key parameter affecting both the strength and ductility of simulated concrete. Values ranging from 25 to 31 were used to model changes in plastic volumetric strain. Rubberized concrete mixtures exhibited higher dilation angles. A lower dilation angle indicates higher-strength concrete, as reduced lateral expansion creates a denser, stronger matrix. In contrast, higher dilation angles enhance ductility, allowing for greater lateral expansion and deformation before failure, improving energy absorption and structural resilience. Precise adjustment of the dilation angle is essential for accurate material model predictions [20].
The yield function is defined in the effective stress space, incorporating both the Von Mises equivalent stress and hydrostatic stress. Figure 7a,b [18] depict the simulated concrete response under uniaxial compression and tension using the CDP model. The tensile behavior was assumed to be linear elastic up to the experimentally measured ultimate tensile stress, after which the stress decreased linearly until reaching zero at the maximum tensile strain. According to the ABAQUS 6.7 manual, this model captures the two primary failure modes of concrete: compressive crushing and tensile cracking. The input parameters included key elastic properties such as Poisson’s ratio and Young’s modulus. Table 2 summarizes the mechanical properties of all concrete mixes used in this study.
A linearly elastic–plastic model was used to simulate the reinforcing steel rebars and stirrups, shown in Figure 7c. Two types of reinforcements were used: mild steel for the stirrups with a yield strength of 280 MPa and an ultimate strength of 420 MPa. The vertical rebars were made of high-tensile steel, which had a yield strength of 550 MPa and an ultimate strength of 640 MPa. The mechanical properties of the steel rebars used in this study are listed in Table 3. The reinforcement was given full bond conditions and was completely incorporated in the concrete region.

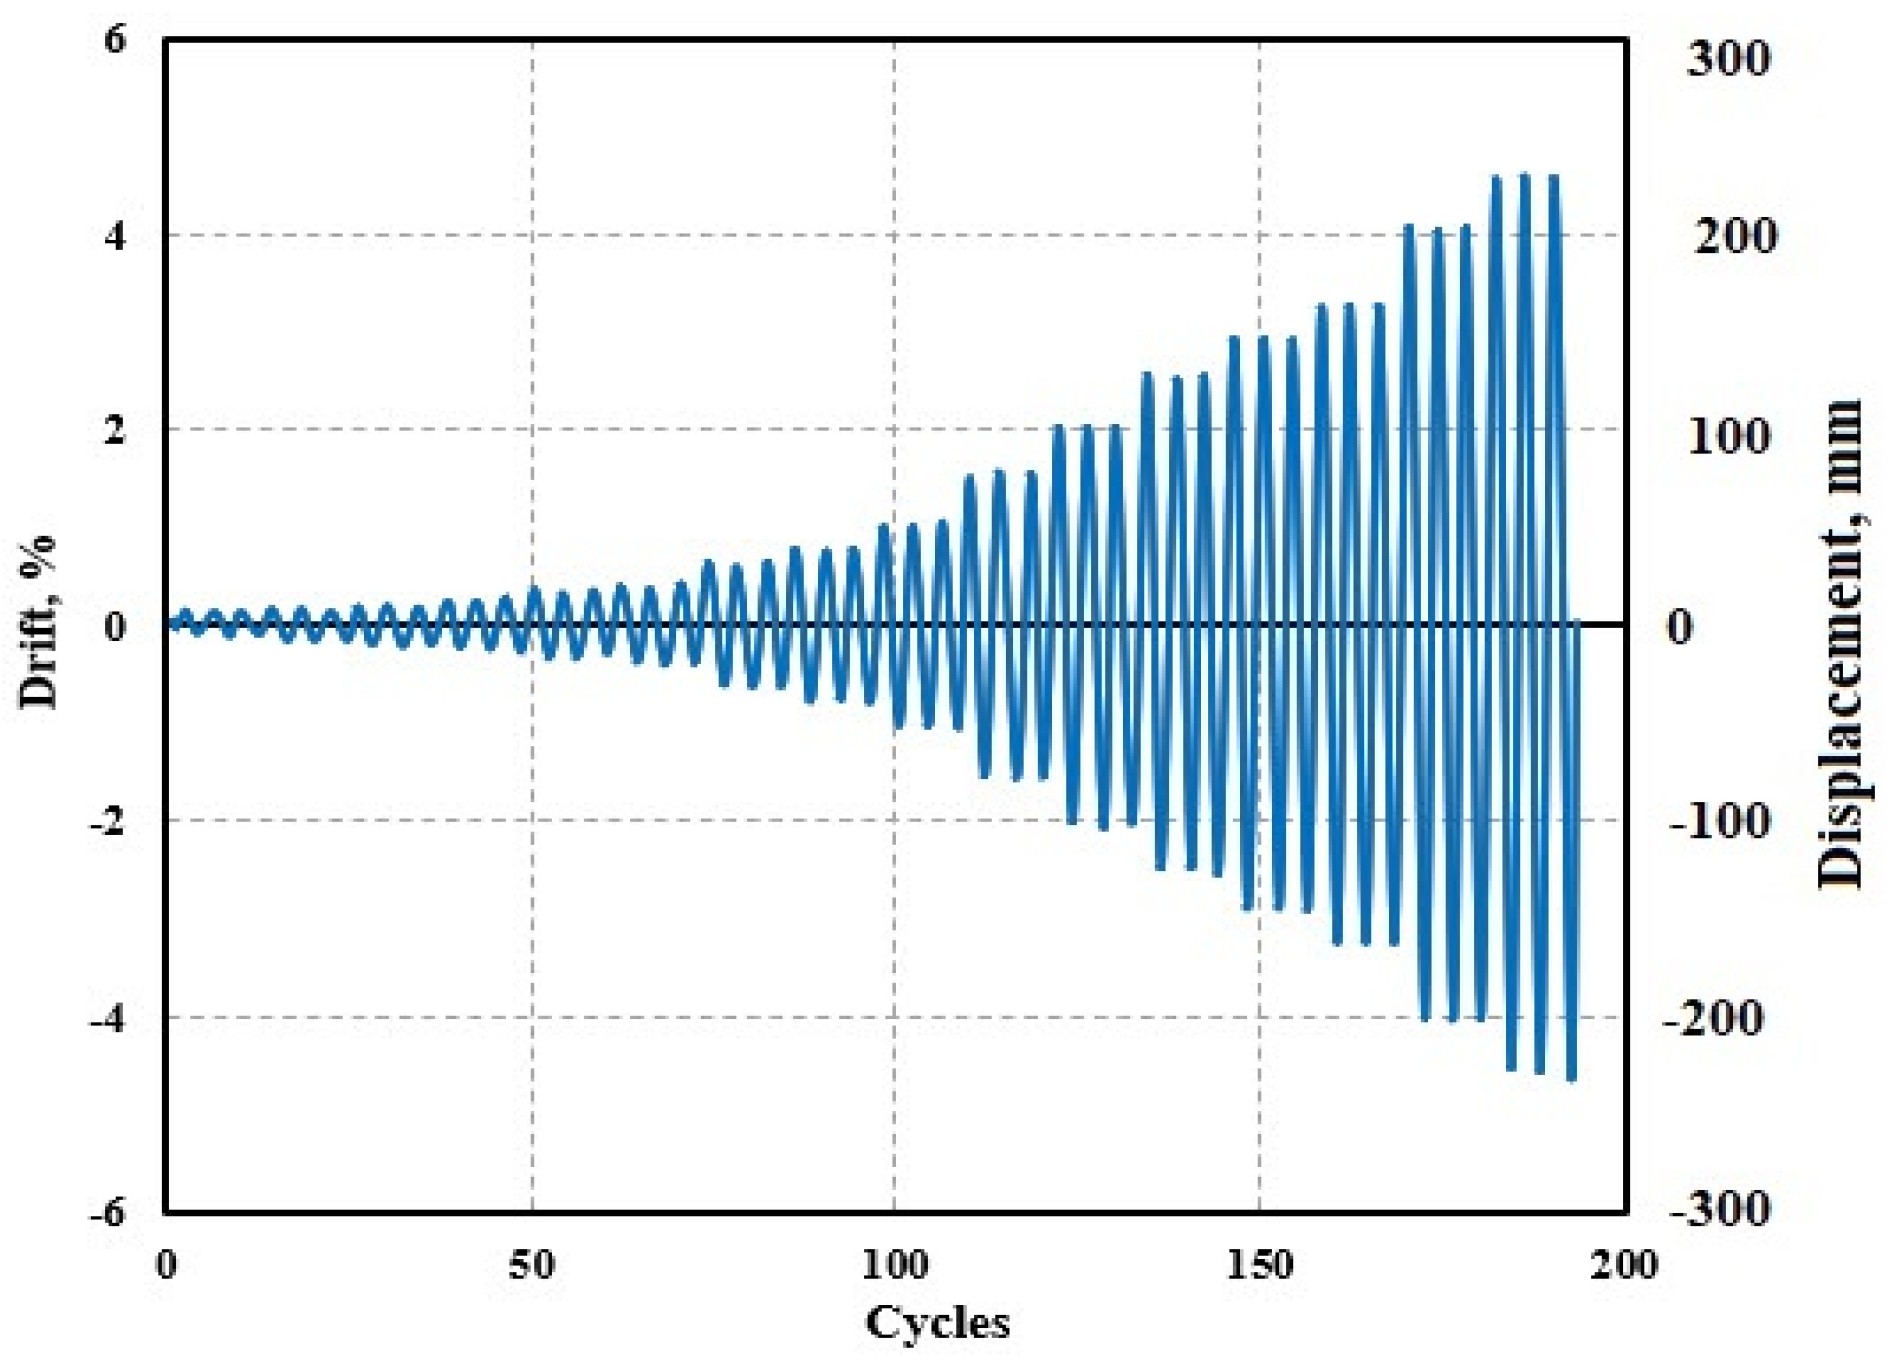
2.3. Loading and Boundary Conditions

The FE model was used to control movement at specific nodes. A set of nodes and mesh elements at the upper and lower ends of the column were grouped together to form a single element, representing a hinged–hinged boundary condition. In the first loading stage, a constant axial load was applied at the top of the column via a reference point. In all cases, the axial load was set at approximately 10% of the column’s axial compressive capacity. In the second loading stage, after applying the initial axial load, horizontal displacement was introduced using a reference point attached to the column head. Following the loading protocol specified in ACI 374 [21] and illustrated in Figure 8, all columns were subjected to lateral displacement. The displacement levels were defined as follows: The initial displacement was applied within the elastic range of the specimens. Subsequent displacement increments were 0.125% up to 1.0% drift, 0.25% from 1.0% to 2.5% drift, and 0.50% from 2.5% to 4.0% drift.
Figure 9 illustrates the applied axial load and lateral displacement for the analyzed columns as well as the applied boundary conditions. In the numerical analysis, the standard/static general method was employed for both loading steps, utilizing appropriate increments and a sufficient number of iterations to ensure accuracy. Additionally, an automatic displacement control methodology was implemented to optimize the simulation process.

3. Results and Discussion

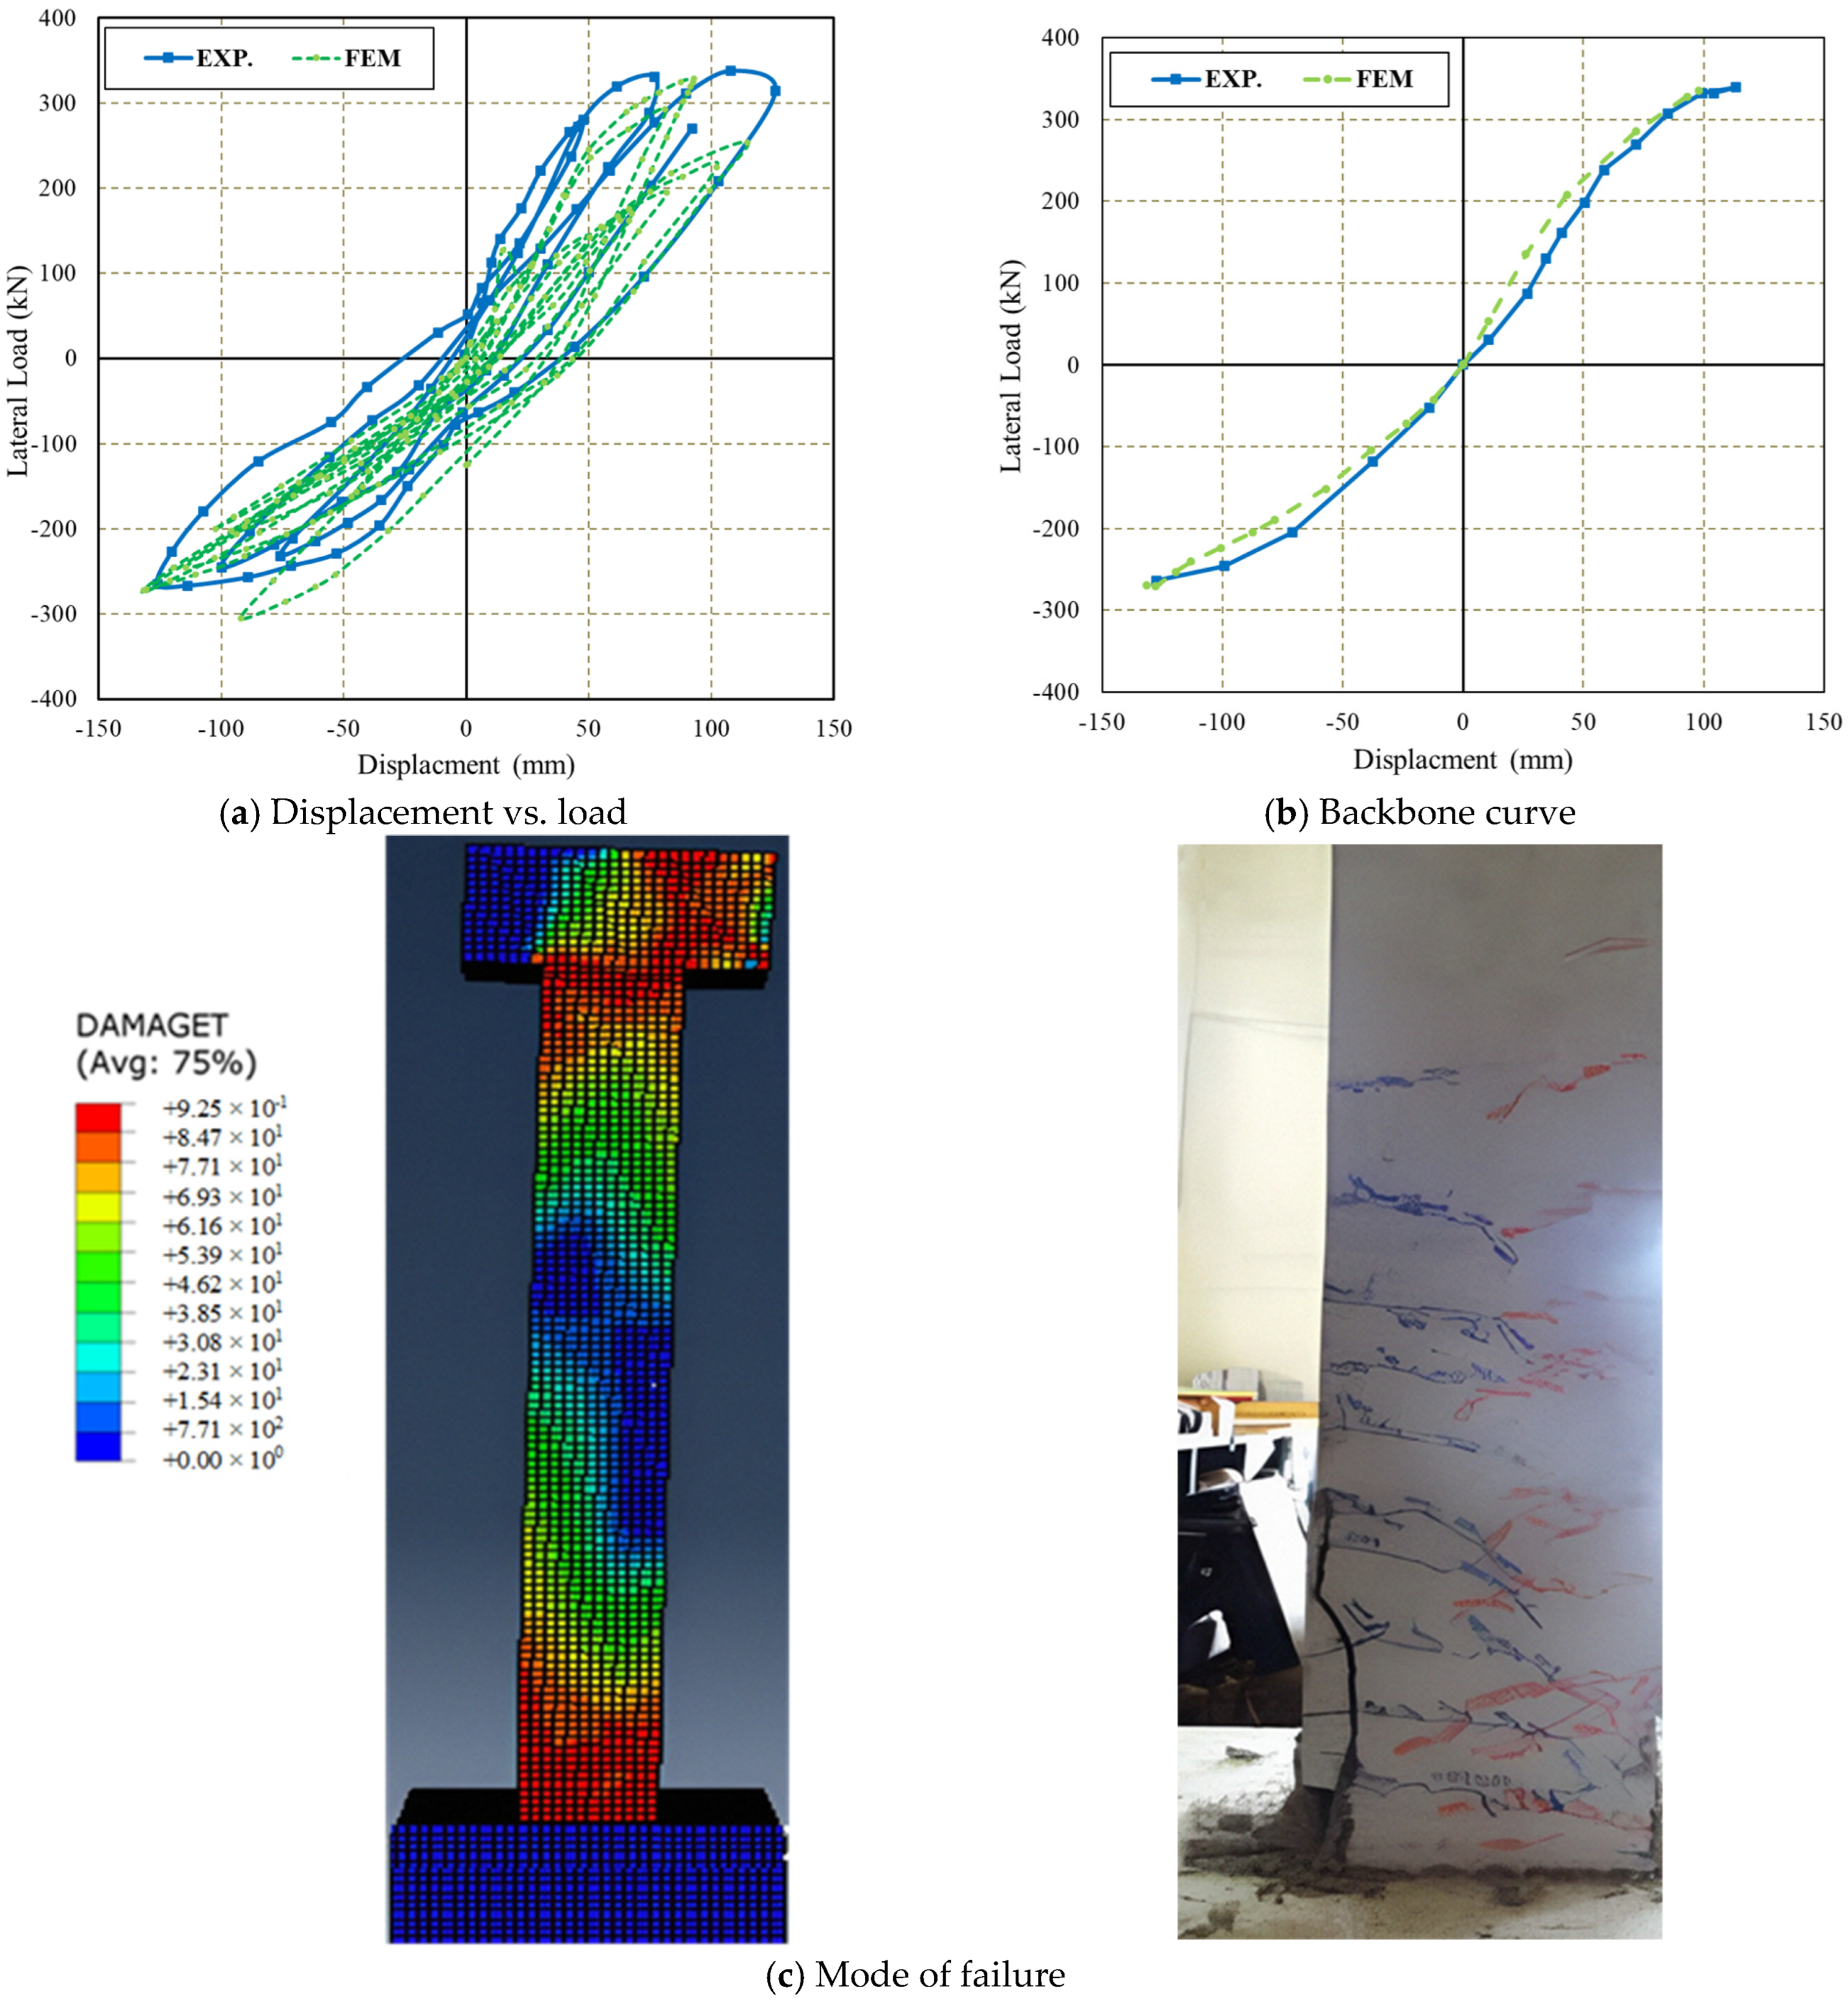
3.1. FE Verification

The validity and accuracy of the proposed finite element model were thoroughly evaluated by comparing the FE results with experimental findings in [18]. The FE load–displacement curves and crack patterns were carefully verified. Further verifications were performed in this paper using previous experimental data [11,22], demonstrating the capability of the proposed FE models to accurately simulate the behavior of rubberized reinforced concrete columns under cyclic loading.
The geometry, properties of materials, and boundary conditions of the RC columns investigated by Hyeon Shin [22] were represented by a three-dimensional nonlinear model. The RC column was 5050 mm in height and had a 600 mm × 600 mm cross-section, with a 70 mm thick concrete cover. The primary reinforcement consisted of twenty 19 mm diameter longitudinal rebars. The horizontal stirrups had a 13 mm diameter and a 300 mm spacing. The column’s boundary conditions, along with the dimensions of the foundation and column head, are illustrated in Figure 10. Following the loading methodology outlined in ACI 374 [21], the RC column was subjected to lateral displacement control testing under a constant axial compressive load of 855 kN, equivalent to approximately 10% of its axial compressive capacity, as shown in Figure 8.
Figure 11 presents a comparison of the experimental and FEM results for the lateral load–displacement behavior of the analyzed column. The maximum lateral load in the experimental test was 323 kN, resulting in a 104.36 mm lateral displacement in the initial loading direction and 263.9 kN with a displacement of 127 mm in the negative loading direction. The FEM predicted a maximum lateral load of 335 kN and a displacement of 97.9 mm in the initial direction, yielding errors of 3.7% and 6.2%, respectively. For the reverse loading direction, the FEM predicted values of 269.42 kN and 131.38 mm, with corresponding errors of 2.1% and 3.12%.
Additional verification was carried out using the experimental results of RRC columns that were tested by Elghazouli [11]. The column’s diameter was 250 mm, and its overall length and span length were 1350 and 1000 mm, respectively, as shown in Figure 12. The column was longitudinally reinforced with eight 12 mm diameter steel rebars and 10 mm circular stirrups spaced 100 mm apart. The column had 60% rubberized concrete replacement. Lateral cyclic displacements were applied in three cycles: 1.0 δy, 2.0 δy, and (2 + 2n) × δy. In each cycle, δy represents the predicted lateral yield deformation, and n can be any number between 1 and 4. In cases where the primary reinforcement was lifted at a lateral displacement δy of around 10 mm, the 20 kN axial load applied to the column was approximately 15% of the nominal axial capacity.
Figure 13 displays comparisons between the experimental and FE results in terms of the lateral loads and the corresponding displacements of the RRC column. The maximum lateral load and displacement in the experimental test were 50 kN and 34.6 mm, respectively, in the negative loading direction, and 54 kN and 35 mm, respectively, in the original loading direction. With errors of 6.9% and 7.65%, the FEM model’s lateral load and displacement in the original loading direction were 58 kN and 37.9 mm, respectively. With errors of 8.4% and 1.7%, the lateral load and displacement in the opposite loading direction were 54.6 kN and 35.2 mm, respectively.

3.2. Behavior of RRC Columns Under Cyclic Loading

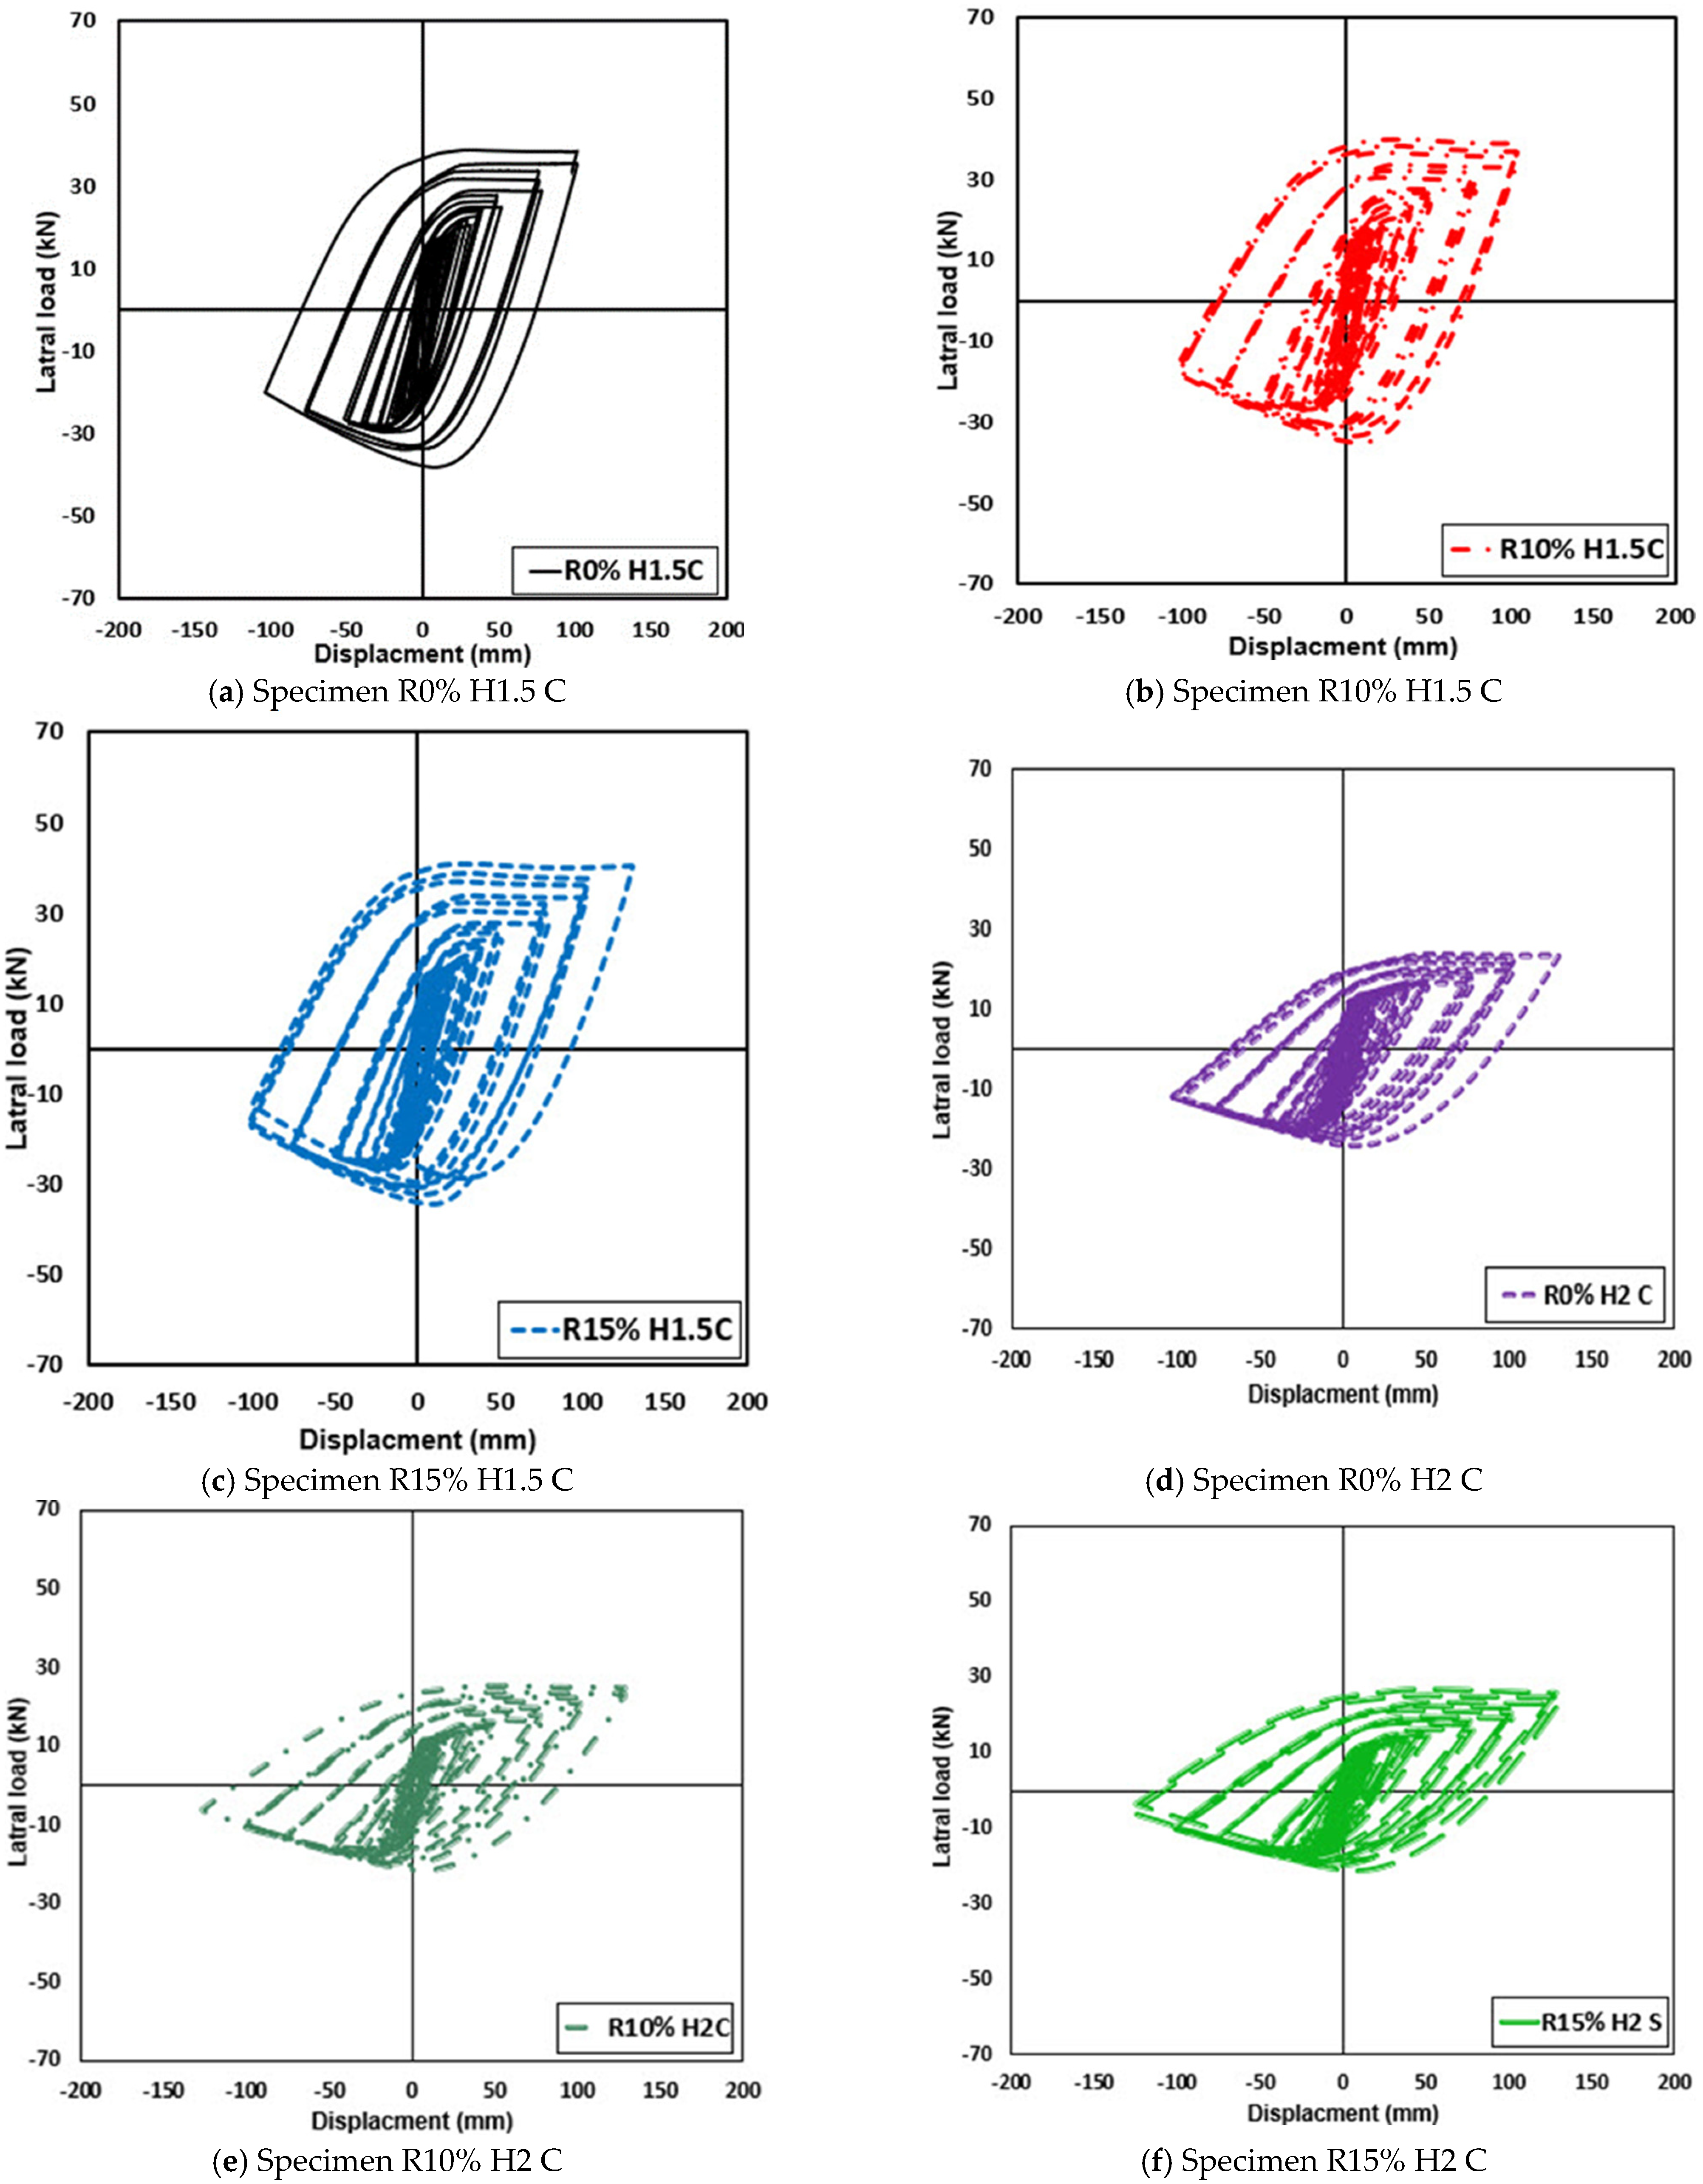
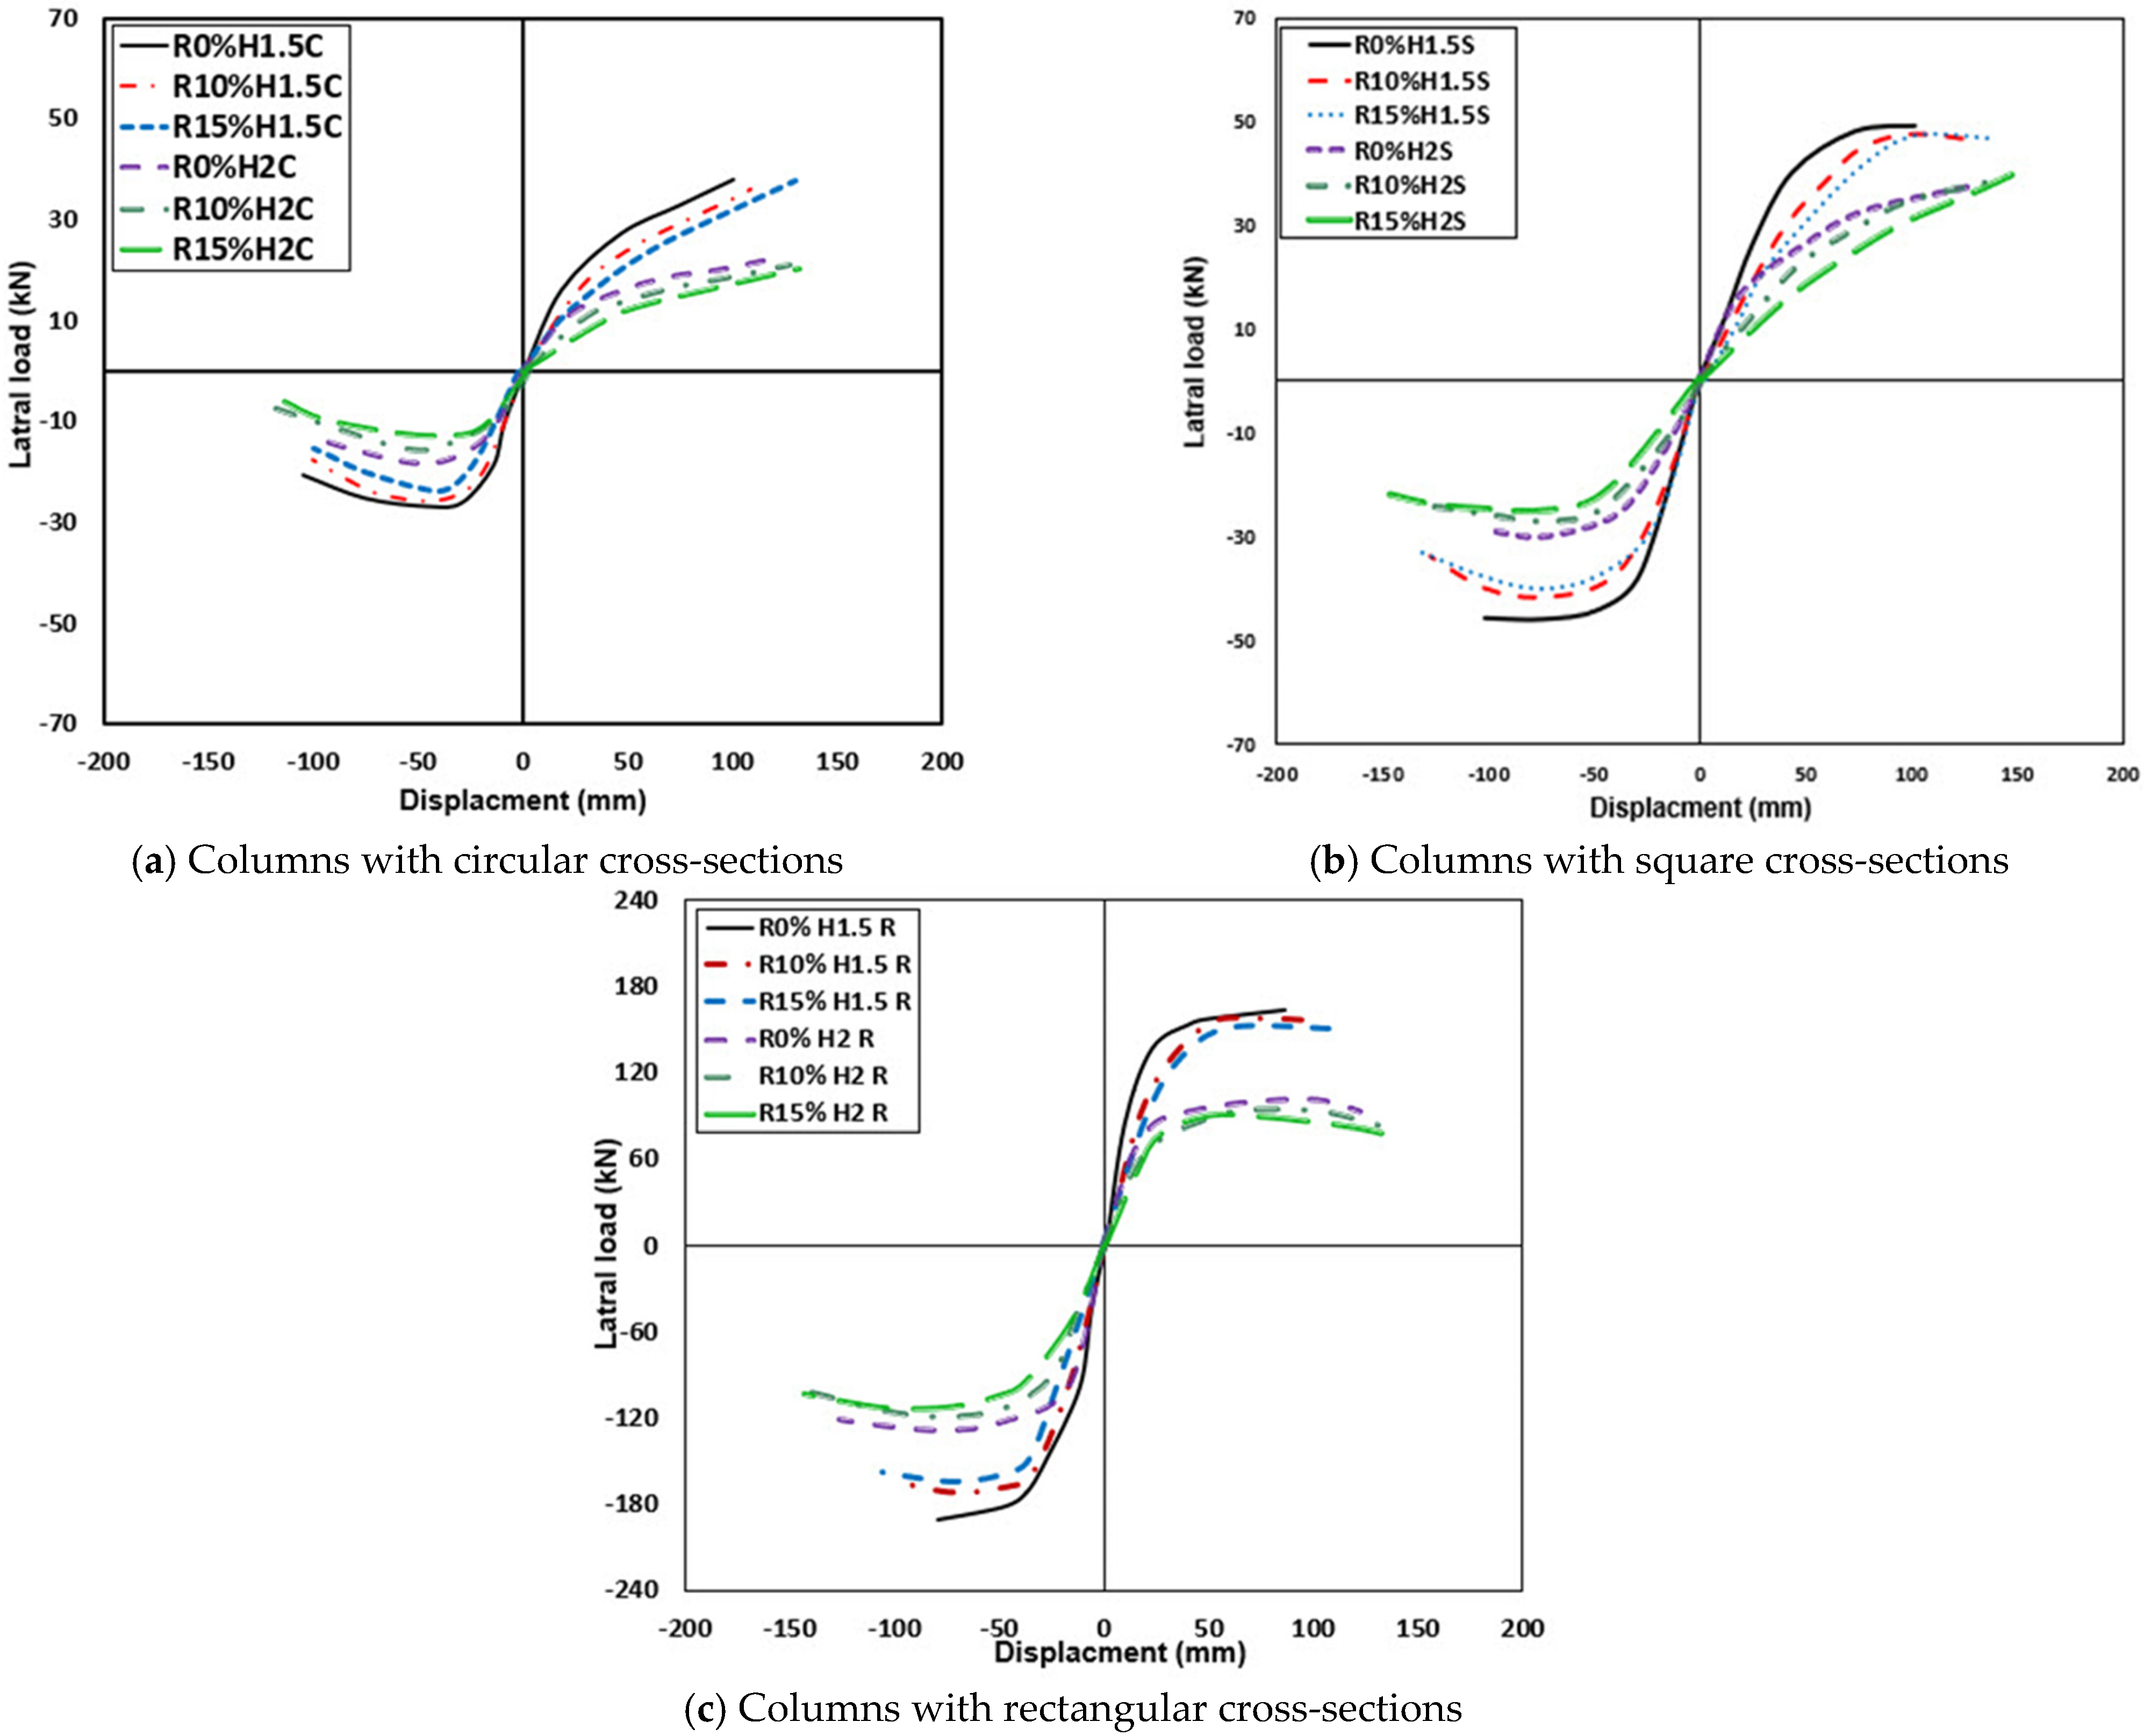
3.2.1. Backbone Curves and Hysterical Behavior

Figure 14, Figure 15 and Figure 16 illustrate the relationship between load and displacement during the early loading stages. Initially, the load increases linearly with displacement, and the areas enclosed by the hysteretic loops remain relatively small and underdeveloped before the specimen yields. As cyclic loading progresses and the applied load increases, plastic deformation begins, stiffness gradually declines, and the slope of the hysteretic loops decreases. Under cyclic loading, the first hysteretic loop encloses a larger area than the subsequent cycles. This occurs because repeated cyclic loading leads to plastic degradation in the RC structure, resulting in a decline in mechanical performance—consistent with findings from previous studies [23,24]. Figure 14 presents the lateral displacement response of circular column specimens in Group 1 under lateral force. All specimens exhibited similar initial behavior. Circular columns with a height of 1.5 m displayed linear behavior up to a displacement of approximately 33 mm, while those with a height of 2.0 m exhibited linear behavior until about 54 mm of displacement. Beyond these points, nonlinear hysteretic loops developed and persisted until the test concluded. Similarly, as shown in Figure 15, the square column specimens in Group 2 exhibited an approximately linear response up to the first yield. Notably, reinforced concrete columns containing CR exhibited greater lateral displacement than RC columns without CR, although RRC columns sustained lower lateral loads.
The key findings from the cyclic analysis of all columns are summarized in Table 4. The results indicate that for circular RRC columns with a height of 1.5 m, replacing 10% and 15% of the fine aggregate with CR reduced the ultimate lateral load by 4.8% and 6.94%, respectively, compared to conventional reinforced concrete (RC) columns without CR. For 2.0 m high RRC columns, replacing 10% and 15% of the fine aggregate with CR resulted in a 6.19% and 10.17% reduction in ultimate lateral load, respectively, compared to RC columns without CR. In terms of lateral displacement, circular RRC columns with 10% and 15% CR exhibited 17.61% and 28.78% greater maximum displacement, respectively, than conventional RC columns at a height of 1.5 m. For 2.0 m high columns, the maximum lateral displacement increased by 3.58% and 7.06% with 10% and 15% CR replacement, respectively.
For Group 2, the columns R10% H1.5 S and R15% H1.5 S exhibited a reduction in ultimate lateral load by 5.27% and 6.28%, respectively, compared to their reference column, R0% H1.5 S. The maximum lateral displacement for these 1.5 m high columns reached 128 mm and 136 mm, representing increases of 26.54% and 34.45%, respectively, relative to R0% H1.5 S. For columns with a height of 2 m, the RRC specimens with 10% and 15% CR showed a slight increase in lateral displacement of 7.85% and 11.43%, respectively, compared to RC columns without CR. However, the ultimate lateral load of these RRC columns decreased by 3.23% and 5.92%, respectively, compared to their conventional RC counterparts.
Figure 16 presents the lateral load versus lateral displacement behavior for rectangular columns (Group 3). The results indicate that for 1.5 m high RRC columns (R10% H1.5 R and R15% H1.5 R), the maximum lateral displacements were 17.21% and 23.7% greater, respectively, than those of the reference RC column (R0% H1.5 R). However, the ultimate lateral load for these RRC columns was reduced by 5.05% and 8.13%, respectively, compared to RC columns without CR. For 2 m high reinforced concrete columns, replacing 10% and 15% of the fine aggregate with CR increased the maximum lateral displacement by 13.92% and 16.2%, respectively. However, the ultimate lateral load of R10% H2R and R15% H2R columns decreased by 14.07% and 19.15%, respectively, compared to the control column (R0% H2 R).
The backbone curve for each specimen was obtained by averaging the cyclic response at each drift level. The envelope of these average cycles during cyclic loading was then used to define the backbone curve. Figure 17 illustrates the backbone curves (hysteretic loop envelopes) of the studied columns. All specimens exhibited consistent post-yield stiffness after steel reinforcement yielded, maintaining this behavior until reaching maximum strength. This indicates that the nonlinear response of RC closely resembles that of conventional concrete. Additionally, as shown in Figure 17c, increasing the applied axial load led to an increase in lateral load capacity. These results suggest that RC can be effectively used in concrete column structures without compromising overall structural behavior.
The findings provide valuable insights into the effects of rubber content and axial loading on the behavior of RC columns. Observations indicate that RRC columns demonstrate greater lateral displacement and a soft crushing failure mode, resulting in improved ductility and energy dissipation compared to traditional RC columns. Furthermore, RRC columns exhibit sensitive crushing behavior while enhancing energy dissipation and ductility, aligning with findings from previous studies [25,26].

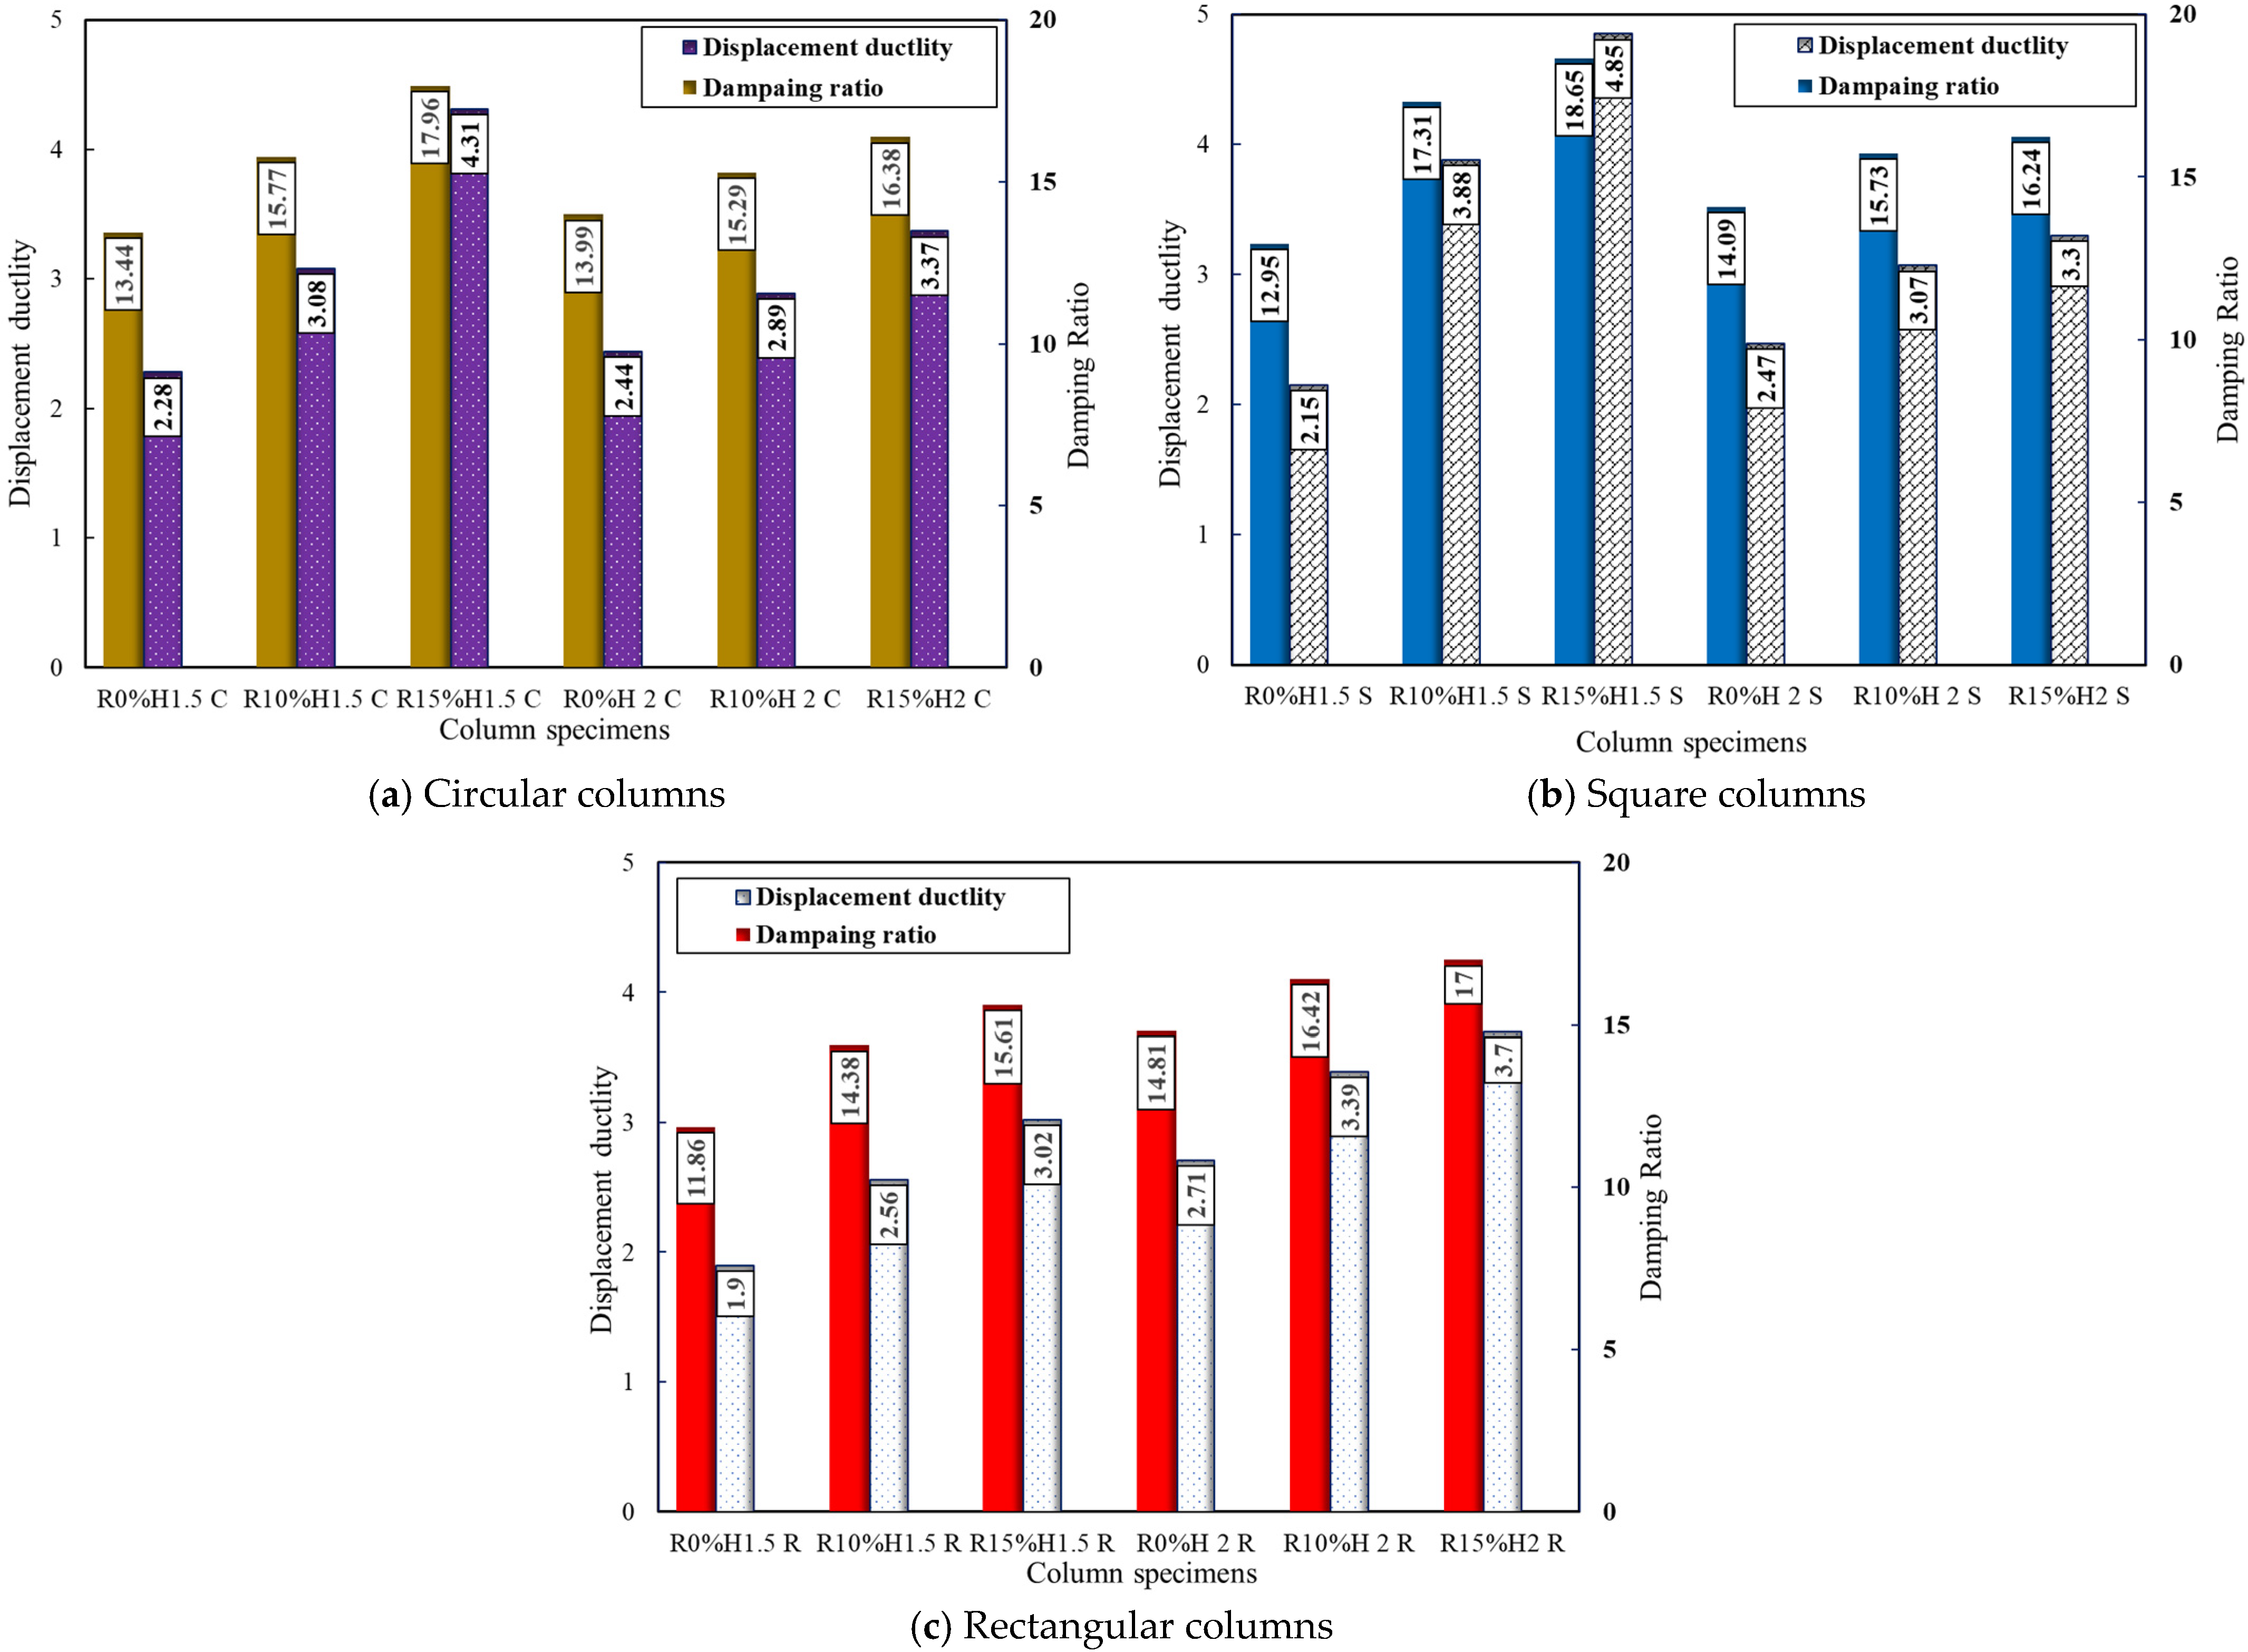
3.2.2. Displacement Ductility

The displacement ductility values (μ) were computed using Equation (1) [27] to compare the columns’ ductility.
μ = u y
where the ∆u and ∆y values were determined by bilinearly estimating the force-displacement envelopes using the force–displacement hysteretic responses displayed in Figure 13, Figure 14, Figure 15 and Figure 16. The displacement ductility values were calculated and are presented in Table 4. Figure 18 displays the comparison between all columns in terms of displacement ductility and damping ratio.
For Group 1 circular columns with a height of 1.5, the displacement ductility increased from 2.28 to 3.088 and 4.31 to 35.44% and 89.04%, respectively, when replacing fine aggregates with 10% and 15% CR. The displacement ductility for circular columns with 2 m and 10% and 15% CR improved by 18.44% and 34.02%, respectively, in contrast to the column devoid of CR. The examination of the results of RRC square columns (Group 2) with a height of 1.5m and 10% and 15% CR showed that the displacement ductility was larger than that of RC columns without CR by 80.47% and 125.58%, respectively. In contrast to the control column, R0% H2 S, the displacement ductility load for columns R10% H2 S and R15% H2 S rose by 24.29% and 33.6%, respectively.
For Group 3, the rectangular RRC columns with 10% and 15% CR presented increased displacement ductility compared to the RC columns without CR by 34.74% and 58.95%, respectively, for the case of 1.5 m column height. When comparing the displacement ductility of an RRC column with 10% and 15% CR to an RC column without CR, the increments in the displacement ductility were 25.09% and 36.53%, respectively, for a column height of 2 m. An increase in the ratio of CR from 0% to 10%, when raised to 15%, led to an increase in displacement ductility, as shown in Figure 18a. Comparing the rubberized reinforced columns to normal RC, test findings showed a relatively moderate post-peak response, indicating a more ductile reaction.

3.2.3. Equivalent Viscous Damping Ratio

The way that buildings respond to seismic loads is largely dependent on structural damping. For numerical analysis, the most basic type of damping, equivalent viscous damping (ξeq), is usually utilized to characterize the damping behavior [28]. The ξeq can be computed as
ξ e q = ξ s + ξ h y s
where ξs is the initial elastic viscous damping and ξhys is the hysteretic damping. In this work, “elastic” refers to the initial elastic viscous damping, whereas “hysteretic” refers to the damping caused by nonlinear hysteretic behavior. ξs takes into account a variety of damping mechanisms, such as radiation damping, nonlinearity in the foundation, and damping between structural and non-structural elements. It also adjusts for tiny mistakes caused by simplicity in calculating ξhys [27].
Many researchers have developed equations to determine equivalent viscous damping in relation to displacement ductility. For example, Gulkan and Sozen [29] determined the equivalent viscous damping as follows:
ξ e q = 0.02 + 0.2 ( 1 1 μ )
The previous equation was altered by Midorikawa et al. [30] by increasing the factor 0.2 in front of the bracket to 0.25 and the initial damping in the elastic zone.
ξ e q = 0.05 + 0.25 ( 1 1 μ )
Equation (4) was used to obtain the test data shown in Figure 19b and Table 4. Although the equation is fundamentally conservative, the figure illustrates how well it predicts the trend of the data. Increasing the proportion of CR replacement from 0% to 10% showed a 17.33% improvement in the equivalent viscous damping ratio; at 15% CR replacement, the damping ratio increased to 33.63% for circular columns with a height of 1.5 m. For 2 m high RRC circular columns, the damping ratio increased by 9.29% and 17.08% with the replacement of 10% and 15% of fine aggregate with crumb rubber (CR), respectively. Similarly, for the 1.5 m high RRC square columns, the damping ratio improved significantly from 33.67% to 44.01% with 10% and 15% CR replacement, respectively. For the same columns and with a 2m height, the damping ratio increased by 11.64% and 16.39%, respectively. For Group 3, replacing the crumb rubber for fine aggregates, the columns R10% H1.5 R and R15% H1.5 R indicated an increase in the damping ratio of 21.25% and 31.62%, respectively, compared to their reference columns R0% H1.5 R. The damping ratio was enhanced by 10.87% and 14.79%, respectively, in the columns with a 2 m height (R10% H2 R and R15% H2 R) when in contrast to the control column (R0% H2 S).
From these results, it may be said that the rubberized reinforced concrete columns have an enhanced ductility and damping ratio than normal RC columns when exposed to cyclic loading. Additionally, the lateral displacement was improved in RRC columns. Incorporating rubberized concrete can effectively delay the onset of earthquake-induced damage, thereby mitigating its severity [31]. Rubberized concrete is more elastic than regular concrete, which accounts for both benefits. For structural parts that are vulnerable to the effect of cyclic loads, rubberized concrete is an environmentally friendly substitute for regular concrete. Figure 16 demonstrates that incorporating CR enhances both the viscous damping ratio and displacement ductility of RC columns under cyclic loading, aligning closely with the findings reported in [11].

4. Conclusions

This paper developed FE models to assess the performance of RRC columns when exposed to cyclic loads. Considering the study’s findings, the investigation’s conclusions and findings are established in the following points:
  • The proposed finite element model can precisely predict the behavior of RRC columns under cyclic loads in terms of lateral load–lateral displacement curves.
  • Rubberized reinforced concrete columns with 10% and 15% fine aggregate replacement exhibited significantly improved lateral displacement compared to columns without CR.
  • RRC columns with 10% and 15% fine aggregate replacement showed small reductions in lateral loads compared to the non-CR columns.
  • In circular columns with a height of 1.5 m, replacing 10% and 15% of the fine aggregates with CR resulted in an increase in displacement ductility of 47.8% and 89.04%, respectively.
  • Square rubberized reinforced concrete columns with a height of 1.5 m showed a higher incremental lateral displacement, displacement ductility, and damping ratio than circular and rectangular columns of the same height.
  • Rubberized reinforced concrete columns performed better in terms of lateral displacement, displacement ductility, and damping ratio when 15% CR was utilized to replace fine aggregates in RC columns. However, there was a minor drop in lateral load capacity.
  • Using crumb rubber in reinforced concrete columns can delay earthquake damage and reduce its severity.
According to these findings, crump rubber can be used in RC columns without having a major impact on the ultimate strength or deformability of the columns. Crumb rubber concrete, on the other hand, can reduce and postpone the damage caused by cyclic loadings.

Author Contributions

Conceptualization, H.A.M., H.H. and A.E.-Z.; Data curation, M.E.; Formal analysis, M.A.M.A. and M.E.; Investigation, H.H.; Methodology, M.A.M.A. and H.A.M.; Resources, A.E.-Z.; Software, M.A.M.A. and M.E.; Supervision, H.A.M. and H.H.; Validation, M.A.M.A. and M.E.; Visualization, A.E.-Z.; Writing—original draft, M.A.M.A., H.A.M., H.H. and M.E.; Writing—review and editing, A.E.-Z. All authors have read and agreed to the published version of the manuscript.

Funding

This research received no external funding.

Data Availability Statement

The data presented in this study are available on request from the corresponding author.

Conflicts of Interest

The authors declare no conflicts of interest.

References

  1. Gagg, C.R. Cement and concrete as an engineering material: An historic appraisal and case study analysis. Eng. Fail. Anal. 2014, 40, 114–140. [Google Scholar] [CrossRef]
  2. Formela, K. Sustainable development of waste tires recycling technologies–recent advances, challenges and future trends. Adv. Ind. Eng. Polym. Res. 2021, 4, 209–222. [Google Scholar] [CrossRef]
  3. Ahmad, I.; Iqbal, M.; Abbas, A.; Badrashi, Y.I.; Jamal, A.; Ullah, S.; Yosri, A.M.; Hamad, M. Enhancement of Confinement in Scaled RC Columns using Steel Fibers Extracted from Scrap Tyres. Materials 2022, 15, 3219. [Google Scholar] [CrossRef]
  4. Pitilakis, K.; Karapetrou, S.; Tsagdi, K. Numerical investigation of the seismic response of RC buildings on soil replaced with rubber–sand mixtures. Soil Dyn. Earthq. Eng. 2015, 79, 237–252. [Google Scholar] [CrossRef]
  5. Oikonomou, N.; Mavridou, S. The use of waste tyre rubber in civil engineering works. In Sustainability of Construction Materials; Elsevier: Amsterdam, The Netherlands, 2009; pp. 213–238. [Google Scholar]
  6. Chen, M.; Si, H.; Fan, X.; Xuan, Y.; Zhang, M. Dynamic compressive behavior of recycled tire steel fiber reinforced concrete. Constr. Build. Mater. 2022, 316, 125896. [Google Scholar] [CrossRef]
  7. Liu, X.; Li, Y. Experimental study of seismic behavior of partially corrosion-damaged reinforced concrete columns strengthened with FRP composites with large deformability. Constr. Build Mater. 2018, 191, 1071–1081. [Google Scholar] [CrossRef]
  8. Atahan, A.O.; Sevim, U.K. Testing and comparison of concrete barriers containing shredded waste tire chips. Mater. Lett. 2008, 62, 3754–3757. [Google Scholar] [CrossRef]
  9. Razvi, S.W.N.; Shaikh, M. Effect of confinement on behavior of short concrete column. Procedia Manuf. 2018, 20, 563–570. [Google Scholar] [CrossRef]
  10. Hassanli, R.; Youssf, O.; Mills, J.E. Seismic Performance of Precast Posttensioned Segmental FRP Confined and Unconfined Crumb Rubber Concrete Columns. J. Compos. Constr. 2017, 21, 04017006. [Google Scholar] [CrossRef]
  11. Elghazouli, A.Y.; Bompa, D.V.; Xu, B.; Ruiz-Teran, A.M.; Staffor, P.J. Performance of rubberised reinforced concrete members under cyclic loading. Eng. Struct. 2018, 166, 526–545. [Google Scholar] [CrossRef]
  12. Moustafa, A.; Gheni, A.; ElGawady, M.A. Shaking-Table Testing of High Energy–Dissipating Rubberized Concrete Columns. J. Bridg. Eng. 2017, 22, 04017042. [Google Scholar] [CrossRef]
  13. Najim, K.B.; Hall, M.R. Mechanical and dynamic properties of self-compacting crumb rubber modified concrete. Constr. Build Mater. 2012, 27, 521–530. [Google Scholar] [CrossRef]
  14. Youssf, O.; Hassanli, R.; Mills, J.E. Mechanical performance of FRP-confined and unconfined crumb rubber concrete containing high rubber content. J. Build. Eng. 2017, 11, 115–126. [Google Scholar] [CrossRef]
  15. Son, K.S.; Hajirasouliha, I.; Pilakoutas, K. Strength and deformability of waste tyre rubber-filled reinforced concrete columns. Constr. Build. Mater. 2011, 25, 218–226. [Google Scholar] [CrossRef]
  16. Xue, J.; Shinozuka, M. Rubberized concrete: A green structural material with enhanced energy dissipation capability. Constr. Build. Mater. 2013, 42, 196–204. [Google Scholar] [CrossRef]
  17. Egyptian Code Committee. Egyptian Code for Design and Construction of Concrete Structures; ECP 203-2020; Housing and Building National Research Center, HBRC: Cairo, Egypt, 2020.
  18. Ahmed, M.; Mohamed, H.-A.; Hassan, H.; Zaghlal, M. Rubberized reinforced concrete columns under axial and cyclic loading. Fract. Struct. Integr. 2024, 18, 286–309. [Google Scholar] [CrossRef]
  19. Xie, J.-H.; Guo, Y.-C.; Liu, L.-S.; Xie, Z.-H. Compressive and flexural behaviors of a new steel-fiber-reinforced recycled aggregate concrete with crumb rubber. Constr. Build Mater. 2015, 79, 263–272. [Google Scholar] [CrossRef]
  20. Nawar, M.T.; Eisa, A.S.; Elshazli, M.T.; Ibrahim, Y.E.; El-Zohairy, A. Numerical Analysis of Rubberized Steel Fiber Reinforced Concrete Beams Subjected to Static and Blast Loadings. Infrastructures 2024, 9, 52. [Google Scholar] [CrossRef]
  21. ACI. Guide for Testing Reinforced Concrete Structural Elements Under Slowly Applied Simulated Seismic Loads; ACI 374; American Concrete Institute: Farmington Hills, MI, USA, 2013. [Google Scholar]
  22. Shin, D.-H.; Kim, H.-J. Cyclic response of rectangular RC columns retrofitted by hybrid FRP sheets. Structures 2020, 28, 697–712. [Google Scholar] [CrossRef]
  23. Li, Q.; Niu, D.T.; Xiao, Q.H.; Guan, X.; Chen, S.-j. Experimental study on seismic behaviors of concrete columns confned by corroded stirrups and lateral strength prediction. Constr Build Mater. 2018, 162, 704–713. [Google Scholar] [CrossRef]
  24. Luo, X.; Cheng, J.; Xiang, P.; Long, H. Seismic behavior of corroded reinforced concrete column joints under low-cyclic repeated loading. Arch. Civ. Mech. Eng. 2020, 20, 40. [Google Scholar] [CrossRef]
  25. ElGawady, M.; Endeshaw, M.; McLean, D.; Sack, R. Retrofitting of Rectangular Columns with Deficient Lap Splices. J. Compos. Constr. 2010, 14, 22–35. [Google Scholar] [CrossRef]
  26. Mahat, M.; Acharya, M.; Acharya, M.; Mashal, M. Use of Waste Tires as Transverse Reinforcement and External Confinement in Concrete Columns Subjected to Axial Loads and cyclic loads. Sustainability 2023, 15, 11620. [Google Scholar] [CrossRef]
  27. Priestley, M.; Calvi, G.; Kowalsky, M. Displacement-Based Seismic Design of Structures; IUSS Press: Pavia, Italy, 2007. [Google Scholar]
  28. Chopra, A.K. Dynamics of Structures; Prentice Hall: Englewood Cliffs, NJ, USA, 1995. [Google Scholar]
  29. Gulkan, P.; Sozen, M.A. Inelastic responses of reinforced concrete structures to earthquake motions. J. Am. Concr. Inst. 1974, 7112, 604–610. [Google Scholar]
  30. Midorikawa, M.; Hiraishi, H.; Okawa, I.; Iiba, M.; Teshigawara, M.; Isoda, H. Development of seismic performance evaluation procedures in Building Code of Japan. In Proceedings of the 12th World Conference on Earthquake Engineering, Silverstream, New Zealand, 30 January–4 February 2000. [Google Scholar]
  31. Sipos, T.K.; Jelec, K.; Milicevic, I. Seismic performance of rubberized concrete in structural applications. In Proceedings of the 2nd Croatian Conference on Earthquake Engineering—2CroCEE 2023, Zagreb, Croatia, 22–24 March 2023. [Google Scholar]
Figure 1. Details of the circular columns of Group 1.
Jcs 09 00095 g001
Figure 2. Details of the square columns of Group 2.
Jcs 09 00095 g002
Figure 3. Details of the rectangular columns of Group 3.
Jcs 09 00095 g003
Figure 4. Crumb rubber particles [18].
Jcs 09 00095 g004
Figure 5. Effects of CR on the mechanical properties of concrete.
Jcs 09 00095 g005
Figure 6. Concrete damage plasticity model provided by ABAQUS [18].
Jcs 09 00095 g006
Figure 7. FE simulation utilizes constitutive models of materials [18].
Jcs 09 00095 g007
Figure 8. The loading protocol [22].
Jcs 09 00095 g008
Figure 9. Loading and boundary conditions of the FE models. These arrows represent the directions of the axial load and lateral displacement, which are provided on the figure.
Jcs 09 00095 g009
Figure 10. RC column details [22].
Jcs 09 00095 g010
Figure 11. Results of experimental and FEM RC column.
Jcs 09 00095 g011
Figure 12. RRC column details.
Jcs 09 00095 g012
Figure 13. Results of the experimental and FE results for the analyzed RRC column.
Jcs 09 00095 g013
Figure 14. Hysteretic behavior of circular columns (Group 1).
Jcs 09 00095 g014
Figure 15. Hysteretic behavior of square columns (Group 2).
Jcs 09 00095 g015
Figure 16. Hysteretic behavior of rectangular columns (Group 3).
Jcs 09 00095 g016
Figure 17. Backbone curve for columns.
Jcs 09 00095 g017
Figure 18. Equivalent viscous damping and displacement ductility of columns.
Jcs 09 00095 g018
Figure 19. Effect of crumb rubber on equivalent viscous damping and displacement ductility of columns.
Jcs 09 00095 g019
Table 1. Full details of the analyzed columns.
Group No.Column LabelBoundary Conditions
( λ ) = k . H o b   o r   D
Hinged–Hinged (Braced)
(K = 1)
Longitudinal
Reinforcement
Applied Axial Load (kN)
1R0% H1.5 C(λ) = 6As = 6ϕ12165
R10% H1.5 C(λ) = 6As = 6ϕ12165
R15% H1.5 C(λ) = 6As = 6ϕ12165
R0% H2 C(λ) = 8As = 6ϕ12155
R10% H2 C(λ) = 8As = 6ϕ12155
R15% H2 C(λ) = 8As = 6ϕ12155
2R0% H1.5 S(λ) = 6As = 6ϕ12190
R10% H1.5 S(λ) = 6As = 6ϕ12190
R15% H1.5 S(λ) = 6As = 6ϕ12190
R0% H2 S(λ) = 8As = 6ϕ12170
R10% H2 S(λ) = 8As = 6ϕ12170
R15% H2 S(λ) = 8As = 6ϕ12170
3R0% H1.5 R(λ) = 5As = 10ϕ16710
R10% H1.5 R(λ) = 5As = 10ϕ16710
R15% H1.5 R(λ) = 5As = 10ϕ16710
R0% H2 R(λ) = 6.67As = 10ϕ16650
R10% H2 R(λ) = 6.67As = 10ϕ16650
R15% H2 R(λ) = 6.67As = 10ϕ16650
Table 2. Concrete’s mechanical characteristics.
Concrete MixCompressive Strength Fcu (MPa)Tensile Strength
Ftu (MPa)
Young’s Modulus E (MPa)Poisson’s Ratio
M1 (R0%)302.6426,8840.2
M2 (R10%)24.52.1524,7230.2
M3 (R15%)22.051.9424,0410.2
Table 3. Steel bars’ mechanical characteristics.
Steel TypeUltimate Strength (MPa)Yield Strength (MPa)Elastic Models
E (MPa)
Poisson’s Ratio
Main reinforcement
(Φ 12 and 16 mm)
640420200,0000.3
Stirrups (Φ 8 mm)420280200,0000.3
Table 4. Results of analyzed columns.
Group No.Column LabelLateral Load
(kN)
y (mm) u (mm) μ ξ e q
1R0% H1.5 C38.0444.01100.42.2813.44
R10% H1.5 C36.2135118.083.08815.77
R15% H1.5 C35.430129.34.3117.96
R0% H2 C22.650.41232.4413.99
R10% H2 C21.244127.42.8915.29
R15% H2 C20.339.02131.683.3716.38
2R0% H1.5 S49.347101.152.1512.95
R10% H1.5 S46.7331283.8817.31
R15% H1.5 S46.2281364.8518.65
R0% H2 S 38.2953131.292.4714.09
R10% H2 S 37.0546141.63.0715.73
R15% H2 S 36.0244.4146.33.316.24
3R0% H1.5 R164.3846.187.51.911.86
R10% H1.5 R156.0740102.562.5614.38
R15% H1.5 R151.0135.8108.243.0215.61
R0% H2 R92.445.2122.372.7114.81
R10% H2 R79.441.05139.43.3916.42
R15% H2 R74.738.3142.23.717.00
Disclaimer/Publisher’s Note: The statements, opinions and data contained in all publications are solely those of the individual author(s) and contributor(s) and not of MDPI and/or the editor(s). MDPI and/or the editor(s) disclaim responsibility for any injury to people or property resulting from any ideas, methods, instructions or products referred to in the content.

