Article

The Fossil, the Green, and the In-Between: Life Cycle Assessment of Manufacturing Composites with Varying Bio-Based Content

1
Processing of Composites Group, Department of Polymer Engineering, Montanuniversitaet Leoben, 8700 Leoben, Austria
2
bto-epoxy GmbH, 3300 Amstetten, Austria
3
Material Science and Testing of Polymers, Department of Polymer Engineering, Montanuniversitaet Leoben, 8700 Leoben, Austria
*
Author to whom correspondence should be addressed.
J. Compos. Sci. 2025, 9(3), 93; https://doi.org/10.3390/jcs9030093
Submission received: 14 January 2025 / Revised: 6 February 2025 / Accepted: 18 February 2025 / Published: 20 February 2025
(This article belongs to the Special Issue Feature Papers in Journal of Composites Science in 2024)

Abstract

:
Bio-based composites offer potential environmental benefits over fossil-based materials, but limited research exists on manufacturing processes with varying material combinations. This study performs a cradle-to-grave Life Cycle Assessment of five composite types to evaluate the role of fully and partially bio-based composites, focusing on the manufacturing stage. The composite materials include glass or flax fiber-based reinforcements embedded in polymer matrices based on a fossil epoxy, a partially bio-based epoxy, or epoxidized linseed oil, fabricated using vacuum-assisted resin infusion. Flax fibers in a partially bio-based epoxy achieve the lowest environmental impacts in most categories when assessed at equal geometry. Glass fiber composites exhibit a higher fiber volume content and material properties and thus demonstrate competitive environmental performance at equal absolute and normalized tensile strength. Composites using epoxidized linseed oil are the least advantageous, with the manufacturing stage contributing a majority of the environmental impacts due to their comparatively long curing times. These results are based on methodological choices and technical constraints which are discussed together with benchmarking against previous studies. While partially bio-based materials can provide a middle ground for enhancing composite environmental performance, the further optimization of bio-based material functionality regarding material properties and processability is pivotal to exploit the full potential of bio-based composites.

1. Introduction

Bio-based materials derived from renewable resources are gaining importance in the composites industry due to concerns about fossil resource limitations and the adverse effects on the environment associated with their use. A bio-based product is an organic material derived from renewable biogenic resources, such as plants [1]. While there is scientific and technical progress and an increasing market availability of natural fiber (NF) reinforcements such as flax, hemp, and kenaf, their combination with fully bio-based polymer matrix materials is still rare and proves difficult. Next to bio-based materials’ availability, their processability and material properties represent challenges that need to be addressed in order to promote bio-based composite usage in various applications [2,3]. Additionally, the potential environmental benefits of using biogenic raw materials, especially the reduction in greenhouse gas emissions, can be cancelled out by the adverse effects of raw material production and processing. Many biogenic materials are derived from agricultural cultivation, which can emit harmful substances and lead to ecosystem degradation [4]. Therefore, the anticipated environmental benefits of bio-based composites require verification through a suitable methodology, such as Life Cycle Assessment (LCA) [5].
The main aim of previous LCA studies on bio-based composites has been to compare the environmental impacts of bio-based composite materials to their fossil counterparts. The emphasis lay mostly on the raw material acquisition and processing phases, such as textile production from biomass and chemical synthesis from oils derived from plant and woody biomass [6,7,8,9]. Few studies have investigated additional life stages, such as the use phase [10] or the treatment of bio-based composites at their End-of-Life (EoL) [11].
Given the often comparative nature of LCA, most studies assess the potential advantage of NFs over glass fibers (GFs) embedded in a fossil thermoplastic or thermoset matrix [12,13,14,15]. Comparing natural fibers to carbon fibers is rare [16] as these exhibit significant differences in material properties, which makes substitution unlikely. Few studies investigate bio-based polymer matrix options to achieve a fully bio-based composite [9,17,18].
Nevertheless, the following gaps were identified when reviewing LCA studies of bio-based composites: In several studies, the life cycle inventory, which lists the exchanges with the technical and natural environment, is incomplete, e.g., because hardener usage is omitted [16]. When comparing materials with different properties, multiple studies use varying component thickness calculated via Ashby equivalence [19] to reach the same level of quality. Different properties are considered, e.g., equal tensile strength and stiffness [20]. There are many factors influencing composite properties, such as textile architecture, process selection, and process parameters [21,22]. These specifications are often overlooked in the LCA evaluation of composites, although they influence environmental impact assessment results. In addition, there is a lack of studies investigating the environmental impacts of the composite manufacturing process, as accurate and reliable data are missing [23].
While the advantages and drawbacks of bio-based composites have been discussed, this work aims to discuss the role of partially bio-based composites as a middle ground in the interplay of materials from fossil and renewable sources. Contrary to most existing studies, the focus of this study lies on composite manufacturing, composite property analysis, and suitability for Ashby analysis within a LCA, rather than the synthesis of (innovative) resin systems or the production of textile reinforcements. Two different GF textiles with different architecture embedded in a fossil epoxy matrix serve as the benchmark for comparing two partially and one fully bio-based composite. All data on composite manufacturing were collected during laboratory experiments with the aim to depict this stage in a detailed and complete way. The contribution analysis of different inputs to the process and processing wastes aims to identify optimization potentials to reduce the environmental impacts of composite manufacturing.

2. Materials and Methods

This methodology includes a description of the material selection and experimental procedure used to manufacture the different composites, as well as the definition of the methodological parameters of the LCA used to analyze the environmental impacts of the manufactured composites.

2.1. Material Selection

In order to investigate the influence of fiber type and textile architecture on composite properties and on environmental impacts, two GF and NF textiles are selected. Information on the textile reinforcements and their properties can be found in Table 1. Epoxy resins have been chosen as matrix systems due to their ubiquity in more advanced technological applications [24]. Epoxies are often crosslinked with amine hardeners, such as Triethylenetetramine (TETA). The premise for the selection of the resin systems was the availability of a two-component epoxy system suitable for processing in Liquid Composite Molding (LCM) processes with a pot life above 10 min and a viscosity between 100 and 1000 mPas. Next to the technical specifications, having a high bio-based content derived from regional resources and market availability were decisive factors. While bio-based epoxies can be based on different plant oils, linseed is one of the most important feedstocks due its competitive economic performance and comparatively high concentration of double bonds, resulting in favorable mechanical properties [25]. Concerning bio-based curing agents, Itaconic Anhydride (IA) has been nominated as one of the top bio-based platform chemicals by the US Department of Energy, which underlines its importance in the industrial transformation towards the bio-economy [26]. More information on the chemical structure and synthesis of linseed-based epoxies and IA can be found in the literature [25,26,27].
The names of the five composites investigated in this research are composed of abbreviations stating the type of textile reinforcement, the resin, the hardener, and the catalyst used. The two GF composites (namely GF1/EP+TETA and GF2/EP+TETA) use a fossil epoxy resin (EP) and amine-based hardener (IR 77.32 and IH 77.11 of bto-epoxy GmbH, Amstetten, Austria), while the NF textile reinforces the partially and fully bio-based composites with varying matrix systems. In NF/bEP+TETA, the partially bio-based epoxy (bEP) resin IR 78.31 of bto-epoxy GmbH, Austria has a biogenic C-content of 37.58%. It is chemically equivalent to the fossil one, with its biogenic content derived from bio-propylene generated using (waste) plant oil, which substitutes the fossil constituents in bisphenol A production. The fully bio-based system NF/ELSO+IA is based on epoxidized linseed oil (ELSO) that is cured with IA. Both the flax fibers for the NF textile and linseed oil are derived from the same plant, although the agricultural production of flax plants is usually optimized for either oil production from the seed or fiber production from the stem [28]. The industrially most common precursor of IA is citric acid, which can be derived through the fermentation of different types of carbohydrate solutions, such as corn steep liquor or beet molasses [29].
The NF/ELSO+IA+Zn adds Deca Zinc 11/12 (Borchers, Westlake, OH, USA) as a catalyst to the ELSO-IA matrix system in order to enhance the reactivity of the resin system. The catalyst consists of a zinc-based salt (Zn) derived from neodecanoic acid and naphthenic acid dissolved in fossil paraffinic mineral oil.

2.2. Composite Manufacturing

All composites were manufactured using vacuum-assisted resin infusion (VARI), which is an industrially relevant process, to impregnate the textile preform with the resin by employing a negative pressure difference generated by a E2M28 vacuum pump (Edwards Limited, Burgess Hill, UK). Figure 1 displays the VARI process, as well as the manufactured plates, which all have identical geometry (a flat plate of 270 mm width and 269 mm length). Table 2 depicts the material amounts per manufactured plate. The number of layers of textile reinforcement was selected to reach a similar theoretical fiber volume content (FVC) of approximately 40%, assuming the same composite thickness, which will be verified and critically discussed in Section 3.1. The FVC φ is calculated using Equation (1):
φ = m f ρ f A t e x     t ,
where mf is the mass of the fibrous reinforcement, ρf is the fiber mass density, Atex is the area of the preform, and t the (theoretical or measured) thickness of the composite [30].he total matrix mass for one plate in Table 2 was calculated by considering the mass in the plate as well as the losses during processing, e.g., in the tubes. Other visible differences between the manufactured composites are the need for drying the NF textile and the preheating of the ELSO-based matrix systems to ensure full melting of the IA hardener. Additionally, the reactivity of the resin system differs regarding temperature settings and curing times, which are significantly longer in the composites using ELSO (compare Table 3). It is important to note that the choice of process parameters, especially temperature and curing times, influences composite properties [31,32]. For the bio-based composites, previous research has shown that lower levels of temperature with longer curing cycles can potentially lead to higher mechanical properties but decrease process reproducibility [21]. Additionally, longer curing cycles impose challenges in industrial production and can lead to higher energy consumption [33]. Therefore, the curing conditions have been selected to minimize the processing time while ensuring a high degree of cure.

2.3. Life Cycle Assessment

The environmental impacts of the different composites are analyzed from cradle to gate, starting with the raw material acquisition to the incineration of the components at EoL. The processes and materials considered in the LCA over the entire composite life cycle are depicted in Figure 2. A passive field of application, such as in the construction sector, is considered with the assumption that no resources are consumed and no harmful substances are released to the environment during the use phase [34]. This choice represents a simplification in order to focus on the manufacturing stage and will be discussed in Section 5.
As the focus lies on the manufacturing of the fossil-, partially, and fully bio-based composites, the inputs and outputs to the composite manufacturing stage are differentiated per life stage and their contribution to the overall life cycle impacts is discussed. Only a part of the composite materials that enter the VARI processing constitute the final component, which is also the reference flow of the LCA. Composite materials that become processing waste are preform scraps after cutting and matrix that remains in the tubes. VARI processing requires several single-use materials for process conduction, such as vacuum foil, peel ply, inlet and outlet tubes, release agent, and cleaning chemicals and materials. Although the amount of consumables is constant for all composites, they are displayed to analyze their contribution to the overall environmental impacts. Together with the composite material waste, the consumable wastes are treated by means of incineration with energy recovery, which is a likely scenario for these type of non-hazardous and calorific wastes [14]. Electricity consumption comprises the sum of the electric energy necessary to operate the equipment, namely the heating plate and the vacuum station as well as the oven to dry the NF preforms. The usage of machinery is included in the LCA despite an often-low influence of infrastructure on overall results [35] because it varies among the composites manufactured according to the respective curing cycles.
While the manufacturing took place at laboratory facilities in Austria, the LCA’s geographical and temporal scope is current Europe for two reasons: This study aims to be representative for the European composites industry and wants to avoid under- or overestimating location specificities, for example in regards to environmental impacts associated with energy consumption [36]. Most chemical products and materials are derived from the European or global market, which limits the gain in accuracy of geographical precision.

2.3.1. Functional Units

A two-pronged approach has been chosen to discuss the different functions of the composite plate. In the first functional unit (FU1), environmental impacts are calculated per a composite plate of equal geometry as manufactured using the VARI process. Other parameters of functionality, such as the material’s properties, quality, or duration of service life, are omitted as they are deemed sufficient for the unspecified passive application. In the second functional unit (FU2), Ashby indices are used in order to compare the manufactured composites at equal material properties by means of varying composite thickness and thus material inputs. Equation (2) is used to calculate the thickness ratio Rtar between the target and reference material, assuming a flat rectangular panel as the component geometry [37]:
R t a r = E r e f E t a r 1 λ ,
where Eref is the respective material property (e.g., Young’s modulus) of the reference material, Etar is the respective material property of the target material to be compared, and λ is the design material index, which depends on the specifications of the component. The different composites are compared regarding tensile properties (strength and modulus), flexural properties (strength and modulus), and Interlaminar Shear Strength (ILSS). All properties were measured using a universal testing machine Z250 (Zwick Roell AS, Ulm, Germany. For tensile tests, five specimens of 250 × 25 mm prepared with GF/epoxy end-tabs were tested at strain rates of 2 mm/min and a gauge length of 75 mm. Flexural properties and ILSS were determined using six 80 × 10 mm and five 50 × 25 mm specimens per plate, respectively. The speed of testing was 2 mm/min and the span width was 64 mm for flexural tests, which was decreased to 1 mm/min and a span width of 20 mm in ILSS tests. More detailed information on specimen dimensions, preparation, and testing parameters, as well as their influence on results, can be found in [21].
The design material index λ can vary between one and three depending on the field of application. A value of two has been chosen for this case to provide a balanced view when the specific field of application of the product is unknown. Nevertheless, this value choice can influence LCA results [38]. Out of the five composite properties, the ones with the most and least pronounced differences between the composites are chosen to model the environmental impacts of FU2.

2.3.2. Life Cycle Inventory

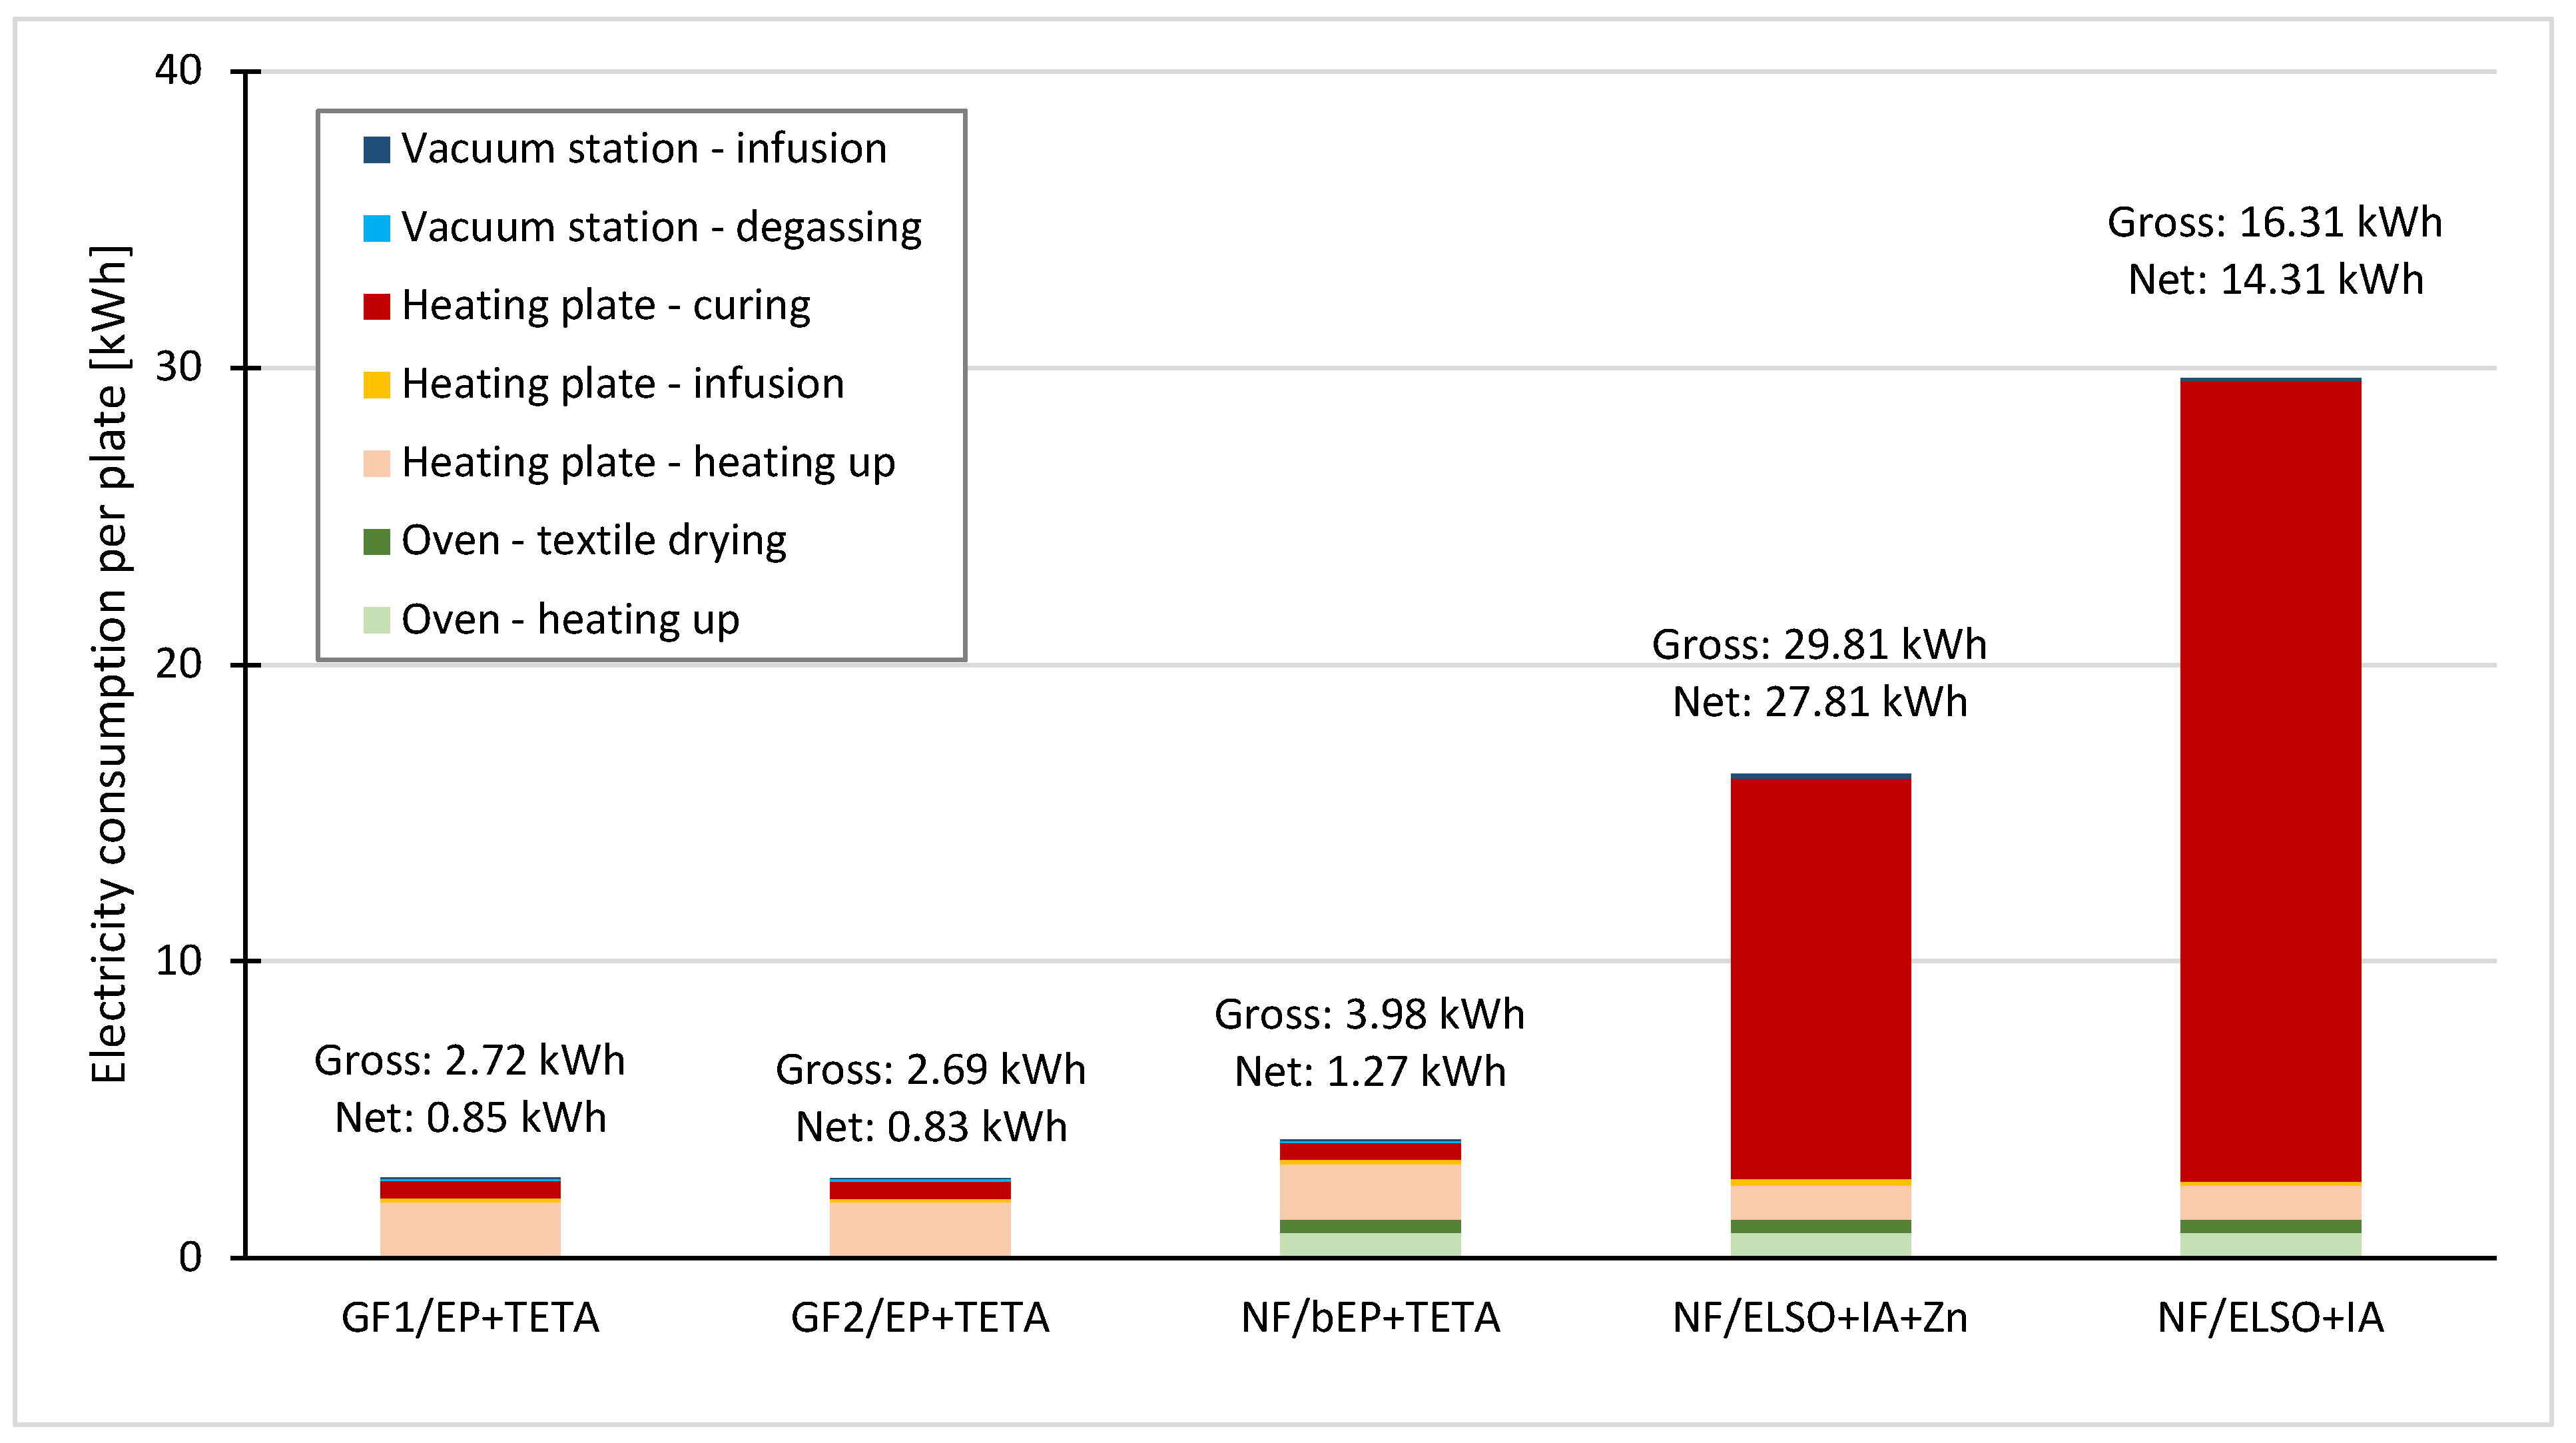
Inventory data were retrieved from various data sources, namely measurements in the laboratory, the ecoinvent 3.9.1 cutoff database [39], and the literature, to model materials not existent in the database. The amount of composite materials and consumables, as well as the machinery requirements and energy consumption, have been measured in the laboratory. The measured electricity consumption for the five plates is shown in Figure 3. The quantity of electricity varies based on the inclusion of energy required to heat the oven and heating plate from ambient temperature to the specified temperature for preform drying and infusion. For this LCA, the net energy consumption (excluding the electricity consumed for experimental preparation) is selected as the baseline due to the experimental character of the study and uncertainty of the heating up values considering reproducibility. However, it is important to note that this choice gives a competitive edge to the GF-based and the NF/bEP+TETA composites.
Figure 4 represents a simplified and incomplete overview of the origin and synthesis routes for the composite materials used in order to increase the understanding for the multiple processing steps required to turn fossil- and bio-based raw materials into composite constituents. In particular, oil refining and steam cracking are complex, multifunctional processes [40]. To facilitate the graphical overview, they have been reduced to the production of the main chemicals needed to synthesize this study’s matrix materials. Furthermore, processes in the foreground system are shaded in turquoise in order to increase transparency and replicability of the modelling [41].
Not all materials constituting the reference flow are available in the ecoinvent database. Therefore, the textile production process from glass and flax fibers is based on the data of [42]. The zinc-based catalyst solved in mineral oil is represented by a dataset with a similar composition and field of application, lubricating oil. The fossil epoxy resin is synthesized through the reaction of bisphenol-A and epichlorohydrin in the presence of a base catalyst (such as sodium hydroxide), for which a dataset from ecoinvent was used. The partially bio-based resin is chemically equivalent to the fossil epoxy resin but uses bio-based propylene to synthesize the acetone and phenol required to produce bisphenol-A. There exist different options to produce bio-based propylene from renewable resources, such as syngas made from sugarcane ethanol and woody biomass [43,44] and the hydrotreatment of plant oils [45]. The latter was chosen to model the bio-based propylene as the inventory data reported are industrially representative.
While for ELSO the inventory is also based on the literature [8], the data for IA and TETA are based on stoichiometric calculations. The pyrolysis process to obtain IA from citric acid is based on data from [46]. It is assumed that TETA is produced from ethanolamine and ethylene dichloride in equal quantities. The chemical modelling follows the recommendations of [35] to increase accuracy for these data gaps [47]. It is nevertheless important to note that these data represent proxies and are subject to uncertainty. Both the processing waste treatment and the composite incineration at EoL have been approximated using data from [48] for waste transport and size reduction, ecoinvent data for the incineration process, and values from [49] for energy and heat recovery from organic waste incineration. Glass fiber waste treatment is modelled separately using mineral wool disposal as a proxy.

2.3.3. Allocation and Biogenic Carbon

Allocating the input and output flows of a process or product system among multiple outputs of this process or system is a highly debated topic in LCA generally and in LCA of agri-food co-products and food waste valorization systems in particular due to the influence on results [50]. In order to be consistent with the attributional nature of this LCA, the multi-functionality of processes in the foreground system has been resolved as recommended by [45], where the used cooking oil comes burden-free from its first life and the environmental impacts of hydrotreatment and steam cracking are attributed according to energy content. The steam generated in the latter process is modelled as a substitution to depict physical causality. The economic allocation principle is applied for the ELSO synthesis following the narrative of [8]. The data in the background system use the default allocation implemented by the ecoinvent cut-off approach.
In addition to partitioning among multiple outputs, the uptake of atmospheric carbon by the biomass used in bio-based materials can have a potential benefit on the environmental impacts of these composites, especially concerning the Global Warming Potential, which is commonly assessed over a time period of 100 years (GWP100) [51,52]. Different approaches to modelling carbon uptake (and release) exist but are subject to on-going research. The consequences of shifting from fossil to biogenic resources require not only biogenic carbon consideration over dynamic time frames but also other system changes, e.g., in regards to land use [53,54]. As biogenic carbon modelling is not at the center of this research but should be considered as a key difference between biogenic and fossil materials, simplified carbon modelling using the −1/+1 approach is used. The CO2 uptake (−1) is calculated considering the biogenic carbon content for the composite materials in the component only, which is released during incineration at EoL (+1).

2.3.4. Life Cycle Impact Assessment

The Life Cycle Impact Assessment (LCIA) method selected for this study is the Environmental Footprint (EF3.1) as implemented in ecoinvent 3.9.1 due to its political relevance for Europe [55]. Furthermore, the display of 16 midpoint impact categories provides a more differentiated picture and trade-offs between different environmental impacts. This is especially important because a change from fossil to biogenic materials can lead to a shift in the damage pathway, e.g., to a reduction in GWP but an increase in eutrophication [56]. While the unit of the different impact categories is usually in reference to the main substance emitted (e.g., CO2-equivalent for GWP), the results are divided by normalization factors [57] to identify the categories most pertinent in regards to global environmental impacts. LCIA is carried out using OpenLCA 2.3.0 [58].

3. Results

This section presents the material testing results to determine the functional equivalence of the five different composites before analyzing the environmental impacts for the two functional units.

3.1. Functional Equivalence of the Composites

Tensile, flexural, and ILSS tests have been conducted to compare the composites environmental performance regarding their expected level of quality within FU2. Table 4 summarizes the test results for all five composites. The FVC in the composites varies from 58% in the GF1/EP+TETA to 40% in the NF/bEP+TETA and NF/ELSO+IA composites using the measured thickness data in Equation (1). The composite density ranges from approximately 2 g/cm3 in GF1/EP+TETA to around 1.2 g/cm3 in the ELSO-based composites. Similarly, there exist large differences in material properties. GF1/EP+TETA exhibits the highest values for all five properties, whereas the ELSO-based composites show a decrease in performance of up to 85%.
Textile architecture and yarn properties, such as yarn spacing length, yarn count, and yarn twist, influence composite properties [59] and explain differences between the GF-reinforced composites and NF/bEP+TETA, as the resin systems in all three cases are chemically equivalent. The laminate pressure and compaction response of the textile reinforcement have a significant influence on composite thickness, FVC, and ultimately composite properties [60]. Furthermore, the remaining water content in the NF decreases composite properties and processability [61].
Next to textile characteristics, variations can be attributed to the choice of the manufacturing process and processing challenges. Other processes with higher consolidation and compaction of the textile, such as Resin Transfer Molding (RTM), lead to a higher FVC and comparatively better material properties also for NF composites [32]. Achieving a full saturation of the NF textile and minimizing void content with the ELSO-based resin systems proved difficult in the experimental work due to the omission of the degassing step for reactivity reasons, as stated in Table 3.
Tensile strength has been selected as the upper benchmark property for FU2 because it exhibits the highest difference in absolute numbers with a decrease of 85% in tensile strength when comparing GF1/EP+TETA and NF/ELSO+IA+Zn. While this approach is suitable for the experimental data collected using the VARI process, it includes constraints of the manufacturing process to control the textile compaction behavior. To emphasize on the material potential regardless of process selection, material properties normalized to the FVC are used for the lower distinction of FU2. Considering normalized values, tensile strength exhibits least variance among the five composites, with a 20% difference between GF1/EP+TETA and NF/ELSO+IA+Zn.

3.2. Environmental Impacts per Composite Plate

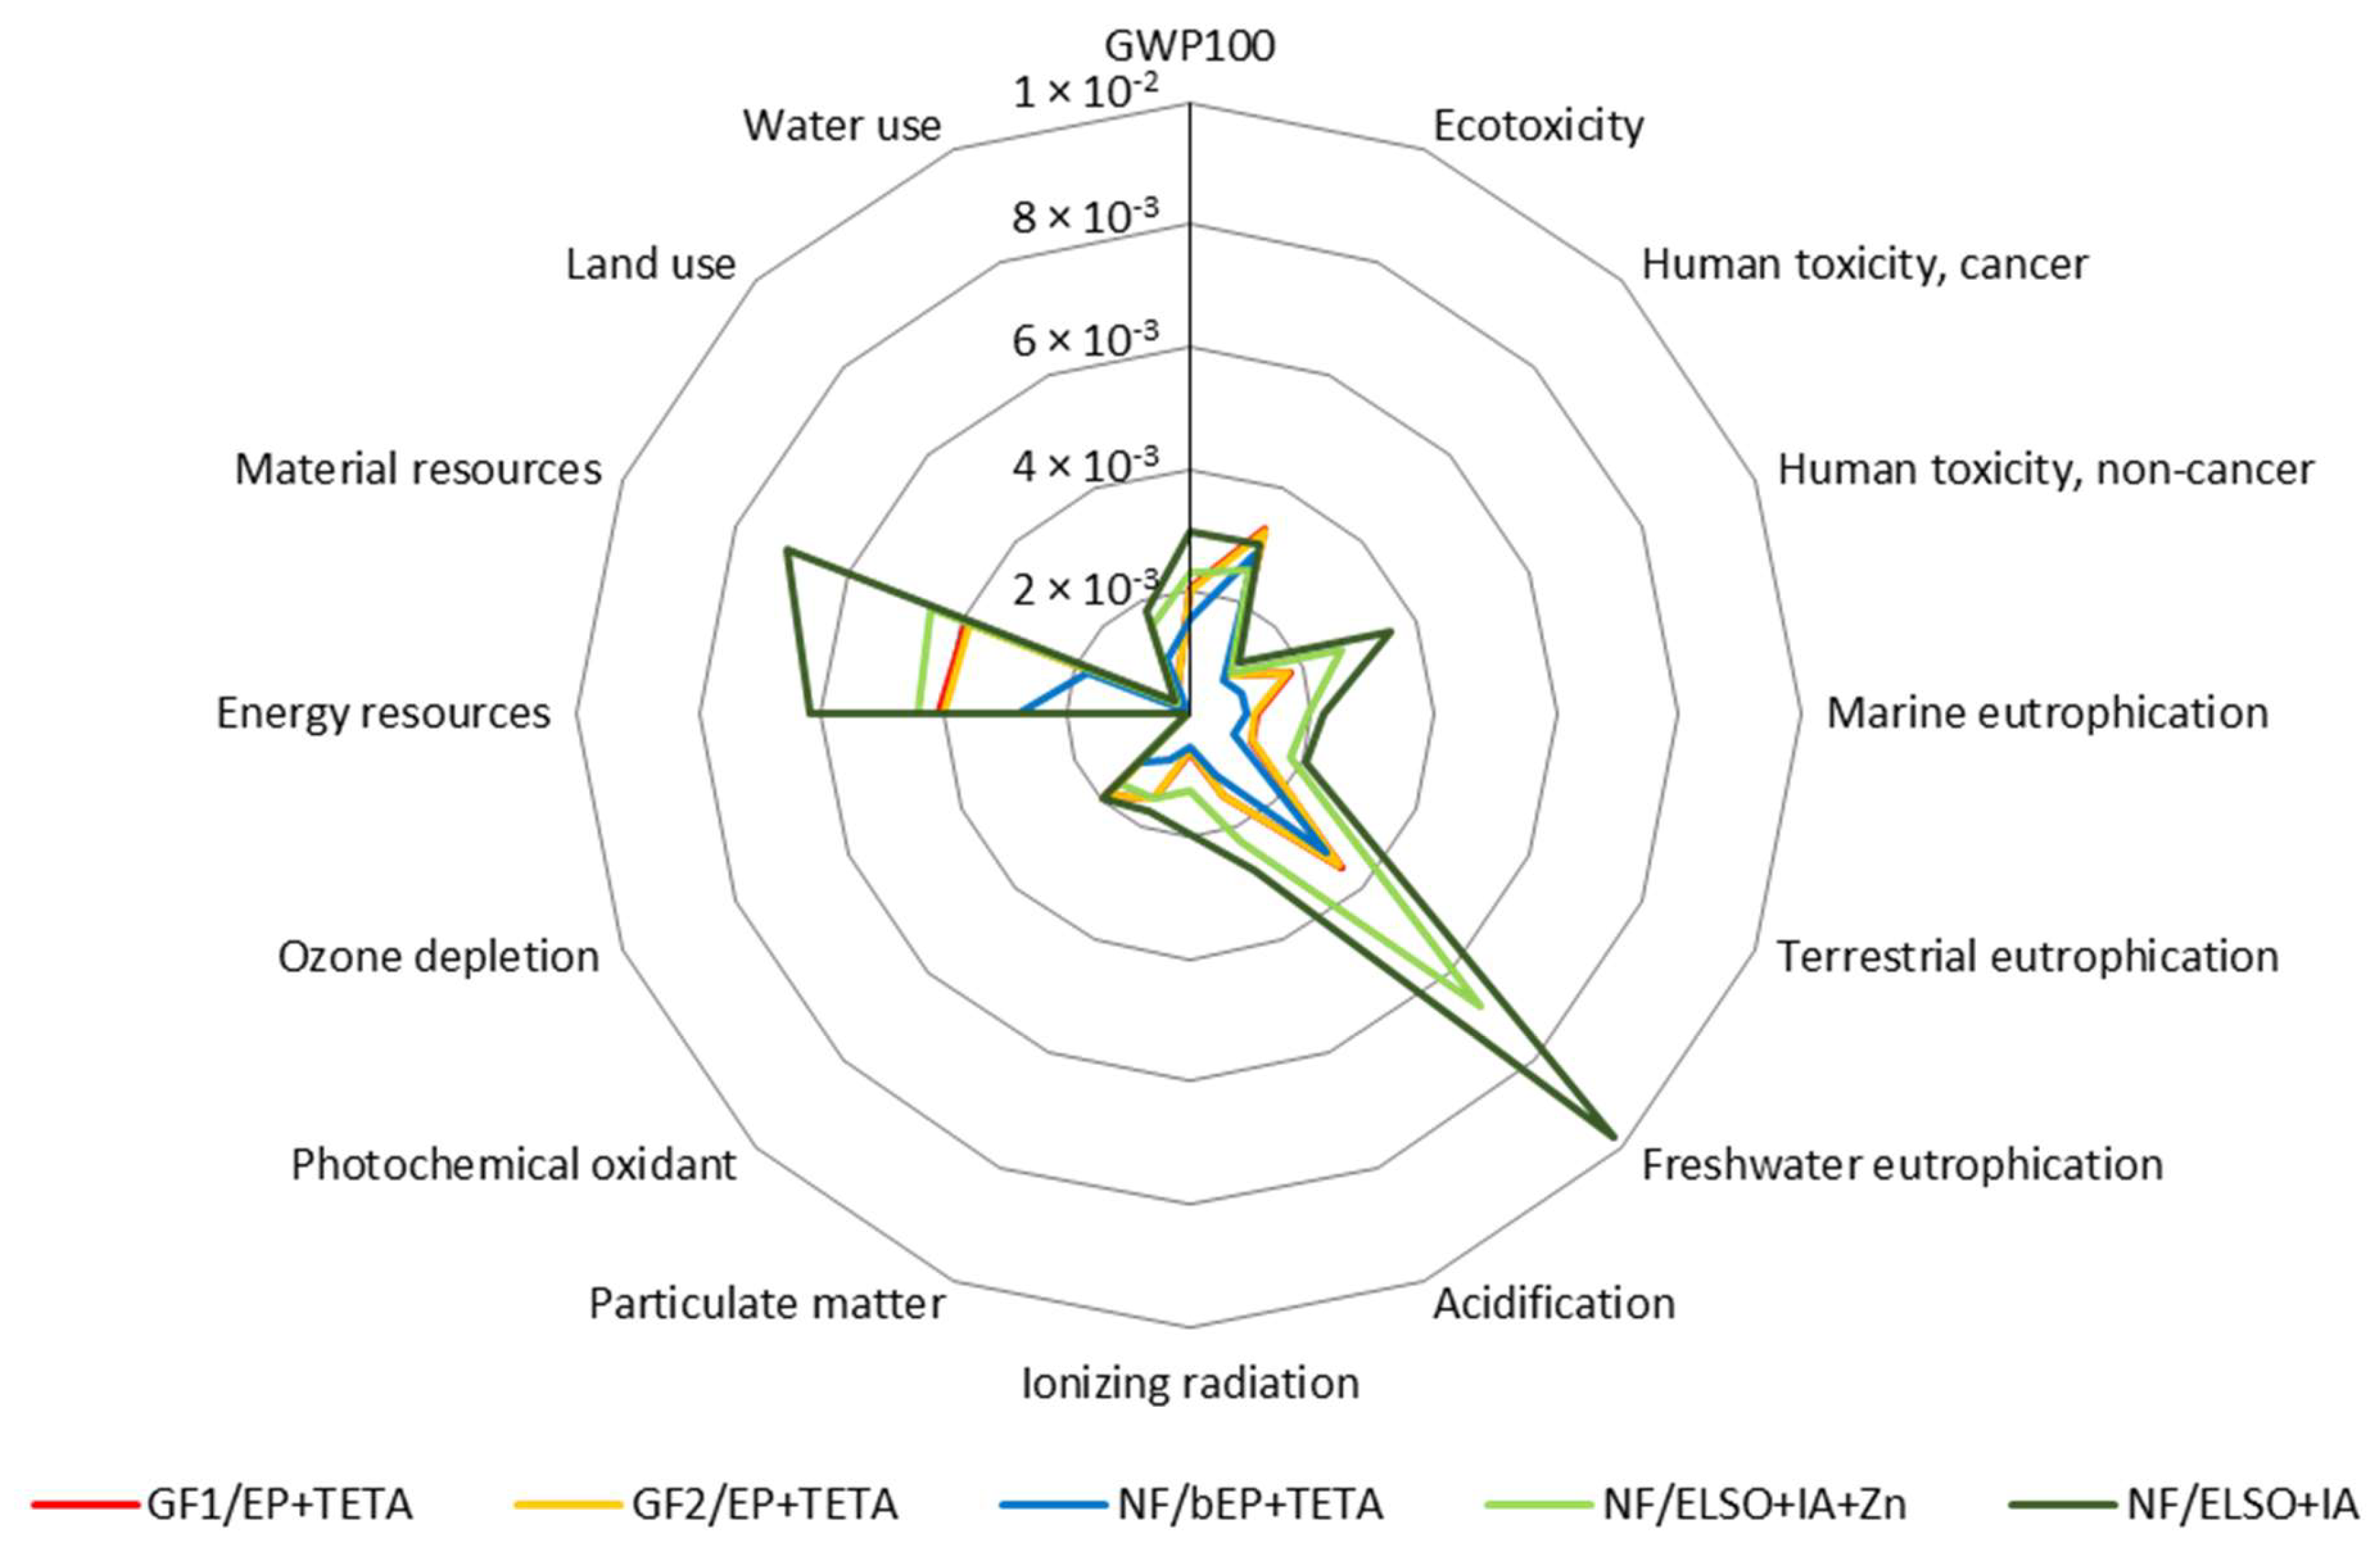
The environmental performance of the five composite plates manufactured is in a similar order of magnitude when comparing absolute numbers for the 16 impact categories, which is partially caused by the limited comprehensiveness of the units for the majority of the impact categories. Therefore, Figure 5 depicts the environmental impacts normalized to the annual impacts of an average global citizen.
It can be observed that NF/ELSO+IA leads to the comparatively highest impacts in most categories, while NF/bEP+TETA exhibits the lowest scores in 13 impact categories. Comparing the magnitude of difference in impacts between NF/ELSO+IA and NF/bEP+TETA, impacts vary from 33% for human cancer toxicity to 85% regarding land use. For ecotoxicity and ozone depletion, NF/ELSO+IA+Zn is the most while GF1/EP+TETA is the least environmentally advantageous, with 22% and 30% higher scores, respectively. Manufacturing the NF/ELSO+IA plate causes the comparatively lowest water use, whereas GF2/EP+TETA is most impactful in this category. Additionally, it is visible from the results that there exist only marginal differences between GF1 and GF2 when comparing plate geometry only.
Despite the different scores in the respective impact categories, the significance of most impact categories compared to the average annual impacts of a global citizen is similar for the five plates. Using these normalization factors, freshwater eutrophication, and material and energy resource depletion exhibit the highest normalized scores across all plates, followed by ecotoxicity, GWP100, and non-cancer human toxicity. On the other hand, land use and ozone depletion are the least significant on the normalized scale for all five plates. There are two potential explanations for the rather low normalized land use results:
  • The relatively small amounts of biogenic materials needed per plate require a limited extent of agricultural activity;
  • The magnitude of land use impacts is also a consequence of choices undertaken in the background database, where the land requirement is divided by the crop cultivation period.
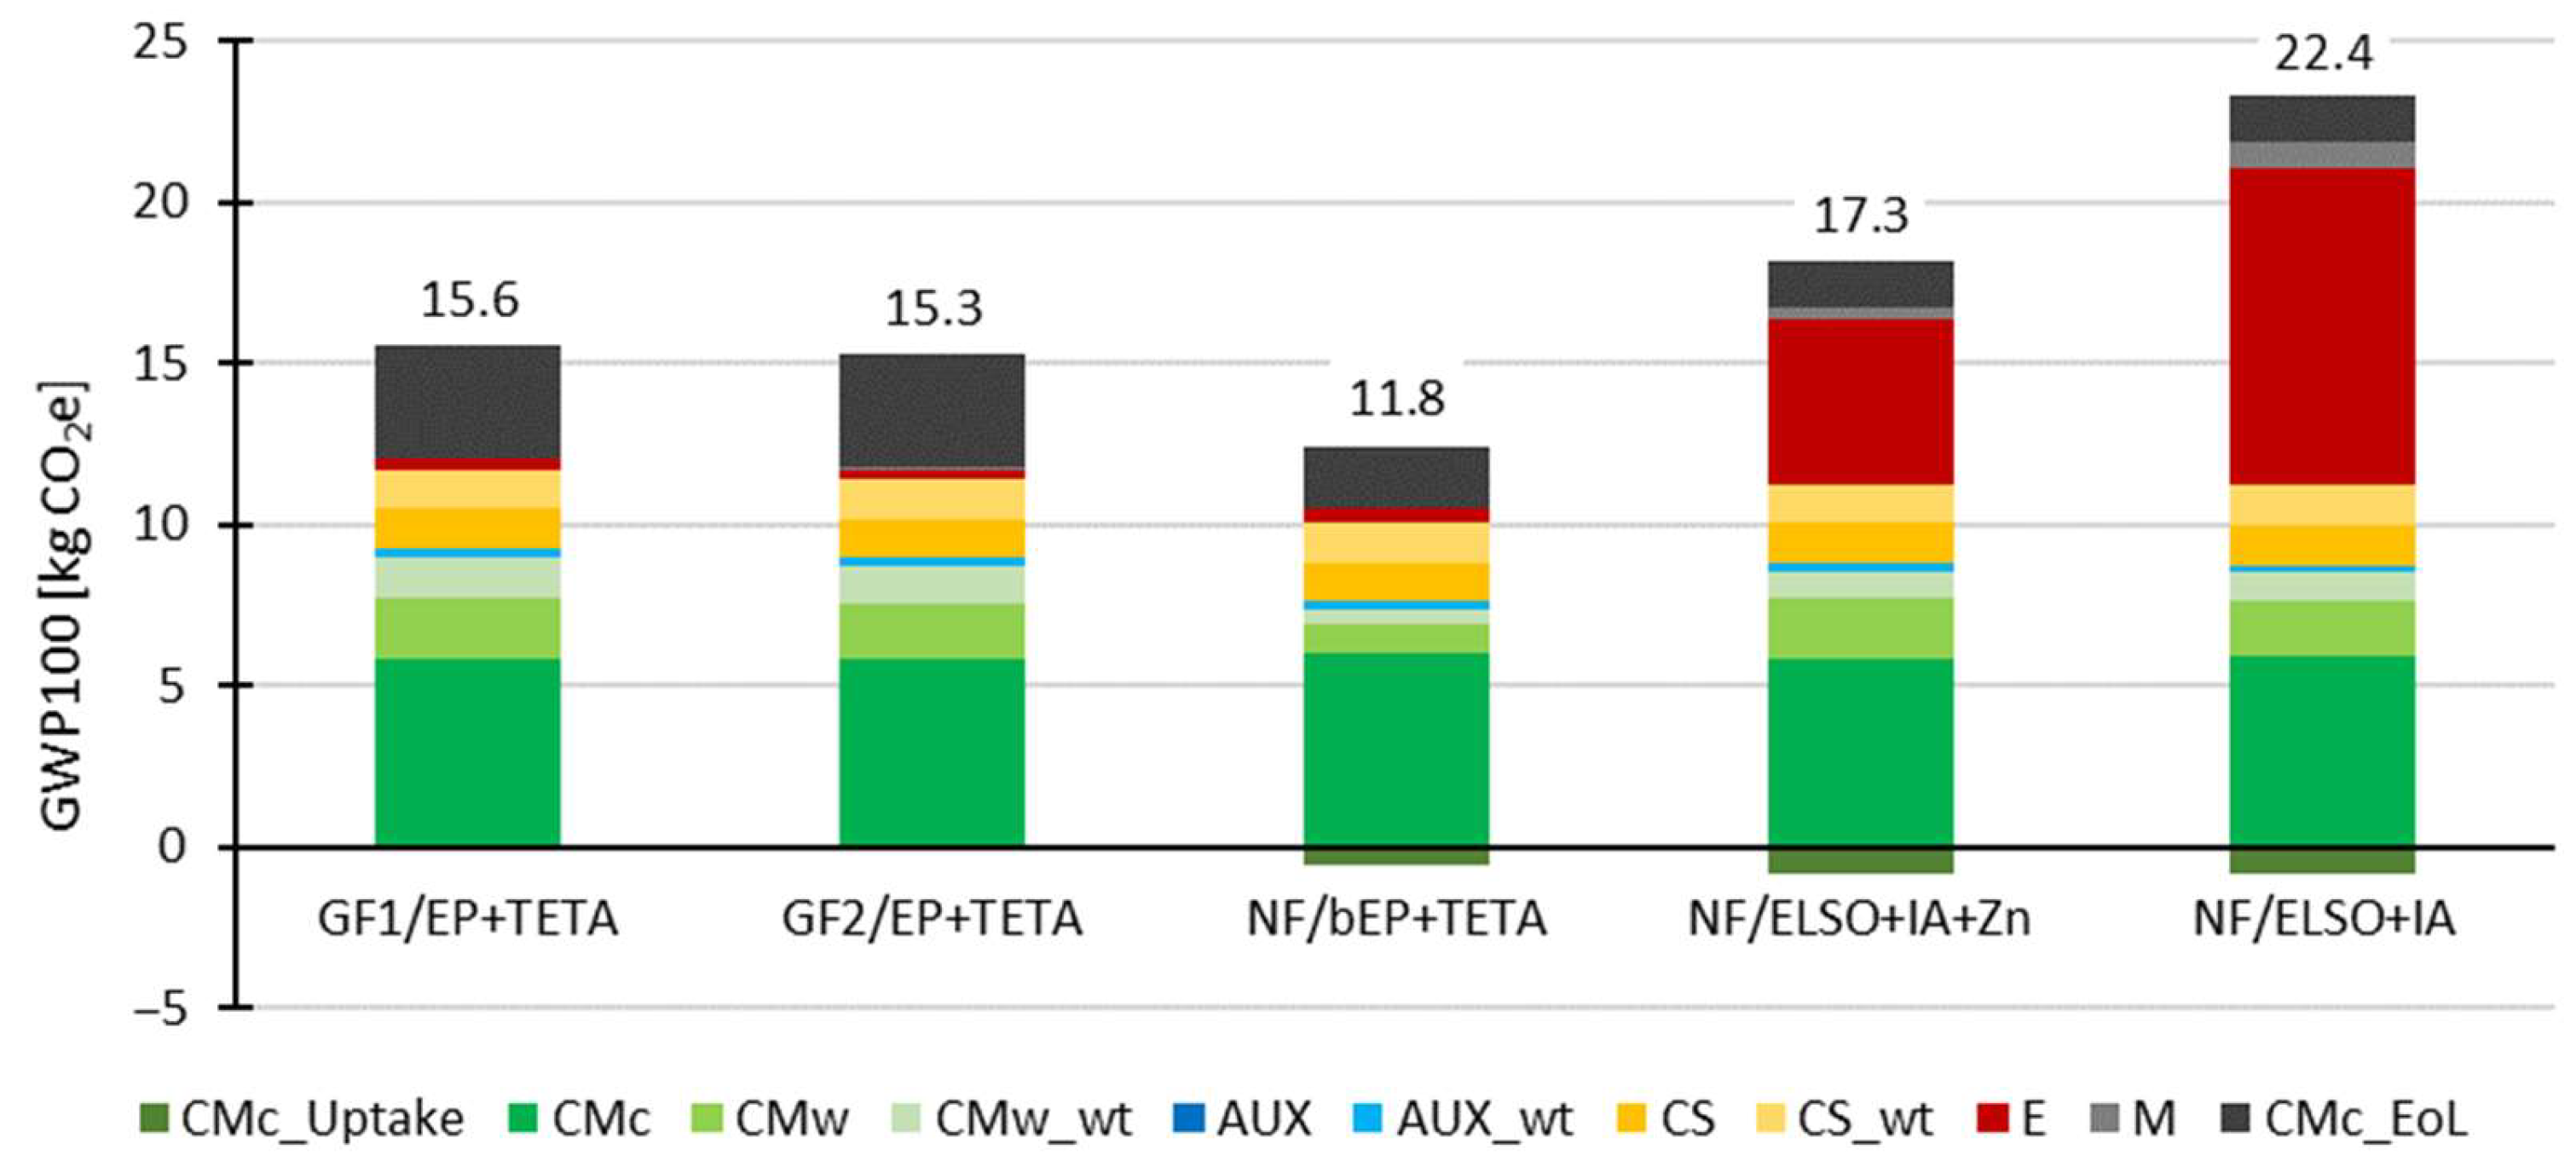
Generally, a comparison of impact categories using (global) normalization factors is debatable as normalization factors neither depict geographical specificities nor consider natural resource constraints [62]. Therefore, no conclusion should be drawn from these normalization results on which impacts are more or less important when talking about the optimization potentials for the respective composites. The predicament of prioritizing impact categories according to normalization factors becomes dispensable for this LCA study, as most impact categories show similar trends when performing contribution analysis per composite. Figure 6 shows the contribution of the different input and output flows to the overall GWP100. In addition to the flows defined in Figure 2, biogenic carbon uptake (CMc_Uptake) and waste treatment processes for waste occurring during processing (wt) and for the component at EoL (CMc_EoL) are depicted separately.
In the NF/ELSO+IA and NF/ELSO+IA+Zn composites, the energy consumption of plate manufacturing is the main contributor in eight and six impact categories, respectively. The contribution varies from 10% (for land use in NF/ELSO+Ia+Zn) to 75% (for ionizing radiation in NF/ELSO+IA) of the impacts. While this is specific for the ELSO-based composites, the materials constituting the plate (CMc) account for a large amount of impacts across all five plates, up to 70% of the water use of the NF/bEP+TETA. This comparison changes when considering biogenic carbon uptake. Without the consideration of biogenic carbon, the GWP100 of CMc leads to a difference of less than 4%. Adding environmental credits for carbon uptake to the CMc burden, NF/ELSO+IA results in a 13% lower GWP100 than the CMc of GF1/EP+TETA. Another process in which the ELSO-based composites show a competitive edge over the fossil- and partially bio-based composites is the emissions from incineration at EoL due to the higher amount of material available for energy recovery. Auxiliary material provision and their waste treatment after processing are negligible for all five plates and 16 impact categories, accounting for less than 1% in most impact categories except photochemical oxidant formation. Similarly, the only impact category where machinery usage has a comparatively larger share is material resource depletion. The share in the fossil- and partially bio-based composites is still comparatively small (at 4% and 9%, respectively), whereas it is more elevated in the ELSO-based composites (at 35% of the material resource depletion impacts in NF/ELSO+IA+Zn and 45% in NF/ELSO+IA) due to the longer processing time and thus machinery occupation.

3.3. Environmental Impacts per Equal Level of Functionality

Except for GF1/EP+TETA, which serves as the benchmark for functionality comparison, the LCIA results for all impact categories in the four thickness-adjusted composites increase between 3% and 39%. Following the rationale of Ashby modelling of varying thickness for all composites, the contribution of CMc and EoL to the overall impacts increases, while the absolute impacts of the other flows remain constant. Trends observed in FU1, such as the large accountability of the CMc in the ELSO-based composites for water use, are amplified in both FU2.
Comparing the results of the LCIA of FU1 to the two distinctions in FU2 (per equal tensile strength and per equal normalized tensile strength to the FVC as the maximum and minimum difference in material properties, respectively), three effects can be observed, as visible in Figure 7:
  • The consideration of tensile strength as a functionality parameter gives the GF1/EP+TETA composite the competitive edge in environmental performance in six impact categories compared to the other options, especially NF/bEP+TETA. FU2 using normalized tensile strength values for Ashby equivalence provides the middle ground, where NF/bEP+TETA still exhibits the lowest scores in 11 impact categories;
  • NF/ELSO+IA remains the least advantageous composite for all three functional units regarding environmental impacts in most categories. Nevertheless, in the two distinctions of FU2 the differences between the best and least performant option are less pronounced than in FU1. The only three impact categories where FU2 can lead to potentially more pronounced differences among the composite types are water use and marine and freshwater eutrophication;
  • In FU1, the GF2 composite exhibits marginally lower environmental impacts (of maximum 2.8% difference) than the composite using GF1. In FU2, the opposite is the case. Additionally, the percentage variance between GF1 and GF2 is more pronounced, with GF1 outperforming GF2 by up to 9.5%.
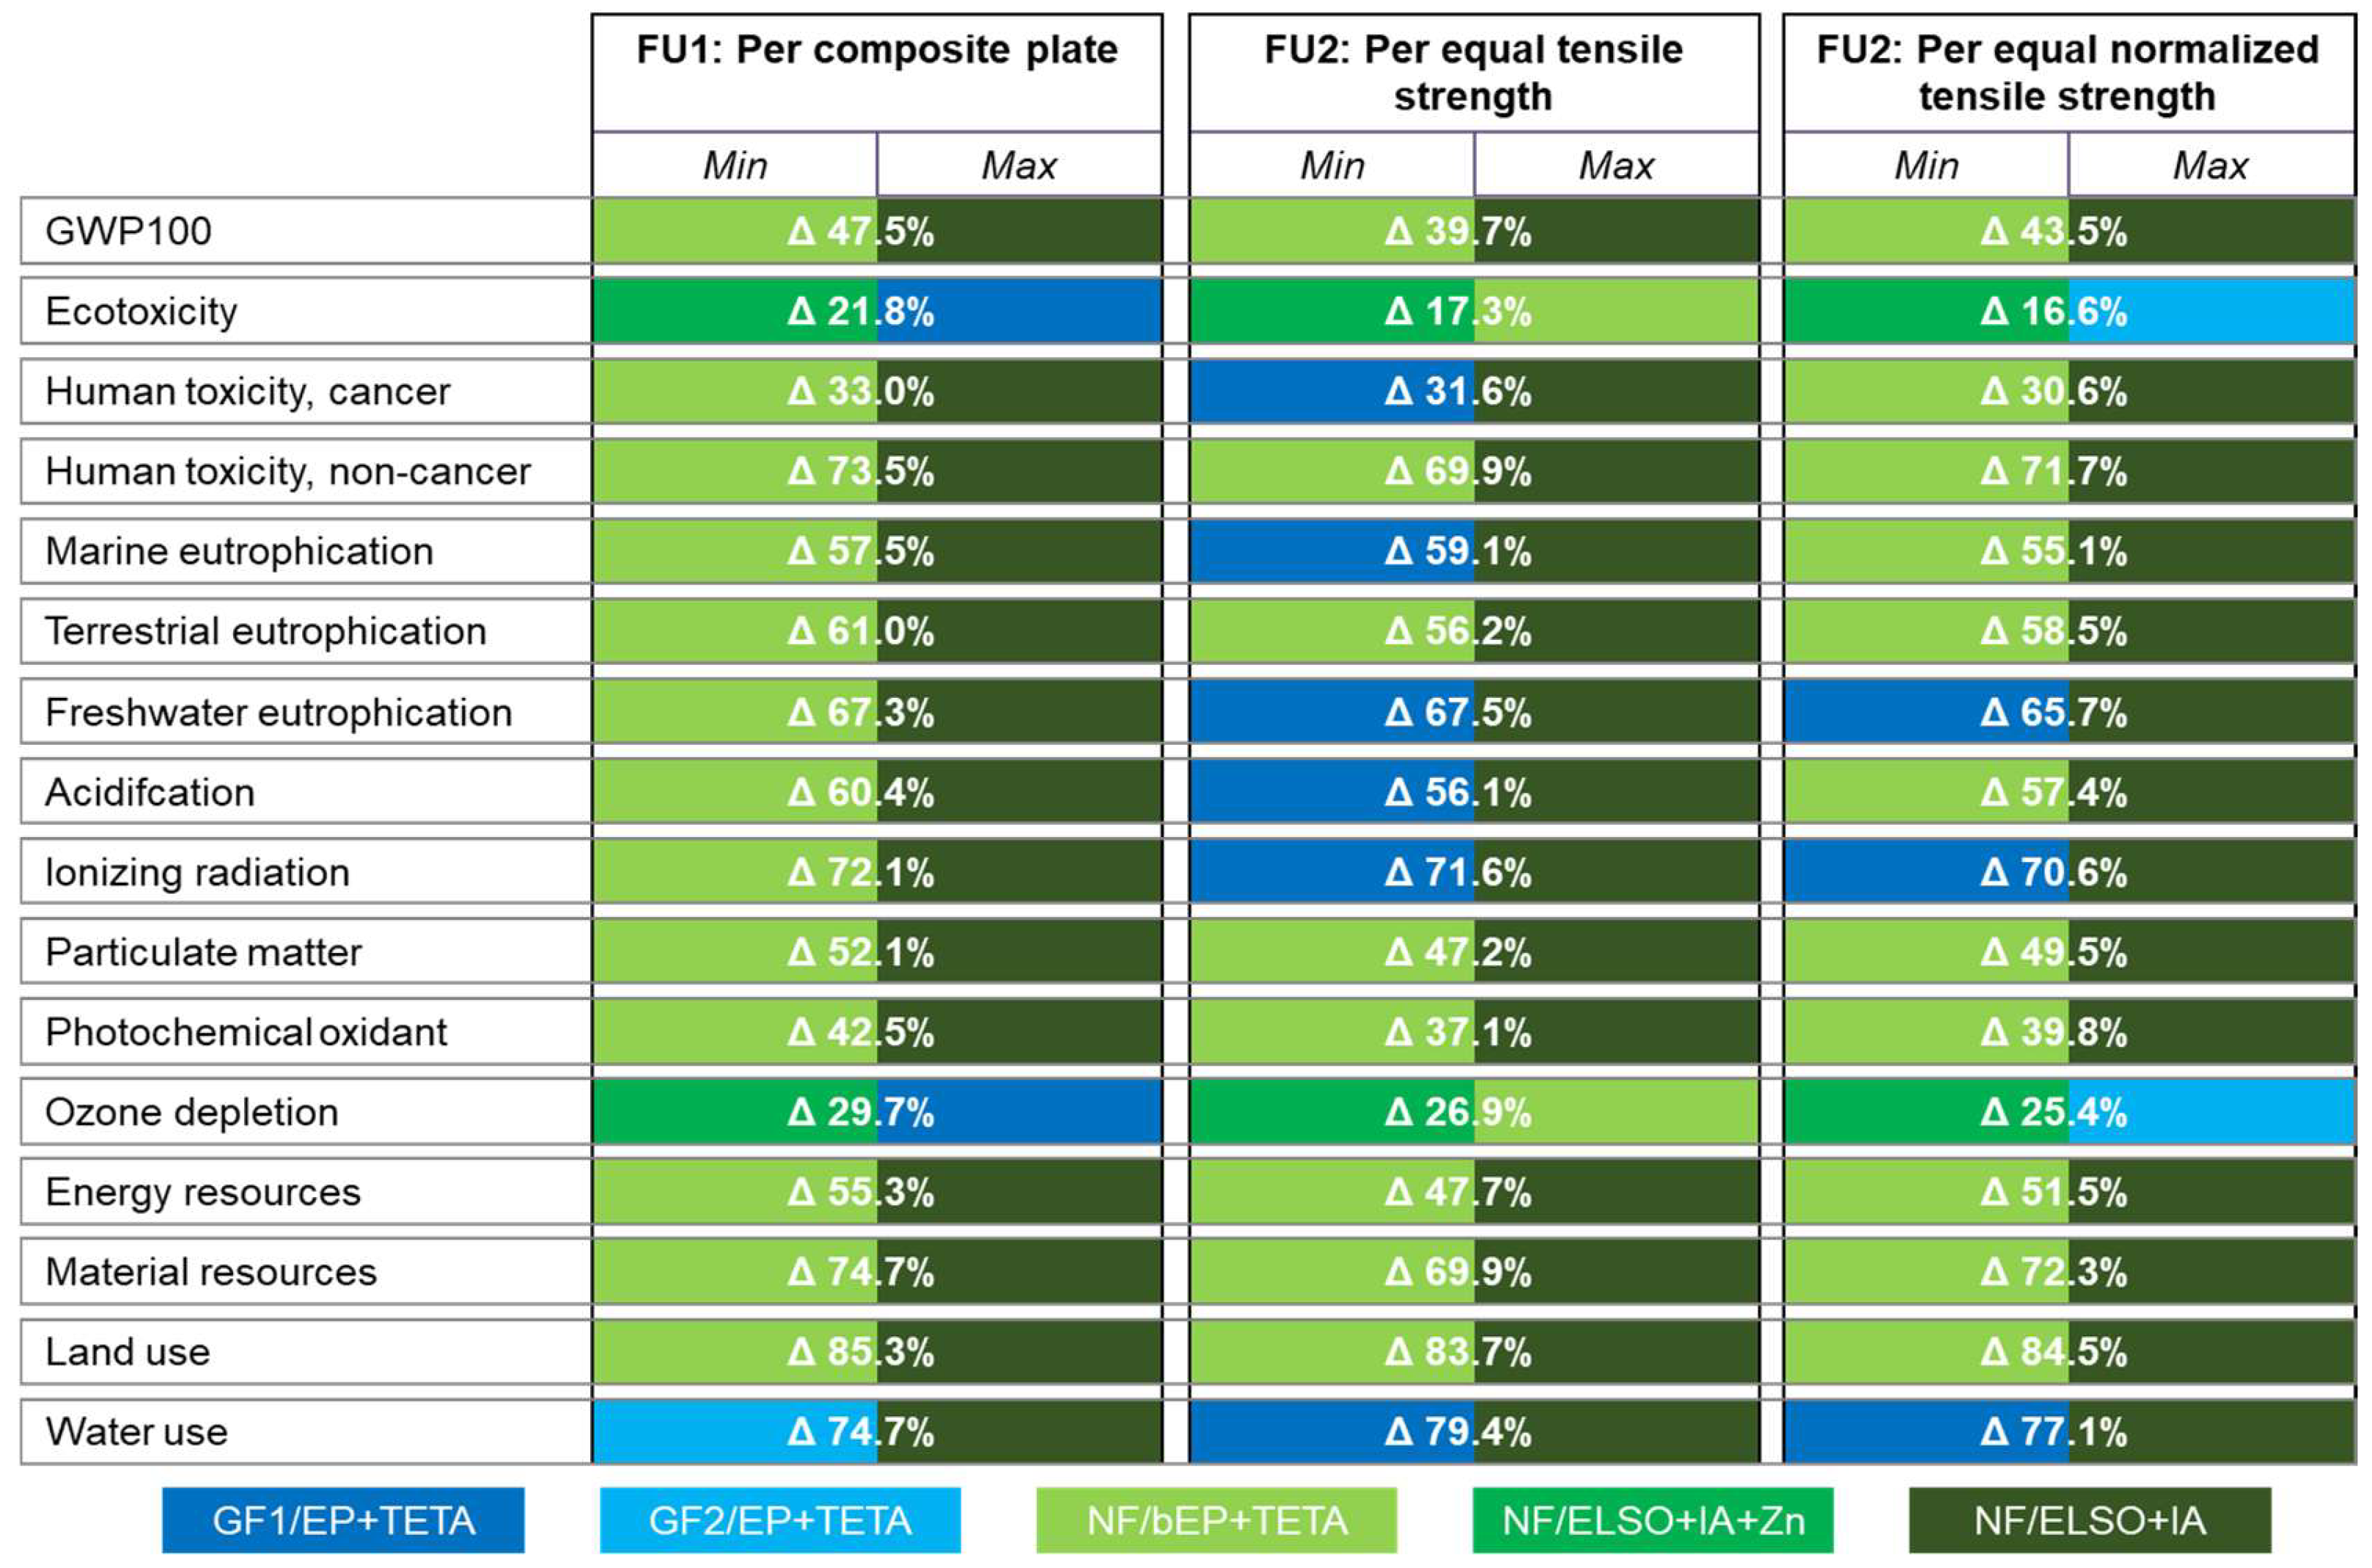
Figure 7. Composite with the minimum and maximum environmental impacts per impact category for all three functional units (per composite plate, per equal tensile strength, and per equal normalized tensile strength) and percentage variance between the minimum and maximum values.
Jcs 09 00093 g007

4. Discussion

This discussion aims to critically reflect on the LCA modelling choices implemented, and their limitations and uncertainties, before putting this study’s results into the context of previous research on the LCA of bio-based composites.

4.1. Limitations and Uncertainties

The methodological choices and inventory data of this study are subject to various limitations and uncertainties which affect LCIA results. An optimization of agricultural practices to produce the bio-based constituents and renewable energy provision can improve the environmental competitiveness of the ELSO-based composites compared to the baseline of conventional global market data for flax fiber and the Austrian electricity grid mix. Another disputable choice is the usage of waste plant oil coming burden-free from its previous life for the synthesis of the partially bio-based epoxy in the NF/bEP+TETA composite. Next to the methodological debate on partitioning impacts for modelling recycling [63], there are also technical limitations and uncertainties: While used cooking oil receives attention in various processes to promote green chemistry, the high-calorific feedstock is available only in a limited quantity and quality [64,65]. Furthermore, it is important to note that the Technological Readiness Level (TRL) of both innovative ELSO-based matrix systems is lower than that of the fossil- and partially bio-based systems, and composition ratios and process parameters are subject to ongoing research.
The environmental comparison of materials in this study is driven by resource acquisition, manufacturing, and EoL treatment as a passive field of application. In active fields of application, such as the transport sector, the use phase accounts for a large share of the impacts over the entire life cycle. Considering use in the aerospace or automotive sector, the bio-based composites are likely to have an advantage over the GF-based composites due to their light weight, as illustrated in previous research [66]. Closely connected to the field of application are also the choices implemented to calculate Ashby equivalence. Next to the selection of a case-specific lambda value, the usefulness of this approach in LCA generally is limited, as there exists a discrepancy between material properties and end-product functionality. Nevertheless, this approach provides helpful insights for comparison at the (intermediary) material stage [67]. Another constraint of functionality consideration within the system boundary is the potential prospect to repair and recycle the ELSO-based composites due to their vitrimeric function [68,69]. The consideration of alternative, circular EoL pathways was out of scope of this study due to the focus on manufacturing, uncertainty in the context of the early stage of resin development, and use-case ambiguity but should be subject to future research.

4.2. Benchmarking with Previous LCA Studies

The direct comparability of the findings of this study to previous LCA research in the field of bio-based composites is restricted by technical and methodological differences. The former includes varying technical parameters such as fiber type, matrix material, and manufacturing process choice, while the latter comprises differences in LCA models such as system boundaries, database selection, and biogenic carbon modelling. The qualitative comparison reveals that this study agrees with some previous findings but expands the discussion regarding the processability of bio-based materials and the necessity of specification when using Ashby equivalence for comparisons within a LCA.
Previous research focused primarily on material comparison. Many studies find that natural fibers are environmentally advantageous compared to GFs [6,10,20,70], although GFs can also outperform their bio-based counterparts [17]. The gap between these results can be bridged by the findings of this study, which demonstrate that the bio-based materials have a competitive edge in some impact categories when considering biogenic carbon uptake, which on the other hand is challenged by additional manufacturing efforts (such as drying of the preform).
The comparison at equal material properties of this study contrasts previous findings: [71] found that flax fiber outperforms GF at equal stiffness. While [14] comes to the same conclusion for stiffness, their study found that GF leads to lower environmental impacts at equal strength in most impact categories. The four bio-based composites (hemp woven fabric in a bio-based epoxy matrix cured with two types of anhydride hardeners) assessed by [9] led to a lower GWP than the GF composite for both composite properties, namely the equivalent flexural modulus and strength. Two conclusions can be drawn from this discrepancy: Comparisons using Ashby equivalence should avoid generalizations and rather emphasize on specifications of material types and properties (e.g., textile architecture, yarn characteristics, matrix composition, and treatment). Additionally, they should carefully reflect on the manufacturing process choice and its parameters, as both factors influence component properties. Combining LCA with experimental research on bio-based composite development to gather complete and consistent data is pivotal in achieving meaningful results.

5. Conclusions

While bio-based fibers and epoxy systems have some advantages when compared to their fossil counterparts, this study demonstrates that optimization of the material functionality as well as the manufacturing process is needed in order to exploit their full potential. Partially bio-based materials can provide a middle ground, including some degree of environmental benefit of using biogenic materials while also achieving comparative environmental impacts during the manufacturing stage. Therefore, future research in material science should focus on increasing matrix reactivity (e.g., through catalysts and the optimization of process parameters) and improving material properties, and also on NF textile production. A suitable approach to steer chemical adaptation of the epoxy system at the interplay with the identification of optimized processing parameters is an in-depth study of the curing reaction according to selected quality indicators, such as crosslink density [72]. While this analysis for the matrix as well as for the resulting composite was out of the scope of this study, it is recommended for future research on bio-based materials and composite manufacturing. The choice of the manufacturing process and its process parameters should be critically reflected upon as it influences composite properties and can be a main driver of environmental impacts, especially in passive fields of application. Further optimization potentials concern biogenic material sourcing and the upscaling of transformation and production processes, which can be subject to prospective LCAs [73].

Author Contributions

Conceptualization, U.K., B.R. and M.F.; Data curation, U.K.; Formal analysis, U.K.; Funding acquisition, U.K.; Investigation, U.K., B.R., M.S. and M.F.; Methodology, U.K.; Project administration, E.F.; Resources, E.F.; Software, U.K.; Validation, U.K., B.R. and M.F.; Visualization, U.K.; Writing—original draft, U.K.; Writing—review and editing, B.R., M.S., E.F. and M.F. All authors have read and agreed to the published version of the manuscript.

Funding

This research was funded in the framework of the program Project QB3R (project no. FO999889818) by the Austrian Ministry for Climate Action, Environment, Energy, Mobility, Innovation and Technology, within the framework of the FTI initiative Kreislaufwirtschaft 2021, which is administered by the Austria Research Promotion Agency (FFG).

Data Availability Statement

The raw data supporting the conclusions of this article will be made available by the authors on request.

Acknowledgments

The authors are grateful to Ralf Schledjewski for funding acquisition and his invaluable contribution to idea development.

Conflicts of Interest

The authors declare no conflicts of interest.

References

  1. European Commission: Directorate-General for Research and Innovation. A Sustainable Bioeconomy for Europe—Strengthening the Connection Between Economy, Society and the Environment—Updated Bioeconomy Strategy; Publications Office of the European Union: Luxembourg, 2018; Available online: https://data.europa.eu/doi/10.2777/792130 (accessed on 2 December 2024).
  2. Andrew, J.J.; Dhakal, H.N. Sustainable biobased composites for advanced applications: Recent trends and future opportunities—A critical review. Compos. Part. C Open Access 2022, 7, 100220. [Google Scholar] [CrossRef]
  3. Singh, M.K.; Tewari, R.; Zafar, S.; Rangappa, S.M.; Siengchin, S. A comprehensive review of various factors for application feasibility of natural fiber-reinforced polymer composites. Results Mater. 2023, 17, 100355. [Google Scholar] [CrossRef]
  4. Fadlallah, S.; Sinha Roy, P.; Garnier, G.; Saito, K.; Allais, F. Are lignin-derived monomers and polymers truly sustainable? An in-depth green metrics calculations approach. Green. Chem. 2021, 23, 1495–1535. [Google Scholar] [CrossRef]
  5. ISO 14040:2006; Environmental Management-Life Cycle Assessment-Principles and Framework (14040). International Organization for Standardization: Geneva, Switzerland, 2006.
  6. Hesser, F. Environmental advantage by choice: Ex-ante LCA for a new Kraft pulp fibre reinforced polypropylene composite in comparison to reference materials. Compos. Part. B Eng. 2015, 79, 197–203. [Google Scholar] [CrossRef]
  7. La Rosa, A.D.; Recca, G.; Summerscales, J.; Latteri, A.; Cozzo, G.; Cicala, G. Bio-based versus traditional polymer composites. A life cycle assessment perspective. J. Clean. Prod. 2014, 74, 135–144. [Google Scholar] [CrossRef]
  8. Deng, Y.; Paraskevas, D.; Tian, Y.; van Acker, K.; Dewulf, W.; Duflou, J.R. Life cycle assessment of flax-fibre reinforced epoxidized linseed oil composite with a flame retardant for electronic applications. J. Clean. Prod. 2016, 133, 427–438. [Google Scholar] [CrossRef]
  9. Witthayolankowit, K.; Rakkijakan, T.; Ayub, R.; Kumaniaev, I.; Pourchet, S.; Boni, G.; Watjanatepin, P.; Zarafshani, H.; Gabrion, X.; Chevallier, A.; et al. Use of a fully biobased and non-reprotoxic epoxy polymer and woven hemp fabric to prepare environmentally friendly composite materials with excellent physical properties. Compos. Part. B Eng. 2023, 258, 110692. [Google Scholar] [CrossRef]
  10. Jayamani, E.; Jie, T.J.; Bin Bakri, M.K. Life cycle assessment of sustainable composites. In Advances in Sustainable Polymer Composites; Elsevier: Amsterdam, The Netherlands, 2021; pp. 245–265. ISBN 9780128203385. [Google Scholar]
  11. Beigbeder, J.; Soccalingame, L.; Perrin, D.; Bénézet, J.-C.; Bergeret, A. How to manage biocomposites wastes end of life? A life cycle assessment approach (LCA) focused on polypropylene (PP)/wood flour and polylactic acid (PLA)/flax fibres biocomposites. Waste Manag. 2019, 83, 184–193. [Google Scholar] [CrossRef]
  12. Corbière-Nicollier, T.; Gfeller Laban, B.; Lundquist, L.; Leterrier, Y.; Månson, J.-A.; Jolliet, O. Life cycle assessment of biofibres replacing glass fibres as reinforcement in plastics. Resour. Conserv. Recycl. 2001, 33, 267–287. [Google Scholar] [CrossRef]
  13. Batouli, S.M.; Zhu, Y.; Nar, M.; D’Souza, N.A. Environmental performance of kenaf-fiber reinforced polyurethane: A life cycle assessment approach. J. Clean. Prod. 2014, 66, 164–173. [Google Scholar] [CrossRef]
  14. Duflou, J.R.; Yelin, D.; van Acker, K.; Dewulf, W. Comparative impact assessment for flax fibre versus conventional glass fibre reinforced composites: Are bio-based reinforcement materials the way to go? CIRP Ann. 2014, 63, 45–48. [Google Scholar] [CrossRef]
  15. Roy, P.; Defersha, F.; Rodriguez-Uribe, A.; Misra, M.; Mohanty, A.K. Evaluation of the life cycle of an automotive component produced from biocomposite. J. Clean. Prod. 2020, 273, 123051. [Google Scholar] [CrossRef]
  16. Ramachandran, K.; Gnanasagaran, C.L.; Vekariya, A. Life cycle assessment of carbon fiber and bio-fiber composites prepared via vacuum bagging technique. J. Manuf. Process. 2023, 89, 124–131. [Google Scholar] [CrossRef]
  17. Hervy, M.; Evangelisti, S.; Lettieri, P.; Lee, K.-Y. Life cycle assessment of nanocellulose-reinforced advanced fibre composites. Compos. Sci. Technol. 2015, 118, 154–162. [Google Scholar] [CrossRef]
  18. Le Duigou, A.; Deux, J.-M.; Davies, P.; Baley, C. PLLA/Flax Mat/Balsa Bio-Sandwich—Environmental Impact and Simplified Life Cycle Analysis. Appl. Compos. Mater. 2012, 19, 363–378. [Google Scholar] [CrossRef]
  19. Ashby, M.F.; Jones, D.R.H. Engineering Materials: An Introduction to Properties, Applications and Design: 1, 5th ed.; Butterworth-Heinemann: Amsterdam, The Netherlands, 2018. [Google Scholar]
  20. Zhou, C.; Shi, S.Q.; Chen, Z.; Cai, L.; Smith, L. Comparative environmental life cycle assessment of fiber reinforced cement panel between kenaf and glass fibers. J. Clean. Prod. 2018, 200, 196–204. [Google Scholar] [CrossRef]
  21. Kirschnick, U.; Feuchter, M.; Ravindran, B.; Salzmann, M.; Duretek, I.; Fauster, E.; Schledjewski, R. Manufacturing bio-based fiber-reinforced polymer composites: Process performance in RTM and VARI processes. Adv. Manuf. Polym. Compos. Sci. 2024, 10, 2379205. [Google Scholar] [CrossRef]
  22. Lau, K.; Hung, P.; Zhu, M.-H.; Hui, D. Properties of natural fibre composites for structural engineering applications. Compos. Part B Eng. 2018, 136, 222–233. [Google Scholar] [CrossRef]
  23. Tapper, R.J.; Longana, M.L.; Norton, A.; Potter, K.D.; Hamerton, I. An evaluation of life cycle assessment and its application to the closed-loop recycling of carbon fibre reinforced polymers. Compos. Part B Eng. 2020, 184, 107665. [Google Scholar] [CrossRef]
  24. Campbell, F.C. Thermoset Resins: The Glue That Holds the Strings Together. In Manufacturing Processes for Advanced Composites; Elsevier: Amsterdam, The Netherlands, 2004; pp. 63–101. ISBN 9781856174152. [Google Scholar]
  25. Rwahwire, S.; Tomkova, B.; Periyasamy, A.P.; Kale, B.M. Green thermoset reinforced biocomposites. In Green Composites for Automotive Applications; Elsevier: Amsterdam, The Netherlands, 2019; pp. 61–80. ISBN 9780081021774. [Google Scholar]
  26. Zhang, Y.; Liu, X.; Wan, M.; Zhu, Y.; Zhang, K. From renewable biomass to bio-based epoxy monomers and bio-based epoxy curing agents: Synthesis and performance. Polym. Degrad. Stab. 2024, 229, 110988. [Google Scholar] [CrossRef]
  27. Kim, J.R.; Sharma, S. The development and comparison of bio-thermoset plastics from epoxidized plant oils. Ind. Crops Prod. 2012, 36, 485–499. [Google Scholar] [CrossRef]
  28. Cullis, C.A.; Cullis, M.A. Comparison Between the Genomes of a Fiber and an Oil-Seed Variety of Flax. In Genetics and Genomics of Linum; Cullis, C.A., Ed.; Springer International Publishing: Cham, Siwtzerland, 2019; pp. 89–96. ISBN 978-3-030-23963-3. [Google Scholar]
  29. Lotfy, W.A.; Ghanem, K.M.; El-Helow, E.R. Citric acid production by a novel Aspergillus niger isolate: II. Optimization of process parameters through statistical experimental designs. Bioresour. Technol. 2007, 98, 3470–3477. [Google Scholar] [CrossRef] [PubMed]
  30. Blößl, Y.; Schledjewski, R. A robust empirical model equation for the compaction response of textile reinforcements. Polym. Compos. 2021, 42, 297–308. [Google Scholar] [CrossRef]
  31. Schillfahrt, C.; Fauster, E.; Schledjewski, R. Influence of process pressures on filling behavior of tubular fabrics in bladder-assisted resin transfer molding. Adv. Manuf. Polym. Compos. Sci. 2017, 3, 148–158. [Google Scholar] [CrossRef]
  32. Van Oosterom, S.; Allen, T.; Battley, M.; Bickerton, S. An objective comparison of common vacuum assisted resin infusion processes. Compos. Part A Appl. Sci. Manuf. 2019, 125, 105528. [Google Scholar] [CrossRef]
  33. Lunetto, V.; Galati, M.; Settineri, L.; Iuliano, L. Sustainability in the manufacturing of composite materials: A literature review and directions for future research. J. Manuf. Process. 2023, 85, 858–874. [Google Scholar] [CrossRef]
  34. Hermansson, F.; Ekvall, T.; Janssen, M.; Svanström, M. Allocation in recycling of composites—The case of life cycle assessment of products from carbon fiber composites. Int. J. Life Cycle Assess. 2022, 27, 419–432. [Google Scholar] [CrossRef]
  35. Hischier, R.; Hellweg, S.; Capello, C.; Primas, A. Establishing Life Cycle Inventories of Chemicals Based on Differing Data Availability (9 pp). Int. J. Life Cycle Assess. 2005, 10, 59–67. [Google Scholar] [CrossRef]
  36. Holzapfel, P.; Bach, V.; Finkbeiner, M. Electricity accounting in life cycle assessment: The challenge of double counting. Int. J. Life Cycle Assess. 2023, 28, 771–787. [Google Scholar] [CrossRef]
  37. Ashby, M.F. Materials Selection in Mechanical Design, 4th ed.; Butterworth-Heinemann: Oxford, UK, 2011; ISBN 9781856176637. [Google Scholar]
  38. Meng, F.; McKechnie, J.; Turner, T.A.; Pickering, S.J. Energy and environmental assessment and reuse of fluidised bed recycled carbon fibres. Compos. Part A Appl. Sci. Manuf. 2017, 100, 206–214. [Google Scholar] [CrossRef]
  39. Ecoinvent. Ecoinvent Database; Ecoinvent Associatio: Zürich, Switzerland, 2023. [Google Scholar]
  40. Karimzadeh, R.; Godini, H.R.; Ghashghaee, M. Flowsheeting of steam cracking furnaces. Chem. Eng. Res. Des. 2009, 87, 36–46. [Google Scholar] [CrossRef]
  41. European Commission—Joint Research Centre—Institute for Environment and Sustainability. International Reference Life Cycle Data System (ILCD) Handbook—General Guide for Life Cycle Assessment—Detailed Guidance; EUR 24708 EN; Publications Office of the European Union: Luxembourg, 2010. [Google Scholar]
  42. Gomez-Campos, A.; Vialle, C.; Rouilly, A.; Sablayrolles, C.; Hamelin, L. Flax fiber for technical textile: A life cycle inventory. J. Clean. Prod. 2021, 281, 125177. [Google Scholar] [CrossRef]
  43. Kikuchi, Y.; Oshita, Y.; Mayumi, K.; Hirao, M. Greenhouse gas emissions and socioeconomic effects of biomass-derived products based on structural path and life cycle analyses: A case study of polyethylene and polypropylene in Japan. J. Clean. Prod. 2017, 167, 289–305. [Google Scholar] [CrossRef]
  44. Mayumi, K.; Kikuchi, Y.; Hirao, M. Life Cycle Assessment of Biomass-Derived Resin for Sustainable Chemical Industry. Chem. Eng. Trans. 2010, 19, 19–25. [Google Scholar] [CrossRef]
  45. Moretti, C.; Junginger, M.; Shen, L. Environmental life cycle assessment of polypropylene made from used cooking oil. Resour. Conserv. Recycl. 2020, 157, 104750. [Google Scholar] [CrossRef]
  46. Lefeuvre, A.; Yerro, X.; Jean-Marie, A.; Vo Dong, P.A.; Azzaro-Pantel, C. Modelling pyrolysis process for CFRP recycling in a closed-loop supply chain approach. In 27th European Symposium on Computer Aided Process Engineering; Elsevier: Amsterdam, The Netherlands, 2017; pp. 2029–2034. ISBN 9780444639653. [Google Scholar]
  47. Wernet, G.; Hellweg, S.; Hungerbühler, K. A tiered approach to estimate inventory data and impacts of chemical products and mixtures. Int. J. Life Cycle Assess. 2012, 17, 720–728. [Google Scholar] [CrossRef]
  48. Nunes, A.O.; Viana, L.R.; Guineheuc, P.-M.; Da Silva Moris, V.A.; Paiva, J.M.F.d.; Barna, R.; Soudais, Y. Life cycle assessment of a steam thermolysis process to recover carbon fibers from carbon fiber-reinforced polymer waste. Int. J. Life Cycle Assess. 2018, 23, 1825–1838. [Google Scholar] [CrossRef]
  49. Wien Energie GmbH. Spittelau Waste Incineration Plant. Available online: https://positionen.wienenergie.at/en/projects/spittelau-waste-incineration-plant/ (accessed on 2 August 2023).
  50. Dominguez Aldama, D.; Grassauer, F.; Zhu, Y.; Ardestani-Jaafari, A.; Pelletier, N. Allocation methods in life cycle assessments (LCAs) of agri-food co-products and food waste valorization systems: Systematic review and recommendations. J. Clean. Prod. 2023, 421, 138488. [Google Scholar] [CrossRef]
  51. Garcia, R.; Alvarenga, R.A.; Huysveld, S.; Dewulf, J.; Allacker, K. Accounting for biogenic carbon and end-of-life allocation in life cycle assessment of multi-output wood cascade systems. J. Clean. Prod. 2020, 275, 122795. [Google Scholar] [CrossRef]
  52. Wiloso, E.I.; Heijungs, R.; Huppes, G.; Fang, K. Effect of biogenic carbon inventory on the life cycle assessment of bioenergy: Challenges to the neutrality assumption. J. Clean. Prod. 2016, 125, 78–85. [Google Scholar] [CrossRef]
  53. Hansen, R.N.; Eliassen, J.L.; Schmidt, J.; Andersen, C.E.; Weidema, B.P.; Birgisdóttir, H.; Hoxha, E. Environmental consequences of shifting to timber construction: The case of Denmark. Sustain. Prod. Consum. 2024, 46, 54–67. [Google Scholar] [CrossRef]
  54. Sazdovski, I.; Hauschild, M.Z.; Arfelis, S.; Bala, A.; Fullana-i-Palmer, P. Short Communication: Biogenic carbon in fast-moving products: A deception or real contribution to circularity? Environ. Adv. 2024, 15, 100461. [Google Scholar] [CrossRef]
  55. Zampori, L.; Pant, R. Suggestions for Updating the Organisation Environmental Footprint (OEF) Method; EUR 29682 EN; Publications Office of the European Union: Luxembourg, 2019; ISBN 978-92-76-00654-1. [Google Scholar]
  56. Bishop, G.; Styles, D.; Lens, P.N. Environmental performance comparison of bioplastics and petrochemical plastics: A review of life cycle assessment (LCA) methodological decisions. Resour. Conserv. Recycl. 2021, 168, 105451. [Google Scholar] [CrossRef]
  57. Andreasi Bassi, S.; Biganzoli, F.; Ferrara, N.; Amadei, A.; Valente, A.; Sala, S.; Ardente, F. Updated Characterisation and Normalisation Factors for the Environmental Footprint 3.1 Method; Publications Office of the European Union: Luxembourg, 2023; ISBN 978-92-76-99069-7. [Google Scholar]
  58. Ciroth, A. OpenLCA; GreenDelta: Berlin, Germany, 2022. [Google Scholar]
  59. Patti, A.; Acierno, D. Materials, Weaving Parameters, and Tensile Responses of Woven Textiles. Macromol 2023, 3, 665–680. [Google Scholar] [CrossRef]
  60. Yenilmez, B.; Senan, M.; Murat Sozer, E. Variation of part thickness and compaction pressure in vacuum infusion process. Compos. Sci. Technol. 2009, 69, 1710–1719. [Google Scholar] [CrossRef]
  61. Resch-Fauster, K.; Džalto, J.; Anusic, A.; Mitschang, P. Effect of the water absorptive capacity of reinforcing fibers on the process ability, morphology, and performance characteristics of composites produced from polyfurfuryl alcohol. Adv. Manuf. Polym. Compos. Sci. 2018, 4, 13–23. [Google Scholar] [CrossRef]
  62. Matuštík, J.; Paulu, A.; Kočí, V. Is normalization in Life Cycle Assessment sustainable? Alternative approach based on natural constraints. J. Clean. Prod. 2024, 444, 141234. [Google Scholar] [CrossRef]
  63. Allacker, K.; Mathieux, F.; Manfredi, S.; Pelletier, N.; Camillis, C.d.; Ardente, F.; Pant, R. Allocation solutions for secondary material production and end of life recovery: Proposals for product policy initiatives. Resour. Conserv. Recycl. 2014, 88, 1–12. [Google Scholar] [CrossRef]
  64. Kusenberg, M.; Eschenbacher, A.; Djokic, M.R.; Zayoud, A.; Ragaert, K.; Meester, S.d.; van Geem, K.M. Opportunities and challenges for the application of post-consumer plastic waste pyrolysis oils as steam cracker feedstocks: To decontaminate or not to decontaminate? Waste Manag. 2022, 138, 83–115. [Google Scholar] [CrossRef]
  65. Orjuela, A.; Clark, J. Green chemicals from used cooking oils: Trends, challenges, and opportunities. Curr. Opin. Green. Sustain. Chem. 2020, 26, 100369. [Google Scholar] [CrossRef]
  66. Kim, H.C.; Wallington, T.J. Life Cycle Assessment of Vehicle Lightweighting: A Physics-Based Model To Estimate Use-Phase Fuel Consumption of Electrified Vehicles. Environ. Sci. Technol. 2016, 50, 11226–11233. [Google Scholar] [CrossRef] [PubMed]
  67. Furberg, A.; Arvidsson, R.; Molander, S. A practice-based framework for defining functional units in comparative life cycle assessments of materials. J. Ind. Ecol. 2022, 26, 718–730. [Google Scholar] [CrossRef]
  68. Ravindran, B.; Agathocleous, T.; Oswald-Tranta, B.; Fauster, E.; Feuchter, M. Impact Characteristics and Repair Approaches of Distinct Bio-Based Matrix Composites: A Comparative Analysis. J. Compos. Sci. 2024, 8, 126. [Google Scholar] [CrossRef]
  69. Ravindran, B.; Feuchter, M.; Schledjewski, R. Investigation of the Mechanical Properties of Sandwich Composite Panels Made with Recyclates and Flax Fiber/Bio-Based Epoxy Processed by Liquid Composite Molding. J. Compos. Sci. 2023, 7, 122. [Google Scholar] [CrossRef]
  70. Deng, Y.; van Acker, K.; Dewulf, W.; Duflou, J.R. Environmental Assessment of Printed Circuit Boards from Biobased Materials. In Glocalized Solutions for Sustainability in Manufacturing; Hesselbach, J., Herrmann, C., Eds.; Springer: Berlin/Heidelberg, Germany, 2011; pp. 605–610. ISBN 978-3-642-19691-1. [Google Scholar]
  71. Rajendran, S.; Scelsi, L.; Hodzic, A.; Soutis, C.; Al-Maadeed, M.A. Environmental impact assessment of composites containing recycled plastics. Resour. Conserv. Recycl. 2012, 60, 131–139. [Google Scholar] [CrossRef]
  72. Wang, Y.; Gan, H.-L.; Liang, C.-X.; Zhang, Z.-Y.; Xie, M.; Xing, J.-Y.; Xue, Y.-H.; Liu, H. Network structure and properties of crosslinked bio-based epoxy resin composite: An in-silico multiscale strategy with dynamic curing reaction process. Giant 2021, 7, 100063. [Google Scholar] [CrossRef]
  73. Bruhn, S.; Sacchi, R.; Cimpan, C.; Birkved, M. Ten questions concerning prospective LCA for decision support for the built environment. Build. Environ. 2023, 242, 110535. [Google Scholar] [CrossRef]
Figure 1. VARI processing for the ELSA+IA resin system (a) and sample specimens of the five composites produced (b).
Jcs 09 00093 g001
Figure 2. Flow chart and system boundary for the LCA to compare fossil-, partially, and fully bio-based composites from cradle to grave.
Jcs 09 00093 g002
Figure 3. Electricity consumption of the machinery needed for the manufacturing of the five different composite plates, differentiating between electricity consumption for experimental preparation, textile drying, matrix degassing, infusion, and curing.
Jcs 09 00093 g003
Figure 4. Flows and processes in the foreground system to model the inventory of the different matrix systems, comprising the different resins, hardeners, catalysts, and glass and flax fiber textile reinforcements.
Jcs 09 00093 g004
Figure 5. LCIA results per plate for all 16 impact categories normalized to the impacts of an average global citizen per year for the five composites manufactured.
Jcs 09 00093 g005
Figure 6. Contribution analysis for the GWP100 of the five manufactured composites differentiated in composite materials constituting the final composite (CMc), the carbon sequestration of these materials (CMc_Uptake) and their EoL treatment (CMc_EoL), composite materials wasted during manufacturing (CMw) and their waste treatment (CMw_wt), and the auxiliary (AUX) and consumable (CS) inputs and their waste treatment (AUX-wt and CS_wt), as well as energy consumption (E) and machinery usage (M) for VARI manufacturing.
Jcs 09 00093 g006
Table 1. Textile reinforcements and their properties.
GF1GF2NF
Fiber typeGlassGlassFlax
Textile nameWRSInterglas 92130 FK144ampliTexTM 5042
CompanyGlasscom, SpainPorcher Industries, GermanyBcomp, Switzerland
Textile architecture2 × 2 twill weavePlain weave4 × 4 twill weave
Areal weight [g/m2]580395500
Table 2. Material amounts (number of layers and masses) for the five different composites manufactured.
MaterialsGF1/EP+TETAGF2/EP+TETANF/bEP+TETANF/ELSO+IA+ZnNF/
ELSO+IA
Layers [no]913666
Textile 1 [g]376366204204204
Matrix 2 [g]320320320264264
Hardener 2 [g]808080136136
Catalyst 2 [g]---4-
1 After drying for 30 min at 120 °C for the NF. 2 Total mass of matrix material prepared for one plate including processing losses.
Table 3. Process parameters for the five different composites manufactured.
MaterialsGF1/EP+TETAGF2/EP+TETANF/bEP+TETANF/ELSO+IA+ZnNF/
ELSO+IA
Resin pre-heating---30 min at
80 °C
30 min at
80 °C
Matrix
mixing
2 min at
ambient air
2 min at
ambient air
2 min at
ambient air
30 min at
80 °C
30 min at
80 °C
Matrix
degassing
6 min at
ambient air
6 min at
ambient air
4 min at
ambient air
--
Infusion240 s at 100 °C200 s at 100 °C230 s at 100 °C680 s at 100 °C360 s at 100 °C
Curing30 min at 100 °C30 min at 100 °C30 min at 100 °C600 min at 120 °C1200 min at 120 °C
Table 4. Fiber volume content (FVC), tensile properties, flexural properties, and Interlaminar Shear Strength (ILSS) for the five manufactured composites.
Tensile Strength [MPa]Young’s
Modulus [GPa]
Flexural Strength [MPa]Flexural
Modulus [GPa]
ILSS
[MPa]
GF1/EP+TETA
FVC: 58%
659 ± 1730.0 ± 1.7694 ± 3529.2 ± 0.746.3 ± 1.0
GF2/EP+TETA
FVC: 53%
441 ± 1327.8 ± 1.0486 ± 1126.8 ± 0.341.6 ± 1.4
NF/bEP+TETA
FVC: 40%
114 ± 915.1 ± 0.9183 ± 1012.4 ± 0.827.3 ± 1.3
NF/ELSO+IA+Zn
FVC: 42%
92 ± 311.1 ± 0.699 ± 48.0 ± 0.510.0 ± 0.2
NF/ELSO+IA
FVC: 40%
100 ± 89.2 ± 1.2113 ± 75.1 ± 1.514.1 ± 0.9
Disclaimer/Publisher’s Note: The statements, opinions and data contained in all publications are solely those of the individual author(s) and contributor(s) and not of MDPI and/or the editor(s). MDPI and/or the editor(s) disclaim responsibility for any injury to people or property resulting from any ideas, methods, instructions or products referred to in the content.