Article

Enhanced Electrocatalytic Performance of Nickel-Cobalt-Titanium Dioxide-Embedded Carbon Nanofibers for Direct Alcohol Fuel Cells

by
Wael M. Mohammed
*,
Mahmoud A. Mohamed
,
Mohamed O. Abdel-Hamed
* and
Esam E. Abdel-Hady
Physics Department, Faculty of Science, Minia University, Minia P.O. Box 61519, Egypt
*
Authors to whom correspondence should be addressed.
J. Compos. Sci. 2025, 9(3), 125; https://doi.org/10.3390/jcs9030125
Submission received: 2 February 2025 / Revised: 5 March 2025 / Accepted: 8 March 2025 / Published: 10 March 2025
(This article belongs to the Section Nanocomposites)

Abstract

This study focuses on making non-precious electrocatalysts for improving the performance of Direct Alcohol Fuel Cells (DAFCs). Specifically, it examines the oxidation of ethanol and methanol. Conventional platinum-based catalysts are expensive and suffer from problems such as degradation and poisoning. To overcome these challenges, we fabricated tri-metallic catalysts composed of nickel, cobalt, and titanium dioxide (TiO2) embedded in carbon nanofibers (CNFs). The synthesis included electrospinning and subsequent carbonization as well as optimization of parameters to achieve uniform nanofiber morphology and high surface area. Electrochemical characterization revealed that the incorporation of TiO2 significantly improved electrocatalytic activity for ethanol and methanol oxidation, with current densities increasing from 57.8 mA/cm2 to 74.2 mA/cm2 for ethanol and from 38.69 mA/cm2 to 60.39 mA/cm2 for methanol as the TiO2 content increased. The catalysts showed excellent stability, with the TiO2-enriched sample (T2) showing superior performance during longer cycling tests. Chronoamperometry and electrochemical impedance spectroscopy are used to examine the stability of the catalysts and the dynamics of the charge carriers. Impedance spectroscopy indicated reduced charge transfer resistance, confirming enhanced activities. These findings suggest that the synthesized non-precious electrocatalysts can serve as effective alternatives to platinum-based materials, offering a promising pathway for the development of cost-efficient and durable fuel cells. Research highlights non-precious metal catalysts for sustainable fuel cell technologies.

Graphical Abstract

1. Introduction

Energy is an important element that affects both economic growth and human existence. Concerns over threats to human health and the environment have grown significantly in the last several decades. The production, usage, and transformation of energy are linked to several issues, such as acid rain, ozone depletion, and global climate change. The decline in present energy supplies has increased the need to find clean and renewable alternative fuels. Fuel cells have garnered significant interest due to their high efficiency and low CO2 emissions. These electrochemical devices convert a fuel’s chemical energy directly into electrical energy [1,2]. The functionality and efficiency of fuel cells heavily rely on catalysts [3]. Platinum (Pt) is the most commonly used catalyst, particularly for the reduction and oxidation reactions occurring at the cathode and the anode, respectively [4,5]. To reduce costs and enhance fuel cell performance, alternative catalysts have been explored, including non-precious metal catalysts, transition metal oxides, carbon-based materials, and platinum-based alloys (Pt-Co, Pt-Ni, Pt-Cr, etc.) [5,6,7,8].
The design and optimization of catalysts involve various factors, including particle size, surface area, and support material [9]. The performance of catalysts can be improved by developing nanostructured catalysts, using high surface area supports and conductive materials, and adding promoters or co-catalysts [10,11]. Among these methods, the synthesis of tri-metal catalysts is particularly important for ensuring stability and maintaining catalytic activity, especially in the oxidation of ethanol, which requires strong catalytic support. Compared to methanol, ethanol plays a significant role in generating more protons and electrons during oxidation. However, catalyst deterioration remains a major challenge in fuel cell systems, ultimately leading to performance degradation [12]. Addressing issues such as poisoning, corrosion, and sintering is crucial for developing more stable and durable catalysts [4,13,14,15].
TiO2 catalysts have numerous applications across various industries, including functioning as photocatalysts that facilitate a range of redox reactions when exposed to ultraviolet or visible light. This capability has led to innovations in self-cleaning surfaces, antimicrobial applications, and the purification of water and air [16,17]. Furthermore, TiO2 catalyzes several chemical processes, such as the oxidation of volatile organic compounds, the water–gas shift reaction, and the selective catalytic reduction of NOx, which are examples of heterogeneous catalysis [18,19]. E. Sarwar et al. examine the effectiveness of Ni-Co/Graphene electrocatalysts in methanol oxidation, specifically looking at different ratios of cobalt to nickel. They investigated different ratios of nickel and cobalt in the composite and found that the presence of both metals is crucial for good catalytic activity. The Co1Ni4/Graphene catalyst achieved the highest peak current density of 22.5 mA.cm−2, which highlights its promise as an efficient catalyst for direct methanol fuel cells (DMFCs) [20]. E. Urbańczyk et al. managed to create electrocatalytic materials for methanol oxidation by using nickel–cobalt–graphene composites, which are produced via a straightforward electrochemical deposition technique. The best-performing electrode was Ni1Co3/Graphene, which showed catalytic activity of 15.82 mA cm2 and excellent stability. Graphene plays a crucial role in improving charge transfer and increasing the number of active sites [21]. V. Hassanzadeh et al. explore the electrocatalytic oxidation of ethanol with a nanostructured Ni-Co/reduced graphene oxide (RGO) composite. The research utilizes a carbon paste electrode modified with RGO and bimetallic Ni-Co nanoparticles, demonstrating improved redox activity arising from the synergistic interaction of the metals. The best catalytic performance at pH 13 was 30 mA/cm2 [22]. N.J. Roodbari et al. investigate the creation and analysis of NiCo/GO-TiO2 as a cost-effective electrocatalyst for the electrooxidation of methanol and ethanol. The GO-TiO2 was produced using a reflux method, followed by the chemical reduction to deposit Ni-Co. The study examines the impact of adding TiO2 nanoparticles to graphene oxide support, revealing that this modification enhances the surface area of the support material, boosting its catalytic performance for methanol and ethanol electrooxidation [23]. Another study was provided by Jin Y. C. et al., which demonstrates a novel Fe-HHTP-modified pencil graphite electrode effectively detects bisphenol A and bisphenol S simultaneously, showing high sensitivity and potential for environmental monitoring and food safety applications [24]. In another study, Li M. and Feng L. G. demonstrated that transition metal phosphides (TMPs) significantly enhance platinum-based catalysts in methanol electrooxidation. TMPs improve CO tolerance and catalytic performance by facilitating efficient electron transfer and optimizing the bifunctional mechanism, highlighting their potential to boost direct methanol fuel cell efficacy and durability [25]. Zhu Z. et al. review the advancements in biomass-derived carbon materials for electrochemical energy storage systems. They highlight the customizable properties and eco-friendly nature of these materials, emphasizing their applications in alkali metal-ion batteries, lithium–sulfur batteries, and supercapacitors while addressing challenges and future research directions [26].
In this context, our research focuses on synthesizing and characterizing non-precious electrocatalysts using tri-metallic structures composed of nickel, cobalt, and titanium dioxide (TiO2) embedded in carbon nanofibers (CNFs). This innovative approach addresses the pressing need for cost-effective alternatives to platinum-based materials while significantly enhancing electrocatalytic performance for ethanol and methanol oxidation. By incorporating the TiO2 content within the catalyst framework, substantial improvements in current densities and stability under operational conditions were demonstrated. Our findings suggest that these synthesized non-precious electrocatalysts can not only match the performance of conventional catalysts but also provide a durable and sustainable solution for fuel cell technologies.
Ongoing research focuses on enhancing the selectivity, stability, and efficiency of TiO2-based catalysts for diverse applications. Direct methanol fuel cells (DMFCs) have attracted significant attention due to their high energy density, ease of storage, and low pollution levels. Consequently, the development of high-activity, low-cost anodes for DMFCs has become a critical field of study. Several initiatives are underway to create effective non-precious electrocatalysts as alternatives to Pt-based materials. Nickel and its alloys have emerged as promising candidates for the oxidation of methanol and ethanol due to their high activity and low cost. It has been shown that both adsorption on the anode surface and electrochemical processes are involved in the oxidation reactions of ethanol and methanol [27,28,29]. Carbon has been added to a number of newly published electrocatalytic materials for DMFCs and other fuel cell types in order to take advantage of its adsorption potential. The primary role of carbon is to facilitate the adsorption of ethanol and methanol molecules onto the catalytic material.
Current research seeks to improve the overall performance and durability of fuel cells by creating new free Pt catalysts based on non-precious tri-metallic structures incorporated with metal oxides. Metal oxides have a crucial role in increasing the chemical stability of the catalyst. To achieve that, we aim to produce cost-effective metal electrocatalysts that incorporate Ni, Co, and TiO2 supported by carbon nanofibers (Ni-Co-TiO2/CNF) as a substitute for Pt using an electrospinning technique. The oxidation of methanol and ethanol in an alkaline medium (KOH) is facilitated by carbon nanofibers (CNF) integrated with Ni-Co-TiO2 nanoparticles. This process is being thoroughly investigated and elucidated. Whereas transmission electron microscopy (TEM) and scanning electron microscopy (SEM) offered in-depth morphological analysis, techniques like X-ray diffraction (XRD) identified the metal/CNFs’ phase and crystal structures. In order to assess the catalysts’ performance and the impact of different electrolyte concentrations, measurements were made using linear sweep voltammetry and various scan rates. The reliability and efficacy of the electrode were evaluated using electrochemical impedance spectroscopy, cyclic voltammetry, and chronoamperometry.

2. Experimental Studies

2.1. Preparation of Investigated Samples

Figure S1 illustrates the synthetic procedure for preparing Ni12Co(8-x) TiO2(x)/CNFs for use as a catalyst for fuel cell application. A set of electrocatalysts is created by combining titanium oxide, cobalt acetate, and nickel (II) acetate tetrahydrate (Both 98% (Alpha, German, Freital) in varying ratios with a 10% PVA solution in water. In different atomic percentages, 20% of the metals Ni, Co, and TiO2 were mixed with the prepared PVA solution, as shown in Table 1. To obtain a clear liquid, the mixture was stirred overnight at room temperature.
The samples were prepared for electrospinning by placing them in a container (20 mL) with the following conditions: voltage 20 kV, flow rate of solution from the needle to the deposition surface 0.3 mL/h, and distance between the needle and the deposition surface 15 cm, these represent the ideal conditions for electrospinning. As a result, a nanofiber network was obtained. The electrospun nanofibers were carbonized for five hours at 750 °C with a heating rate of 2.5 °C/min and a holding time of two hours after being dehydrated for twenty-four hours at 80 °C in a vacuum.

2.2. Sample Characterization

The morphology of the nanofiber surface was examined by the Energy Dispersive X-rays (EDX)-equipped scanning electron microscope (SEM) (Jeol JSM-I T 200, Tokyo, Japan). The crystallinity and the crystal structure of the generated catalyst were investigated using Cu Kα ( λ = 0.1540 Å) radiation and an X-ray diffractometer (202964/Panalytical Empryan, Malvern, UK). At a step size of 0.05, the diffraction pattern was examined over a range of 10° to 100°. The electrocatalytic activities of electrodes employed as anode or cathode for ethanol or methanol electrooxidation were tested using an electrochemical analyzer (CHI 660E Series, Austin, TX, USA). A reference electrode, a working electrode, and an auxiliary (counter) electrode (Ag/AgCl; the concentration of the KCl solution was 1.0 M, Ag/AgCl; glassy. Using the electrochemical analyzer, the electrochemical analysis was carried out in a standard three-electrode cell. The following process was used to create the working electrodes: Slurry was created by dispersing 50 µL of Nafion and 5 mg of catalyst powder in 0.4 mL of isopropyl alcohol using a small agate mortar. The mixture was agitated for 12 h to create homogeneous catalyst ink. Next, a slurry of approximately 16 µL was directly injected into a glassy carbon electrode with a surface area of 0.07065 cm2. The electrode was allowed to dry at an ambient temperature for an hour. The potential was scanned at different scan rates in varied amounts of solutions (ethanol and methanol) from 0 to 0.8 V (against Ag/AgCl). Using a frequency range of 100 kHz to 0.1 Hz and a modulation amplitude of 5 mV, electrochemical impedance spectroscopy (EIS) was examined for the current electrodes at an open circuit voltage (0.8 V). The electrocatalytic activity of the samples was studied using polarization curves acquired at room temperature (RT) using linear sweep voltammetry (LSV).

3. Results and Discussion

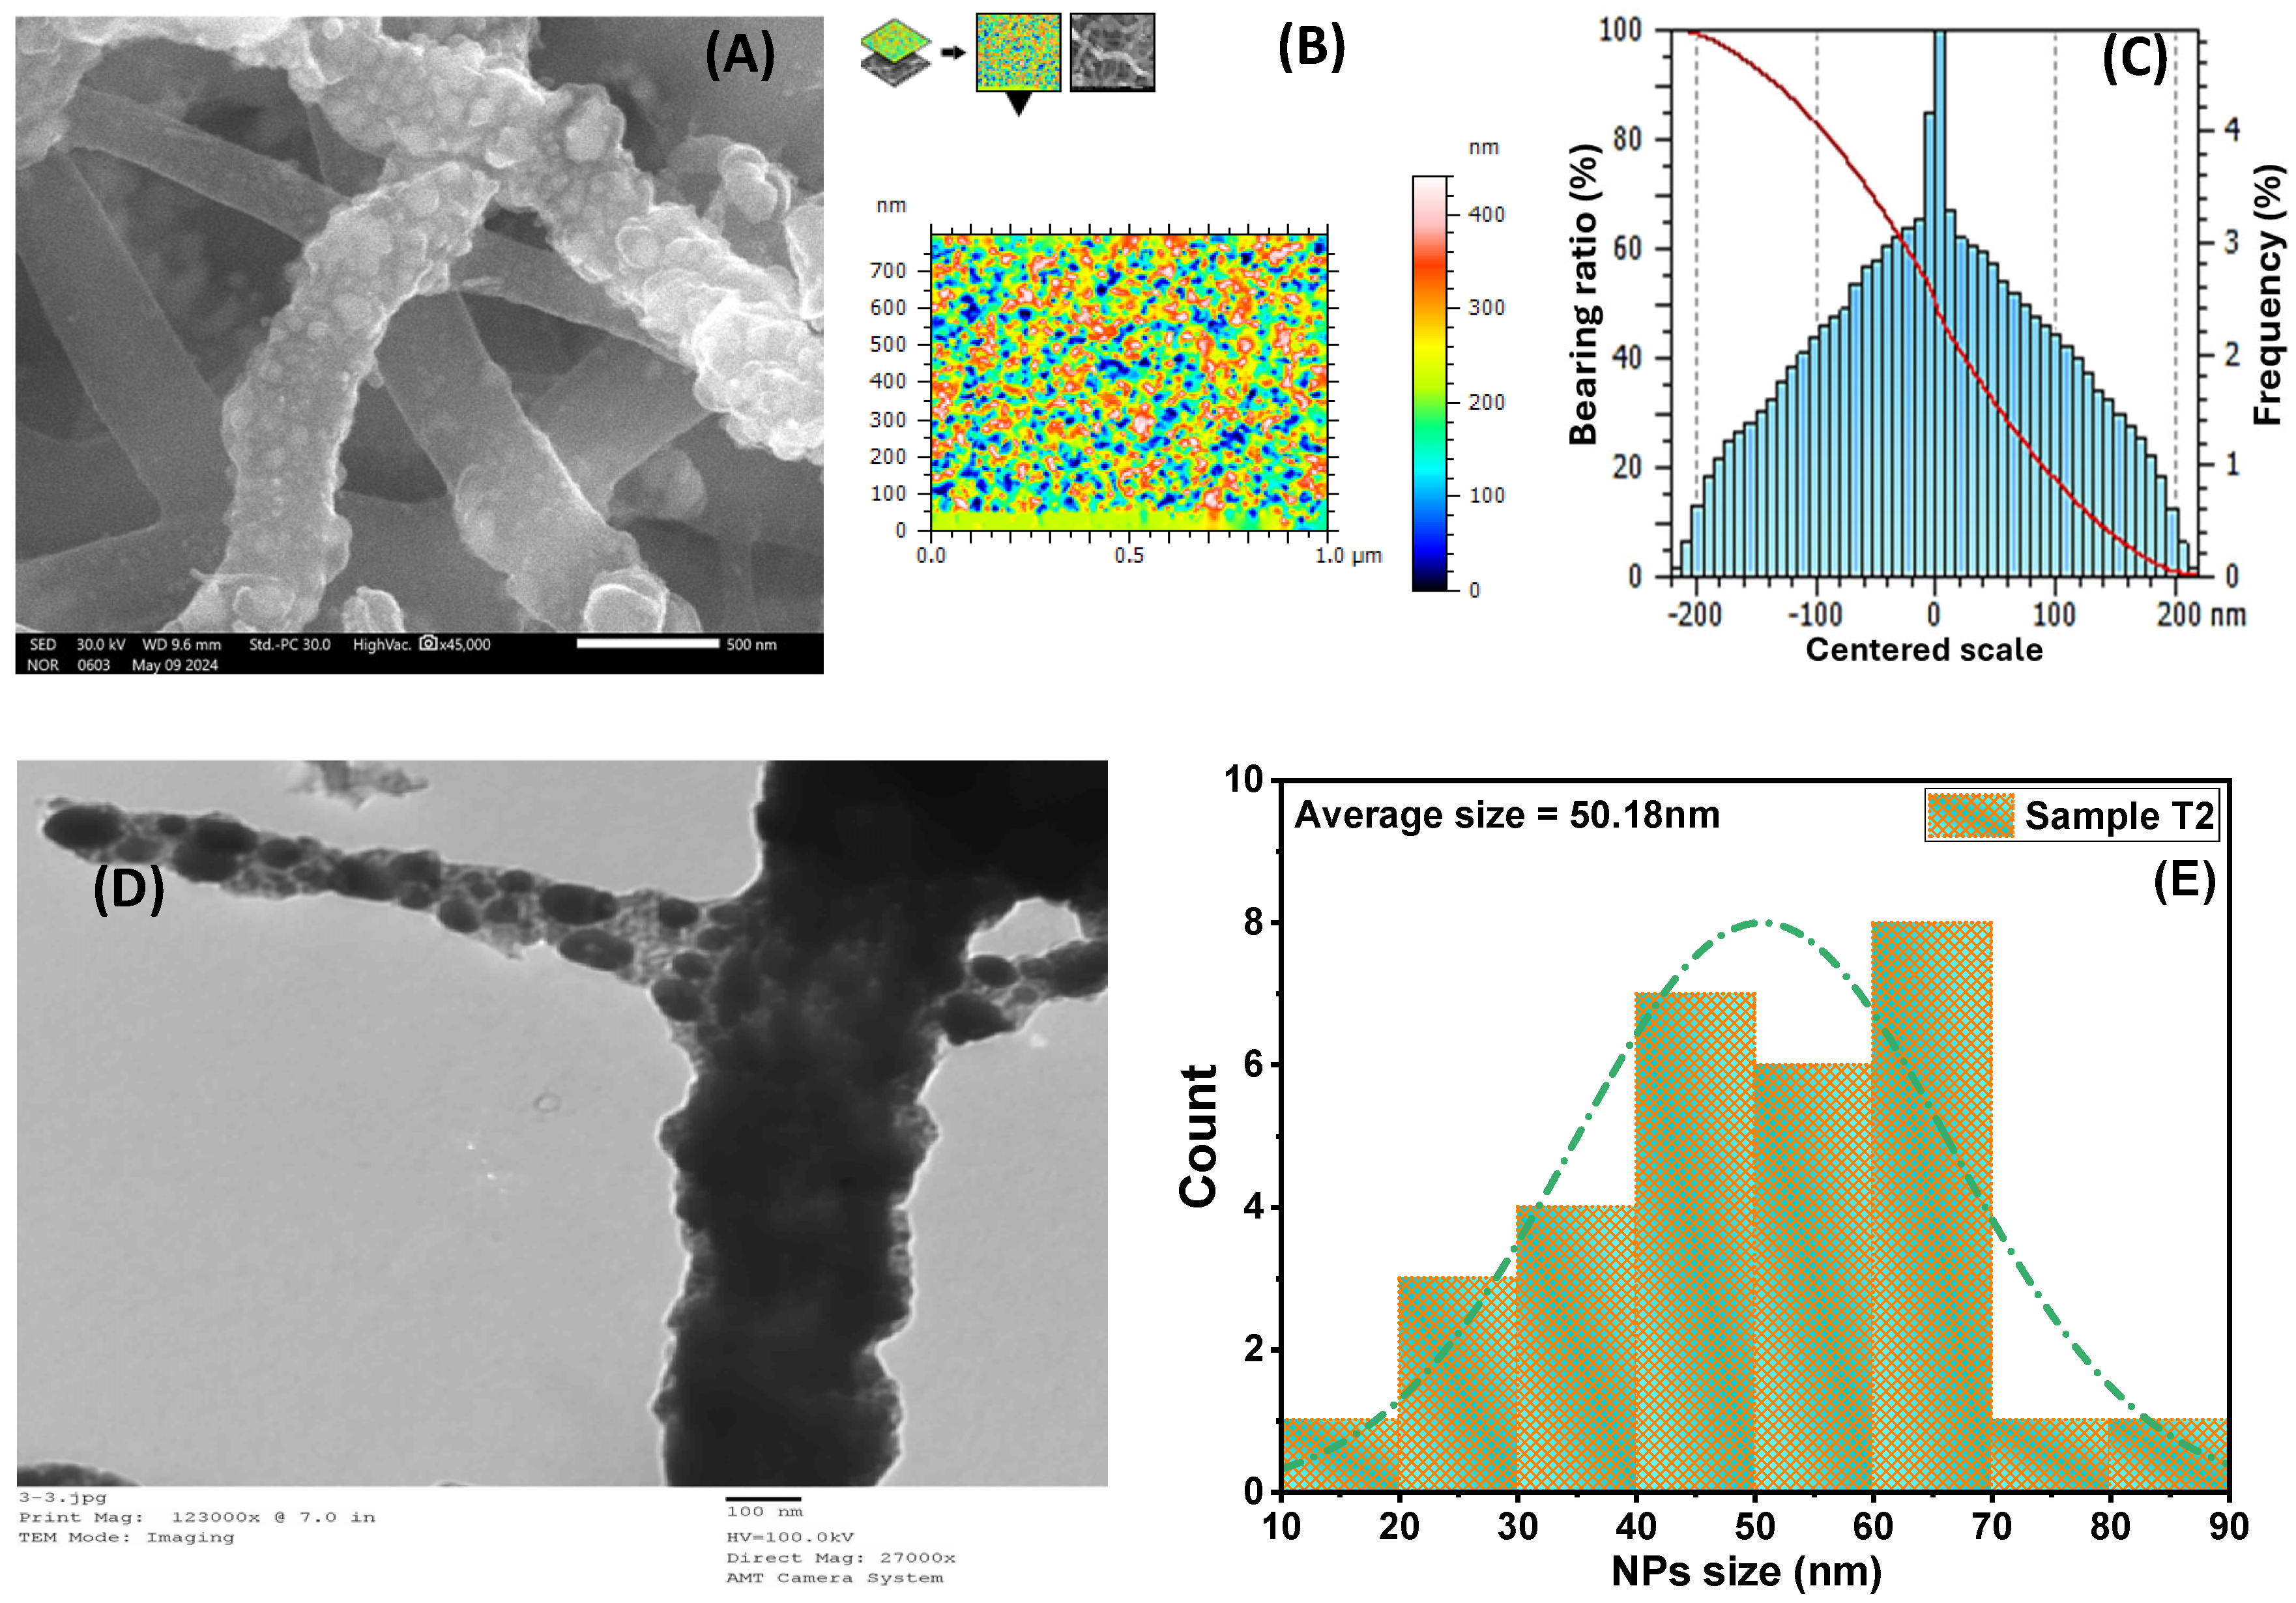
3.1. Morphological Studies

Figure 1A presents SEM images of PVA polymers containing Ni12 Co5(TiO2)3(T2) at various magnifications. As depicted in the images, the achievement of uniform, continuous, and beads-free nanofibers suggests that the carbonization was successfully processed. For all the prepared electrodes, no variance was observed in the morphology of the fiber. The fiber morphologies of the resultant samples differed somewhat in diameter, from 292 to 450 nm. This is defined by the transition metal’s capacity to adhere to the hydroxyl groups in PVA and bond to the carbon following calcination [7,29]. During the catalytic process, the metal nanoparticles’ (NPs’) size may be effectively limited by the CNFs, preventing them from clumping together [30,31]. The connected 3D architecture of the CNF network is considered an appropriate support material, as mentioned in the previous series, since it establishes wide interfaces and interstices between the electrolyte and catalytically active regions, promoting quick electron transport and fuel diffusion [29,32]. Surface morphology has attracted a lot of attention because it can reveal crucial characteristics, such as deformation and heterogeneities, that could influence the material’s application.
The geographical SEM images were analyzed using software called Mountain Map®9.0. Figure 1B displays a three-dimensional topographical representation of a surface, highlighting intricate features and variations in height, which are essential for analyzing surface roughness and morphology. This figure provides a comprehensive overview of surface characteristics, which are pivotal in a lot of applications where the functionality and performance of materials are often dictated by their surface properties. Figure 1C shows the Abbott–Firestone curve and sample depth histogram. This figure displays a histogram of the bearing ratio against a centered scale, revealing the distribution of surface heights across a specified range. The Abbott–Firestone curve’s vertical axis is graduated in depths, and its horizontal axis is graduated in percentages of the total population, with a developed area of 0.8005 µm2.
The TEM technique can be used to analyze the size and distribution of the metal nanoparticles on the CNFs. The TEM picture of sample T2 demonstrated that the NPs were dispersed nearly uniformly across the carbon nanofiber surface. As shown in Figure 1D,E, the nanoparticles’ average size was approximately 50.18 nm.

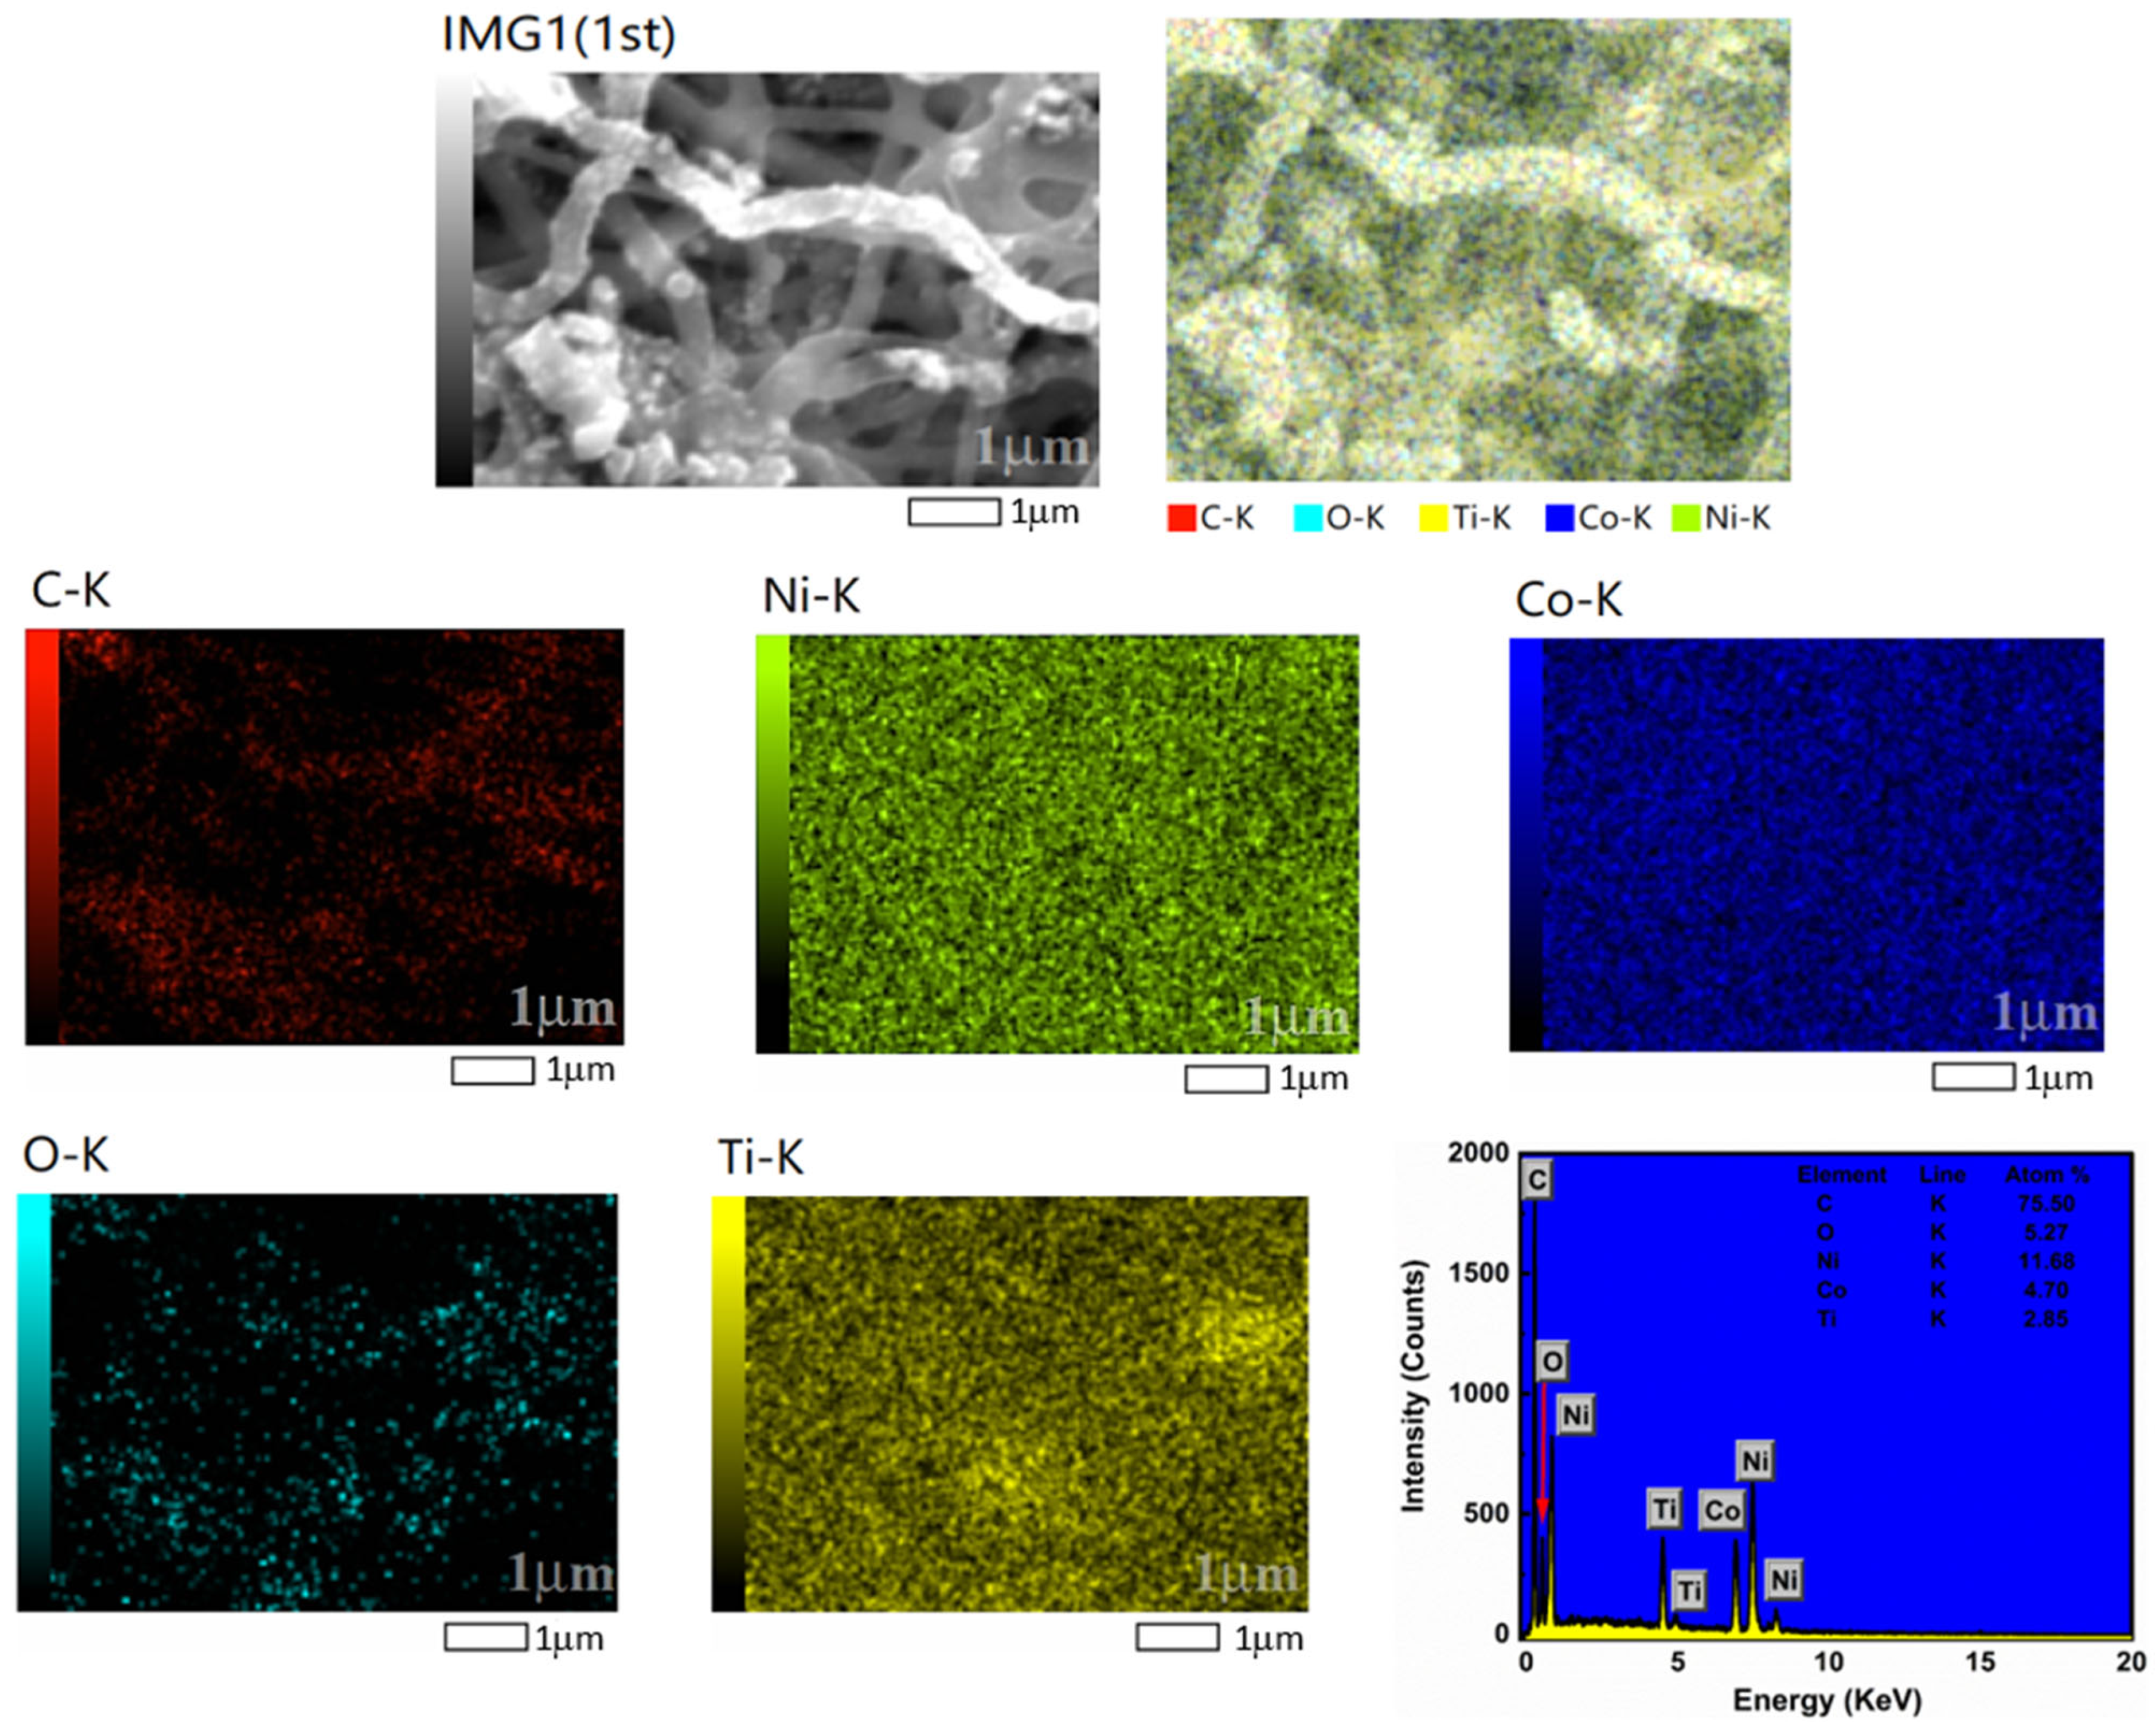
3.2. Elemental Analysis

The SEM picture and mapping for sample T2 are exhibited in Figure 2. It indicates that the carbon was dispersed uniformly and thickly as nanofibers across the entire sample. Moreover, the images of elemental recording in Figure 2 revealed that the only nanoparticles included are Ni, Co, and TiO2. No other pollutants were present. This is because the carbonization process creates a carbon content that enables the d-block metal to be drawn to the OH groups in PVA. Grinding the samples resulted in transforming some of the fibers into small particles close to nano-size, which led to their interference with the nano-size minerals. This caused the unclear distribution to appear in the mapping images. However, the images indicate the presence of the elements present in the structure, which is clear in the combined image. The distribution ratios of the elements in the structure were deduced from the EDX.
The EDX spectrum of the Ni-Co-TiO2/CNFs sample offers an in-depth insight into its elemental composition, as shown in Figure 2. A significant peak for carbon, located around 0.3–0.4 keV, constitutes an impressive 75.50% of the sample, highlighting the important role of carbon nanofibers (CNFs) as both a structural and conductive matrix within the composite. The oxygen detected, represented by a peak at approximately 0.5 keV and making up 5.27% of the composition, implies the presence of titanium dioxide (TiO2) and may also indicate surface oxidation or hydroxylation processes. Nickel, characterized by peaks in the 7–9 keV range and accounting for 11.68% of the sample, plays a crucial role as a catalytic material, enhancing the electrochemical activity of the composite. Cobalt appears in the 7–8 keV range at 4.70%, adding to the overall catalytic properties despite its lower concentration. Titanium is identified in the 4–5 keV range, comprising 2.85% of the sample, which contributes to the structural integrity and works synergistically with nickel and cobalt to enhance catalytic effectiveness. The ratios and intensities of the elements not only illustrate the material’s composition but also suggest a well-balanced distribution of catalytic components, which is essential for optimizing performance in applications like fuel cells. The slight differences between the theoretical ratio and EDX result are attributed to experimental circumstances and calcination treatment.

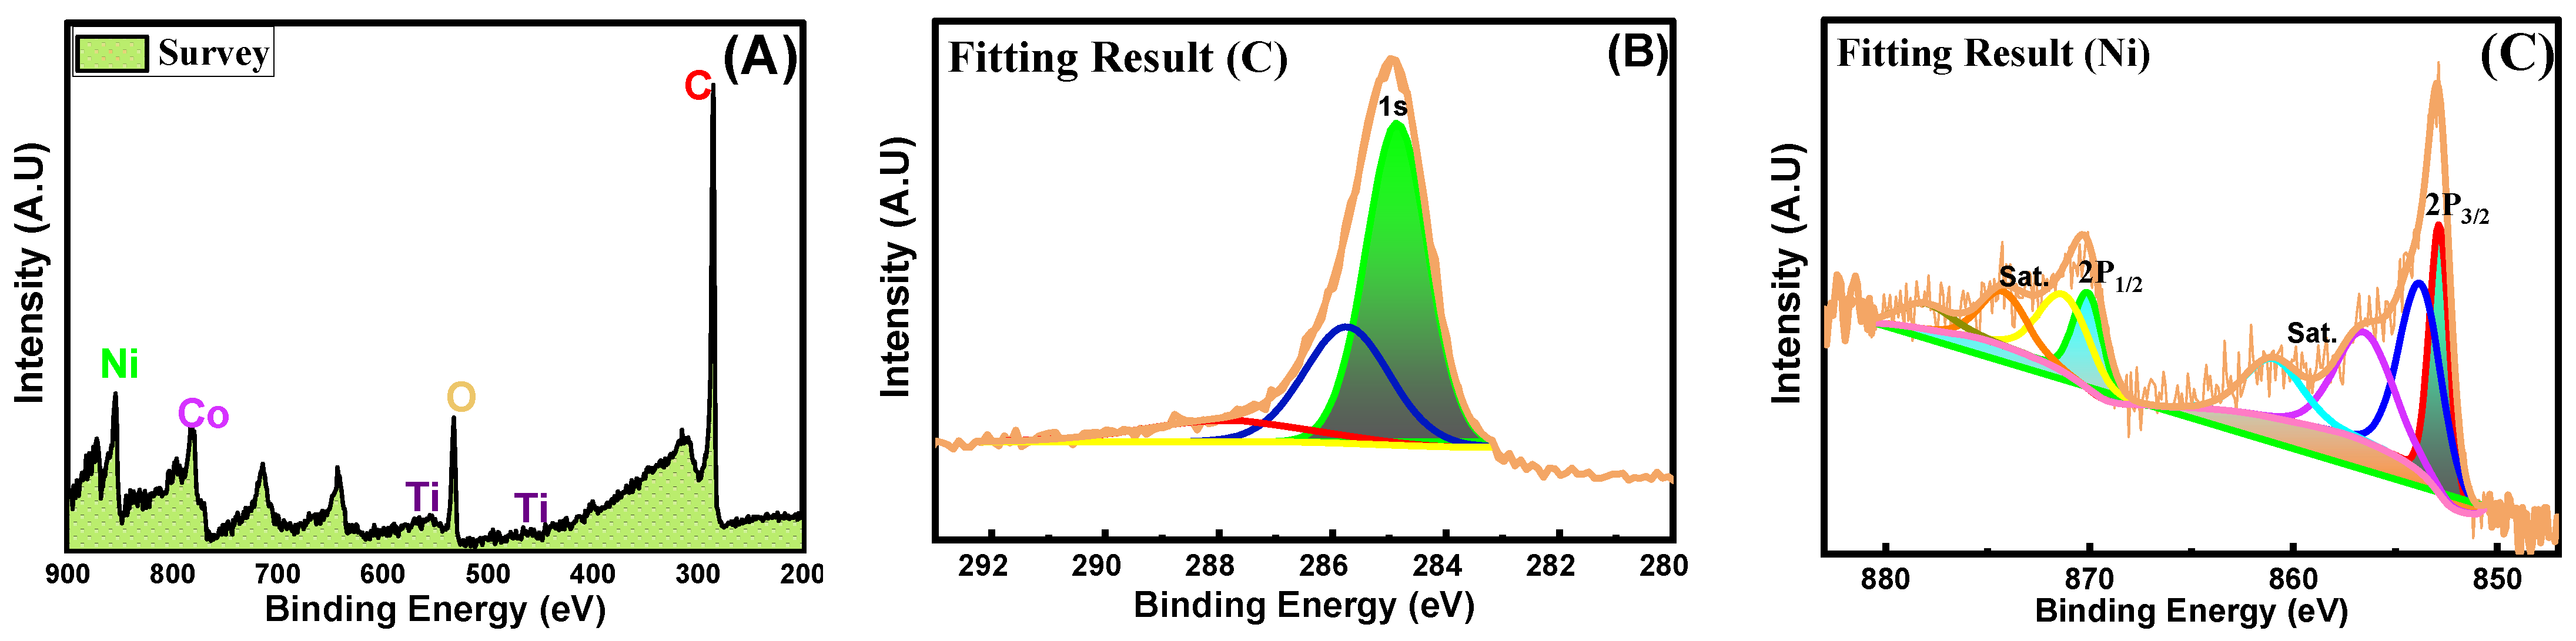
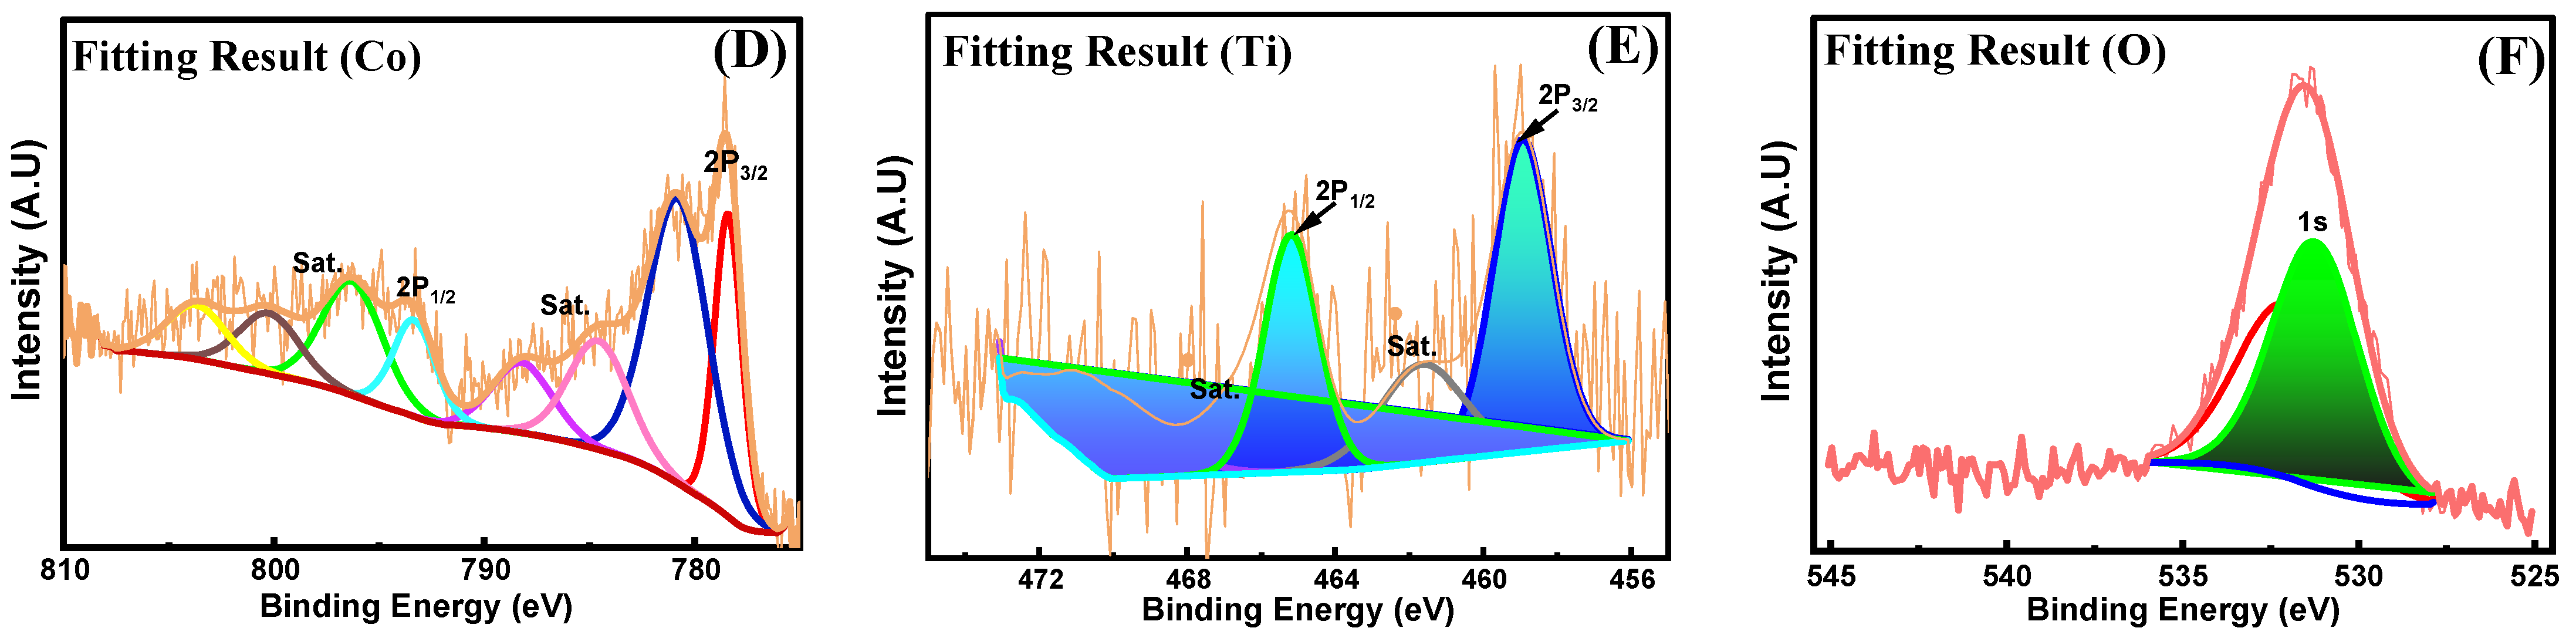
3.3. Surface Chemistry and Valence States of Ni-Co-TiO2/CNF Analysis via (XPS)

X-ray photoelectron spectroscopy (XPS) was conducted to study the chemistry of the surface and the valence state of the incorporated transition metals. Figure 3A shows the XPS survey spectra of Ni-Co-TiO2 alloy NPs/CNFs, which confirms the presence of Ni-2p, Co-2P, C-1s, TiO2-2p, and O-1s. The detailed C-1s XPS spectrum, illustrated in Figure 3B, reveals the presence of a single type of carbon species, indicated by the peak at 284.5 eV. The spectrum presented for the Ni in the NiCoTiO2/C structure in Figure 3C illustrates the electronic states of nickel. The binding energies observed at 853 eV correspond to the 2P3/2 level, and 870 eV corresponds to the 2P1/2 level; these are characteristic of nickel in its various oxidation states, primarily Ni2+ and Ni3+ [8]. The spectrum also displays satellite peaks that are often associated with the multiplet splitting and the presence of different oxidation states or coordination environments of nickel in the material. These satellite features can provide insights into the electronic configuration and interactions within the NiCoTiO2/C matrix. Figure 3D shows the Co XPS spectrum. The binding energies observed at 778.3 eV (2P3/2 level) and 793 eV (2P1/2 level) are characteristic of cobalt in various oxidation states, primarily Co2+ and Co3+ [33]. The energy difference between these peaks suggests the presence of spin–orbit coupling, which is a typical characteristic of transition metals such as cobalt. The spectrum displays multiple satellite peaks, typically linked to multiple splitting and the existence of various oxidation states of cobalt in the material. These satellite features can offer additional insights into cobalt’s electronic configuration and its local environment. The spectra of Ti-2p and O-1s for TiO2 are shown in Figure 3E,F, respectively. From the Ti-2p spectrum, it can be observed that the two peaks reflect the spin degeneracy of the 2p level (2p3/2, 2p1/2) with the binding energies of 458 eV and 465 eV, respectively. Similarly, the spectrum of O-1s is obtained at the binding energy of 531 eV. These values indicate the TiO2 existence [33,34].

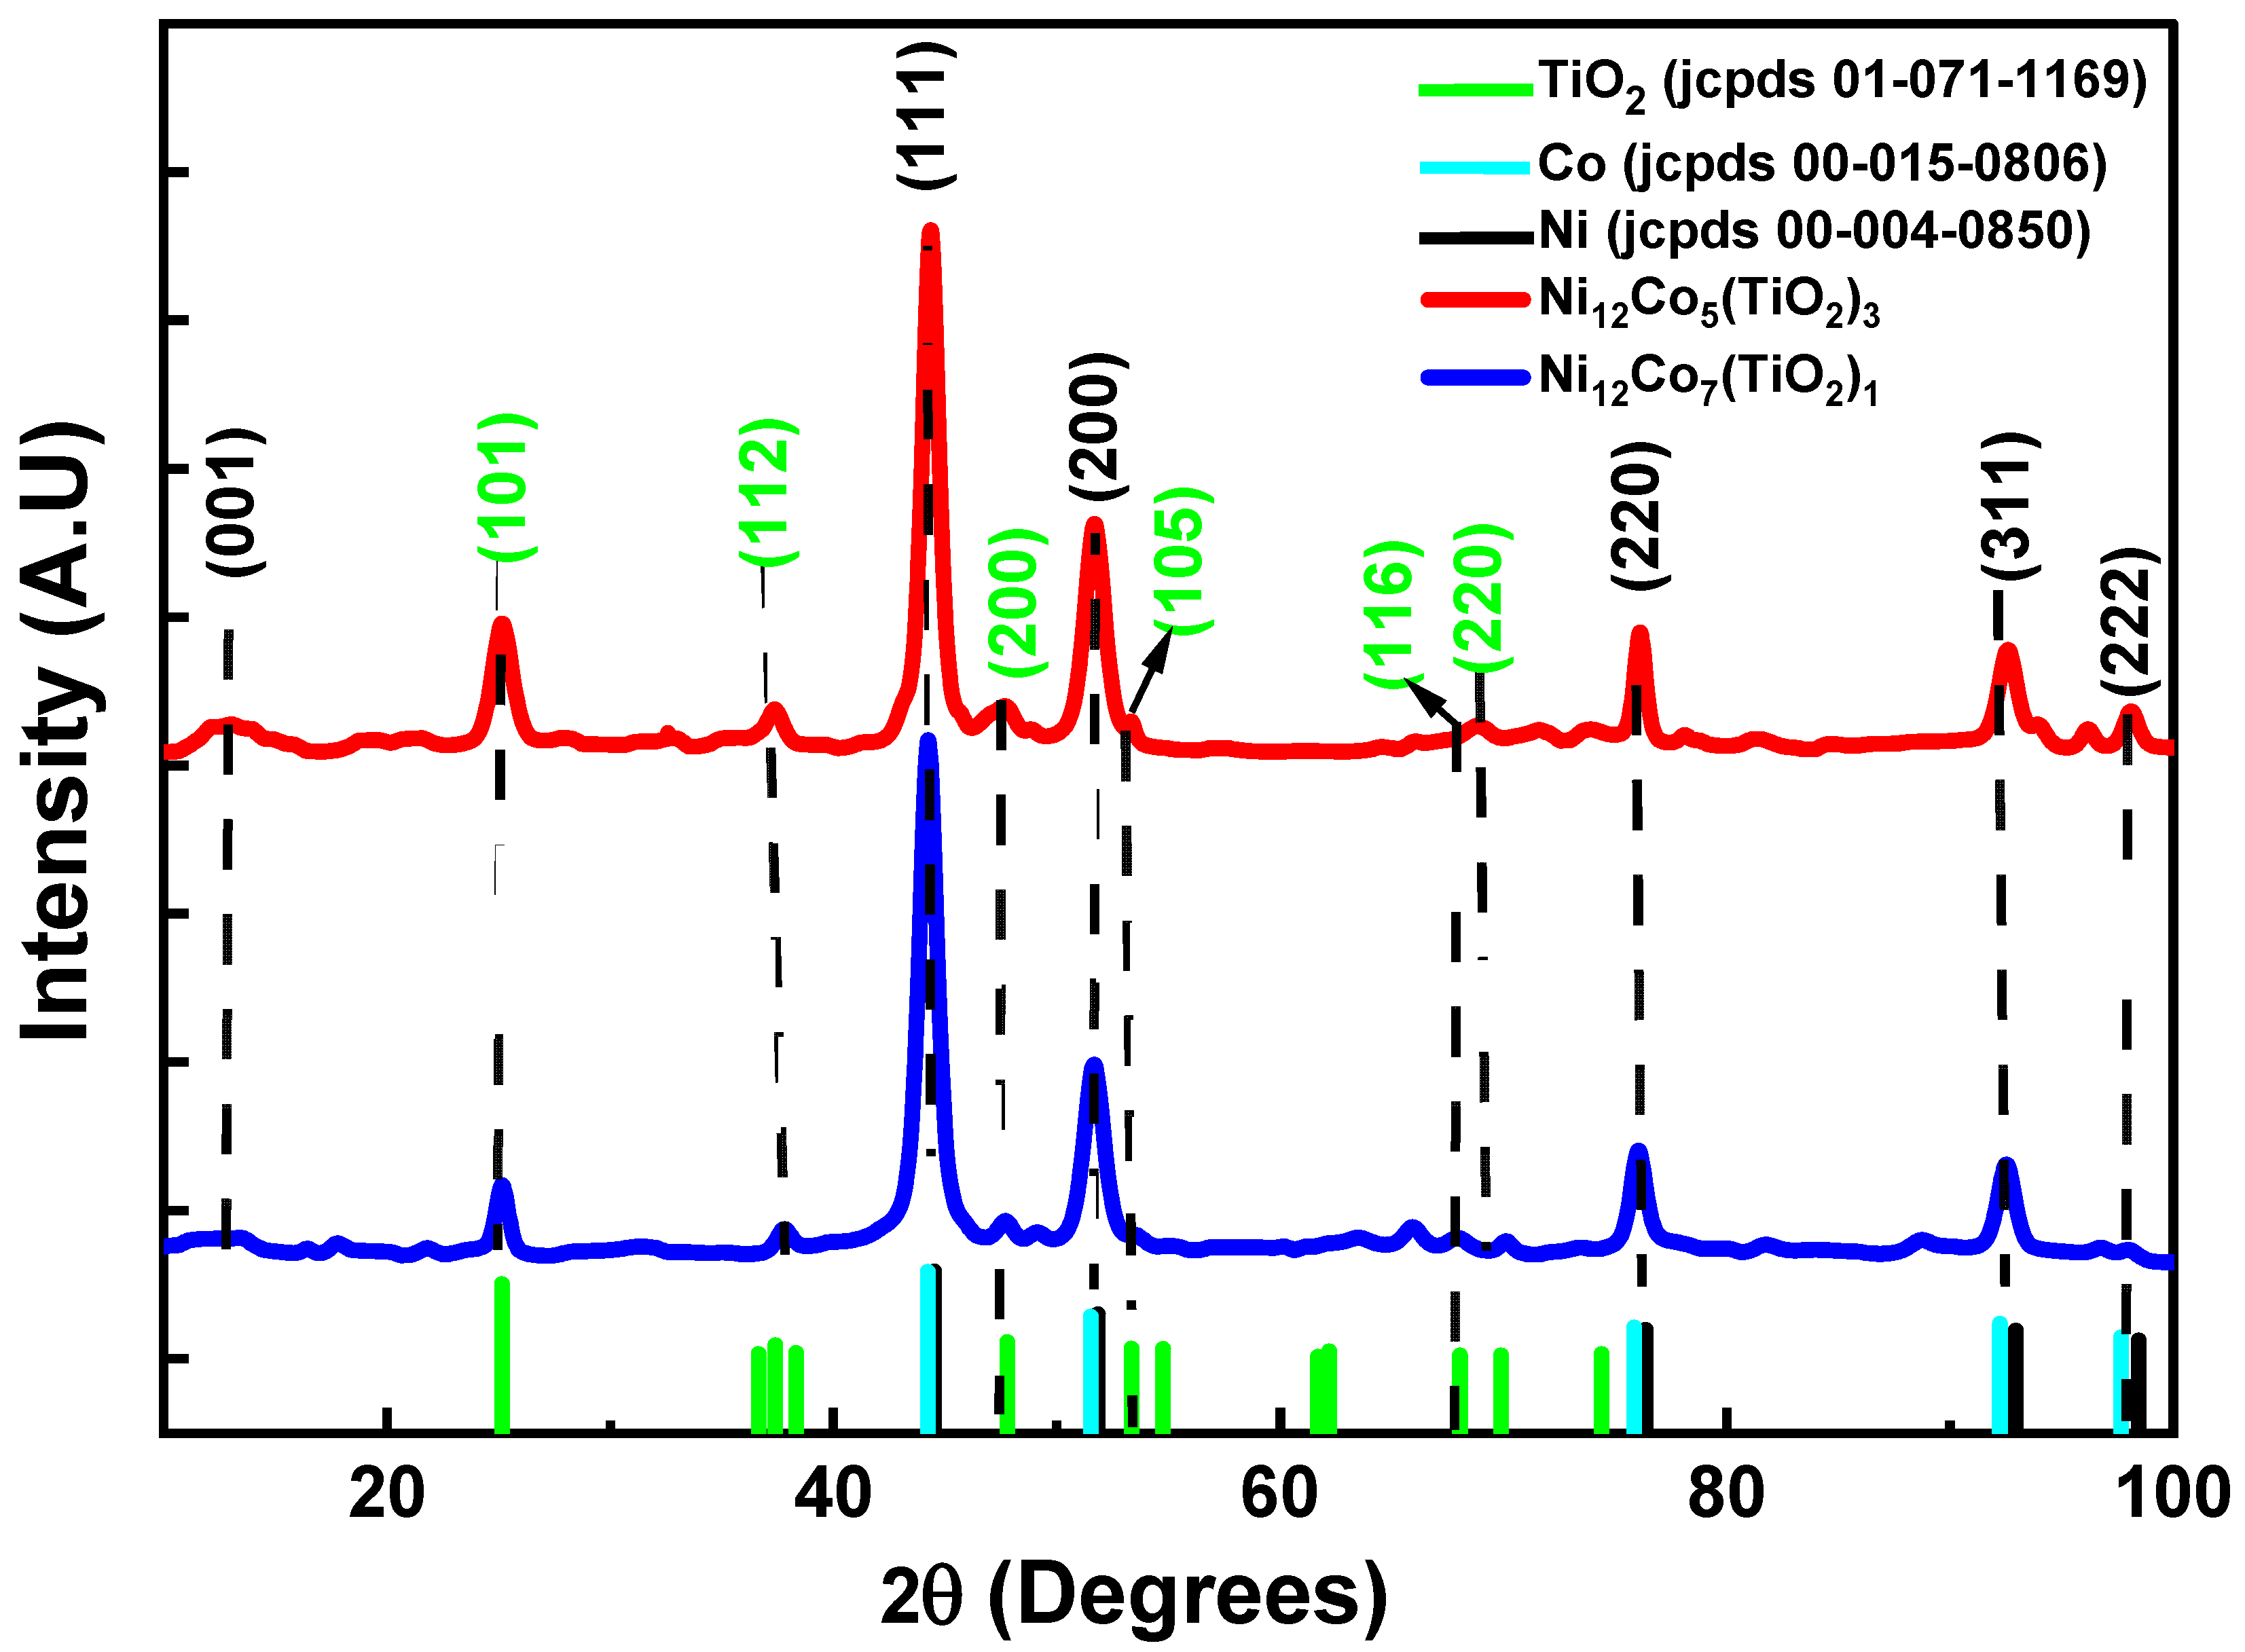
3.4. Characterization of Structure and Evaluation of Phases (XRD)

Using X-ray diffraction (XRD) analysis, it is possible to determine with great confidence both the composition and the crystal structure of the nanofibers after carbonization. According to XRD data, metallic NPs were produced within the NF matrix, as shown in Figure 4. With an FCC nickel crystallite inserted on the NFs’ surface for all the samples, five peaks associated with the (111), (200), (220), (311), and (222) crystal planes can be seen at 44°, 51°, 76°, 92°, and 98° for Ni NPs (JCPDS File No. 04-0850) [7,29,30]. Due to the high ratio of nickel compared to cobalt, the cobalt’s diffraction angles coincide with those of nickel, potentially causing the peaks to become entangled [29]. Due to the following factors, the two metals can form a substitutional alloy: (i) Their adjacency in the periodic table; (ii) their atomic weights (Ni = 58.7 and Co = 58.9) are almost equal, meaning that their atomic sizes are also nearly equal; (iii) the XRD obtained results verify that both metals have an FCC crystal structure; (iv) they have the same valence. Stated differently, in the FCC cobalt crystal, nickel atoms can take the place of cobalt atoms and vice versa. Therefore, Ni and Co nanoparticles, in addition to TiO2, make up the resultant nanofibers. Six distinct peaks are observed at 25.1°, 37.7°, 47.69°, 53.37°, 68.01°, and 76°, corresponding to the Miller indices (101), (112), (200), (105), (116) and (220) planes of the anatase phase of TiO2 (JCPDS File No. 01-071-1169), respectively [35,36,37,38]. These peaks are indicative of the crystalline structure of titanium dioxide (TiO2) nanoparticles (NPs), reflecting their well-defined crystallographic orientations and confirming the successful synthesis of the material. The small peak observed at 12.5° coincides with the diffraction peak (001) of GO (graphene oxide) [39,40,41], while the standard (002) peak of graphite, typically observed around 26° in the literature for carbon nanofibers (CNFs), may coincide with a peak from TiO2.
The XRD analysis approves that the composite’s nanoparticles are only present in the metallic phase; no hydroxide phases can be seen in the XRD patterns. The crystallite size (D) was computed using the Scherer formula (Equation (1)) [32,42]:
D = K λ β c o s θ
The total surface area of a solid material per mass unit is known as its surface area (SA). It depends on the material’s structure and porosity, as well as the size of the particles. The following formula was used to determine the SA values [43,44].
S A = 6000 D ρ
The parameter (D) stands for the crystalline realm average size (nm), while (ρ) represents the density of the prepared samples. The results obtained of both surface area and crystallite size are illustrated in Table 2. It was observed that there is a difference between the surface area values calculated from X-rays and those calculated from TEM. This may be due to some clusters of nanoparticles agglomerating with each other where the carbonization process was carried out at high temperatures.

3.5. Electrooxidation Study

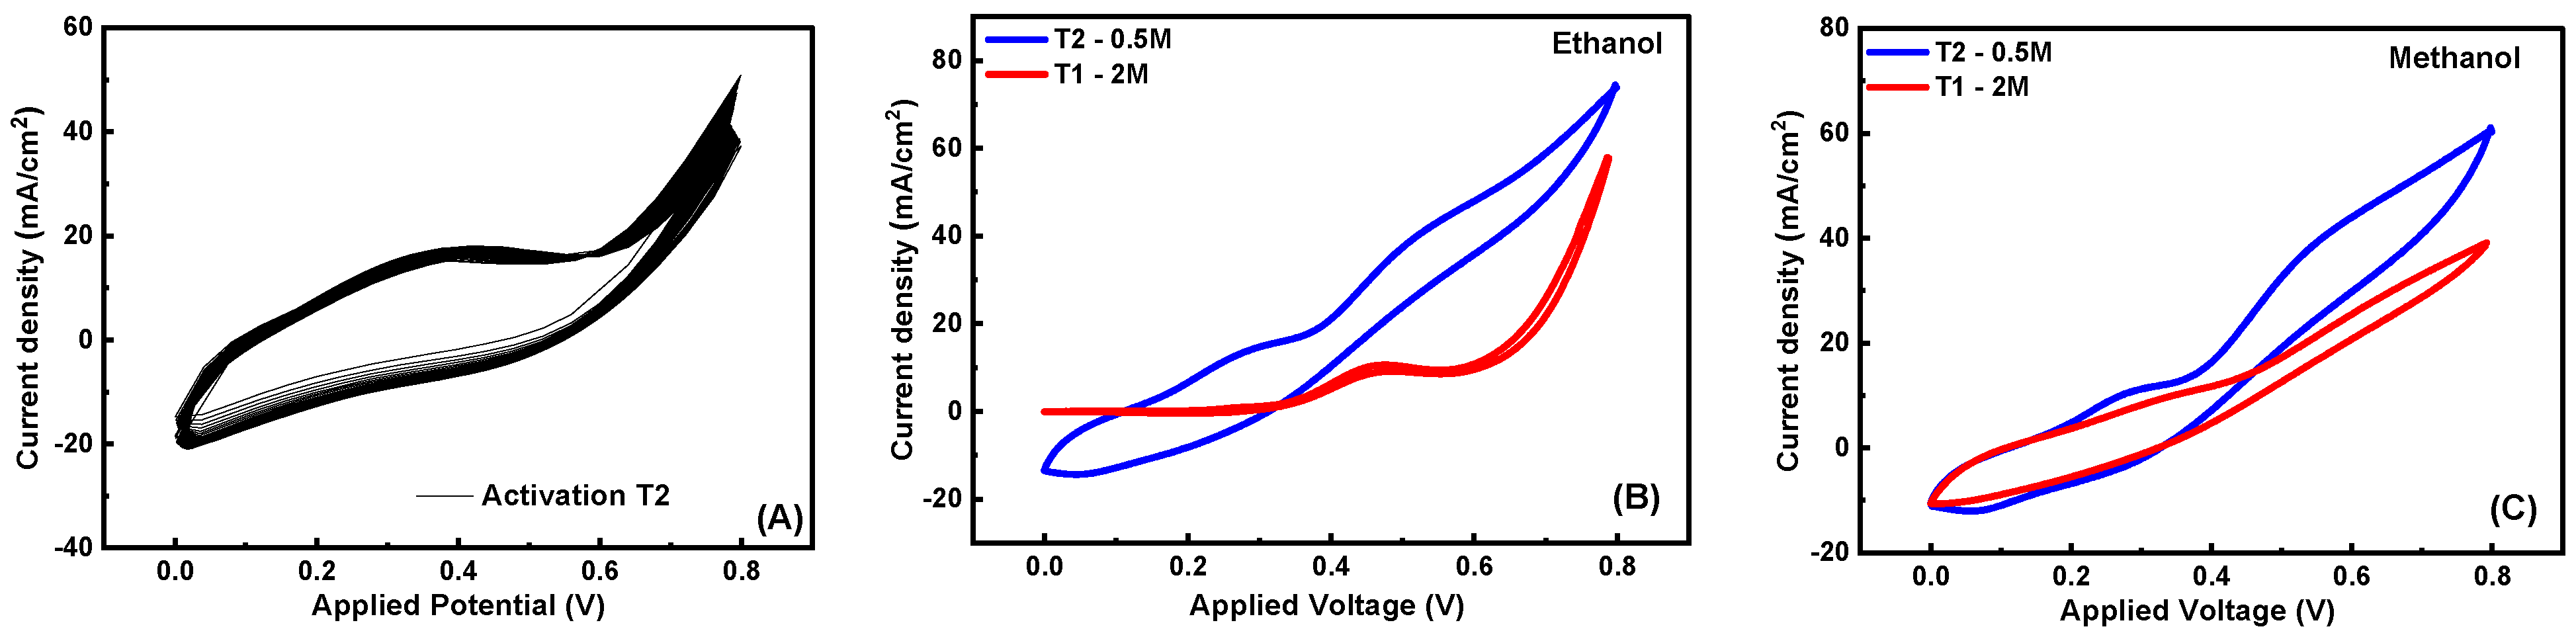
3.5.1. Surface Activation

A layer of NiOOH was created on the surface of the catalyst by activating the prepared samples in KOH (1.0 M) utilizing a standard three-electrode cyclic voltammetry setup. The CV diagram of the nanofiber formulations in sample T2 in a KOH solution of 1.0 M concentration is displayed in Figure 5A. At an SR of 100 mV/s, a potential (0 to 0.8 V) scanning was used to initiate polarization (versus Ag/AgCl as a reference electrode). A thicker layer of NiOOH, in accordance with the Ni (OH)2/NiOOH transition, may be gradually developed when the No. of potential sweeps is increased; this will raise the current density values. An increase in the number of potential sweeps can lead to an advancement in the development of a thicker layer of NiOOH, which corresponds to the Ni(OH)2/NiOOH transition and increases the current density values [45].

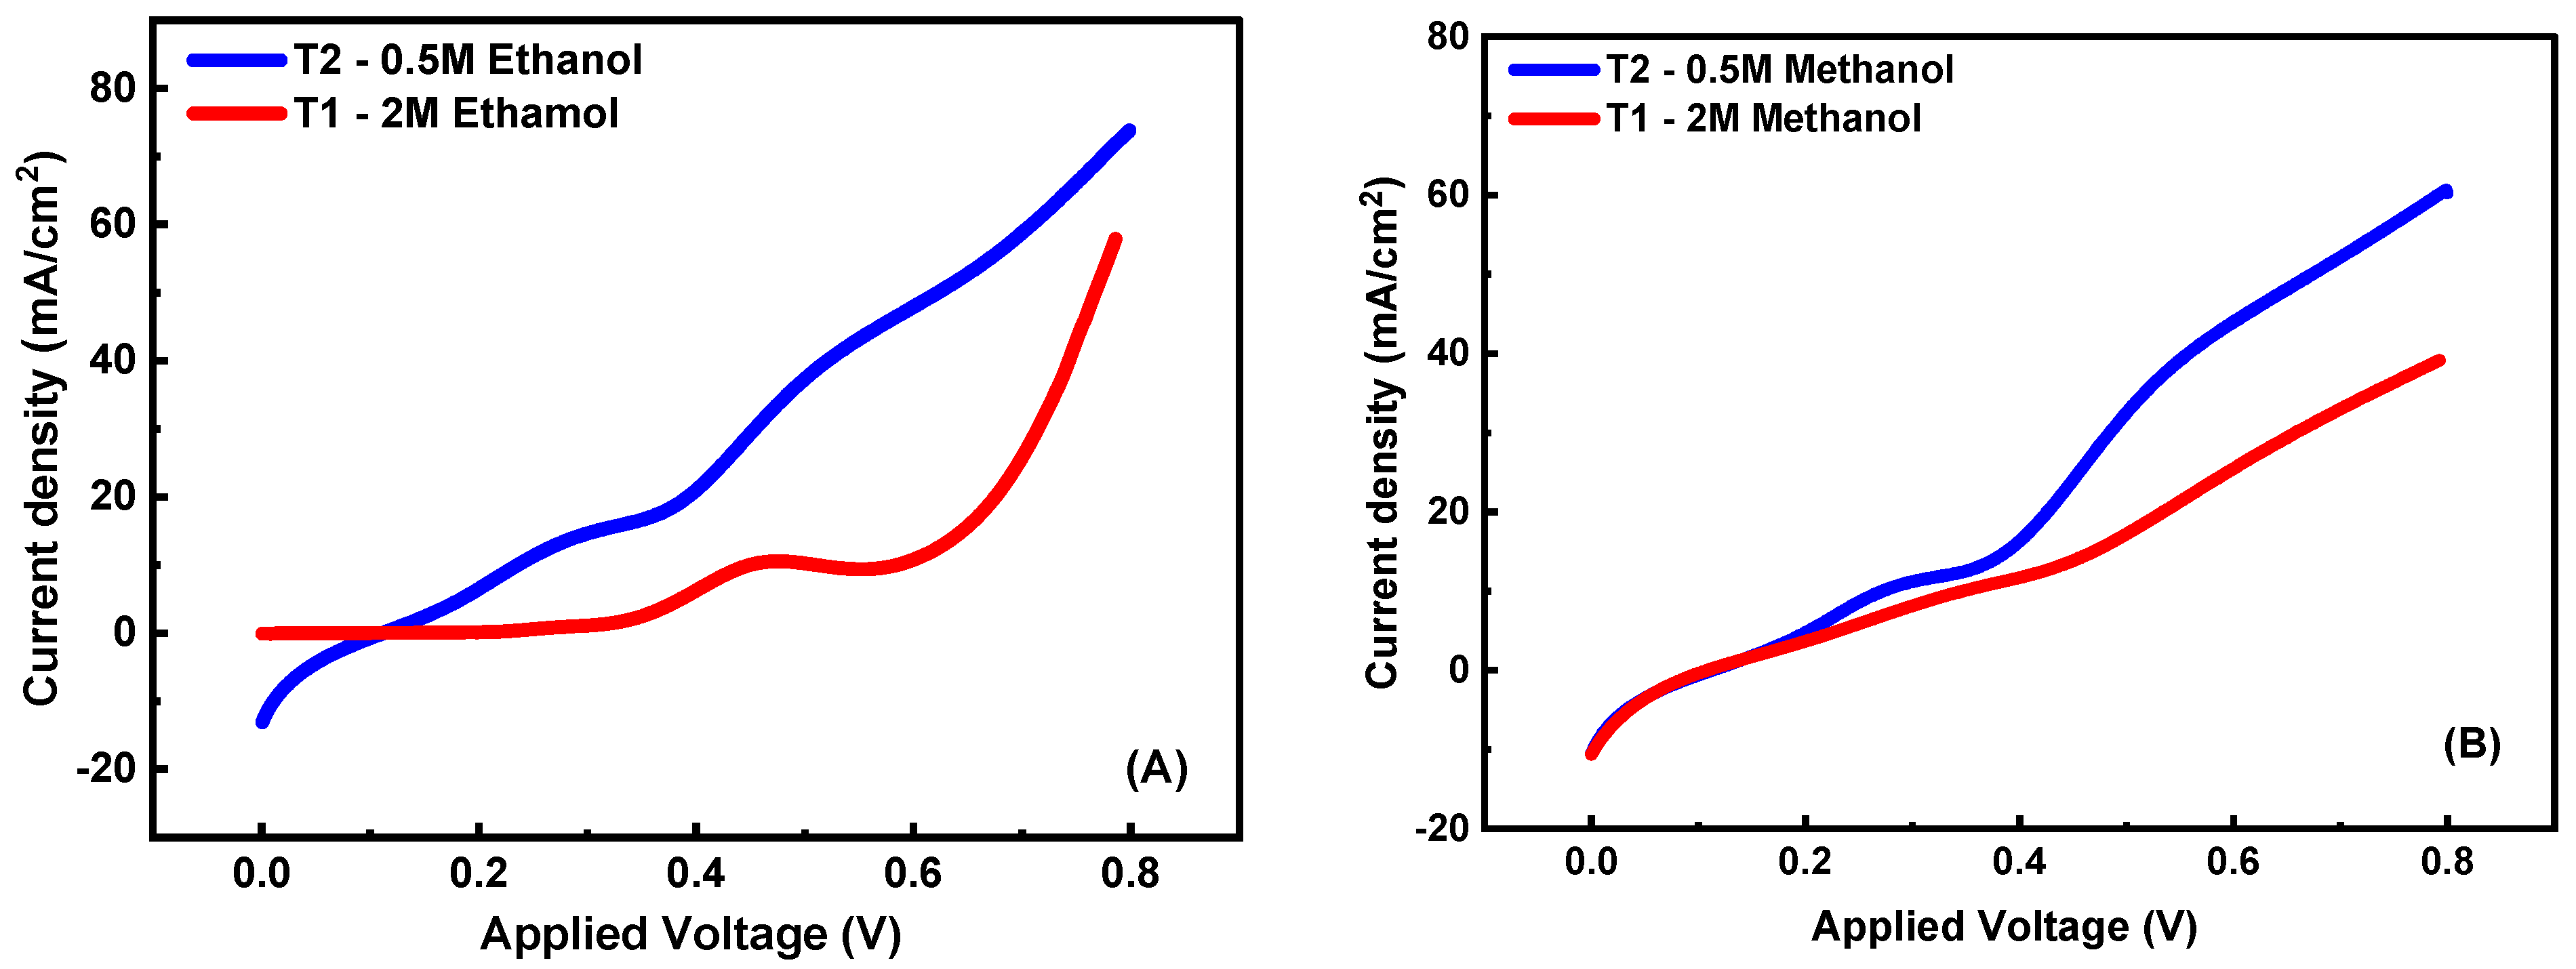
3.5.2. Sample Composition Effect

T1 and T2 samples were subjected to sequential cyclic voltammetry utilizing three electrodes: a platinum wire as the working electrode (CE), a GC coated with the generated electrocatalyst as the working electrode (WE), and an electrochemical cell with an Ag/AgCl as the RE. The effect of TiO2 on the electrochemical activity in 0.5 M ethanol and methanol oxidation was obtained as shown in Figure 5B,C in a KOH solution of 1.0 M concentration at ambient temperature and 100 mV/s SR for T1 and T2, respectively. The addition of TiO2 shows a considerable increase in EC activity, as revealed by the current values. In Figure 5B, the current density of the oxidation peak extension (JPE) values at 0.5 M ethanol concentration increased from 57.8 mA/cm2 to 74.2 mA/cm2 as the ratio of TiO2 was increased from 1% to 3%. For 2 M methanol, as shown in Figure 5C, the current density (JPE) value was raised from 38.69 mA/cm2 to 60.39 mA/cm2 as the TiO2 ratio increased from 1 to 3 wt.%. The substantial synergistic effect of Ni, Co, and TiO2 is responsible for the increased electrocatalytic activity and decrease the molarity of fuel from 2 M to 0.5 M in ethanol and from 3 to 2 M in methanol of Ni-Co-TiO2 towards the oxidation of ethanol and methanol, as demonstrated by the results [43,46]. Notably, increasing the TiO2 ratio from 1% to 3% results in a significant increase in current density; this is due to the synergistic effect of Ni, Co, and TiO2. Here, the synergistic effect resulted in a greater peak current density for the NiCoTiO2/CNFs electrode. This may be explained by the quick elimination of CO, which made it easier for methanol to adsorb on both new and regenerated catalyst sites. This finding is consistent with research on other metal oxides that supported Pt for the MOR [47,48]. The literature has repeatedly underlined the significance of active surface oxygen atoms for the efficient oxidation of CO at lower potentials [49]. It seems that the MOR activity is enhanced by a significant contact between the closely spaced NiCo and TiO2 particles.

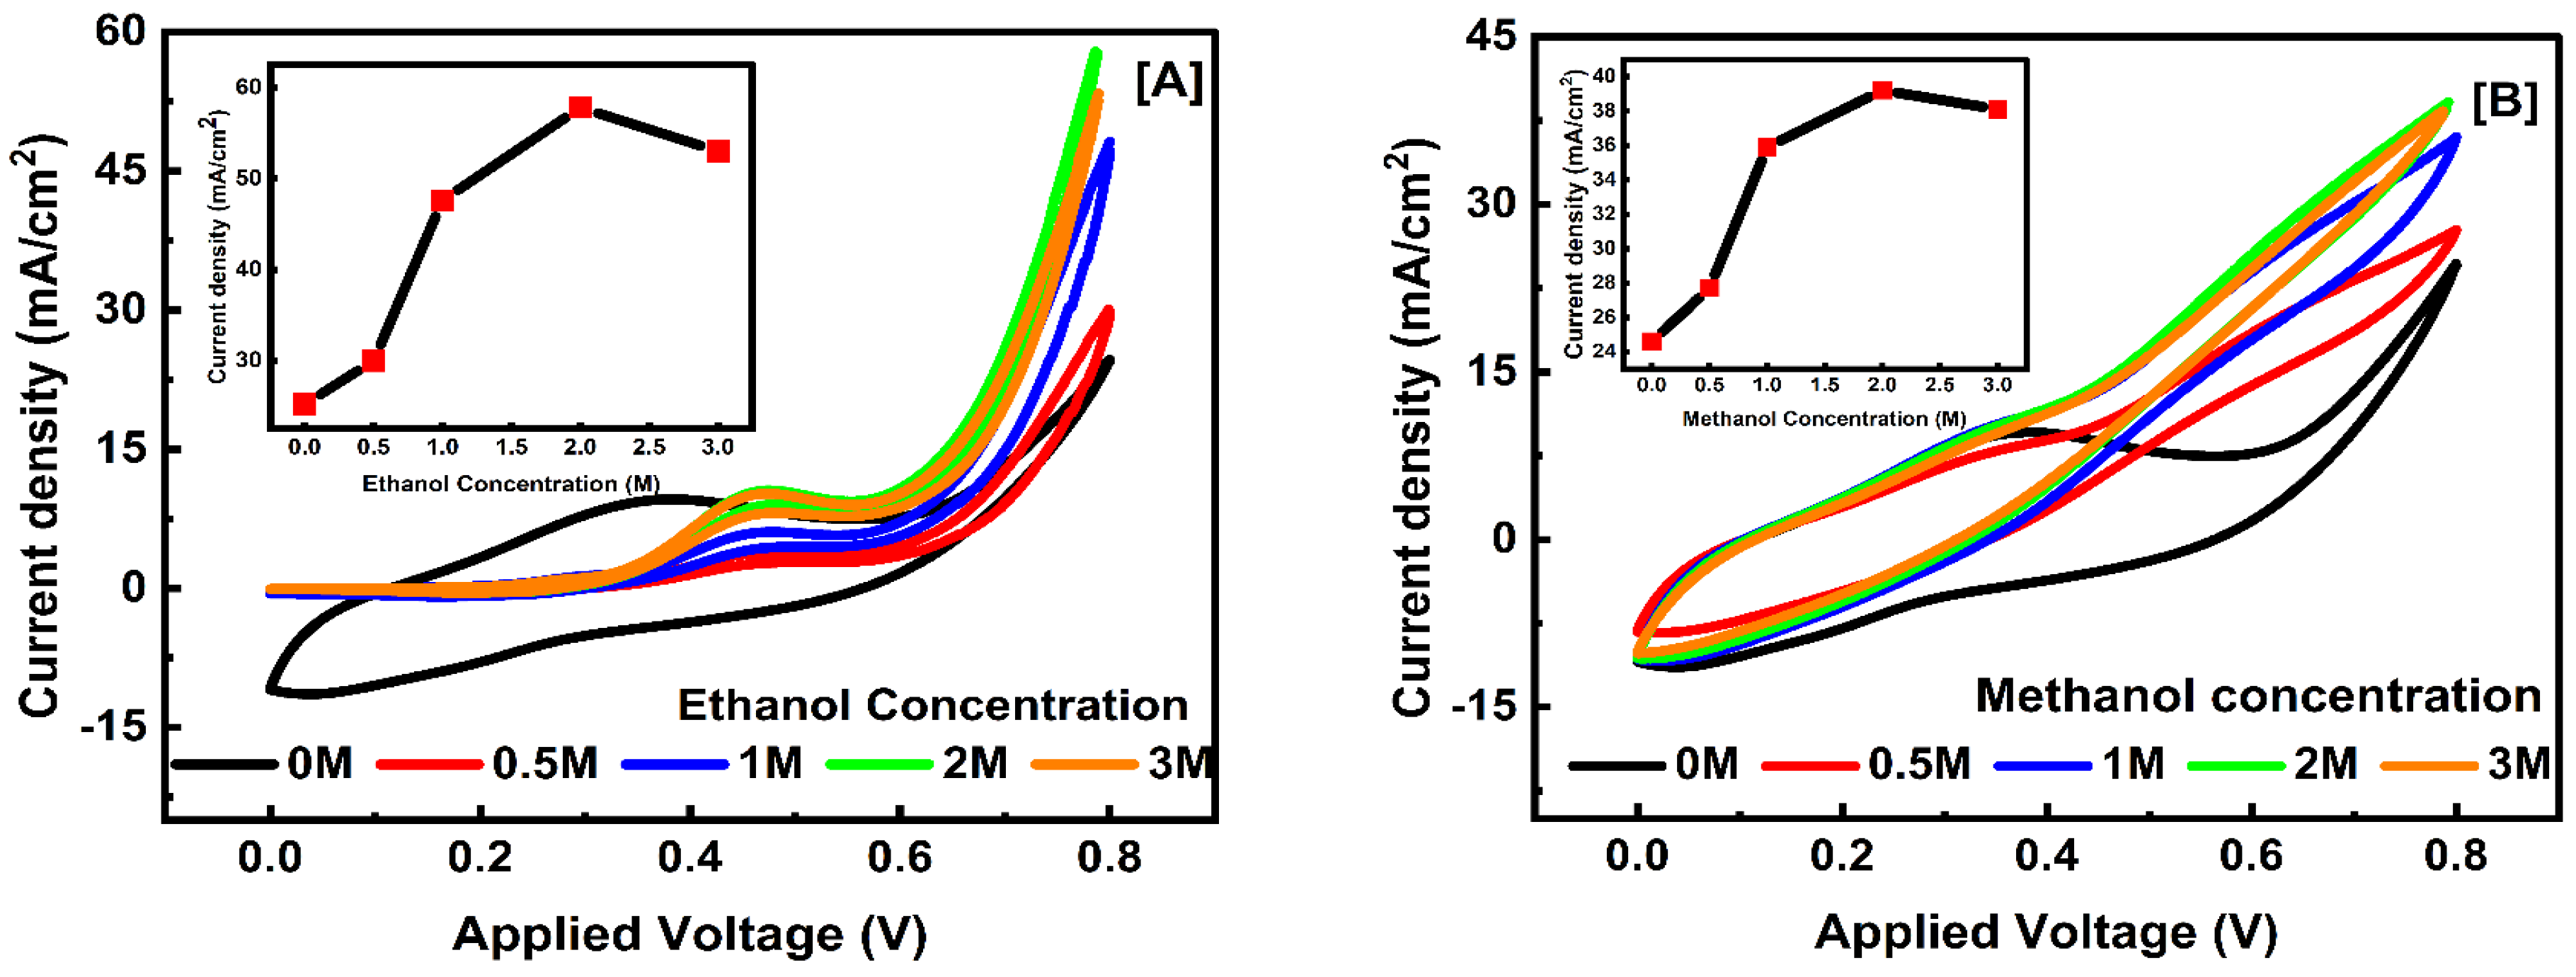
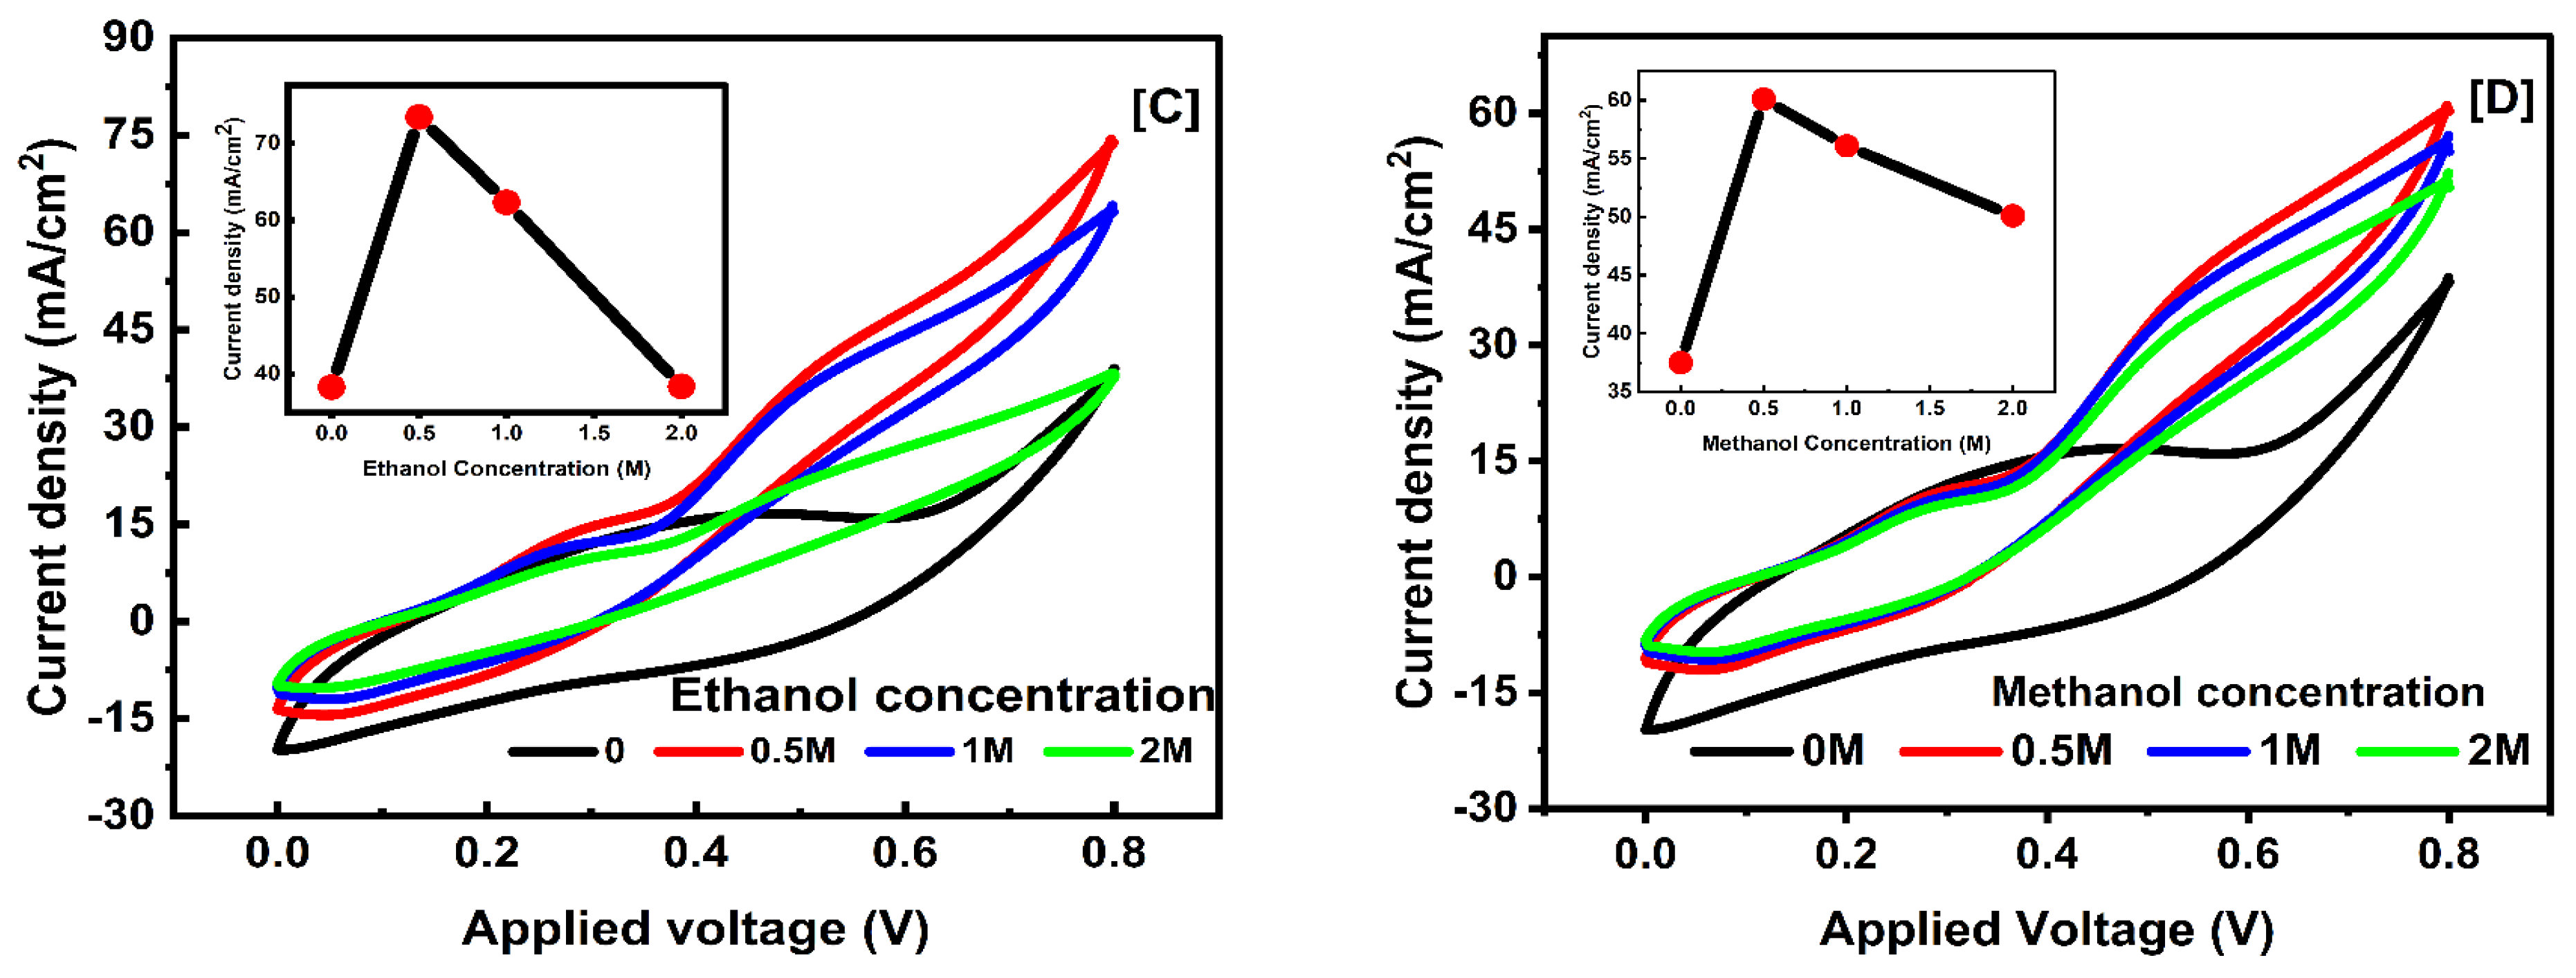
3.5.3. Concentration Effect of Electrolyte

With an applied potential range of 0:0.8 V and a 100 mV/s SR, the CV for the produced samples in ethanol and methanol is shown in Figure 6. The electrooxidation process between ethanol and methanol is based on the oxidation peak rising and shifting towards a positive potential as the methanol concentration rises, as shown in Figure 6A–D, which shows the relationship between the current density and potential in 0.5, 1, and 2 M methanol concentrations for the samples. As the ethanol concentration rises for sample T1, Figure 6A demonstrates that the current densities (JP) of the oxidation peaks rise from 3.77 mA/cm2 at 0.483 V to 10.5 mA/cm2 at 0.469 V. It is also observed that the value of JPE is increased from 30.08 to 57.80 mA/cm2 at 0.798 V by increasing the concentration of ethanol from 0.5 to 2 M. A concentration of 3 M was taken into consideration to prove that the sample was saturated with fuel and that oxidation had completely occurred. On the other hand, as shown in Figure 6B, increasing methanol concentration resulted in increased current densities (JP) of the oxidation peaks from 7.96 mA/cm2 at 0.352 V to 10.86 mA/cm2 at 0.372 V. Also, the increased methanol concentration led to an increase in the value of JPE from 27.55 to 38.69 mA/cm2 at 0.796 V. A concentration of 3 M was taken into consideration to prove that the sample was saturated with methanol and the oxidation had completely occurred, and the (JPE) decreased. In accordance with the presented data, the greatest value of the current density for sample T1 was obtained at 2 M ethanol and methanol concentrations. For the sample T2, Figure 6C shows that JP increases as the ethanol concentration decreases. The current density (JP) of the oxidation peaks show improvement; for 2 M, 1.0 M, and 0.5 M of ethanol, they are 21.87 mA/cm2 at 0.499 V, 39.33 mA/cm2 at 0.539 V, and 42.11 mA/cm2 at 0.539 V, respectively.
Additionally, at 0.799 voltages, the obtained values of JPE were 38.01, 63.00, and 74.21 mA/cm2 corresponding to ethanol concentrations 2, 1, and 0.5 M, respectively. For T2, Figure 6D shows how JPE grows with reducing methanol concentrations. As listed in Table 3, for 2 M, 1.0 M, and 0.5 M of methanol, the improvement in the JP value of the oxidation peaks is 32.43 mA/cm2 at 0.533 V, 37.32 mA/cm2 at 0.549 V, and 41.87 mA/cm2 at 0.576 V, respectively. Furthermore, at 0.799 V, the JPE value increased from 51.03, 55.80, to 60.39 mA/cm2 when decreasing the molarity. This demonstrates the improved electrochemical activity of sample T2 in ethanol. The reactants and intermediate components’ adsorption, which is followed by dissociation phases, is the foundation of the ethanol electrooxidation process. First, during the dehydrogenation of ethanol, the O-H link was broken, forming ethoxy species (CH3CH2O). Then, acetaldehyde (CH3CHO) was produced by transforming these species. Acetate ions (CH3COO), acetyl (CH3CO), methane, acetone (CH3COCH3), crotonaldehyde (CH3CHCHCHO), various hydrocarbons, carbonate ions (CO3−2), CO2, and CO are the products of several processes that oxidize the acetaldehyde that is formed [45,46]. Increasing the percentage of titanium oxide from 1% to 3% led to an increase in the JPE and JP values and reduced the use of the fuel concentration ratio from 2 M to 0.5 M. The sample T2 is distinguished by enhanced chemical catalysis and a decrease in fuel usage, leading to reduced fuel consumption in the cell.

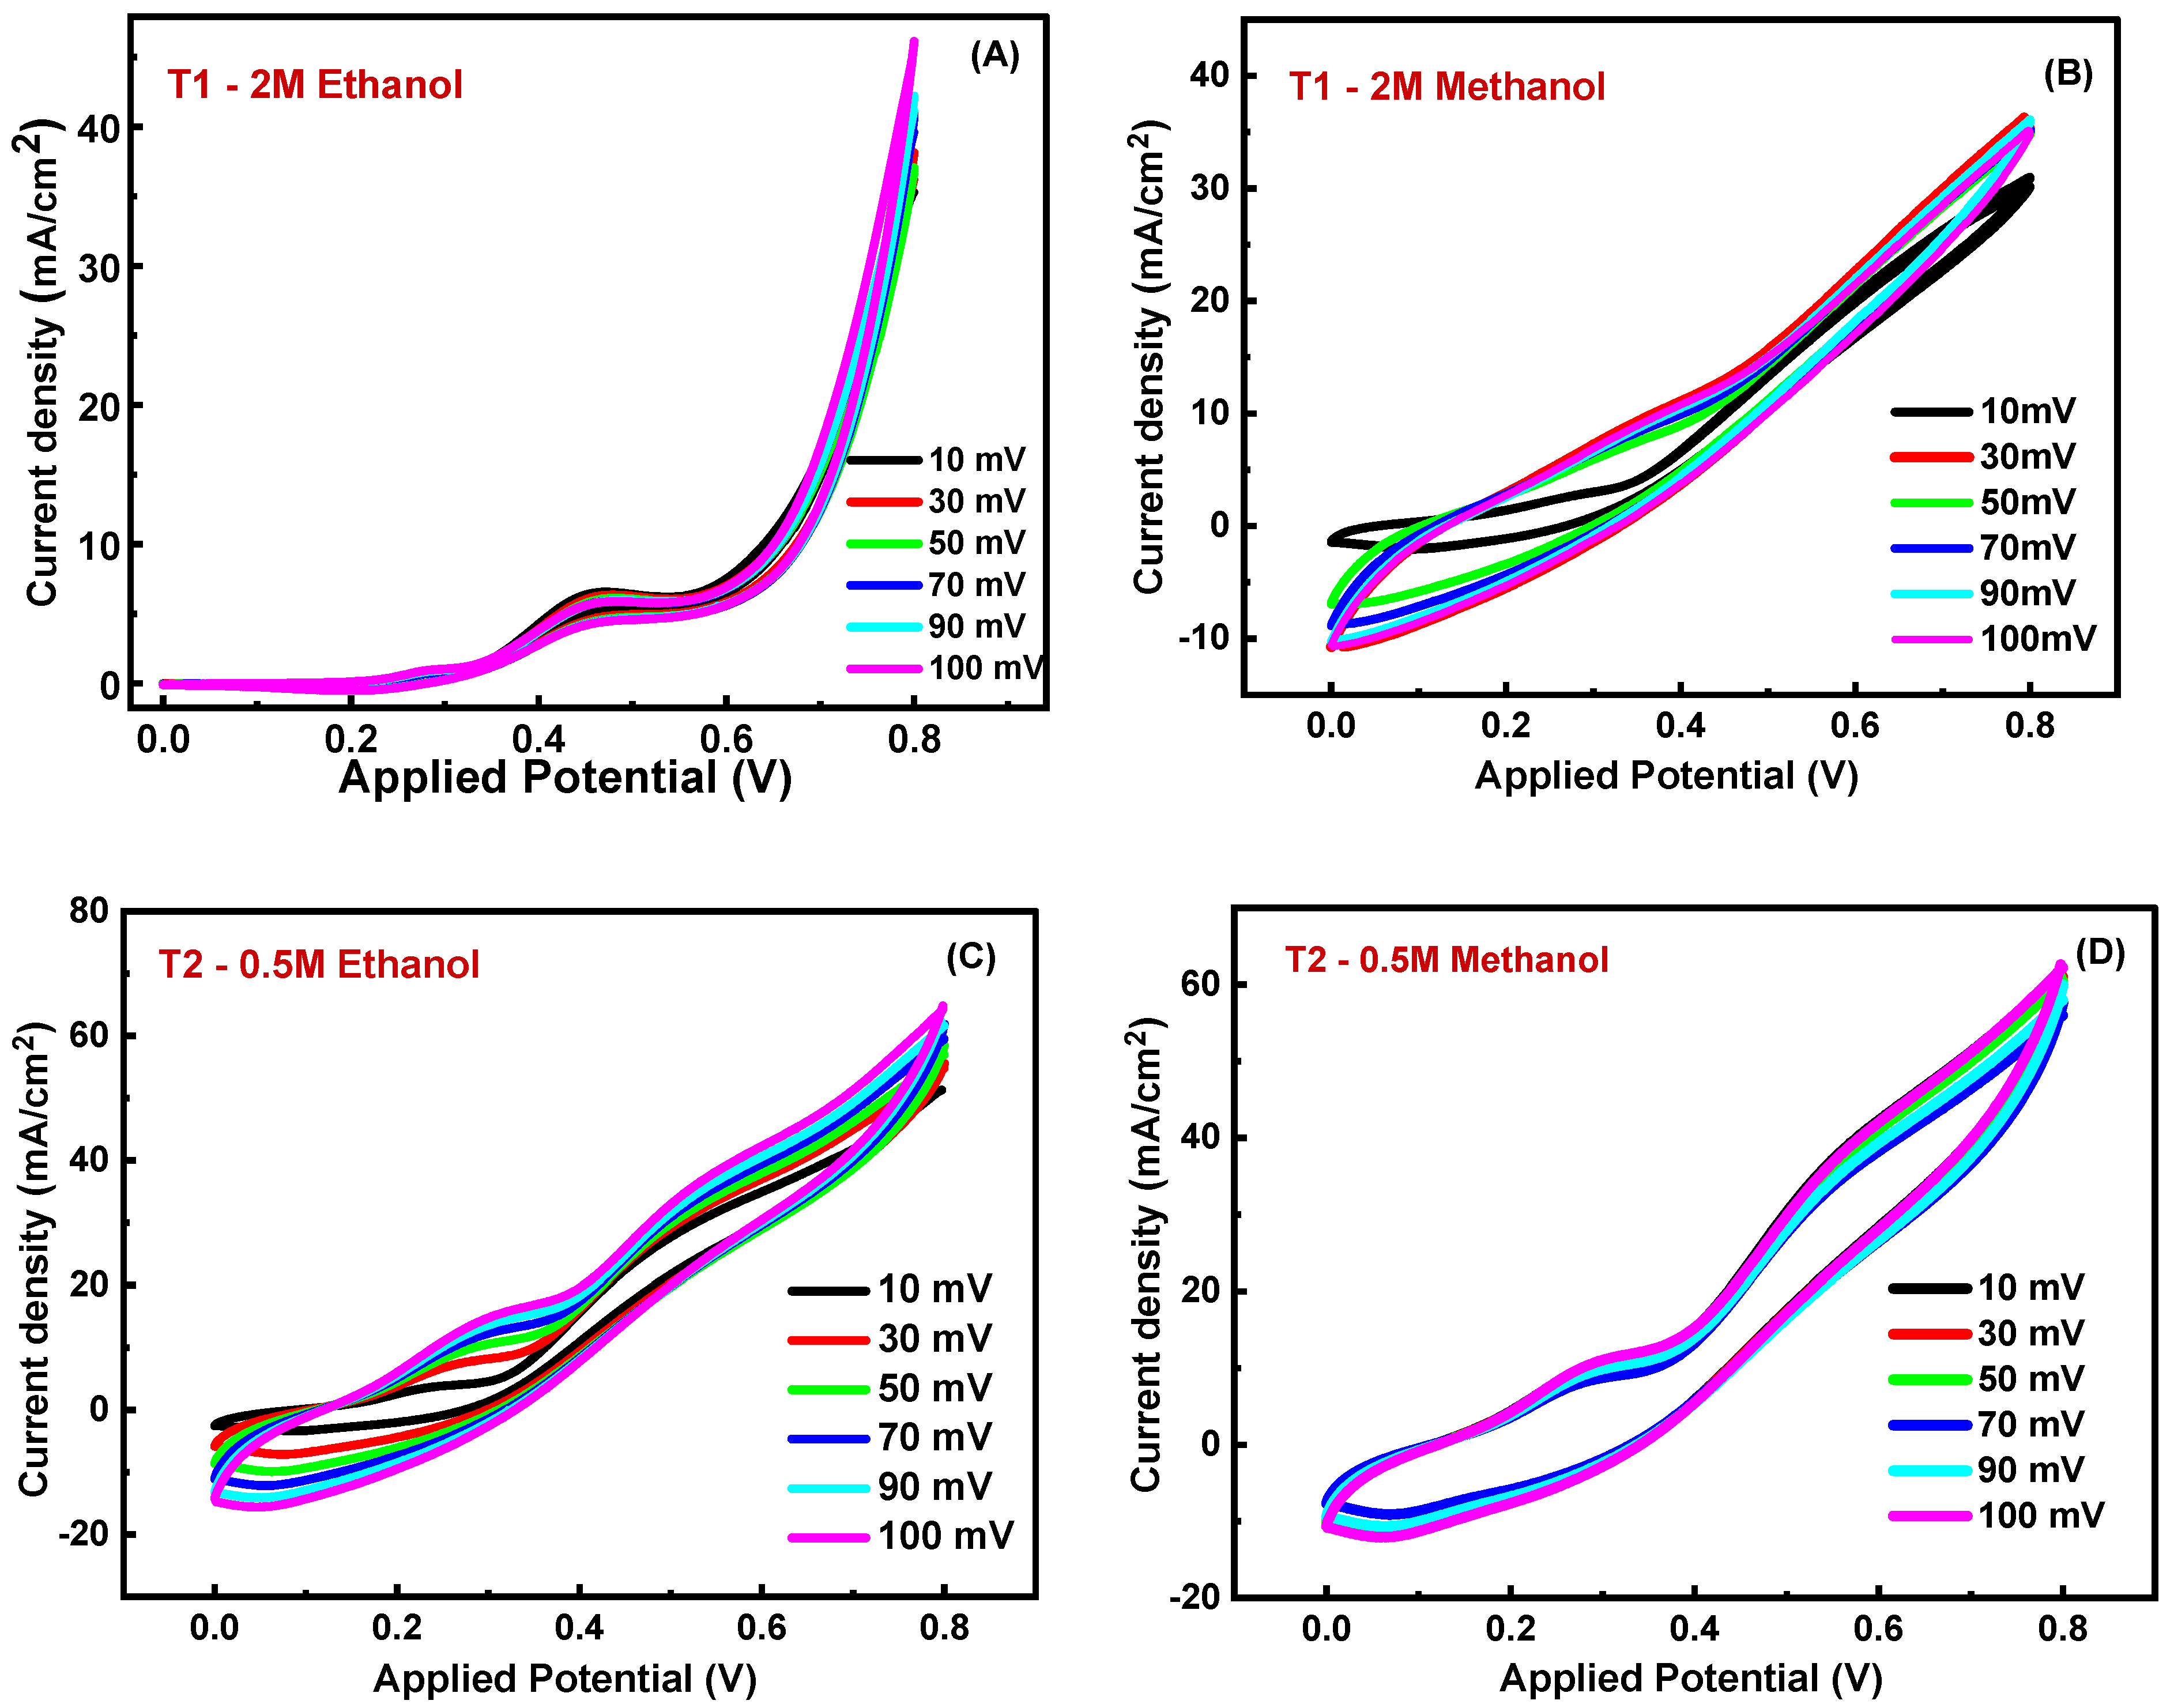
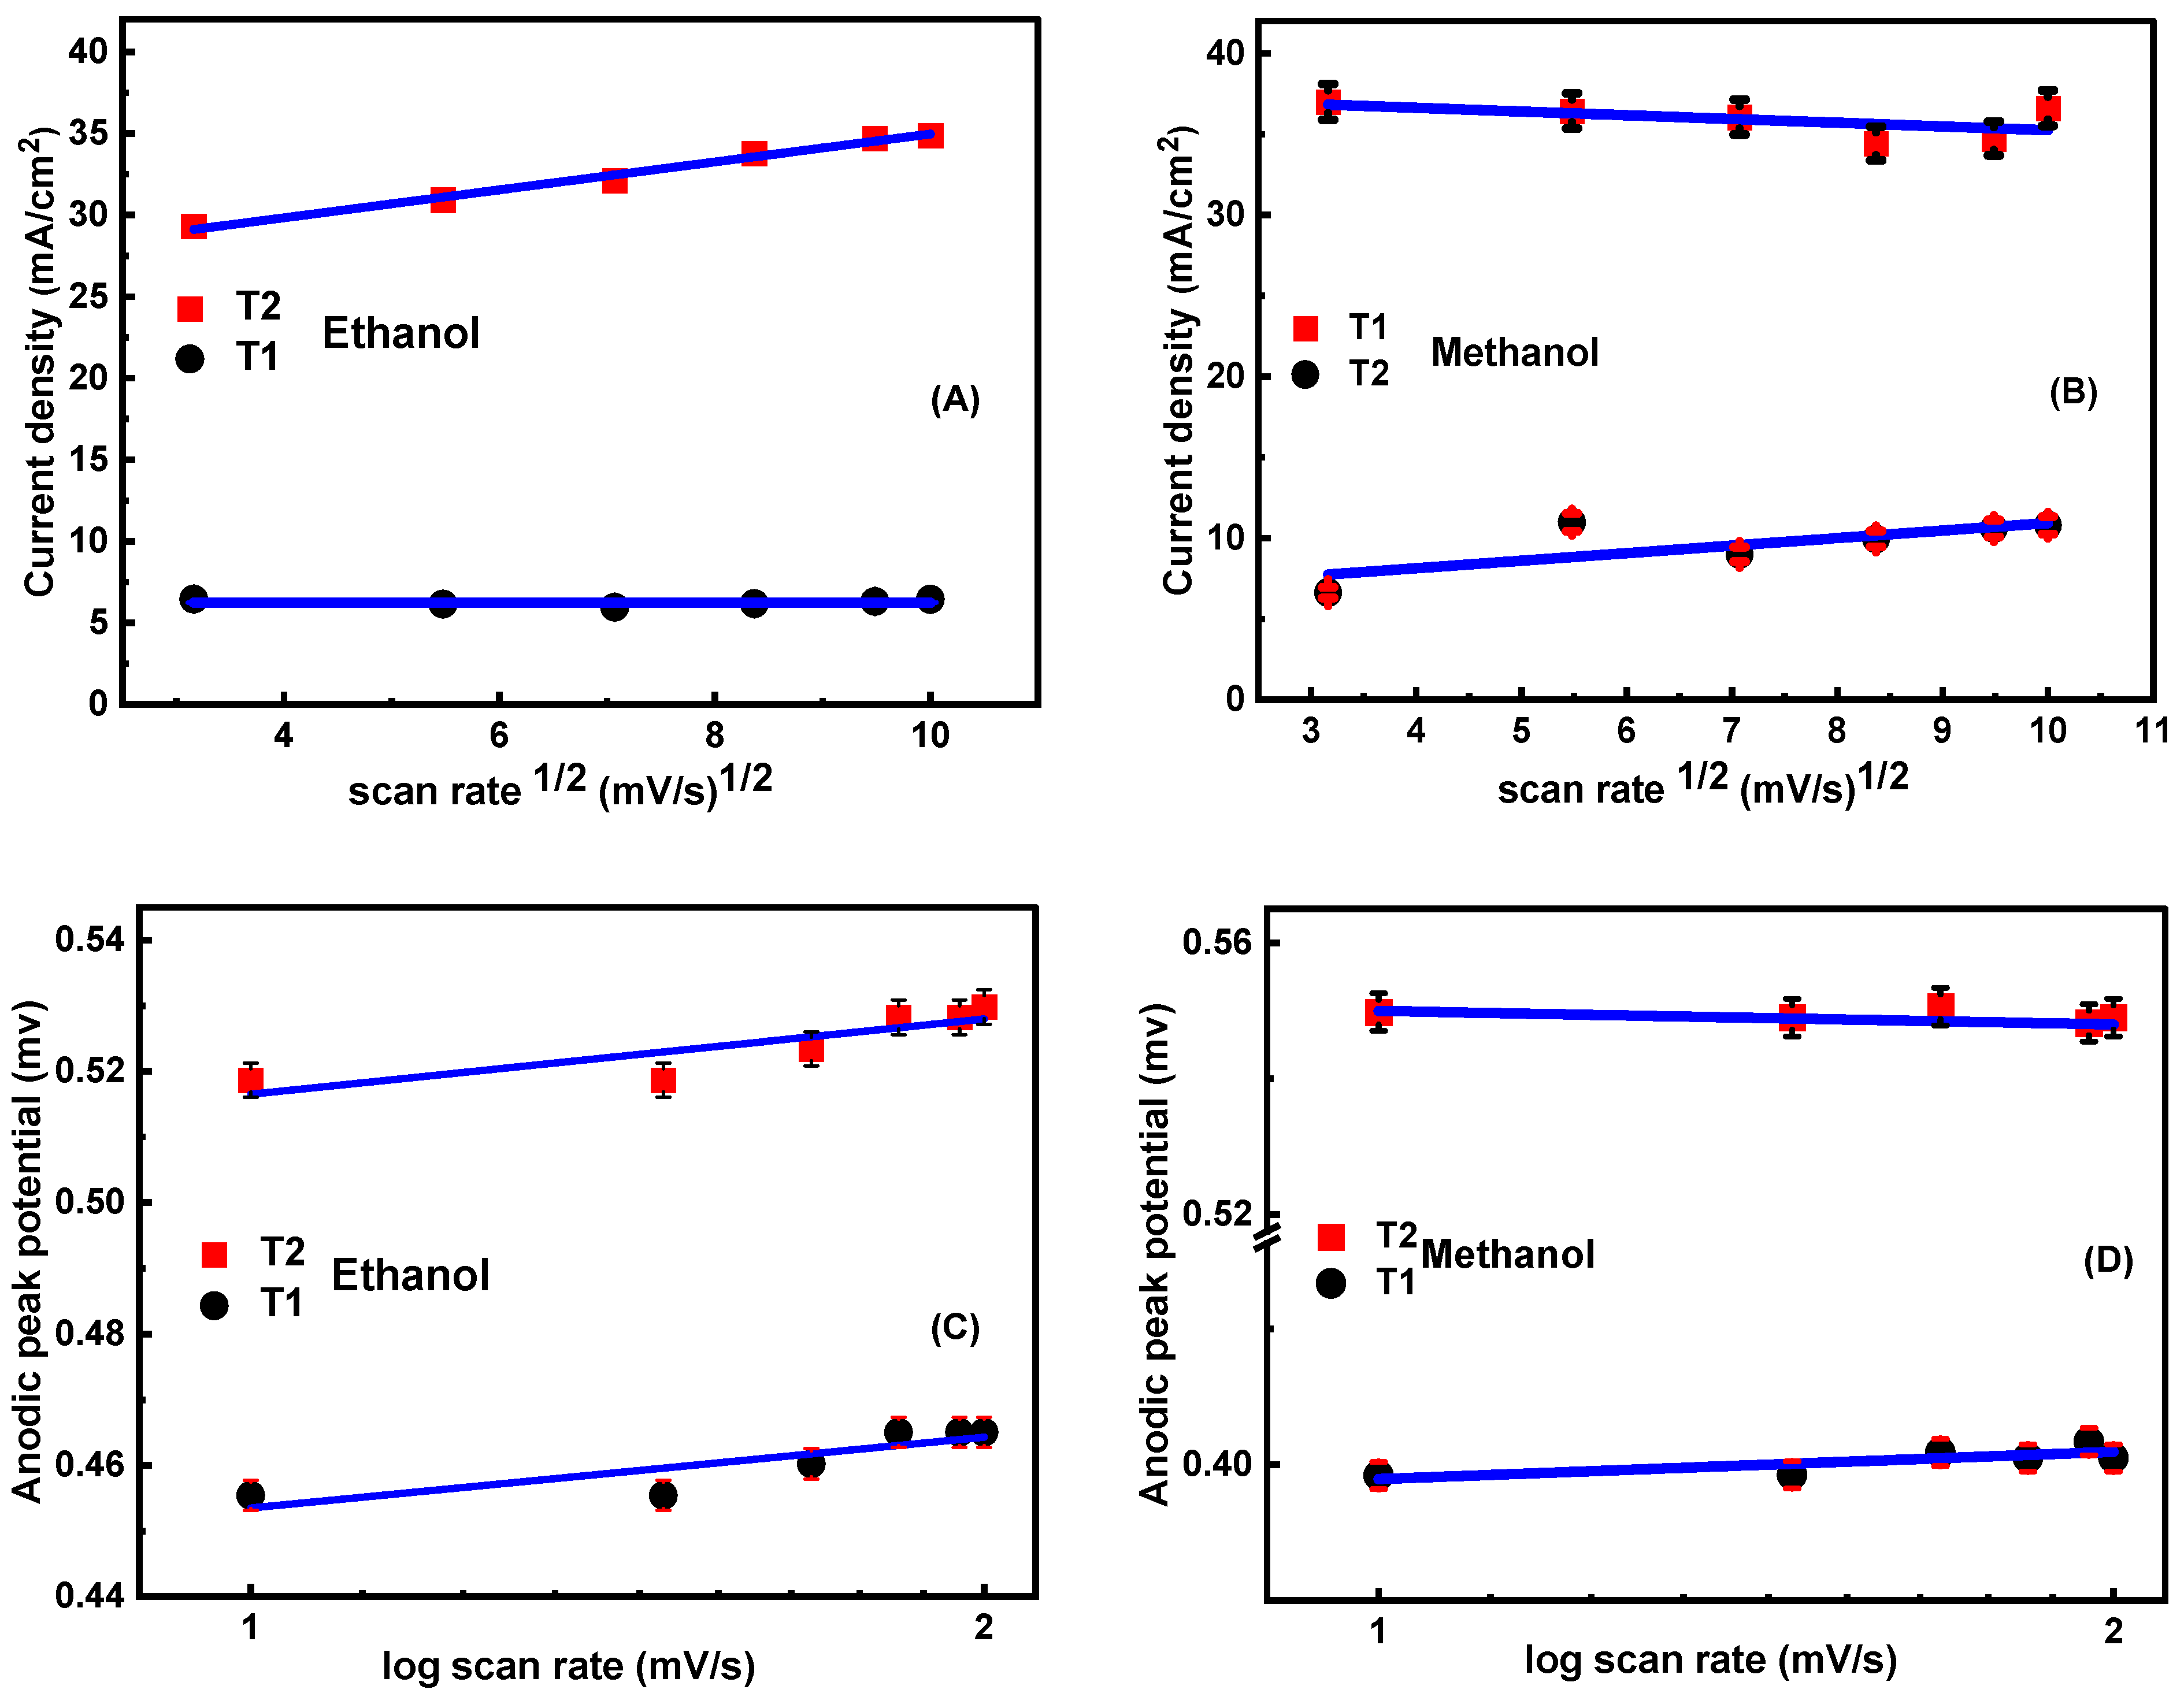
3.5.4. Influence of Scan Rate (SR)

Figure 7A–D exhibits the impact of scan rate ( S R s = 10 100 mV/s) on the T1 and T2 electrocatalytic activity for electrooxidation of 0.5 M ethanol and 2 M methanol in a 1.0 M KOH solution at RT. Anode current increases gradually as SRs rise between 10 and 100 mV, which can be attributed to rapid electron transport at the electrode/electrolyte interface.
A diffusion-controlled mechanism is supported by the nearly straight plot of the current density in ethanol and methanol against the square root of the SR, as shown in Figure 8A,B. By examining the relationship between the log of anodic peak potential and log (SR), as illustrated in Figure 8C,D, the diffusion-based properties are further elucidated. These findings imply that oxidation is controlled by diffusion [50,51]. To enhance the kinetic oxidation of methanol and ethanol, the oxidation current density increases as the scan rate points increase. The logarithm of the anodic peak potential vs. SR has a linear relationship with the kinetic threshold of the reaction seen in Figure 8C,D. Thermodynamically reversible electrochemical reactions take place when the anodic peak positions stay constant with the SR [7,29]. The electrochemical reaction is not reversible, as seen in Figure 9. As a result, sample T2 has the largest value of the current density at 0.799 mV potential compared to sample T1. This illustrates how increasing the TiO2 ratio enhances the catalytic activity in a synergistic way [47]. The linear relation between anodic peak potential and the log of the scan rate (Figure 8C,D) shows that methanol and ethanol electrooxidation have kinetic restrictions [47]. These results suggest that a combination of diffusion and kinetic constraints governs the electrooxidation of ethanol and methanol for manufactured catalysts [52].

3.5.5. Linear Sweep Voltammetry (LSV) and Tafel Slope

Figure 9A,B display the LSV profiles for the investigated NFs (T1, T2). The LSV curves in methanol (2.0 M)/KOH (1.0 M) were performed using a three-electrode cell in a potential window ranging from 0.2 to 0.799 V. The current density for ethanol increases from 57.8 to 74.21 mA/cm2 at 0.799 V. Consequently, it can be concluded that the greatest current density was obtained for sample T2 at a potential 799 mV compared to sample T1.
As exhibited in Figure S2, the electrochemical reaction kinetics were investigated using Tafel curves. The Tafel slope represents the relationship between the overpotential and the reaction rate in electrochemical kinetics. A high Tafel slope indicates that a significant amount of energy is required to achieve a given reaction rate, suggesting a slow reaction rate. This reflects how changes in the applied potential affect the rate of electrochemical reactions. Consistent with that, the Tafel slope of the present samples (T1 and T2) calculated from Figure S2A,B are 67.6 ± 0.02 and 81.7 ± 0.02 mV/Dec for ethanol and 59.7 ± 0.04 73.825 ± 0.01 mV/Dec for methanol, respectively. It is clear that the Tafel slope of T2 (3% of TiO2) is a bit higher than that of T1 (1% of TiO2). The charge transfer coefficient and the number of electrons engaged in the electrode reaction determine the Tafel slope. A reaction only involves one step and one electron transfer; in other words, any change in the Tafel slope signifies a modification in the electrode reaction’s mechanism. Reaction kinetics are affected by variations in the Tafel slope brought on by variations in the charge transfer coefficient [7,29].

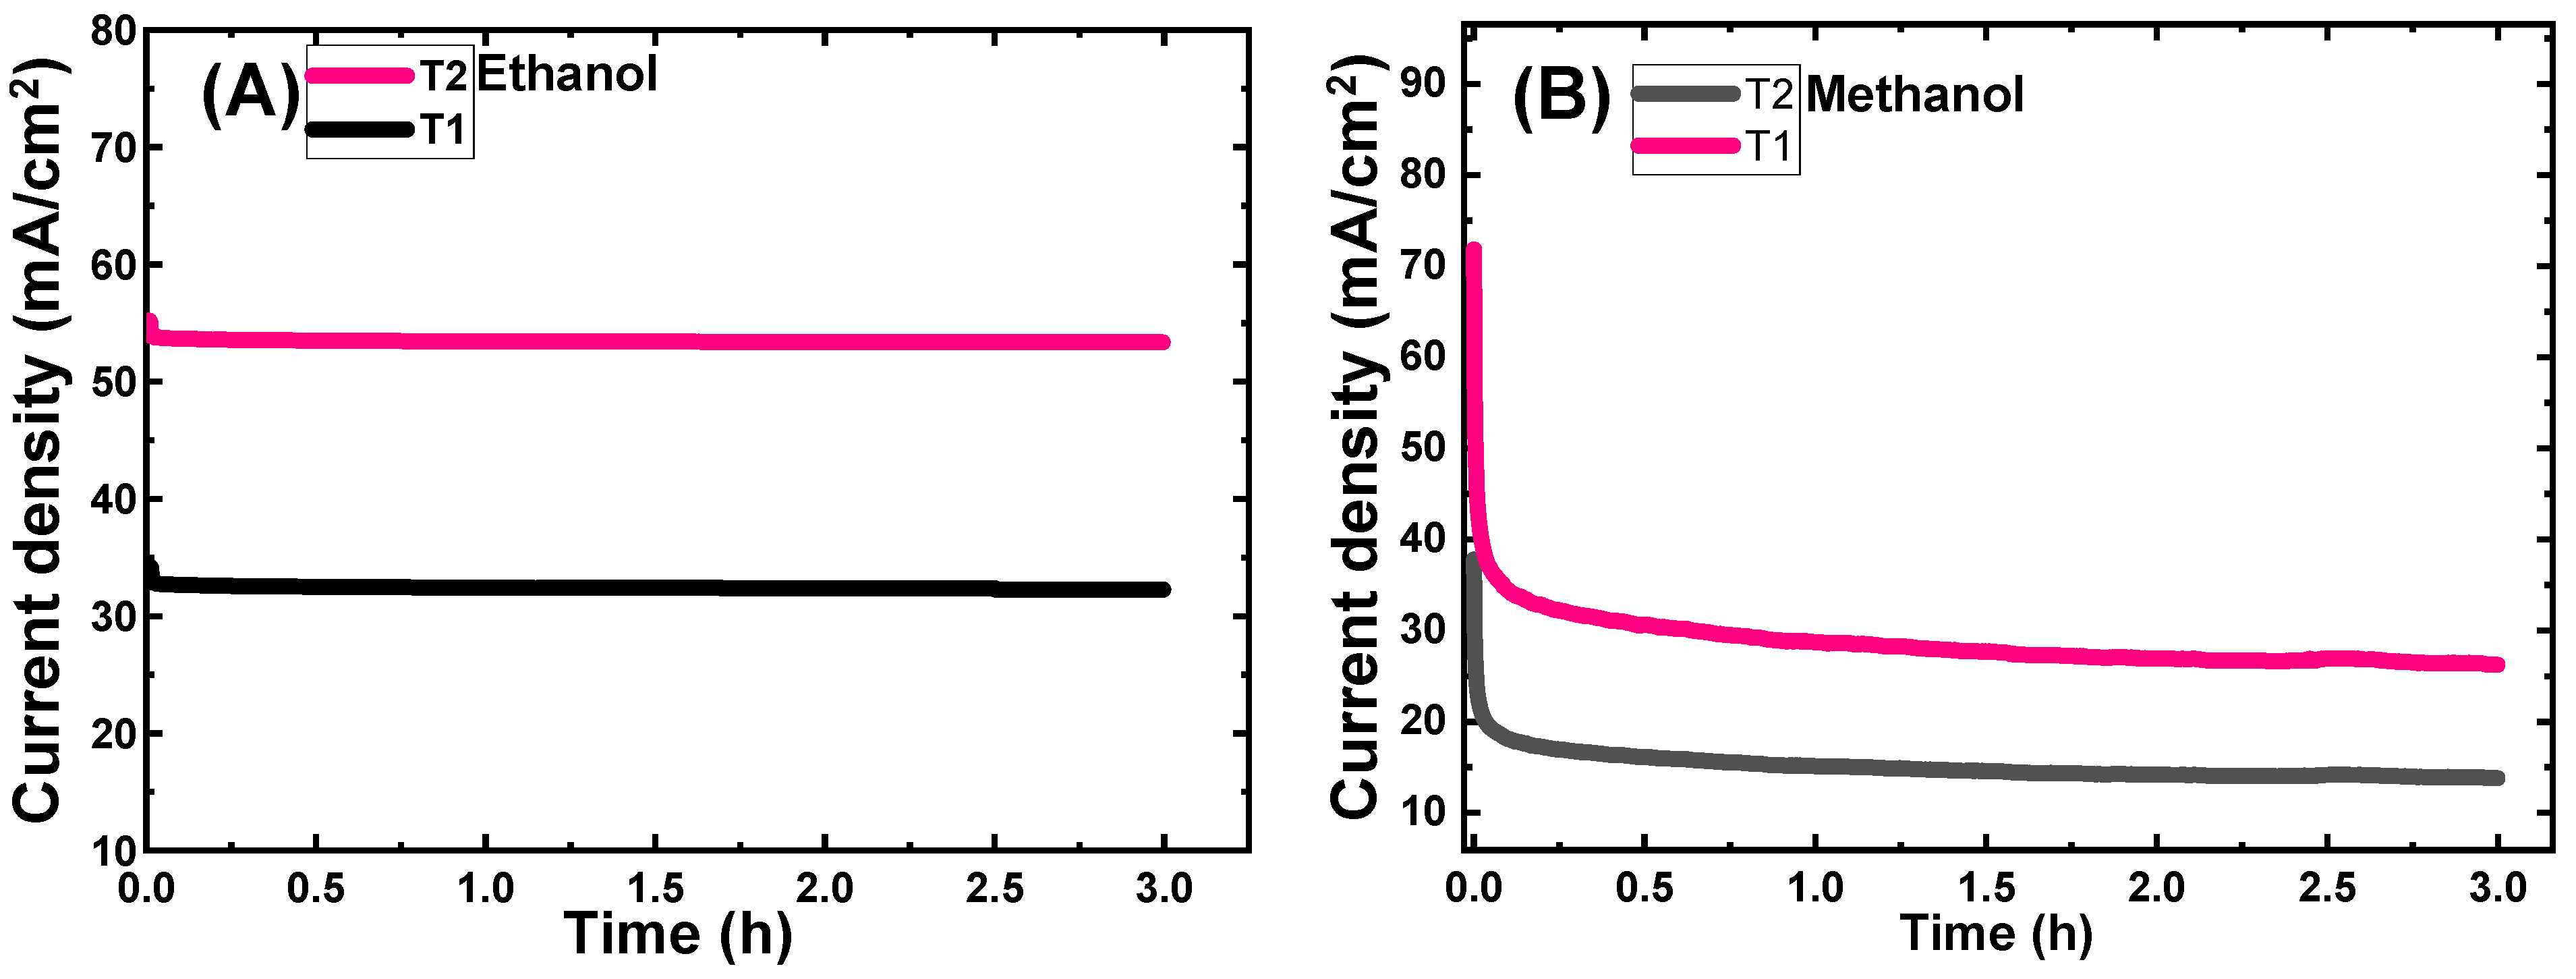
3.5.6. Stability Study

For a prolonged amount of time, the stability of samples T1 and T2 between the Pt counter electrode and the working electrode at 0.799 V, ethanol, and methanol is investigated. Figure 10A,B displays the variations in current density over time as measured by chronoamperometry. The sample T2 exhibited more stability than methanol electrooxidation. Figure 10A demonstrated that the samples in ethanol are more stable than methanol, and T2 was higher than T1 during the ethanol electrooxidation process, and the current density decreased to 54 mA/cm2 and 34.6 mA/cm2 for T2 and T1, respectively. Figure 10B shows that the samples in methanol are less stable than ethanol. However, T2 was more stable than T1 during the methanol electrooxidation process, and the current density decreased from 57.8 to 27 mA/cm2 and 38.6 to 21.8 mA/cm2 for T2 and T1, respectively. As a functional electrooxidation electrode, the T2 electrode exhibits outstanding chemical stability and a long lifespan, even in spite of the early decrease in current density. These results imply that TiO2 can be used as a co-catalyst to increase the electrocatalytic activity. The deactivation rate (DR) was calculated from the stability data obtained through CA using the formula DR = (1 − J600s/J60s) [53,54]. The DR values for samples T1 and T2 were found to be 20.01% and 20.34% in methanol, respectively. In ethanol, they were 4.26% and 1.52%. The relatively low values associated with the non-precious nature of these materials highlight their potential for commercial applications, offering advantages over precious metals such as platinum. Thus, we conclude that Ni/Co/TiO2 supported by carbonized PVA can serve as an effective electrocatalyst for the oxidation of ethanol and methanol in KOH, as discussed in Section 3.5.6.

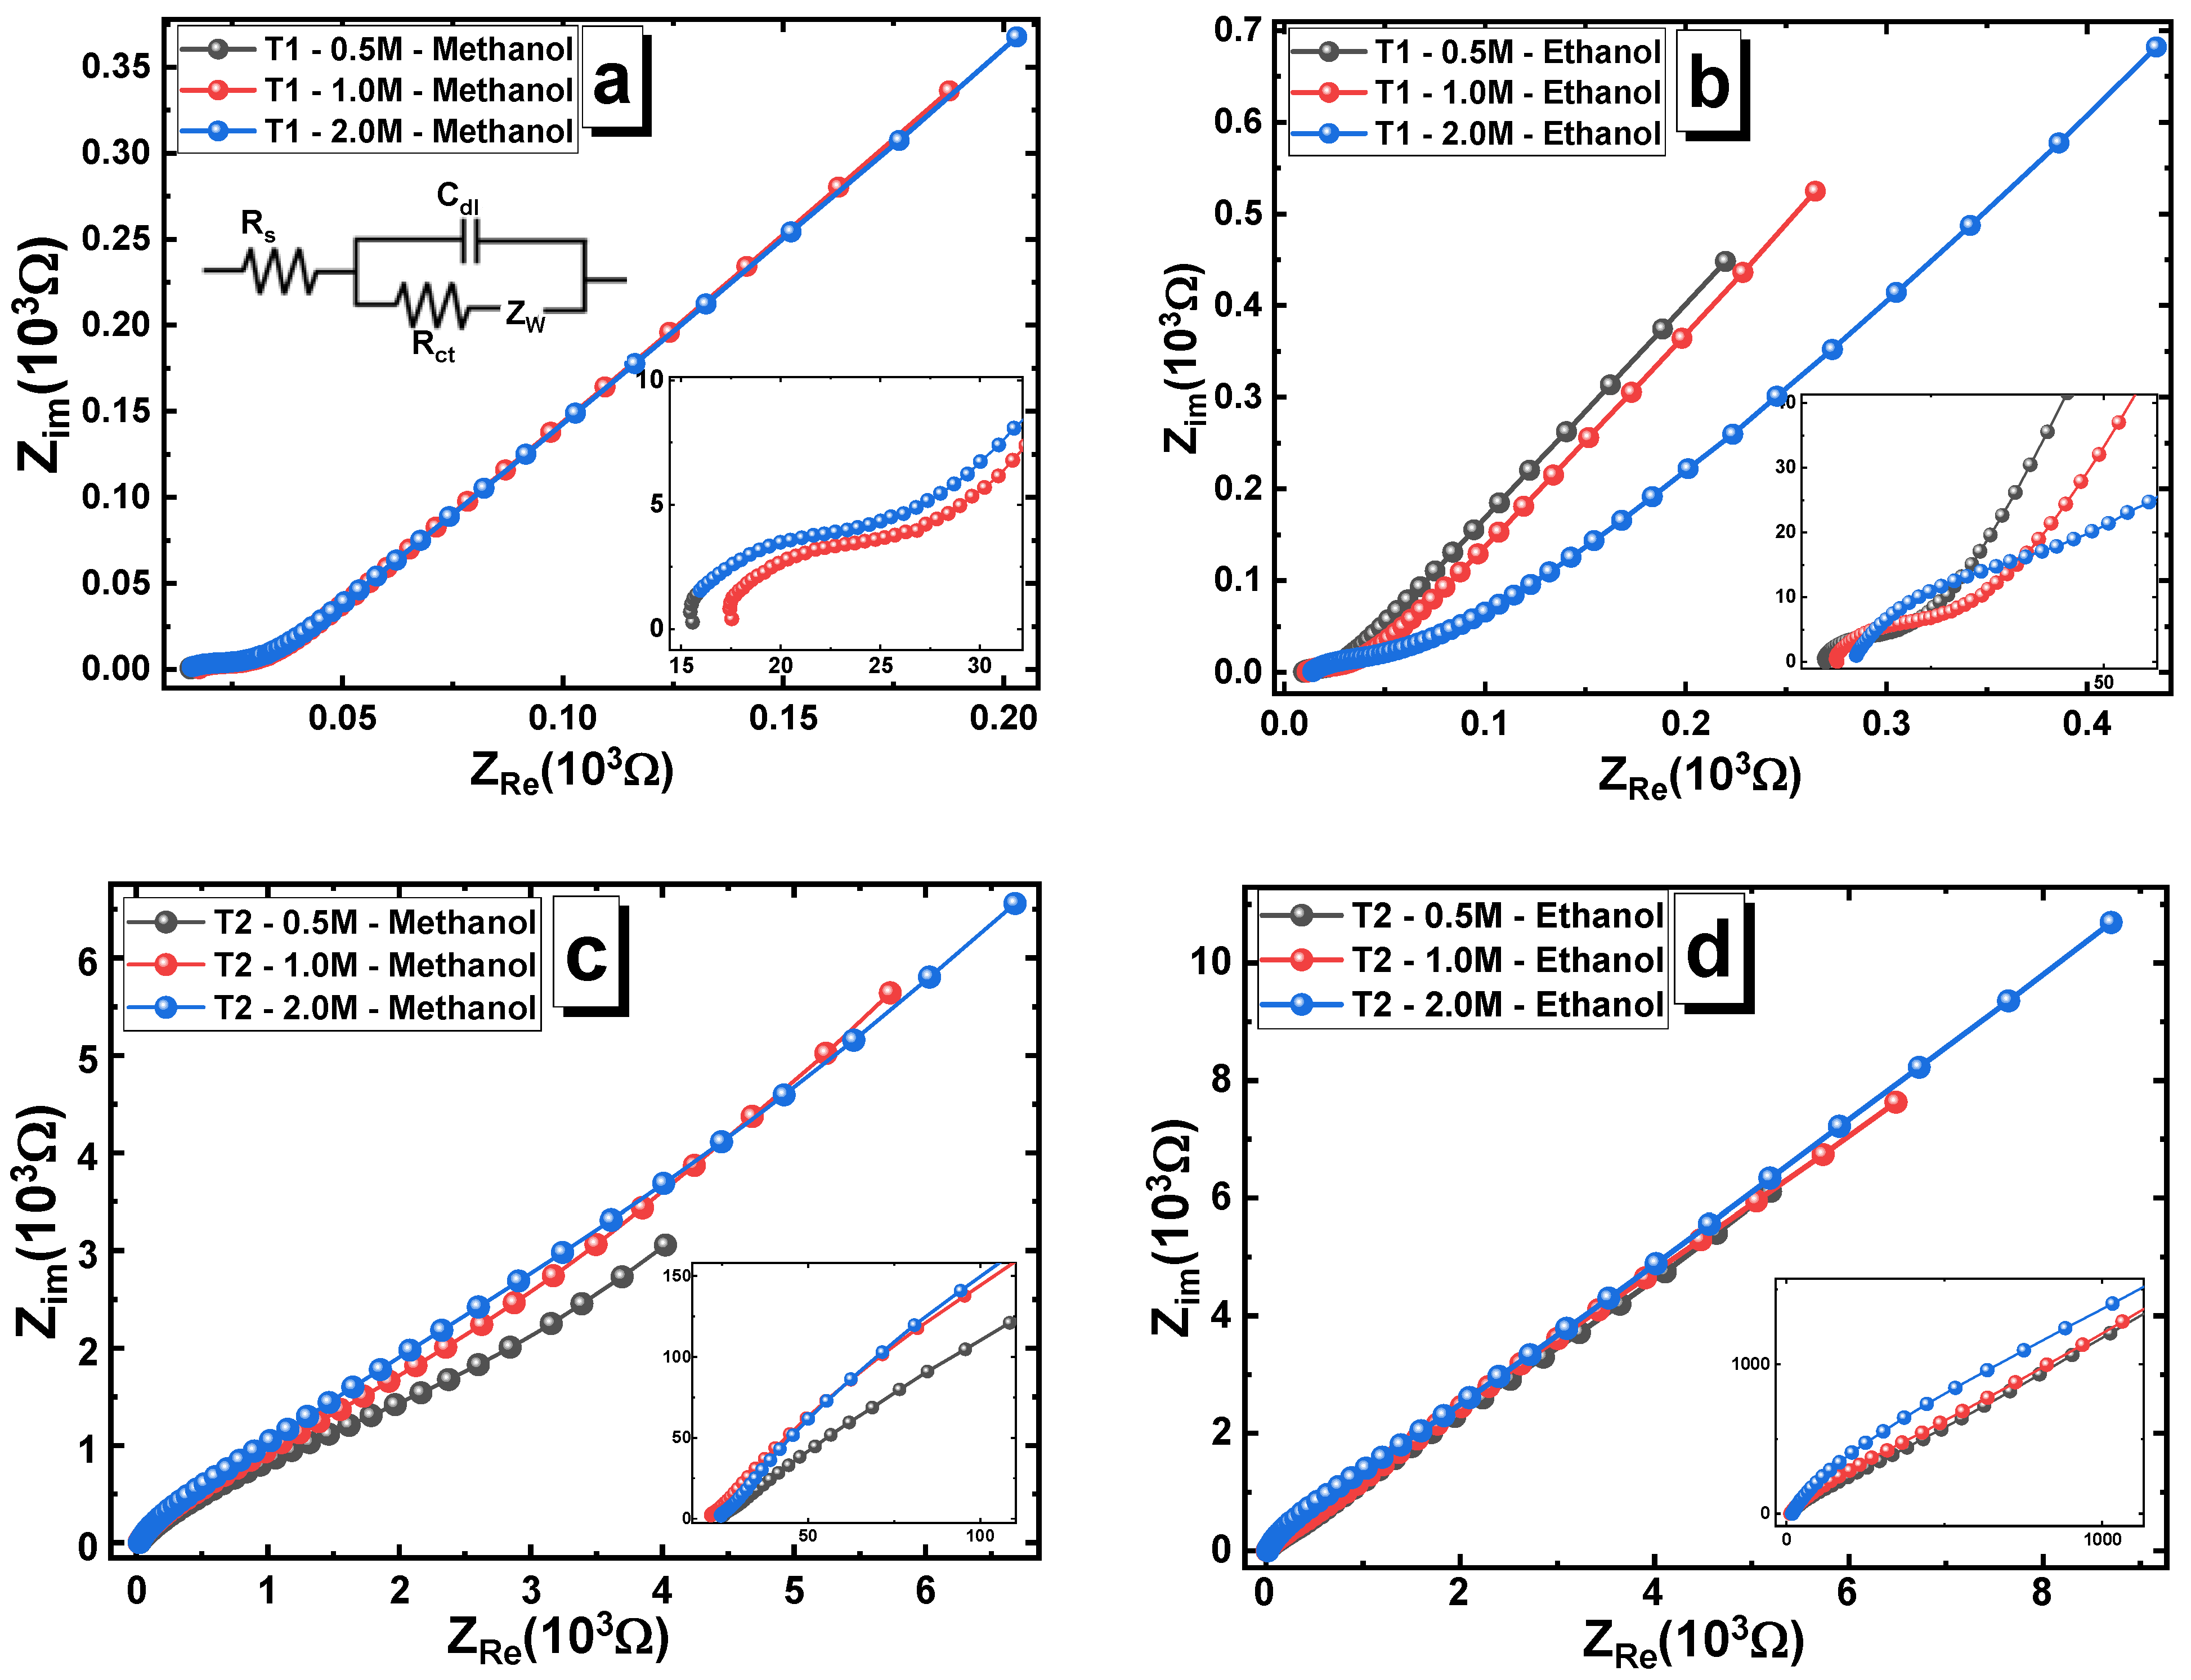
3.6. Electrochemical Impedance Spectroscopy (EIS)

Critical characteristics such as the charge transfer kinetics, the ease of reactant and product transport, and the interfacial properties between the catalyst and the electrolyte may all be assessed using EIS for fuel cell catalysts. Numerous details regarding the functionality and longevity of the catalyst can be found by analyzing the impedance spectrum, which comprises the real and imaginary impedance in addition to the phase angle. Nyquist charts, in which the real part of the impedance (Z′) is plotted against the imaginary part’s negative (−Z″), are a popular method of presenting EIS data [50,51,55]. Semi-circles are a defining feature of these plots and can be linked to various electrochemical reactions taking place at the catalyst–electrolyte interface. The Bode plot is another useful representation that shows the phase angle (θ) and the logarithm of the total impedance as functions of frequency. The Bode plot is another useful representation that shows the phase angle (θ) and the logarithm of the total impedance as functions of frequency. The Bode plot is another useful representation that shows the phase angle (θ) and the logarithm of the total impedance as functions of frequency. The Bode plot is another useful representation that shows the phase angle (θ) and the logarithm of the total impedance as functions of frequency [56,57].
The Nyquist plot of both Ni12Co7(TiO2)1 and Ni12Co5(TiO2)3 electrodes in different concentrations (0.5, 1, and 2 M) of methanol and ethanol is shown in Figure 11a–d. For all the samples, the figures exhibit a small semi-circle and a spike at the high and low frequencies, respectively. The small semi-circles represent the charge transfer resistance (Rct) at the electrode–electrolyte interface; this shows that charge transfer reactions can easily occur at the surface of the catalyst, suggesting a speedy transfer procedure [58,59]. The observed spike at the lower frequencies is related to the capacitive behavior of the electrode; this reveals the double-layer capacitance that forms at the interface between the electrode and electrolyte surfaces.
Table 4 shows the values of the active electrolyte resistance (Rs), the charge transfer resistance (Rct), and the capacitance of the prepared electrodes. For Ni12Co7(TiO2)1 electrode, Rct is observed to decrease as the concentration of methanol and ethanol increases; this reveals that the electrochemical kinetics are enhanced at higher concentrations of methanol and ethanol. This means that the increased concentration of methanol or ethanol led to enhancing the interaction between their molecules with the active sites on the electrode, which improved the oxidation process, resulting in reduced Rct values. The same behavior is observed for the active electrolyte resistance; the decrease in the Rs values with increasing the fuel concentration reveals the enhanced diffusion of the reactants to the surface of the electrode, resulting in lower values of Rs. For the electrode Ni12Co5(TiO2)3, as the concentration of methanol or ethanol fuel increases from 0.5 to 2 M, the values of Rct also increase. This indicates that the kinetics of the electrochemical reaction go slow with increasing fuel concentrations, resulting in lower Rct values. On the other hand, the mass transfer resistance also increases as the concentration of methanol or ethanol fuels increases, showing difficulty in the diffusion of the reactant during the fuel. A similar behavior was observed by MM Goma et al. for NiCu/CNFs [59].
The obtained equivalent circuit, which consists of the active electrolyte resistance in series with a combination of a charge transfer resistor in parallel with a capacitor connected in series with a Warburg resistor, represents the well-known Randle circuit [60,61]. The calculated values of the elements are listed in Table 4. The best performance is obtained for the Ni12Co5(TiO2)3 electrode at 0.5 M concentration of ethanol, which exhibits the lowest Rct. This may be owing to the enhanced electrochemical activity due to the increased TiO2, which increased the surface area and provided more active sites for the electrochemical reactions. These results demonstrate that TiO2 can serve as an excellent addition for strengthening Ni-based catalysts, and they are consistent with the obtained results from the cyclic voltammetry experiments.
In electrochemical investigations, the Bode plot is essential because it shows how the amplitude of alternating voltage and current relate to frequency. This plot enables researchers to examine the performance of electrochemical cells and systems by offering useful details on the impedance characteristics of the system across a range of frequencies. The Bode plot, in contrast to the Nyquist plot, clearly displays frequency information, which facilitates the identification of the main mechanisms influencing the electrochemical response. Figure S3 shows the frequency dependence of the phase angle for the present electrodes utilizing ethanol and methanol at 0.8 V (vs. Ag/AgCl) at room temperature. The phase angle (θ) provides information about the capacitive or inductive behavior of the system [23,60]. For both Ni12Co7(TiO2)1 and Ni12Co5(TiO2)3 electrodes in methanol or ethanol, it is observed that the phase angle is less than 90° at the low-frequency range, which reveals the resistive property of the current electrodes. Based on the observed behaviors in the figures, one can conclude that the best electrochemical activity is achieved by the Ni12Co5(TiO2)3 electrode in ethanol, which exhibits the highest phase angle value, corresponding to a lower frequency value and longer relaxation time.
Understanding the kinetics of electrocatalysts is essential for maximizing their performance in applications such as fuel cells, batteries, and electrolyzers. Electrocatalysis is the process of accelerating electrochemical reactions at the electrode surface. The kinetics of an electrocatalyst and the Randles circuit are related through the study of electrochemical systems, particularly in the context of impedance spectroscopy. These Nyquist plots show that as the amount of TiO2 in NiCo/CNF increases, the charge transfer resistance Rct decreases (31.5 to 23.12 Ω for methanol and 25.82 to 21.67 Ω for ethanol at 0.5 M), which is a clear indication of facilitation of charge transfer for the catalytic conversion of methanol and ethanol. The same conclusion has been drawn from voltammetry studies, as mentioned in the article. The resistivity of the solution RS has a significant role in the overall resistance that controls fuel cell power output. The electrolyte resistance decreases as the number of ions in the electrolyte increases [62]. From Nyquist plots, it can be noticed that RS decreases from 40.68 to 25.09 Ω at 0.5 M methanol and from 34.3 to 23.42 Ω at 0.5 M ethanol as the TiO2 ratio increases from 1 to 3%, respectively. Moreover, the Warburg diffusion coefficient, which is obtainable through slope in the low-frequency domain, is associated with charge transfer activity, and the change in its value (0.01 to 0.001 F.cm−2.s−1/2) proves that the reaction goes on all through diffusion-controlled phenomena [63,64]. The impedance results complement the voltammetric findings.
Table 5 shows related studies with various metal additives, preparation methods, electrolytes, onset potential, and peak current density. Because of its high activity, Pt is a common electrocatalyst in fuel cells; nonetheless, it has a number of drawbacks. Pt is costly, which raises the fuel cell system’s total cost. Furthermore, Pt is a rare metal, and the supply chain and sustainability of fuel cell technologies are questioned due to its restricted availability. The synergistic effect of Ni and Co as an electrocatalyst has drawn a lot of interest lately, especially for energy conversion applications like fuel cells. Because of the distinct electrical and geometric structures that are created when Co and Ni unite to produce nanostructured forms, they frequently show better catalytic activity when compared to their individual components. Moreover, the addition of metal oxides (TiO2) increases stability and activity.
Through the study of electrochemical activity and chemical stability of the current compound, we found that the samples under investigation exhibit high electrochemical activity and also high stability, making them a promising candidate for use as an electrochemical catalyst in fuel cells. Although globally standard materials in this field have better catalytic properties, the compounds under study have demonstrated advantages such as stability and lower cost. This represents one of the primary goals for the commercial proliferation of fuel cells.
The table provides a comparative analysis of the electrocatalytic activity of various structures, highlighting their onset potential, electrolytes, and current densities. Notably, NiCoTiO2/CNFs structure demonstrates a peak current density of 74.21 mA/cm2 with an onset potential of 0.4 V in an electrolyte of 1 M methanol, showcasing strong performance relative to the other materials listed. For instance, while Ni-Co/RGO nanofibers achieve a peak current density of 20 mA/cm2, the current structure outperforms this, indicating superior electrocatalytic activity. Despite this advantage, the onset potential of NiCoTiO2/CNFs is comparable to that of other structures, such as Ni/TiO2/Ti, which shows a slightly lower onset potential of 0.35 V. This suggests that while the current structure outperforms in current density. The onset potential might be improved, which could increase the overall effectiveness of the catalyst.

4. Conclusions

A successful synthesis and characterization of non-precious electrocatalysts using nickel, cobalt, and titanium dioxide embedded in carbon nanofibers (CNFs) is mentioned. The electrospinning technique, followed by carbonization, produced uniform and continuous nanofibers, essential for enhancing the structural integrity and surface area of the catalysts. The results demonstrated that the incorporation of TiO2 significantly improved the electrocatalytic activity for ethanol and methanol oxidation. As the TiO2 content increased, current densities notably rose, indicating a synergistic effect that enhances catalyst performance. The electrochemical analyses, including cyclic voltammetry and electrochemical impedance spectroscopy, showed an observed reduction in the value of charge transfer resistance, suggesting improved kinetics and efficiency during the oxidation processes. Moreover, the stability tests indicated that the synthesized catalysts maintained their performance over extended periods, highlighting their potential for practical applications in Direct Alcohol Fuel Cells.

Supplementary Materials

The following supporting information can be downloaded at https://www.mdpi.com/article/10.3390/jcs9030125/s1. Figure S1: Diagrammatic representation of the synthetic procedure of the present electrodes; Figure S2: Tafel slope for the prepared catalysts T1 and T2 prepared electrodes; Figure S3: Bode plots for the electrodes Ti in methanol (a) and ethanol (b) & T2 in methanol (c) and ethanol (d).

Author Contributions

Conceptualization, E.E.A.-H.; methodology, E.E.A.-H., M.O.A.-H. and W.M.M.; software, M.O.A.-H., W.M.M. and M.A.M.; validation, E.E.A.-H., M.O.A.-H., W.M.M. and M.A.M.; formal analysis, M.O.A.-H., M.A.M. and W.M.M.; investigation, W.M.M. and M.A.M.; resources, E.E.A.-H.; data curation, M.O.A.-H., W.M.M. and M.A.M.; writing—original draft preparation, E.E.A.-H., M.O.A.-H., W.M.M. and M.A.M.; writing—review and editing, E.E.A.-H., M.O.A.-H. and W.M.M.; visualization, E.E.A.-H., M.O.A.-H. and W.M.M.; supervision, E.E.A.-H. All authors have read and agreed to the published version of the manuscript.

Funding

This paper is based upon work supported by the Science, Technology & Innovation Funding Authority (STDF) under grant (No. 48117).

Data Availability Statement

The datasets used and/or analyzed during the current study are available from the corresponding author upon reasonable request.

Acknowledgments

This paper is based upon work supported by the Science, Technology & Innovation Funding Authority (STDF) under grant (No. 48117). Also, we would like to express our gratitude to the Central Laboratory for Microanalysis and Nanotechnology at Minia University for their assistance in characterizing the data used in this research.

Conflicts of Interest

The authors declare no conflicts of interest.

References

  1. Steele, B.C.; Heinzel, A. Materials for fuel-cell technologies. Nature 2001, 414, 345–352. [Google Scholar] [CrossRef]
  2. Mohammed, W.M.; Awad, S.; Abdel-Hady, E.E.; Mohamed, H.F.; Elsharkawy, Y.S.; Elsharkawy, M.R. Nanostructure analysis and dielectric properties of PVA/sPTA proton exchange membrane for fuel cell applications: Positron lifetime study. Radiat. Phys. Chem. 2023, 208, 110942. [Google Scholar] [CrossRef]
  3. Gasteiger, H.A.; Marković, N.M. Just a dream—Or future reality? Science 2009, 324, 48–49. [Google Scholar] [CrossRef] [PubMed]
  4. Debe, M.K. Electrocatalyst approaches and challenges for automotive fuel cells. Nature 2012, 486, 43–51. [Google Scholar] [CrossRef]
  5. Shao, Y.; Yin, G.; Gao, Y. Understanding and approaches for the durability issues of Pt-based catalysts for PEM fuel cell. J. Power Sources 2007, 171, 558–566. [Google Scholar] [CrossRef]
  6. Wu, G.; More, K.L.; Johnston, C.M.; Zelenay, P. High-performance electrocatalysts for oxygen reduction derived from polyaniline, iron, and cobalt. Science 2011, 332, 443–447. [Google Scholar] [CrossRef]
  7. Awad, S.; Kaouach, H.; Mohammed, M.A.; Abdel-Hady, E.E.; Mohammed, W.M. Fabrication of bimetallic Ni-Ag/CNFs nanoparticles as a catalyst in direct alcohol fuel cells (DAFCs). Polym. Adv. Technol. 2023, 34, 1723–1738. [Google Scholar] [CrossRef]
  8. Abdel-Hady, E.E.; Gamal, A.; Hamdy, H.; Shaban, M.; Abdel-Hamed, M.O.; Mohammed, M.A.; Mohammed, W.M. Methanol electro oxidation on Ni–Pt–CrO/CNFs composite: Morphology, structural, and electrochemical characterization. Sci. Rep. 2023, 13, 4870. [Google Scholar] [CrossRef]
  9. Kongkanand, A.; Kuwabata, S.; Girishkumar, G.; Kamat, P. Single-wall carbon nanotubes supported platinum nanoparticles with improved electrocatalytic activity for oxygen reduction reaction. Langmuir 2006, 22, 2392–2396. [Google Scholar] [CrossRef]
  10. Chen, P.-J.; Wang, Y.-L.; Kuo, L.-M.; Lin, C.-F.; Chen, C.-Y.; Tsai, Y.-F.; Shen, J.-J.; Hwang, T.-L. Honokiol suppresses TNF-α-induced neutrophil adhesion on cerebral endothelial cells by disrupting polyubiquitination and degradation of IκBα. Sci. Rep. 2016, 6, 26554. [Google Scholar] [CrossRef]
  11. Saha, M.S.; Li, R.; Sun, X. High loading and monodispersed Pt nanoparticles on multiwalled carbon nanotubes for high performance proton exchange membrane fuel cells. J. Power Sources 2008, 177, 314–322. [Google Scholar] [CrossRef]
  12. Ferreira, P.; Shao-Horn, Y.; Morgan, D.; Makharia, R.; Kocha, S.; Gasteiger, H. Instability of Pt/C electrocatalysts in proton exchange membrane fuel cells: A mechanistic investigation. J. Electrochem. Soc. 2005, 152, A2256. [Google Scholar] [CrossRef]
  13. Meier, J.C.; Galeano, C.; Katsounaros, I.; Topalov, A.A.; Kostka, A.; Schüth, F.; Mayrhofer, K.J. Degradation mechanisms of Pt/C fuel cell catalysts under simulated start–stop conditions. ACS Catal. 2012, 2, 832–843. [Google Scholar] [CrossRef]
  14. Borup, R.; Meyers, J.; Pivovar, B.; Kim, Y.S.; Mukundan, R.; Garland, N.; Myers, D.; Wilson, M.; Garzon, F.; Wood, D.; et al. Scientific aspects of polymer electrolyte fuel cell durability and degradation. Chem. Rev. 2007, 107, 3904–3951. [Google Scholar] [CrossRef]
  15. Hikosaka, B.N. Fuel Cells: Current Technology Challenges and Future Research Needs; Elsevier: Amsterdam, The Netherlands, 2013. [Google Scholar]
  16. Fujishima, A.; Zhang, X. Titanium dioxide photocatalysis: Present situation and future approaches. Comptes Rendus Chim. 2006, 9, 750–760. [Google Scholar] [CrossRef]
  17. Nakata, K.; Fujishima, A. TiO2 photocatalysis: Design and applications. J. Photochem. Photobiol. C Photochem. Rev. 2012, 13, 169–189. [Google Scholar] [CrossRef]
  18. Kočí, K.; Obalová, L.; Lacný, Z. Photocatalytic reduction of CO2 over TiO2 based catalysts. Chem. Pap. 2008, 62, 1–9. [Google Scholar] [CrossRef]
  19. Centi, G.; Perathoner, S. Opportunities and prospects in the chemical recycling of carbon dioxide to fuels. Catal. Today 2009, 148, 191–205. [Google Scholar] [CrossRef]
  20. Sarwar, E.; Noor, T.; Iqbal, N.; Mehmood, Y.; Ahmed, S.; Mehek, R. Effect of Co-Ni ratio in graphene based bimetallic electro-catalyst for methanol oxidation. Fuel Cells 2018, 18, 189–194. [Google Scholar] [CrossRef]
  21. Urbańczyk, E.; Wala, M.; Blacha-Grzechnik, A.; Stolarczyk, A.; Maciej, A.; Simka, W. Electrocatalytic methanol oxidation using Ni–Co–graphene composite electrodes. Int. J. Hydrogen Energy 2021, 46, 33272–33286. [Google Scholar] [CrossRef]
  22. Hassanzadeh, V.; Sheikh-Mohseni, M.A.; Habibi, B. Catalytic oxidation of ethanol by a nanostructured Ni-Co/RGO composite: Electrochemical construction and investigation. J. Electroanal. Chem. 2019, 847, 113200. [Google Scholar] [CrossRef]
  23. Roodbari, N.J.; Omrani, A.; Hosseini, S.R. Synthesis, characterization and performance of a novel Ni–Co/GO-TiO2 for electrooxidation of methanol and ethanol. Int. J. Hydrog. Energy 2022, 47, 6044–6058. [Google Scholar] [CrossRef]
  24. Chen, J.-Y.; Weng, Y.-X.; Han, Y.-H.; Ye, R.-H.; Huang, D.-H. A novel pencil graphite electrode modified with an iron-based conductive metal-organic framework exhibited good ability in simultaneous sensing bisphenol A and bisphenol S. Ecotoxicol. Environ. Saf. 2024, 272, 116065. [Google Scholar] [CrossRef]
  25. Li, M.; Feng, L.G. Advances of phosphide promoter assisted Pt based catalyst for electrooxidation of methanol. J. Electrochem. 2022, 28, 2106211. [Google Scholar]
  26. Zhu, Z.; Men, Y.; Zhang, W.; Yang, W.; Wang, F.; Zhang, Y.; Zeng, X.; Xiao, J.; Tang, C.; Li, X.; et al. Versatile carbon-based materials from biomass for advanced electrochemical energy storage systems. Escience 2024, 4, 100249. [Google Scholar] [CrossRef]
  27. Long, N.V.; Asaka, T.; Matsubara, T.; Nogami, M. Shape-controlled synthesis of Pt–Pd core–shell nanoparticles exhibiting polyhedral morphologies by modified polyol method. Acta Mater. 2011, 59, 2901–2907. [Google Scholar] [CrossRef]
  28. Kim, B.-Y.; Lee, K.-H.; Song, W.-J.; Cao, G.; Park, K.-W. Synthesis of monodispersed Pt-Ni alloy nanodendrites and their electrochemical properties. Int. J. Electrochem. Sci. 2013, 8, 2305–2312. [Google Scholar]
  29. Abdel-Hady, E.E.; Shaban, M.; Abdel-Hamed, M.O.; Gamal, A.; Yehia, H.; Ahmed, A.M. Synthesis and characterization of NiCoPt/CNFs nanoparticles as an effective electrocatalyst for energy applications. Nanomaterials 2022, 12, 492. [Google Scholar] [CrossRef]
  30. Barakat, N.A.; El-Newehy, M.H.; Yasin, A.S.; Ghouri, Z.K.; Al-Deyab, S.S. Ni & Mn nanoparticles-decorated carbon nanofibers as effective electrocatalyst for urea oxidation. Appl. Catal. A Gen. 2016, 510, 180–188. [Google Scholar]
  31. Pant, B.; Pant, H.R.; Barakat, N.A.; Park, M.; Jeon, K.; Choi, Y.; Kim, H. Carbon nanofibers decorated with binary semiconductor (TiO2/ZnO) nanocomposites for the effective removal of organic pollutants and the enhancement of antibacterial activities. Ceram. Int. 2013, 39, 7029–7035. [Google Scholar] [CrossRef]
  32. Zhao, Y.; Zhan, L.; Tian, J.; Nie, S.; Ning, Z. Enhanced electrocatalytic oxidation of methanol on Pd/polypyrrole–graphene in alkaline medium. Electrochim. Acta 2011, 56, 1967–1972. [Google Scholar] [CrossRef]
  33. Chastain, J.; King, R.C., Jr. Handbook of X-Ray Photoelectron Spectroscopy; Perkin-Elmer Corporation: Waltham, MA, USA, 1992; Volume 40, p. 221. [Google Scholar]
  34. Mohammed, W.M.; Gumarov, A.I.; Vakhitov, I.R.; Yanilkin, I.V.; Kiiamov, A.G.; Kharintsev, S.S.; Nikitin, S.I.; Tagirov, L.R.; Yusupov, R.V. (Eds.) Electrical properties of titanium nitride films synthesized by reactive magnetron sputtering. J. Phys. Conf. Ser. 2017, 927, 012036. [Google Scholar] [CrossRef]
  35. Madhugiri, S.; Sun, B.; Smirniotis, P.G.; Ferraris, J.P.; Balkus, K.J., Jr. Electrospun mesoporous titanium dioxide fibers. Microporous Mesoporous Mater. 2004, 69, 77–83. [Google Scholar] [CrossRef]
  36. Xu, J.; Ao, Y.; Fu, D.; Yuan, C. Synthesis of Gd-doped TiO2 nanoparticles under mild condition and their photocatalytic activity. Colloids Surf. A Physicochem. Eng. Asp. 2009, 334, 107–111. [Google Scholar] [CrossRef]
  37. Murcia, J.J.; Hidalgo, M.C.; Navío, J.A.; Vaiano, V.; Ciambelli, P.; Sannino, D. Photocatalytic ethanol oxidative dehydrogenation over Pt/TiO2: Effect of the addition of blue phosphors. Int. J. Photoenergy 2012, 2012, 687262. [Google Scholar] [CrossRef]
  38. John, A.K.; Palaty, S.; Sharma, S.S. Greener approach towards the synthesis of titanium dioxide nanostructures with exposed {001} facets for enhanced visible light photodegradation of organic pollutants. J. Mater. Sci. Mater. Electron. 2020, 31, 20868–20882. [Google Scholar] [CrossRef]
  39. Soomro, S.A.; Gul, I.H.; Naseer, H.; Marwat, S.; Mujahid, M. Improved performance of CuFe2O4/rGO nanohybrid as an anode material for lithium-ion batteries prepared via facile one-step method. Curr. Nanosci. 2019, 15, 420–429. [Google Scholar] [CrossRef]
  40. Malas, A.; Das, C.K. Effect of graphene oxide on the physical, mechanical and thermo-mechanical properties of neoprene and chlorosulfonated polyethylene vulcanizates. Compos. Part B Eng. 2015, 79, 639–648. [Google Scholar] [CrossRef]
  41. Abdel-Hamed, M.O.; Draz, A.A.; Khala, M.; El-Hossary, F.M.; Mohamed, H.F.; Abdel-Hady, E.E. Effect of plasma pretreatment and graphene oxide ratios on the transport properties of PVA/PVP membranes for fuel cells. Sci. Rep. 2024, 14, 1092. [Google Scholar] [CrossRef]
  42. Mohamed, H.F.; Abdel-Hady, E.E.; Mohammed, W.M. Investigation of Transport Mechanism and Nanostructure of Nylon-6, 6/PVA Blend Polymers. Polymers 2022, 15, 107. [Google Scholar] [CrossRef]
  43. Raghuveer, V.; Manthiram, A.; Bard, A.J. Pd−Co−Mo electrocatalyst for the oxygen reduction reaction in proton exchange membrane fuel cells. J. Phys. Chem. B 2005, 109, 22909–22912. [Google Scholar] [CrossRef] [PubMed]
  44. Nath, B.; Barbhuiya, T. Studies on the density and surface area of nanoparticles from Camellia sinensis, A natural source. J. Chem. Pharm. Res. 2014, 6, 608–610. [Google Scholar]
  45. Ramachandran, K.; Raj Kumar, T.; Babu, K.J.; Gnana Kumar, G. Ni-Co bimetal nanowires filled multiwalled carbon nanotubes for the highly sensitive and selective non-enzymatic glucose sensor applications. Sci. Rep. 2016, 6, 36583. [Google Scholar] [CrossRef]
  46. Barakat, N.A.; Moustafa, H.M.; Nassar, M.M.; Abdelkareem, M.A.; Mahmoud, M.S.; Almajid, A.A.; Khalil, K.A. Distinct influence for carbon nano-morphology on the activity and optimum metal loading of Ni/C composite used for ethanol oxidation. Electrochim. Acta 2015, 182, 143–155. [Google Scholar] [CrossRef]
  47. García-Rodríguez, S.; Rojas, S.; Pena, M.; Fierro, J.; Baranton, S.; Léger, J. An FTIR study of Rh-PtSn/C catalysts for ethanol electrooxidation: Effect of surface composition. Appl. Catal. B Environ. 2011, 106, 520–528. [Google Scholar] [CrossRef]
  48. Shenashen, M.A.; Hassen, D.; El-Safty, S.A.; Isago, H.; Elmarakbi, A.; Yamaguchi, H. Axially oriented tubercle vein and X-crossed sheet of N-Co3O4@ C hierarchical mesoarchitectures as potential heterogeneous catalysts for methanol oxidation reaction. Chem. Eng. J. 2017, 313, 83–98. [Google Scholar] [CrossRef]
  49. Zhang, J.; Tse, Y.-H.; Pietro, W.J.; Lever, A. Electrocatalytic activity of N, N′, N″, N‴-tetramethyl-tetra-3, 4-pyridoporphyrazinocobalt (II) adsorbed on a graphite electrode towards the oxidation of hydrazine and hydroxylamine. J. Electroanal. Chem. 1996, 406, 203–211. [Google Scholar] [CrossRef]
  50. Elsharkawy, M.R.M.; Ibrahim, S.; Mohammed, W.M.M. Effect of V2O5 incorporation on the Structural, Electrical, and Conduction Properties of sulfonated PVC/PMMA Blend: Positron Annihilation Study. Egypt. J. Phys. 2024, 52, 65–79. [Google Scholar] [CrossRef]
  51. Elsharkawy, M.R.; Mohammed, W.M. Effect of the electric field on the free volume investigated from positron annihilation lifetime and dielectric properties of sulfonated PVC/PMMA. Polym. Adv. Technol. 2024, 35, e6519. [Google Scholar] [CrossRef]
  52. Zayed, M.; Ahmed, A.M.; Shaban, M. Synthesis and characterization of nanoporous ZnO and Pt/ZnO thin films for dye degradation and water splitting applications. Int. J. Hydrogen Energy 2019, 44, 17630–17648. [Google Scholar] [CrossRef]
  53. Mohamed, I.M.; Yasin, A.S.; Barakat, N.A.; Song, S.A.; Lee, H.E.; Kim, S.S. Electrocatalytic behavior of a nanocomposite of Ni/Pd supported by carbonized PVA nanofibers towards formic acid, ethanol and urea oxidation: A physicochemical and electro-analysis study. Appl. Surf. Sci. 2018, 435, 122–129. [Google Scholar] [CrossRef]
  54. Zeng, F.; Mebrahtu, C.; Liao, L.; Beine, A.K.; Palkovits, R. Stability and deactivation of OER electrocatalysts: A review. J. Energy Chem. 2022, 69, 301–329. [Google Scholar] [CrossRef]
  55. Kaur, A.; Kaur, G.; Singh, P.P.; Kaushal, S. Supported bimetallic nanoparticles as anode catalysts for direct methanol fuel cells: A review. Int. J. Hydrogen Energy 2021, 46, 15820–15849. [Google Scholar] [CrossRef]
  56. Siwal, S.S.; Thakur, S.; Zhang, Q.; Thakur, V.K. Electrocatalysts for electrooxidation of direct alcohol fuel cell: Chemistry and applications. Mater. Today Chem. 2019, 14, 100182. [Google Scholar] [CrossRef]
  57. Liu, C.; Yang, F.; Schechter, A.; Feng, L. Recent progress of Ni-based catalysts for methanol electrooxidation reaction in alkaline media. Adv. Sens. Energy Mater. 2023, 2, 100055. [Google Scholar] [CrossRef]
  58. Feng, L.-J.; Zhang, X.-H.; Zhao, D.-M.; Wang, S.-F. Electrochemical studies of bovine serum albumin immobilization onto the poly-o-phenylenediamine and carbon-coated nickel composite film and its interaction with papaverine. Sens. Actuators B Chem. 2011, 152, 88–93. [Google Scholar] [CrossRef]
  59. Gomaa, M.M.; Abdel-Hamed, M.O.; Ibrahim, M.; Abdel-Hady, E.E.; Elsharkawy, Y.S. High-Performance Methanol Oxidation via Ni12-Metal8/CNF Catalyst for Fuel Cell Applications. Catalysts 2024, 14, 680. [Google Scholar] [CrossRef]
  60. Chen, M.; Du, C.; Yin, G.; Shi, P.; Zhao, T. Numerical analysis of the electrochemical impedance spectra of the cathode of direct methanol fuel cells. Int. J. Hydrogen Energy 2009, 34, 1522–1530. [Google Scholar] [CrossRef]
  61. Lai, C.-Y.; Huang, W.-C.; Weng, J.-H.; Chen, L.-C.; Chou, C.-F.; Wei, P.-K. Impedimetric aptasensing using a symmetric Randles circuit model. Electrochim. Acta 2020, 337, 135750. [Google Scholar] [CrossRef]
  62. Manohar, A.K.; Bretschger, O.; Nealson, K.H.; Mansfeld, F. The use of electrochemical impedance spectroscopy (EIS) in the evaluation of the electrochemical properties of a microbial fuel cell. Bioelectrochemistry 2008, 72, 149–154. [Google Scholar] [CrossRef]
  63. Zhu, X.; Zhang, P.; Xu, S.; Yan, X.; Xue, Q. Free-standing three-dimensional graphene/manganese oxide hybrids as binder-free electrode materials for energy storage applications. ACS Appl. Mater. Interfaces 2014, 6, 11665–11674. [Google Scholar] [CrossRef] [PubMed]
  64. Wu, Q.; Jiang, M.; Zhang, X.; Cai, J.; Lin, S. A novel octahedral MnO/RGO composite prepared by thermal decomposition as a noble-metal free electrocatalyst for ORR. J. Mater. Sci. 2017, 52, 6656–6669. [Google Scholar] [CrossRef]
  65. Chen, F.; Guo, S.; Yu, S.; Zhang, C.; Guo, M.; Li, C. Hierarchical N-doped carbon nanofiber-loaded NiCo alloy nanocrystals with enhanced methanol electrooxidation for alkaline direct methanol fuel cells. J. Colloid Interface Sci. 2023, 646, 43–53. [Google Scholar] [CrossRef] [PubMed]
  66. Cheshideh, H.; Nasirpouri, F. Cyclic voltammetry deposition of nickel nanoparticles on TiO2 nanotubes and their enhanced properties for electro-oxidation of methanol. J. Electroanal. Chem. 2017, 797, 121–133. [Google Scholar] [CrossRef]
  67. Hosseini, M.G.; Momeni, M.; Faraji, M. Highly active nickel nanoparticles supported on TiO2 nanotube electrodes for methanol electrooxidation. Electroanalysis 2010, 22, 2620–2625. [Google Scholar] [CrossRef]
  68. Hu, G.-H.; Zeng, H.-X.; Wei, Z.-G.; Pan, Z.-C.; Xie, S.-G.; Zou, Y.-D. Electrocatalytic Oxidation of Ethanol on Ni-P-TiO2 Composite Coating electrodes. J. Electrochem. 2012, 18, 16. [Google Scholar] [CrossRef]
  69. Mahapatra, S.; Datta, J. Characterization of Pt-Pd/C electrocatalyst for methanol oxidation in alkaline medium. Int. J. Electrochem. 2011, 2011, 563495. [Google Scholar] [CrossRef]
Figure 1. (A) Scanning electron microscope images with different magnifications for sample T2 after the carbonization process. (B) three-dimensional topographical representation of a surface. (C) Abbott–Firestone curve and sample depth histogram. (D) TEM micrograph and (E) the histogram of the size distribution for the sample T2.
Jcs 09 00125 g001
Figure 2. SEM matched with mappings of elements Ni(12)Co(5)TiO2(3) NPs/CNFs. EDX spectrum for Ni-Co- TiO2 Sample.
Jcs 09 00125 g002
Figure 3. XPS spectra of NiCoTiO2/CNF: (A) Survey, (B) Carbon, (C) Nickel, (D) Cobalt, (E) Titanium, and (F) Oxygen.
Jcs 09 00125 g003aJcs 09 00125 g003b
Figure 4. XRD patterns for the two fabricated samples.
Jcs 09 00125 g004
Figure 5. (A) Consecutive cyclic voltammogram (T2) in 1.0 M KOH solution (100 mV/s SR). Electric potential dependence of current density for T1, T2 prepared electrodes in (B) ethanol and (C) methanol fuels.
Jcs 09 00125 g005
Figure 6. Catalysts T1 (A,B) and T2 (C,D) exhibit electrocatalytic activity in 1.0 M KOH when 0.5, 1.0, and 2 M ethanol and methanol are present, with SR 100 mVs−1. The correlation between JPE and methanol and ethanol concentrations is shown in the inset.
Jcs 09 00125 g006aJcs 09 00125 g006b
Figure 7. CVs of Sample T1 in (A) 2 M ethanol and (B) 2 M methanol, and Sample T2 in (C) 0.5 M ethanol and (D) 0.5 M methanol at various scan rates (10−100 mV/s).
Jcs 09 00125 g007
Figure 8. The dependency of the current density on scan rate1/2 in (A) ethanol and (B) methanol. The log scan rate dependency of the anodic peak potential in (C) ethanol and (D) methanol.
Jcs 09 00125 g008
Figure 9. LSV plots of the produced NFs (T1, T2) in KOH solution (1.0 M concentration) containing ethanol (A) and methanol (B) at ambient temperature with SR 100 mV/s.
Jcs 09 00125 g009
Figure 10. Chronoamperometry measurements of the current density variation over time for the electrodes T1 and T2 in (A) ethanol and (B) methanol.
Jcs 09 00125 g010
Figure 11. Nyquist plots for the T1 electrode in (a) methanol and (b) ethanol and the T2 electrode in (c) methanol and (d) ethanol.
Jcs 09 00125 g011
Table 1. The electrocatalysts’ metal composition with a 20% total metal loading.
Catalyst Ni (%) Co (%) TiO2 (%)
T1 1271
T2 1253
Table 2. Crystallite size and SA calculated values from the XRD outcomes.
Samples (hkl) Peak Position
(Degree)
FWHM
(Degree)
D (nm)
(Sherrer Equation)
Surface Area (m2/g)
T1 (101) (TiO2)25.140.7810.9065.24 ± 0.052
(112) (TiO2)37.750.8410.43
(111) (Ni)44.241.078.31
T2 (101) (TiO2)25.161.097.8062.78 ± 0.063
(112) (TiO2)37.350.869.79
(111) (Ni)44.300.959.06
Table 3. Calculated values of electrochemical parameters of the two catalysts. JPE stands for the extension peak’s current density values at a potential of 0.79 V.
Fuel TypeConc.TiO2 3% (T2)TiO2 1% (T1)
(JPE) mA/cm2(JP) mA/cm2(V) Peak Potential(JPE) mA/cm2(JP) mA/cm2(V) Peak Potential
Ethanol0.0 M38.408.600.26824.39.520.376
0.5 M74.2142.110.53930.083.770.483
1.0 M63.0039.330.53948.186.000.465
2.0 M38.0121.870.49957.810.510.469
3.0 M 53.310.160.466
Methanol0.0 M38.6012.250.30624.49.440.362
0.5 M60.3941.870.57627.557.960.352
1.0 M55.8037.320.54935.6310.090.344
2.0 M51.0332.430.53338.6910.860.372
3.0 M 37.729.910.344
Table 4. Rs, Rct, and Cdl values of both Ni12Co7(TiO2)1 and Ni12Co5(TiO2)3 electrodes in different concentrations of methanol and ethanol fuels.
ConcentrationMethanolEthanol
Rs (Ω) Rct (Ω)Cdl (mF)Rs (Ω) Rct (Ω)Cdl (mF)
Ni12Co7(TiO2)10.5 M40.68 ± 0.2131.5 ± 0.1612 ± 0.03634.30 ± 0.1725.82 ± 0.1312 ± 0.036
1 M36.72 ± 0.1826.67 ± 0.1310.95 ± 0.0332.71 ± 0.1620.61 ± 0.1011.3 ± 0.033
2 M33.10 ± 0.1722.35 ± 0.119.20 ± 0.2827.23 ± 0.1417.03 ± 0.0910.9 ± 0.033
Ni12Co5(TiO2)30.5 M25.09 ± 0.1323.12 ± 0.1110.78 ± 0.0323.42 ± 0.1221.67 ± 0.1110 ± 0.030
1 M28.94 ± 0.1427.37 ± 0.1311 ± 0.03332.34 ± 0.1627.92 ± 0.1410.5 ± 0.032
2 M30.65 ± 0.1528.41 ± 0.1412 ± 0.03637.86 ± 0.1943.22 ± 0.2212 ± 0.036
Table 5. Related studies with various metal additives, onset potential, electrolyte, and peak current density.
CatalystPreparation MethodElectrolyteE Onset (mV)Current (mA/cm2)Refs.
Co1–Ni4/GrapheneSol-Gel1 M Methanol + 1 M KOH~0.222.5[20]
Ni1Co3/GrapheneElectrochemical co-deposition1 M Methanol + 1 M KOH~0.215.82[21]
Ni-Co/RGOSol-Gel1 M Ethanol + 1 M NaOH~0.430[22]
NiCo2O4 nanocatalystnanofibers1 M Methanol + 0.1 M NaOH~0.321[65]
Ni NPs/TNTs/TiDC electrodeposition0.5 M NaOH + 0.5 M methanol~0.62.56[66]
Ni/TiO2/Tinanotubes0.5 M NaOH + 0.1 M methanol~0.354.5[67]
Ni-P-TiO2 compositecoating0.5 M Ethanol + 1 M KOH~0.4223.3[68]
Pt/CNanoparticles1 M Methanol + 1 KOH~0.4100[69]
Ni12Co5(TiO2)3/CNFsNanofiber0.5 M Methanol + 1 M KOH~0.460.39In this study
Nanofiber0.5 M Ethanol + 1 M KOH~0.3774.21In this study
Disclaimer/Publisher’s Note: The statements, opinions and data contained in all publications are solely those of the individual author(s) and contributor(s) and not of MDPI and/or the editor(s). MDPI and/or the editor(s) disclaim responsibility for any injury to people or property resulting from any ideas, methods, instructions or products referred to in the content.

