Article

Leveraging Delayed Strength Gains in Supplementary Cementitious Material Concretes: Rethinking Mix Design for Enhanced Cost Efficiency and Sustainability

by
Wanderson Santos de Jesus
1,
Thalles Murilo Santos de Almeida
1,
Suânia Fabiele Moitinho da Silva
1,
Marcelo Tramontin Souza
1,*,
Eduarda Silva Leal
2,
Ramon Santos Souza
1,
Laio Andrade Sacramento
3,
Ivan Bezerra Allaman
4 and
José Renato de Castro Pessôa
1
1
Graduate Program in Science, Innovation and Modeling in Materials (PROCIMM), Department of Engineering and Computing, State University of Santa Cruz (UESC), Ilhéus 45662-900, BA, Brazil
2
Department of Agrarian and Environmental Sciences (DCAA), State University of Santa Cruz (UESC), Ilhéus 45662-900, BA, Brazil
3
Department of Engineering and Computing, State University of Santa Cruz (UESC), Ilhéus 45662-900, BA, Brazil
4
Department of Exact Sciences, State University of Santa Cruz (UESC), Ilhéus 45662-900, BA, Brazil
*
Author to whom correspondence should be addressed.
J. Compos. Sci. 2025, 9(3), 110; https://doi.org/10.3390/jcs9030110
Submission received: 29 January 2025 / Revised: 17 February 2025 / Accepted: 24 February 2025 / Published: 26 February 2025

Abstract

Engineers commonly use the 28-day characteristic strength of concrete for project calculations, but this may not reflect the full-strength potential, especially in concretes with supplementary cementitious materials (SCMs). SCMs, known for their slow reactivity, often delay optimal strength beyond 28 days, requiring higher cement content to speed up early strength development, thus increasing production costs. This study examined the relationship between concrete age and mechanical strength across eight cement types, including tests for axial compression, water absorption, void index, and specific mass. The findings showed that pozzolan and slag cements gained significant long-term strength due to slow pozzolanic reactions. Conversely, limestone filler mixes had lower initial strength and slower progress, likely due to increased porosity from fine fillers. A correlation was found between higher pozzolan content and improved durability, including reduced water absorption and void index. Cost analysis indicated that optimizing cement mix designs for targeted strength levels could reduce production costs, especially for concretes with high SCM content. Using long-term characteristic strength rather than the traditional 28-day strength resulted in approximately 14% savings, particularly for slag- and pozzolan-based cements. The savings were less significant for other cement types, emphasizing the importance of adjusting mix designs based on both performance and financial considerations.

1. Introduction

To combat global warming, carbon dioxide emissions from human activities such as fossil fuel burning, cement production, and deforestation must be reduced to zero. This pressing challenge has fueled growing interest in albedo modification, a climate intervention that involves injecting reflective substances into the stratosphere to enhance sunlight reflection. Initially introduced as a “Plan B” in case decarbonization efforts fall short, albedo modification is often seen as a potential last-resort solution to mitigate severe climate change. This underscores the urgent need for comprehensive efforts to reduce carbon emissions as the primary and most sustainable approach to addressing the climate crisis [1].
Cement is the most consumed man-made material in the world. Each year, more than 4 billion tons of cement are produced [2]. According to the Global Cement and Concrete Association (GCCA) [3], approximately 14 billion cubic meters of concrete are used annually. In Brazil, cement sales totaled 64.7 million tons in 2024, as reported by the National Cement Industry Union (SNIC) [4].
The cement industry has a high polluting potential. The British research institute Chatham House [2] has estimated that this sector is responsible for approximately 7 to 8% of all global CO2 emissions, one of the main greenhouse gases. The environmental impacts of the cement production process can occur at practically every stage, from the extraction of raw materials to the production and final disposal of the material.
According to data from the World Business Council for Sustainable Development (WBCSD) report [5], approximately 50 to 60% of CO2 emissions result from the process of calcining limestone (CaCO3) to form clinker. Around 30 to 40% of emissions come from burning coal and other fossil fuels used to heat kilns to temperatures of over 1400 °C. In this context, the use of cements with a lower clinker content therefore reduces the environmental impact, as it implies.
Concrete showcases a diverse array of properties, with strength being particularly pivotal in the construction industry, capturing the attention of designers and quality control engineers. It is essential to underscore that the compressive strength of concrete significantly surpasses its tensile strength, the latter of which is fortified through the integration of steel rebars. In this framework, compressive strength takes center stage as the paramount parameter for analysis in the design of structural elements [6].
It is widely acknowledged that the concrete strength at 28 days serves as a crucial indicator of characteristic strength, marking the initial benchmark for quality assessment. Beyond this period, the strength gain tends to progress more gradually in concretes employing ordinary Portland cement (without supplementary cementitious materials, SCMs). Conversely, for pozzolanic cements, a noteworthy increase in strength becomes evident in the subsequent weeks. Lopes et al. [7] undertook a study utilizing industrial residues in the production of sustainable concrete, assessing its compressive mechanical strength at 7, 28, and 56 days. Notably, an increase in strength was observed across all concrete ages. Sun et al. [8] assessed the compressive strength of concretes incorporating partial cement replacement with fly ash. For a 40% substitution of fly ash, the concrete strength was found to be approximately 44% lower than the reference concrete strength at 1-day age and about 8% lower at 28-days age. The strengths converged and became equivalent at 90 days of hydration. When the fly ash content increases to 55%, the compressive strength at 28 days is equivalent to the reference concrete strength at only 1 day of hydration. While the authors did not evaluate the strength beyond 110 days of age, it is reasonably safe to assert from their data that the same sample would require approximately 100 to 200 days of hydration to achieve the strength equivalent to the 28-day age of the reference sample.
In the realm of concrete technology, the pozzolanic reaction with SCMs unfolds gradually, in contrast to the rapid hydration reactions of Portland cement. SCMs like fly ash and ground granulated blast-furnace slag require extended activation periods in the presence of alkalis and calcium hydroxide. The activation process is influenced by factors such as particle size, reactivity, inhibiting impurities, and environmental conditions. Finely ground SCMs exhibit higher reactivity, but even with optimal fineness, complete reactivity takes time. Inhibiting factors, such as impurities and environmental conditions, can further slowdown the pozzolanic reaction. The suppression of the reaction by calcium hydroxide (CH) is another critical aspect. As known, the pozzolanic reaction consumes CH and forms additional CSH. However, the limited availability of CH initially may delay the reaction until sufficient CH becomes available over time. Temperature dependence and the necessity for proper curing conditions add further complexity [9].
There are several commercial types of cement, each featuring distinct types and proportions of supplementary cementitious materials (SCMs), significantly influencing the rate of mechanical strength development. The Brazilian standard NBR 16697 [10] establishes normative designations for each cement type, encompassing five classes and a total of 11 types, accounting for the different types and proportions of SCMs. Brazilian cements incorporating fly ash and slag are designated PC II Z and PC II E, with relatively low additions of pozzolan (up to 14%) and blast-furnace slag (up to 34%), respectively. Another type, named PC III, is characterized by higher levels of blast-furnace slag (up to 75%), while PC IV cement features a substantial pozzolan content (up to 50%). Those cements can also be designed to be sulfate-resistant (SR), where the content of tricalcium aluminate (C3A) is intentionally limited to 5%, and the quantity of (2C3A + C4AF) is restricted to below 25%. These minerals are especially vulnerable to sulfate attack, as they can interact with sulfate ions, forming expansive compounds such as ettringite, which can contribute to concrete degradation. Therefore, the gain in concrete strength is strongly influenced by the rate of formation of hydration products, and the type of cement plays a crucial role in this process.
While the 28-day compressive strength is widely used as a benchmark for structural design, the long-term strength development of concrete, particularly with cements containing SCMs, is critical for evaluating durability and optimizing material use. Pozzolanic reactions, which occur more slowly than clinker hydration, contribute significantly to strength gain beyond 28 days. Concretes incorporating SCMs may take several months to reach strengths comparable to reference mixes without SCMs, depending on the type and proportion used. Therefore, this study assesses the compressive strength of concrete at both 28 days and 28 weeks (196 days) to better understand the long-term performance of SCM concretes. By considering longer curing times in structural design, it may be possible to reduce cement consumption and overall concrete costs, making construction more economically and environmentally sustainable.

2. Materials and Methods

The research was conducted through a quantitative–qualitative, exploratory, and experimental methodology. The concrete mixes were designed using the method established by the Brazilian Portland Cement Association (ABCP). A total of 136 specimens were produced, 17 for each type of concrete to be analyzed in the axial compressive strength (NBR 5739 [11]), water absorption, void index and specific mass (NBR 9778 [12]) tests at 28 and 196 days.

2.1. Features of Starting Materials

In this research, eight different types of cement with a strength of 32 MPa, commonly used in Brazilian construction, were employed. These included PC II E, PC II E-SR, PC II Z, PC III-SR, PC IV, PC IV-SR, PC II F, and PC II F-SR. The last two types do not contain slag and pozzolanic material, allowing for an assessment of the influence of supplementary cementitious materials (SCMs) on strength development and four of the eight types of concrete studied were produced with sulfate-resistant (SR) cements.
Table 1 presents the types and permissible minimum and maximum SCM content in the composition of each cement type, according to the NBR 16697 [10] standard.
It is worth mentioning that commercial cements are also marketed with characteristic strengths of 25 and 40 MPa, in addition to 32 MPa. The adjustment of characteristic strengths is typically achieved by reducing or increasing the use of SCMs, as well as controlling their particle size.
In addition to hydraulic binders, fine sand with a fineness modulus of 1.71, washed, was employed as the fine aggregate, while type zero gravel (between 4.8 and 9.5 mm) served as the coarse aggregate. The potable water used in the mix was supplied by the public water network managed by the Bahia Water and Sanitation Company (EMBASA, Salvador, Bahia, Brazil) and the additive utilized was the Bauchemie® (Bottrop, Germany) Superplasticizer MC-PowerFlow 1180. Table 2 provides the specific masses (Kg/m3) as supplied by the manufacturers of the cements used. It also presents the physical properties of the aggregates, obtained in the laboratory through the procedures outlined in standards NBR 16916 [13] for “Fine Aggregate-Determination of Density and Water Absorption” and NBR 16917 [14] for “Coarse Aggregate–Determination of Density and Water Absorption.”

2.2. Mix Design of Concretes

The method employed for dosing was provided by the Brazilian Portland Cement Association (ABCP), utilizing the Abrams Curve to determine the water/cement ratio. This calculation considers the required concrete strength at 28 days (fcj28) and the characteristic strength of the cement used. The selection of the concrete strength (fck) followed the recommendation of NBR 6118 [16] for highly aggressive environments (Class IV).
Reference concretes were dosed with an estimated axial compression strength of 40 MPa and a water/cement ratio below 0.45, as also suggested by NBR 6118 [16]. The slump was set at 200 mm. The slump test was conducted to assess concrete consistency, adhering to the guidelines of NBR 16889 [17]. With this slump value, the concretes demonstrated excellent workability, minimizing the risk of improper molding and air incorporation. A superplasticizer additive was employed to enhance the workability of the concrete, especially given the reduced water/cement ratio in the mixes. The dosage of the additive was fine-tuned as needed during production to achieve the initially set slump levels of 200 mm while ensuring it remained below the limit stipulated by the manufacturer, which corresponded to 1% of the cement dosage.
To distinguish and identify the concretes, they were named according to the type of cement used in their production. Table 3 outlines the defined proportions of materials for the fabrication of the specimens. The use of cements with different specific masses results in changes to the mixture’s composition. With regard to the water/cement ratio (w/c), a value of 0.35 was taken from the Abrams curve.

2.3. Characterization of the Manufactured Concretes

2.3.1. Compressive Strength Test

After a curing period of 28 days immersed in a saturated solution of hydrated lime, followed by an additional 168 days of air curing, the test specimens underwent grinding using a diamond saw. Subsequently, five specimens from each mix, at the ages of 28 and 196 days, underwent the mechanical test of axial compression, following the guidelines of NBR 5739 [11]). This standard specifies that the test loading should be applied continuously and without shocks at a rate of 0.45 ± 0.15 MPa/s. To conduct this test, an EMIC hydraulic press model PC 200C, with a loading capacity of up to 2000 KN, was used. The press, along with a fractured specimen and the results of the axial compression test, are presented in Figure 1.

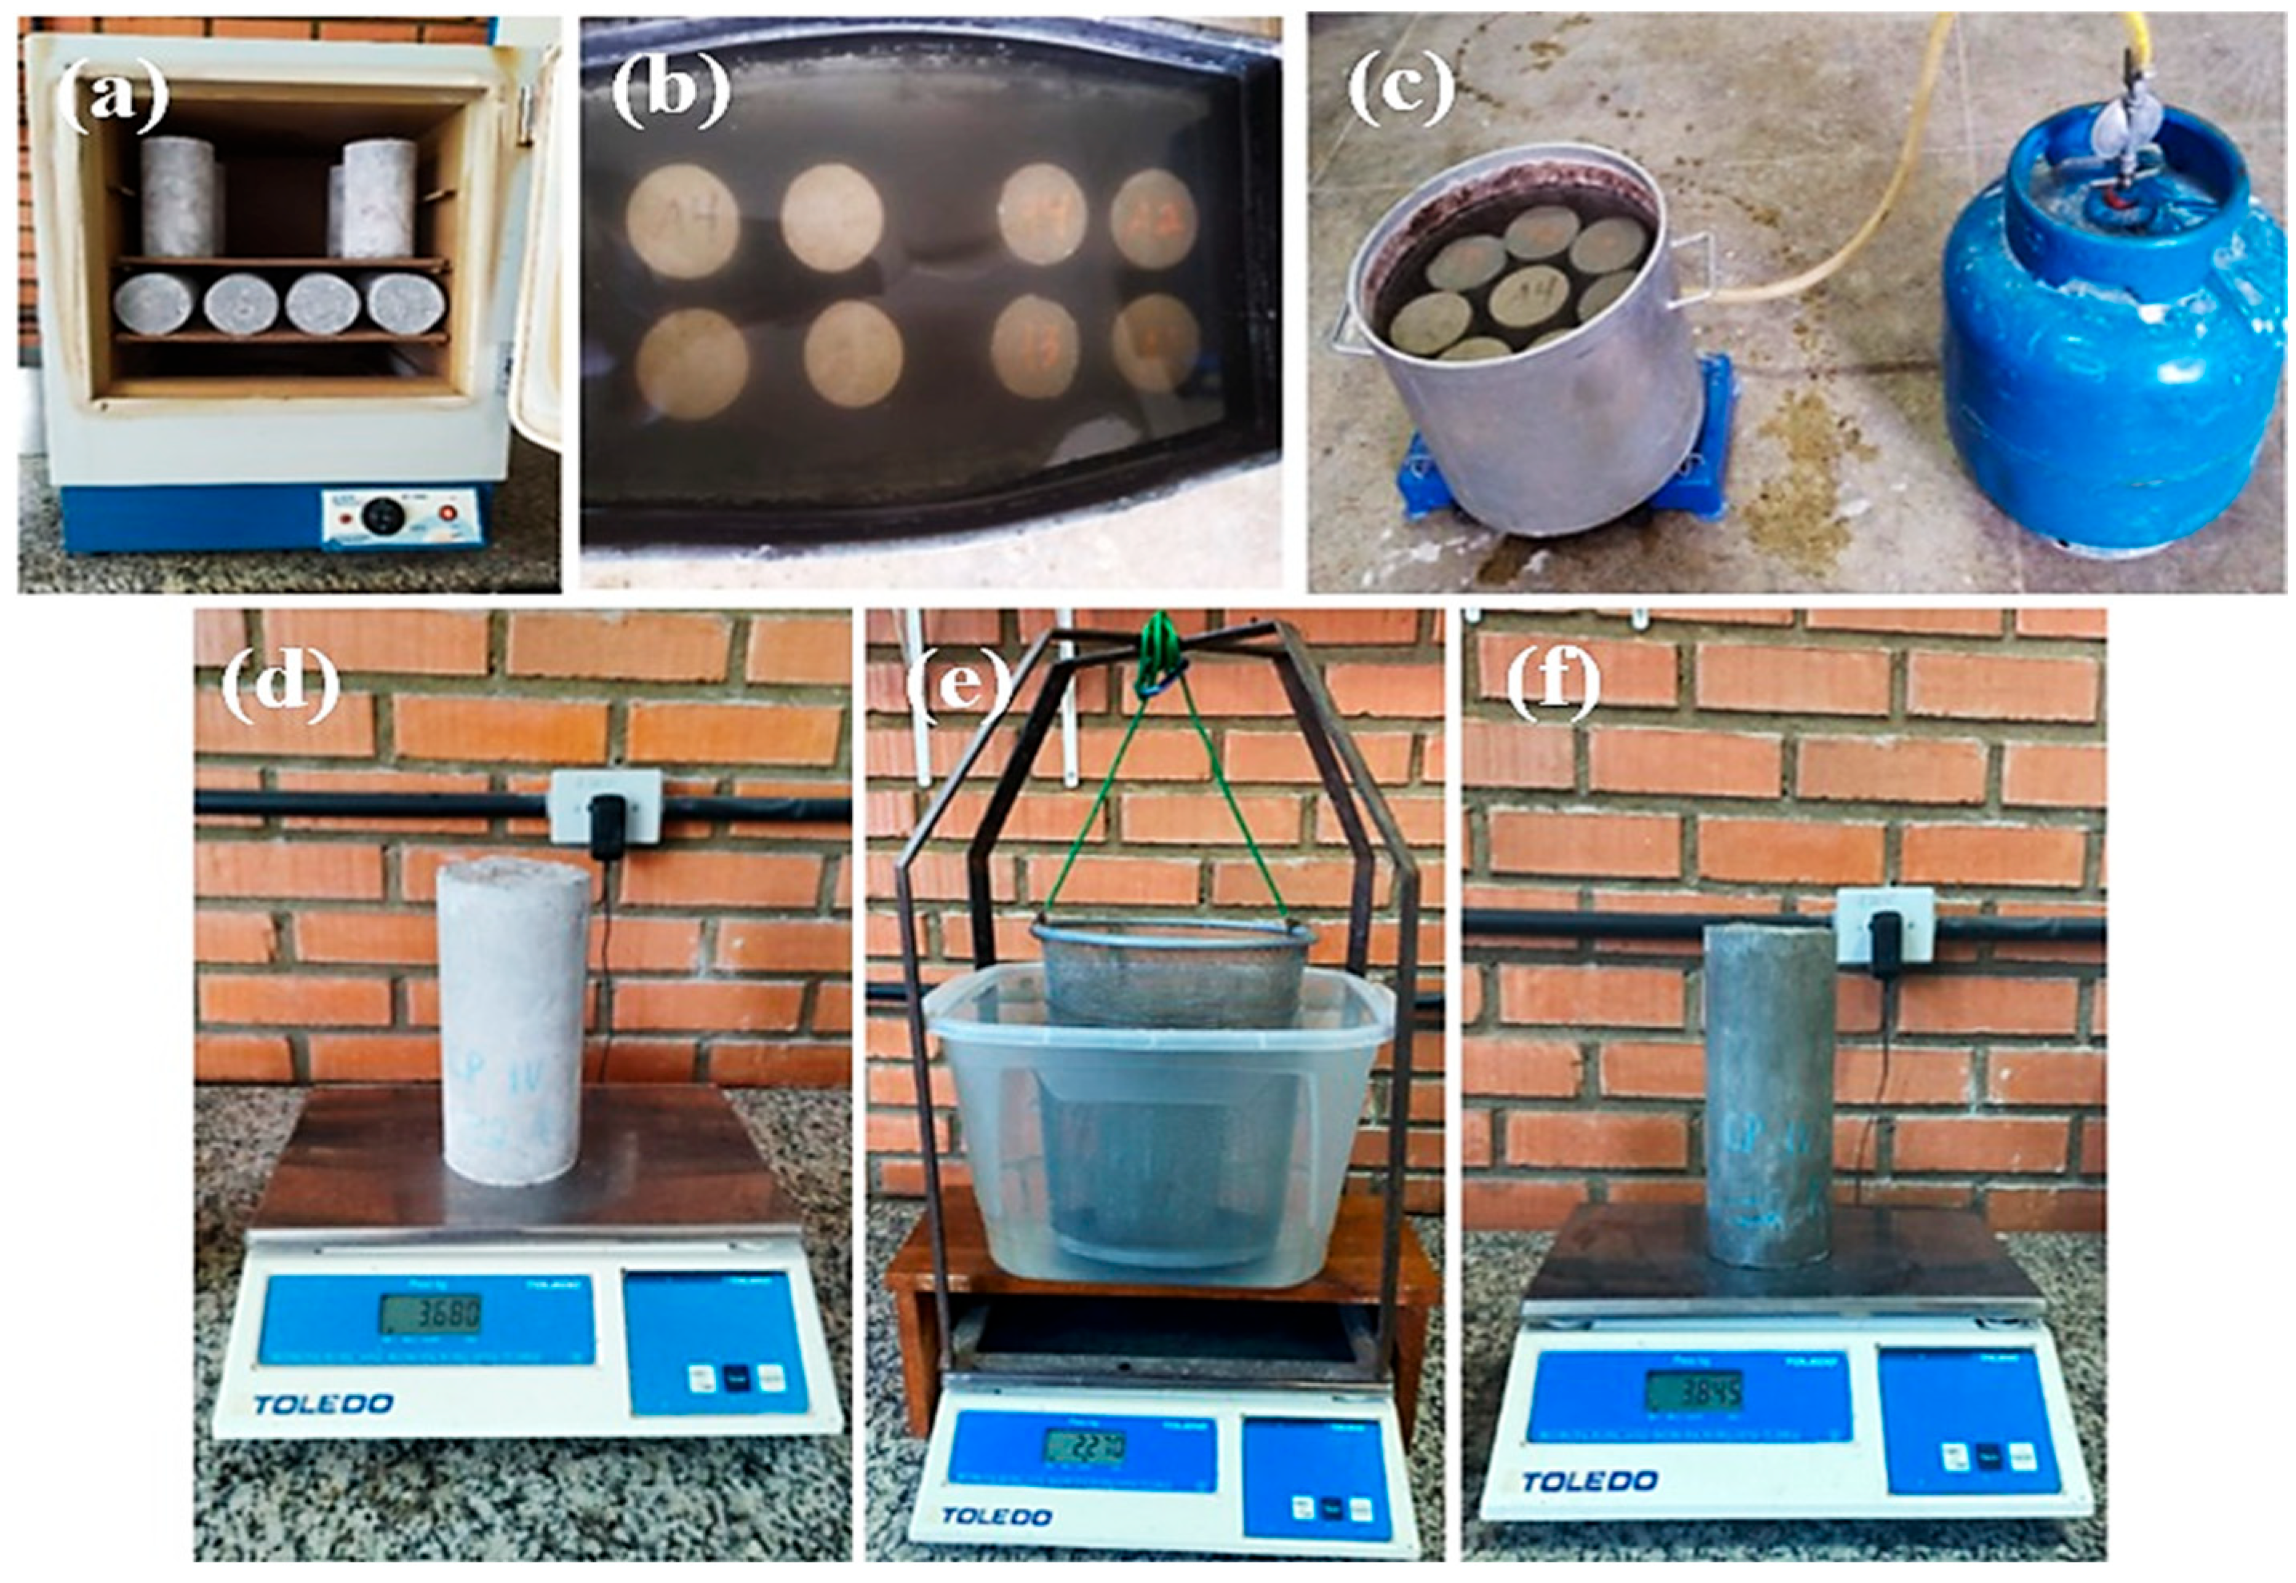
2.3.2. Water Absorption Test, Void Content, and Specific Mass Determination

Four specimens from each mix were randomly selected at 28 days and 196 days, adhering to the guidelines of NBR 9778 [12]. The specimens underwent a 72-h period in an oven at 105 ± 5 °C (Figure 2a). Immediately after removal from the oven, they were meticulously weighed to determine the mass in the dry condition (Figure 2d). Subsequently, the specimens were immersed in water (Figure 2b) at a temperature of 23 ± 2 °C for an additional 72 h. Following this, the samples were placed in a boiler with water (Figure 2c), gradually brought to a boil at intervals of 15 to 30 min, and maintained in this condition for 5 h with a constant water volume. The water was then allowed to cool naturally to a temperature of 23 ± 2 °C. The immersed mass in water was recorded using a hydrostatic balance (Figure 2e). Subsequently, the sample was removed from the hydrostatic balance, dried with a damp cloth, and the mass of the saturated sample was recorded (Figure 2f).
To calculate the percentage water absorption (WA), Equation (1) was utilized, where msat represents the mass (g) of the sample saturated in water after immersion and boiling, and md represents the mass (g) of the sample dried in an oven.
W A = m s a t m d m d × 100
The void index (VI) was calculated using Equation (2), where mw represents the mass (g) of the sample saturated in water after boiling.
V I = m s a t m d m s a t m w × 100
The specific mass ( ρ r ) of the sample (g/cm3) was calculated using Equation (3).
ρ r = m d m d m w

2.4. Comparative Cost Analysis

Based on the compressive strengths achieved at 28 and 196 days, the percentage increases relative to the minimum design strength of 40 MPa were determined. Given that mechanical strength is inversely proportional to the water/cement (w/c) ratio, the corresponding w/c ratios for the average experimental strengths at the studied ages were calculated using the compressive strength versus w/c ratio for a cement with 32 MPa from the Abrams curve, as depicted in Figure 3.
With the calculated w/c ratios, a percentage adjustment was made to the original mix designs, estimating the production of concrete with altered material consumption. This allowed for a performance and financial comparison between the mix designs. Local market average prices for the materials were researched to assess the financial impact of using different curing ages for the various types of Portland cement in the concretes.

2.5. Statistical Analysis

The statistical analysis of the data followed a completely randomized experimental design. An analysis of variance was used to assess possible significant differences between treatments. When such differences were identified, the Scott-Knott multiple mean comparison test was used. All the assumptions of the analysis of variance, such as normality and homoscedasticity of the residuals, were duly verified. The significance level adopted was 5%. R software, 4.4.3 version, (R Core Team [19]) was used to analyze the data, along with the Scott-Knott package, version 1.3-0 [20].
Treatment refers to the variable being analyzed in that situation. In this research, it can only refer to axial compressive strength, water absorption, void index, and actual specific mass. However, when the term “days” is mentioned, it can only refer to the days in which the concretes were evaluated, i.e., 28 and 196 days.

3. Results

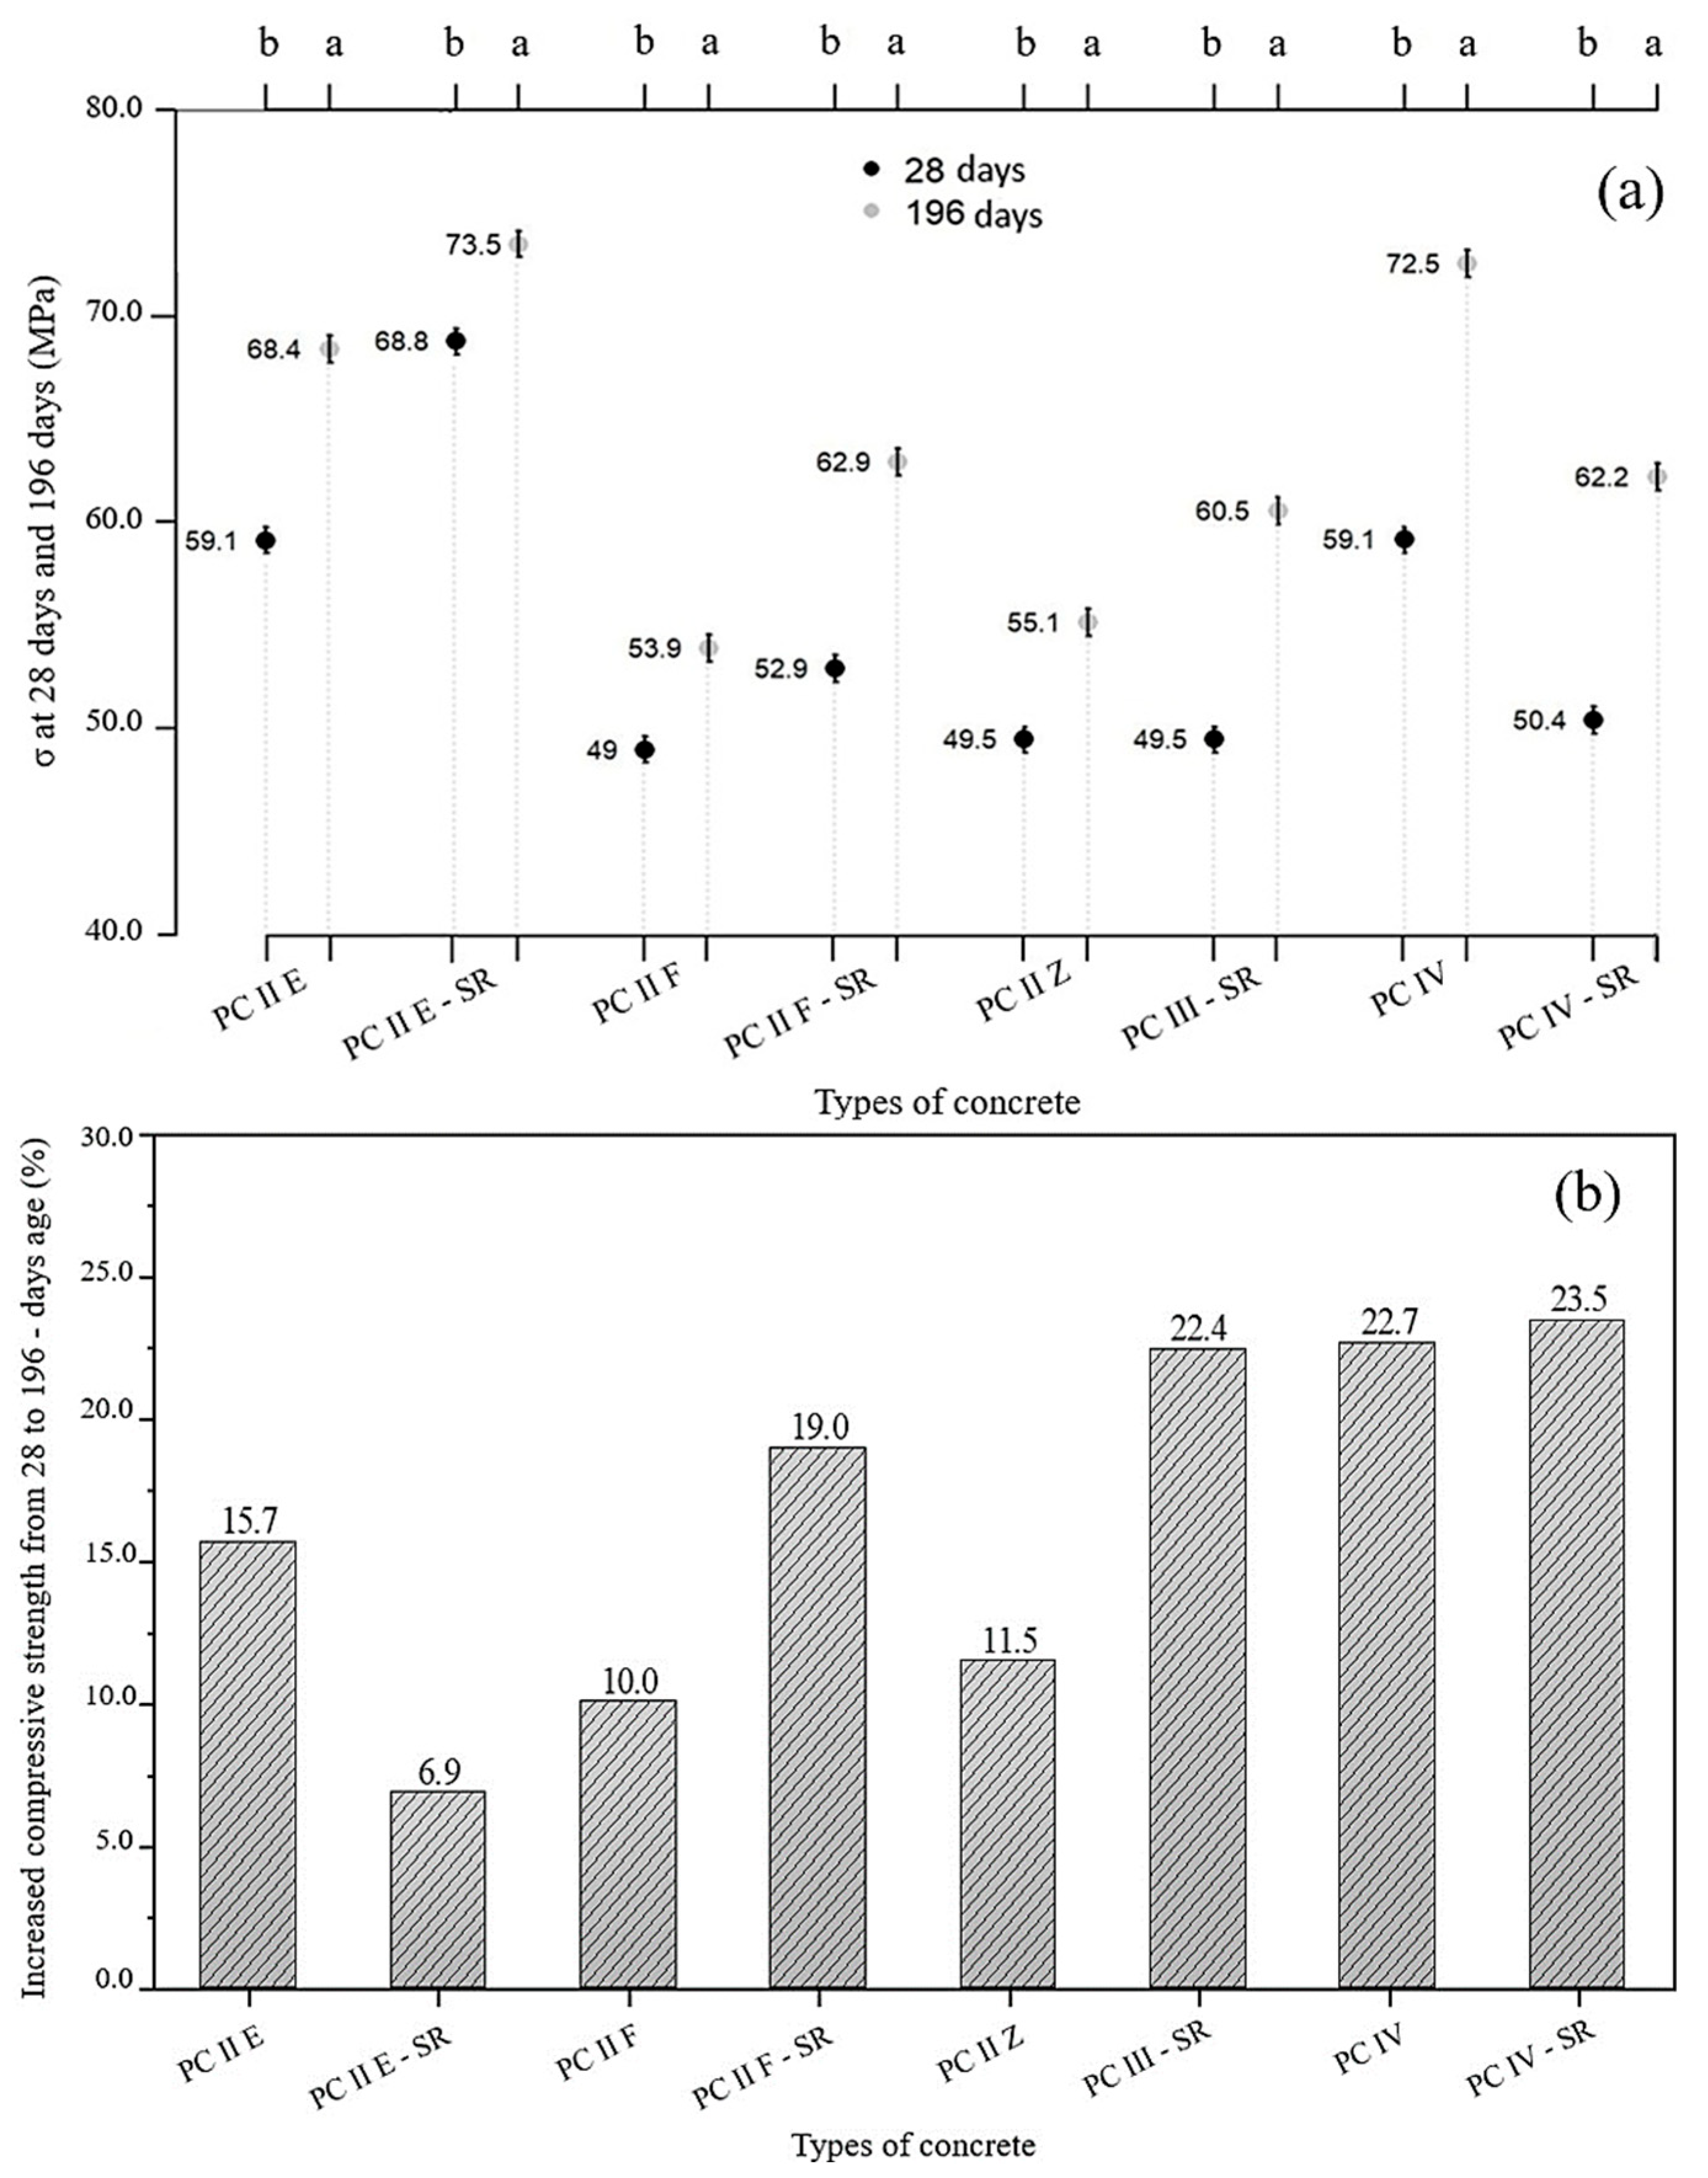
3.1. Resistance to Axial Compression

Figure 4a,b present comparative graphs of the statistical analyses of concrete compressive strength at 28 days and 196 days, respectively. Distinct lowercase letters in the graphs indicate statistically significant differences between the axial compressive strengths of the concretes, as determined by the Scott-Knott test at a 5% significance level.
At 28 days, concrete PC II E-SR showed the best performance, followed by PC IV and PC II E, which were statistically equal. Next was PC II F-SR, followed by four other concretes with statistically equal compressive strengths ranging from 49 to 50.4 MPa. At 196 days, PC IV became statistically equal to PC II E-SR. Similarly, PC II F-SR and PC IV-SR also showed statistically similar performance. Notably, concretes PC IV-SR and PC III-SR, which were statistically similar to PC II E and PC II Z in mechanical performance at 28 days, showed substantial increases in compressive strength and differentiated themselves at 196 days.
Figure 5a compares the mechanical performance of concretes individually between the two ages. It is evident that all concretes at 196 days exhibited statistically higher compressive strengths than at 28 days, with some concretes showing greater improvements than others. Figure 5b illustrates the percentage differences. Concretes with higher contents of supplementary cementitious materials, such as PC III-SR, PC IV-SR, and PC IV, displayed the highest differences due to the slower reactivity of these cements. Conversely, PC II E-SR showed the lowest difference.

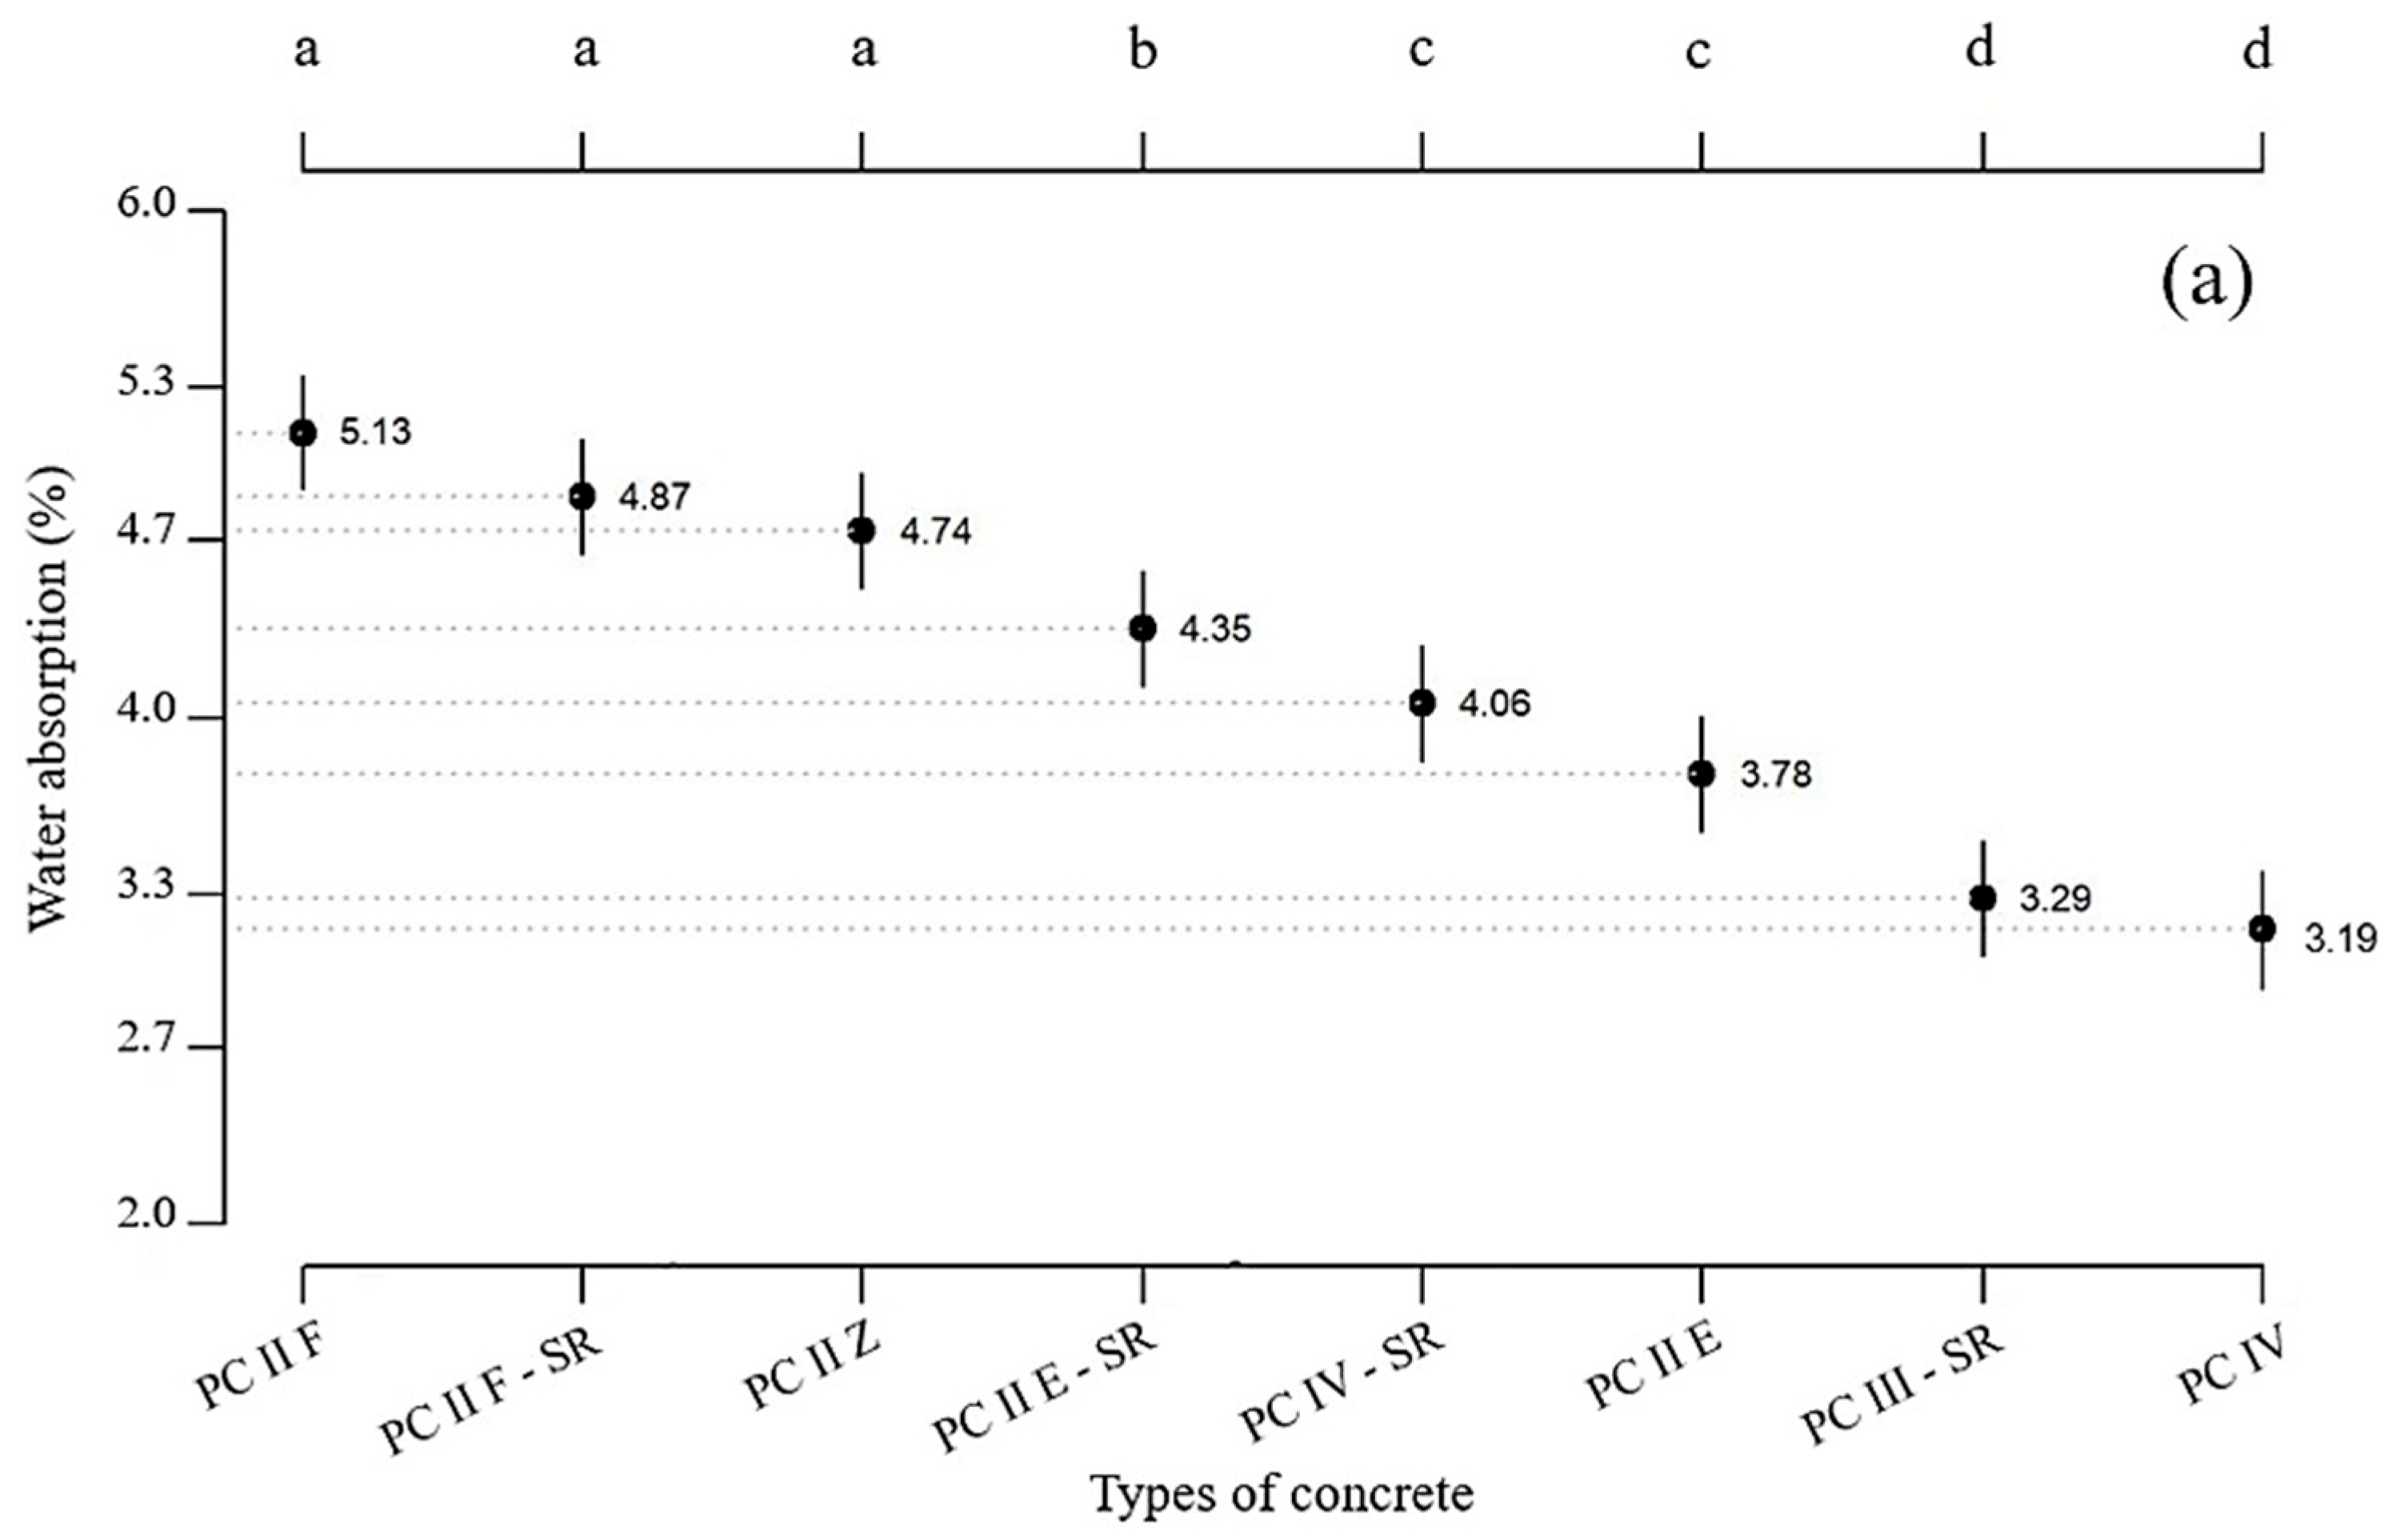
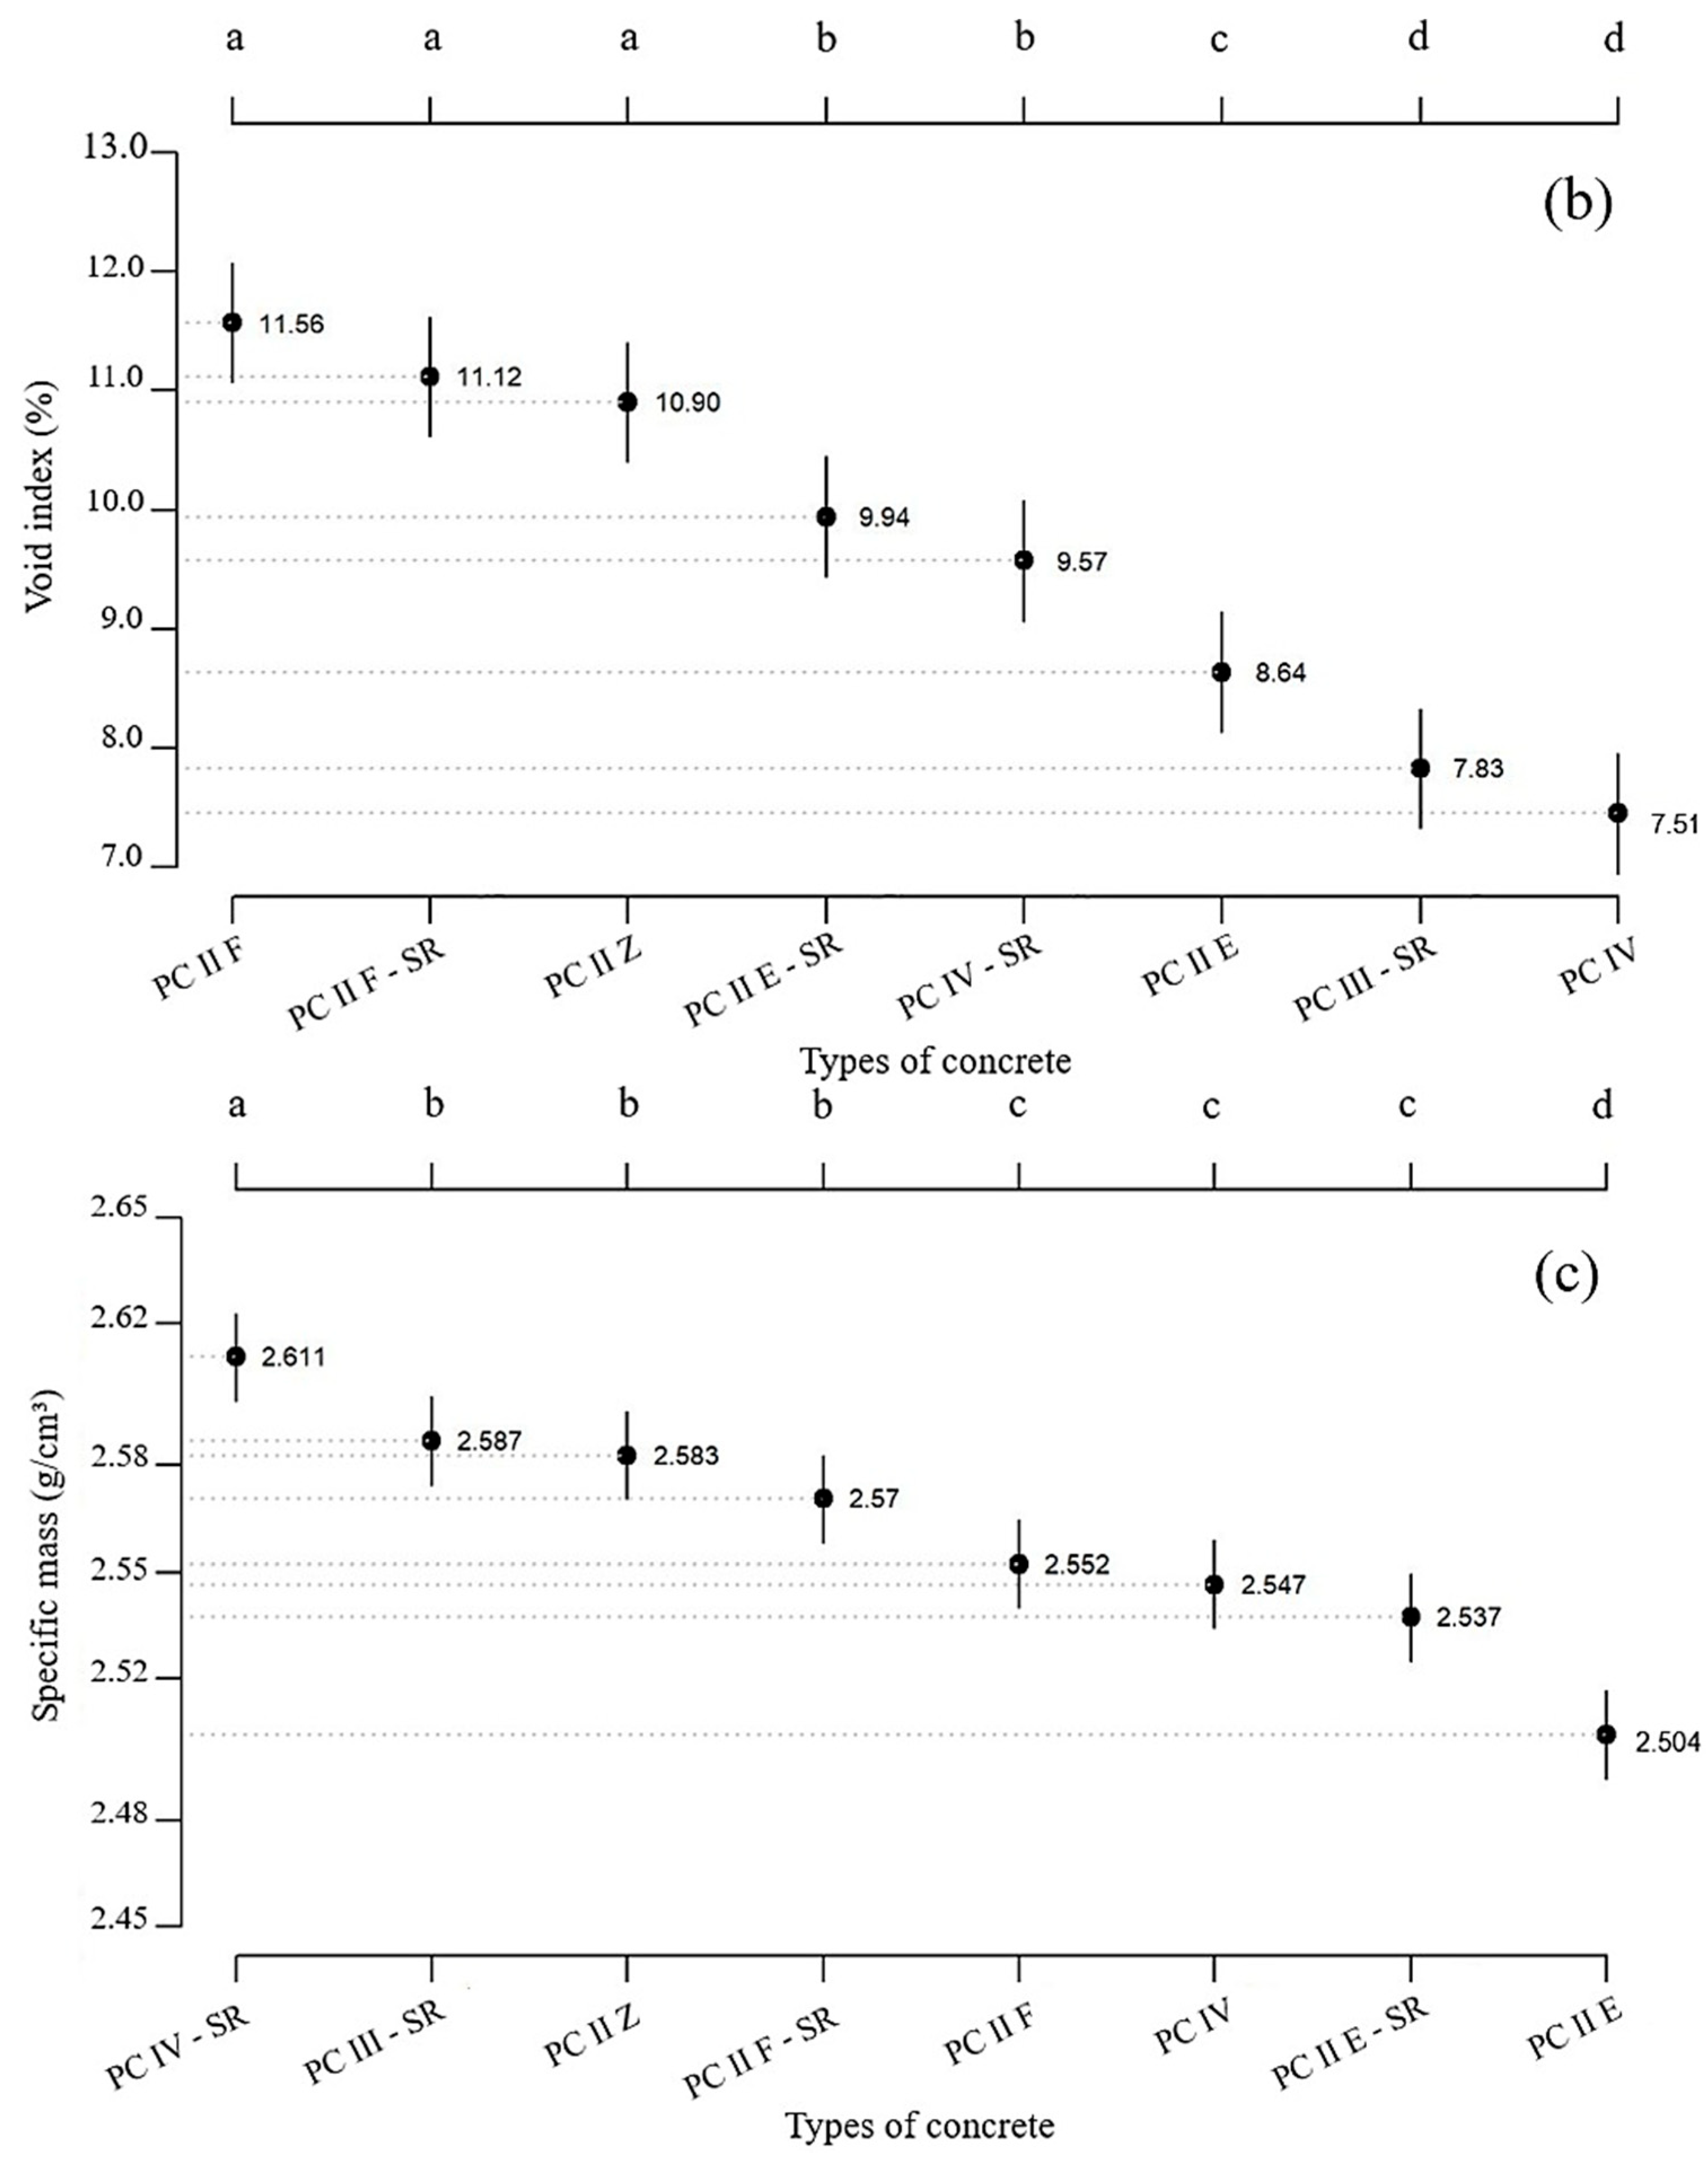
3.2. Water Absorption, Void Index, and Specific Mass

It was initially observed that there was no significant difference (p < 0.05) between the results for each treatment and curing period. This indicates that, for the different types of concrete produced in this study, the water absorption, void index, and specific mass remained consistent regardless of the age of the concrete. Consequently, the results at 28 and 196 days were averaged to compare only the effect of the cement in the concrete.
Figure 6a illustrates the water absorption values of the eight types of concrete at 28 and 196 days. A noteworthy fluctuation of up to 51.64% in water absorption is observed.
This is evident when comparing the averages of PC II F, PC II F-SR, and PC II Z, which exhibited similar patterns and demonstrated the least favorable water absorption performance. In contrast, the average of PC IV and PC III-SR, characterized by a high content of pozzolan and slag, respectively, showcased better resistance to water absorption.
Comparing Figure 6a,b, it is evident that there is consistency in the results, where concretes produced with higher levels of pozzolan and slag (PC IV and PC III, respectively) exhibited a lower void index. In contrast, concretes produced with cements containing filler (PC II F-32 and PC II F-32-SR), as well as those with a low pozzolan content (PC II Z), showed a higher void index, similar to each other. This was expected since these concretes also had higher water absorption rates.
This difference in void indices between the average of concretes with better performance and the average of those with poorer performance reached up to 45.93%. The lower number of voids presented by samples with slag and pozzolan reflects the high compressive strength results shown in Figure 4b, reaching up to 72.5 MPa for concretes with an age of 196 days produced with PC IV cement. PC II F-32 concrete naturally had lower compressive strength at 28 days, along with three other concrete types, and the second-lowest strength gain at 196 days, being 4.91 MPa, corresponding to only 10.04%.
In terms of specific mass values (Figure 6c), it is noteworthy that despite the statistical variances among cement types, all fall under the classification of normal concrete (C), within the range of 2.000 g/cm3 and 2.800 g/cm3 according to NBR 8953: concrete for structural purposes [21]. For lightweight concrete (CL), the specific mass should be below 2.000 g/cm3, and for heavyweight concrete (CD), it should exceed 2.800 g/cm3. In this context, PC II E concrete displayed the lowest real specific mass at 2.504 g/cm3, while PC IV-SR attained the highest real specific mass, registering at 2.611 g/cm3, representing a 4.10% difference.

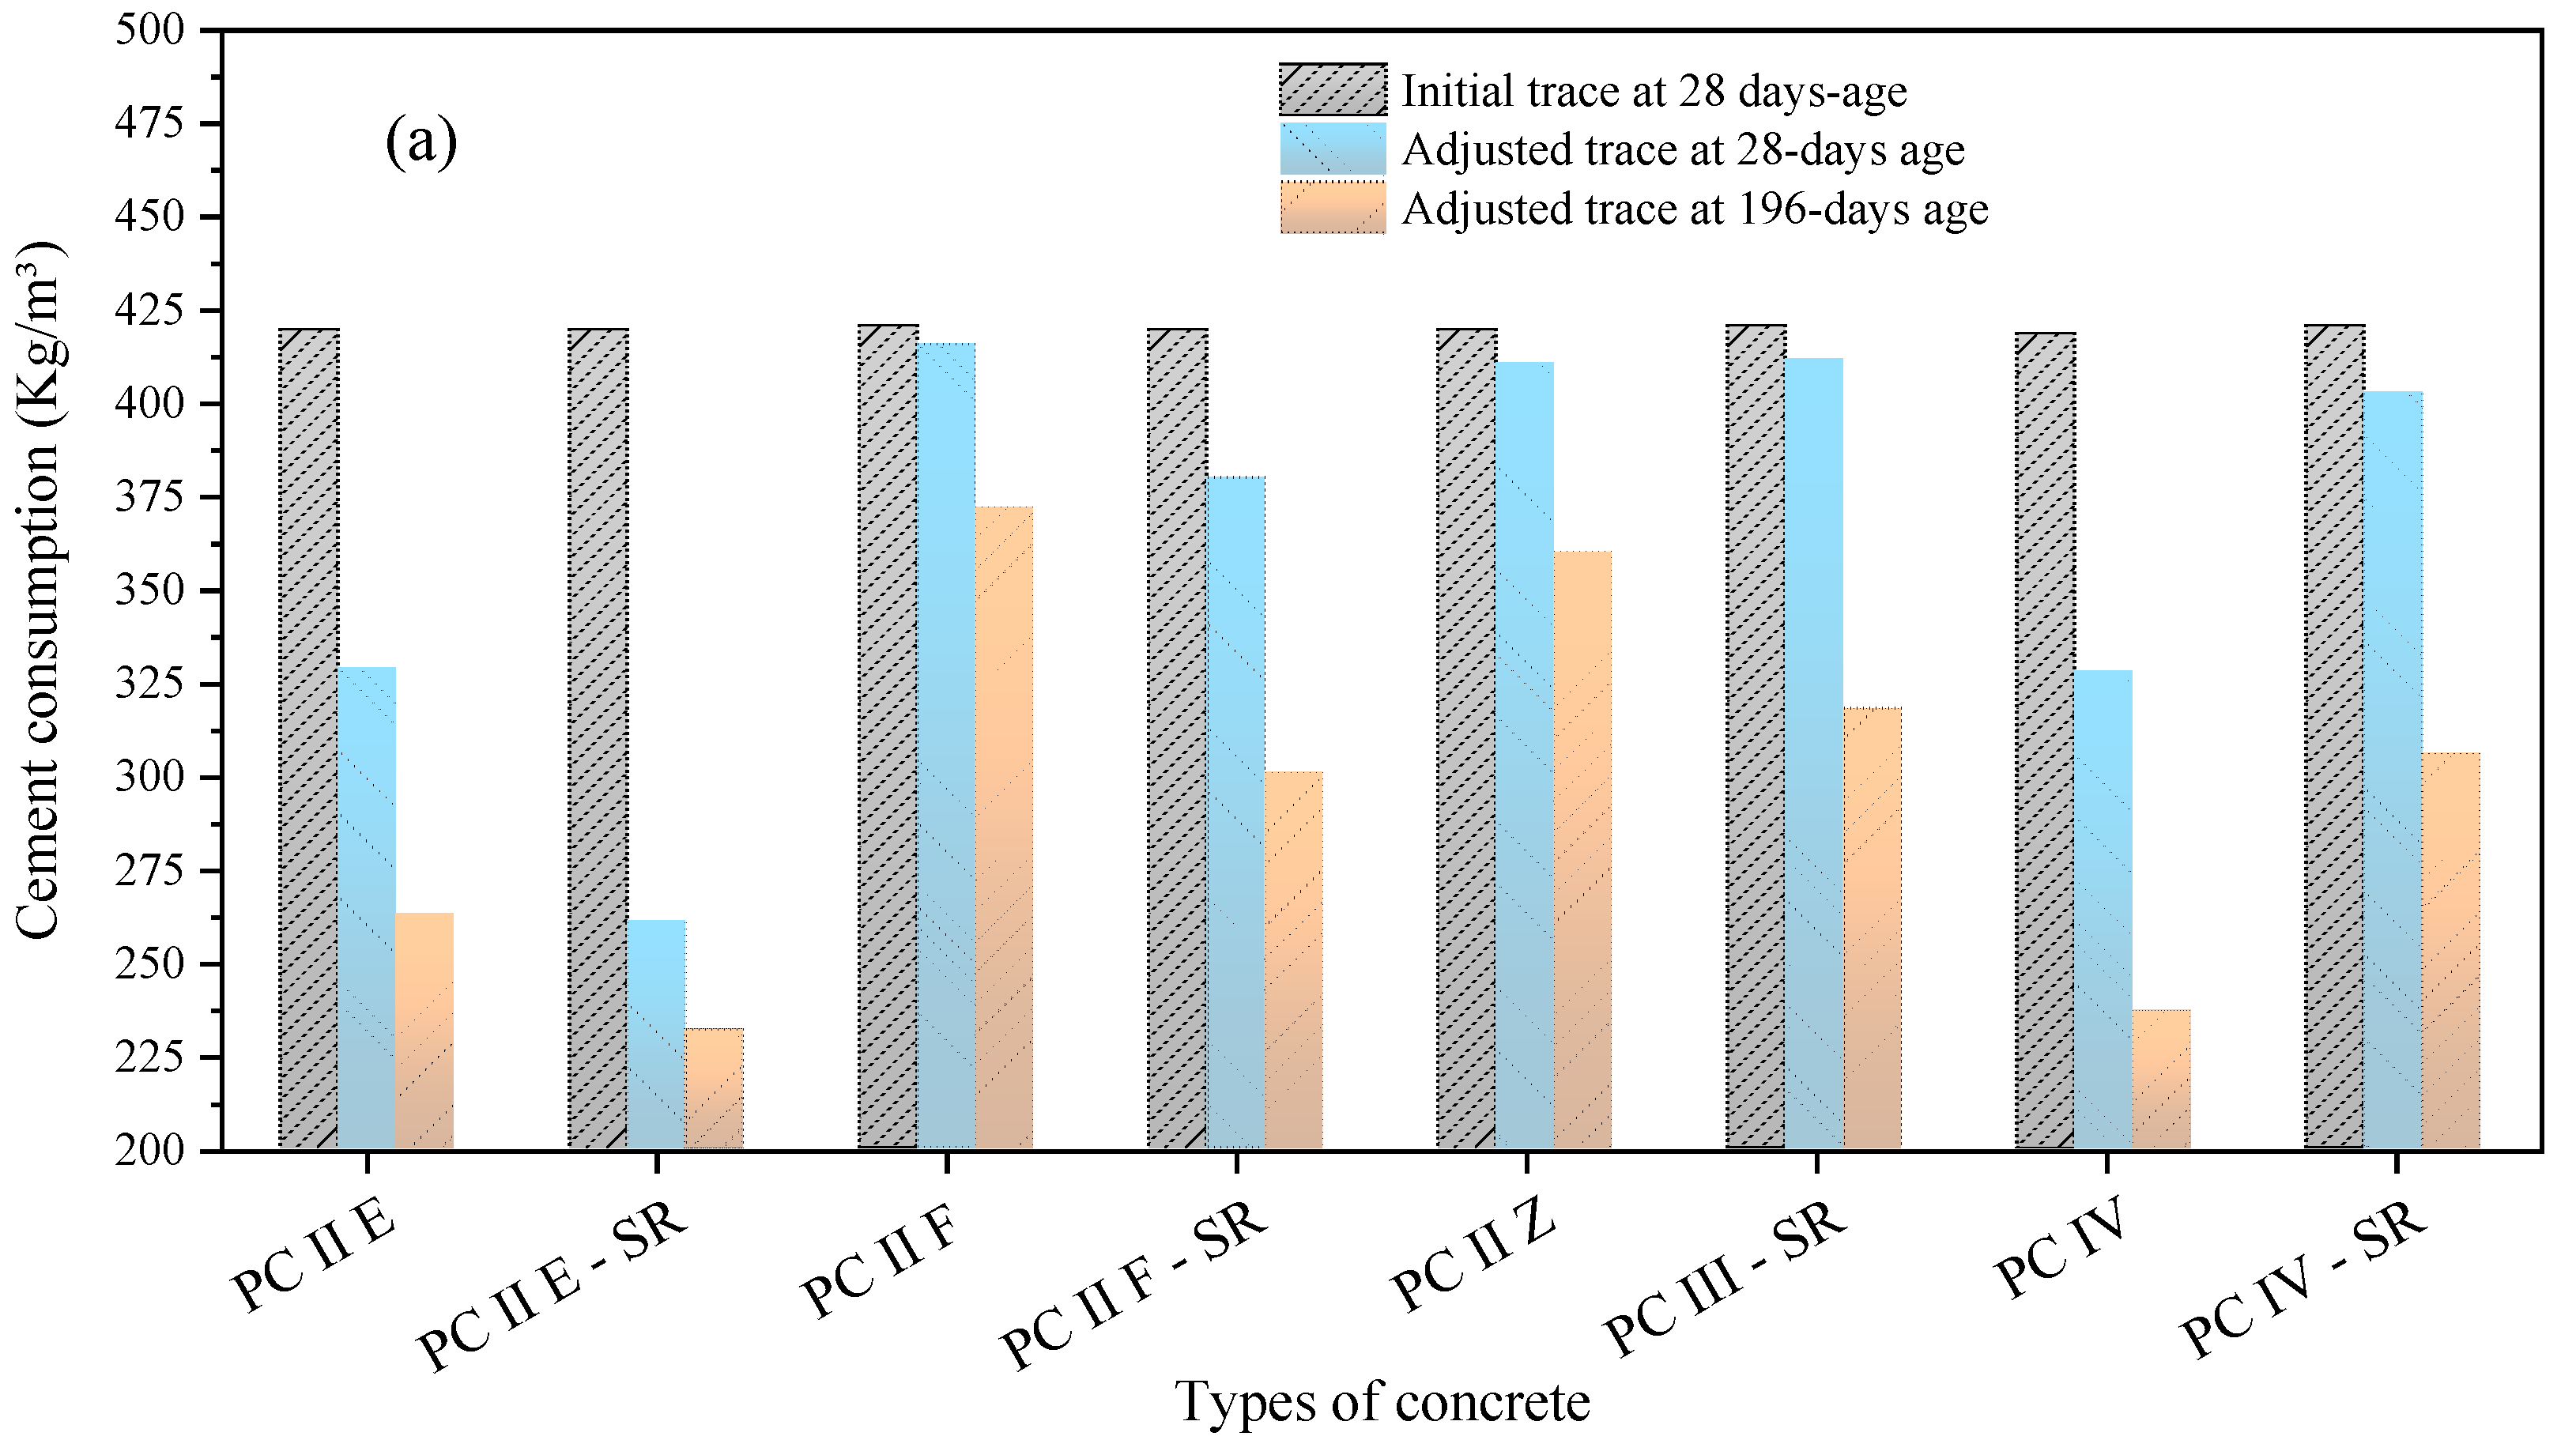
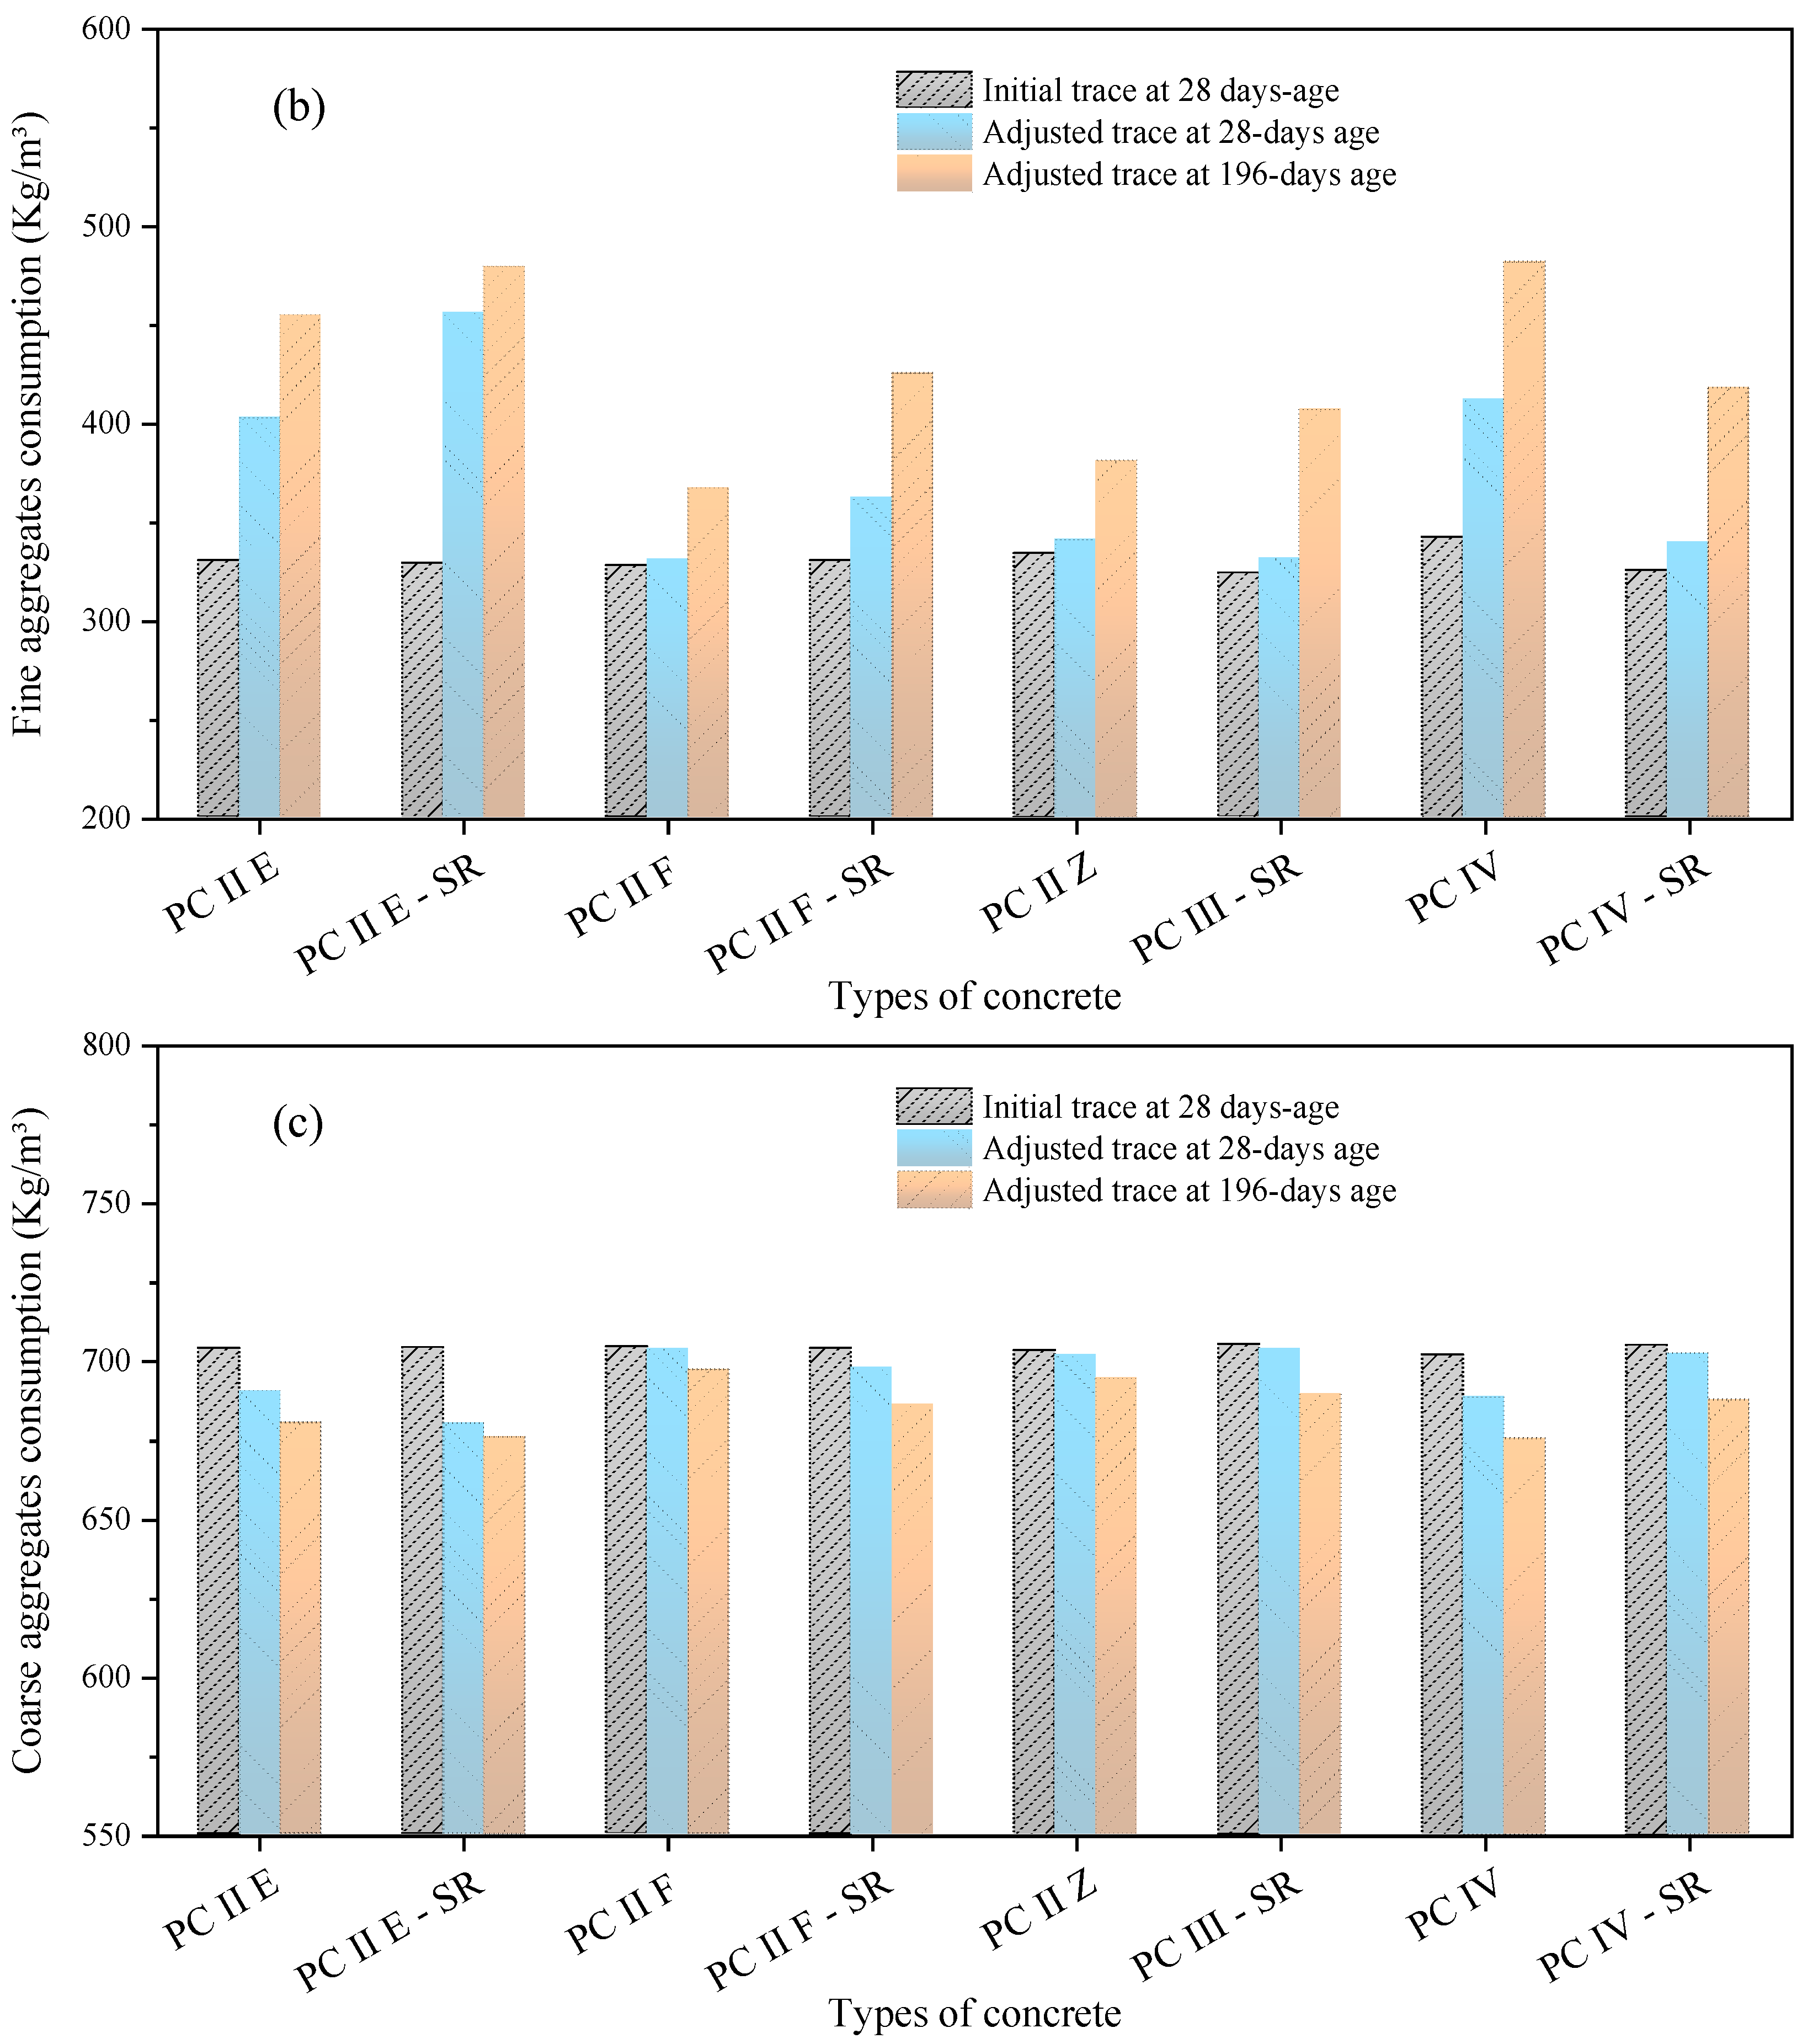
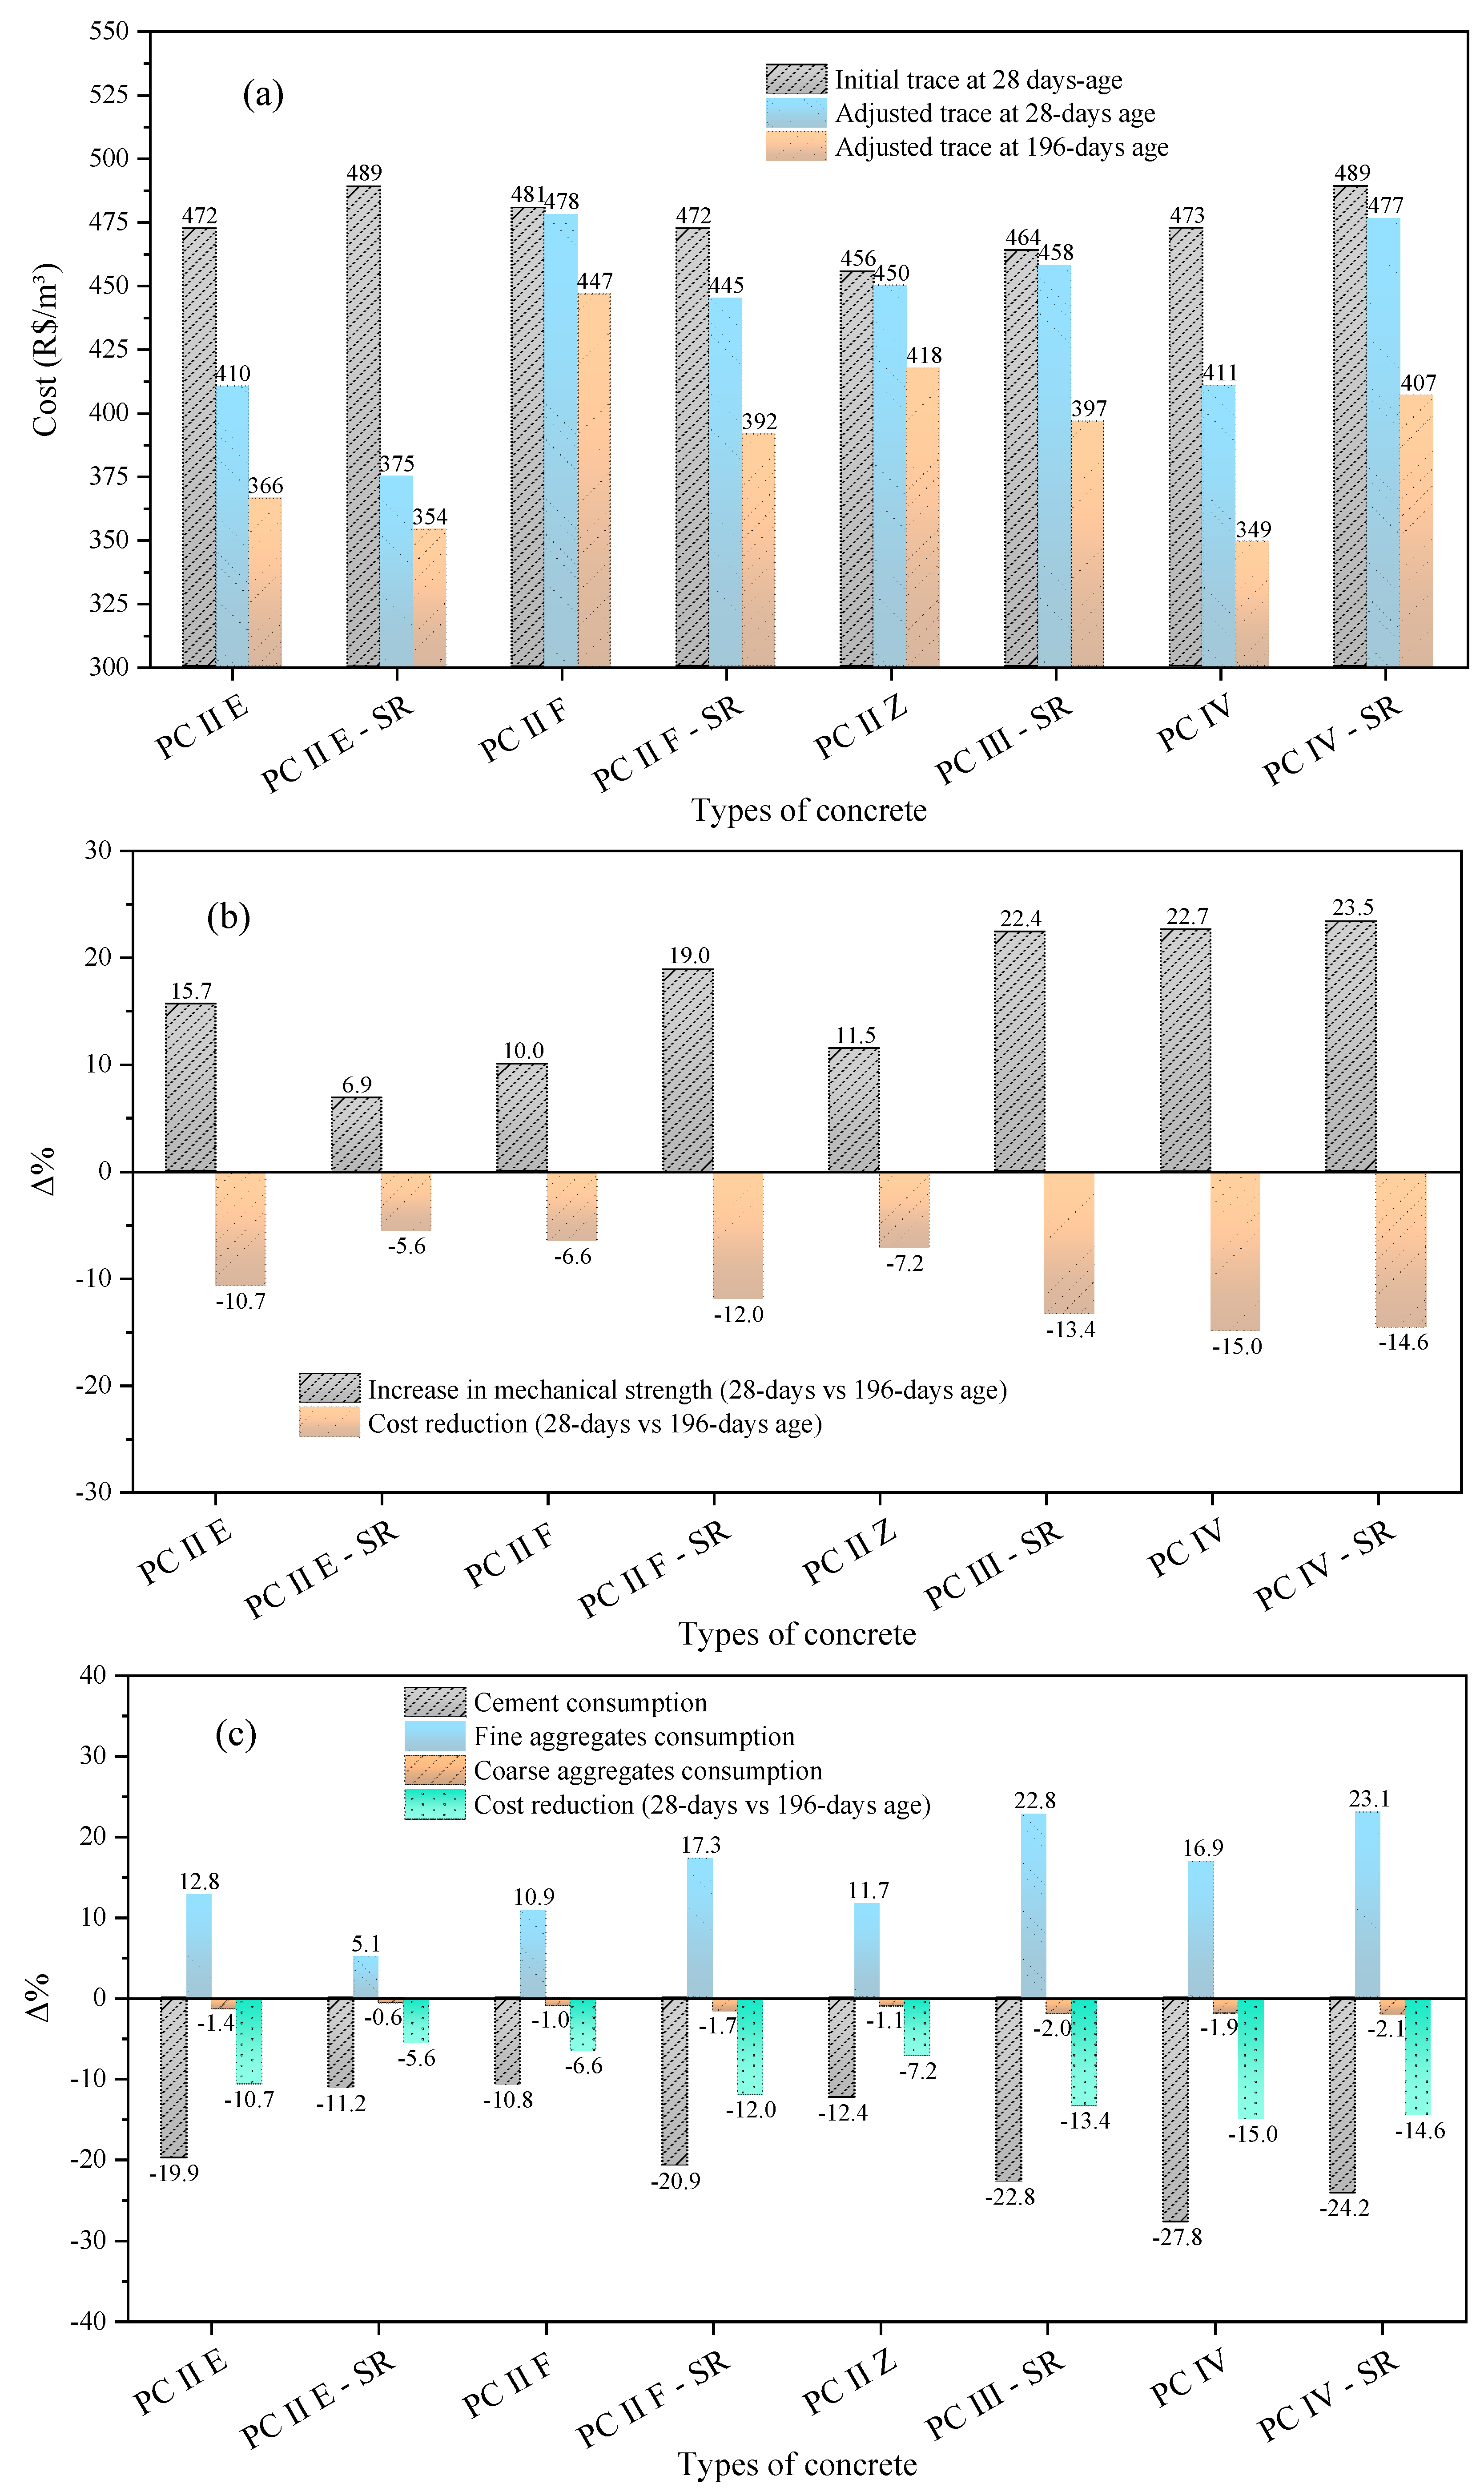
3.3. Cost Analysis of Concretes

The average compressive strength of all the concrete samples was observed to exceed the projected 40 MPa, with values ranging from 48.97 MPa to 68.77 MPa at 28 days, and from 53.88 MPa to 73.49 MPa at 196 days. Although the Abrams curve is typically limited to concretes up to 50 MPa, an extrapolation was performed using the curve equation shown in Figure 3 to estimate the w/c ratio in accordance with the dosage method specification. At this stage, the initially calculated w/c ratio was set aside in favor of a new w/c ratio derived from the obtained compressive strength. Table 4 presents these results, displaying the adjusted w/c ratios corresponding to the compressive strengths for the concretes at both 28 and 196 days.
Producing concrete with significantly higher strength than projected results increased costs. Therefore, the w/c ratio can be adjusted to reduce costs and avoid excessive strength beyond the projected value. To estimate the cost reduction by adjusting the concrete mix designs, a new w/c ratio was calculated to achieve the projected strength of 40 MPa. This calculation involved determining the difference between the initial w/c ratio (0.35) and the adjusted w/c ratio for the obtained strengths (Table 4), then adding this difference to the initial w/c ratio. Table 5 shows the readjusted w/c ratios, and Table 6 presents the new component proportions.
Figure 7 shows the cement consumption, fine aggregates consumption, and coarse aggregates consumption for the initial trace at 28-days age, as well as for the adjusted traces at 28- and 196-days age. At this point, it is worth remembering that cement serves as the binding agent in concrete, holding all the ingredients together. The strength of concrete is primarily influenced by the amount of cement present. Increasing the cement content enhances the number of chemical reactions and hydration processes, leading to a denser and stronger concrete matrix. Additionally, a higher cement content provides more paste to fill the voids between aggregates, resulting in better cohesion and improved overall strength. Conversely, reducing the cement content typically results in a decrease in the strength of concrete [22,23,24].
The concretes with higher mechanical strengths, such as PC II E, PC II E-SR, and PC IV, experienced a greater reduction in cement consumption (Figure 7a) when comparing the adjusted mix with the initial mix at 28 days. On the other hand, PC II F, PC II Z, and PC III-SR, which had mechanical strengths already close to the target of 40 MPa, showed a smaller reduction in cement content. Notably, all concretes exhibited a substantial reduction in cement consumption when comparing the adjusted mixes at 28 and 196 days. The concretes PC III-SR, PC IV, and PC IV-SR had particularly significant reductions in cement consumption, corresponding with a greater increase in strength from 28 to 196 days, as previously observed in Figure 5b.
The reduction in cement content is accompanied by an increase in fine aggregates, as illustrated in Figure 7b. The content of coarse aggregates underwent more subtle adjustments, with discrete reductions observed for all concretes (Figure 7c).
The influence of adjustments in concrete mixes and costs is clearly illustrated in Figure 8a-c. Naturally, a higher variation in compressive strength between 28 and 196 days of curing corresponds to a greater potential for cost reduction (Figure 8b). This opens the possibility of reducing the cement consumption and increasing the content of fine aggregates (Figure 8c). The cost reduction ranged from 5.6% to 15%. Notably, concretes PC II E-SR, PC II F, and PC II-Z demonstrated lower variations (between 5.6% and 7.2%), whereas concretes PC III-SR, PC IV, and PC IV-SR exhibited higher variations (between 13.4% and 15%). The detailed mix designs, along with the cost of the concretes, are shown in Tables S1–S3 of the Supplementary Materials. The values do not take into account the cost of the superplasticizer, which represents 2% to 4% of the concrete cost, depending on the targeted slump. Additionally, water, which accounts for less than 0.1% of the costs, was excluded for simplicity.

4. Discussion

In the analysis of axial compressive strength results, notable differences arise based on the type of cement used in the concrete. Additionally, the high values of axial compressive strength may be associated with the inappropriate use of the characteristic strength of the cement at 28 days in the Abrams curve. Although the cement’s class is 32 MPa, its characteristic strength is often higher, sometimes even exceeding 40 MPa. By employing a lower cement strength in the Abrams curve, there is a tendency for the w/c ratio to be lower. This positively influences mechanical strength since there is already sufficient water for cement hydration, but it naturally increases costs.
PC IV, PC III-SR, and PC IV-SR concretes showed the greatest strength gain at long-term ages. These were produced with cements containing high levels of blast-furnace slag and pozzolanic material. According to Medeiros Junior et al. [25], this significant strength increase is justified by their slower and progressive pozzolanic reactions compared to other types of cement. Other studies have also reported increased compressive strength with age in concretes with slag additions [26,27,28].
PC IV concretes tend to exhibit lower permeability due to the high pozzolan content in their composition. Mehta and Monteiro [6] explain the pozzolanic reactions. Despite having a slow reaction and low initial strength, these reactions tend to form very efficient products in filling capillary pores, improving the impermeability of the matrix, a process described as “pore refinement.” In this reaction, pozzolan consumes calcium hydroxides (CH) forming low-density CSH, different from what would happen in a cement without pozzolan.
In their work, Magalhães [29] found that concretes with a higher percentage of cement replacement by slag (0%, 30%, and 60%) had lower capillary absorption rates than reference concretes. Ogirigbo and Black [30] explain that due to the high levels of alumina present in slag, there is a higher degree of hydration, resulting in a more refined pore structure. These results converge with those found in this study, as the concretes produced with PC III-SR and PC IV had lower water absorption rates and void indexes, implying that different cementitious additions also have a significant influence on this property [6]. It is worth highlighting that there may be disconnected pores in the cement matrix, which does not necessarily imply greater permeability. To identify them correctly, non-destructive tests would be required to allow the real distinction and counting of these voids in the matrix, such as scanning electron microscopy and X-ray microtomography. In the execution of the water absorption and void index tests in this study, the counted pores are directly related to permeability due to their interconnection.
Concretes with filler additions (PC II F and PC II F-SR) showed low initial strength, the lowest strength gain in 196 days, and higher void/water absorption indexes. It is understood that filler is a finely ground material which, in these productions, due to low water addition (w/c ratio = 0.30), can reduce compressive strength by increasing porosity. This effect was observed by Ramezanianpour et al. [31] in studies with filler additions of 0%, 5%, 10%, 15%, and 20% with w/c ratios of 0.37, 0.45, and 0.55. They found that concretes without additions still exhibited better compressive strength than the others. Additionally, they noted that the water absorption coefficient increased as more filler was used in cement replacement. These findings are consistent with the results of this study, particularly highlighting the subpar performance of PC II F-32.
It was also observed that the ABPC dosage method used to determine the initial mix in this study requires a significantly higher material consumption compared to the average obtained strength and the projected strength.
In terms of production cost, the usage of long-term ages was significant only for concretes with high supplementary cementitious materials, with reduction costs near 14 ± 1%. When comparing the costs of the adjusted mixes aimed at achieving a targeted strength of 40 MPa, the cost reduction increased to up to 23.3% at 28 days and 27.6% at 196 days, with higher impact for concretes PC II E and PC II E-SR. This translates to a decrease of BRL 114.24/m3 (BRL = real, the Brazilian currency) to BRL 135.21/m3 respectively for the studied ages, equivalent to a reduction of BRL 913.92 to BRL 1081.68 per conventional 8 m3 concrete truck used on a construction site. It is well understood that the execution phase of reinforced concrete structures constitutes a significant portion of a project’s costs, and for medium to large-scale projects, this reduction in concrete costs can have a profound impact on the final budget.
It has also been demonstrated that concretes produced with the PC II E-SR cement type offer better cost-effectiveness when evaluating both axial compressive mechanical performance and financial viability after adjusting the w/c ratio.
Regarding PC IV or PC IV-SR cements, which align with the classifications used in the research by Ananyachandran and Vasugi [32], Liu et al. [33], Ahmad et al. [34], and Baghabra al-Amoudi et al. [35], it is evident that while the pozzolanic reaction consistently occurs across these studies, its outcome is strongly influenced by factors such as the type, percentage, and reactivity of the added pozzolan. This observation holds true for concretes produced with slag cements as well, as noted by Ananyachandran and Vasugi [32] and Rahman et al. [36]. Notably, PC II E-SR cement, likely due to its slag content, exhibited the lowest percentage increase in strength between 28 and 196 days among the eight types of concrete studied, at just 6.87%, as depicted in Figure 5b.
Regarding concretes produced with PC II F and PC II F-SR cement, the gain in mechanical strength can be attributed to the presence of carbonate material. This filler effect results in void filling and matrix densification, as also observed by Wang et al. [37] in research involving limestone filler-based cement, equivalent to PC II F and PC II F-SR cement. Additionally, for concrete produced with PC II Z cement, the inclusion of pozzolans provides nucleation points to the system, thus enhancing hydration intensity. This phenomenon is evident in the work of Wang et al. [37] for concretes produced with limestone filler-based cement and metakaolin addition. Bediako and Valentini [38] also observed similar behavior, attributing strength gains to the addition of pozzolanic clay.
Table 7 presents data on the long-term mechanical performance of concretes with various SCMs sourced from the literature, summarizing the main findings from each study. While most strength gains are modest, some studies have observed notable improvements in the long-term strength of concretes. For instance, the standard sample tested by Adegoke and Ikumapayi [39], the control sample, and the sample with 40% lithium slag by Rahman et al. [40], as well as the samples investigated by Bhagath Singh et al. [41], all exhibited substantial strength gains exceeding 20% for ages between 90 and 180 days, when compared to samples of 28-days age.
Finally, it is worth pointing out that cement fineness plays a crucial role in accelerating hydration, potentially reducing the time required to achieve design strength. Conversely, the SCM content (especially fly ash and slag) tends to delay “full-strength development”, with longer setting times as the proportion of SCMs increases.
In this context, further studies correlating cement fineness, SCM content, and different hydration times beyond 28 days would provide valuable insights into defining an optimized testing age for structural design, enabling a more precise and cost-effective assessment of concrete performance.

5. Conclusions

This study evaluated concretes produced with eight different types of cement, focusing on axial compressive strength, water absorption, void index, and real specific mass at 28 and 196 days of curing. Additionally, a cost analysis was conducted to assess the impact of using long-term strength in structural projects instead of the characteristic strength at 28 days. The following key conclusions were drawn from this work:
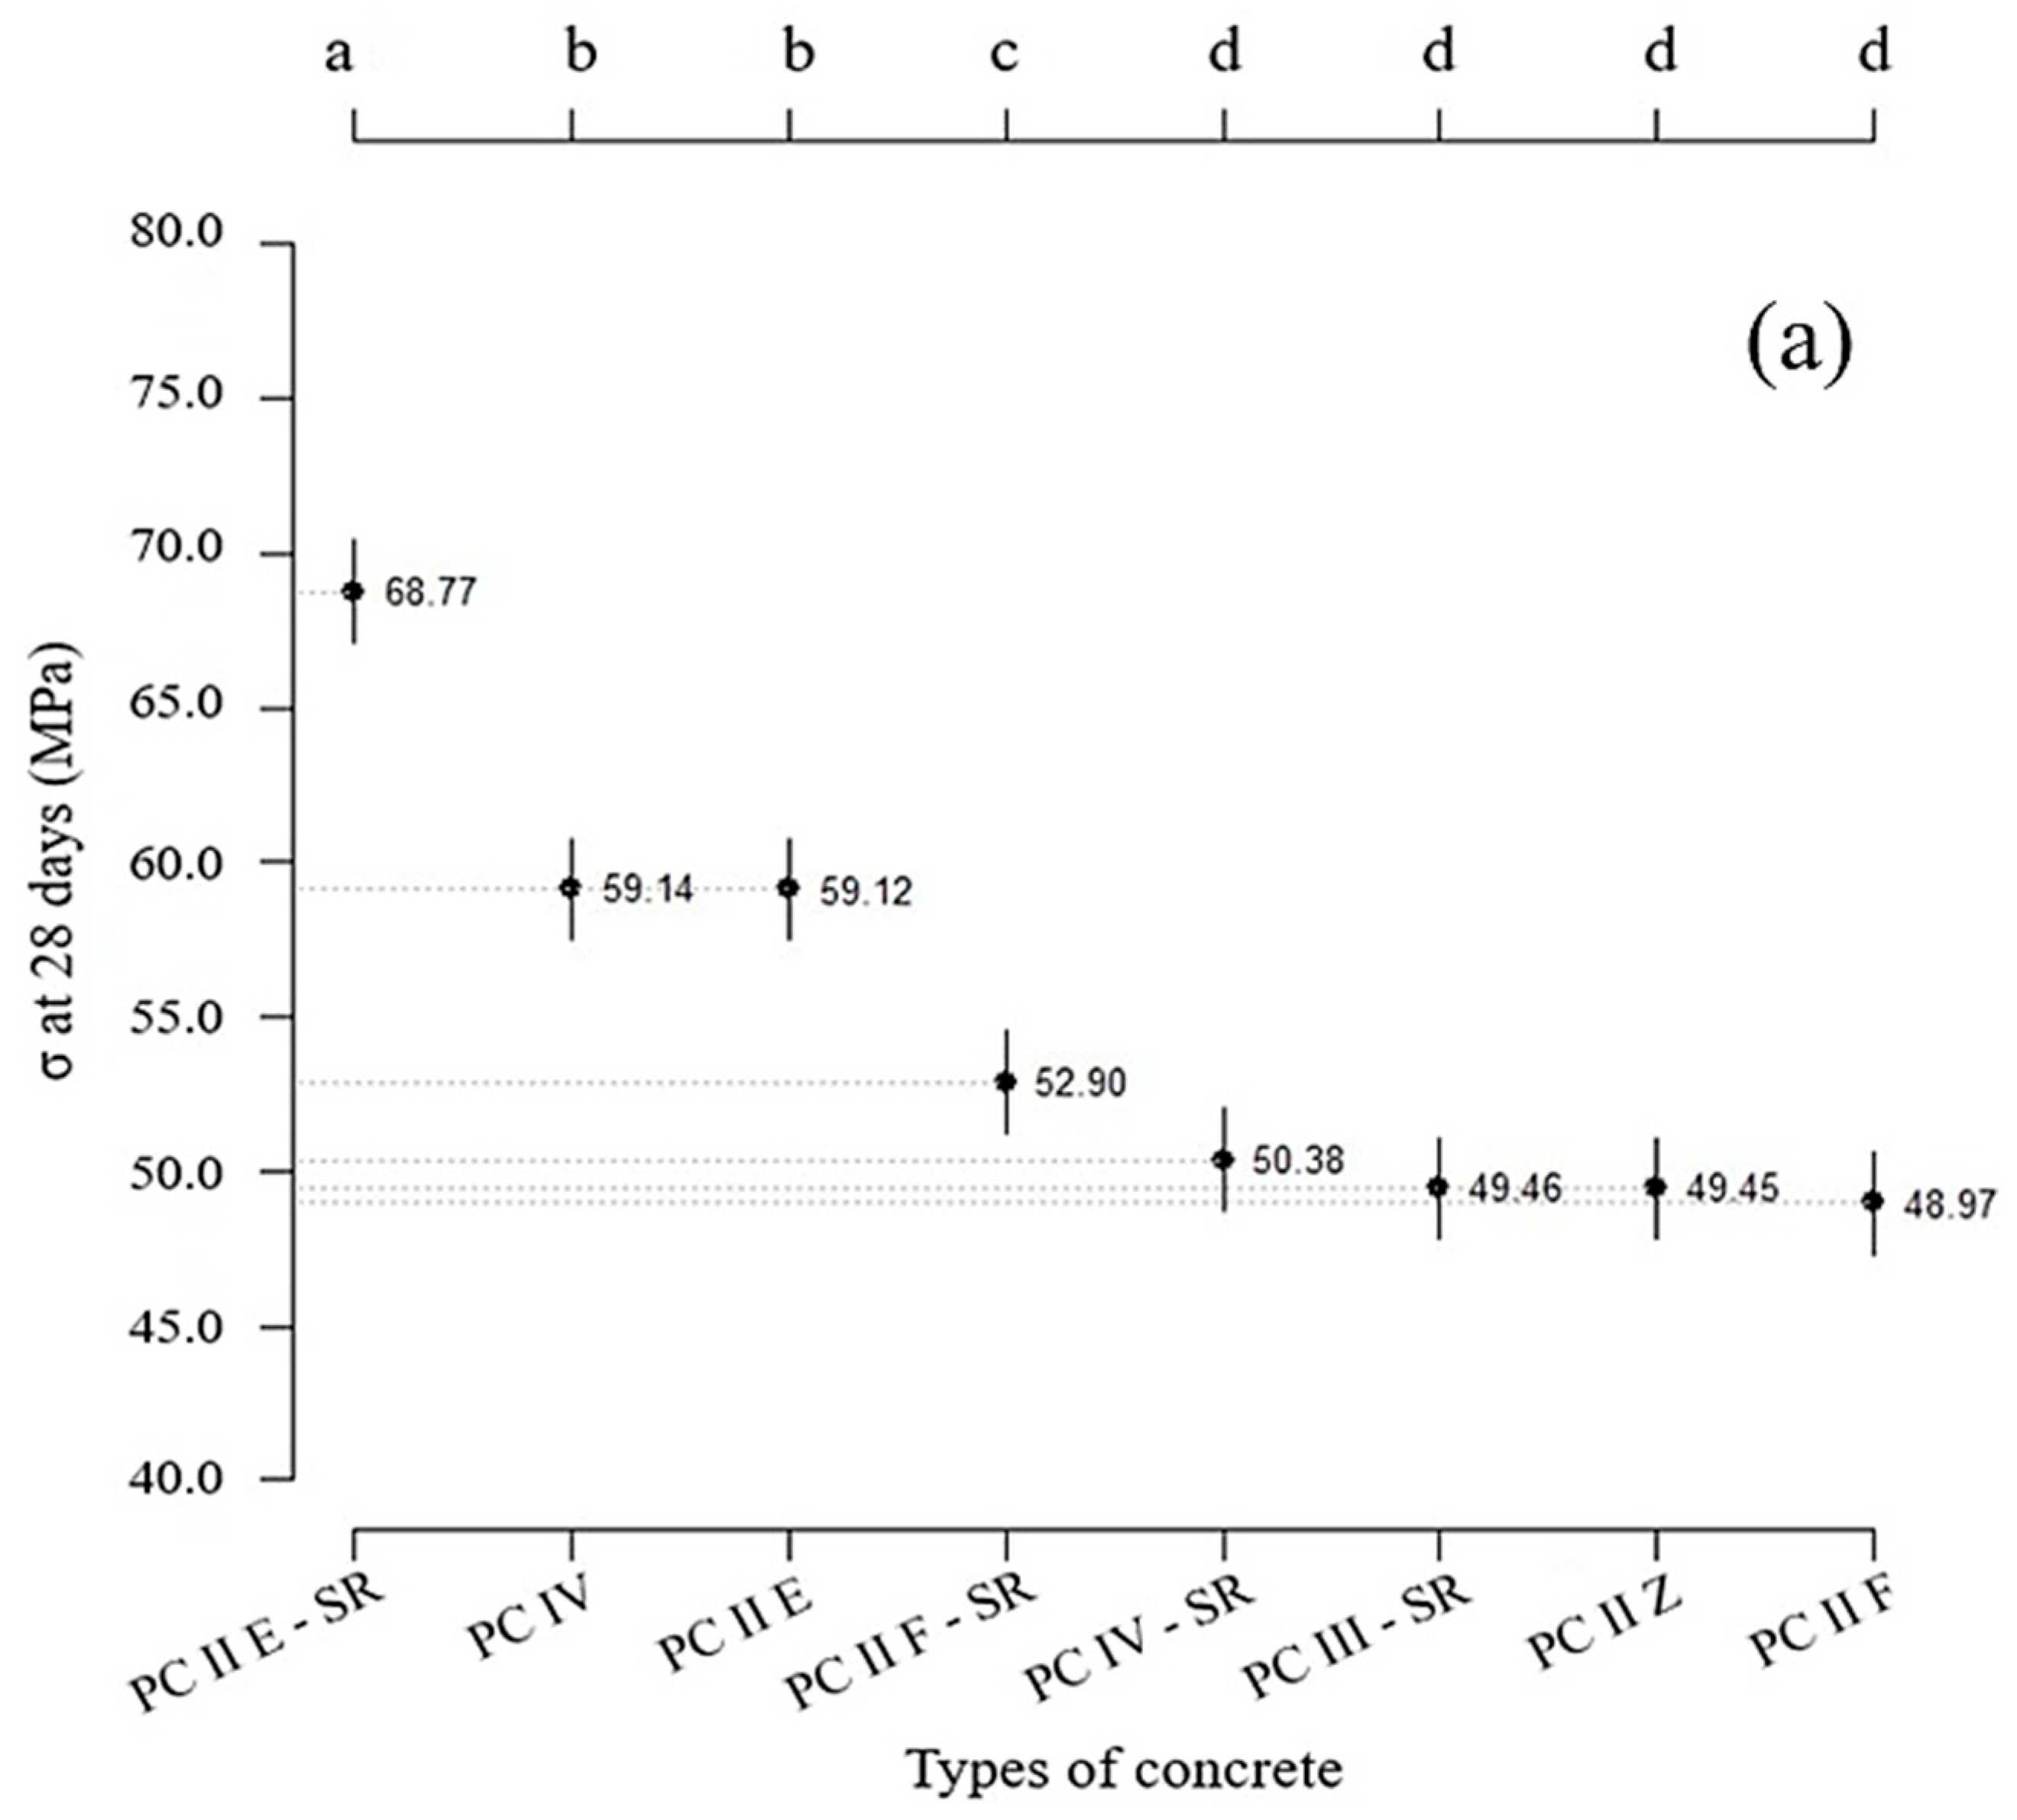
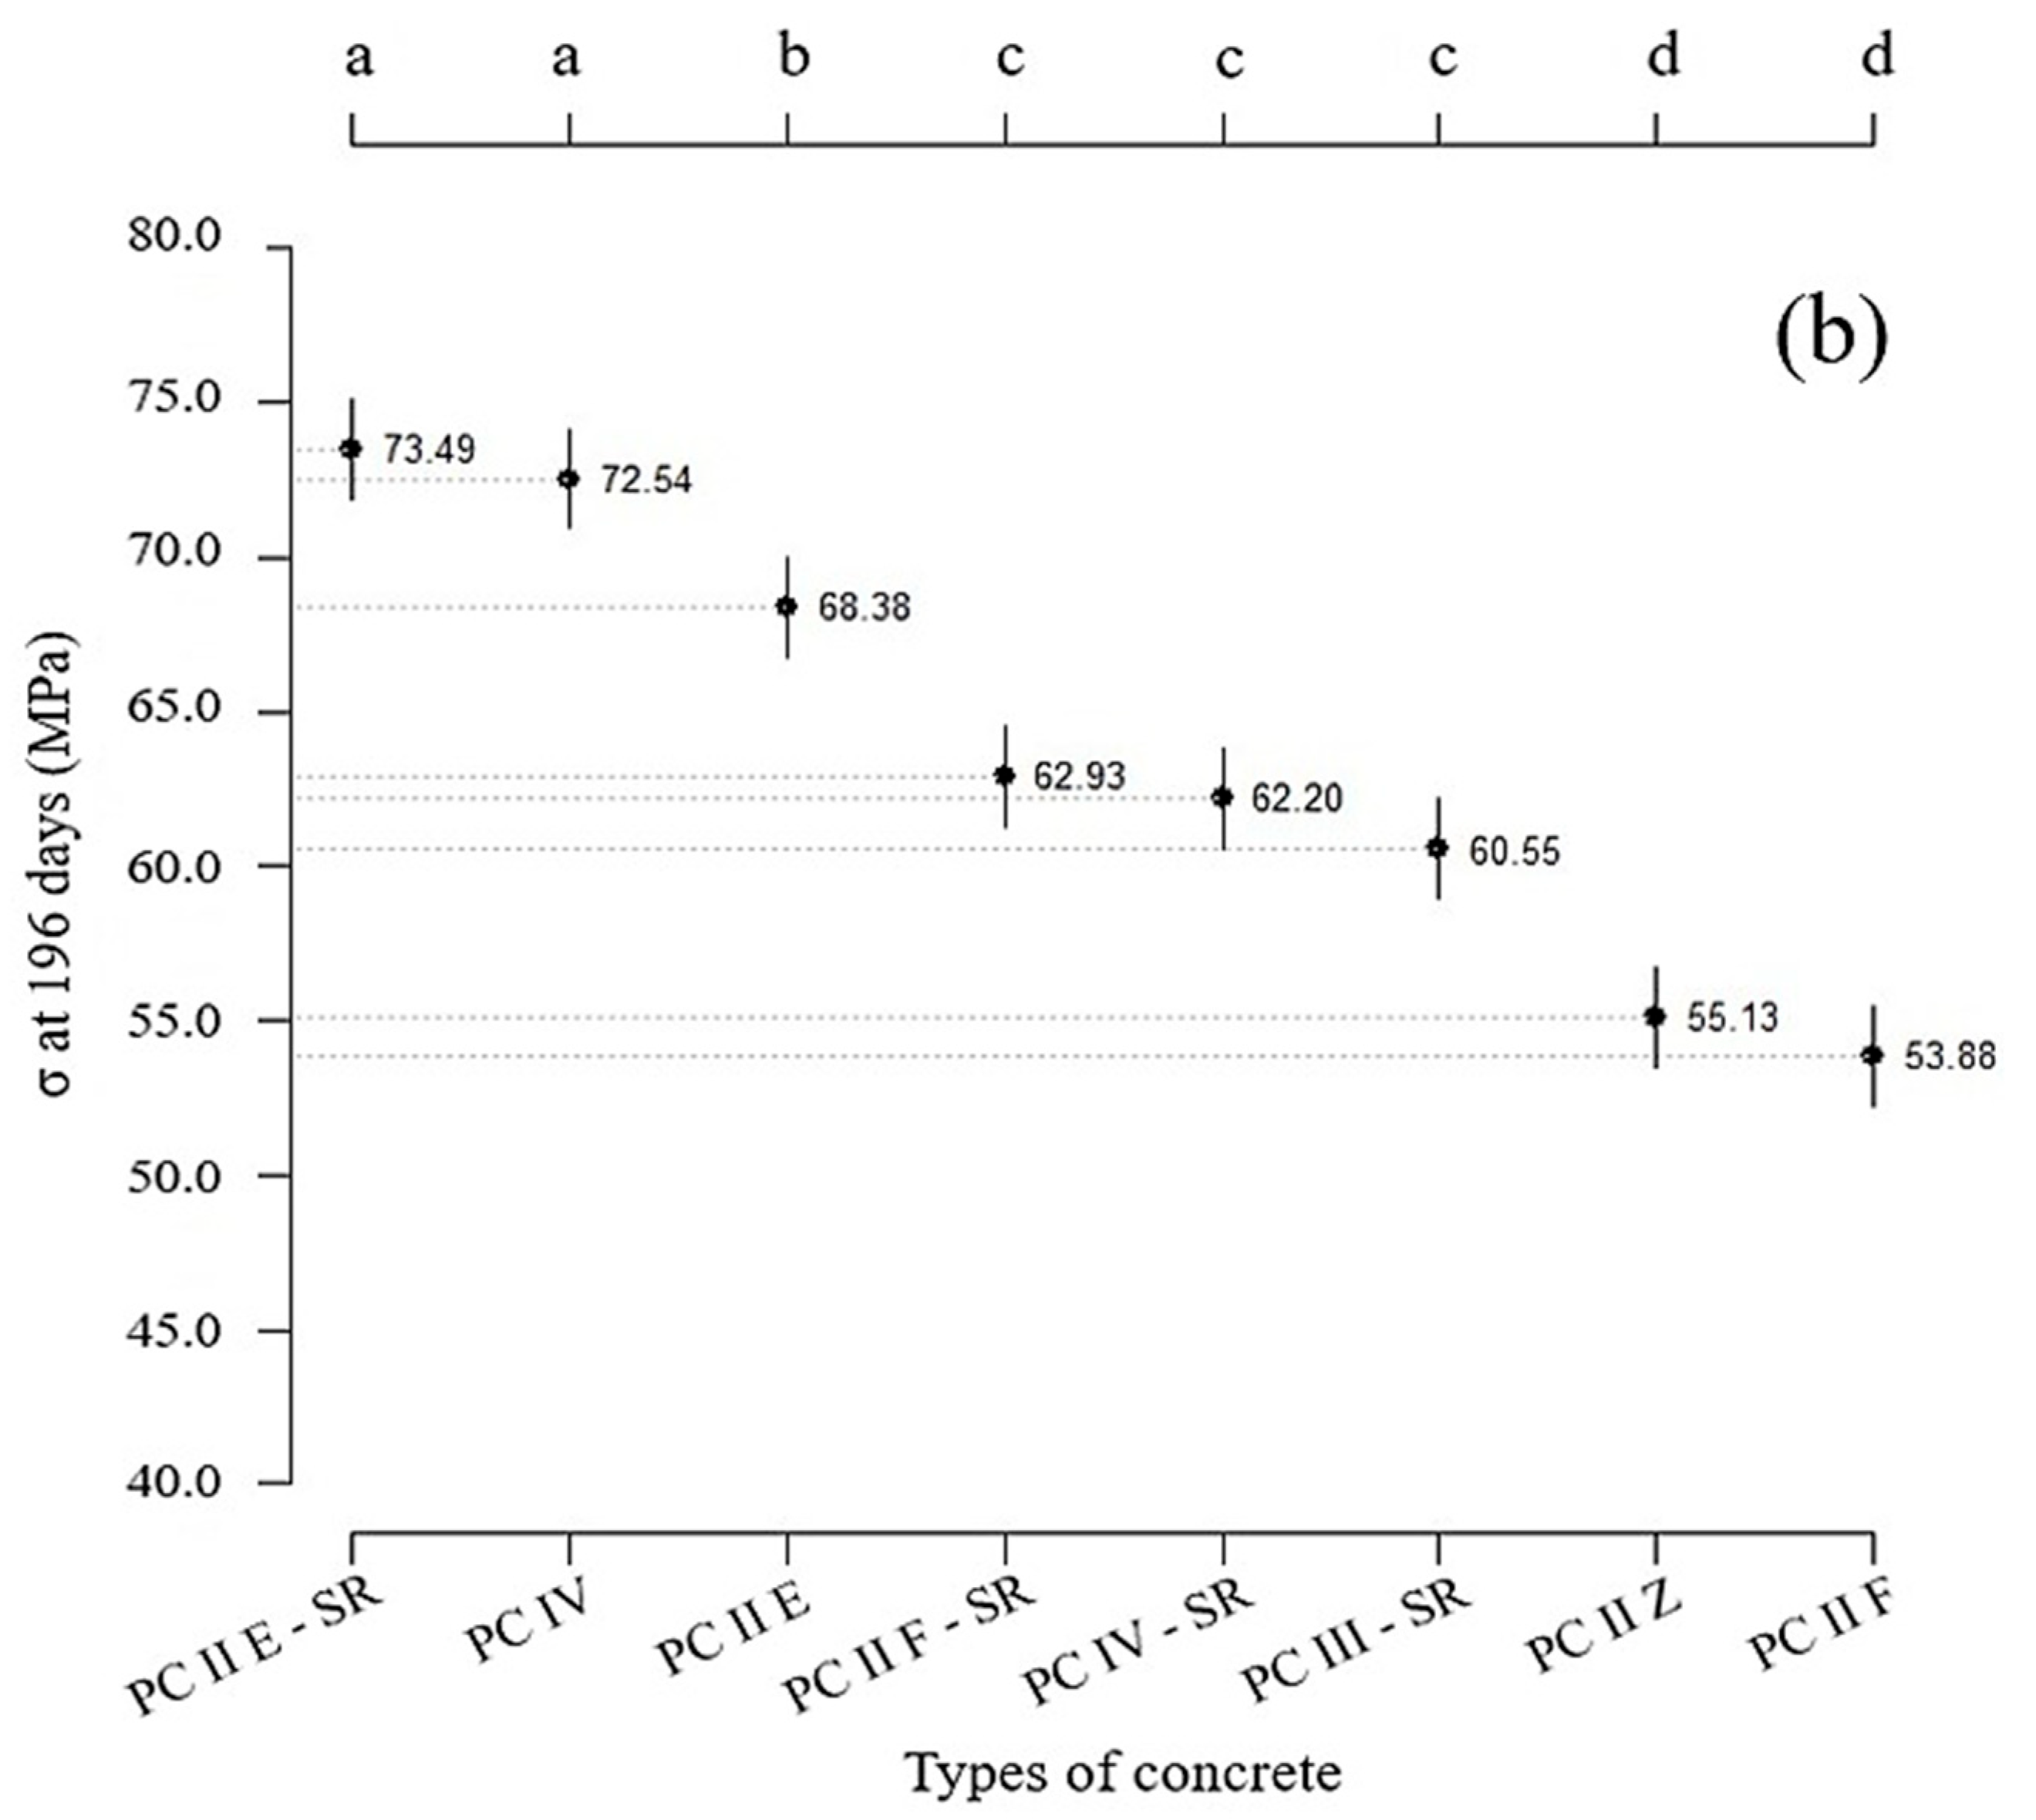
The results showed significant differences in axial compressive strength based on the type of cement used. Concretes with PC IV, PC III-SR, and PC IV-SR cements exhibited the greatest strength gains at long-term ages. This is attributed to the slower and progressive pozzolanic reactions associated with these cements. On the other hand, concretes with filler additions (PC II F and PC II F-SR) showed lower initial strength and inferior strength gain over time. This can be attributed to the finely ground filler material, which increases porosity and reduces compressive strength.
Concretes with higher pozzolan content, such as those with PC IV cement, exhibited lower water absorption and void index due to the efficient filling of capillary pores, known as the “pore refinement” effect. This property is crucial for improving the durability and longevity of concrete structures.
The cost analysis revealed that adjusting the cement mix to achieve a targeted strength can significantly impact production costs. Optimizing the mix design based on mechanical performance and financial viability can lead to significant cost savings in construction projects. Considering the characteristic strength at long-term ages instead of the usual 28 days had a significant impact on samples with high SCM content, especially PC III and PC IV, resulting in savings near 14%. The impact was lower for other concretes. In conclusion, this study highlights the importance of selecting appropriate cement types and optimizing mix designs to enhance both mechanical properties and cost-effectiveness in concrete construction projects. These findings provide valuable insights for engineers and construction professionals, enabling them to make informed decisions about cement selection and mix design to achieve desired performance and economic efficiency.

Supplementary Materials

The following supporting information can be downloaded at: https://www.mdpi.com/article/10.3390/jcs9030110/s1, Table S1: Mix proportion and cost of concretes (initial mix design); Table S2: Mix proportion and cost of concretes (adjusted mix for the target compressive strength of 40 MPa at 28 days of hydration); Table S3: Mix proportion and cost of concretes (adjusted mix for the target compressive strength of 40 MPa based on 196-days age data).

Author Contributions

Conceptualization, all authors; methodology, all authors; software, W.S.d.J., S.F.M.d.S., M.T.S. and I.B.A.; validation, all authors; formal analysis, all authors; investigation, all authors; resources, W.S.d.J., E.S.L., S.F.M.d.S. and J.R.d.C.P.; data curation, all authors; writing—original draft preparation, W.S.d.J., M.T.S., T.M.S.d.A. and S.F.M.d.S.; writing—review and editing, E.S.L., R.S.S., L.A.S., I.B.A. and J.R.d.C.P.; supervision, J.R.d.C.P. and I.B.A.; project administration, J.R.d.C.P.; funding acquisition, J.R.d.C.P. All authors have read and agreed to the published version of the manuscript.

Funding

This research was supported by fellowships provided by the Coordination for the Improvement of Higher Education Personnel (CAPES)—Funding Code 001, a foundation of the Brazilian Ministry of Education.

Data Availability Statement

Data will be made available on request.

Acknowledgments

The authors would like to thank the Coordination for the Improvement of Higher Education Personnel (CAPES) for their support. They also express their gratitude to the Graduate Program in Science, Innovation, and Modeling in Materials (PROCIMM), the Laboratory of Mechanical Tests and Resistance of Materials (LEMER), and the Laboratory of Computational Statistics (LEC) at the State University of Santa Cruz (UESC) for their invaluable assistance.

Conflicts of Interest

The authors declare no conflicts of interest.

References

  1. Pierrehumbert, R. There is no plan b for dealing with the climate crisis. Bull. At. Sci. 2019, 75, 215–221. [Google Scholar] [CrossRef]
  2. Chatham House. Making Concrete Change: Innovation in Low-Carbon Cement and Concrete; Chatham House: London, UK, 2018; Available online: https://www.chathamhouse.org/2018/06/making-concrete-change-innovation-low-carbon-cement-and-concrete (accessed on 11 February 2025).
  3. Global Cement and Concrete Association (GCCA). Global Cement and Concrete Industry Announces Roadmap to Achieve Groundbreaking Net Zero CO2 Emissions by 2050; GCCA. 2021. Available online: https://gccassociation.org/news/global-cement-and-concrete-industry-announces-roadmap-to-achieve-groundbreaking-net-zero-co2-emissions-by-2050 (accessed on 11 February 2025).
  4. Sindicato Nacional da Indústria do Cimento (SNIC). Resultados Preliminares 2023; SNIC. 2023. Available online: http://snic.org.br/assets/pdf/resultados-preliminares/1731334457.pdf (accessed on 11 February 2025).
  5. World Business Council for Sustainable Development Guidelines for Emissions Monitoring and Reporting. WBCSD: Geneva, Switzerland, 2012. Available online: https://docs.wbcsd.org/2012/03/GuidelinesEmissionsMonitoringandReporting.pdf (accessed on 11 February 2025).
  6. Mehta, P.K.; Monteiro, P.J.M. Concrete: Microstructure, Properties, and Materials, 4th ed.; McGraw-Hill Education: New York, NY, USA, 2014. [Google Scholar]
  7. Lopes, J.P.; Rudnick, T.; Martins, C.H. Utilização de resíduos industriais para produção de concreto sustentável. REEC Rev. Eletrônica Eng. Civ. 2018, 14, 216–228. [Google Scholar] [CrossRef]
  8. Sun, J.; Shen, X.; Tan, G.; Tanner, J.E. Compressive strength and hydration characteristics of high-volume fly ash concrete prepared from fly ash. J. Therm. Anal. Calorim. 2019, 136, 565–580. [Google Scholar] [CrossRef]
  9. Neville, A.M.; Brooks, J.J. Concrete Technology, 2nd ed.; Pearson Education Ltd.: London, UK, 2010. [Google Scholar]
  10. NBR 16697; Cimento Portland—Requisitos. ABNT: Rio de Janeiro, Brazil, 2018.
  11. NBR 5739; Concreto—Ensaio de Compressão de Corpos de Prova Cilíndricos. ABNT: Rio de Janeiro, Brazil, 2018.
  12. NBR 9778; Argamassa e Concreto Endurecidos—Determinação da Absorção de Água por Imersão—Índice de Vazios e Massa Específica. ABNT: Rio de Janeiro, Brazil, 2009.
  13. NBR 16916; Agregado Miúdo—Determinação da Densidade e da Absorção de Água. ABNT: Rio de Janeiro, Brazil, 2021.
  14. NBR 16917; Agregado Graúdo—Determinação da Densidade e da Absorção de Água. ABNT: Rio de Janeiro, Brazil, 2021.
  15. de Jesus, W.S.; da Silva, M.F.S.; de Almeida, S.M.T.; Souza, T.M.; Leal, E.S.; Souza, R.S.; Sacramento, L.A.; Allaman, I.B.; de Castro Pessôa, J.R. Comparative study of ASTM C1202 and IBRACON/NT Build 492 testing methods for assessing chloride ion penetration in concretes using different types of cement. Buildings 2025, 15, 302. [Google Scholar] [CrossRef]
  16. NBR 6118; Projeto de Estruturas de Concreto. ABNT: Rio de Janeiro, Brazil, 2023.
  17. NBR 16889; Concreto—Determinação da Consistência Pelo Abatimento do Tronco de Cone. ABNT: Rio de Janeiro, Brazil, 2020.
  18. Abrams, D.A. Design of Concrete Mixtures; Structural Materials Research Laboratory, Lewis Institute: Chicago, IL, USA, 1919; Volume 1. [Google Scholar]
  19. R Core Team. R: A Language and Environment for Statistical Computing. R Foundation for Statistical Computing: Vienna, Austria, 2023. Available online: http://www.R-project.org/ (accessed on 21 December 2022).
  20. Jelihovschi, E.G.; Faria, J.C.; Allaman, I.B. ScottKnott: A package for performing the Scott-Knott clustering algorithm in R. TEMA 2014, 15, 3–17. [Google Scholar] [CrossRef]
  21. NBR 8953; Concreto Para Fins Estruturais—Classificação Pela Massa Específica, por Grupos de Resistência e Consistência. ABNT: Rio de Janeiro, 2015.
  22. Ram, K.; Londono-Zuluaga, D.; Serdar, M.; Scrivener, K. The effect of cement reduction and substitution on the mechanical and durability properties of concrete. In Proceedings of the International Conference on Concrete Repair, Rehabilitation and Retrofitting (ICCRRR 2022), Cape Town, South Africa, 3–5 October 2022; MATEC Web of Conferences 364. p. 02008. [Google Scholar]
  23. Medeiros, M.H.F.; Rocha, F.C.; Medeiros-júnior, R.A.; Helene, P. Potencial de corrosão: Influência da umidade, relação água/cimento, teor de cloretos e cobrimento. IBRACON Struct. Mater. J. 2017, 10, 864–885. [Google Scholar]
  24. Esteves, I.C.A.; Hino, J.R., Jr.; Réus, G.C.; Medeiros, M.H.F. Influência do consumo de cimento na dosagem do concreto sobre a formação da película passivadora do aço. Tech. Sci. J. CREA PR 2018, 1, 143–155. [Google Scholar]
  25. Medeiros, R.A., Jr.; Lima, M.G.; Medeiros, M.H.F.; Real, L.V. Investigação da resistência à compressão e da resistividade elétrica de concretos com diferentes tipos de cimento. ALCONPAT J. 2014, 4, 116–132. [Google Scholar]
  26. Muhammad, A.; Usman, N.; Gambo, N. Effect of binary blended pozzolanic materials on properties of self-compacting concrete. Int. J. Constr. Manag. 2022, 22, 1323–1332. [Google Scholar] [CrossRef]
  27. Huynh, T.P.; Ho, L.S.; Van Ho, Q. Experimental investigation on the performance of concrete incorporating fine dune sand and ground granulated blast-furnace slag. Constr. Build. Mater. 2022, 347, 128512. [Google Scholar] [CrossRef]
  28. Prasanna, P.K.; Srinivasu, K.; Murthy, A.R. Strength and durability of fiber reinforced concrete with partial replacement of cement by ground granulated blast furnace slag. Mater. Today Proc. 2021, 47, 5416–5425. [Google Scholar] [CrossRef]
  29. Magalhães, T.A. Análise da Penetração de Íons Cloreto Em Compósitos Cimentícios Contendo Diferentes Teores de Escória De Alto Forno. Master’s Thesis, Postgraduate Program in Civil Construction at the Federal University of Minas Gerais, Belo Horizonte, Minas Gerais, Brazil, 2019. [Google Scholar]
  30. Ogirigbo, O.; Black, L. Chloride binding and diffusion in slag blends: Influence of slag composition and temperature. Constr. Build. Mater. 2017, 149, 816–825. [Google Scholar] [CrossRef]
  31. Ramezanianpour, A.; Ghiasvand, E.; Nickseresht, I.; Mahdikhani, M.; Moodi, F. Influence of various amounts of limestone powder on performance of Portland limestone cement concretes. Cem. Concr. Compos. 2009, 31, 715–720. [Google Scholar] [CrossRef]
  32. Ananyachandran, P.; Vasugi, V. Development of a sustainable high early strength concrete incorporated with pozzolans, calcium nitrate and triethanolamine: An experimental study. Sustain. Energy Technol. Assess. 2022, 54, 102857. [Google Scholar] [CrossRef]
  33. Liu, J.C.; Hossain, M.U.; NG, T.S.; Ye, H. High-performance green concrete with high-volume natural pozzolan: Mechanical, carbon emission and cost analysis. J. Build. Eng. 2023, 68, 106087. [Google Scholar] [CrossRef]
  34. Ahmad, S.; Baghabra Al-Amoudi, O.S.; Khan, S.M.S.; Maslehuddin, M. Effect of silica fume inclusion on the strength, shrinkage and durability characteristics of natural pozzolan-based cement concrete. Case Stud. Constr. Mater. 2022, 17, e01255. [Google Scholar] [CrossRef]
  35. Baghabra Al-Amoudi, O.S.; Ahmad, S.; Maslehuddin, M.; Khan, S.M.S. Lime-activation of natural pozzolan for use as supplementary cementitious material in concrete. Ain. Shams. Eng. J. 2022, 13, 101602. [Google Scholar] [CrossRef]
  36. Rahman, S.A.; Dodd, A.; Khair, S.; Shaikh, F.U.A.; Sarker, P.K.; Hosan, A. Assessment of lithium slag as a supplementary cementitious material: Pozzolanic activity and microstructure development. Cem. Concr. Compos. 2023, 143, 105262. [Google Scholar] [CrossRef]
  37. Wang, Y.; Shui, Z.; Wang, L.; Gao, X.; Huang, Y.; Song, Q.; Liu, K. Alumina-rich pozzolan modification on Portland-limestone cement concrete: Hydration kinetics, formation of hydrates and long-term performance evolution. Constr. Build. Mater. 2020, 258, 119712. [Google Scholar] [CrossRef]
  38. Bediako, M.; Valentini, L. Strength performance and life cycle assessment of high-volume low-grade kaolin clay pozzolan concrete: A Ghanaian scenario. Case Stud. Constr. Mater. 2022, 17, e01679. [Google Scholar] [CrossRef]
  39. Adegoke, H.A.; Ikumapayi, C.M. Effects of induction furnace slag on the durability properties of concrete. Constr. Build. Mater. 2024, 419, 135263. [Google Scholar] [CrossRef]
  40. Rahman, S.A.; Shaikh, F.U.A.; Sarker, P.K. Fresh, mechanical, and microstructural properties of lithium slag concretes. Cem. Concr. Compos. 2024, 148, 105469. [Google Scholar] [CrossRef]
  41. Bhagath Singh, G.V.P.; Durga Prasad, V. Environmental impact of concrete containing high volume fly ash and ground granulated blast furnace slag. J. Clean. Prod. 2024, 448, 141729. [Google Scholar] [CrossRef]
  42. AS 3972:2010; General Purpose and Blended Cements. Standards Australia: Sydney, Australia, 2010.
  43. BS EN 197-1:2011; Cement—Part 1: Composition, Specifications and Conformity Criteria for Common Cements. British Standards Institution: London, UK, 2011.
  44. ASTM C150/C150M-22; Standard Specification for Portland Cement. ASTM International: West Conshohocken, PA, USA, 2022.
  45. GS 1118:16; General Specification for Cement. Development Bureau, Hong Kong Government: Hong Kong, 2016.
Figure 1. Axial compression test: (a) adjustment of specimen into hydraulic press, (b) specimen after rupture, and (c) recorded result.
Jcs 09 00110 g001
Figure 2. Apparatus used for determining water absorption, void index, and specific mass: (a) specimens in the oven, (b) saturating specimens, (c) boiling of specimens, (d) determination of dry mass, (e) determination of immersed mass, (f) determination of saturated mass.
Jcs 09 00110 g002
Figure 3. Axial compressive strength (σ) versus water/cement (w/c) ratio obtained by exponential regression of the Abrams curve for cement with a characteristic strength of 32 MPa [18].
Jcs 09 00110 g003
Figure 4. Axial compressive strength (σ) for the different types of concrete at (a) 28-days and (b) 196-days age.
Jcs 09 00110 g004aJcs 09 00110 g004b
Figure 5. Axial compressive strength for the different types of concrete. (a) Statistical comparison between curing ages and (b) % increase of compressive strength from 28- to 196-days age.
Jcs 09 00110 g005
Figure 6. (a) Water absorption, (b) void index, and (c) specific mass of concretes at 28 and 196-days age.
Jcs 09 00110 g006aJcs 09 00110 g006b
Figure 7. Consumption of (a) cement, (b) fine aggregates, and (c) coarse aggregates for each type of concrete.
Jcs 09 00110 g007aJcs 09 00110 g007b
Figure 8. (a) Cost per m3 for each type of concrete (BRL = real, the Brazilian currency), (b) comparison of compressive strength increase with cost reduction, and (c) variations in the cement, fine and coarse aggregates, as well as cost among the types of concretes.
Jcs 09 00110 g008
Table 1. Composition of the Portland cements (percentage by mass) used in this work. Adapted from NBR 16697 [10].
Type of CementAbbreviationClinker + GypsumGranulated Blast-Furnace SlagPozzolanCarbonates
(Filler)
Portland cement blended with granulated blast-furnace slagPC II E51–946–3400–15
Portland cement blended with pozzolanic materialPC II Z71–9406–140–15
Portland cement blended with carbonate materialPC II F75–890011–25
Blast-furnace Portland cementPC III25–6535–7500–10
Pozzolanic Portland cementPC IV45–85015–500–10
Table 2. Physical properties of cements and aggregates [15].
Cement TypeSpecific Mass (kg/m3)Loose Unit Mass (kg/m3)Compacted Unit Mass (kg/m3)Fineness ModulusMaximum Diameter (mm)Moisture
PC II E3000 a
PC II E-SR2990 b
PC II F2980 b
PC II F-SR3000 c
PC II Z3030 d
PC III-SR2950 e
PC IV3100 f
PC IV-SR 2960 a
Fine aggregate2845163917691.711.182.94
Coarse aggregate2719136715532.4612.50.32
Superplasticizer1090 *
Information about specific mass of cements was provided by suppliers: a Liz cement brand; b Nacional cement brand; c Mizu cement brand; d Montes Claros cement brand; e CSN cement brand; f Faciment cement brand. * Information about specific mass of superplasticizer was obtained in the technical sheet provided by supplier.
Table 3. Proportion of materials per m3 of concrete. SP means superplasticizer [15].
Type of ConcreteCement (kg/m3)Fine Aggregate (kg/m3)Coarse Aggregate (kg/m3)Water
(L/m3)
w/c RatioSP
(L/m3)
PC II E420.30330.44704.20137.120.330.77
PC II E-SR420.44329.21704.43137.210.330.96
PC II F420.58327.98704.66137.290.331.16
PC II F-SR420.30330.44704.20137.120.330.58
PC II Z419.89334.06703.51136.870.330.39
PC III-SR421.00324.22705.37137.550.330.48
PC IV418.97342.21701.98136.300.330.77
PC IV-SR420.86325.48705.13137.470.330.58
Table 4. Adjusted w/c ratios from the Abrams curve for the average compressive strengths obtained in the concretes at 28 and 196 days.
Type of Concretew/c at 28 Days w/c at 196 Days
PC II E0.2790.227
PC II E-SR0.2250.201
PC II F0.3470.313
PC II F-SR0.3190.257
PC II Z0.3430.304
PC III-SR0.3430.271
PC IV0.2790.206
PC IV-SR0.3370.261
Table 5. Adjusted w/c ratios from the Abrams curve for the average compressive strengths obtained at 28 and 196 days, targeting a compressive strength of 40 MPa.
Type of ConcreteDosage at 28 DaysDosage at 196 Days
w/c at 28 DaysIncrease (%)w/c at 196 DaysIncrease (%)
PC II E 0.43925.370.54054.34
PC II E-SR0.54555.740.61074.28
PC II F0.3530.860.39211.97
PC II F-SR0.3849.650.47736.35
PC II Z0.3571.890.40315.00
PC III-SR0.3571.920.45329.36
PC IV0.43925.420.59670.31
PC IV-SR0.3643.920.47034.16
Table 6. New material contents per m3 of concrete obtained from the ABPC method guidelines for a target compressive strength of 40 MPa at 28 days.
Type of ConcreteConsumption at 28 DaysConsumption at 196 Days
Cement (kg/m3)Fine Aggregate (kg/m3)Coarse Aggregate (kg/m3)Water (L/m3)Cement (kg/m3)Fine Aggregate (kg/m3)Coarse Aggregate (kg/m3)Water (L/m3)
PC II E328.56403.21690.46132.05263.33454.96680.70128.45
PC II E-SR260.82456.26680.45128.36231.52479.58676.05126.74
PC II F416.65331.11704.07137.08371.58367.11697.28134.57
PC II F-SR379.79362.58698.13134.88300.55425.43686.27130.51
PC II Z410.88341.14702.18136.38360.07381.04694.65133.60
PC III-SR411.94331.53703.99137.05318.05407.27689.70131.77
PC IV327.75412.24688.76131.43236.79482.07675.58126.56
PC IV-SR403.13339.74702.44136.47305.63418.12687.65131.02
Table 7. Literature on the long-term mechanical performance of concretes with various supplementary cementitious materials.
AuthorSCMOptimal Content (%)w/bCompressive Strength (MPa)Findings
28 Days56 Days90 Days180 Days270 Days
(Adegoke, Ikumapayi [39])Control--6.87.1 (+4.4%)9.4 (+38.2%)--The authors used Portland limestone cement (CEM II) with a strength class of 42.5. The highest compressive strength, reaching 14.4 MPa, was achieved with a 25% substitution of induced blast-furnace slag (FS) at 90 days. Due to its predominantly crystalline nature, the slag showed low reactivity, resulting in only a modest 12.5% increase in strength compared to the 28-days age. However, a significant increase was observed in the control sample from 28 to 90 days.
FS25-11.512.8 (+11.3%)14.4 (+12.5%)--
(Rahman, Shaikh, Sarker [40])Control-0.4340.4-49.9 (+23.5%)--Authors utilized OPC without SCMs, conforming to AS 3972:2010 [42], for general purpose. The highest compressive strength at 28 days was attained with 20% lithium slag (LS), while at 90 days, it was achieved with 40% *. LS content ranging from 20% to 40% accelerated pozzolanic activity during the early stages. LS comprises 31.6% amorphous aluminosilicate, initiating pozzolanic activity within 3 to 7 days. Concretes containing 60% fly ash (FA) exhibited the highest strengths among those containing fly ash. The low solubility of fly ash in an alkaline environment did not expedite strength gain, indicating its slower pozzolanic nature compared to LS.
LS 2049.8 52.5 (+5.4%)
LS 4047-58.6 (+24.7%)--
FA6038.8-45 (+16%)--
(Liu et al. [33])Control-0.337582 (+9.3%)---The authors utilized OPC without SCMs, conforming to the BS EN 197-1 [43] standard with a strength class of 52.5. The authors asserted that 1 g of volcanic ash (VA) consumes 321 milligrams of Portlandite, indicating its low reactivity compared to other pozzolans. Although not explicitly stated, this could explain why the strength at 28 days was lower than that of the control concrete. However, both the control and VA-based concretes demonstrated a reasonably significant increase in strength by 56 days compared to 28 days of age.
VA3072.179.9 (+10.8%)---
(Ananyachandran, Vasugi [32])Control-0.3550--51.8 (+3.6)52 (+0.38%)Three different types of cementitious materials were employed in this study: (1) 53-grade Ordinary Portland Cement (OPC) as the control, (2) Portland Slag Cement (PSC), and (3) Ordinary Portland Cement with 15% Metakaolin substitution. Both Metakaolin (MK) and Furnace Slag (FS) contributed to enhanced resistance compared to the standard sample, with MK standing out for its high reactivity and fine particle size. However, the difference in long-term strength development compared to the 28-day hydration period was not significant for either SCM, remaining below 10%.
FS 21–3554.956.0 (+2%) 56.8 (+3.5%)58.1 (+5.8%)59.2 (+7.8%)
MK1563.164.8 (+2.7%)65.9 (+4.4%)67.2 (+6.5%)68.3 (+8.2%)
(Ahmad et al. [34])Control-0.453.2-57 (+7.1%)63 (+18.4%)-In this study, OPC Type I, conforming to ASTM C150 [44], was used. The concrete incorporating 20% natural pozzolan (NP) and 5% silica fume (SF) exhibited a greater increase in strength over time compared to the reference concrete after 28 days of curing. Additionally, both samples showed a significant strength gain of 17–18% from 180 to 28 days.
NP + SF *20–5 *63.9-69.5 (+8.7%)74.9 (+17.2%)-
(Baghabra Al-Amoudi et al. [35])Control-0.453-58 (+9.4%)64 (+20.7%)-Author used OPC Type I, conforming to ASTM C 150 [44]. The activation of natural pozzolan (NP) by hydrated lime (HL) enhanced both the initial and final strength and compensated for the loss of strength due to the substitution of OPC with NP. Not only did it improve the initial strength by approximately 10 to 15% across all ages, but the HL-treated concrete also exhibited superior strength compared to the OPC concrete. Finally, the strength gain reached up to approximately 25% at 180 days compared to the standard sample.
NP + HL *20–7 *58.5-65.2 (+11.5%)73.2 (+25.2%)-
(Bediako, Valentini [38])Control-0.483440 (+17.6%)---Portland cement class 42.5 R without SCMs (likely CEM I), conforming to GS 1118:16 [45], was used. The 10% clay pozzolan (CP) sample showed a gain in strength compared to the standard sample, particularly at the 28-day hydration mark. This suggests a pozzolanic reaction occurred, where products formed and filled spaces, enhancing strength. Comparing the samples, later ages slightly favor the CP sample, but there is a significant gain for the standard sample.
CP1042.145.4 (+7.8%)---
(Wang et al. [37])Control 0.3552.658.3 (+10.8%)---The authors used Portland limestone cement (PLC) as a reference, adhering to BS EN 197-1 [43] standards. The increase in strength is attributed to the formation of carboaluminates, which fills voids in the matrix, resulting in a denser structure. The addition of Metakaolin (MK) accelerates the hydration of PLC paste, and at low MK replacement levels, this effect can be enhanced further by ultra-fine fly ash (UFA).
MK1166.371.4 (+7.7%)---
MK + UFA *10 + 10 *72.975.8 (+4%)---
* Content of the SCM indicated.
Disclaimer/Publisher’s Note: The statements, opinions and data contained in all publications are solely those of the individual author(s) and contributor(s) and not of MDPI and/or the editor(s). MDPI and/or the editor(s) disclaim responsibility for any injury to people or property resulting from any ideas, methods, instructions or products referred to in the content.

