1. Introduction
As the world faces the problem of climate change, carbon neutrality policies have been implemented, and the demand for electric vehicles has increased. As the performance of electric vehicles highly depends on electrical motors, the interest in soft magnetic electrical steel equipped for motor stators and rotors has increased. Electrical steel requires superior soft magnetic properties, including low core loss, high magnetic saturation flux density, and high permeability, to ensure efficient performance and power. Core loss comprises hysteresis, eddy current, and anomalous loss. In the range of motor applications, hysteresis loss accounts for the largest proportion, but with the recent increase in operating frequencies, the impact of eddy current loss is also increasing.
In 1929, the binary Fe-Co alloy was developed [
1]. Fe-Co alloy has the highest saturation magnetic flux density among soft magnetic materials. As can be seen in the Slater–Pauling curve showing the mean atomic moment for equiatomic alloys as a function of composition, Fe
70Co
30 has the highest saturation magnetic flux density of 2.46 T. In Fe
45Co
55, as the value of anisotropy constant K
1 approaches zero, the permeability sharply increases, and the maximum value can be obtained at around the Fe
50Co
50 composition [
2,
3]. However, Fe-Co alloy has a disadvantage due to its brittleness, so studies have been conducted to improve its mechanical properties by adding various elements [
4,
5,
6,
7,
8,
9].
White and Wahl improved the brittleness of Fe-Co alloy by adding vanadium (V) in amounts ranging from 1% to 4% [
4]. Notably, they concluded that when V was added at concentrations of 2% or higher, the alloy could be shaped into the desired form through appropriate heat treatment and rolling processes, leading them to file a patent. Kawahara conducted a study on whether various added elements improved the cold workability of Fe-Co alloys [
5], and they found that eight elements, including carbon (C), vanadium (V), niobium (Nb), and tantalum (Ta), improved its ductility. Also, Kawahara and Uehara studied the effects of chromium (Cr), molybdenum (Mo), tungsten (W), tantalum (Ta), and niobium (Nb) in Fe-Co-based alloy [
6]. Fe-Co-0.5Cr had coercivity of 2800 A/m after undergoing 90% cold rolling and an aging heat treatment for 30 min at 500 °C; this coercivity value is out of the range of soft magnets. In the same conditions, the additions of Mo, W, Ta, and Nb led to high coercivity values of 2000 A/m, 2300 A/m, 2100 A/m, and 2200 A/m, respectively. The researchers found that adding V, Nb, Ta, and other various elements to Fe-Co alloy improved its mechanical properties without degrading its soft magnetic properties. Subsequently, many studies have compared the influence of adding three elements. Major and Orrok compared the mechanical and magnetic properties of Fe-Co alloys with the addition of V and the substitution of Nb and Ta [
7]. The effects of V, Nb, and Ta led to coercivity values of 60 A/m, 102 A/m, and 45 A/m, respectively, with Ta exhibiting the lowest coercivity. Additionally, Major compared the addition of 0.35 wt.% Ta and 2 wt.% V with the findings of Samadian [
8]. The elongation improved with the heat treatment temperature. Elongation of 7% was achieved with the Ta addition, and 8% elongation was achieved with the V addition when the two samples were heat-treated at 800 °C. The minimum coercivity was 57 A/m for the Fe-Co-V alloy and 15 A/m for the Fe-Co-Ta alloy. Persiano and Rawlings compared adding 2~5.4 wt.% V and 1~3 wt.% Nb when heat treating Fe-Co alloy at 760 °C, followed by furnace cooling [
9]. The minimum coercivity was 90 A/m for the V-containing alloy and 300 A/m for the Nb-containing alloy. However, eddy current loss is also an important property for power electronics applications and electrical machines. Resistivity is inversely proportional to eddy current loss; the higher the resistivity, the lower the eddy current loss. Persiaano and Rawling compared the resistivity of Fe-Co alloys with the addition of alloying elements under quenching heat treatment. The addition of 5.4 wt.% V resulted in a maximum resistivity of 60.7 µΩ × cm, while 3 wt.% Nb showed a maximum resistivity of 5.50 µΩ × cm, a lower value compared to that of the addition of V. During furnace cooling, V-containing alloy also showed a higher resistivity of 48.4 µΩ × cm compared to the Nb-containing alloy, with a resistivity of 3.16 µΩ × cm.
Various methods have been attempted to improve the mechanical properties of Fe-Co alloy, such as precipitation of the second phase and micro-alloying, as well as adding elements [
10,
11]. Sundar, Deevi, and Reddy improved the mechanical properties of Fe-Co alloy (Fe
BalCo
40V
5B
0.005C
0.15Mo
0.5Nb
0.5) through various heat treatments in the age-hardening process [
10]. When the aging temperature was 600 °C, the hardness had the highest value, and the resistivity was 40% higher than that of the FeCo-2V alloy, but the coercivity had a value of at least 12 times to at most 50 times that of the FeCo-2V alloy. Hou et al. added a micro amount of Cr to the FeCo-2V alloy and compared its mechanical properties and coercivity at different heat treatment temperatures with those of the FeCo-2V alloy [
11]. Both alloys had decreased tensile strength as the heat treatment temperature increased up to 760 °C. However, beyond 760 °C, the tensile strength of the FeCo-2V alloy continued to decrease, and that of the alloy with the addition of Cr increased. The authors concluded that the reason for this was the formation of micrometers of Cr-rich or V-rich precipitation in the matrix. They determined that the optimal heat treatment temperature was 800 °C, which achieved a tensile strength of 912 MPa and 10.9% elongation, which were improvements compared to the FeCo-2V alloy. At that temperature, the coercivity had a low value of 2.6 Oe (≈ 207 A/m), but it was a little higher than that of the FeCo-2V alloy.
Therefore, we can confirm a slight trade-off relationship between the mechanical and magnetic properties of Fe-Co alloys. Since the research has been focused on improving the mechanical properties, further research is needed to optimize the soft magnetic properties. The addition of vanadium improves the mechanical properties of Fe-Co alloy but also maintains its magnetic properties. Vanadium also plays an important role in the phase transformation mechanisms of Fe-Co alloy [
3,
4]. When the ordered body-centered cubic (ordered BCC) phase was present, the soft magnetic properties were better than those of the other phases [
12,
13], and they reacted sensitively to the final heat treatment conditions. Because the microstructure and soft magnetic properties, such as coercivity, are closely related, the microstructure, like the grain size, is affected by the final heat treatment conditions, such as the cooling rate and temperature [
12,
14,
15]. Adding vanadium expands the gap between the ordered BCC phase and the face-centered cubic (FCC) phase. For this reason, it is easier to construct an ordered BCC structure. This research developed a single-phase ordered BCC structure by adding 2 at.% vanadium and optimized the magnetic properties by correlating the grain size with the magnetic properties. This study achieved this by varying the heat treatment temperature and identifying an optimized annealing temperature that enhances the soft magnetic properties.
2. Experiment
This study processed an electrical steel alloy with 49 at.% Fe, 49 at.% Co, and 2 at.% V under high vacuum conditions exceeding 10−5 Torr during the melting phase. The alloy was subjected to a homogenization heat treatment at 1200 °C for 4 h, followed by hot rolling to a thickness of 6 mm. The material was annealed at 950 °C for 1 h to facilitate cold rolling, followed by rapid quenching. Cold rolling was performed to achieve a final thickness of 0.15 mm. Subsequently, specimens were sectioned into dimensions of 100 × 10 mm2 for further heat treatment.
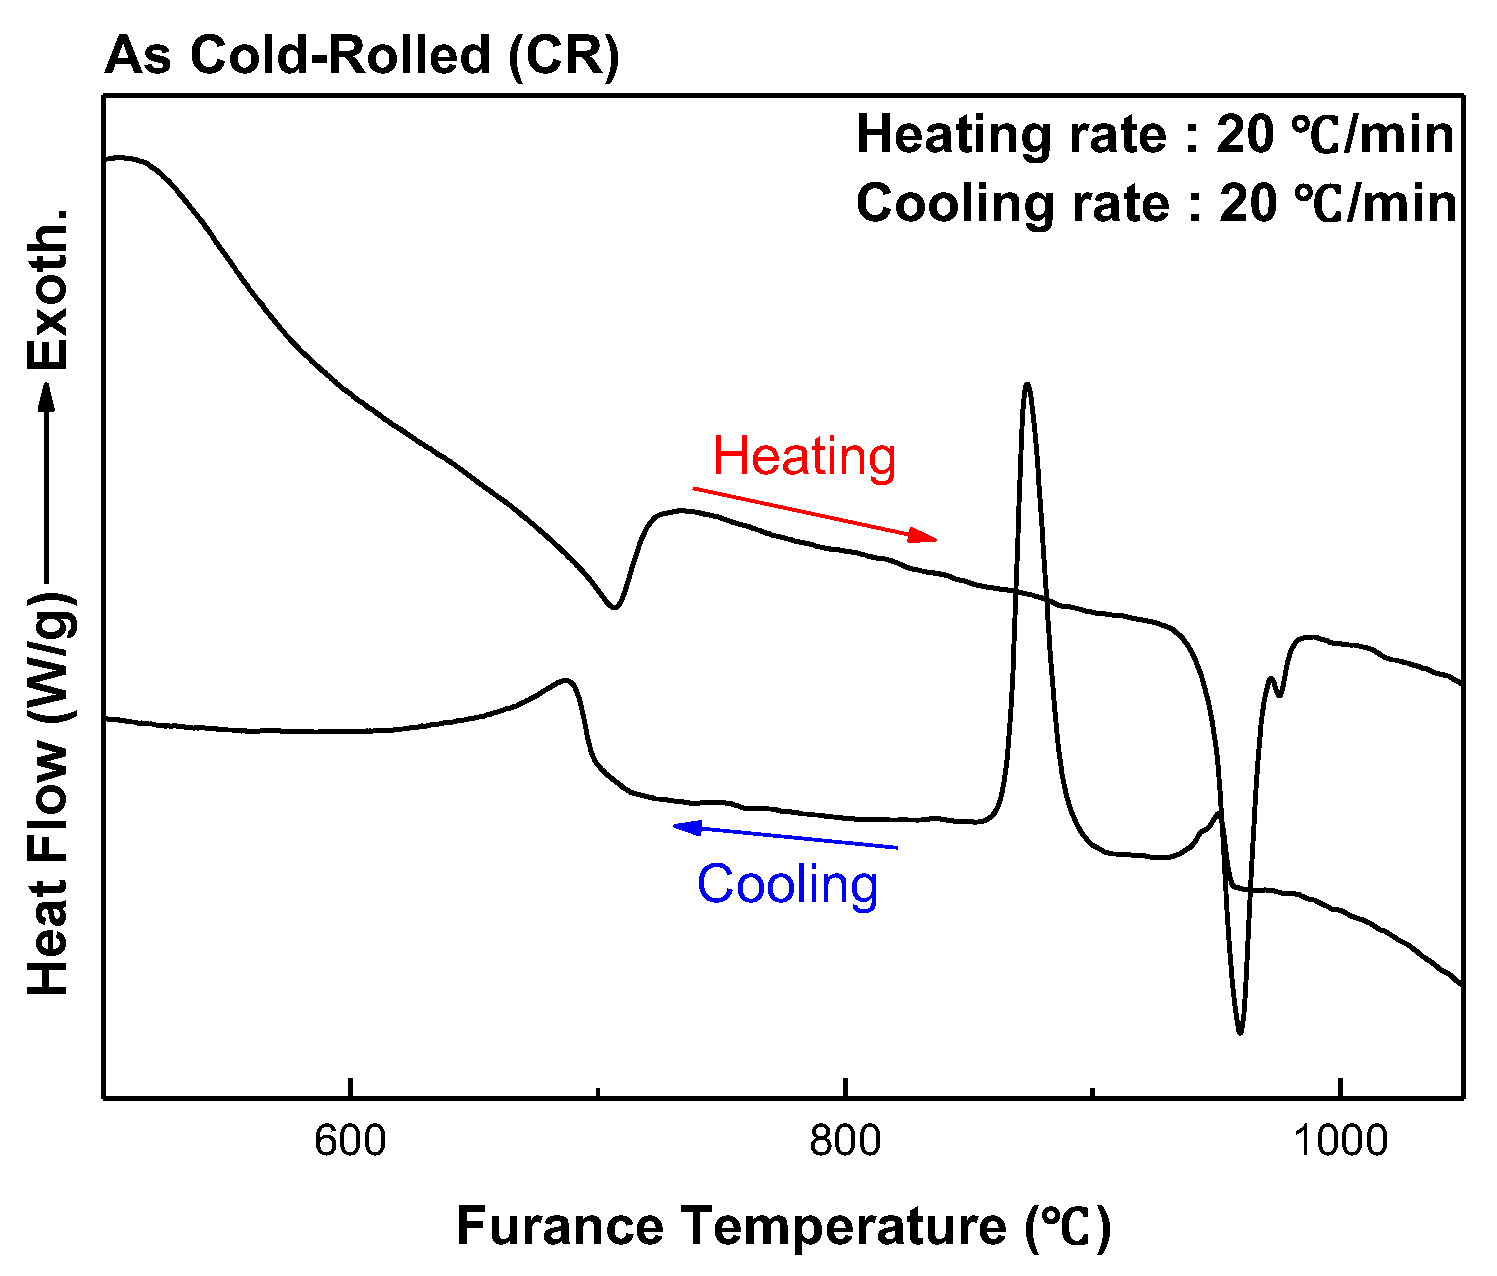
The heat treatment was conducted in an argon atmosphere with a controlled heating rate of 5 °C/min. The samples were treated across a temperature range from 600 °C to 950 °C, in 50 °C increments, each for 1 h and 30 min, followed by furnace cooling. Differential scanning calorimetry (DSC) was performed from 20 °C to 1100 °C in an argon environment to determine the optimal heat treatment temperature range. The heating rates were set to 20 °C/min from 20 °C to 1100 °C. The thermal properties in response to the heat treatment were characterized under these conditions for each specimen. In addition to the heating process, the DSC analysis for the as-cold-rolled sample also included a cooling phase. This was implemented to compare the thermal behavior during heating and cooling. The sample was cooled from 1100 °C to 20 °C at a rate of 20 °C/min, allowing for a comprehensive comparison of the thermal responses during the heating and cooling processes.
The magnetic properties, including the coercivity and hysteresis loss, were assessed with a DC B-H loop tracer (MI-36, SENSORPIA, Daejeon, Republic of Korea), recording measurements up to a magnetic field strength of 5000 A/m. The data presented are averaged values obtained from three or more repetitions of each measurement. A vibrating sample magnetometer (VSM, 7410-S, Lake Shore, Westerville, OH, USA) measured the saturation magnetic moment up to a magnetic field strength of 10,000 Oe (≈796 kA/m). The microstructure of the specimens was analyzed with great care using a scanning electron microscope (SEM, JSM-7600F, JEOL, Tokyo, Japan), and the chemical composition of the sample heat-treated at 850°C was further examined using energy-dispersive X-ray spectroscopy (EDS, JSM-6390, Oxford Instruments, Abingdon-on-Thames, UK).
3. Results and Discussion
There are three phases in the Fe-Co diagram [
16]: ordered BCC phase (α
2), disordered BCC phase (α), and FCC phase (γ). Each phase has different properties. For example, the γ phase has good mechanical properties [
17,
18], so it has the advantage of increasing the material’s cold workability. Therefore, when using cold-rolling to make electrical steel, it is quenched after the heat treatment at a certain temperature to obtain the γ phase. Alloys with an ordered phase are known to have good soft magnetic properties [
12,
13], so we wanted to obtain the α phase. Before undergoing heat treatment, the DSC curve of an as-cold rolled sample was measured to determine the heat treatment temperature range and compare its thermal behavior during heating and cooling, as shown in
Figure 1.
Three peaks occurred during the heating process. As shown in
Table 1, the first peak’s temperature was 706 °C, that of the second was 959 °C, and that of the last was 975 °C. As explained by the Fe-Co phase diagram, the first one indicates a phase transformation from α
2 to α, the second one indicates a phase transformation from α to α + γ, and the last one indicates a phase transformation from α + γ to γ. Therefore, the heat treatment was performed in 50 °C increments between 600 °C and 950 °C, near the main peak temperature. The thermal behavior of the as-cold-rolled sample was also measured during the cooling process, and the DSC curve has three peaks. As shown in
Table 1, each peak’s temperature differed from those in the heating process: the first peak’s temperature was 686 °C, that of the second was 873 °C, and that of the last was 950 °C. The peaks indicate phase transformations from α to α
2, from α to α + γ, and from α + γ to γ, respectively. Another difference was that the heating process exhibited endothermic behavior, and the cooling process exhibited exothermic behavior.
Each specimen was measured under the same conditions to compare the thermal properties after the heat treatment.
Figure 2a shows the DSC curve of each sample after the heat treatment, and
Figure 2b–d show the enlargement of the second and third peaks. The as-cold-rolled sample and the sample after the heat treatment at 600 °C had three peaks; each peak’s temperature did not differ much, and the meaning of each peak was the same. The samples heat-treated between 650 °C and 950 °C displayed only two peaks, with the second and third peaks merging. The peak temperature remained consistent except for the sample heat-treated at 850 °C. Overall, the first peak’s temperature was 709 °C (±1 °C), and that of the second was 960 °C (±1 °C). At 850 °C, the first was 711 °C, and that of the second was 965 °C. Only two peaks can be seen in the narrowing region of the α + γ phase, but it can be seen that the region re-emerges in the curve of the samples heat-treated from 650 °C to 700 °C, and from 900 °C to 950 °C.
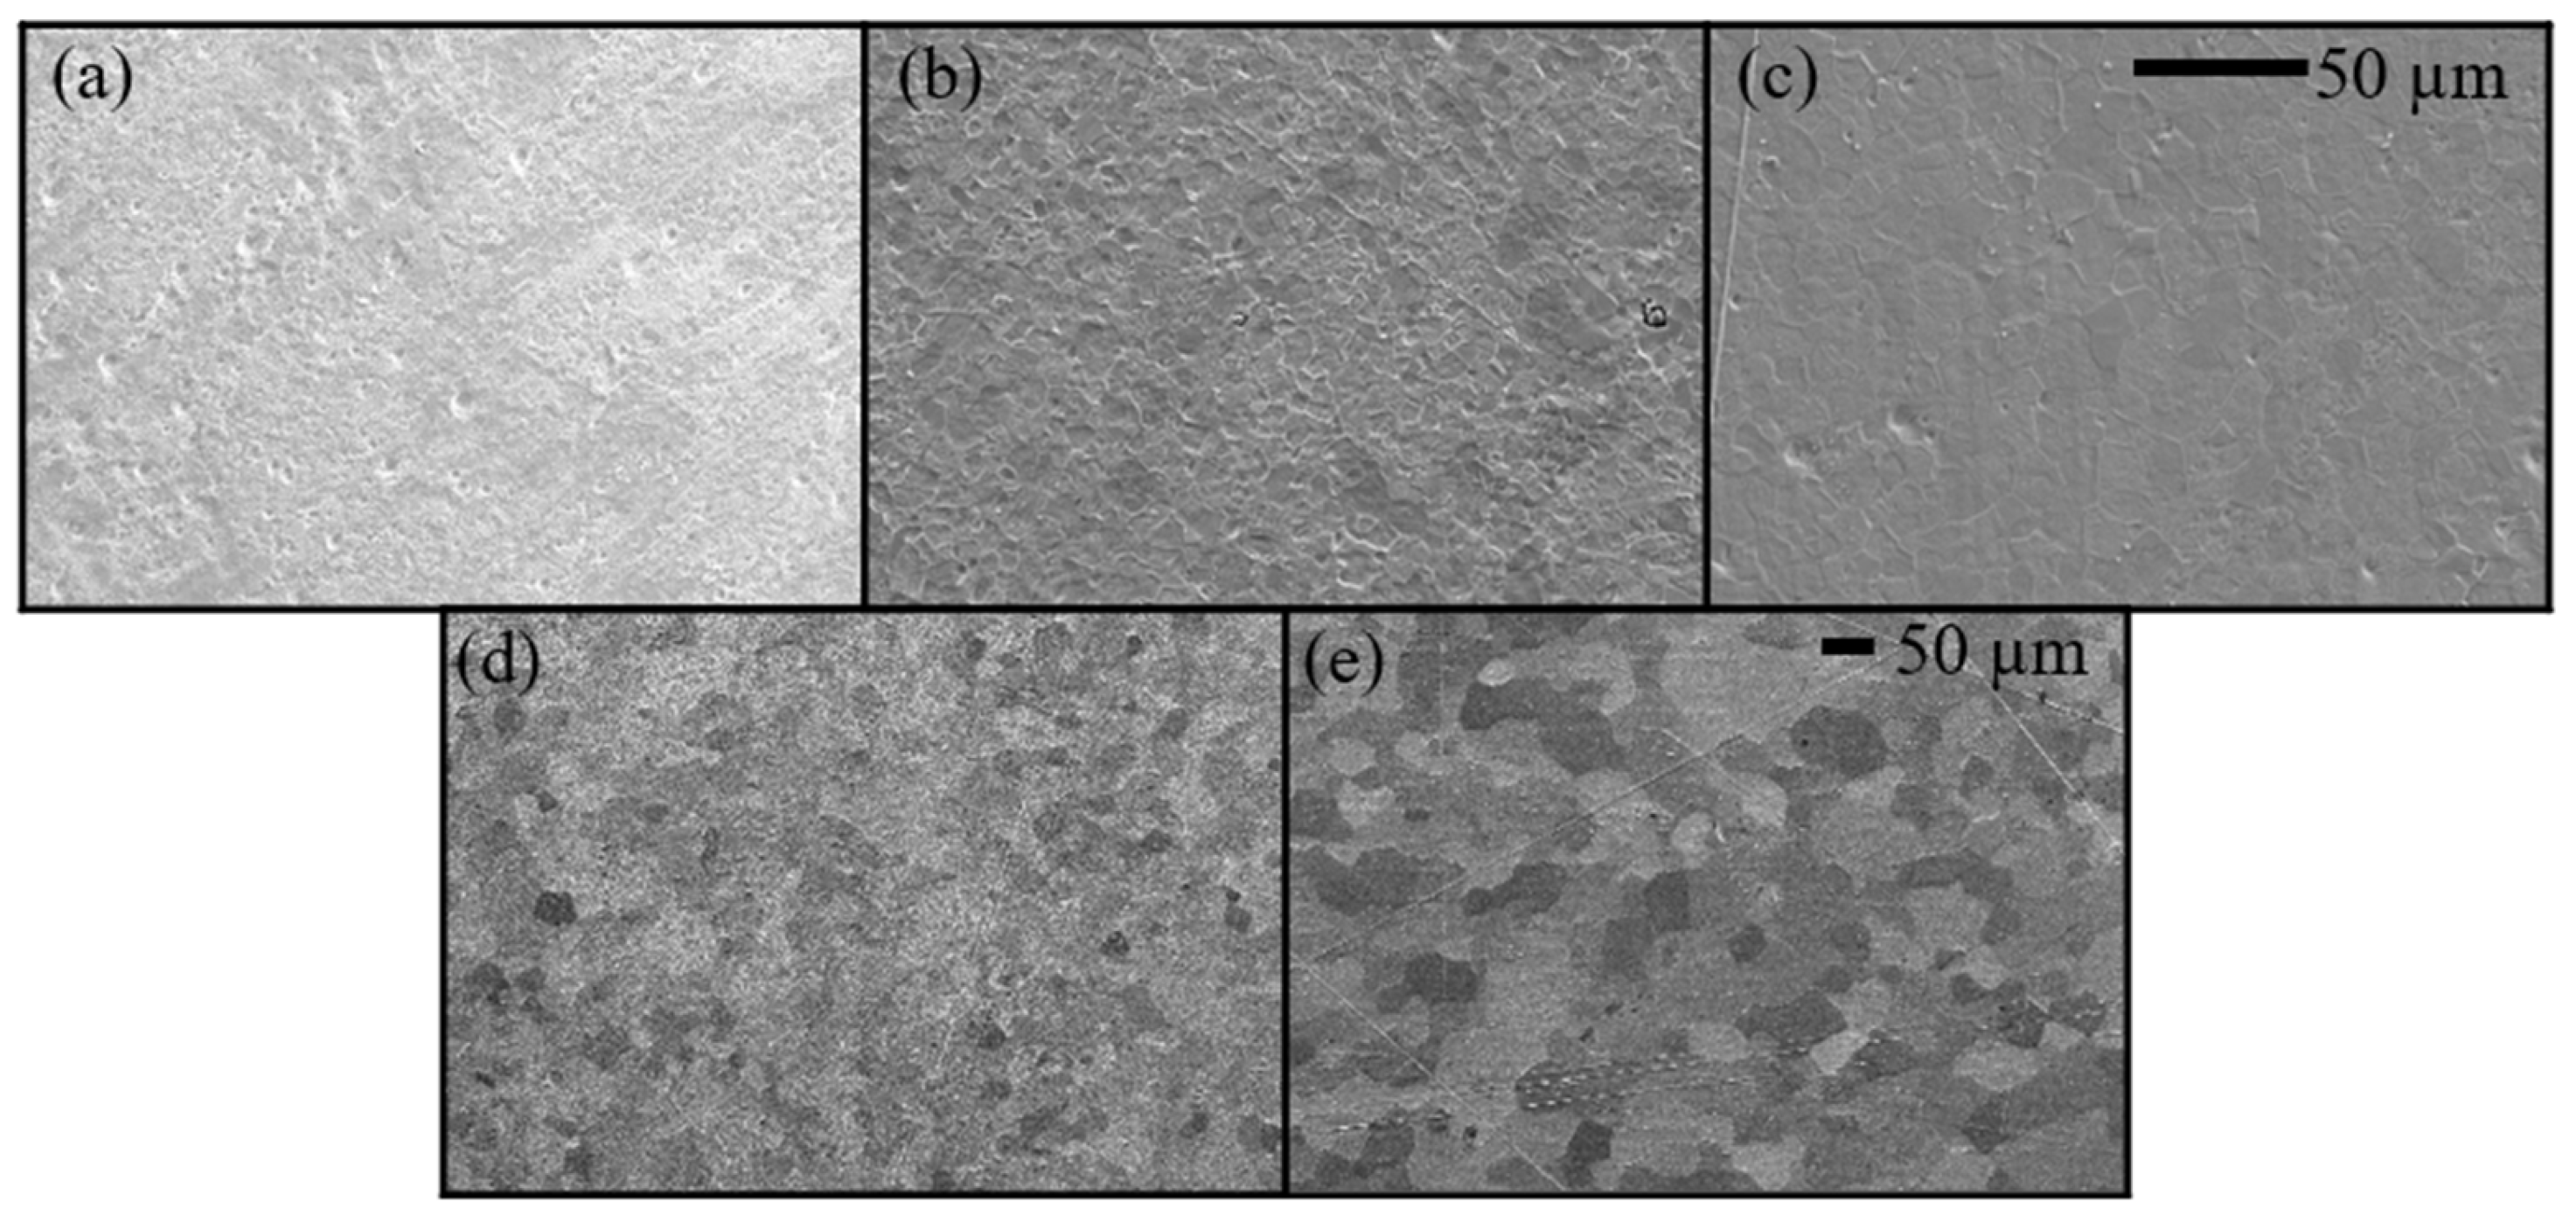
Figure 3 shows the microstructure of the electrical steel samples annealed from 600 °C to 800 °C, illustrating the progression of the full annealing process. At 650 °C, the electrical steel exhibited stress relief; from 700 °C, it exhibited recrystallization; and from 800 °C, it exhibited grain growth. As shown in
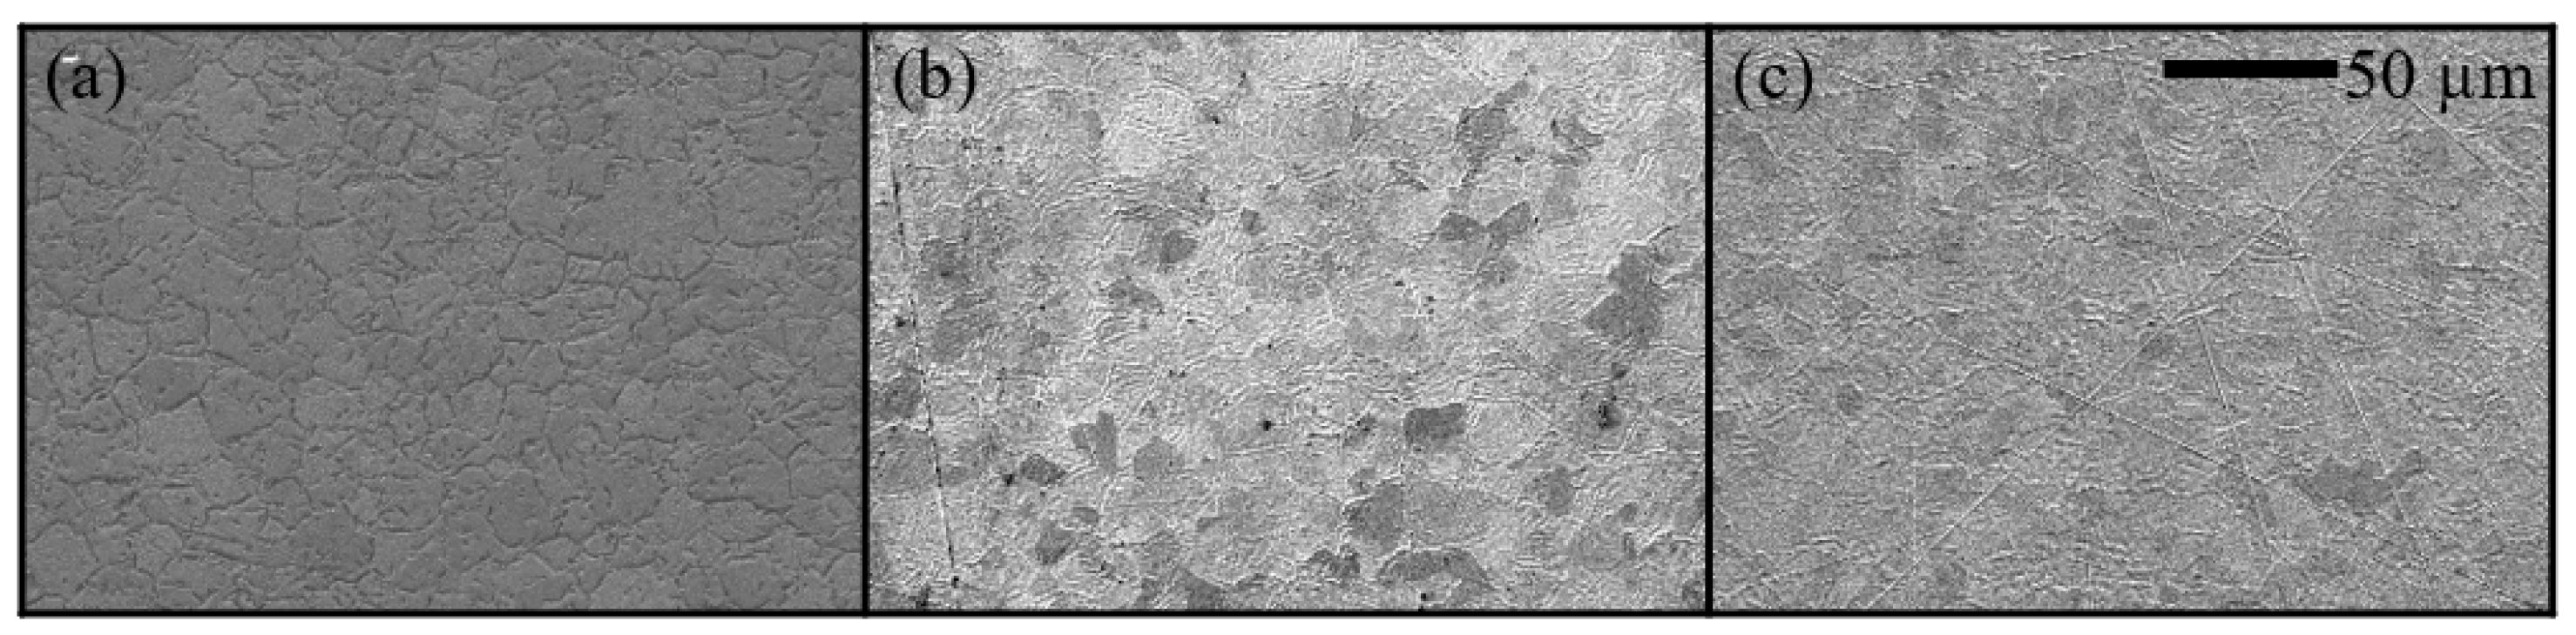
Figure 4, the microstructure after annealing at 850 °C exhibited a new grain shape. At 900 °C, the grain of the new phase grew. Unlike before, a new grain shape appeared, so it was measured by energy-dispersive X-ray spectroscopy (EDS, JSM-6390, Oxford Instruments, Abingdon-on-Thames, UK), and the results are shown in
Figure 5. At 850 °C, there was a difference in the element weight percent between the matrix and the grain boundary.
Table 2 shows the element weight percent of each region. The matrix contained 46.98 wt.% Fe, 47.21 wt.% Co and 1.60 wt.% V, while the grain boundary contained 45.12 wt.% Fe, 46.63 wt.% Co, and 2.21 wt.% V. The grain boundary showed a higher V content than the matrix. Both the matrix and grain boundary exhibited C and O; it can be seen that oxidation and carbonization occurred during the heat treatment.
In addition to the thermal properties, the magnetic properties, such as the saturation magnetization (M
s), magnetic flux density at 5000 A/m (B
50), coercivity (H
c), and hysteresis loss (W
h), were also measured. The values can be seen in
Table 3. The saturation magnetization had no obvious tendency at a relatively low temperature, but starting from 850 °C, it increased as the heat treatment temperature increased.
Figure 6 shows the hysteresis loop of the electrical steel annealed at 800 °C. It had a typical soft magnetic square loop, and all the heat-treated samples’ had similar hysteresis loops.
Figure 7 shows the tendency of the magnetic flux density at 5000 A/m, where no clear trend was observed, but the values exceeded 2.0 T, except at 850 °C. The high value of the magnetic flux density at 5000 A/m indicates that the sample was not saturated at a low applied magnetic field and its magnetization could be maintained; therefore, it can be used in high-current environments.
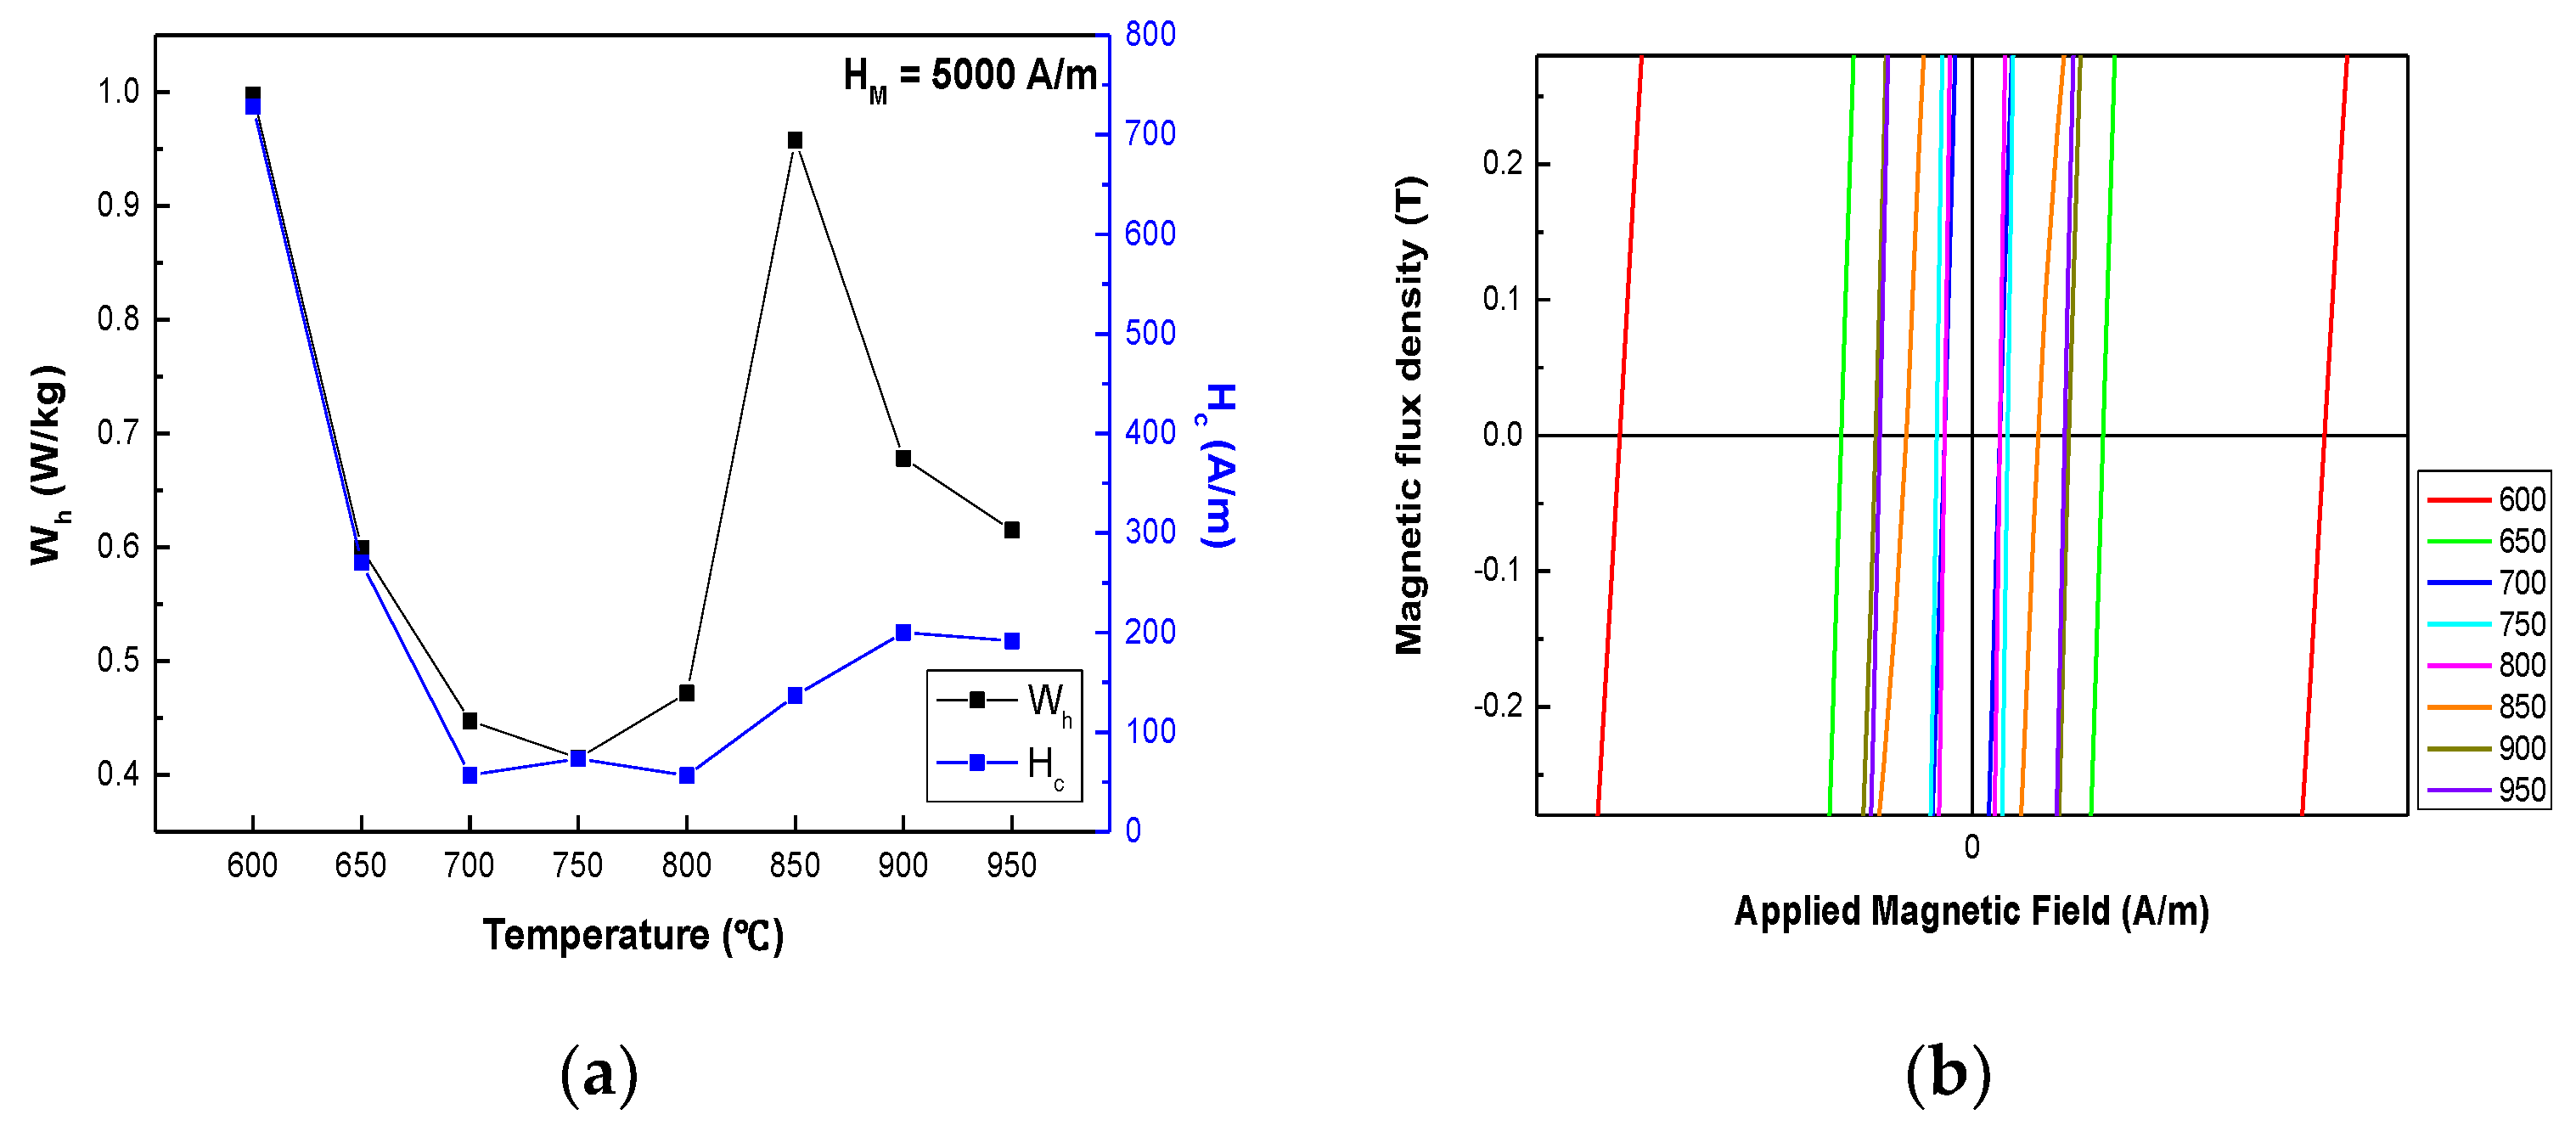
Figure 8 shows that soft magnetic properties were sensitive to the heat treatment temperatures. The coercivity, as shown in
Figure 8a, dropped rapidly from 728 A/m at 600 °C to 57.1 A/m at 700 °C because of stress relief. It increased slightly to 73.4 A/m at 750 °C, decreased slightly to 800 °C, and had a minimum value of 56.7 A/m. After 850 °C, it gradually increased up to 200.3 A/m. The reason for the decrease up to 800 °C and the increase after 800 °C is explained in
Figure 3 and
Figure 4. The electrical steels after the heat treatment had a full annealing process; that is, they underwent recovery from stress, recrystallization, and grain growth, and then the coercivity dropped. It is well known that the correlation between grain size and coercivity varies according to the grain size [
14,
15]. The bigger the grain size, the smaller the coercivity obtained in a micrometer. From 850 °C, a V-rich phase was created around the grain boundary, as shown in
Table 2. It is assumed that the V-rich phase worked like a pinning site, leading to an increase in the coercivity at 850 °C, as shown in
Figure 8a [
10,
13,
19,
20].
Figure 8b is an enlargement of the B-H loop to show the coercivity tendency. From 600 °C to 700 °C, it expanded in scope; from 700 °C to 800 °C it narrowed in scope and had a similar range; and from 850 °C to 950 °C, it expanded again. The hysteresis loss that can be seen in
Figure 8a also dropped rapidly from 600 °C to 750 °C, which is similar to the coercivity tendency because of the stress caused by the recovery from cold rolling in the microstructure. At 750 °C, it had a minimum value of 0.41 W/kg. Up to 800 °C, the hysteresis loss increased slightly; up to 850 °C, it increased sharply, and then dropped. A lower hysteresis loss means less energy loss. It is better to have a lower hysteresis loss value in terms of efficiency.
Annealing the steel at 800 °C resulted in a reasonable saturation magnetization of 2.28 T, the highest magnetic flux density at 5000 A/m of 2.17 T, the lowest coercivity of 56.7 A/m, and a reasonable hysteresis loss value of 0.47 W/kg.
Figure 6 shows the hysteresis loop of the electrical steel annealed at 800 °C. It had a typical soft magnetic square loop; as a result, the optimal heat treatment temperature is 800 °C.


