Article

Mechanical Properties and Vibrational Behavior of 3D-Printed Carbon Fiber-Reinforced Polyphenylene Sulfide and Polyamide-6 Composites with Different Infill Types

by
Vasileios Papageorgiou
1,
Konstantinos Tsongas
2,*,
Michel Theodor Mansour
1,
Dimitrios Tzetzis
3 and
Gabriel Mansour
1
1
Department of Mechanical Engineering, Aristotle University of Thessaloniki, 54124 Thessaloniki, Greece
2
Advanced Materials and Manufacturing Technologies Laboratory, Department of Industrial Engineering and Management, School of Engineering, International Hellenic University, 57001 Thessaloniki, Greece
3
Digital Manufacturing and Materials Characterization Laboratory, School of Science and Technology, International Hellenic University, 57001 Thermi, Greece
*
Author to whom correspondence should be addressed.
J. Compos. Sci. 2025, 9(2), 59; https://doi.org/10.3390/jcs9020059
Submission received: 20 December 2024 / Revised: 21 January 2025 / Accepted: 25 January 2025 / Published: 28 January 2025
(This article belongs to the Special Issue Feature Papers in Journal of Composites Science in 2024)

Abstract

:
The aim of the present study is to investigate the performance of two carbon fiber-reinforced composite polymers used to manufacture end-use parts via the fused filament fabrication (FFF) method. The materials under investigation were carbon fiber-reinforced Polyamide-6 (PA6-CF15) and carbon fiber-reinforced polyphenylene sulfide (PPS-CF15). To evaluate their mechanical properties and vibrational behavior, specimens were fabricated with four distinct infill patterns: grid, gyroid, triangle and hexagon. In particular, the vibrational behavior of the 3D-printed composites was determined by conducting cyclic compression testing, as well as modal tests. Additionally, the mechanical behavior of the reinforced polymers was determined by conducting both uniaxial tensile and compression tests, as well as three-point bending tests. The results of the mechanical experiments revealed that the grid pattern exhibited the best overall performance, while the gyroid pattern exhibited the greatest strength-to-weight ratio, making it the most durable infill for use with composite filaments. In vibration experiments, PA6-CF15 structures exhibited higher damping ratios than PPS-CF15, indicating superior damping capacity. Among the infill patterns, the hexagon pattern provided the greatest vibration isolation performance.

1. Introduction

During the last decade, additive manufacturing (AM) has revolutionized the way new products are fabricated. This groundbreaking technology enables industries to produce complex components and structures with unparalleled customization as well as reductions in manufacturing costs, time, and material waste [1]. The global market size of AM is estimated to be USD 17.5 billion in 2024 and is expected to reach USD 37.4 billion by 2029, growing at a compound annual growth rate (CAGR) of 16.4% during this period [2]. The most widely used 3D-printing technology is fused filament fabrication (FFF), where thermoplastic polymers are used for the components’ fabrication [3]. FFF is an extrusion procedure where the object is developed by depositing melted material layer upon layer on the build-plate of the 3D printer [4]. Most of the polymers used in FFF additive manufacturing are available at low cost with ordinary properties, including PLA (polylactic acid), PETG (polyethylene terephthalate glycol-modified), ABS (acrylonitrile butadiene styrene), polypropylene (PP), polyethylene (PE), ASA (acrylonitrile styrene acrylate), and nylon (polyamide-6 and polyamide-12) [5]. Lately, new categories of thermoplastics have been introduced, such as PEEK and PMMA, with higher printing temperatures and enhanced mechanical properties than ordinary thermoplastics [6]. For example, polymers such as PLA, ABS, and nylon can achieve tensile strength between 15 and 70 MPa, while PMMA and PEEK are between 70 and 120 MPa [7,8,9].
As an effort to further enhance the mechanical behavior of thermoplastic polymers, advanced additives such as glass fibers, carbon fibers, and carbon fiber nanotubes (CNTs) are included in the polymer matrix [10]. Such additives were mixed with the polymer matrix in precise concentration to achieve the best performance of the filament. Fuda Ning et al. mixed ABS with carbon fibers at a percentage from 0% to 15% and examined their mechanical behavior by conducting various tests [11]. The results revealed that the implementation of carbon fiber in the polymer matrix increased the filaments tensile test up to 22%, the bending strength up to 11.8%, and the Young’s modulus up to 31.6%. Also, the peak of the average tensile strength was at 5% of fiber weight content.
Dul et al. [12] fabricated filaments suitable for the FFF technique by extruding polyamide and carbon fiber-reinforced PA composite (PA/CF). The 3D-printed specimens were studied under a series of mechanical tests to determine the material’s mechanical properties, to compare them with the injection-molded ones. Results showed that the strength as well as the elastic modulus of 3D-printed specimen were marginally lower compared to those produced through compression molding. Compared to neat PA, the composite exhibited a 34% increase in tensile strength and a remarkable 147% increase in tensile modulus. Flexural strength and stiffness also increased by 29% and 140%, respectively. Additionally, Almeshari et al. [13] developed short carbon fiber (SCF) reinforced polypropylene (PP) composite filament by mixing PP granules and micro-size SCFs in percentages between 4–22 wt.%. 3D-printed specimens were fabricated and subjected to tensile and impact tests to determine the filaments strength and hardness. Results showed an increase of 150% in tensile strength of the composite in comparison to neat PP. The hardness and the impact energy of the composite were also increased compared to the neat PP.
Shulga et al. [14] utilized glass fiber-reinforced polypropylene filament to determine the effect of fiber orientation on mechanical tensile behavior of the 3D-printed samples. As an effort to investigate the impact of the printed layer thickness and raster angle on final fiber orientations, X-ray micro-computed tomography was used. The study concludes that the greatest mechanical behavior was achieved with a 90° raster angle, exhibiting ultimate tensile strength of 57.4 MPa and elasticity modulus of 5.5 GPa, while the samples with a crisscross 45° and 135° raster angle exhibited 30.4 MPa and 2.5 GPa, with the thinnest printed layer thickness of 0.1 mm. Also, Kabir et al. [15] fabricated 3D-printed specimens with continuous fiberglass-reinforced composites orientated in different directions with maximum fiber content. Results showed that the tensile strength of 3D-printed composite specimens were lower than expected because of the poor structural integrity caused by inadequate matrix infusion between raster angles and the absence of through-thickness reinforcement. The greatest tensile properties were obtained at 0°/0° raster angle, followed by 0°/90°.
Abderrafai et al. [16], fabricated short carbon fiber-reinforced polyamide-12 composite filament to investigate the influence of carbon fibers type and concentration, infill structure, and environmental temperatures on the specimens’ mechanical behavior. The material’s strength was increased as the carbon fiber weight percentage is increased. The maximum strength reached up to 90 MPa and a tensile modulus up to 8.8 GPa at a 35 wt.% concentration when chopped carbon fibers were used. It is noteworthy that the control of the environmental temperature during printing holds significant importance to the specimens’ mechanical performance. Microscopic observation showed that the samples fabricated in higher temperature are less prone to delamination and have less porosity during mechanical loading, in comparison to the specimen fabricated at room temperature.
Calignano et al. [17] investigated the mechanical properties of 3D-printed carbon fiber-reinforced nylon. The study also investigates the effect of the infill percentage as well as the printing orientation to the material’s mechanical performance. The specimen tested had honeycomb infill pattern and three different infill percentages of 15%, 80%, and 100%. Moreover, two different printing planes were tested, XY and XZ. Results conclude that the samples printed in the printer’s XY plane demonstrated higher hardness than the samples printed in the XZ plane. On the other hand, the XZ plane specimens were stiffer than those fabricated in the XY orientation. It is also worth mentioning that the association between infill ratio and mechanical characteristics is non-linear; for infill ratio from 80% to 100%, the maximum tensile strength is quite comparable.
Medel et al. [18] studied the damping and stiffness behavior of 3D-printed PLA specimens. Forty-eight different parameter combinations were considered in the specimens’ fabrication process, including build orientation, raster angle, print speed, nozzle temperature, and layer height, as an effort to examine the impact of printing process parameters on dynamical behavior. Experimental results showed that the specimen printed in higher temperature at a lower speed using a 0° raster angle exhibited the lowest damping and, therefore, superior interfilament bonding. On the other hand, high damping ration and, therefore, poor interfilament bonding are related to low temperature printing temperature and high printing speed. In another study, M. Somireddy and A. Czekanski [19] studied the anisotropic behavior of 3D-printed specimen fabricated with different printing parameters, focusing on anisotropy phenomena due to change in build orientation of the specimen. The specimens were fabricated in three different orientations: flat, upright, and edge. The results from the three-point bending testing revealed that thin-layered specimens exhibit better mechanical properties. Furthermore, both the flexural and mechanical performance of the upright-printed specimen were found to be poorer than the ones printed in the other two orientations.
Due to the layer-by-layer procedure of 3D-printing technology, the final parts produced are heterogeneous and exhibit anisotropic behavior [20]. The latter characteristics make it difficult to calculate the mechanical behavior of a component fabricated using 3D printing. Consequently, when compared to numerical methods, experimental methods are more accurate in predicting the behavior of a material used for 3D-printing items. The objective of the present research is to investigate the mechanical properties and the vibration behavior of fused filament fabrication (FFF) 3D-printed specimens of two carbon fiber-reinforced composites with different infill types, as an effort to produce more reliable and stronger 3D-printed end-use parts. The composites utilized in the present study were carbon fiber-reinforced polyphenylene sulfide and polyamide-6 at 15 wt.%. Four different infill types were examined in this study, specifically grid, gyroid, triangular, and hexagon patterns. The mechanical behavior of the various infill types was determined by conducting three-point bending tests as well as uniaxial tensile tests. On top of the latter, the vibration performance of the fabricated specimens was determined by conducting cyclic compression testing, as well as modal tests. By completing the latter experiments, the necessary information was acquired for the materials’ behavior in mechanical stress and vibrational excitations, providing an additional knowledge resource to fabricate more reliable end-use parts made with nanocomposites.

2. Materials and Methods

2.1. Materials and Fabrication Parameters

The materials investigated in the present study are polyamide-6 reinforced with 15% carbon fiber (Spectrum PA6-CF15, Spectrum Filaments, Pęcice Małe, Poland), as well as polyphenylene sulfide reinforced with carbon fibers (Treed PPS-CF15, TreeD Filaments, Seregno, Italy) in a weight percentage of 15%. The properties of fiber and thermoplastic filaments can be found in Mansour et al. [21]. The fabrication of 3D-printed specimens was achieved through a Raise Pro 2 3D printer (Raise 3D Technologies, Inc., Shanghai, China) via the fused filament fabrication (FFF) method.
The Ideamaker software (Raise 3D Technologies, Inc., Irvine, CA, USA, v4.4.1 Alpha) was used to define the printing parameters of the fabricated specimens. Considering that composite filaments are extremely abrasive, a 0.80 mm hardened steel nozzle was used for their fabrication. The printing parameters used for the composite specimen fabrication were chosen according to the filament manufacturer’s recommendations [22,23]. The printing parameters of the filaments are presented in Table 1. Both composite filaments were dried at 90 °C for 6 h before printing to reassure the best overall mechanical properties of the filaments. Three specimens were fabricated per material and infill pattern to ensure satisfactory results from the experimental procedure.
In the present study, four different infill patterns were tested: grid, gyroid, triangles, and hexagon. Figure 1 illustrates the four infill patterns, as fabricated with the FFF method, magnified twenty times using an optical microscope (Dino-Lite, model AM7013MZT, AnMo Electronics Corporation, Taipei, Taiwan).
It is worth mentioning that every infill pattern has different material density, therefore the final weight of the specimen varies depending on the infill pattern used during the fabrication process. Each pattern’s density was calculated by dividing the weight of the fabricated specimen by their own volume. The material density per infill pattern is presented in Table 2. The grid pattern was the densest, while the hexagon was found to be the lightest, in both materials. As the density decreased, the pattern became more porous, leading to a lighter structure with distinct mechanical properties.

2.2. Specimen Fabrication

The specimens for the uniaxial tension tests were fabricated based on the ISO 527-2 standard [24], the specimens for the three-point bending test according to the ISO 178 [25], and the specimens used for the uniaxial compression testing were fabricated complying with the ASTM D395B [26], as shown in Figure 2a. All specimens were printed facing the XY plane of the printer’s axes. The specimens used for the cyclic compression tests were cylindrical, with a diameter and thickness of 29 mm and 12.5 mm, respectively, according to the ASTM D395B. Additionally, rectangular specimens were manufactured with dimensions of 160 × 20 × 4 mm for the vibration tests (Figure 2b). Three specimens were fabricated per material and infill pattern to ensure satisfactory results from the experimental procedure.

2.3. Mechanical Testing

The fabricated specimens were subjected to three different mechanical tests, uniaxial tension, uniaxial compression, and three-point bending experiments. All measurements were performed using a universal mechanical testing machine (Testometric M500-50 AT, Rochdale, United Kingdom) equipped with a 50 kN load cell at an ambient temperature. The uniaxial tensile and compression tests as well as the three-point bending tests were conducted at a 5 mm/min crosshead speed and a 5 N tensile pre-load.

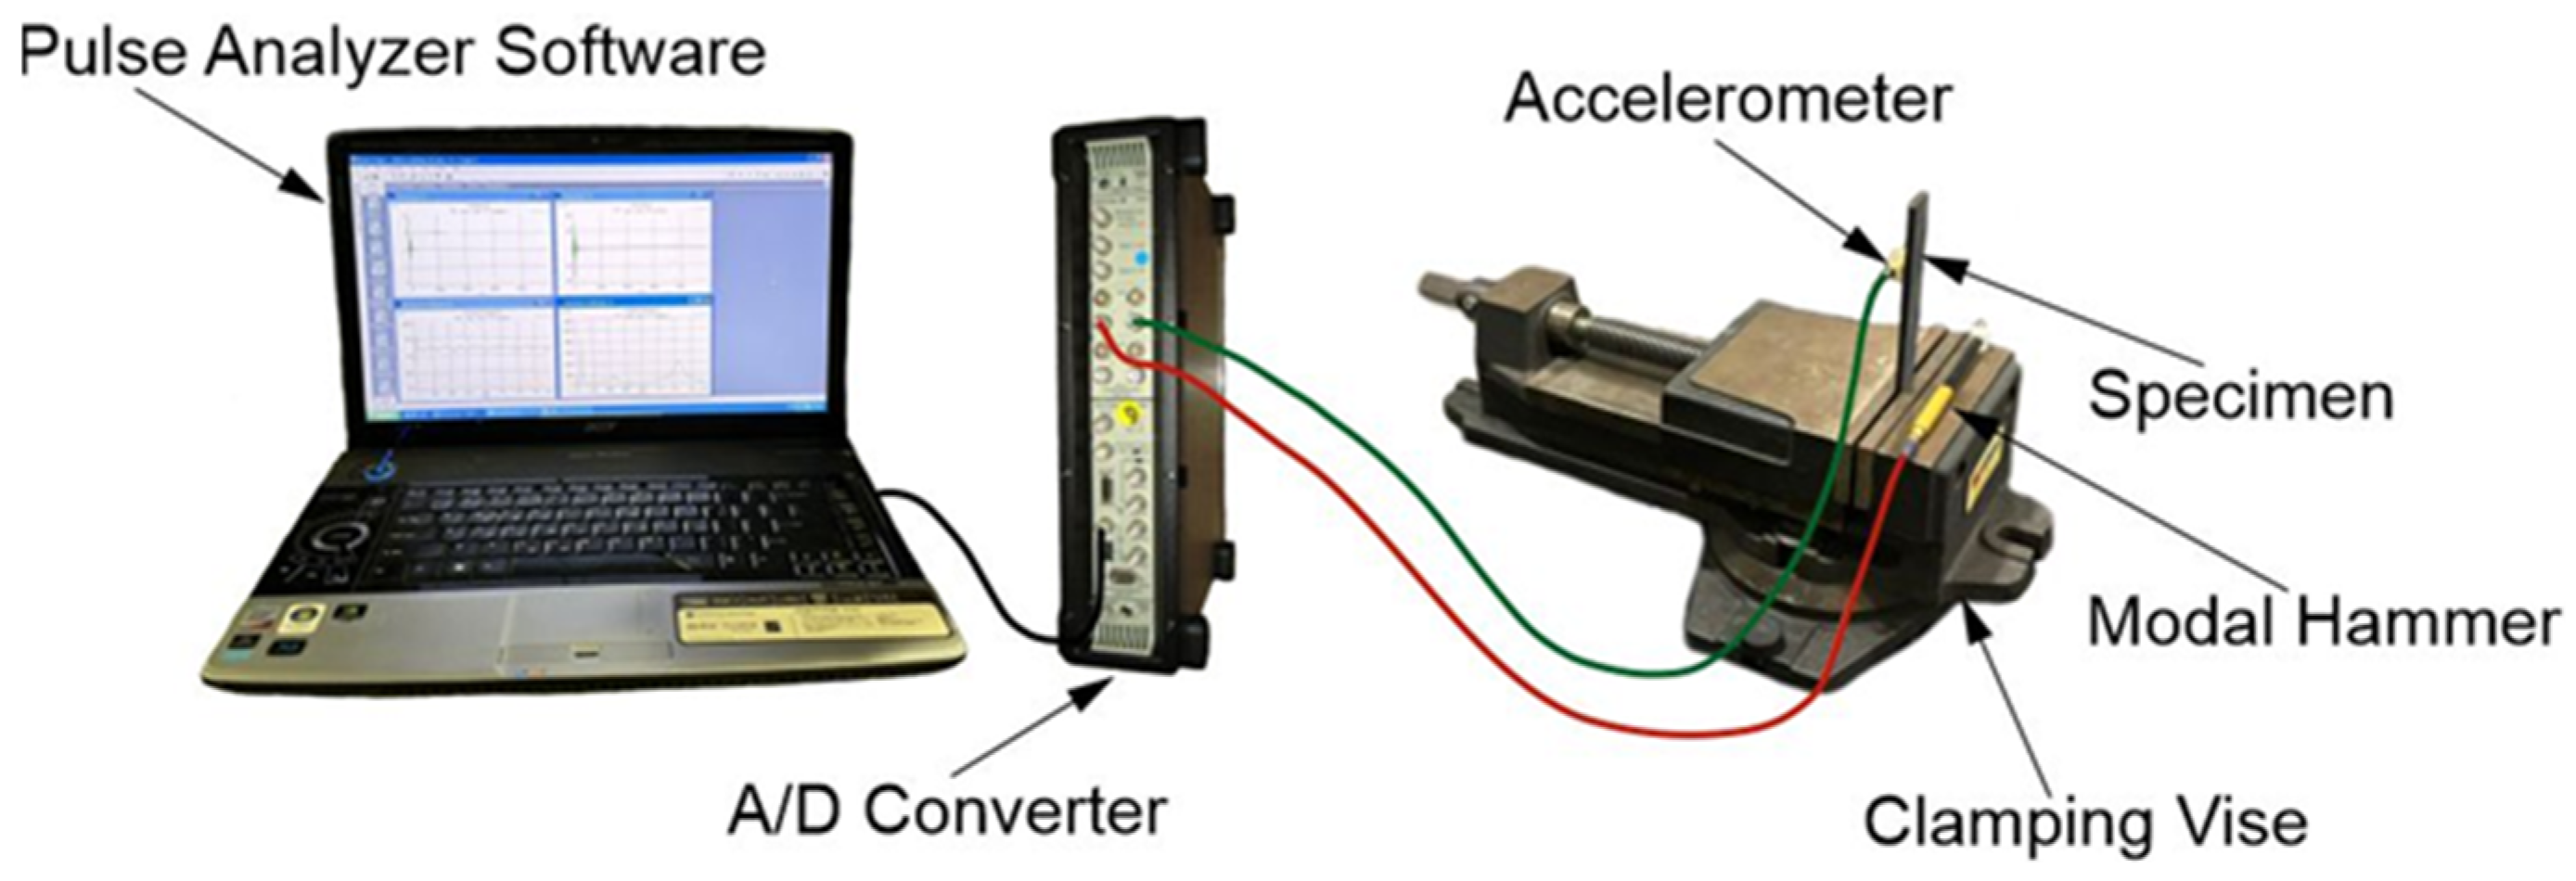
2.4. Vibration Testing

To study the vibration behavior of the 3D-printed composites, two separate tests were conducted: cyclic compression tests and modal tests. Cyclic compression tests were conducted with a constant strain rate for the loading and unloading phase. The cyclic compressive experiments were conducted with a frequency of 0.01 Hz and a peak load up to 6 kN for the PPS-CF15 specimen and up to 8 kN for the PA6-CF15 ones. The speed of the load cell was set at 5 mm/min for both the loading and unloading phase. During this quasi-static experiment, the stress–strain performance was acquired during the loading–unloading stage, and every single sample displayed hysteretic behavior. The energy loss in each loading cycle was measured by the area of the corresponding hysteresis loops.
Modal tests were conducted using an impact hammer equipped with a high-quality piezoelectric force transducer (Endevco Model 2302-10, San Juan Capistrano, CA, USA) to apply the input load (pulse) to the specimen. The resulting output was measured by an acceleration transducer with a sensitivity of 100 mV/g (Brüel & Kjaer 4507 B, Nærum, Denmark) attached to the free end of the specimen, with the sensing cables kept loose to minimize their impact on the vibration test. Both force and acceleration signals were captured and amplified using a pulse analyzer (Brüel & Kjaer, Nærum, Denmark), and the data were recorded on a computer. The frequency range for the acceleration signals extended up to 3200 Hz, with a sampling interval of 0.12207 μs and a sampling rate of 8192 Hz. This provided an FFT resolution of 1 Hz for a block size of 8192 samples. The resolution of the analytical transfer function matched that of the experimental data for the identification procedure. The modal hammer was calibrated by adjusting the trigger force level, and each specimen was tested 10 times, with linear averaging applied to the results.

3. Results

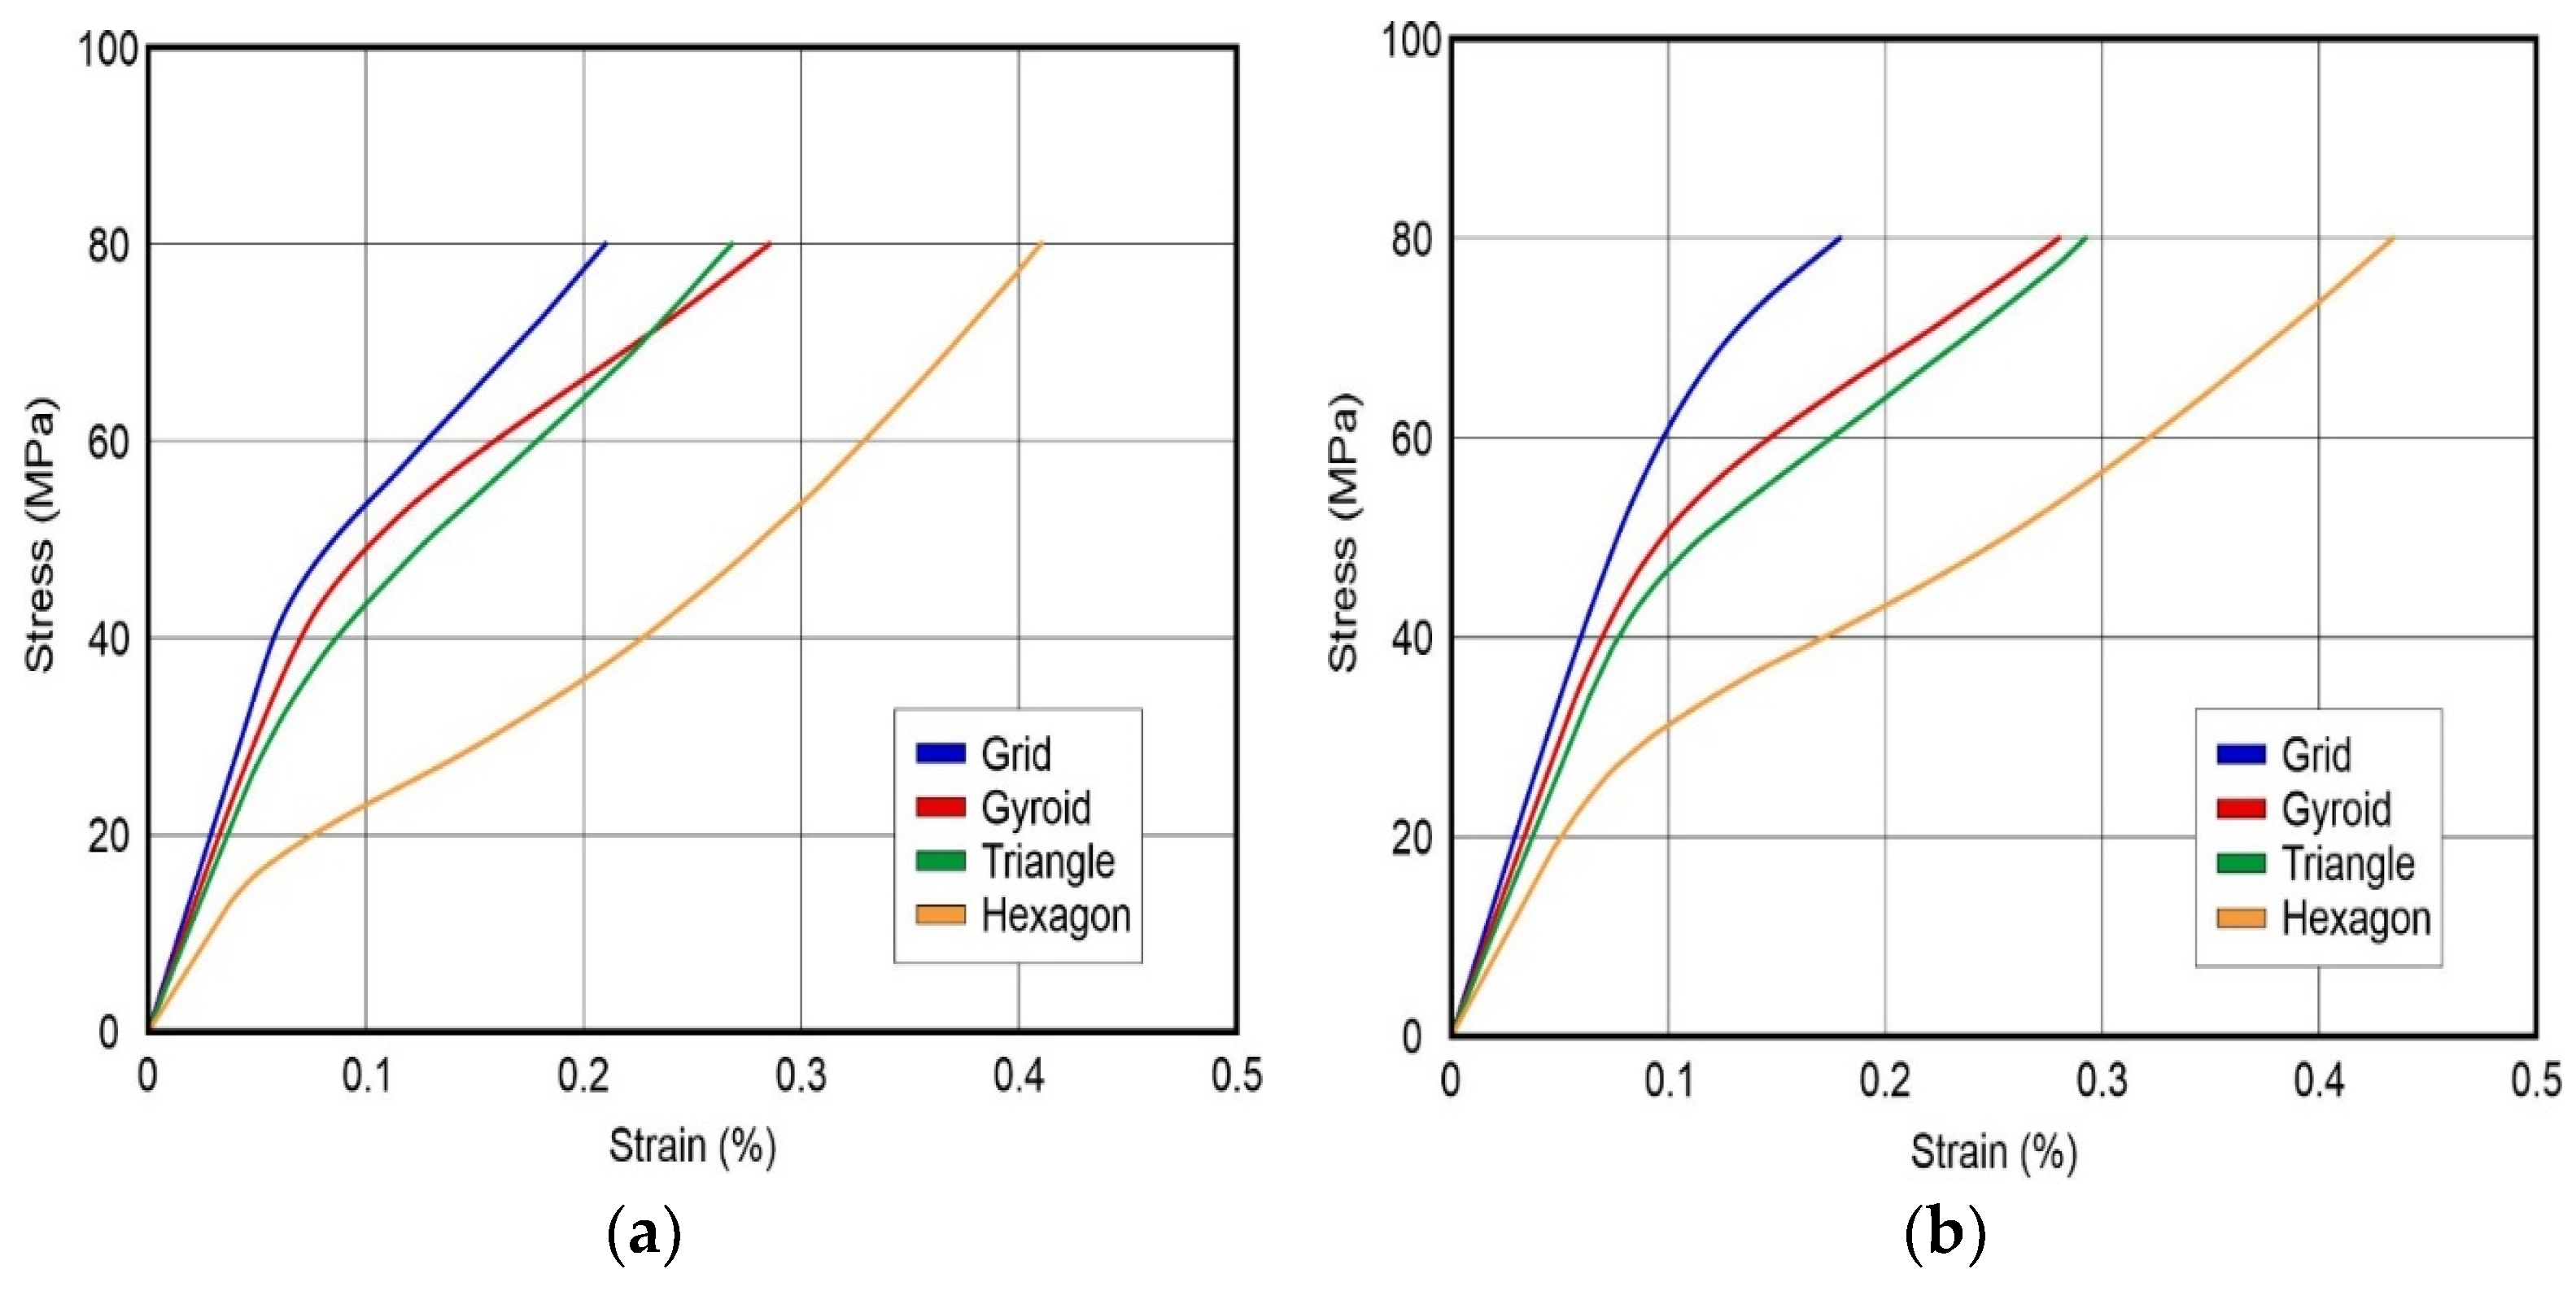
3.1. Uniaxial Tensile Strength Results

The infills’ tensile strength is presented in Figure 3a, for the PA6 composite and in Figure 3b, for the PPS one. The infill patterns’ strength hierarchy tested in both composites was determined to be identical, from higher to lower. In general, PA6-CF15 specimen achieved slightly higher strength, compared to the PPS-CF15, in every infill. Furthermore, the PPS composite demonstrated higher elastic modulus than the PA6 composite due to different hardness among the composite’s polymer matrices. The ultimate strength and strain, along with the tensile elastic modulus per infill pattern, for each material, is presented in Table 3. The grid pattern was found to be the stronger infill type, with yield strength 21.5 MPa and 18.6 MPa for the PA6-CF15 and the PPS-CF15, respectively. The gyroid pattern comes second in strength, close to the grid, with 18.7 MPa and 17.8 MPa for the two composites tested. The triangular pattern ranks third in strength with 14.4 MPa for the carbon fiber-reinforced PA6 and 13.7 MPa for the PPS composite. Finally, the hexagon pattern presented the lowest strength in both materials at 9 MPa and 8.2 MPa. It is also worth noting that the hexagon pattern showed the smallest deformation before fracture at 0.005% for the PA6 composite and at 0.003% for the PPS one. The latter, in conjunction with the strength results, leads to the conclusion that the grid pattern is the strongest under tensile uniaxial loads. On the other hand, the triangular and the hexagon pattern are deemed inappropriate as they had the weakest performance throughout the tensile experiments.

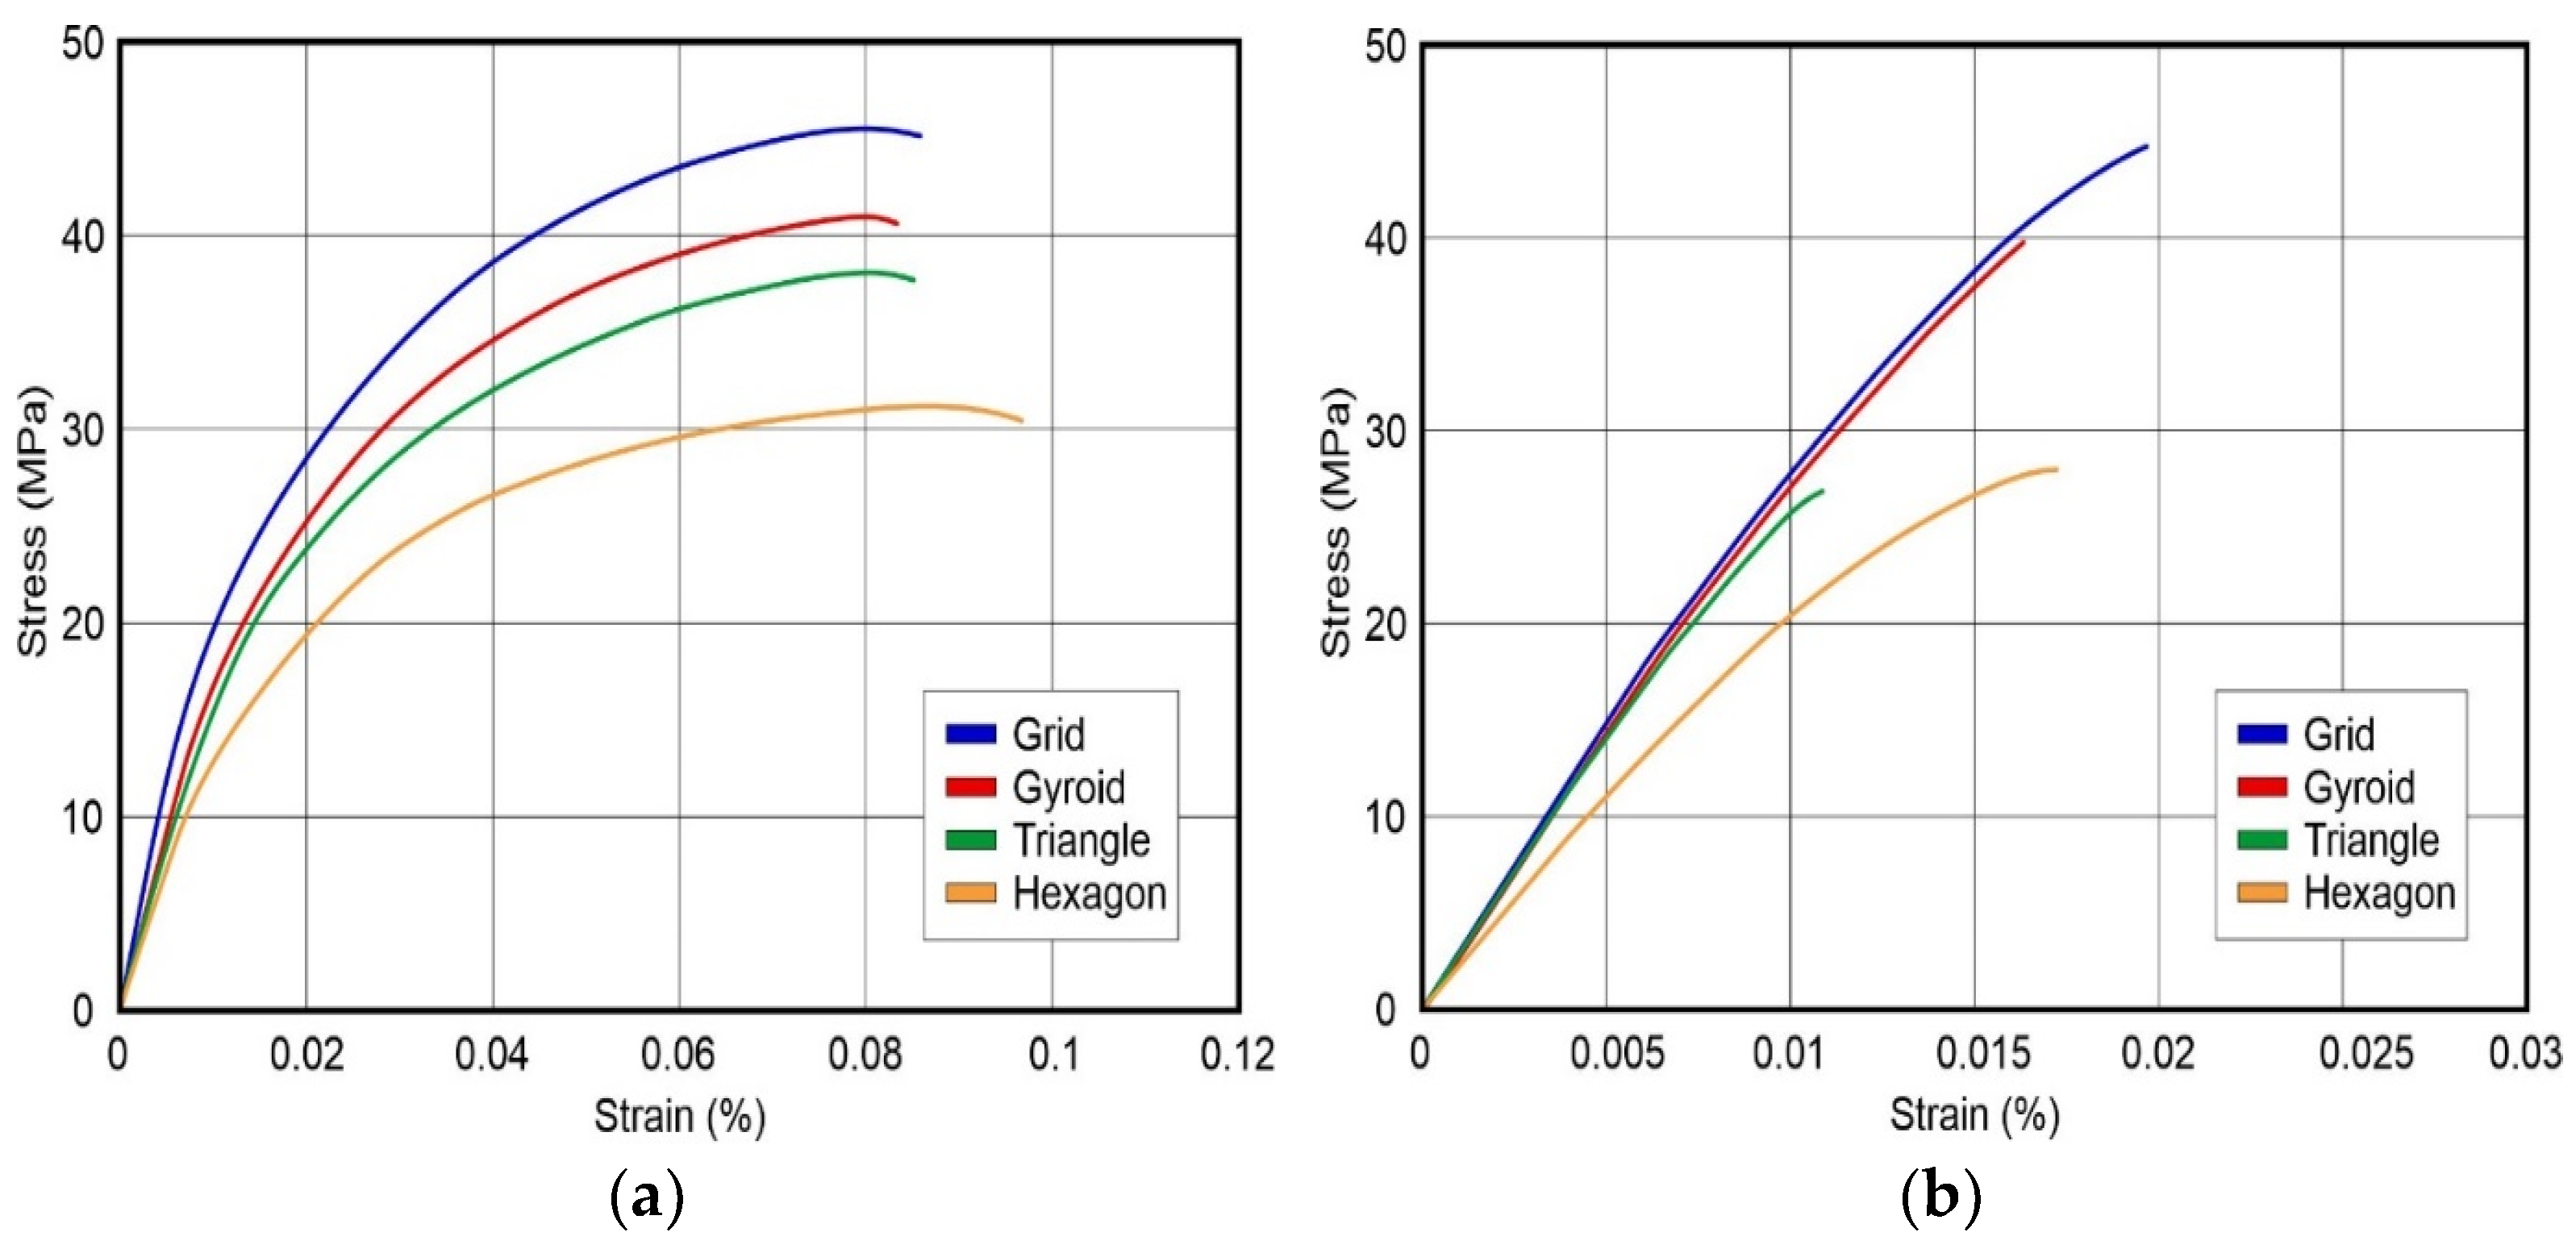
3.2. Uniaxial Compressive Strength Results

Figure 4 presents the infills’ compressive strength for the PA6 and PPS composites. The infills’ strength hierarchy resembles the uniaxial tensile results. The PPS-CF15 specimens achieved higher compressive strength along with higher compressive elastic modulus, compared to PA6-CF15, in every infill type. The ultimate strength and strain, in addition to the compressive elastic modulus per infill pattern for each material, is presented in Table 4. The strongest infill pattern was found to be the grid pattern, with yield strength of 40.5 MPa and 53.2 MPa for PA6-CF15 and PPS-CF15, respectively. The gyroid pattern comes second in strength, close to the grid, with 37.7 MPa and 42.4 MPa for the two composites tested. The triangular pattern ranks third in strength, with 30.8 MPa for the carbon fiber-reinforced PA6 and 40.1 MPa for the PPS composite. Finally, the hexagon pattern presented the lowest strength in both materials at 16.4 MPa and 21.6 MPa. Summarizing the uniaxial tests, tension and compression, the grid pattern achieved the highest yield strength. Considering that the gyroid pattern is less dense than the grid, it can be stated that the gyroid pattern is just as strong as the grid. Also, in both materials and tests, the gyroid’s elastic modulus is slightly lower than the grid’s.

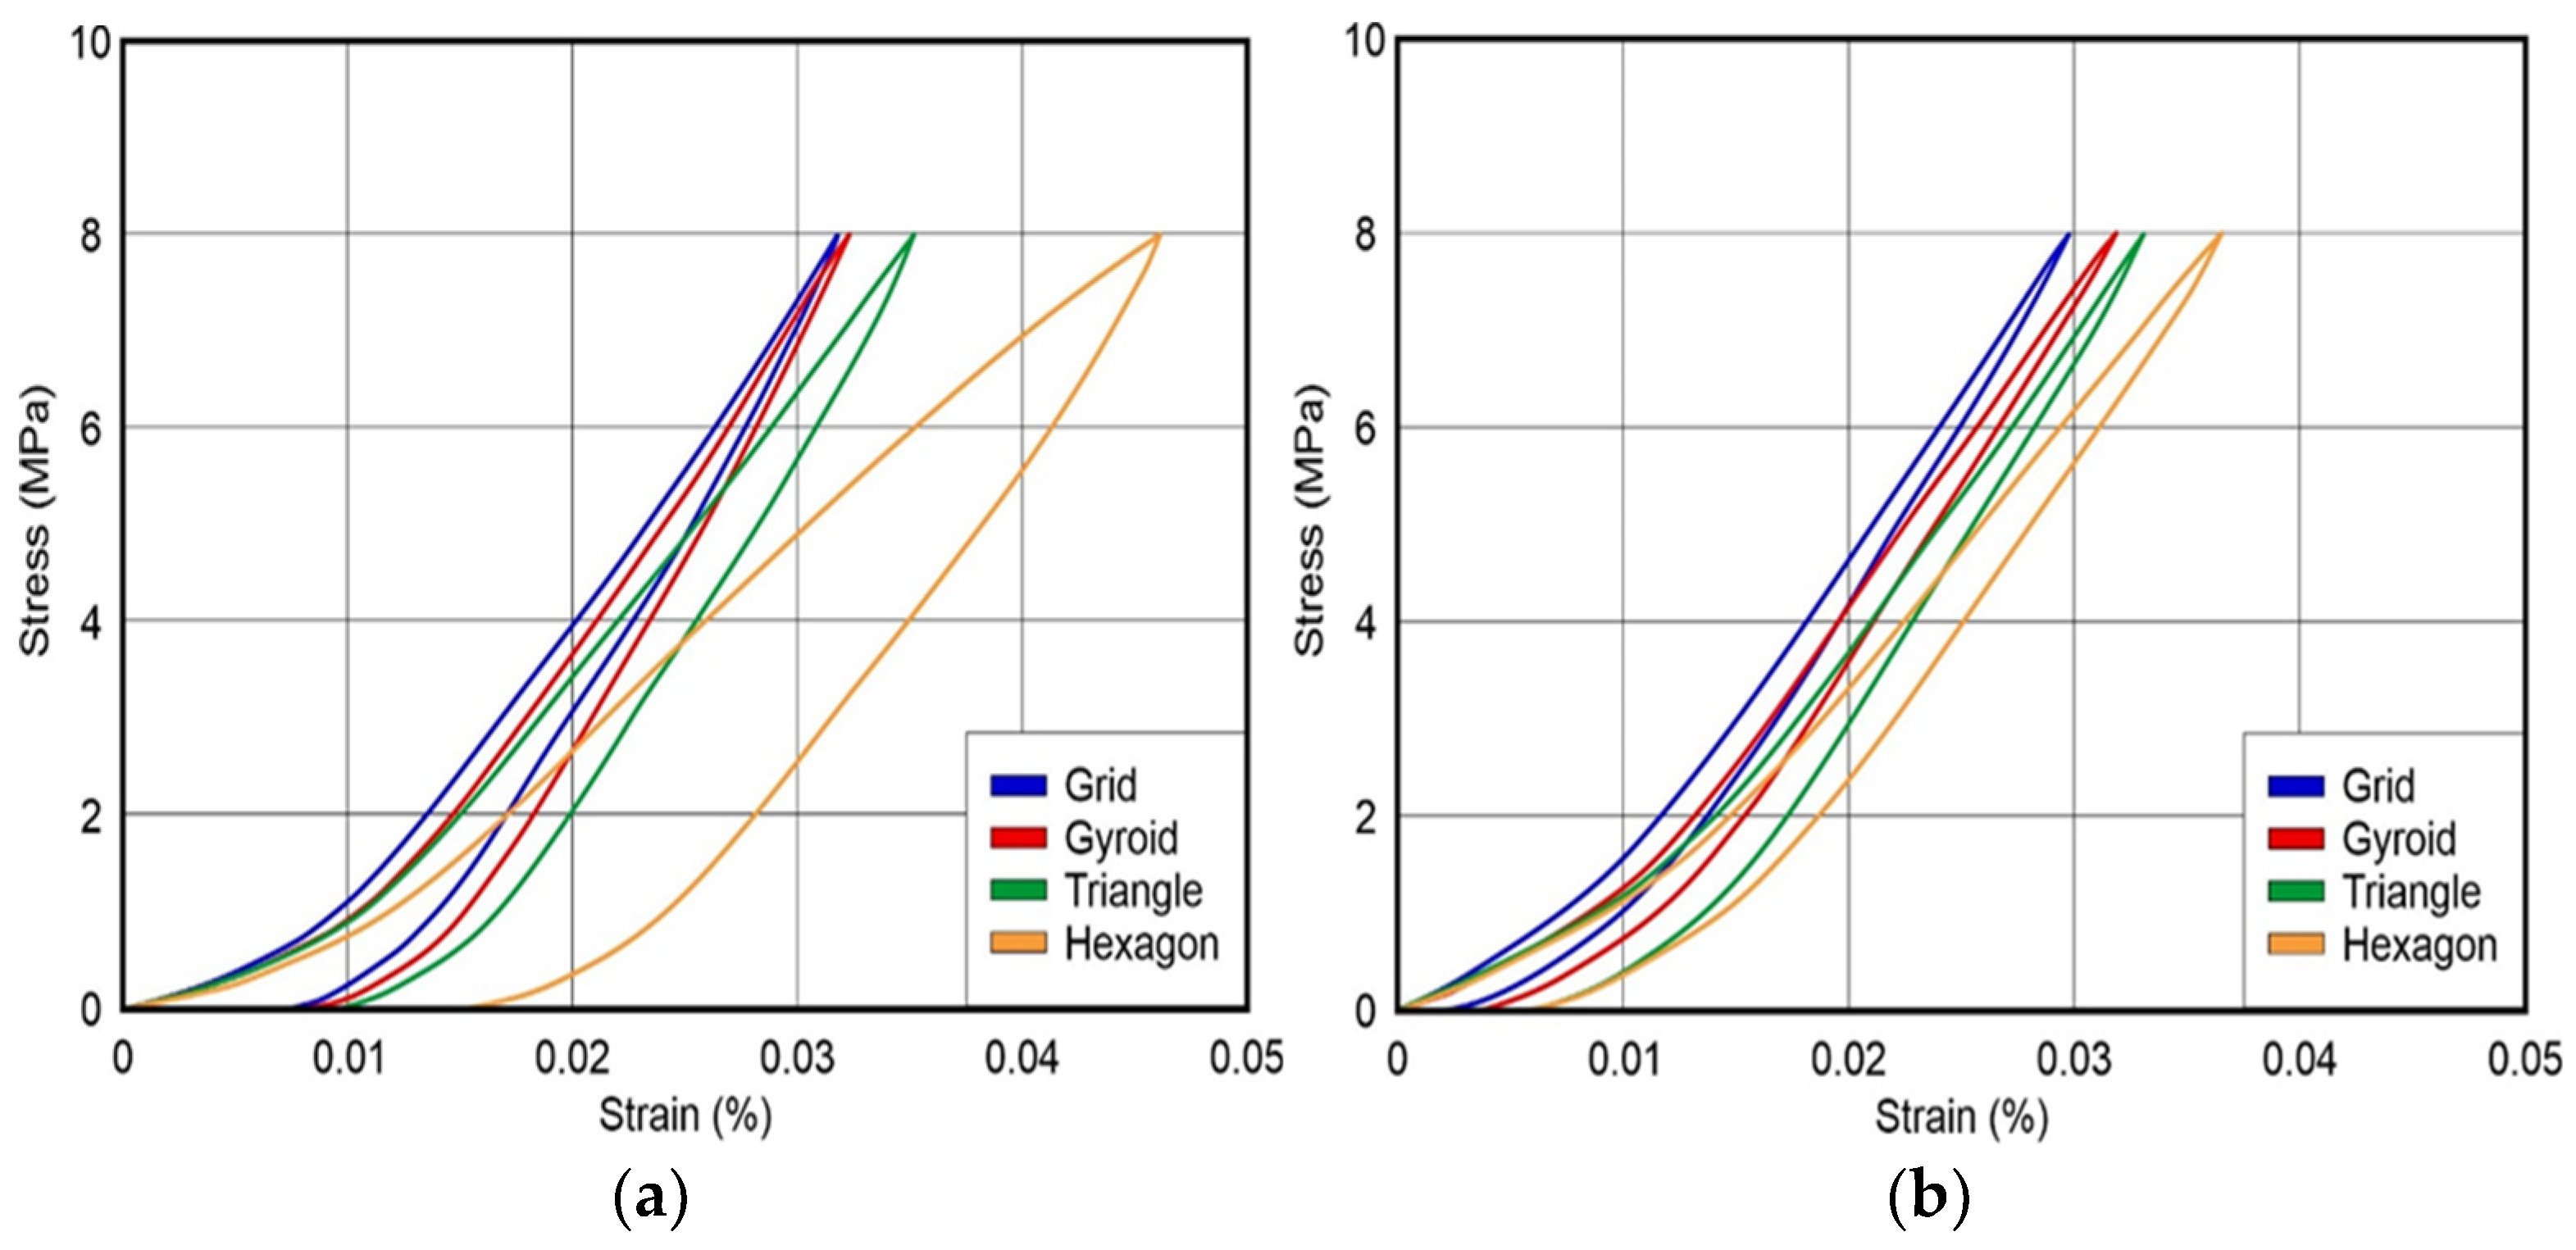
3.3. Three-Point Bending Results

The infills’ flexural strength per material is presented in Figure 5. Upon completion of the three-point bending tests for both composites, results revealed that the grid pattern achieved the highest flexural strength among the patterns tested. The flexural modulus, flexural strength, and strain per infill pattern for each material is presented in Table 5. The PA6-CF15 grid specimen flexural yield strength was measured at 2.12 MPa, while for the PPS-CF15 specimen it was 1.78 MPa. The gyroid pattern follows slightly below the grid pattern, measuring 1.63 MPa and 1.55 MPa, respectively, for the examined composites. Third was the triangular pattern, which achieved 1.35 MPa with PA6-CF15 and 1.26 MPa with PPS-CF15. The infill pattern with the lowest performance in the bending tests was the hexagon pattern, measuring 0.77 MPa and 0.68 MPa, respectively. PPS-CF15 demonstrated approximately 40–50% higher flexural modulus compared to the PA6 composite. As in the case of uniaxial strength results, the flexural strain has been found to be proportional to the flexural strength achieved by each infill. Concluding, the grid pattern showed the best flexural performance, with the gyroid pattern following slightly below. The hexagon and triangular patterns’ performance was significantly poorer, and they are consequently judged as inappropriate for use under flexural loads.

3.4. Hysteretic Behavior of Composite Specimen

The area inside the hysteresis loop is related to energy loss during the experiment. For polymer damping materials, a larger hysteresis loop depicts higher damping, which means it can effectively reduce vibration levels [27]. The damping parameters can be extracted by the hysteresis loop’s enclosed area, as shown in Figure 6. Figure 7a demonstrates the typical hysteresis loop of a PA6-CF15 specimen under compressive vibration at 0.01 Hz with a maximum load of 25 kN. Also, Figure 7b demonstrates the typical hysteresis loop of a PPS-CF15 specimen under compressive vibration at 0.01 Hz with a maximum load of 15 kN. According to the free vibration model, the vibration isolation capacity of materials can be determined from the hysteresis damping characteristics.
The specific damping capacity (SDC) is given by:
S D C = Δ W W × 100 % = σ d ε / ω t = 0 π / 2 σ d ε × 100 %
where σ defines the stress, ∆W represents the energy dissipated in any one cycle, and W corresponds to the maximum energy related to that cycle [28]. The specific damping capacity can be associated with the loss factor [29,30,31,32] by the following equation:
n = Δ W π W
Considering Equations (1) and (2), the energy loss over a cycle (∆W), the maximum energy of that cycle (W) and the loss factor (n) were calculated to measure the damping of the carbon fiber-reinforced polyamide-6 and polyphenylene sulfide composites during loading–unloading experiments, as shown in Table 6. Furthermore, ∆W denotes that the antivibration property of grid infill is superior to the other infill types, for both materials.
According to the PA6-CF15 results, the grid pattern showed the lowest loss factor, at 6.49%. On the other hand, the hexagon pattern showed the highest loss factor, almost double compared to the grid, at a percentage of 13.04%. The gyroid pattern ranked second with 6.72% loss factor. Third was the triangle pattern with 7.96%. PPS-CF15 demonstrated almost similar results as the carbon fiber-reinforced PA6. The grid pattern had the lowest loss factor at 2.96%, while the hexagon pattern demonstrated the highest loss factor at 5.02%. By comparing the two materials, it is evident that PPS-CF15 achieved lower loss factors in every infill pattern compared to PA6-CF15. The latter can be attributed to the fact that the PPS polymer matrix is harder than the PA6 one. At the same infill, the PA6 composite loss factor is twice as high as the corresponding PPS infill. Concluding, among the tested composite materials, PPS-CF15 exhibited a greater performance. The lowest possible loss factor can be achieved by combining the PPS composite with the grid pattern.

3.5. Modal Behavior of PA6 and PPS Composite Specimens

The experimental setup for the forced vibration tests is illustrated in Figure 8. In this configuration, the specimen is clamped onto a rigid support, functioning as a cantilever beam, and subjected to vibrations induced by an impact hammer equipped with a high-quality piezoelectric force transducer. To determine the modal properties of the specimen from the transient vibration, Fourier transforms of both the excitation and response signals were computed. The ratio of these response and excitation functions was then used to derive an expression from the corresponding transfer function.
The response can be measured in terms of displacement, velocity, or acceleration, leading to different terms for the ratios of response to force. This study specifically focuses on displacement responses, where any reference to the transfer function (TF) pertains to the system’s receptance, also known as dynamic compliance. The displacement is obtained by performing a double integration of the experimental data collected from the accelerometer sensor. To eliminate direct current (DC) components and prevent integration errors, high-pass filters were applied. Consequently, the ratio of the resulting displacement to the applied force was calculated to derive the receptance transfer function.
The analytical functions successfully identified the resonance in all key flexural modes. These mathematically synthesized transfer functions encapsulate all the essential resonance details, and interpolation among the measured data is deemed satisfactory. Figure 9 and Figure 10 illustrate a comparison between the identified and measured complex transfer functions (TFs) of the specimens. Table 7 displays the identified resonant frequencies of specimens with varying inclusions and infill configurations along with the equivalent stiffness and the viscous damping of each configuration. It is evident that the frequencies of the first mode vary depending on the lattice structure of the infill. The results indicate a noticeable shift in resonant frequencies based on the material and infill pattern. The PA6-CF15 composites generally demonstrated higher resonant frequencies compared to the PPS-CF15 composites across all configurations. For example, the PA6-CF15 grid structure exhibits the highest frequency at 80 Hz, while the PPS-CF hexagon structure has the lowest at 56 Hz. This suggests that the PA6-CF15 material results in a stiffer structure, leading to higher natural frequencies, whereas the PPS-CF15 material is relatively more compliant, resulting in lower frequencies. Additionally, the damping capacity varies between the different structures, with the PA6-CF hexagon configuration showing the highest damping ratio at 5.87%, indicating superior energy dissipation and vibration reduction. In contrast, the PPS-CF15 grid has the lowest damping ratio at 2.16%, reflecting less effective energy dissipation. Generally, PA6-CF15 structures exhibit higher damping ratios than PPS-CF15 structures, implying better vibration damping performance. Information about the materials’ stiffness can also be determined from the transfer function. PPS-CF15 demonstrates higher stiffness than its counterpart PA6 composite. In terms of the infill patterns’ stiffness, the grid pattern showed the highest stiffness in both composites, followed by the gyroid pattern. The PPS-CF15 grid structure achieved the greatest stiffness performance at 436.1 N/m, while PA6-CF15 achieved the lowest at 227.1 N/m.

4. Discussion

The present study investigated the mechanical behavior of FFF 3D-printed specimens of PA6-CF15 and PPS-CF15 with various infill patterns, as well as their vibration behavior. The experiments conducted showed that infill patterns play a significant role in the structure’s performance. By altering the infill pattern, while keeping the same composite material, quantities such as strength, stiffness, and vibration damping performance are significantly affected. The experimental results demonstrated that the grid pattern showed increased strength during uniaxial and bending loads compared to the other patterns tested in both materials, as depicted in Figure 11. The gyroid pattern demonstrated the optimal strength in every mechanical test. Several studies have been conducted regarding the infill patterns’ mechanical properties, which conclude that the grid pattern exhibits the greatest strength, followed by the gyroid and the triangular patterns [33,34]. The grid pattern demonstrates the highest density among the tested patterns, which relates to higher concentration of carbon fibers, resulting in superior strength. At high infill ratios, the 3D-printed structure resembles a porous solid shape. Different infill patterns exhibit varying densities, resulting in proportionate porosity structures. The structure’s porosity increases with decreasing pattern density. In general, increasing the structure’s porosity reduces its mechanical strength. However, designs such as gyroid can attain a higher strength-to-weight ratio than the other patterns evaluated. Additionally, PA6-CF15 showed lower elastic modulus compared to the PPS-CF15 composite in every infill pattern and mechanical test. The latter characteristic can be attributed to the material’s polymer matrix. PA6 polymer has lower elastic modulus compared to PPS [35,36,37]. It is noteworthy that despite the influence of the infill pattern on the structure’s performance, the material’s polymer matrix properties are also affecting the final mechanical and vibration performance.
Upon completion of the vibration experiments, PA6-CF15 specimens demonstrated higher resonant frequencies compared to PPS-CF15 ones across all configurations, whereas PPS composite showed higher stiffness. Furthermore, PA6-CF15 structures exhibited higher damping ratios than PPS-CF15 structures, implying better vibration damping performance. The hexagon pattern, due to its lower density, demonstrated the highest vibration damping performance, while the grid pattern exhibited the lowest damping in both materials, as shown in Figure 12. By comparing the hysteretic with the viscous damping per material and infill, it is evident that the hierarchy of the results of the two damping values are quite similar. The viscous damping is lower than the hysteretic in every configuration, which assumes that the dissipated energy in each cycle is higher than the structure’s ability to damp an external excitation. Moreover, the calculated stiffness from the modal tests agrees with the modulus of elasticity from the mechanical experiments. The latter leads to the conclusion that the results are reliable and provide a sufficiently accurate assessment of the mechanical and vibration properties of the examined composite materials. Previous studies [4,26,27,28,29] have also demonstrated the validity of the proposed analytical–experimental modal testing method as a non-destructive approach for determining the modulus of fiber composites and nanocomposites.
The materials investigated in this study demonstrate tailored properties that make them suitable for diverse engineering applications. PA6-CF15, with its superior tensile properties, is more suitable for applications requiring high strength and durability under dynamic loading, such as structural components in automotive and aerospace industries. On the other hand, PPS-CF15, with higher stiffness, is more appropriate for applications that require rigidity, water resistance, and thermal stability, such as in high-temperature environments or precision components.

5. Conclusions

The determination of the mechanical and vibrational performance of a 3D-printed structure is a multidimensional problem with many variables that each influence on a different degree to the final behavior of the part’s geometry. Upon completion of the mechanical experiments, the grid pattern demonstrated the highest strength among the patterns tested, in every experimental procedure. The gyroid pattern came second in strength, exhibiting the best strength-to-weight ratio. Furthermore, PPS-CF15 specimens demonstrated a higher elastic modulus than those of PA6-CF15. The vibration behavior of every pattern and material was determined at a satisfactory level through the modal and cyclic compression experiments. PA6-CF15 specimens had greater resonant frequencies than PPS-CF15 specimens in all configurations, yet PPS composites offered higher stiffness. In addition, PA6-CF15 structures had greater damping ratios than PPS-CF15 structures, indicating improved vibration damping performance. The hexagon pattern showed superior damping performance in both cyclic and modal tests. However, in terms of strength and stiffness, the gyroid pattern demonstrates the greatest performance among the infills tested in the present study. The specific pattern allows for higher mechanical performance while keeping the weight of the structure relatively low. Concluding, in order to fabricate an end-use part with the AM technology, the infill pattern and material have to be chosen based on the required final mechanical and damping characteristics, as each material and infill pattern combination produces a geometry with different mechanical and damping properties.

Author Contributions

Conceptualization, V.P.; Software, K.T.; Validation, M.T.M.; Investigation, V.P., K.T., M.T.M. and D.T.; Data curation, V.P. and M.T.M.; Writing—original draft, V.P.; Supervision, K.T. and G.M. All authors have read and agreed to the published version of the manuscript.

Funding

This research received no external funding.

Data Availability Statement

The original contributions presented in this study is included in the article. Further inquiries can be directed to the corresponding authors.

Conflicts of Interest

The authors declare no conflicts of interest.

References

  1. Zhou, L.; Miller, J.; Vezza, J.; Mayster, M.; Raffay, M.; Justice, Q.; Al Tamimi, Z.; Hansotte, G.; Sunkara, L.D.; Bernat, J. Additive Manufacturing: A Comprehensive Review. Sensors 2024, 24, 2668. [Google Scholar] [CrossRef] [PubMed]
  2. Markets and Markets. 3D Printing Market Size, Share, Industry Report, Revenue Trends and Growth Drivers-Global Forecast to 2029. Available online: https://www.marketsandmarkets.com/Market-Reports/3d-printing-market-1276.html (accessed on 4 June 2024).
  3. Jemghili, R.; Taleb, A.A.; Mansouri, K. Additive Manufacturing Progress as a New Industrial Revolution. In Proceedings of the 2020 IEEE 2nd International Conference on Electronics, Control, Optimization and Computer Science (ICECOCS), Kenitra, Morocco, 2–3 December 2020; pp. 1–8. [Google Scholar]
  4. Mansour, M.; Tsongas, K.; Tzetzis, D. Measurement of the Mechanical and Dynamic Properties of 3D Printed Polylactic Acid Reinforced with Graphene. Polym.-Plast. Technol. Mater. 2019, 58, 1234–1244. [Google Scholar] [CrossRef]
  5. Caminero, M.; Chacón, J.; García-Moreno, I.; Rodríguez, G. Impact Damage Resistance of 3D Printed Continuous Fibre Reinforced Thermoplastic Composites Using Fused Deposition Modelling. Compos. Part B Eng. 2018, 148, 93–103. [Google Scholar] [CrossRef]
  6. Dizon, J.R.C.; Espera, A.H., Jr.; Chen, Q.; Advincula, R.C. Mechanical Characterization of 3D-Printed Polymers. Addit. Manuf. 2018, 20, 44–67. [Google Scholar] [CrossRef]
  7. Tymrak, B.M.; Kreiger, M.; Pearce, J.M. Mechanical Properties of Components Fabricated with Open-Source 3D Printers Under Realistic Environmental Conditions. Mater. Des. 2014, 58, 242–246. [Google Scholar] [CrossRef]
  8. Prpić, V.; Schauperl, Z.; Ćatić, A.; Dulčić, N.; Čimić, S. Comparison of Mechanical Properties of 3D-Printed, CAD/CAM, and Conventional Denture Base Materials. J. Prosthodont. 2020, 29, 524–528. [Google Scholar] [CrossRef]
  9. Wu, W.; Geng, P.; Li, G.; Zhao, D.; Zhang, H.; Zhao, J. Influence of Layer Thickness and Raster Angle on the Mechanical Properties of 3D-Printed PEEK and a Comparative Mechanical Study between PEEK and ABS. Materials 2015, 8, 5834–5846. [Google Scholar] [CrossRef] [PubMed]
  10. Patel, A.; Taufik, M. Nanocomposite Materials for Fused Filament Fabrication. Mater. Proc. 2021, 47, 5142–5150. [Google Scholar] [CrossRef]
  11. Ning, F.; Cong, W.; Qiu, J.; Wei, J.; Wang, S. Additive Manufacturing of Carbon Fiber Reinforced Thermoplastic Composites Using Fused Deposition Modeling. Compos. Part B Eng. 2015, 80, 369–378. [Google Scholar] [CrossRef]
  12. Dul, S.; Fambri, L.; Pegoretti, A. High-Performance Polyamide/Carbon Fiber Composites for Fused Filament Fabrication: Mechanical and Functional Performances. J. Mater. Eng. Perform. 2021, 30, 5066–5085. [Google Scholar] [CrossRef]
  13. Almeshari, B.; Junaedi, H.; Baig, M.; Almajid, A. Development of 3D Printing Short Carbon Fiber Reinforced Polypropylene Composite Filaments. J. Mater. Res. Technol. 2023, 24, 16–26. [Google Scholar] [CrossRef]
  14. Shulga, E.; Karamov, R.; Sergeichev, I.S.; Konev, S.D.; Shurygina, L.I.; Akhatov, I.S.; Shandakov, S.D.; Nasibulin, A.G. Fused Filament Fabricated Polypropylene Composite Reinforced by Aligned Glass Fibers. Materials 2020, 13, 3442. [Google Scholar] [CrossRef] [PubMed]
  15. Kabir, S.M.F.; Mathur, K.; Seyam, A.-F.M. Maximizing the Performance of 3D Printed Fiber-Reinforced Composites. J. Compos. Sci. 2021, 5, 136. [Google Scholar] [CrossRef]
  16. Abderrafai, Y.; Mahdavi, M.H.; Sosa-Rey, F.; Hérard, C.; Navas, I.O.; Piccirelli, N.; Lévesque, M.; Therriault, D. Additive Manufacturing of Short Carbon Fiber-Reinforced Polyamide Composites by Fused Filament Fabrication: Formulation, Manufacturing and Characterization. Mater. Des. 2022, 214, 110358. [Google Scholar] [CrossRef]
  17. Calignano, F.; Lorusso, M.; Roppolo, I.; Minetola, P. Investigation of the Mechanical Properties of a Carbon Fibre-Reinforced Nylon Filament for 3D Printing. Machines 2020, 8, 52. [Google Scholar] [CrossRef]
  18. Medel, F.; Abad, J.; Esteban, V. Stiffness and Damping Behavior of 3D Printed Specimens. Polym. Test. 2022, 109, 107529. [Google Scholar] [CrossRef]
  19. Somireddy, M.; Czekanski, A. Anisotropic Material Behavior of 3D Printed Composite Structures—Material Extrusion Additive Manufacturing. Mater. Des. 2020, 195, 108953. [Google Scholar] [CrossRef]
  20. Zohdi, N.; Yang, R. Material Anisotropy in Additively Manufactured Polymers and Polymer Composites: A Review. Polymers 2021, 13, 3368. [Google Scholar] [CrossRef]
  21. Mansour, G.; Papageorgiou, V.; Tzetzis, D. Carbon Fiber Polymer Reinforced 3D Printed Composites for Centrifugal Pump Impeller Manufacturing. Technologies 2024, 12, 48. [Google Scholar] [CrossRef]
  22. Spectrum Filaments. Available online: https://spectrumfilaments.com/en/filament/pa6-cf15/ (accessed on 9 November 2024).
  23. TreeD Filaments. Available online: https://treedfilaments.com/datasheets/tech/TDS_PPSCF.pdf (accessed on 9 November 2024).
  24. ISO 527-2; Plastics—Determination of Tensile Properties. International Organization for Standardization: Geneva, Switzerland, 2012. Available online: https://cdn.standards.iteh.ai/samples/56046/c5c3ec20cc0741289bf6def861e0a40b/ISO-527-2-2012.pdf (accessed on 24 January 2025).
  25. ISO 178; Plastics—Determination of Flexural Properties. International Organization for Standardization: Geneva, Switzerland, 2019. Available online: https://cdn.standards.iteh.ai/samples/70513/cd351551961842c590df25e23807b73c/ISO-178-2019.pdf (accessed on 24 January 2025).
  26. ASTM D395B; Standard Test Methods for Rubber Property-Compression Set. ASTM International: West Conshohocken, PA, USA, 2017. Available online: https://www.astm.org/d0395-01.html (accessed on 24 January 2025).
  27. Sperling, L.H. Introduction to Physical Polymer Science, 4th ed.; John Wiley & Sons Inc.: Hoboken, NJ, USA, 2005; Chapter 3. [Google Scholar]
  28. Rao, S.S. Mechanical Vibrations, 5th ed.; Prentice Hall: Hoboken, NJ, USA, 2011. [Google Scholar]
  29. Tsongas, K.; Tzetzis, D.; Mansour, G. Mechanical and Vibration Isolation Behaviour of Acrylonitrile-Butadiene Rubber/Multiwalled Carbon Nanotube Composite Machine Mounts. Plast. Rubber Comp. 2017, 46, 458–468. [Google Scholar] [CrossRef]
  30. Mansour, G.; Tsongas, K.; Tzetzis, D.; Tzikas, K. Dynamic Mechanical Characterization of Polyurethane/Multi-Walled Carbon Nanotube Composite Thermoplastic Elastomers. Polym. Plast. Technol. Eng. 2017, 56, 1505–1515. [Google Scholar] [CrossRef]
  31. Mansour, G.; Tsongas, K.; Tzetzis, D. Modal Testing of Nanocomposite Materials Through an Optimization Algorithm. Measurement 2016, 91, 31–38. [Google Scholar] [CrossRef]
  32. Mansour, G.; Tsongas, K.; Tzetzis, D. Modal Testing of Epoxy Carbon-Aramid Fiber Hybrid Composites Reinforced with Silica Nanoparticles. J. Reinf. Plast. Comp. 2016, 35, 1401–1410. [Google Scholar] [CrossRef]
  33. Pandzic, A.; Hodzic, D. Mechanical Properties Comparison of PLA, Tough PLA and PC 3D Printed Materials with Infill Structure–Influence of Infill Pattern on Tensile Mechanical Properties. IOP Conf. Ser. Mater. Sci. Eng. 2021, 1208, 12019. [Google Scholar] [CrossRef]
  34. Dudescu, C.; Racz, L. Effects of Raster Orientation, Infill Rate and Infill Pattern on the Mechanical Properties of 3D Printed Materials. Acta Univ. Cibiniensis 2017, 69, 23–30. [Google Scholar] [CrossRef]
  35. Chukov, D.; Stepashkin, A.; Tcherdyntsev, V.; Olifirov, L.; Kaloshkin, S. Structure and Properties of Composites based on Polyphenylene Sulfide Reinforced with Al-Cu-Fe Quasicrystalline Particles. J. Thermoplast. Compos. Mater. 2017, 31, 882–895. [Google Scholar] [CrossRef]
  36. Ünal, H.; Ermiş, K. Determination of Mechanical Performance of Glass Fiber Reinforced and Elastomer Filled Polyamide-6 Composites. Int. Adv. Res. Eng. J. 2021, 5, 405–411. [Google Scholar] [CrossRef]
  37. Martín, M.J.; Auñón, J.A.; Martín, F. Influence of Infill Pattern on Mechanical Behavior of Polymeric and Composites Specimens Manufactured Using Fused Filament Fabrication Technology. Polymers 2021, 13, 2934. [Google Scholar] [CrossRef]
Figure 1. 3D-printed infill patterns ×20 magnification.
Jcs 09 00059 g001
Figure 2. (a) Mechanical test specimens; (b) vibration test specimens.
Jcs 09 00059 g002
Figure 3. Tensile strength per infill pattern: (a) PA6-CF15; (b) PPS-CF15.
Jcs 09 00059 g003
Figure 4. Compressive strength per infill pattern: (a) PA6-CF15; (b) PPS-CF15.
Jcs 09 00059 g004
Figure 5. Flexural strength per infill pattern: (a) PA6-CF15; (b) PPS-CF15.
Jcs 09 00059 g005
Figure 6. Typical hysteresis loop curve during cyclic loading.
Jcs 09 00059 g006
Figure 7. Hysteresis loops of 3D-printed specimen with different infill types: (a) PA6-CF15; (b) PPS-CF15.
Jcs 09 00059 g007
Figure 8. Modal test experimental setup.
Jcs 09 00059 g008
Figure 9. Transfer functions along with the resonance frequencies of PA6-CF15 specimens per infill pattern. (a) Grid; (b) gyroid; (c) triangle; (d) hexagon.
Jcs 09 00059 g009aJcs 09 00059 g009b
Figure 10. Transfer functions along with the resonance frequencies of PPS-CF15 specimens per infill pattern. (a) Grid; (b) gyroid; (c) triangle; (d) hexagon.
Jcs 09 00059 g010
Figure 11. Overall mechanical behavior: (a) tensile strength and modulus, (b) compressive strength and modulus, and (c) flexural Strength and modulus of the composite materials and infill patterns.
Jcs 09 00059 g011aJcs 09 00059 g011b
Figure 12. (a) Hysteretic damping and (b) viscous damping of the composite materials and infill patterns.
Jcs 09 00059 g012
Table 1. Specimen fabrication parameters.
MaterialNozzle
Temperature (°C)
Bed
Temperature (°C)
Layer
Height (mm)
Printing
Speed (mm/s)
Infill
Ratio (%)
PA6-CF15280900.260100
PPS-CF153101100.260100
Table 2. Material density per infill pattern.
Infill Pattern PA6-CF15 Density (kg/m3)PPS-CF15 Density (kg/m3)
Grid1042.11193.6
Gyroid959.41002.7
Triangle1017.91169.3
Hexagon805.8920.9
Table 3. Tensile strength and strain per material and infill type.
MaterialInfill PatternsTensile Yield Strength (MPa)Strain at Yield (%)Tensile
Modulus (MPa)
PA6-CF15Grid21.50.0121800
Gyroid18.70.0111710
Triangle
Hexagon
14.4
9
0.009
0.005
1580
1500
PPS-CF15Grid18.60.0063080
Gyroid
Triangle
Hexagon
17.8
13.7
8.2
0.005
0.004
0.003
2960
2850
2060
Table 4. Compressive strength and strain per material and infill type.
MaterialInfill PatternsCompressive Yield Strength (MPa)Strain at
Yield (%)
Compressive
Modulus (MPa)
PA6-CF15Grid40.50.068627
Gyroid37.70.072542
Triangle
Hexagon
30.8
16.4
0.062
0.046
532
349
PPS-CF15Grid53.20.084648
Gyroid
Triangle
Hexagon
42.4
40.1
21.6
0.071
0.076
0.058
624
537
391
Table 5. Flexural strength and strain per material and infill type.
MaterialInfill PatternsFlexural Yield Strength (MPa)Strain at Yield (%)Flexural Modulus
(MPa)
PA6-CF15Grid2.120.03364.3
Gyroid1.630.03054.5
Triangle
Hexagon
1.35
0.77
0.025
0.017
53.7
45.3
PPS-CF15Grid1.780.01993.8
Gyroid
Triangle
Hexagon
1.55
1.26
0.68
0.017
0.014
0.011
91.2
89.8
61.9
Table 6. Hysteretic compression damping properties of the 3D-printed specimens per material and infill type.
MaterialInfill PatternsLoss Factor, nEnergy Loss over a Cycle, ΔWMaximum Energy of that Cycle, W
PA6-CF15Grid6.49%0.02150.1053
Gyroid6.72%0.02110.1002
Triangle
Hexagon
7.96%
13.04%
0.0292
0.0701
0.1169
0.1711
PPS-CF15Grid2.96%0.1180.1266
Gyroid
Triangle
Hexagon
3.24%
4.7%
5.02%
0.0133
0.0194
0.0242
0.1309
0.1315
0.1534
Table 7. Vibration test results.
MaterialInfill PatternsResonance
Frequency (Hz)
Viscous
Damping
Stiffness
(N/m)
PA6-CF15Grid802.21%303.5
Gyroid762.77%269.5
Triangle
Hexagon
73
63
4.73%
5.87%
251
227.1
PPS-CF15Grid532.16%436.1
Gyroid
Triangle
Hexagon
66
63
56
2.28%
2.56%
2.75%
414.2
406.4
321
Disclaimer/Publisher’s Note: The statements, opinions and data contained in all publications are solely those of the individual author(s) and contributor(s) and not of MDPI and/or the editor(s). MDPI and/or the editor(s) disclaim responsibility for any injury to people or property resulting from any ideas, methods, instructions or products referred to in the content.

