Abstract
The activity of Co- and Ni-containing ceria-based catalysts for water–gas shift (WGS) reaction were examined in this work. The catalysts were prepared by the urea co-precipitation method. Sm and Pr dopant (5 wt.%) was used as a structural stabilizer of CeO2, while Co or Ni was used in a small amount (1 wt.%). H2-TPR experiments indicate that both Sm and Pr addition increased the reducibility of CeO2. Among the studies’ catalysts, 1%Ni/Ce5%SmO exhibited the highest WGS activity. In addition, WGS rate was measured in the temperature range of 200–400 °C for Ni supported on CeO2, Ce5%SmO, and Ce5%PrO. The activation energy of the reaction over 1%Ni/Ce5%SmO was 57 kJ/mol, while it was 61 and 66 kJ/mol, respectively, over 1%Ni/Ce5%PrO and 1%Ni/CeO2 catalysts. A WGS reaction mechanism, CO adsorbed on the metal cluster is oxidized by oxygen supplied from the CeO2 support at the metal–ceria interface. This oxygen is then re-oxidized by H2O, which caps the oxygen vacancy on the ceria surface, and thereby oxygen vacancies serve as active sites for the WGS reaction. Raman experiments indicate that the presence of Sm in 1%Ni/Ce5%SmO catalyst promoted the formation of oxygen vacancies, leading to enhanced WGS performance.
1. Introduction
Fuel cell technology is rapidly developing for both power plant and transportation applications because of its high energy efficiency and ability in converting the chemical energy into electricity through an electrochemical reaction. O2 from air and H2 fuel, which can be produced from gasoline, CH4, or CH3OH, combine electrochemically in a fuel cell to generate electricity without combustion. Steam reforming of CH4 is a common method for hydrogen production. Normally, the reformate gas includes CO, CO2, H2, and H2O. However, the presence of CO in the fuel stream poisons the Pt electrodes, thereby hindering the performance of PEM fuel cell. There has been a renewed interest in the water–gas shift (WGS) reaction in recent years, primarily because of the increasing demand for H2 and the requirement for more efficient and sustainable methods for its generation. The WGS reaction, which converts CO and steam into CO2 and H2, is a crucial step in many industrial processes, including H2 production for fuel cells and other applications.
Ceria acts as a stabilizer for both noble and non-noble metals in various catalytic applications. It achieves this through several mechanisms, including metal–support interactions, oxygen storage capacity, and the generation of defects like oxygen vacancies. CeO2 loaded with Pt metal is a very good catalyst for WGS reaction. CeO2-based WGS catalysts are very attractive because of their high oxygen storage capacity of ceria and modified CeO2 [1,2]. Furthermore, CeO2 material serves as a stabilizer of both noble and non-noble metals and as a promoter of many reactions, including the WGS reaction and CO oxidation. In previous studies, the WGS kinetics over Rh/CeO2-Al2O3 were studied [3]. The reaction mechanism of this catalyst is a regenerative mechanism in which CO is inserted into the reactive oxygen species of Rh/CeO2-based materials to give CO2 and oxygen vacancies, which are then immediately filled by H2O to give H2. Similar results over CeO2-supported Pt, Rh, and Pd [4] demonstrated the importance of OSC and oxygen mobility in these catalysts. The authors noted that a regenerative mechanism of WGS was controlled by two steps; first, oxygen from CeO2 is transferred to a metal catalyst at the interface and then the CeO2 is re-oxidized [4]. Ample evidence supports a regenerative mechanism in oxidation reactions over ceria-based materials. This mechanism involves the exchange of electrons between the ceria support and the supported metal oxides, resulting in the oxidation of a reactant and then the reduction in the CeO2.
The introduction of a dopant with a lower oxidation state, such as M3+, into the Ce4+ lattice of CeO2 increases the oxygen vacancies concentration in the CeO2 structure and improves the thermal stability of the catalysts by hindering the agglomeration of CeO2-based materials [5,6,7,8]. Increasing oxygen vacancies in a ceria-based catalyst is a rational strategy to improve the efficiency of the oxidation reaction (such as the water–gas shift reaction). This can be achieved through methods like aliovalent doping with lower-valence cations (e.g., La3+, Pr3+, or Sm3+), which creates a charge imbalance and defects [5,6,7]. The superior redox behavior of Pr- or Sm-doped CeO2 means that it is reduced at a lower temperature compared to pure CeO2 and typically reduces more easily than La-doped CeO2. Since La is fixed in the La3+ state, the generation of oxygen vacancies relies solely on the reduction in nearby Ce4+ sites. Whereas a Pr or Sm can cycle between oxidation states, this process is dynamic and creates highly mobile vacancies. Therefore, the presence of Pr or Sm leads to a higher concentration of oxygen vacancies compared to La-doped CeO2. Furthermore, some studies indicate that while La can improve catalyst activity and stability, Sm and Pr may show even better performance for certain reactions. For example, one study found that Sm doping improved the performance of a CuO-CeO2 catalyst, while La doping either had no effect or lowered the performance [9].
In this work, we are interested in examining non-noble metal support on CeO2-based material as catalysts for the WGS reaction. Recent findings found that ceria-supported Ni catalysts are very active for CO oxidation [10,11,12]. Furthermore, Cu- and Ni-loaded CeO2 catalysts were studied for the water–gas shift reaction and compared to CuO–ZnO commercial catalysts. It was found that CeO2-based catalysts present better thermal stability and extend the operating temperature range. Therefore, we have examined the WGS reaction over non-noble metal (Co and Ni) supported on CeO2 and X-doped CeO2 (X = Sm and Pr) catalysts to clarify the characteristics of these catalysts. The influence of each metal on the redox behavior and reactivity of CeO2-based material was compared.
2. Experimental Procedure
2.1. Catalyst Preparation
Ce(NO3)3.6H2O (99%, Sigma-Aldrich, Darmstadt, Germany) and X(NO)3.6H2O (X = Sm or Pr, 99%, Sigma-Aldrich) are initial precursors for the preparation of ceria and X-doped ceria supports through the precipitation method [13,14]. Metal salts and urea were dissolved with deionized water (DI), stirred, and heated to obtain homogenous solution. Then, NH4OH was added at a rate of 1 mL min−1 to obtain precipitate. The mixture reactants were stirred at 110 °C for 4 h to eliminate ammonia and age the support. The filtered sample was first dried at 100 °C overnight, followed by calcination at 450 °C for 4 h.
Co and Ni catalysts were prepared by the impregnation method. Co(NO3)2.6H2O or Ni(NO3)2.6H2O was dissolved with DI and then added to ceria, Sm-doped ceria, and Pr-doped ceria support. All catalysts were dried at 100 °C overnight and followed by calcination at 650 °C for 8 h.
2.2. Catalyst Characterization
2.2.1. Standard Characterization
N2 adsorption–desorption isotherms of samples were determined employing the Quantachrome NOVA 1200e instrument (Anton Paar QuantaTec Inc., Boynton Beach, FL, USA). About 0.2 g of the sample was degassed in vacuum at 300 °C for 6 h before the measurement and then the adsorption was performed at 77 K. The specific surface areas were determined using the BET procedure. The BJH method was used to evaluate the pore size distribution and average pore size diameter.
The metal loading of the catalysts was determined using an Epsilon3-XL X-ray fluorescence (Malvern Panalytical, Almelo, The Netherlands) spectrometer.
The X-ray diffraction patterns were collected by Ni-filtered Cu Kα radiation (λ = 1.5406 Å). The measurements were operated at 0.5 s and 0.02° per step over a range of 20–80° under the current of 30 mA and 40 kV. The CeO2 crystallite size is estimated using Scherrer’s equation [15].
2.2.2. Raman Spectroscopy
The Raman spectra of catalysts were determined by Perkin Elmer System 2000 FT-IR/FT-Raman (PerkinElmer, Inc., Shelton, CT, USA) in the range of 200–1000 cm−1 with a 514.5 nm line of an Ar ion laser. The samples were irradiated with an output power 10 mW and detected by a Charge Coupled Device detector (Sharp Corporation, Tokyo, Japan).
2.2.3. Temperature Programmed Reduction (TPR)
A catalyst analyzer BELCAT-B (BEL Japan, Inc., Osaka, Japan) was used for H2-TPR experiments under 5% H2/Ar flow with a heating rate of 10 °C/min from 100 to 1000 °C. The samples were treated under a flow of helium at 120 °C for 30 min before the measurement. H2-TPR measures the rate of hydrogen consumption during a temperature ramp to assess the reducibility of catalysts’ surfaces, as H2 is directly involved in the reduction process, such as the formation of oxygen vacancies. The H2-TPR peaks correspond to different reduction steps, revealing information about the reducibility of each species in the catalyst.
2.2.4. Temperature-Programmed Oxidation (TPO)
TPO was carried out by a catalyst analyzer BELCAT-B to analyze the kind of deposited carbon on the catalyst surface. The measurement was operated in the range of 100–900 °C, under 10% O2/He with a flow of 40 mL/min. The used catalysts were pre-treated under Ar atmosphere at 150 °C for 30 min.
2.2.5. Pulse Injection Method
Metal particle size and dispersion were determined by the pulse injection method with a flow of 10%CO/He (on a catalysts analyzer BELCAT-B). About 0.05 g of sample was loaded into a quartz reactor and then reduced with 30 mL/min of 10% H2/He at 400 °C for an hour and followed by cooling under a flow of He gas. After that, CO chemisorption pulse was carried out by introducing 10% CO/He to the sample until saturated chemisorption with the flow rate of 30 mL/min at 50 °C and then the outlet gas was detected by thermal conductivity detector (TCD). Metal dispersion and particle size were estimated assuming the stoichiometric factor (CO/Ni or CO/Co) as 1.
The percentage of metal dispersion (D) was calculated using the following formula:
where VChem is adsorption volume (cm3/g), MW is atomic weight of the supported metal (g/mol), Vm is molar volume of gas at STP, SF is stoichiometric factor (number of adsorbed CO molecules per metal atom), m is sample weight (g), and c is % metal loading on the support.
Metal particle size is calculated from CO chemisorption using the following formula:
where D is the metal dispersion, dmetal is the metal’s surface density of atoms, and NA is Avogadro’s number.
2.3. WGS Performance Test
The sample (~0.15 g) was sandwiched between two layers of quartz wool in a stainless steel tube reactor. Stainless steel was used for WGS reactors because it provides good mechanical and thermal stability for operation at high temperatures. A tube furnace and mass flow controllers were utilized to control the reaction temperature and the flow rate of feed gas, respectively. The water vapor content was controlled by syringe pump. A mixture of 5% CO, 10% H2O, and a balance N2 gas was flowed through a catalyst bed at the constant 100 mL/min STP rate to study the WGS reaction. An on-line Shimadzu GC-14B gas chromatography (Shimadzu Corporation, Kyoto, Japan) equipped with TCD and a Unibeads C stainless-steel packed column (15 m × 0.53 mm) was used to analyze the remaining reactant and product out from the reactor. The water–gas shift activities were calculated by the following equation.
where COin and COout are the CO molar flow rate at the inlet and outlet, respectively.
A blank run in a water–gas shift reactor was performed to establish a baseline of the reactor’s physical and thermal behavior without the influence of a catalyst or chemical reaction, allowing you to understand the effect of the stainless steel reactor itself on the gas and temperature. This baseline is critical for accurately analyzing the true performance of the catalyst and the WGS reaction by subtracting the blank run’s results from the actual catalytic run.
For turnover frequency (TOF) calculations and the reaction rates, the catalytic activity testing was operated using 20 mg of catalyst and feed gas mixture of 10% H2O, 5% CO, and 85% N2 where the CO conversions were lower than 10% to avoid the influence of reaction products on the reaction rate. This ensures that the measured rate accurately reflects the initial reaction kinetics, rather than being affected by product inhibition or the shift in equilibrium that occurs at higher conversions. The TOF was calculated by the following equation:
TOF = mol of CO converted/(mol of Ni metal × time (s))
The WGS rates were calculated by the following equation:
where RCO is the WGS rate (mol g−1 s−1), MCO is the molar flow rate of CO (mol s−1), mcat is the catalyst mass (g), and XCO is the CO conversion.
RCO = (MCO × XCO)/mcat
3. Results and Discussion
Figure 1 presents CO conversions over Co- or Ni-containing CeO2. Pure CeO2 is not an active catalyst for WGS reaction. Its activity is significantly enhanced when modified with Ni and Co, or when doped with Sm. The CO conversion of all catalysts increases with increasing reaction temperature. 1%Ni/Ce5%SmO is a superior WGS catalyst compared to other catalysts. Notably, almost 90% CO conversion can be achieved at 450 °C over 1%Ni/Ce5%SmO catalyst, and the conversion slightly decreases at temperatures higher than 450 °C. In the case of Co-containing ceria catalysts, the CO conversion of Co on Ce5%SmO support is much higher than that of Co on CeO2 and Ce5%PrO supports. The 1%Co/Ce5%SmO catalyst shows a maximum CO conversion of 80% at 450 °C, with a subsequent decrease in conversion at higher temperatures.
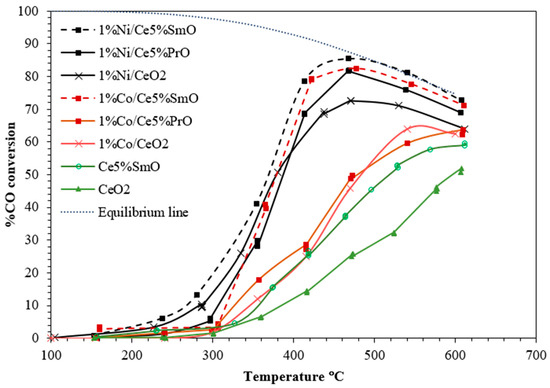
Figure 1.
WGS activity of Ni and Co catalysts (0.15 g of catalyst and feed gas mixture of 5%CO, 10%H2O, and a balance N2 gas).
BET surface areas, average pore size, CeO2 crystallite sizes, and metal loading of M/CeO2 and M/doped CeO2 (M = Ni, Co) are shown in Table 1. Doping of CeO2 with Sm or Pr increases the specific surface area, decreases average pore size and reduces the CeO2 crystallite size of the catalyst. On the other hand, an addition of M (M = Co, Ni) on CeO2 and doped CeO2 supports leads to a decrease in BET surface area and an increase in CeO2 crystallite size. This result is indicated to be due to the growth and agglomeration of CeO2 particles after calcination at high temperature (650 °C). Sm and Pr ions in M/Sm-doped CeO2 and M/Pr-doped CeO2 stabilize the catalyst and hamper the catalyst from sintering by maintaining small particles and high surface area. Furthermore, on BET surface areas of the catalysts after water–gas shift reaction testing up to 600 °C for 10 h, very little loss of surface area took place. The actual metal loadings (Ni, Co, Sm, and Pr) in different ceria-based catalysts were determined using X-ray fluorescence (XRF), and which were all measured to be close to the initial target value used in the preparation.

Table 1.
BET surface areas, average pore size, CeO2 crystallite sizes, and metal loading of supported Ni and Co catalysts.
The N2 adsorption–desorption isotherms and pore size distribution curves for CeO2-based catalysts are exhibited in Figure 2. According to the IUPAC classification, Ni and Co catalysts show type IV isotherms with H3 type hysteresis loop, featured by a sharp uptake at low pressure which indicates the presence of small pores (micropore), while a large hysteresis loop at higher pressure points to larger pores (mesopore). The rising (adsorption) and falling (desorption) portions of the loop do not coincide, suggesting significant hysteresis and the presence of mesoporous structures [16]. The pore size distribution curves of Ni catalysts showed a narrow peak centered at 0.6 nm (Figure 2c), suggesting a high degree of uniformity in the pore diameters. This uniformity and small pore size can enhance catalytic activity by providing a high density of active sites and creating channels that are optimal for the rapid diffusion of reactants and products [17]. Therefore, the smallest average pore size of the Ni/Ce5%SmO catalyst contributes to increased catalyst stability and decreased sintering.
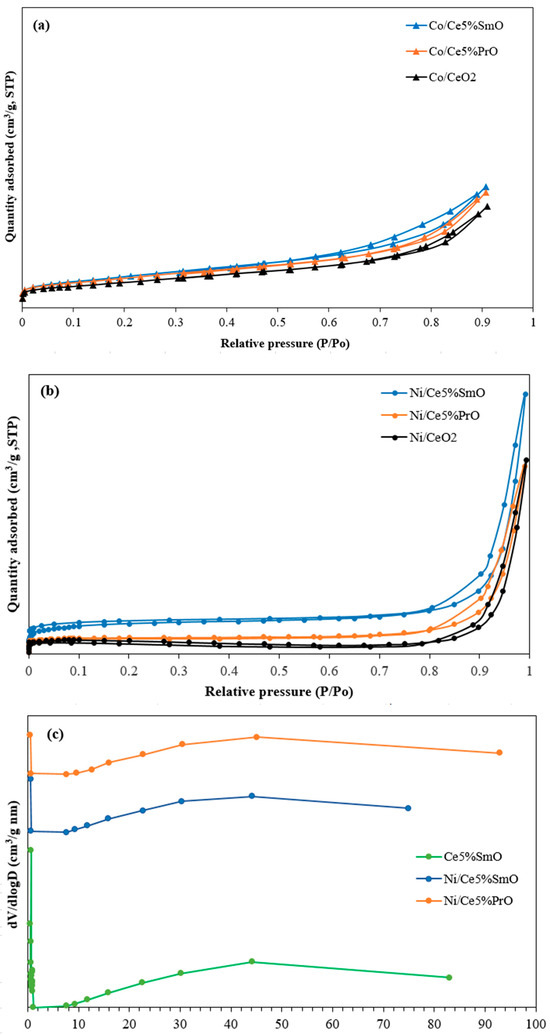
Figure 2.
(a) N2 adsorption–desorption isotherms of Co catalysts, (b) N2 adsorption–desorption isotherms of Ni catalysts, and (c) BJH pore size distribution curves of Ce5%SmO support and Ni catalysts.
The X-ray diffraction patterns of calcined catalysts are shown in Figure 3. The XRD patterns of all catalysts were found to be fluorite-type cubic crystal structures of ceria (JCPDS No. 43-1002). The presence of a very small content of 1% Ni can be difficult to detect. In addition, the absence of Sm2O3 or Pr2O3 peaks strongly suggests that Sm and Pr have successfully replaced the Ce ions in the CeO2 crystal structure to form a solid solution [18,19]. When doping a CeO2 material with larger ions (Pr3+ and Sm3+ ions), the crystal structure expands to accommodate the larger dopant, and thereby oxygen vacancies are expected to generate in the CeO2 lattice to keep the charge equilibrium [20]. This leads to a shift in the XRD peaks towards lower 2θ values.
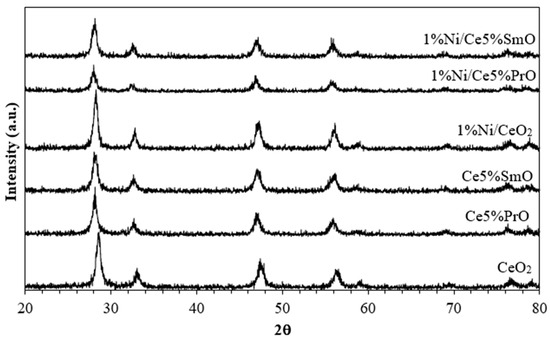
Figure 3.
XRD patterns of supports and Ni catalysts.
The crystallite sizes of CeO2 on the calcined catalysts in Table 1 were estimated from the (111) plane using Scherrer’s equation. The addition of Sm and Pr into Ni/CeO2 and Co/CeO2 causes a decrease in CeO2 crystallite size together with high surface area, indicating a greater distribution of the catalysts. The absence of Sm and Pr in the preparation of CeO2 leads to the preferential growth of CeO2. This is because Sm and Pr influence the crystal structure and growth behavior of CeO2, potentially leading to different morphologies or the formation of solid solutions with CeO2.
In essence, maximizing Ni dispersion is essential for optimizing Ni-based catalysts for efficient and selective WGS reactions. The choice of support material influences Ni dispersion and stability. To quantify the Ni dispersion, CO chemisorption pulse was operated on supported Ni and Co catalysts (Table 2). As expected, the content of CO chemisorbed to the surface enhanced when doping CeO2 with Sm and Pr. The result presented that a 1%Ni/Ce5%SmO catalyst exhibits the highest Ni dispersion compared to other catalysts. This enhanced dispersion promotes CO adsorption, which is crucial for improving the WGS activity. Furthermore, higher dispersion means smaller metal particles, leading to a larger surface area and more active sites.
Table 2.
H2 consumption and % dispersion of Ni and Co catalysts.
H2-TPR measurements were performed to study the reducibility of the catalysts (Figure 4). The intensity in arbitrary units indicates the relative amount of consumed hydrogen during the reduction in a catalyst. A higher intensity corresponds to a greater rate of hydrogen consumption. The increased reducibility in doped ceria materials is evidenced by the H2 consumption, which is summarized in Table 2. The content of consumed H2 during the reduction in metal oxides is evaluated from the areas under the TPR peaks corresponding to each metal oxide reduction. The H2 consumption of Co and Ni catalysts increased in the order of 1%Co/CeO2 (1.17 mmol/g) < 1%Co/Ce5%PrO (1.35 mmol/g) < 1%Co/Ce5%SmO (1.43 mmol/g) < 1%Ni/CeO2 (1.93 mmol/g) < 1%Ni/Ce5%SmO (2.15 mmol/g) < 1%Ni/Ce5%PrO (2.19 mmol/g). Accordingly, the reduction temperature and H2 consumption data demonstrate that Sm addition significantly enhances the reduction in Ni/CeO2 and Co/CeO2 by lower reduction temperatures and higher H2 consumption. This process results in the creation of oxygen vacancies on the catalyst surface which serve as active sites for the dissociation of water molecules, thereby increasing H2 production [21]. From H2-TPR profiles, CeO2 and doped CeO2 supports show two main characteristics at around 450 °C and 850 °C, ascribed to the reduction in surface CeO2 and bulk CeO2, respectively [22]. The addition of Co and Ni improves the reduction of CeO2 supports because hydrogen atoms spill over from the metal particles onto the CeO2 support, facilitating its reduction at lower temperatures. Furthermore, Sm and Pr doping into Ni/CeO2 and Co/CeO2 can lower the reduction temperature and enhance the overall redox activity. The Ni/CeO2 profile exhibits the reduction peak in the range of 300–400 °C, assigned to the reduction in NiO species with varying degrees of interaction with the support [23]. Similarly to the reduction profile of the bare support, the reduction peak at around 850 °C related to the bulk reduction of CeO2. Upon the addition of Sm or Pr to Ni/CeO2 catalysts, the reduction peaks feature of NiO shifts to a lower temperature. This can be attributed to the synergistic interaction between nickel and CeO2-based supports. This synergistic effect leads to smaller and more evenly dispersed nickel particles [24]. The fine dispersion inhibits Ni sintering, a process where particles clump together at high temperatures, and enhances the catalyst’s resistance to oxidation during reactions.
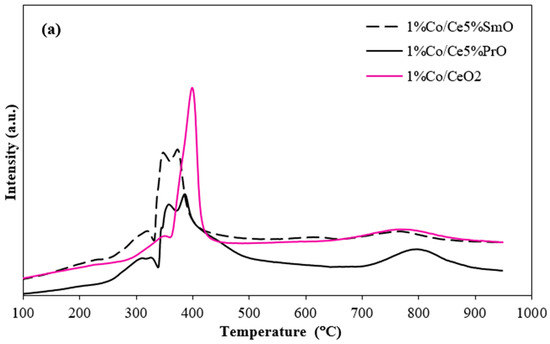
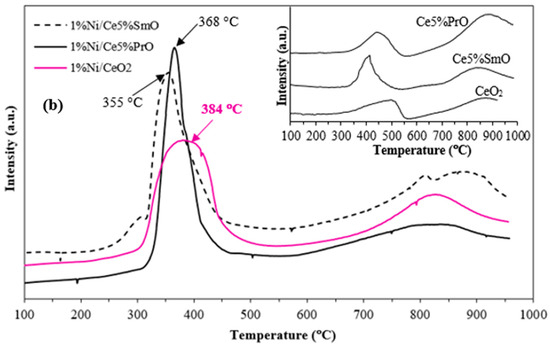
Figure 4.
H2-TPR profiles of Co catalysts (a), Ni catalysts and insert of the figure corresponding to H2-TPR profiles of ceria-based support (b).
The TPR patterns for Co/CeO2 catalysts exhibited three TPR peaks. The first peak at 350 °C was attributed to the reduction of Co3+ to Co2+. The second peak at 400 °C was assigned to the reduction of Co2+ to metallic Co. The third peak at around 800 °C corresponds to the reduction in bulk CeO2 [25]. In contrast, four TPR peaks were observed for the Co/Ce5%SmO and Co/Ce5%PrO catalysts. A peak detected at about 320 °C resulted from the reduction of Co3+ to Co2+. In addition, the peaks were observed in the range of 350–500 °C, corresponding to the reduction of Co2+ interacting with CeO2 to metallic Co, whereas the peak at about 800 °C corresponds to the reduction in bulk CeO2. Therefore, the addition of Sm or Pr into Co/CeO2 shifts the reduction peak to a lower temperature and increases the H2 consumption of Co catalysts when compared to Co supported by pure CeO2.
Raman spectroscopy for Ni catalysts was conducted to study oxygen vacancies in the catalyst (Figure 5). The Raman peak of CeO2 support at about 460 cm−1 was attributed to the F2g vibration for the Ce–O bond in cubic fluorite ceria [26]. Compared to pure ceria, doping ceria with Sm drastically decreased the F2g peak intensity and the peak position shifted to lower wavelengths. This result was due to the lattice distortion of ceria which led to the reduction in the Ce-O bond symmetry [27]. Besides the F2g peak, the Raman peak was observed at 580 cm−1 (D peak) corresponding to the vibration induced by defect sites on the ceria structure [27]. In comparison to Ni/CeO2 and Ni/Ce5%SmO, the D peak intensity of the 1%Ni/Ce5%SmO catalyst was higher than that of 1%Ni/CeO2, suggesting that the presence of Sm promoted the oxygen vacancies production on the ceria structure. The ratio of the peak intensities for the D and F2g peaks serves as an indicator of surface oxygen vacancy concentration. Notably, the estimated ID/IF2g values follow a trend of Ni/Ce5%SmO (0.50)∼Ce5%SmO (0.52) > Ni/CeO2 (0.09) > CeO2 (0.06). This implies that the addition of Sm into Ni/CeO2 significantly enhances the number of surface oxygen vacancies.
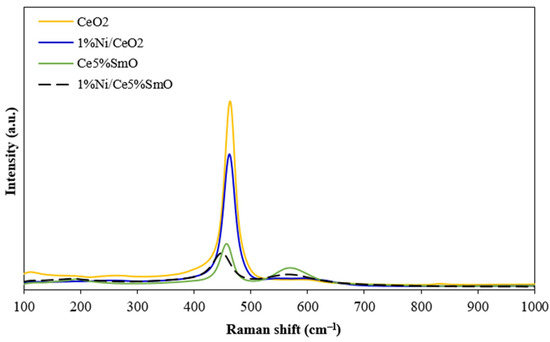
Figure 5.
Raman spectra of CeO2, 1%Ni/CeO2, Ce5%SmO, and 1%Ni/Ce5%SmO catalysts.
The WGS reaction converts CO and water to CO2 and H2. However, nickel can also catalyze the methanation reaction (3H2 + CO → CH4 + H2O), leading to the generation of CH4 as a byproduct, which reduces the efficiency of hydrogen production. Figure 6 shows the selectivity to CO2 and CH4 on the Ni/CeO2 and Ni/Ce5%SmO catalysts. On the Ni/CeO2 catalyst, CH4 was the only byproduct. The Ni/Ce5%SmO catalyst presented 100% CO2 selectivity and 0% CH4 selectivity at all temperatures studied. This is due to the high oxygen vacancy amount of the Ni/Ce5%SmO catalyst, which disrupts the methanation reaction by increasing the supply of oxygen atoms. The 1%Ni/Ce5%SmO catalyst clearly exhibited higher activity than the Ni/CeO2 catalyst with no methanation activity, making it a promising catalyst for the WGS reaction. Therefore, introducing Sm to the Ni-based catalyst can enhance its activity for the WGS reaction, potentially suppressing methane formation.
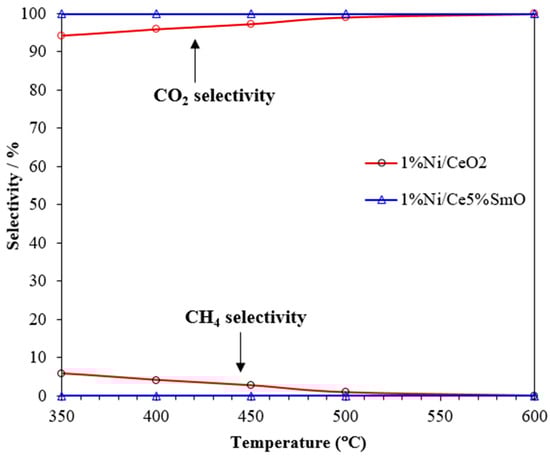
Figure 6.
CO2 and CH4 selectivities of the Ni catalysts.
The carbon deposition on the surface of used catalysts after the WGS test was analyzed by temperature programmed oxidation (Figure 7). The thermal conductivity detector (TCD) responds to changes in the thermal conductivity of the gas exiting the reactor as a function of temperature. The TCD measures the concentration of reaction products by comparing the thermal conductivity of the carrier gas with the gas mixture exiting the heated sample. The oxygen consumption curves represent the carbon oxidation of spent catalysts. Carbon deposition on the used catalysts surface could be amorphous carbon, graphitic carbon, or atomic in nature depending on the oxidation temperature. It has been reported that atomic carbon oxidizes at a temperature below 250 °C, while the oxidation peaks in the temperature ranges of 250–600 °C can be ascribed to the combustion of amorphous carbon. Lastly, the oxidation peak appearing at a temperature above 600 °C is graphitic carbon [28,29]. The TPO curves for the spent Ni/CeO2 and Ni/Ce5%SmO catalysts had higher intensity peaks appearing between 250 and 600 °C, corresponding to the presence of amorphous carbon on these catalysts. In addition, a small peak can be seen at above 600 °C for the spent Ni/CeO2 catalyst. This indicated that there appeared to be very small deposits of graphitic carbon on the used Ni/CeO2. The highest amount of oxygen consumed during the oxidation found on the used Ni/CeO2 catalyst indicates the largest content of carbon deposited on it. More carbon deposition on catalyst surface means more carbon to oxidize, leading to a higher oxygen consumption. Therefore, carbon deposition on catalyst surface which happened during the WGS reaction causes carbon balance to be less than 100%. As can be seen from Figure 8, the carbon balance did not reach 100% toward the Ni/CeO2 catalyst for most of the temperatures and decreased gradually with increasing temperature. For the Ni/Ce5%SmO catalyst, the carbon balance is ~100% for all testing in the temperature range of 350–600 °C. The carbon balance in the water–gas shift reaction maintains the principle of mass conservation: carbon is neither created nor destroyed, so the total amount of carbon in the reactants (CO and water) equals the total amount of carbon in the products (CO2 and any potential byproducts, like methane). The overall reaction is CO + H2O ⇌ CO2 + H2, where all carbon atoms are conserved and converted from CO to CO2. However, undesirable side reactions can occur, such as the methanation reaction (CO + 3H2 → CH4 + H2O). Therefore, while the ideal carbon balance is achieved by converting CO to CO2, the actual balance must account for the loss of carbon in methane if it forms.
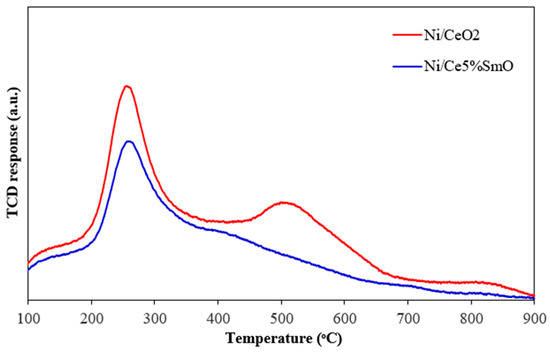
Figure 7.
TPO profile of spent catalysts after WGS reaction.
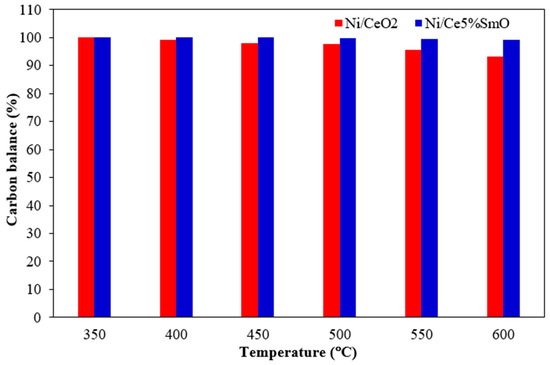
Figure 8.
Carbon balance for Ni catalysts (using 150 mg of catalysts; the feed gas contained 5% CO, 10% H2O, and 85% N2 and the total flow rate was 100 mL/min).
The CO conversion of the Ni/CeO2 and Ni/Ce5%SmO catalysts measured with respect to time at a reaction temperature of 400 °C is shown in Figure 9. The Ni/Ce5%SmO catalyst maintained consistent CO conversion in the whole period of 40 h, demonstrating its good stability. Notably, the Ni/CeO2 catalyst exhibited signs of deactivation by a decrease in CO conversion around 10% after WGS reaction for 40 h. Generally, carbon deposition is a significant factor in the deactivation of catalysts used in the water–gas shift reaction. The deposited carbon blocks active sites of the catalyst, hindering reactant access and ultimately reducing the catalyst’s activity. From the TPO result of the used catalysts, a large amount of the carbon deposition on the surface was found in the used Ni/CeO2 catalyst, whereas the excellent resistance to coke formation in the Ni/Ce5%SmO catalyst, which was influenced by higher oxygen vacancy, resulted in stable catalyst performance.
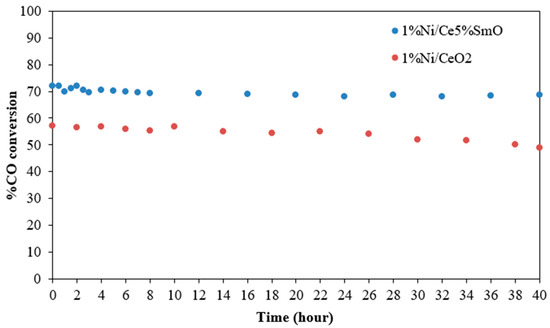
Figure 9.
Stability test at 400 °C of the Ni/CeO2 and Ni/Ce5%SmO catalysts (using 150 mg of catalysts; the feed gas contained 5% CO, 10% H2O, and 85% N2 and the total flow rate was 100 mL/min).
The WGS rates were performed using 0.02 g of catalyst and a feed gas mixture of 10%H2O, 5%CO, and 85%N2. The activation energy (Ea) of Ni catalysts was calculated from the slope of the Arrhenius plot in the temperature range of 200–400 °C (Figure 10) and the estimated parameters are presented in Table 3. Generally, the apparent Ea values reported from the literature are in the range of 60–80 kJ/mol for transition metals supported on CeO2 [30], while the activation energies obtained from this work are in the range of 57–66 kJ/mol. Among the studied catalysts, 1%Ni/Ce5%SmO catalyst exhibited the highest WGS rate at 400 °C and the lowest of the Ea values (57 kJ/mol).
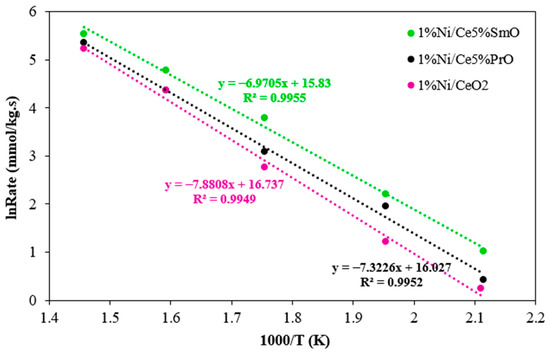
Figure 10.
Arrhenius plot of reaction rate over Ni catalysts (using 20 mg of catalysts; the feed gas contained 5% CO, 10% H2O, and 85% N2 and the total flow rate was 100 mL/min).
Table 3.
The reaction rate and turnover frequency at 400 °C of Ni catalysts.
In addition, the calculated TOF values are summarized in Table 3. The 1%Ni/Ce5%SmO catalyst exhibited a superior performance (in terms of TOF and WGS rate) as compared to other Ni-based catalysts at 400 °C. A TOF value of 0.40 s−1 and a WGS rate of 253 mmol/kg·s were achieved with the 1%Ni/Ce5%SmO catalyst. Therefore, the 1%Ni/Ce5%SmO catalyst is a promising and highly active catalyst which can be used for the water–gas shift reaction conducted at high temperatures of approximately 400 °C.
4. Conclusions
Ni/X-doped CeO2 and Co/X-doped CeO2 (X = Pr and Sm) were investigated as WGS catalysts in this work. Co or Ni was added in small amounts (1 wt.%) on CeO2, Sm-doped CeO2, and Pr-doped CeO2 supports. The WGS activity of Ni and Co supports on ceria-based materials was significantly enhanced by the addition of Sm. It was found that Sm doping in Ni/CeO2 can lower the reduction temperature and increase the overall redox activity. The increased reducibility of the catalytic surface and the increased dispersion of active sites boosted the WGS performance. Such enhanced reducibility benefits the WGS reaction by increasing oxygen vacancies and mobility in the catalyst, which are crucial for the catalytic cycle. This allows the catalyst to more effectively participate in the redox mechanism, where oxygen is removed to convert CO into CO2, leaving behind a vacancy that can be filled by H2O molecules to generate H2. By improving both oxygen mobility and the creation of oxygen vacancies, the catalyst’s overall ability to convert CO and H2O is significantly boosted. Moreover, a large amount of carbon deposition on the surface was found in the used Ni/CeO2 catalyst, whereas the excellent resistance to coke formation in the Ni/Ce5%SmO catalyst was influenced by higher oxygen vacancy and resulted in stable catalyst performance. Among the studied catalysts, the 1%Ni/Ce5%SmO catalyst demonstrates the highest Ni dispersion which is crucial for improving the WGS activity because the enhanced dispersion promotes CO adsorption. In addition, the Ea value of the WGS reaction over 1%Ni/Ce5%SmO was 57 kJ/mol, whereas it was 61 and 66 kJ/mol, respectively, over the 1%Ni/Ce5%PrO and 1%Ni/CeO2 catalysts. Notably, the 1%Ni/Ce5%SmO catalyst can facilitate the water–gas shift reaction with a lower activation energy than other catalysts which allows the reaction to occur more efficiently.
Author Contributions
Conceptualization, W.S. and P.N.; Methodology, W.S. and P.N.; Validation, P.N.; Formal analysis, P.N.; Investigation, P.N.; Resources, W.S. and P.N.; Data curation, P.N.; Writing—original draft, P.N.; Writing—review & editing, P.N.; Visualization, P.N.; Funding acquisition, W.S. and P.N. All authors have read and agreed to the published version of the manuscript.
Funding
The authors gratefully acknowledge the financial support provide by the Thammasat University Research Fund, Contract No TUFT 018/2568, and the Thammasat University Research Fund, Contract No TUFT 111/2567.
Data Availability Statement
The original contributions presented in this study are included in the article. Further inquiries can be directed to the corresponding author.
Conflicts of Interest
The authors declare no conflicts of interest.
References
- Lomonaco, J.G.; Sesuk, T.; Charojrochkul, S.; Tepamatr, P. Effect of Re Addition on the Water–Gas Shift Activity of Ni Catalyst Supported by Mixed Oxide Materials for H2 Production. Catalysts 2023, 13, 959. [Google Scholar] [CrossRef]
- Lomonaco, J.G.; Tojira, O.; Charojrochkul, S.; Tepamatr, P. Structure-Activity Relationship of Ceria Based Catalyst for Hydrogen Production. Chiang Mai J. Sci. 2022, 49, 1129–1134. [Google Scholar] [CrossRef]
- Weibel, M.; Garin, F.; Bernhardt, P.; Maire, G.; Prigent, M. Catalysis and automotive pollution control II. In Studies in Surface Science and Catalysis, Proceedings of the Second International Symposium, Hanover, NH, USA, 15–16 May 1978; Elsevier: Amsterdam, The Netherlands, 1991; Volume 71. [Google Scholar]
- Bunluesin, T.; Gorte, R.J.; Graham, G.W. Studies of the water-gas-shift reaction on ceria-supported Pt, Pd, and Rh: Implications for oxygen-storage properties. Appl. Catal. B Environ. 1998, 15, 107–114. [Google Scholar] [CrossRef]
- Zhu, M.; Tian, P.; Cao, X.; Chen, J.; Pu, T.; Shi, B.; Xu, J.; Moon, J.; Wu, Z.; Han, Y.F. Vacancy engineering of the nickel-based catalysts for enhanced CO2 methanation. Appl. Catal. B Environ. 2021, 282, 119561. [Google Scholar]
- Du, Y.; Qin, C.; Xu, Y.; Xu, D.; Bai, J.; Ma, G.; Ding, M. Ni nanoparticles dispersed on oxygen vacancies-rich CeO2 nanoplates for enhanced low-temperature CO2 methanation performance. Chem. Eng. J. 2021, 418, 129402. [Google Scholar] [CrossRef]
- Siakavelas, G.I.; Charisiou, N.D.; AlKhoori, S.; AlKhoori, A.A.; Sebastian, V.; Hinder, S.J.; Baker, M.A.; Yentekakis, I.V.; Polychronopoulou, K.; Goula, M.A. Highly selective and stable nickel catalysts supported on ceria promoted with Sm2O3, Pr2O3 and MgO for the CO2 methanation reaction. Appl. Catal. B Environ. 2021, 282, 119562. [Google Scholar] [CrossRef]
- Siakavelas, G.I.; Charisiou, N.D.; AlKhoori, A.; AlKhoori, S.; Sebastian, V.; Hinder, S.J.; Baker, M.A.; Yentekakis, I.V.; Polychronopoulou, K.; Goula, M.A. Highly selective and stable Ni/La-M (M=Sm, Pr, and Mg)-CeO2 catalysts for CO2 methanation. J. CO2 Util. 2021, 51, 101618. [Google Scholar] [CrossRef]
- Papavasiliou, J.; Avgouropoulos, G.; Ioannides, T. Effect of dopants on the performance of CuO–CeO2 catalysts in methanol steam reforming. Appl. Catal. B Environ. 2007, 69, 226–234. [Google Scholar] [CrossRef]
- Tepamatr, P.; Rungsri, P.; Daorattanachai, P.; Laosiripojana, N. Maximizing H2 Production from a Combination of Catalytic Partial Oxidation of CH4 and Water Gas Shift Reaction. Molecules 2025, 30, 271. [Google Scholar] [CrossRef]
- Patel, R.; Varatharajan, P.; Zhang, Q.; Li, Z.; Gu, S. Catalysts in the water-gas shift reaction: A comparative review of industrial and academic contributions. Carbon Capture Sci. Technol. 2025, 15, 100388. [Google Scholar] [CrossRef]
- Li, Y.; Fu, Q.; Stephanopoulos, M.F. Low-temperature water-gas shift reaction over Cu- and Ni-loaded cerium oxide catalysts. Appl. Catal. B Environ. 2000, 27, 179–191. [Google Scholar] [CrossRef]
- Tabakova, T.; Ilieva, L.; Ivanov, I.; Manzoli, M.; Zanella, R.; Petrova, P.; Kaszkur, Z. Structure activity relationship in water-gas shift reaction over gold catalysts supported on Y-doped ceria. J. Rare Earths 2019, 37, 383. [Google Scholar] [CrossRef]
- Tepamatr, P.; Buarod, E.; Laosiripojana, N.; Charojrochkul, S. Study of water gas shift reaction over ceria based catalysts in solid oxide fuel cells. ECS Trans. Actions 2015, 68, 1207. [Google Scholar] [CrossRef]
- Monshi, A.; Foroughi, M.; Monshi, M. Modified scherrer equation to estimate more accurately nano-crystallite size using XRD. World J. Nano Sci. Eng. 2012, 2, 154–160. [Google Scholar] [CrossRef]
- Thommes, M.; Kaneko, K.; Neimark, A.V.; Olivier, J.P.; Rodriguez-Reinoso, F.; Rouquerol, J.; Sing, K.S.W. Physisorption of gases, with special reference to the evaluation of surface area and pore size distribution (IUPAC Technical Report). Pure Appl. Chem. 2015, 87, 1051–1069. [Google Scholar] [CrossRef]
- Deka, J.R.; Saikia, D.; Lin, J.C.; Chen, W.Y.; Kao, H.M.; Yang, Y.C. ZIF-67-derived Co−N−C supported Ni nanoparticles as efficient recyclable catalyst for hydrogenation of 4-nitrophenol. Catalysts 2025, 15, 343. [Google Scholar] [CrossRef]
- Truffault, L.; Ta, M.-T.; Devers, T.; Konstantinov, K.; Harel, V.; Simmonard, C.; Andreazza, C.; Nevirkovets, I.P.; Pineau, A.; Veron, O.; et al. Application of nanostructured Ca doped CeO2 for ultraviolet filtration. Mater. Res. Bull. 2010, 45, 527. [Google Scholar] [CrossRef]
- El Rouby, W.M.A.; Farghali, A.A.; Hamdedein, A. Microwave synthesis of pure and doped cerium (IV) oxide (CeO2) nanoparticles for methylene blue degradation. Water Sci. Technol. 2016, 74, 2325. [Google Scholar] [CrossRef]
- Mandal, B.; Mondal, A.; Ray, S.S.; Kundu, A. Sm doped mesoporous CeO2 nanocrystals: Aqueous solution-based surfactant assisted low temperature synthesis, characterization and their improved autocatalytic activity. Dalton Trans. 2016, 45, 1679. [Google Scholar] [CrossRef]
- López-Rodríguez, S.; Davó-Quiñonero, A.; Bailón-García, E.; Lozano-Castelló, D.; Bueno-López, A. Effect of Ru loading on Ru/CeO2 catalysts for CO2 methanation. Mol. Catal. 2021, 515, 111911. [Google Scholar] [CrossRef]
- Hojo, H.; Hirota, K.; Ito, S.; Einaga, H. Reduction mechanism for CeO2 revealed by direct observation of the oxygen vacancy distribution in shape-controlled CeO2. Adv. Mater. Interfaces 2023, 10, 2–7. [Google Scholar] [CrossRef]
- Megía, P.J.; Morales, A.; Vizcaíno, A.J.; Calles, J.A.; Carrero, A. Oxidative steam reforming of acetic acid on Ni catalysts: Influence of the La promotion on mesostructured supports. Int. J. Hydrogen Energy 2024, 52, 1136–1145. [Google Scholar] [CrossRef]
- Li, D.; Nakagawa, Y.; Tomishige, K. Methane reforming to synthesis gas over Ni catalysts modified with noble metals. Appl. Catal. A Gen. 2011, 408, 1–24. [Google Scholar] [CrossRef]
- Lee, Y.L.; Jha, A.; Jang, W.J.; Shim, J.O.; Rode, C.V.; Jeon, B.H.; Bae, J.W.; Roh, H.S. Effect of alkali and alkaline earth metal on Co/CeO2 catalyst for the water-gas shift reaction of waste derived synthesis Gas. Appl. Catal. A Gen. 2018, 551, 63–70. [Google Scholar] [CrossRef]
- Spanier, J.E.; Robinson, R.D.; Zhang, F.; Chan, S.W.; Herman, I.P. Size-dependent properties of CeO2 y nanoparticles as studied by Raman scattering. Phys. Rev. B 2001, 64, 245407. [Google Scholar] [CrossRef]
- Wu, Z.L.; Li, M.J.; Howe, J.; Meyer, H.M.; Overbury, S.H. Probing defect sites on CeO2 nanocrystals with well-defined surface planes by Raman spectroscopy and O2 adsorption. Langmuir 2010, 26, 16595–16606. [Google Scholar] [CrossRef]
- Chen, L.; Qi, Z.; Zhang, S.; Su, J.; Somorjai, G.A. Catalytic hydrogen production from methane: A review on recent progress and prospect. Catalysts 2020, 10, 858. [Google Scholar] [CrossRef]
- Nabgan, W.; Nabgan, B.; Abdullah, T.A.T.; Ngadi, N.; Jalil, A.A.; Hassan, N.S.; Majeed, F.S.A. Conversion of polyethylene terephthalate plastic waste and phenol steam reforming to hydrogen and valuable liquid fuel: Synthesis effect of Ni–Co/ZrO2 nanostructured catalysts. Int. J. Hydrogen Energy 2020, 45, 6302–6317. [Google Scholar] [CrossRef]
- Liu, L.; Wang, Q.; Song, J.; Ahmad, S.; Yang, X.; Sun, Y. Plasma-assisted catalytic reforming of toluene to hydrogen rich syngas. Catal. Sci. Technol. 2017, 7, 4216–4231. [Google Scholar] [CrossRef]
Disclaimer/Publisher’s Note: The statements, opinions and data contained in all publications are solely those of the individual author(s) and contributor(s) and not of MDPI and/or the editor(s). MDPI and/or the editor(s) disclaim responsibility for any injury to people or property resulting from any ideas, methods, instructions or products referred to in the content. |
© 2025 by the authors. Licensee MDPI, Basel, Switzerland. This article is an open access article distributed under the terms and conditions of the Creative Commons Attribution (CC BY) license (https://creativecommons.org/licenses/by/4.0/).