Article

Inverse Cellular Lattices

1
Centre for Robotics in Industry and Intelligent Systems, INESC TEC—Institute for Systems and Computer Engineering, Technology and Science, 4200-465 Porto, Portugal
2
Department of Engineering, School of Science and Technology, University of Trás-os-Montes e Alto Douro, 5000-801 Vila Real, Portugal
3
CMEMS-UMinho, Department of Mechanical Engineering, University of Minho, Campus de Azurém, 4800-058 Guimarães, Portugal
*
Author to whom correspondence should be addressed.
J. Compos. Sci. 2025, 9(11), 605; https://doi.org/10.3390/jcs9110605
Submission received: 8 September 2025 / Revised: 31 October 2025 / Accepted: 3 November 2025 / Published: 5 November 2025
(This article belongs to the Special Issue Lattice Structures)

Abstract

The deformation mechanisms of classic lattice topologies (e.g., Cubic, Diamond, Octet, and Double Pyramid lattices) and their specific density-dependent mechanical properties have already been thoroughly explored by the scientific community. This study details a novel approach to designing lattices by generating the topologies that correspond to the voids of these classic lattice designs. This is achieved by using a Boolean operation performed to create a solid topology from the original voided fraction. The resultant topologies are proposed to be named Inverse lattices. Static structural numerical analysis shows that this process may generate significant changes in the lattice deformation mechanism and stiffness. For this effect, elastic properties such as the Specific modulus and Apparent Poisson’s ratio were determined as a function of Specific density. Specifically, for Octet and Double Pyramid inverse lattice topologies, results show a reduction in stiffness by promoting a change to a bending deformation mechanism. However, the inverse Diamond inverse lattice topologies present a higher stiffness (i.e., specific modulus) relative to the original classic design. This new lattice model may be a promising design for future lattice applications.

1. Introduction

Metamaterials are a relatively novel class of highly desirable materials due to their elevated specific mechanical properties that may be tailored by changing their topology. Non-stochastic cellular lattices, for instance, may display a wide range of mechanical properties by simply changing the topology of their periodic cells [1,2]. This may include behaviors that are uncommon in natural occurring materials, such as negative stiffness, negative thermal expansion, negative Poisson’s ratio (i.e., auxetic behavior), enhanced energy absorption, and vibration damping [3,4].
The design of these metamaterials is frequently based on nature, e.g., honeycombs, cork, cancellous bone, and other organic structures [5,6], and bioinspired designs are still being developed nowadays [7,8]. Classic three-dimensional metamaterial periodic cell designs are frequently based on Cubic, Diamond, Octet, and Pyramid micromechanical structures.
Current designs are also highly functional and performed in a wide array of techniques. Recent approaches include the use of topology optimization approaches to obtain lattices with increased mechanical properties. W. Wang et al. have shown an novel approach to design self-supporting lattices by topology optimization to increase the overall strength [9]. W. Song et al. [10] have developed a bidirectional evolutionary structural optimization approach to design lattice structures with maximized bulk modulus and elastic isotropy.
Machine learning is also being used to optimize lattice topologies. Gongora et al. [11] have combined numerical approaches to machine learning to reduce the computational cost and improve the efficiency of lattice designs.
These procedures have also been combined with topology optimization. J. Wang and A. Panesar [12] used a neural network-based inverse lattice generator to design topologies with target mechanical properties. C. Wu et al. [13] developed a multiscale optimization approach for additive manufacturing that optimizes non-uniform lattice topologies to promote highly uniform strain patterns.
While these desirable properties are highly dependent on complex topologies, the real application of metamaterials relies on their manufacturability [14]. Furthermore, metallic materials are frequently used for their solid fraction if these metamaterials are intended for load-bearing applications. The recent advances in metal-based additive manufacturing and metal casting techniques are widening the range of topologies that may be manufactured [15,16].
In this study, a different design approach is explored. Here, the solid and void fractions of the classic lattice models are inverted (i.e., voided volumes become solid and vice versa) using a Boolean operation to obtain Inverse lattices. The resultant topologies of these Inverse lattices, along with the classic lattices with the same specific densities, are compared in terms of normalized stiffness by determining their specific modulus by numerical analysis (Finite element analysis). Contrary to most assumptions, it is shown that, for certain topologies, the inverse lattice configuration has enhanced stiffness relative to the classic lattice models.

2. Methodology

2.1. Cellular Lattice Design

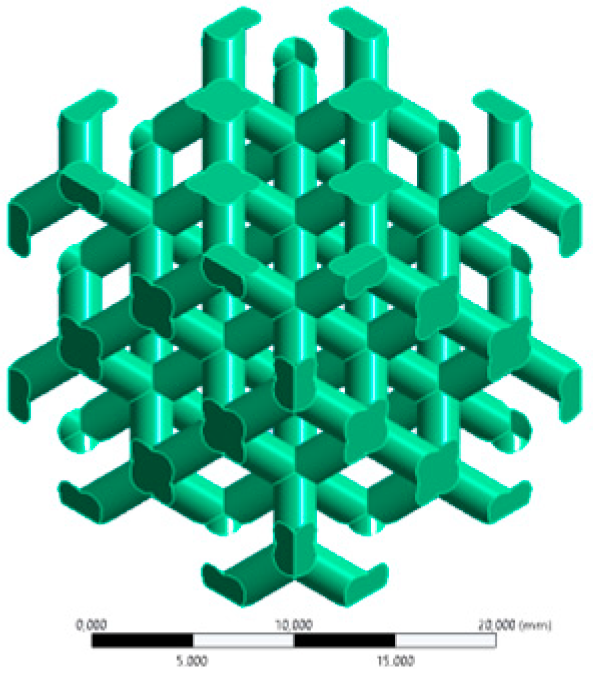
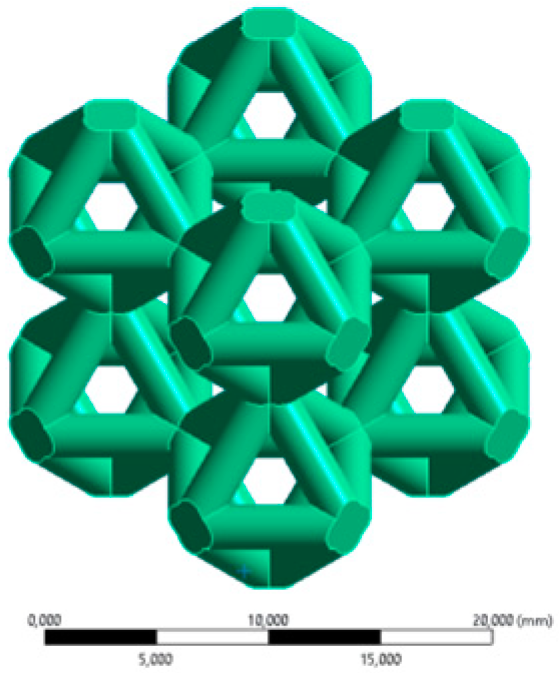
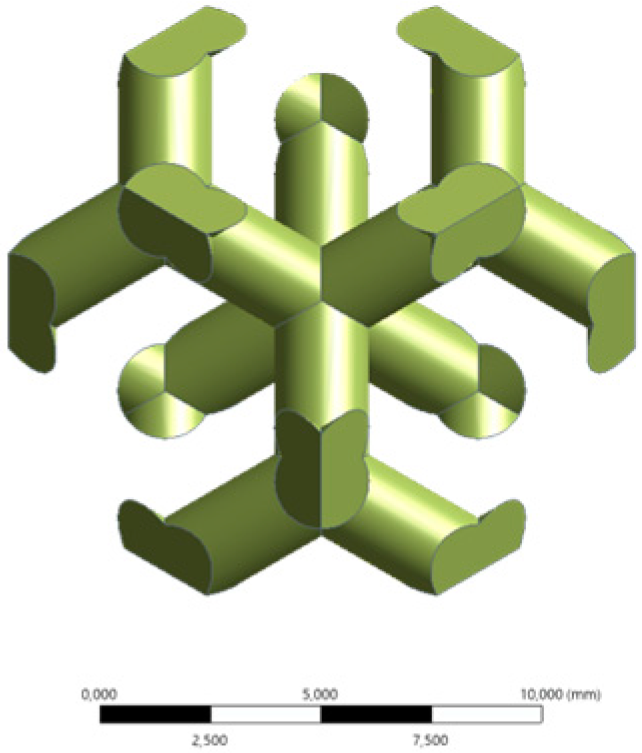
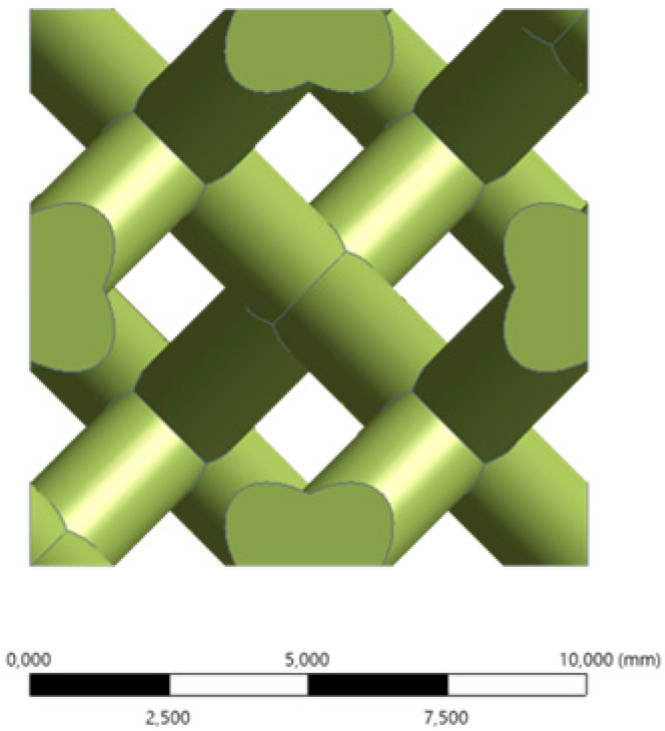
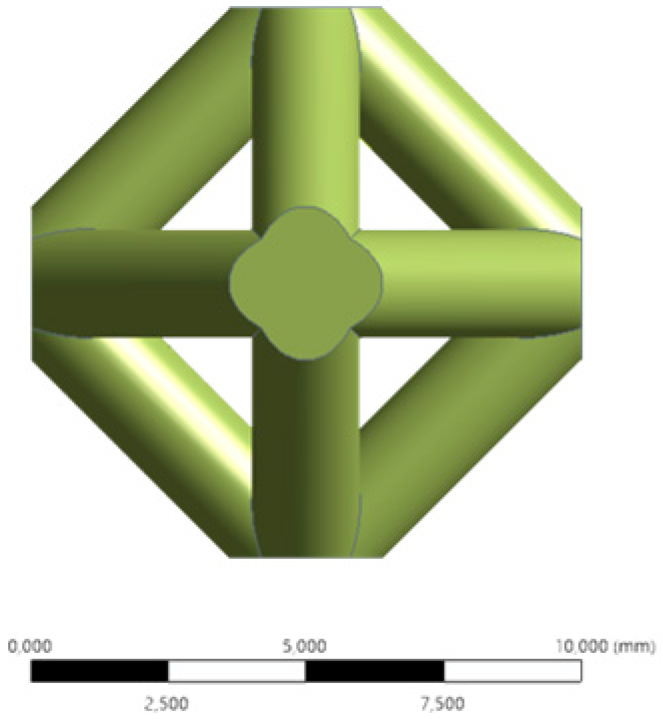
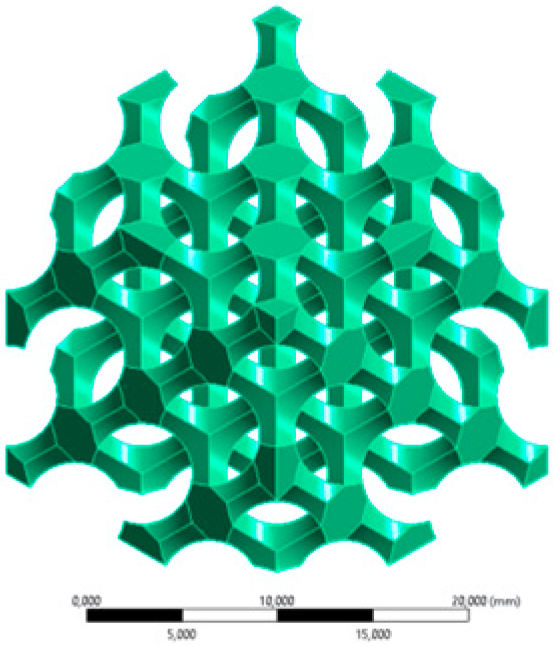
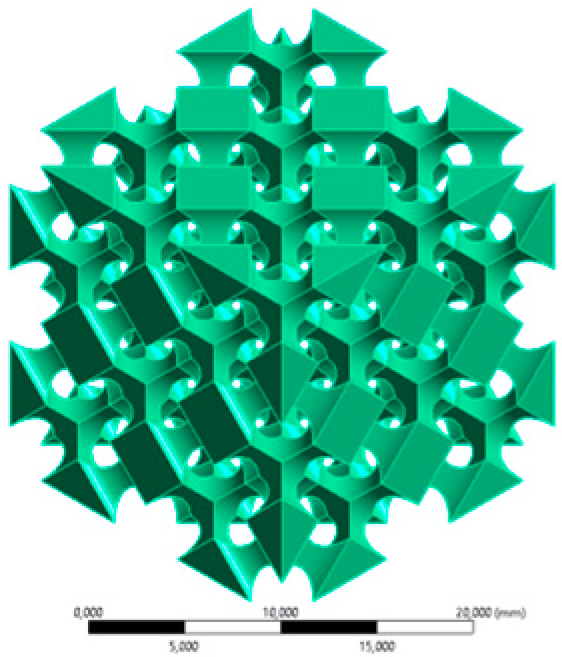
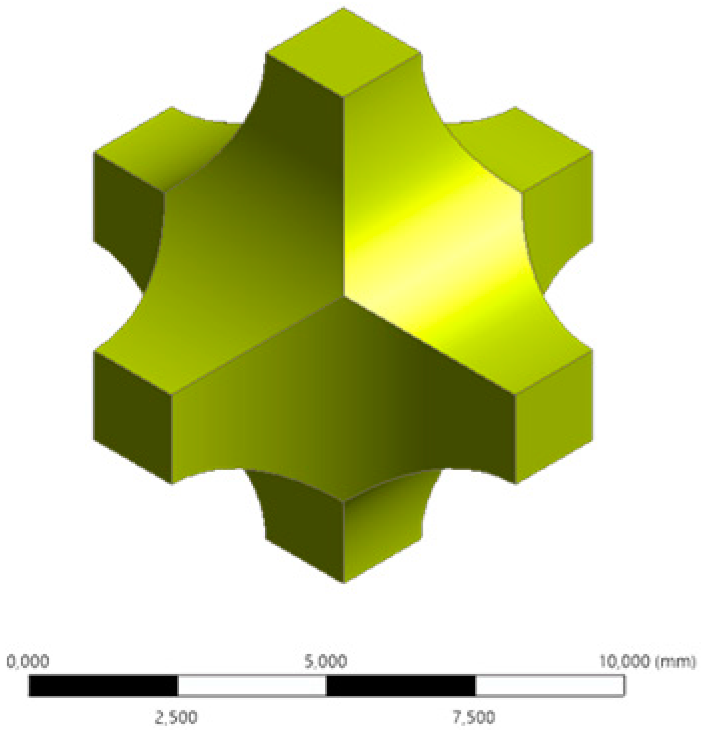
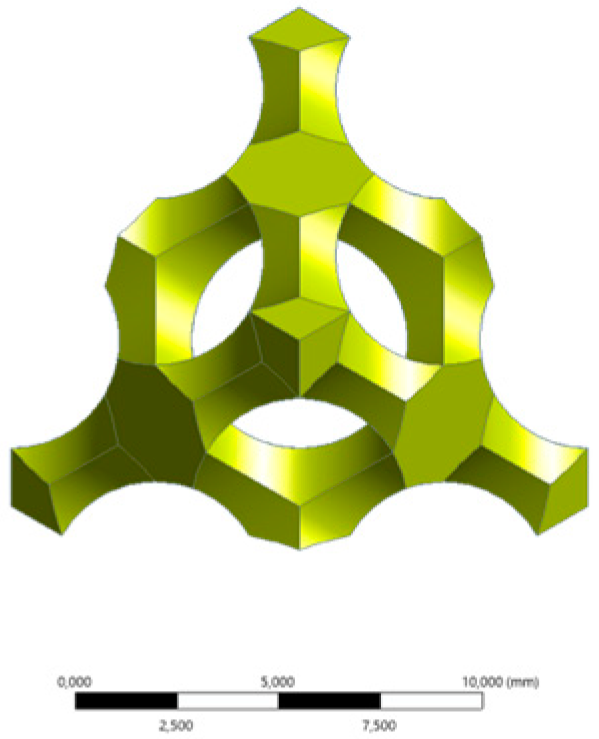
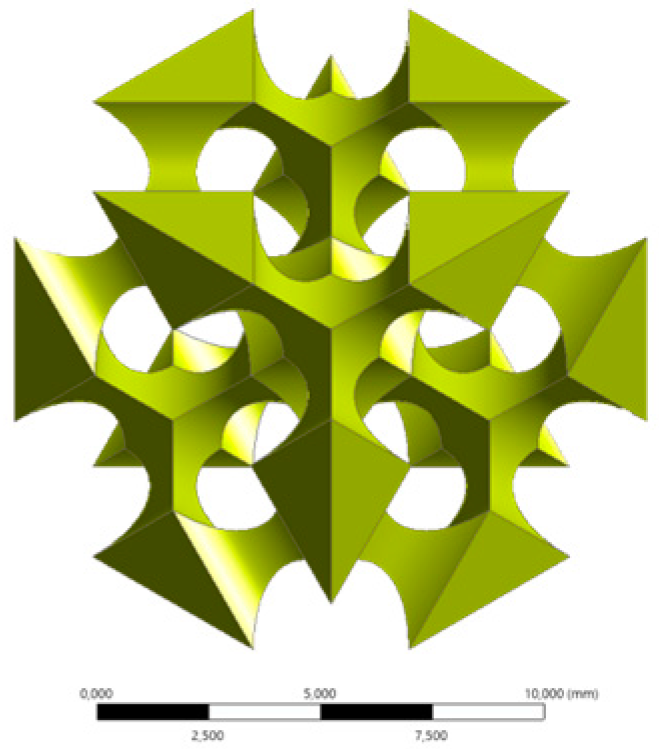
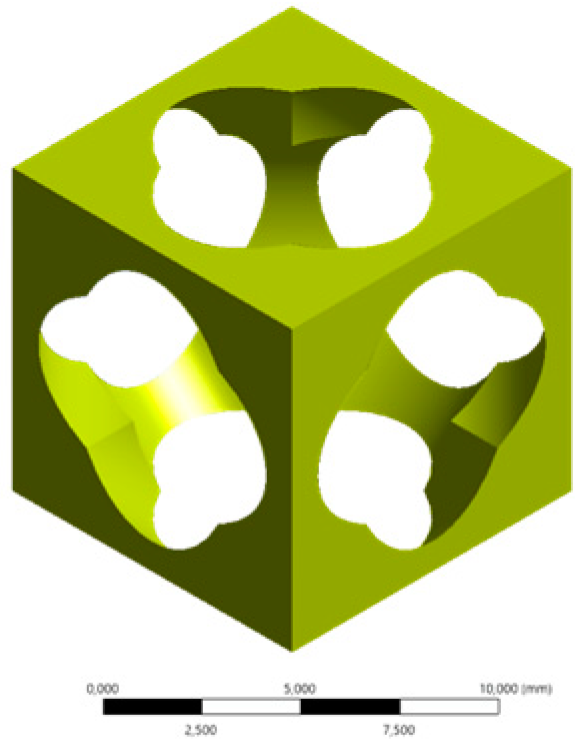
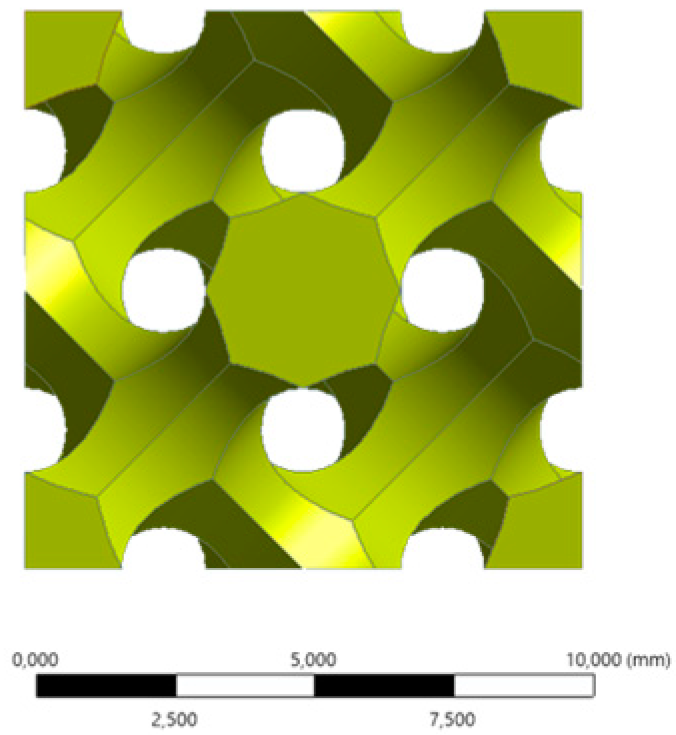
Non-stochastic cellular lattices were modeled using the Material Designer module of ANSYS 17 software to generate classic lattice topologies (Cubic, Diamond, Octet, and Double Pyramid) with a 2 × 2 × 2 configuration (each cellular unit with a 10 × 10 × 10 mm3 volume—Figure 1) in an array of specific densities (ρ*/ρ0—where ρ* and ρ0 are, respectively, the lattice apparent density and bulk base material density) from 0.05 to 0.95. These geometries were then imported as an IGES file to the Design Modeler module of ANSYS 17, where a Boolean operation was also used to design samples that represent the voided regions of the referred lattices with the correspondent relative density range, as represented in Figure 1. The topologies that result from the Boolean operation were coined Inverse lattices. The generated topologies by both approaches are highlighted in Table 1, using samples with the same relative density (e.g., ρ*/ρ0 = 0.20).

2.2. Static Structural Simulation

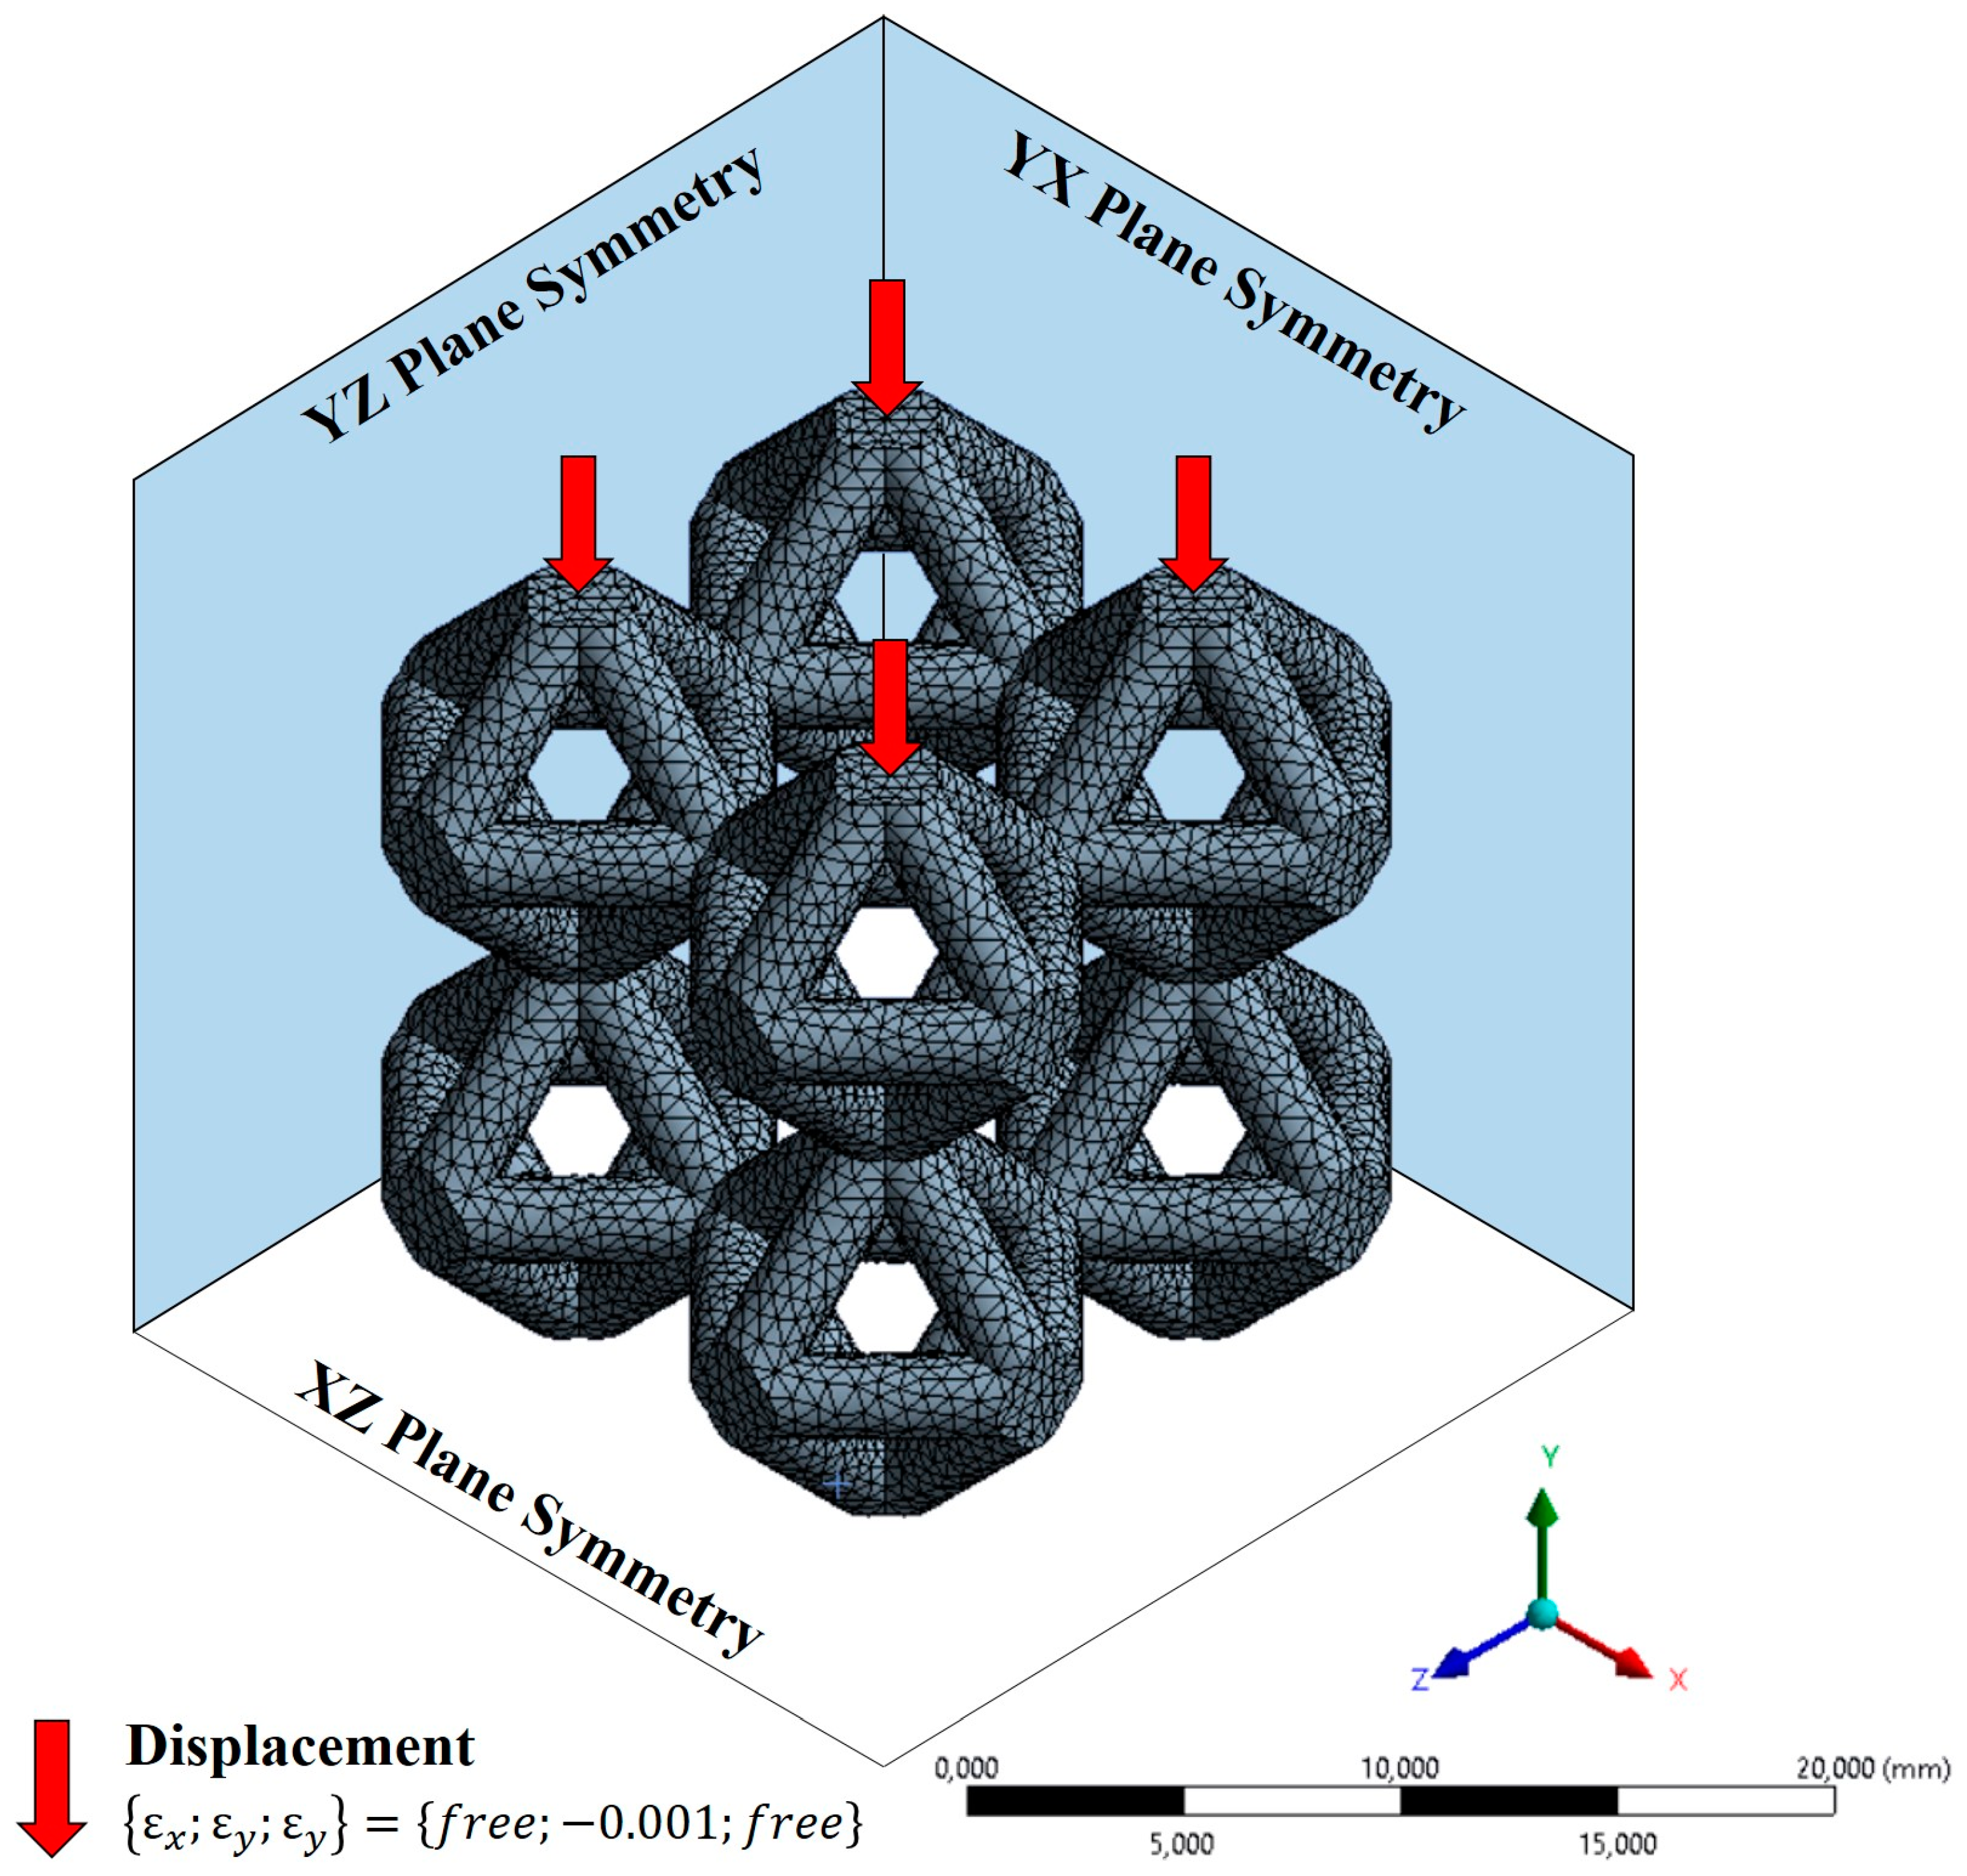
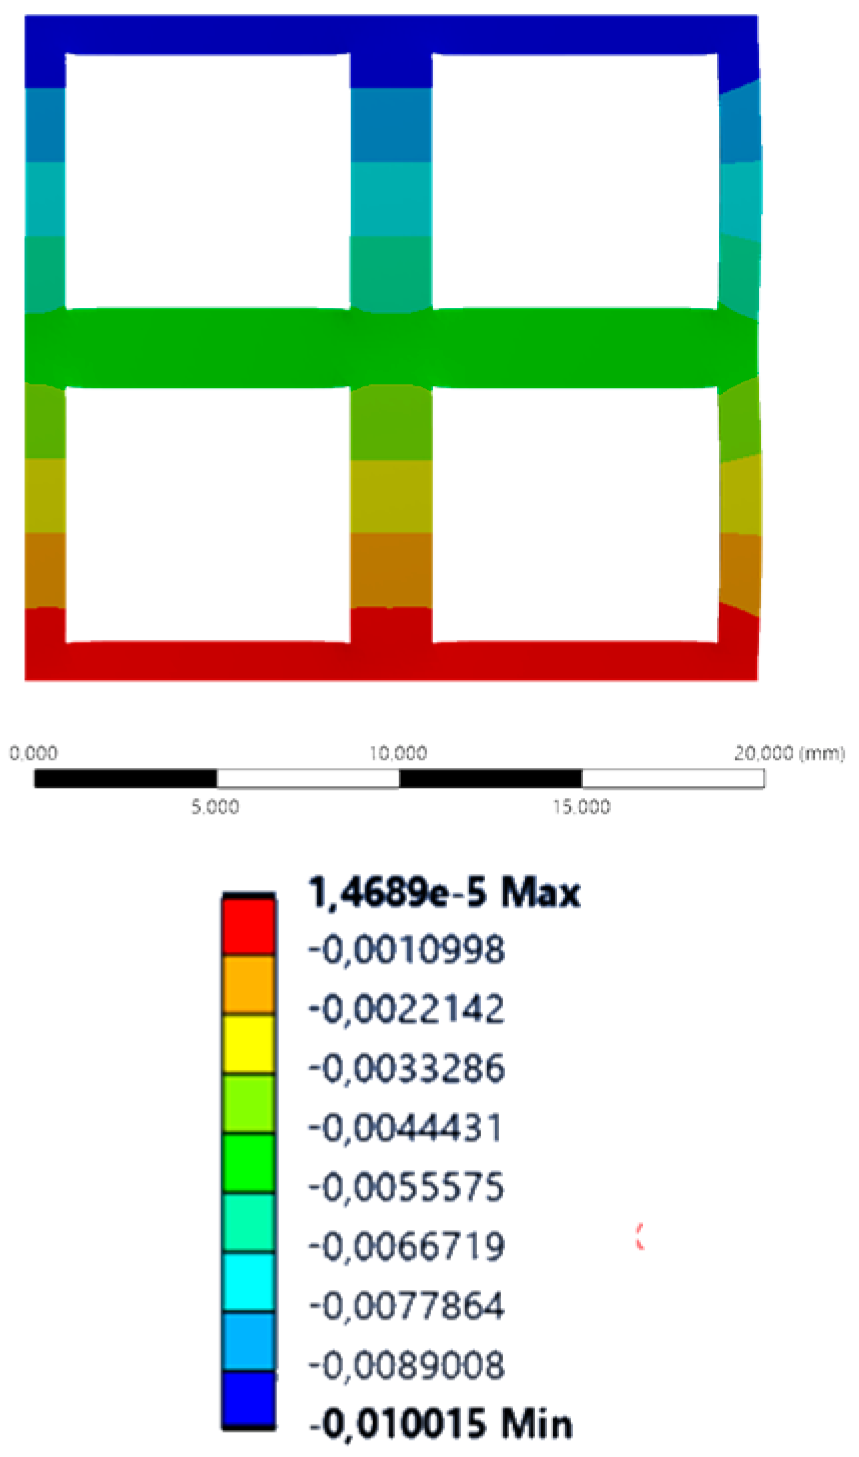
The designed topologies were selected (ρ*/ρ0 = {0.05 to 0.30–0.05 intervals}) and subjected to static linear elastic structural simulations in compression (Static Structural module—ANSYS 17, according to Figure 2. A linear elastic Aluminum alloy was attributed as the lattice base material (Bulk Elastic modulus, Poisson’s ratio and density, respectively, E0 = 70 GPa, ν0 = 0.3 and ρ = 2.7 g/cm3). Symmetries were imposed in the XZ, YZ, and YX planes, in which the contacting faces may move freely (i.e., frictionless) in each plane. The modeled symmetries imply that for small displacements the overall deformation mechanism represents 4 × 4 × 4 lattices (resulting from the 2 × 2 × 2 lattices symmetry in the three planes shown in Figure 2). A compression strain is applied (displacement in the YY axis, imposing an Apparent strain of εyy* = 0.1% in compression) in the top faces of the models, while the displacements in the XX and ZZ axis are kept unconstrained. Reaction loads (Fr) in the YY axis are monitored to determine the Apparent modulus (E*) according to Equation (1), where A* is the apparent resistant area of the models. The Specific modulus (E*/E0) was then determined by normalizing the Apparent modulus (E*) of the lattices by the Bulk Elastic modulus (E0). A constant element size of 0.5 mm was used to mesh the samples using SOLID187 elements, that was optimized to be within the mesh convergence range in all simulated models. This value was obtained after a mesh convergence analysis and is the most efficient value to assure convergence in all simulated models. The Apparent Poisson’s ratio (ν*) of the topologies was determined by monitoring the Apparent lateral (εxx*) and vertical strains (εyy*) and applying Equation (2).
E * = F r A *   ε y y *
ν * = ε x x * ε y y *

3. Results and Discussion

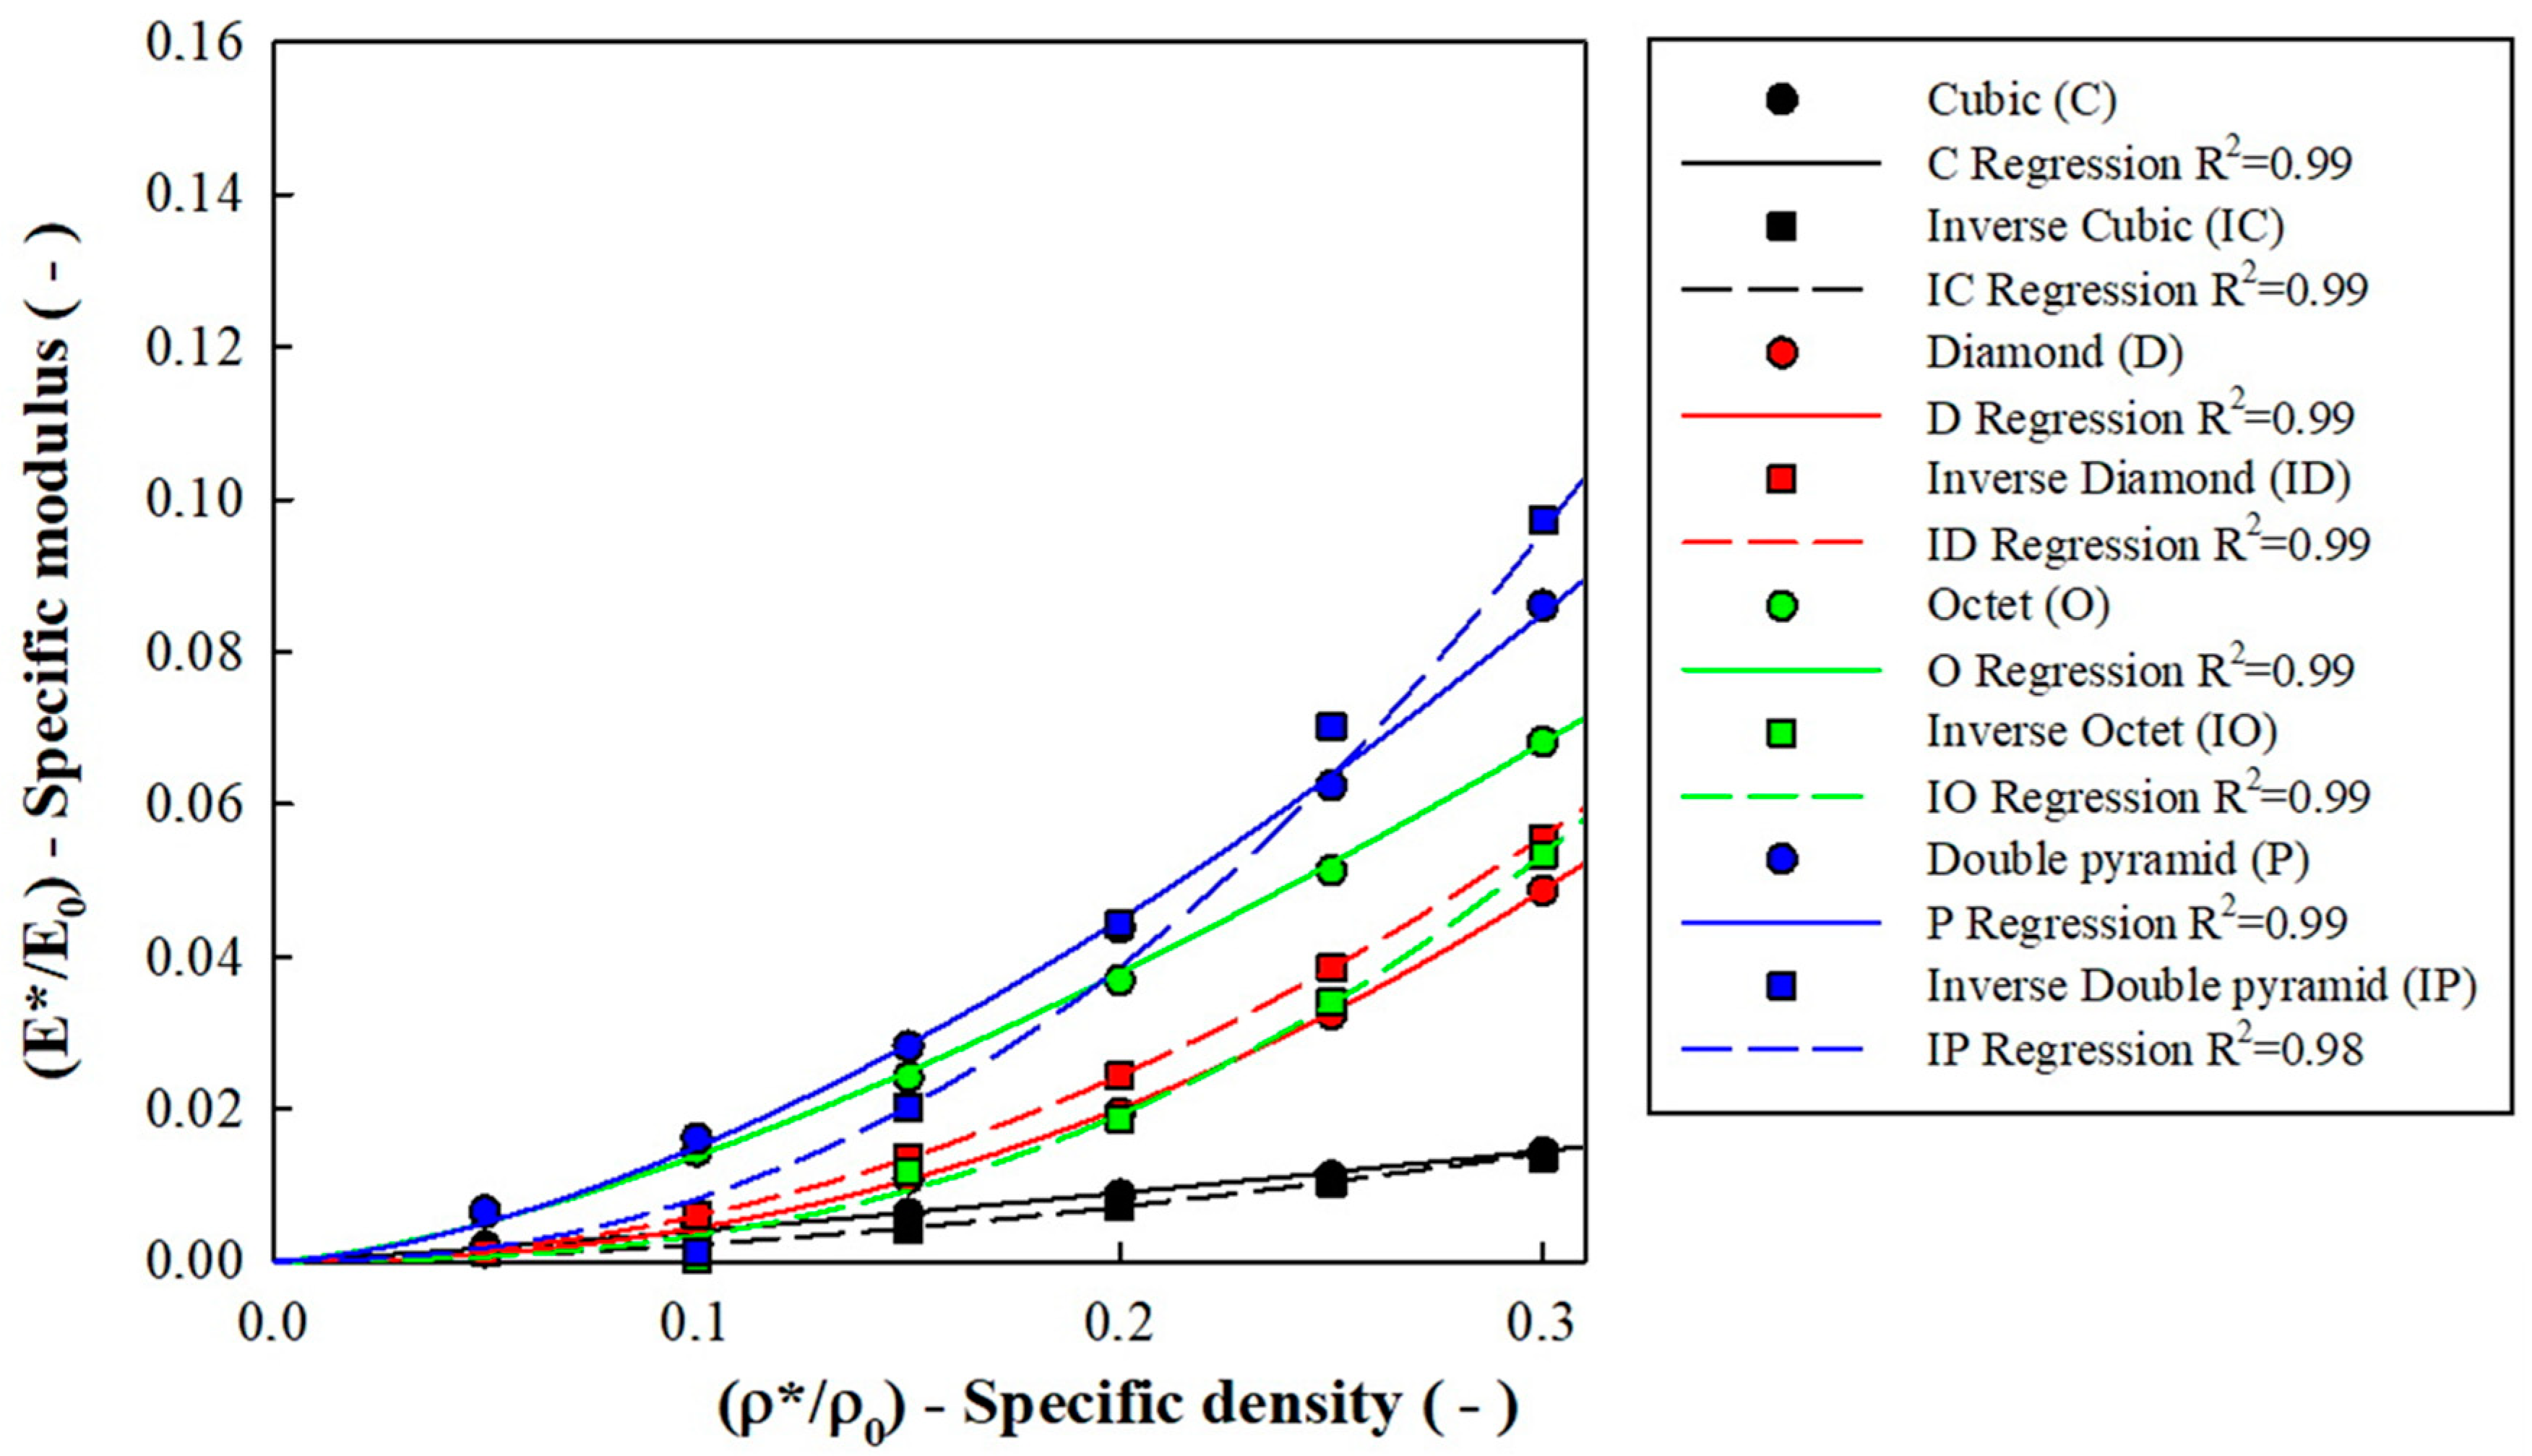
Figure 3 details the variation in the intrinsic stiffness (i.e., specific modulus—E*/E0) of the samples as their Specific density (ρ*/ρ0) is changed. An initial comparison between the Classic lattice designs and their Inverse topology counterpart shows that the Boolean operation generated a lattice design that deeply affects the mechanical behavior of some models. While the specific density-dependent modulus for Cubic-based topologies (i.e., classic vs. inverse Cubic lattices) does not change significantly, the same is not true for the remaining designs. Interestingly, the results in Figure 3 show that the Inverse Diamond topology presents higher values of Specific modulus for the full range of tested specific densities than the classic Diamond topology. These results suggest a new lattice topology with interesting mechanical properties, which has not been explored before.
The results on Octet and Double Pyramid models also show that the inverse topologies eventually display higher specific stiffness as the specific density is increased. This transition is located at ρ*/ρ0 = 0.37 and ρ*/ρ0 = 0.25, respectively, for the Octet and Double pyramid models, i.e., low values of porosity (i.e., void fraction).
The plots in Figure 3 (solid and dashed, respectively, for classic and inverse lattices) represent the non-linear regression plots for the Power law (Equation (2)) that describes the relation between the specific modulus (E*/ES) and specific density (ρ*/ρ0) [17] in cellular solids. The C and n variables in Equation (3) represent, respectively, the Proportionality and Growth factors. The analysis of the Growth factor may be used to identify the deformation behavior of the models, as lattices with n~1 are stretch (i.e., axially) dominated, while those with n~2 are known to be bending (i.e., flexure) dominated [17,18]. The correlation of the plots with the numerical results (R2 ≥ 0.98 for all topologies) shows that the regressions accurately fit the results.
E * E 0 = C ρ * ρ 0 n
Table 2 details the Proportionality (C) and Growth (n) factors that fit the Power law regressions for the classic and inverse lattices. Focusing on the Growth factor (n) of the classic lattices, it may be determined that the classic Cubic and Octet reveal stretch deformation mechanics (i.e., n~1). In contrast, the classic Diamond lattice is characterized by a bending-dominated deformation mechanism (i.e., n~2). It may also be determined that the classic Double pyramid model shows a hybrid (i.e., stretch+bending) deformation mechanism due to its n~1.5. Indeed, these results are fully aligned with the values determined by other publications for the same models [19,20,21] and, thus, the simulated results seem to be validated as they fully represent the expected outcomes for classic lattices.
By comparing these results with the Growth factors (n) that were determined for the Inverse lattices, it is shown that the inversion of the topologies promotes bending-dominated deformation mechanisms. Indeed, there is a predominant increase in the growth factor to n~2. This is especially visible in the results for the inverse Octet lattices (n = 1.15 → n = 2.52), however, as highlighted in Figure 3, this also implies a reduction in stiffness (i.e., E*/ES) for the correspondent specific density (ρ*/ρ0). Concerning the inverse Cubic and Double Pyramid lattices, the numerical results show that there is an increase in the Growth factor (n), implying that the bending-dominated component of the deformation mechanism is promoted. The results in Figure 3, show that this is not beneficial at lower values of specific density as these inverse lattices display lower stiffness than their classic counterpart.
The analysis of Table 2 for inverse Diamond lattices, as opposed to the remaining lattice designs, reveals that there is a slight reduction in the Growth factor (n = 2.19 → n = 1.99), while the deformation mechanism (i.e., bending) remains unchanged. In this case, the results in Figure 3, show that there is an effective increase in stiffness (E*/ES) for the inverse lattices in the full range of tested specific densities (ρ*/ρ0).
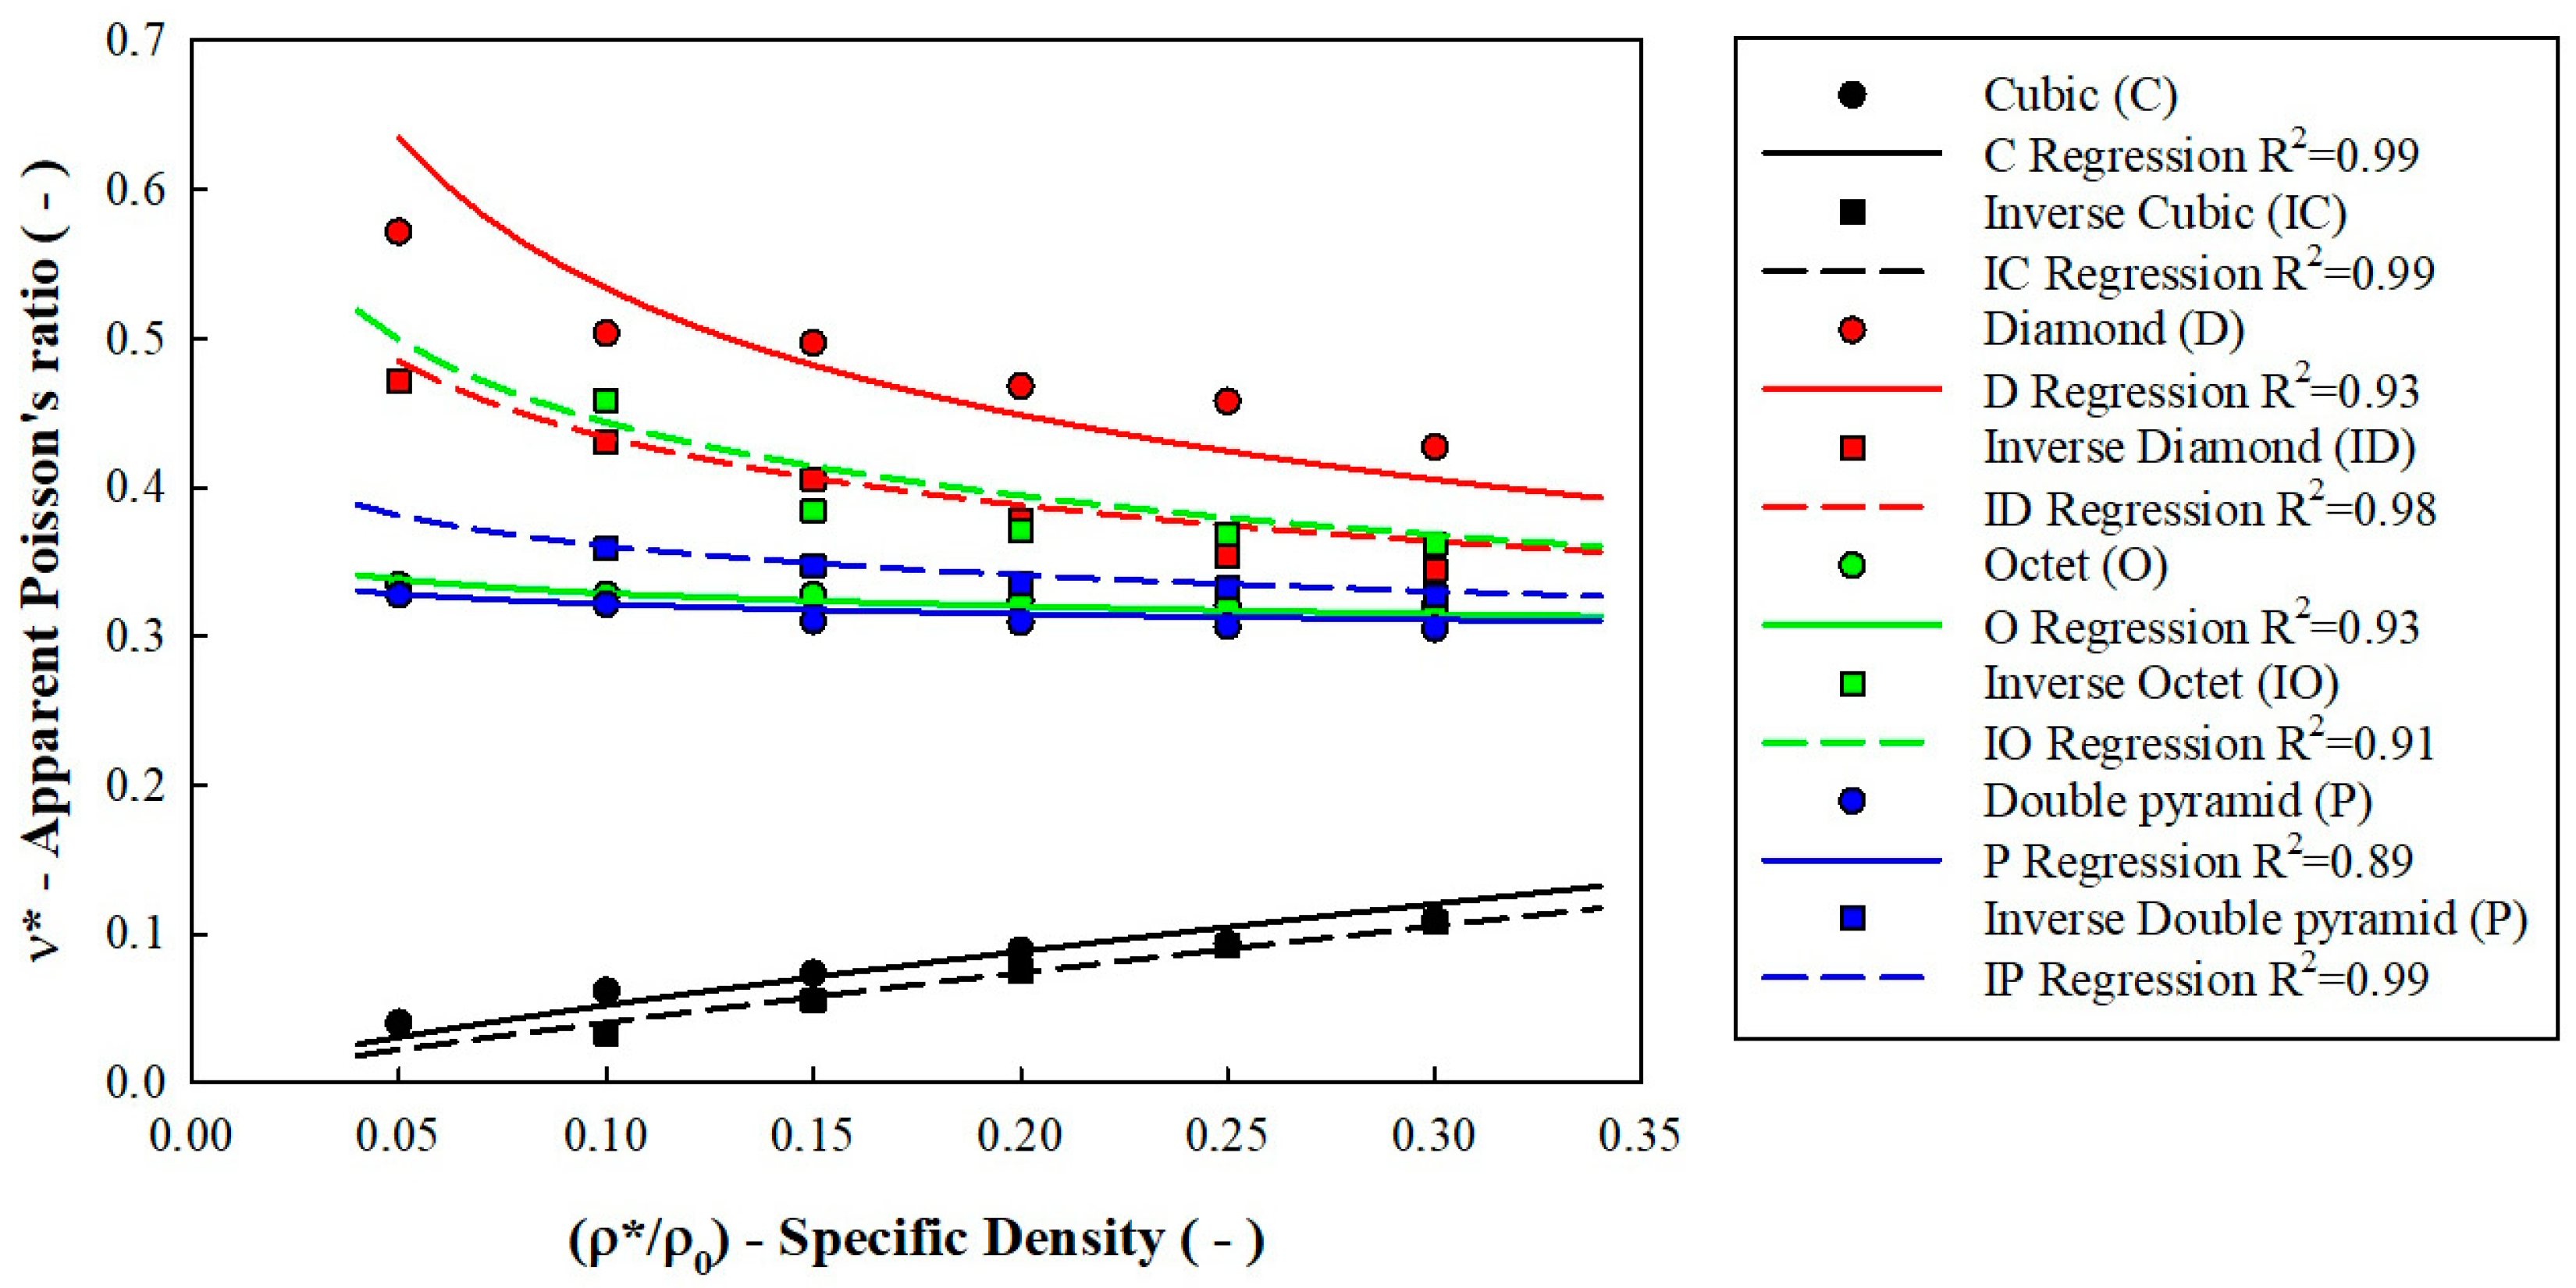
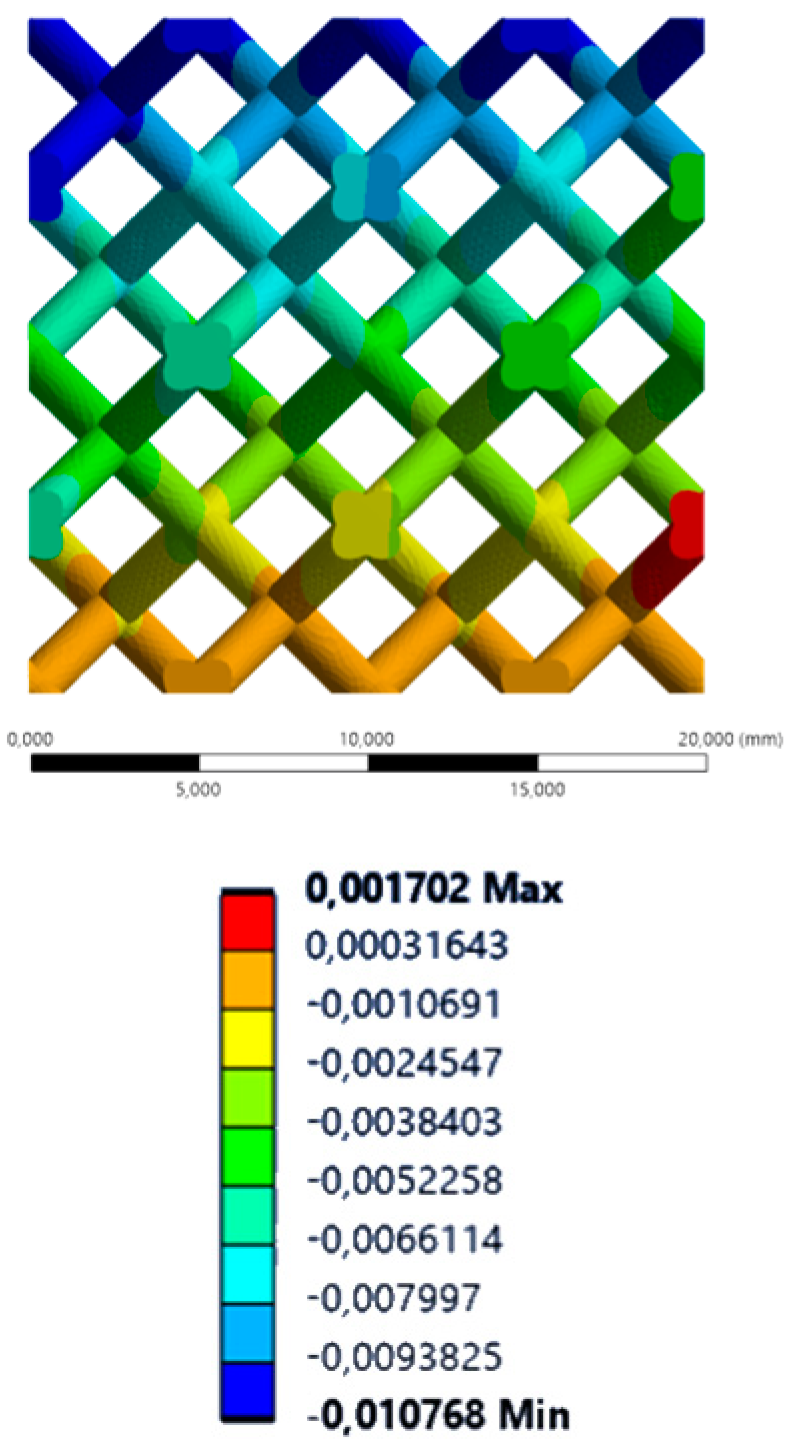
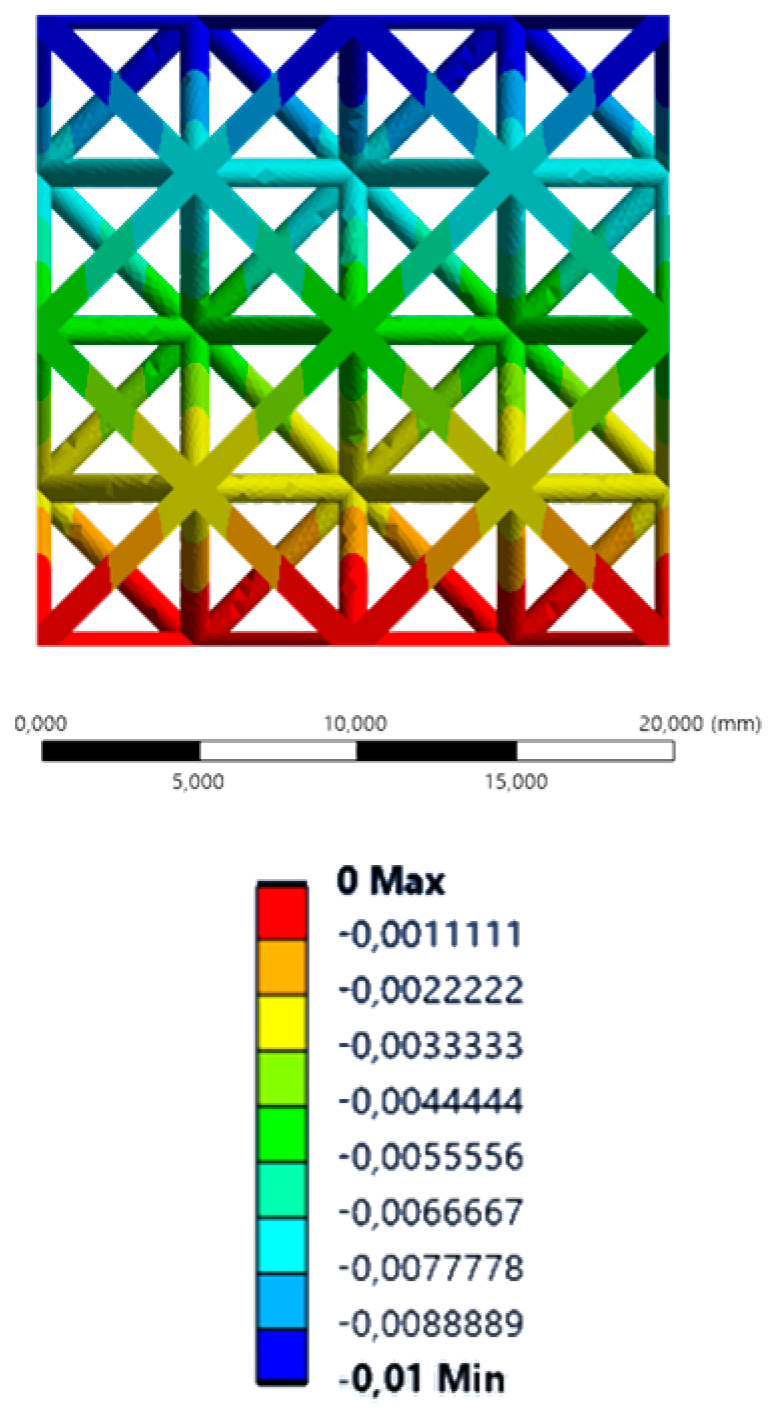
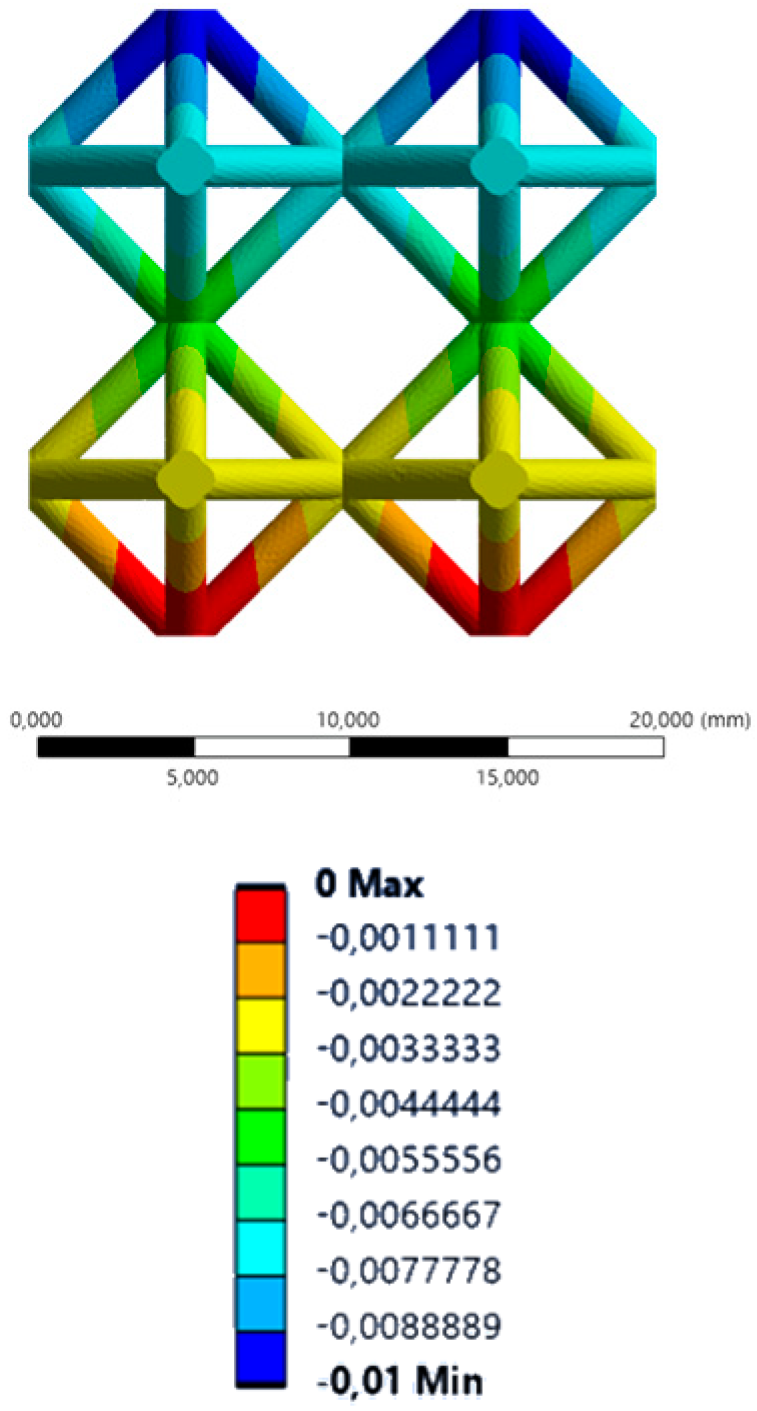
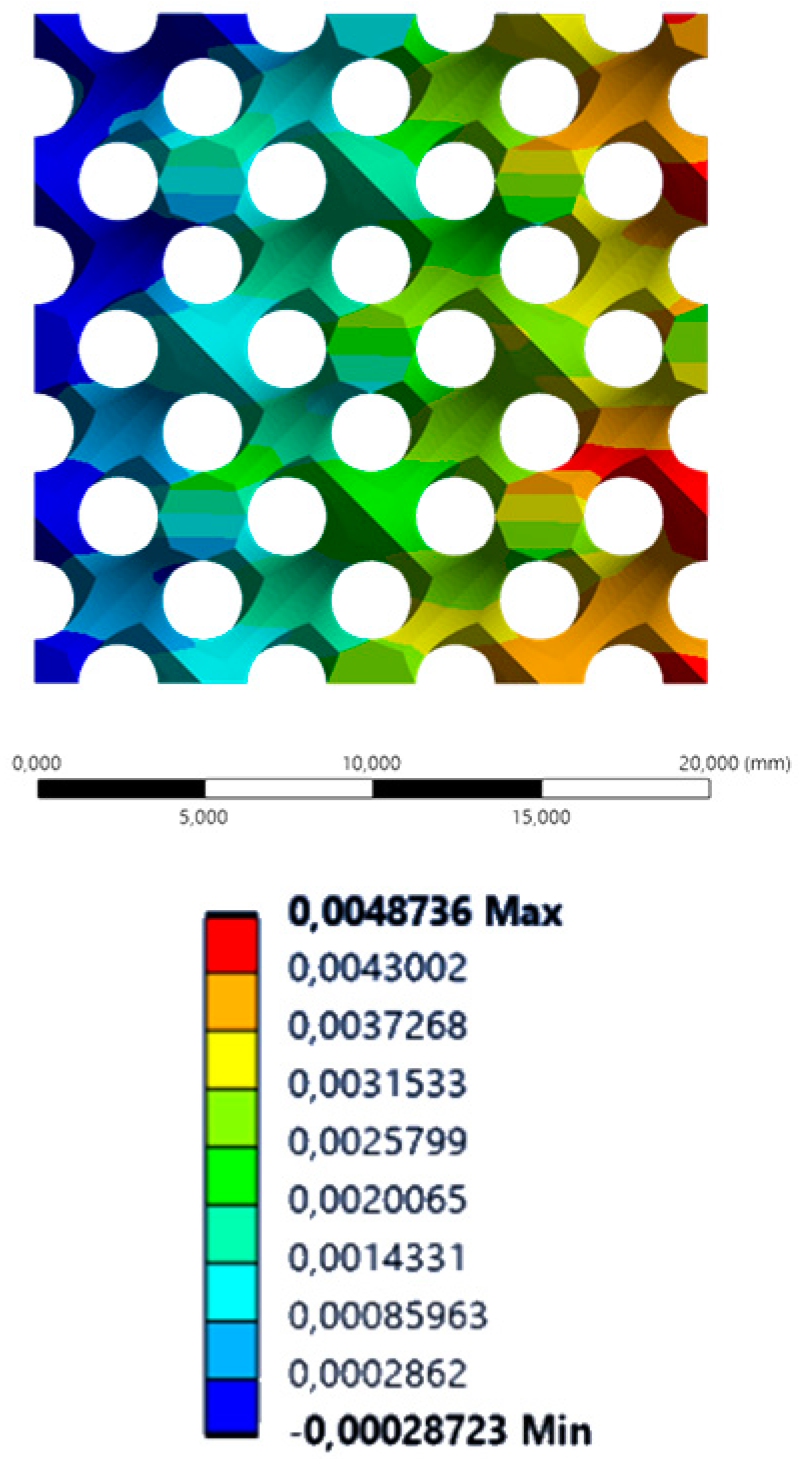
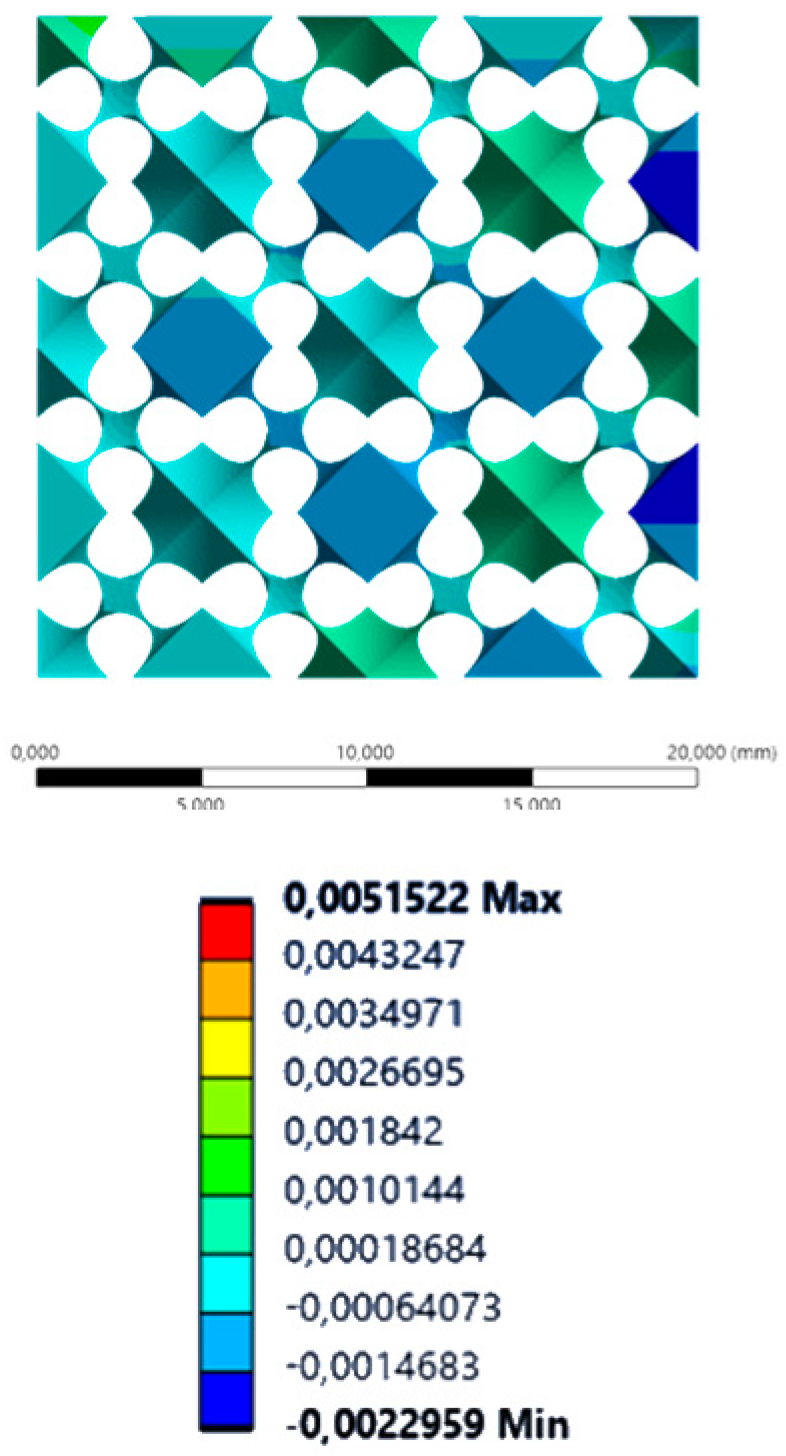
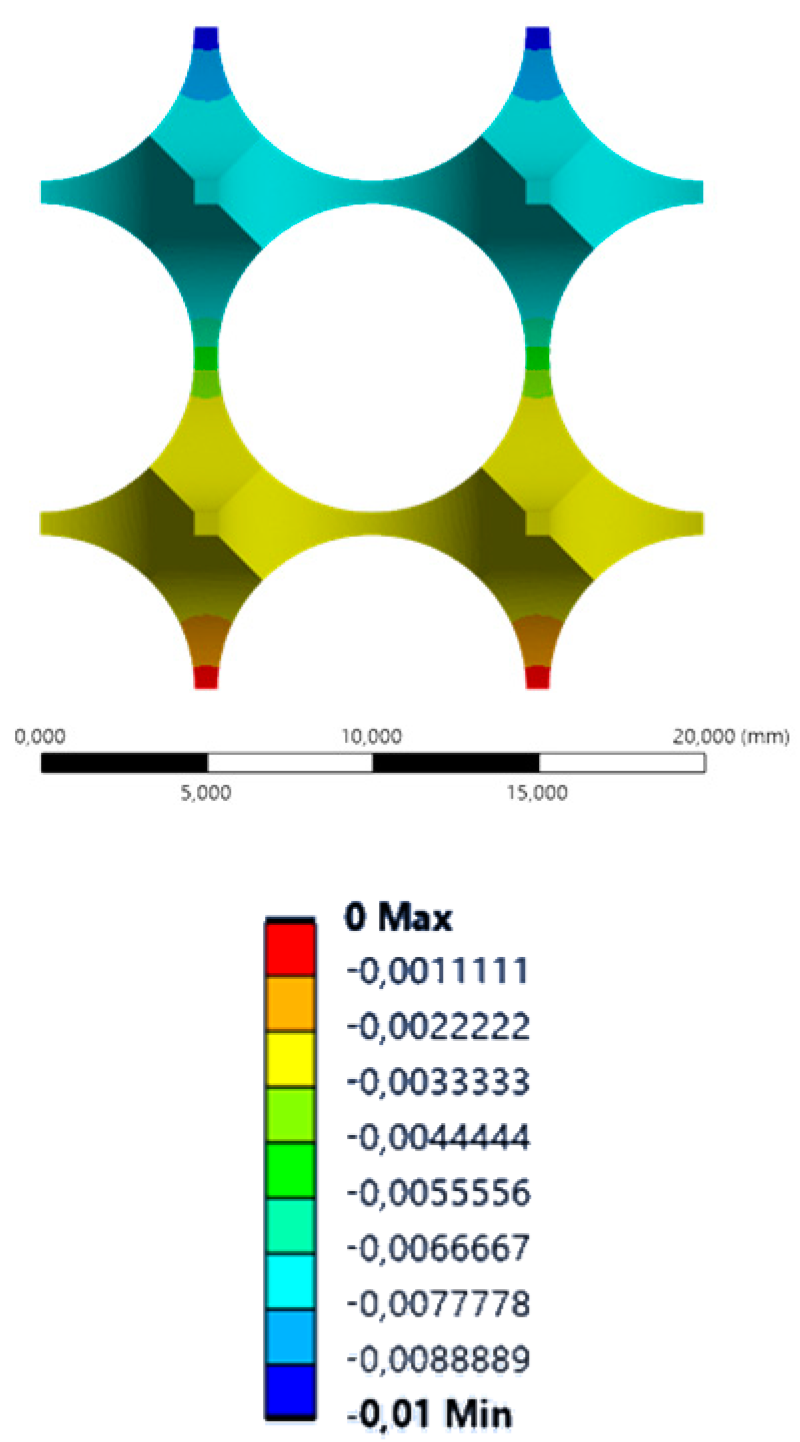
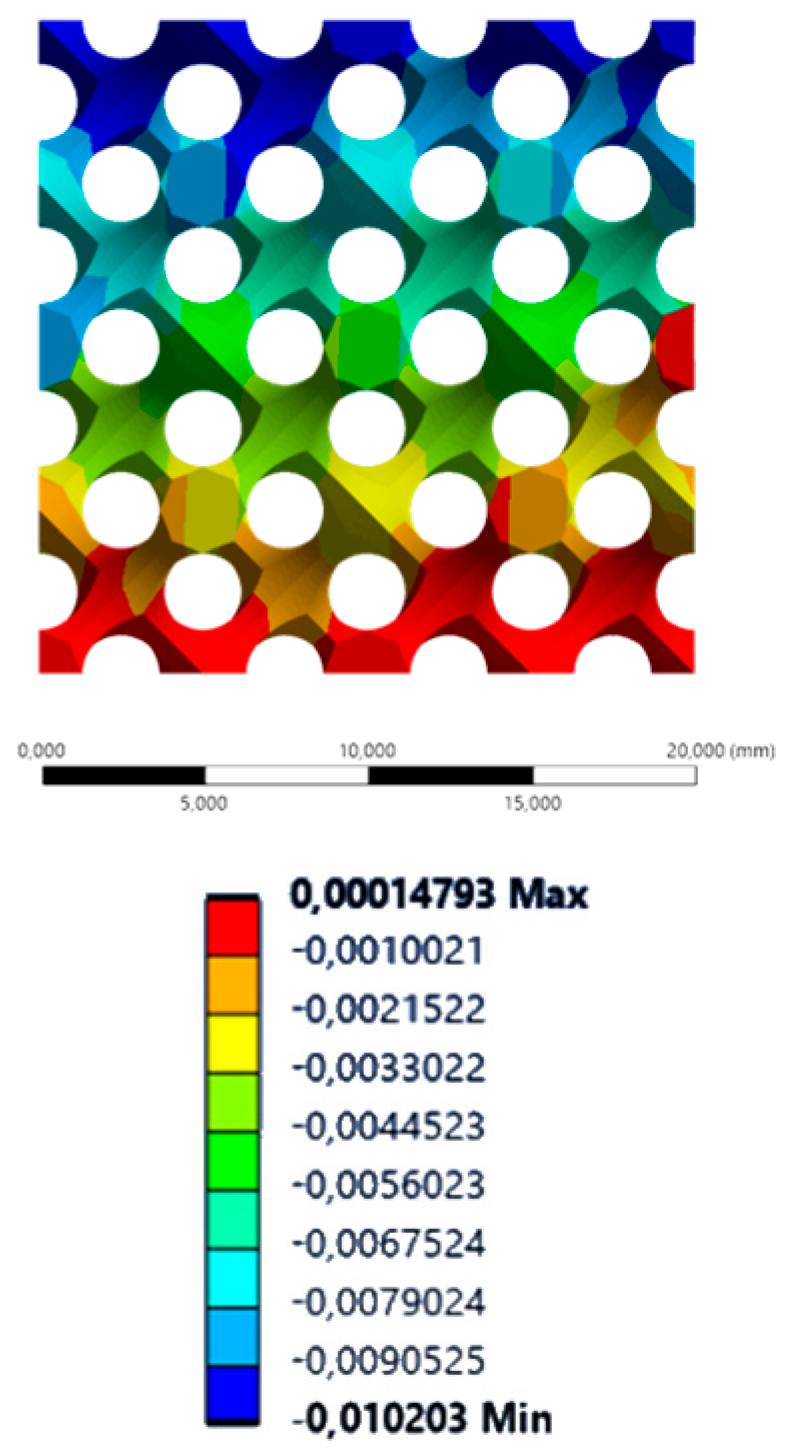
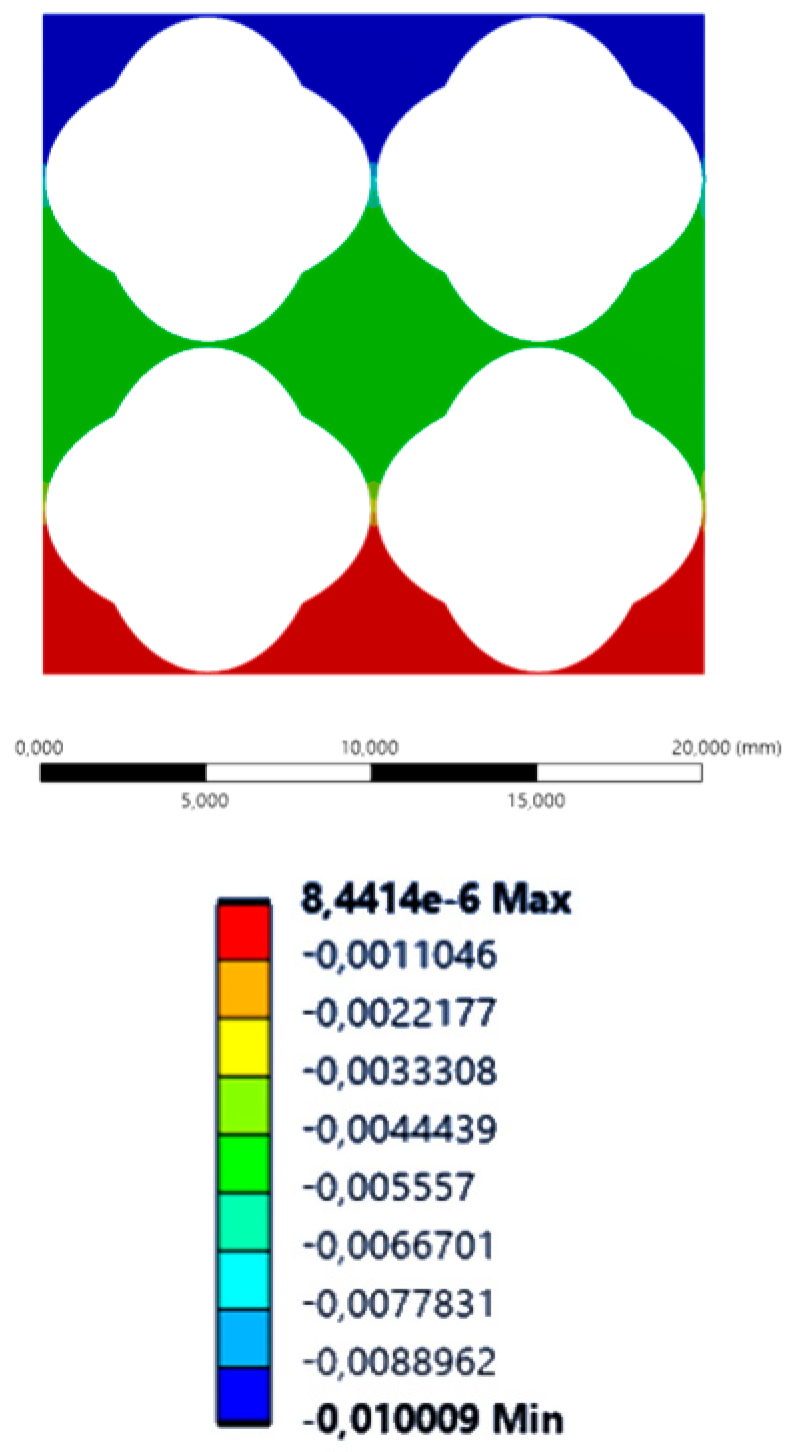
Table 3 and Table 4 detail the lateral (XX axis—Figure 2) and vertical (YY axis) displacements from the numerical results (example for ρ*/ρ0 = 0.1). These displacements were also used to determine the Apparent Poisson’s ratios (ν*) of the different lattice topologies depending on their Specific density, as displayed in Figure 4. Table 5 also highlights the power function regression parameter that correlates the normalized Poisson’s ratio (ν*/ν) to the Specific density, according to Equation (4).
ν * ν 0 = ρ * ρ 0 n
These results show that the inversion of classic Cubic Lattices does not have a significant impact on the Poisson’s ratio of these lattice topologies. For the analyzed Specific density ranges (0.05 to 0.30) the Cubic lattices show a range of Apparent Poisson’s ratio (ν*) from 0.04 to 0.09. Table 4 shows the Inverse Cubic lattices maintain low values of Apparent Poisson’s ratio (ν* = 0.03 to 0.11); however, they are more prone to increase this elastic constant with Specific Density, as shown in Table 5. This supports the hybrid deformation behavior suggested in Table 2.
As for Diamond lattice topologies, these display significantly higher Apparent Poisson’s ratios (0.43 to 0.57, for the analyzed Specific Density range) than the base material (ν0 = 0.30), due to their bending dominated deformation mechanism as highlighted in the displacements in Table 2 and Table 4. Figure 4 shows that the conversion into the Inverse Diamond lattice topology reduces the Apparent Poisson’s ratio (0.34 to 0.47, for the analyzed Specific Density range). However, Table 5 shows that classic Diamond lattices tend to the base material’s Poisson’s ratio at a higher rate (n = −0.25) than its Inverse Diamond counterpart (n = −0.16).
The Octet lattice topologies Apparent Poisson’s ratios tend to remain stable (ν* = 0.32 to 0.33, for the analyzed Specific Density range—according to Table 5, n = 0.02) for the analyzed Specific Densities as these values are close to the base material’s Poisson’s ratio (ν0 = 0.30). The conversion of these topologies into Inverse Octet lattices promotes a significant increase in the Apparent Poisson’s ratio (ν* = 0.36 to 0.46, for the analyzed Specific Density range). This is also accompanied by a change in the rate which this elastic constant decreases (n = −0.17—Table 5) as the Specific Density is raised.
The results also show that Double Pyramid lattices Apparent Poisson’s ratio (ν* = 0.30 to 0.32, for the analyzed Specific Density range) do not display a significant sensitivity (n = −0.03—Table 5) to changes in Specific Density, as these are close to the base material’s Poisson’s ratio (ν0 = 0.30). The conversion into an Inverse Double Pyramid topology promotes an increase in Apparent Poisson’s ratio (ν* = 0.33 to 0.36, for the analyzed Specific Density range). This also implies an increase in its sensitivity to changes in Specific Densities (n = −0.10—Table 5).

4. Conclusions

A novel class of cellular solids, here named Inverse lattices, were designed by performing a Boolean operation to obtain the solid topology that composes the void fraction of classic lattice topologies. While classic topologies have been thoroughly studied and their deformation mechanism is well known, using numerical analysis, it is shown that depending on the initial topology, the inverse topology may completely change the deformation mechanism. It is concluded that:
(i) Inverse Octet, Cubic, and Double pyramid lattices tend to change their deformation mechanism from a stretch to a bending-dominated mechanism. This effect is more prominent in inverse Octet lattices; however, this transition implies an overall reduction in stiffness (i.e., Specific modulus) in the lower ranges of specific density.
(ii) For inverse Diamond lattices, the transition generates a slight reduction in the bending-dominated fraction of the deformation mechanism. This promotes an overall increase in stiffness (i.e., Specific modulus) in the simulated Specific density relative to the classic Diamond topology. The Inverse Diamond lattices also tend to be less sensible to Specific Density changes than its classic topology counterpart. Considering this property, these inverse Diamond topologies may be a promising solution for future applications.
(iii) Future works will include a detailed analysis of the deformation mechanisms of these novel lattice topologies, including their fabrication and experimental characterization.

Author Contributions

Conceptualization, V.H.C.; methodology, V.H.C. and H.P.; software, H.P.; validation, V.H.C. and H.P.; formal analysis, V.H.C. and H.P.; investigation, V.H.C.; resources, H.P.; data curation, V.H.C.; writing—original draft preparation, V.H.C. and H.P.; writing—review and editing, V.H.C. and H.P.; visualization, V.H.C. and H.P.; supervision, V.H.C. and H.P. All authors have read and agreed to the published version of the manuscript.

Funding

This work is financed by National Funds through the Portuguese funding agency, FCT—Fundação para a Ciência e a Tecnologia, within project LA/P/0063/2020. DOI 10.54499/LA/P/0063/2020|https://doi.org/10.54499/LA/P/0063/2020. This research was supported by the project iRAIL Innovation in Railway Systems and Technologies Doctoral Programme funds and by national funds through FCT—Portuguese Foundation for Science and Technology and was developed on the aim of the Doctoral grant PD/BD/114096/2015.

Data Availability Statement

The raw data supporting the conclusions of this article will be made.

Conflicts of Interest

The author declares no conflicts of interest.

Abbreviations

The following abbreviations are used in this manuscript:
FEAFinite Element Analysis

References

  1. Bari, K. Design, Simulation, and Mechanical Testing of 3D-Printed Titanium Lattice Structures. J. Compos. Sci. 2023, 7, 32. [Google Scholar] [CrossRef]
  2. Hanks, B.; Berthel, J.; Frecker, M.; Simpson, T.W. Mechanical Properties of Additively Manufactured Metal Lattice Structures: Data Review and Design Interface. Addit. Manuf. 2020, 35, 101301. [Google Scholar] [CrossRef]
  3. Papageorgiou, V.; Tsongas, K.; Mansour, M.T.; Tzetzis, D.; Mansour, G. Mechanical Properties and Vibrational Behavior of 3D-Printed Carbon Fiber-Reinforced Polyphenylene Sulfide and Polyamide-6 Composites with Different Infill Types. J. Compos. Sci. 2025, 9, 59. [Google Scholar] [CrossRef]
  4. Cardoso, J.O.; Borges, J.P.; Velhinho, A. Structural Metamaterials with Negative Mechanical/Thermomechanical Indices: A Review. Prog. Nat. Sci. Mater. Int. 2021, 31, 801–808. [Google Scholar] [CrossRef]
  5. Gibson, L.J.; Ashby, M.F.; Harley, B.A. Cellular Materials in Nature and Medicine; Cambridge University Press: Cambridge, UK, 2010; ISBN 0-521-19544-6. [Google Scholar]
  6. Le Barbenchon, L.; Girardot, J.; Kopp, J.-B.; Viot, P. Multi-Scale Foam: 3D Structure/Compressive Behaviour Relationship of Agglomerated Cork. Materialia 2019, 5, 100219. [Google Scholar] [CrossRef]
  7. Sharma, D.; Hiremath, S.S. Bio-Inspired Repeatable Lattice Structures for Energy Absorption: Experimental and Finite Element Study. Compos. Struct. 2022, 283, 115102. [Google Scholar] [CrossRef]
  8. Yang, H.; Cao, X.; Zhang, Y.; Li, Y. 3D-Printed Bioinspired Cage Lattices with Defect-Tolerant Mechanical Properties. Addit. Manuf. 2024, 82, 104036. [Google Scholar] [CrossRef]
  9. Wang, W.; Feng, D.; Yang, L.; Li, S.; Wang, C.C.L. Topology Optimization of Self-Supporting Lattice Structure. Addit. Manuf. 2023, 67, 103507. [Google Scholar] [CrossRef]
  10. Song, W.; Zhao, L.; Liu, J.; Liu, S.; Yu, G.; Qin, B.; Xiao, L. Mechanical Behavior of Topology-Optimized Lattice Structures Fabricated by Additive Manufacturing. Materials 2025, 18, 3614. [Google Scholar] [CrossRef] [PubMed]
  11. Gongora, A.E.; Friedman, C.; Newton, D.K.; Yee, T.D.; Doorenbos, Z.; Giera, B.; Duoss, E.B.; Han, T.Y.-J.; Sullivan, K.; Rodriguez, J.N. Accelerating the Design of Lattice Structures Using Machine Learning. Sci. Rep. 2024, 14, 13703. [Google Scholar] [CrossRef] [PubMed]
  12. Wang, J.; Panesar, A. Machine Learning Based Lattice Generation Method Derived from Topology Optimisation. Addit. Manuf. 2022, 60, 103238. [Google Scholar] [CrossRef]
  13. Wu, C.; Luo, J.; Zhong, J.; Xu, Y.; Wan, B.; Huang, W.; Fang, J.; Steven, G.P.; Sun, G.; Li, Q. Topology Optimisation for Design and Additive Manufacturing of Functionally Graded Lattice Structures Using Derivative-Aware Machine Learning Algorithms. Addit. Manuf. 2023, 78, 103833. [Google Scholar] [CrossRef]
  14. Fan, J.; Zhang, L.; Wei, S.; Zhang, Z.; Choi, S.-K.; Song, B.; Shi, Y. A Review of Additive Manufacturing of Metamaterials and Developing Trends. Mater. Today 2021, 50, 303–328. [Google Scholar] [CrossRef]
  15. Lopes, V.; Puga, H.; Barbosa, J.; Teixeira, J.C. Effect of Yttria Mould Coating on the Investment Casting of AZ91D-1 Wt% CaO Magnesium Alloy. Int. J. Met. 2020, 14, 98–107. [Google Scholar] [CrossRef]
  16. Fernández-Morales, P.; Echeverrí, L.; Fandiño, E.M.; Zuleta Gil, A.A. Replication Casting and Additive Manufacturing for Fabrication of Cellular Aluminum with Periodic Topology: Optimization by CFD Simulation. Int. J. Adv. Manuf. Technol. 2023, 126, 1789–1797. [Google Scholar] [CrossRef]
  17. Ashby, M.F. The Properties of Foams and Lattices. Philos. Trans. R. Soc. A Math. Phys. Eng. Sci. 2006, 364, 15–30. [Google Scholar] [CrossRef] [PubMed]
  18. Hejripour, F.; Salam, M.A.; Bowlin, G.L.; Asadi, E. Laser-Based Powder-Bed Fusion Strategies for the Fabrication of Cellular Structures with a Fine Resolution. Materialia 2020, 13, 100829. [Google Scholar] [CrossRef]
  19. Maconachie, T.; Leary, M.; Lozanovski, B.; Zhang, X.; Qian, M.; Faruque, O.; Brandt, M. SLM Lattice Structures: Properties, Performance, Applications and Challenges. Mater. Des. 2019, 183, 108137. [Google Scholar] [CrossRef]
  20. Benedetti, M.; du Plessis, A.; Ritchie, R.O.; Dallago, M.; Razavi, S.M.J.; Berto, F. Architected Cellular Materials: A Review on Their Mechanical Properties towards Fatigue-Tolerant Design and Fabrication. Mater. Sci. Eng. R Rep. 2021, 144, 100606. [Google Scholar] [CrossRef]
  21. Arretche, I.; Matlack, K.H. On the Interrelationship Between Static and Vibration Mitigation Properties of Architected Metastructures. Front. Mater. 2018, 5, 68. [Google Scholar] [CrossRef]
Figure 1. Protocol to design inverse lattices using a Boolean operation– example of an octet-based topology with ρ*/ρ0 = 0.20. Note—Scale bar: 20 mm.
Jcs 09 00605 g001
Figure 2. Graphical representation of the structural simulation protocol (example of a double pyramid topology with ρ*/ρ0 = 0.20). Note—Scale bar: 20 mm.
Jcs 09 00605 g002
Figure 3. Specific modulus FEA results for classic and inverse lattices (respectively, ● and ■), including their correlation (R2) with the cellular solid power function (Solid and dashed lines-Equation (3)).
Jcs 09 00605 g003
Figure 4. Apparent Poisson’s ratio FEA results for classic and inverse lattices (respectively, ● and ■), including their correlation (R2) with the cellular solid power function (Solid and dashed lines-Equation (3)).
Jcs 09 00605 g004
Table 1. General representation of studied topologies (example for ρ*/ρ0 = 0.20).
Design
Approach
CubicDiamondOctetDouble
Pyramid
Classic lattice2 × 2 × 2
CAD model for FEA
(Scale bar: 20 mm)
Jcs 09 00605 i001Jcs 09 00605 i002Jcs 09 00605 i003Jcs 09 00605 i004
Single cell view
(Scale bar: 10 mm)
IsometricJcs 09 00605 i005Jcs 09 00605 i006Jcs 09 00605 i007Jcs 09 00605 i008
FrontJcs 09 00605 i009Jcs 09 00605 i010Jcs 09 00605 i011Jcs 09 00605 i012
Inverse lattice2 × 2 × 2
CAD model for FEA
(Scale bar: 20 mm)
Jcs 09 00605 i013Jcs 09 00605 i014Jcs 09 00605 i015Jcs 09 00605 i016
Single cell view
(Scale bar: 10 mm)
IsometricJcs 09 00605 i017Jcs 09 00605 i018Jcs 09 00605 i019Jcs 09 00605 i020
FrontJcs 09 00605 i021Jcs 09 00605 i022Jcs 09 00605 i023Jcs 09 00605 i024
Table 2. Power function regression parameters (C and n—Equation (2)) for the simulated models.
Design CubicDiamondOctetDouble Pyramid
Variable C—Proportionality factor
Classic lattice0.090.680.390.57
Inverse lattice0.110.651.111.42
Variable n—Growth factor
Classic lattice1.18 12.19 31.15 11.58 2
Inverse lattice1.70 21.99 32.52 32.24 3
1 Stretch deformation dominated (n~1); 2 Hybrid (stretch + bending) deformation (1 < n < 2); 3 Bending deformation dominated (n~2).
Table 3. Lateral (XX axis) and vertical (YY axis) displacements in classic lattices (example for ρ*/ρ0 = 0.10).
CubicDiamondOctetDouble Pyramid
XX axis (lateral)Jcs 09 00605 i025Jcs 09 00605 i026Jcs 09 00605 i027Jcs 09 00605 i028
YY axis (vertical)Jcs 09 00605 i029Jcs 09 00605 i030Jcs 09 00605 i031Jcs 09 00605 i032
Table 4. Lateral (XX axis) and vertical (YY axis) displacements in inverse lattices (example for ρ*/ρ0 = 0.10).
Inverse CubicInverse DiamondInverse OctetInverse Double Pyramid
XX axis (lateral)Jcs 09 00605 i033Jcs 09 00605 i034Jcs 09 00605 i035Jcs 09 00605 i036
YY axis (vertical)Jcs 09 00605 i037Jcs 09 00605 i038Jcs 09 00605 i039Jcs 09 00605 i040
Table 5. Power function regression parameter (n—Equation (3)) for the Apparent Poisson’s ratio.
Design CubicDiamondOctetDouble Pyramid
Classic lattice0.76−0.25−0.02−0.03
Inverse lattice0.87−0.16−0.17−0.10
Disclaimer/Publisher’s Note: The statements, opinions and data contained in all publications are solely those of the individual author(s) and contributor(s) and not of MDPI and/or the editor(s). MDPI and/or the editor(s) disclaim responsibility for any injury to people or property resulting from any ideas, methods, instructions or products referred to in the content.