Article

Characteristics of the Mesostructure of 3D-Printed PLA/GNP Composites

by
Mingju Lei
1,
Pengfei Liu
2,*,
Caiyun Niu
1,
Yiyi Xu
1,
Qiaowen Li
1,
Xueru Liang
1 and
Hongfeng Chen
1
1
School of Mechanical and Automotive Engineering, Guangxi University of Science and Technology, Liuzhou 545006, China
2
School of Ship, Ocean, Energy and Power Engineering, Wuhan University of Technology, No. 1178, Heping Avenue, Wuhan 430063, China
*
Author to whom correspondence should be addressed.
J. Compos. Sci. 2025, 9(11), 585; https://doi.org/10.3390/jcs9110585 (registering DOI)
Submission received: 24 September 2025 / Revised: 14 October 2025 / Accepted: 24 October 2025 / Published: 1 November 2025
(This article belongs to the Section Composites Modelling and Characterization)

Abstract

This study investigates the influence of 3D printing process parameters on the mesoscopic structure of polylactic acid/graphene nanoplatelet (PLA/GNP) composites. A computational fluid dynamics (CFD) multiphase flow model was developed to simulate the deposition, flow, and solidification behavior of the molten composite during the printing process. The effects of nozzle temperature (180–220 °C) and printing speed (30–50 mm/s) on the filament morphology, porosity, surface roughness, dimensional accuracy, and tensile strength of the printed parts were systematically examined. The accuracy of the model was validated by comparing simulation results with experimental data from scanning electron microscopy (SEM) observations and mechanical tests. The findings reveal that a higher nozzle temperature and a lower printing speed result in a flatter filament cross-section, which effectively reduces porosity and surface roughness, thereby enhancing print quality. Furthermore, a skewed deposition configuration achieves a denser structure and superior surface quality compared to an aligned configuration. The research uncovered a critical trade-off between dimensional accuracy and mechanical properties: low-temperature, low-speed conditions favor dimensional accuracy, whereas high-temperature, high-speed conditions improve tensile strength. A comprehensive analysis identified an optimal processing window at a nozzle temperature of 210–215 °C and a printing speed of 30–35 mm/s. This window balances performance, enabling the fabrication of composite parts with both high tensile strength (approximately 56 MPa) and excellent dimensional accuracy (root mean square deviation below 0.18 mm). This study provides a theoretical basis and process guidance for the application of 3D printing for high-performance PLA/GNP composites.

1. Introduction

Additive Manufacturing (AM), commonly known as 3D printing, is a disruptive manufacturing technology that is widely applied in fields such as aerospace, maritime engineering, biomedicine, automotive manufacturing, etc., due to its advantages of high design freedom, rapid prototyping, and efficient material utilization [1,2]. Among AM technologies, fused deposition modeling (FDM) has become one of the most extensively used methods owing to its low equipment cost, simple operation, and wide variety of available materials [3,4,5]. However, the FDM process involves complex thermodynamic and hydrodynamic phenomena, including melt flow, heat transfer, free surface evolution, and solidification shrinkage. These transient processes directly affect the internal mesoscopic structure (e.g., porosity, interlayer bonding) and macroscopic properties (e.g., dimensional accuracy, mechanical strength) of the printed parts [6,7,8]. Therefore, a thorough understanding of the physical mechanisms in the FDM process and the establishment of the intrinsic relationship between process parameters and part performance are crucial for achieving high-quality printing [9,10].
In recent years, to further expand the applications of FDM and enhance the performance of printed parts, researchers have turned their attention to the 3D printing of high-performance composite materials. Graphene nanoplatelets (GNPs), an emerging two-dimensional nanomaterial, have garnered significant interest due to their exceptional thermal, electrical, and mechanical properties [11,12]. By compounding GNPs with a thermoplastic polymer matrix like polylactic acid (PLA), the mechanical strength, thermal stability, and functionality of 3D-printed PLA parts can be significantly enhanced [13]. However, the addition of GNPs alters the rheological and thermal properties of the melt, making the conventional FDM process more complex [14,15]. Currently, research on the formation mechanism of the mesoscopic structure during the FDM printing of PLA/GNP composites is insufficient, particularly lacking systematic numerical simulations that can accurately model the entire process of melt deposition and solidification.
The advent of additive manufacturing has greatly advanced the fields of materials science and engineering. To optimize the FDM process, researchers have conducted extensive work from both experimental and numerical simulation perspectives. Early experimental studies on FDM processing and performance primarily relied on orthogonal or single-factor experiments to explore the impact of process parameters on the properties of printed parts. Studies have shown that parameters such as nozzle temperature, printing speed, layer thickness, and infill density have a determinant influence on the tensile strength, flexural strength, dimensional accuracy, and surface roughness of the final products [16]. Milovanovic et al. [17] investigated the effects of printing orientation, infill pattern, and layer height on the mechanical properties of polymers like PLA and PETG, finding that an infill pattern aligned with the stress axis yields superior strength and strain performance. Prakasan et al. [18] systematically analyzed the influence of printing speed, infill rate, layer thickness, and layer width on the tensile properties of PLA specimens, concluding that infill rate significantly affects tensile strength, while layer thickness has the greatest impact on elongation. These studies have provided valuable experimental data for FDM process optimization. However, purely experimental methods are time-consuming and labor-intensive, and they make it difficult to directly observe the flow, spreading, and interlayer fusion of filaments at the micro-scale [19,20].
To overcome the limitations of experimental research, numerical simulation techniques, particularly computational fluid dynamics (CFD), have been widely applied to study the FDM process [21,22,23]. CFD can accurately simulate multiphysics-coupled problems, such as the flow of melt in the nozzle, the formation of a free surface after extrusion, and heat transfer with previously deposited filaments. The early modeling efforts made pioneering contributions to understanding the fundamental physical phenomena in this process. In the area of fluid flow and heat transfer simulation, Serdeczny et al. [24] conducted CFD simulations of polymer flow in the hot-end during material extrusion AM, revealing a melt recirculation zone between the nozzle wall and the incoming filament. Comminal et al. [8] used a CFD model to simulate the material deposition process in FDM, finding that the final shape of the filament depends on the normalized layer thickness and printing speed, and pointed out that CFD simulation can help optimize the toolpath to improve dimensional accuracy. Seta et al. [25] investigated the non-Newtonian rheological and thermal behavior of the melt inside the nozzle during the FDM process using numerical methods. Furthermore, Samy et al. [26] employed the finite element method to predict the thermal field and residual stresses during the FDM printing process, emphasizing their impact on the dimensional stability and mechanical properties of the final product. For free surface tracking, the FDM process involves a two-phase flow of melt and air, making it crucial to accurately track the interface. Common methods include the volume of fluid (VOF) method and the level set method. The VOF method is known for tracking sharp interfaces, while the level set method is more advantageous in handling topological changes [27,28]. To combine the advantages of both, Serdeczny et al. [29] proposed the coupled level set–volume of fluid (CLS-VOF) method to more accurately track the free surface during additive manufacturing, which is essential for simulating complex filament spreading and interlayer fusion processes. These foundational models mainly focus on the behavior of a single filament, and can accurately predict the cross-sectional morphology of a single filament in a pure polymer system, and reveal how its final shape depends on process parameters such as printing speed and temperature.
Although numerous studies have been conducted to explore the FDM forming process and its impact on the properties of the products, there are still some deficiencies [30]. Existing CFD simulations have largely focused on pure polymer materials, with relatively few studies on the molten deposition process of nanocomposites like PLA/GNPs. In particular, there is a lack of a comprehensive, systematic model that fully couples non-Newtonian fluid characteristics, heat transfer, free surface evolution, and the solidification process. While some studies have analyzed the properties of PLA/GNP-printed parts from an experimental perspective, few have been able to systematically elucidate through numerical simulation how process parameters determine the final porosity, surface roughness, dimensional accuracy, and tensile strength by influencing the mesostructure behavior of the filament. Additionally, the impact of the thermal history in the FDM process on the microstructure and macroscopic mechanical properties of composites requires more in-depth quantitative research [31,32]. It is worth noting that in our previous research, we successfully developed and verified a CFD model that can accurately predict the cross-sectional morphology of a “single filament” during the fused deposition process, and preliminarily explored the influence of process parameters on the geometric shape and macroscopic mechanical properties of the single filament [33]. However, the previous models were limited to the study of “single filament” behavior and were unable to capture the complex mesostructure features resulting from the interaction of multiple filaments, as well as the structural defects that determine the quality of the final component, such as the porosity and surface roughness between the filaments. In order to truly understand and optimize the overall quality of the final printed component, the research must expand from the behavior of “single filament” to the complete mesostructure composed of “multiple filaments and multiple layers of stacking”. This study is a crucial deepening and expansion based on the previous work, and its unique contribution lies in: Firstly, the model expands from the two-dimensional “line” to the three-dimensional “body”; we conducted simulations and analyses on the stacking process of multiple filament deposition and explored the influence of printing parameters on the mesostructure of the formed objects. Secondly, we quantitatively analyzed the porosity and surface roughness of the mesostructure under two typical deposition strategies (alignment and interlacing), which are key quality indicators that cannot be covered by the research on single filaments. Finally, this study aims to establish a more complete and systematic intrinsic relationship between process parameters, mesostructure defects, and macroscopic properties.

2. Materials and Methods

2.1. Preparation of PLA/GNP Composites

The PLA/GNP composite material used in this study was prepared based on our prior work. According to our previous research, a PLA/GNP composite with a GNP content of 2 wt% exhibits optimal mechanical and thermal stability properties [33,34]. In order to achieve a balance between the optimal mechanical performance and the stability of FDM printing, a 2 wt% GNP ratio enables GNPs to form an effective reinforcing network, maximizing the strength of the composite material, while avoiding the sharp increase in melt viscosity and nozzle blockage caused by excessive GNP content, thus ensuring the stability and accuracy of the FDM process. Therefore, this material was selected for numerical simulations and printing experiments in this study. The preparation process was as follows: First, PLA pellets were dried in a vacuum oven at 60 °C for 4 h to remove moisture. Concurrently, GNP powder was dried in a vacuum oven at 100 °C for 2 h. The dried PLA pellets and GNP powder were then mixed at a mass ratio of 98:2. To ensure uniform dispersion of GNPs in the PLA matrix, a melt blending method was employed using a twin-screw extruder (TSE-20, Beijing Guanyuan Technology Co., Ltd., Beijing, China) at 180 °C to extrude and pelletize the mixture, yielding PLA/GNP composite pellets. Finally, the composite pellets were fed into a single-screw extruder (Krauss Maffei Berstorff ZE 25, Shanghai Lianhang Electromechanical Technology Co., Ltd., Shanghai, China) and extruded at 190 °C to produce a PLA/GNP composite filament with a diameter of 1.75 mm. The filament preparation process was strictly controlled to ensure a uniform diameter, thereby meeting the feeding requirements for FDM printing. Figure 1 shows the SEM image of the fracture surface of the starting feedstocks. It can be seen that in the PLA/GNP composite pellets prepared by twin-screw extrusion and blending, the GNPs are aggregated in a sheet-like manner. After being processed by single-screw secondary extrusion to produce a 1.75 mm filament feedstock, the GNPs were uniformly dispersed in the PLA matrix, and no large-scale agglomeration occurred. The fine GNP layers exhibit certain orientationally uniform dispersion in the extrusion direction, which ensures the material has stable rheological properties on a macroscopic scale, enabling our CFD simulation to focus on studying the local flow, spreading, and curing behaviors during the deposition process and their influence on the mesoscopic structure.

2.2. CFD Simulation of 3D-Printed PLA/GNPs

This study introduces a numerical simulation method for 3D printing of polymer composites based on computational fluid dynamics (CFD). A schematic of the 3D printing process for polymer composites is shown in Figure 2a, where the thermoplastic PLA/GNP filament is melted into a semi-liquid state within the print head nozzle, extruded along a specific path, and deposited layer by layer onto a build plate. As the temperature decreases and viscosity increases, the molten PLA/GNP material solidifies and welds together, ultimately forming a component with a complex structure and special functionality. As indicated by the blue arrows, the print head moves horizontally at a controlled speed, while the build plate is fixed in the vertical direction. The numerical simulation treats the molten PLA/GNP composite and the surrounding air as two immiscible fluid phases, modeled within an Eulerian framework. The three-dimensional geometry of the computational model is shown in Figure 2b. The computational domain is a 1.2 × 2.4 × 4 mm hexahedral box, containing a simplified print nozzle, a build plate, and the gap between them. The nozzle is modeled as a wall-less cylindrical tube with an inner diameter of 0.4 mm and a length of 1.2 mm. In the simulation, the molten PLA/GNP material enters the nozzle at a constant flow rate of 5.024 mm3/s. The nozzle is fixed at a distance of 0.38 mm from the build plate, which represents the printing layer height. The top and side walls of the computational domain are set as outlet boundaries, allowing material and air to flow freely. The build plate is treated as a rigid, non-adiabatic wall that permits heat transfer, and a no-slip boundary condition is applied at the build plate and nozzle walls. To simplify the computation, the model adopts a relative motion configuration: the nozzle remains stationary while the build plate moves at a constant printing speed, Vn. This approach neglects acceleration and effectively simulates the relative motion between the nozzle and the build plate during the actual printing process. The numerical simulation focuses on the deposition and deformation process of the molten PLA/GNP composite on the moving substrate. The nozzle temperature is Tn, which is the printing temperature.

2.2.1. Governing Equations

The numerical simulation of the deposition process for 3D-printed PLA/GNP composites includes the flow of molten PLA/GNPs, free surface tracking, a rheological model for PLA/GNP viscosity, and a heat transfer model. Since the flow velocity of the PLA/GNP melt during the printing process is very low and the pressure is not excessively high, both the PLA/GNP melt and the gas can be treated as incompressible fluids. Under the assumption of an incompressible two-phase flow containing the PLA/GNP melt and surrounding air, the dynamic flow field is governed by the continuity equation, momentum equation, and energy equations, which can be unified into a generalized form [35]:
  ·   u   =   0
( ρ ( ϕ ) u ) t +   ·   ( ρ ( ϕ ) uu )   ·   ( 2 η ( ϕ ) D ) = p   +   H ε ( ϕ )   ·   ( 2 ( β     1 ) η ( ϕ ) D ) + H ε ( ϕ )   ·   τ
( ρ ( ϕ ) C ν ( ϕ ) T ) t +   ·   ( ρ ( ϕ ) C ν ( ϕ ) u T )     ·   ( κ ( ϕ ) T ) =   H ε ( ϕ ) τ ij   :   v i
where u is the velocity vector; ρ is the density, including buoyancy effects from thermal expansion of air; η is the viscosity field; p is the pressure field; T , C , and κ represent temperature, specific heat capacity, and thermal conductivity, respectively; ϕ is the Level set (LS) function; and D is the rate of deformation tensor, calculated as follows:
D   =   1 2   ( u   +   u T )

2.2.2. Heat Transfer Model

In the numerical analysis of heat transfer during the 3D printing deposition of PLA/GNPs, heat transfer primarily consists of two components: heat conduction between the PLA/GNP melt and the build plate, and heat convection between the PLA/GNP melt and the air. Within the computational domain, heat is introduced with the deposition of the PLA/GNP melt and is dissipated through conduction and convection. The equation for heat conduction is as follows:
Q 1   =   k p   A   ( T     T   ) / δ
where Q 1 is the heat transfer rate by conduction; k p is the thermal conductivity of the PLA/GNPs melt; A is the contact area; T is the initial melt temperature; T is the critical solidification temperature of the melt; and δ is the element thickness.

2.2.3. Cross-WLF Rheology Model

Typically, the viscosity of thermoplastics in the 3D printing process depends on temperature, shear rate, and pressure. In this simulation, since the deposition process is non-isothermal and the PLA/GNP melt undergoes significant temperature changes after exiting the nozzle, even experiencing a glass–liquid transition, temperature is the primary factor affecting deposition flow. Furthermore, we assume that the effect of pressure changes on the deposition flow is negligible. This is because the gap between the nozzle exit and the moving substrate is small, making the pressure inside the nozzle close to the ambient pressure after deposition. To accurately describe the viscosity changes of the molten PLA/GNPs with temperature and shear rate during cooling and solidification, this simulation employs the generalized cross-WLF model. This model effectively characterizes the viscosity properties of polymer composites, providing a reliable rheological basis for CFD simulations.
η m   ( T   ,   γ ˙ ) = η 0 1 + ( η 0   γ ˙ v   τ * ) 1 n
where T is the temperature of the PLA/GNPs melt; τ * is the critical stress for the onset of shear thinning; n is the power-law index; η 0 is the zero-shear-rate viscosity; and γ ˙ is the shear strain rate, which can be expressed as:
γ ˙   =   2   D   :   D
The viscosity η 0 of the PLA/GNP melt at zero shear rate is a function of temperature and pressure, which can be expressed as follows:
η 0 T     =   D 1 exp   A 1 T     T * A 2   +   D 3   p   +   T     T *  
where T * is the glass transition temperature of the melt; A 1 is a model parameter characterizing the temperature dependence of the zero-shear-rate viscosity at the glass transition temperature; A 2 is a model parameter determined by the type of PLA/GNP melt; D 1 is a model constant for the viscosity of the PLA/GNP melt; D 2 is a model constant for the glass transition temperature of the PLA/GNP melt; and D 3 is a model constant characterizing the pressure dependence of the glass transition temperature.
In this study, the parameters of the cross-WLF model were obtained through experimental measurements and curve fitting. Specifically, the TA Instruments AR 2000ex (Newcastle, DE, USA) rheometer was used to measure the rheological properties of the PLA/GNP composite. At a series of constant temperatures of 180 °C, 190 °C, 200 °C, 210 °C, and 220 °C, we applied different shear rates ranging from 0.1 s−1 to 1000 s−1 to the molten composite and measured the corresponding steady-state shear viscosity ( η ). For the cross-model constants, we performed a nonlinear fit on the experimental data of viscosity ( η ) and shear rate ( γ ˙ ) at the highest temperature of 220 °C. Through the fitting, we obtained the shear thinning index n and the critical shear stress τ * . These two parameters are assumed to be material constants that are independent of temperature. For the WLF model constants, the glass transition temperature Tg of the PLA/GNP composite was determined through DSC (differential scanning calorimetry) experiments. Based on the experimental values of zero shear viscosity η 0 T   at different temperatures, these data points were fitted to the WLF equation using the least squares method, and finally, D 1 (reference viscosity), A 1 , and A 2 were determined [33,34].
In this numerical model, the cross-WLF parameters used to calculate the PLA/GNP viscosity are as follows: A 1   =   20.194 , A 2   =   51.6 , D 1   =   3.31719   ×   10 9 , D 2   =   100 . Since the effect of pressure difference within the PLA/GNP melt on viscosity is minimal, the pressure effect is neglected, thus D 3   =   0 . Considering that the viscosity is very high at low temperatures and low shear rates, a limiting viscosity of η =   8000   Pa · s , where Pa·s is used for the PLA/GNP melt in the model. This value is sufficiently large to prevent excessively high viscosity values at low temperatures and shear rates while ensuring the solidification of the injected material. Table 1 summarizes the material properties of the PLA/GNP composite and air used in the numerical calculations. Table 1 summarizes the material properties of the PLA/GNP composite and air used in the numerical calculations.

2.2.4. Free Surface Reconstruction Based on VOF Scheme

To accurately capture the free surface between the molten PLA/GNP composite and the air, this study employs the volume of fluid (VOF) method. The VOF method tracks the interface by introducing a volume fraction function, α , in each grid cell, where α = 1 indicates the cell is completely filled with melt, α = 0 indicates it is completely filled with air, and 0 < α < 1 indicates the cell is at the interface. The phase equation for VOF can be written as follows:
α t   +   u · α   =   0
where u is the fluid velocity vector, and t is time. This method effectively handles large deformations and topological changes of the free surface.

2.3. Implementation and Validation of Mesostructure Numerical Calculation

Unidirectional parallel deposition is the most typical deposition pattern in material extrusion 3D printing. Within this pattern, aligned and skewed configurations are the two most commonly used deposition strategies. This study simulates both single-filament and multi-filament deposition processes using numerical methods to predict the cross-sectional morphology of a single filament and the mesostructure of a representative volume element (RVE) formed by multi-filament parallel deposition. In the single-filament simulation, the build plate is flat and moves at a speed Vn relative to the nozzle, which corresponds to the printing speed. The nozzle temperature Tn is set as the printing temperature, and both are treated as variables to study their effect on the filament cross-sectional morphology. In the simulations, the build plate speeds (Vn) were set to 30, 40, and 50 mm/s. The nozzle and extruded material temperatures (Tn) were set to 180 °C, 200 °C, and 220 °C. The initial air temperature was set to 25 °C, the feed rate of the molten PLA/GNP composite was maintained at 5.024 mm3/s, and the build plate temperature was kept at 40 °C. The gap along the z-axis between the nozzle and the build plate was g (0.4 mm), which can be considered the printing layer thickness. Table 2 shows the printing parameters selected for the numerical simulation.
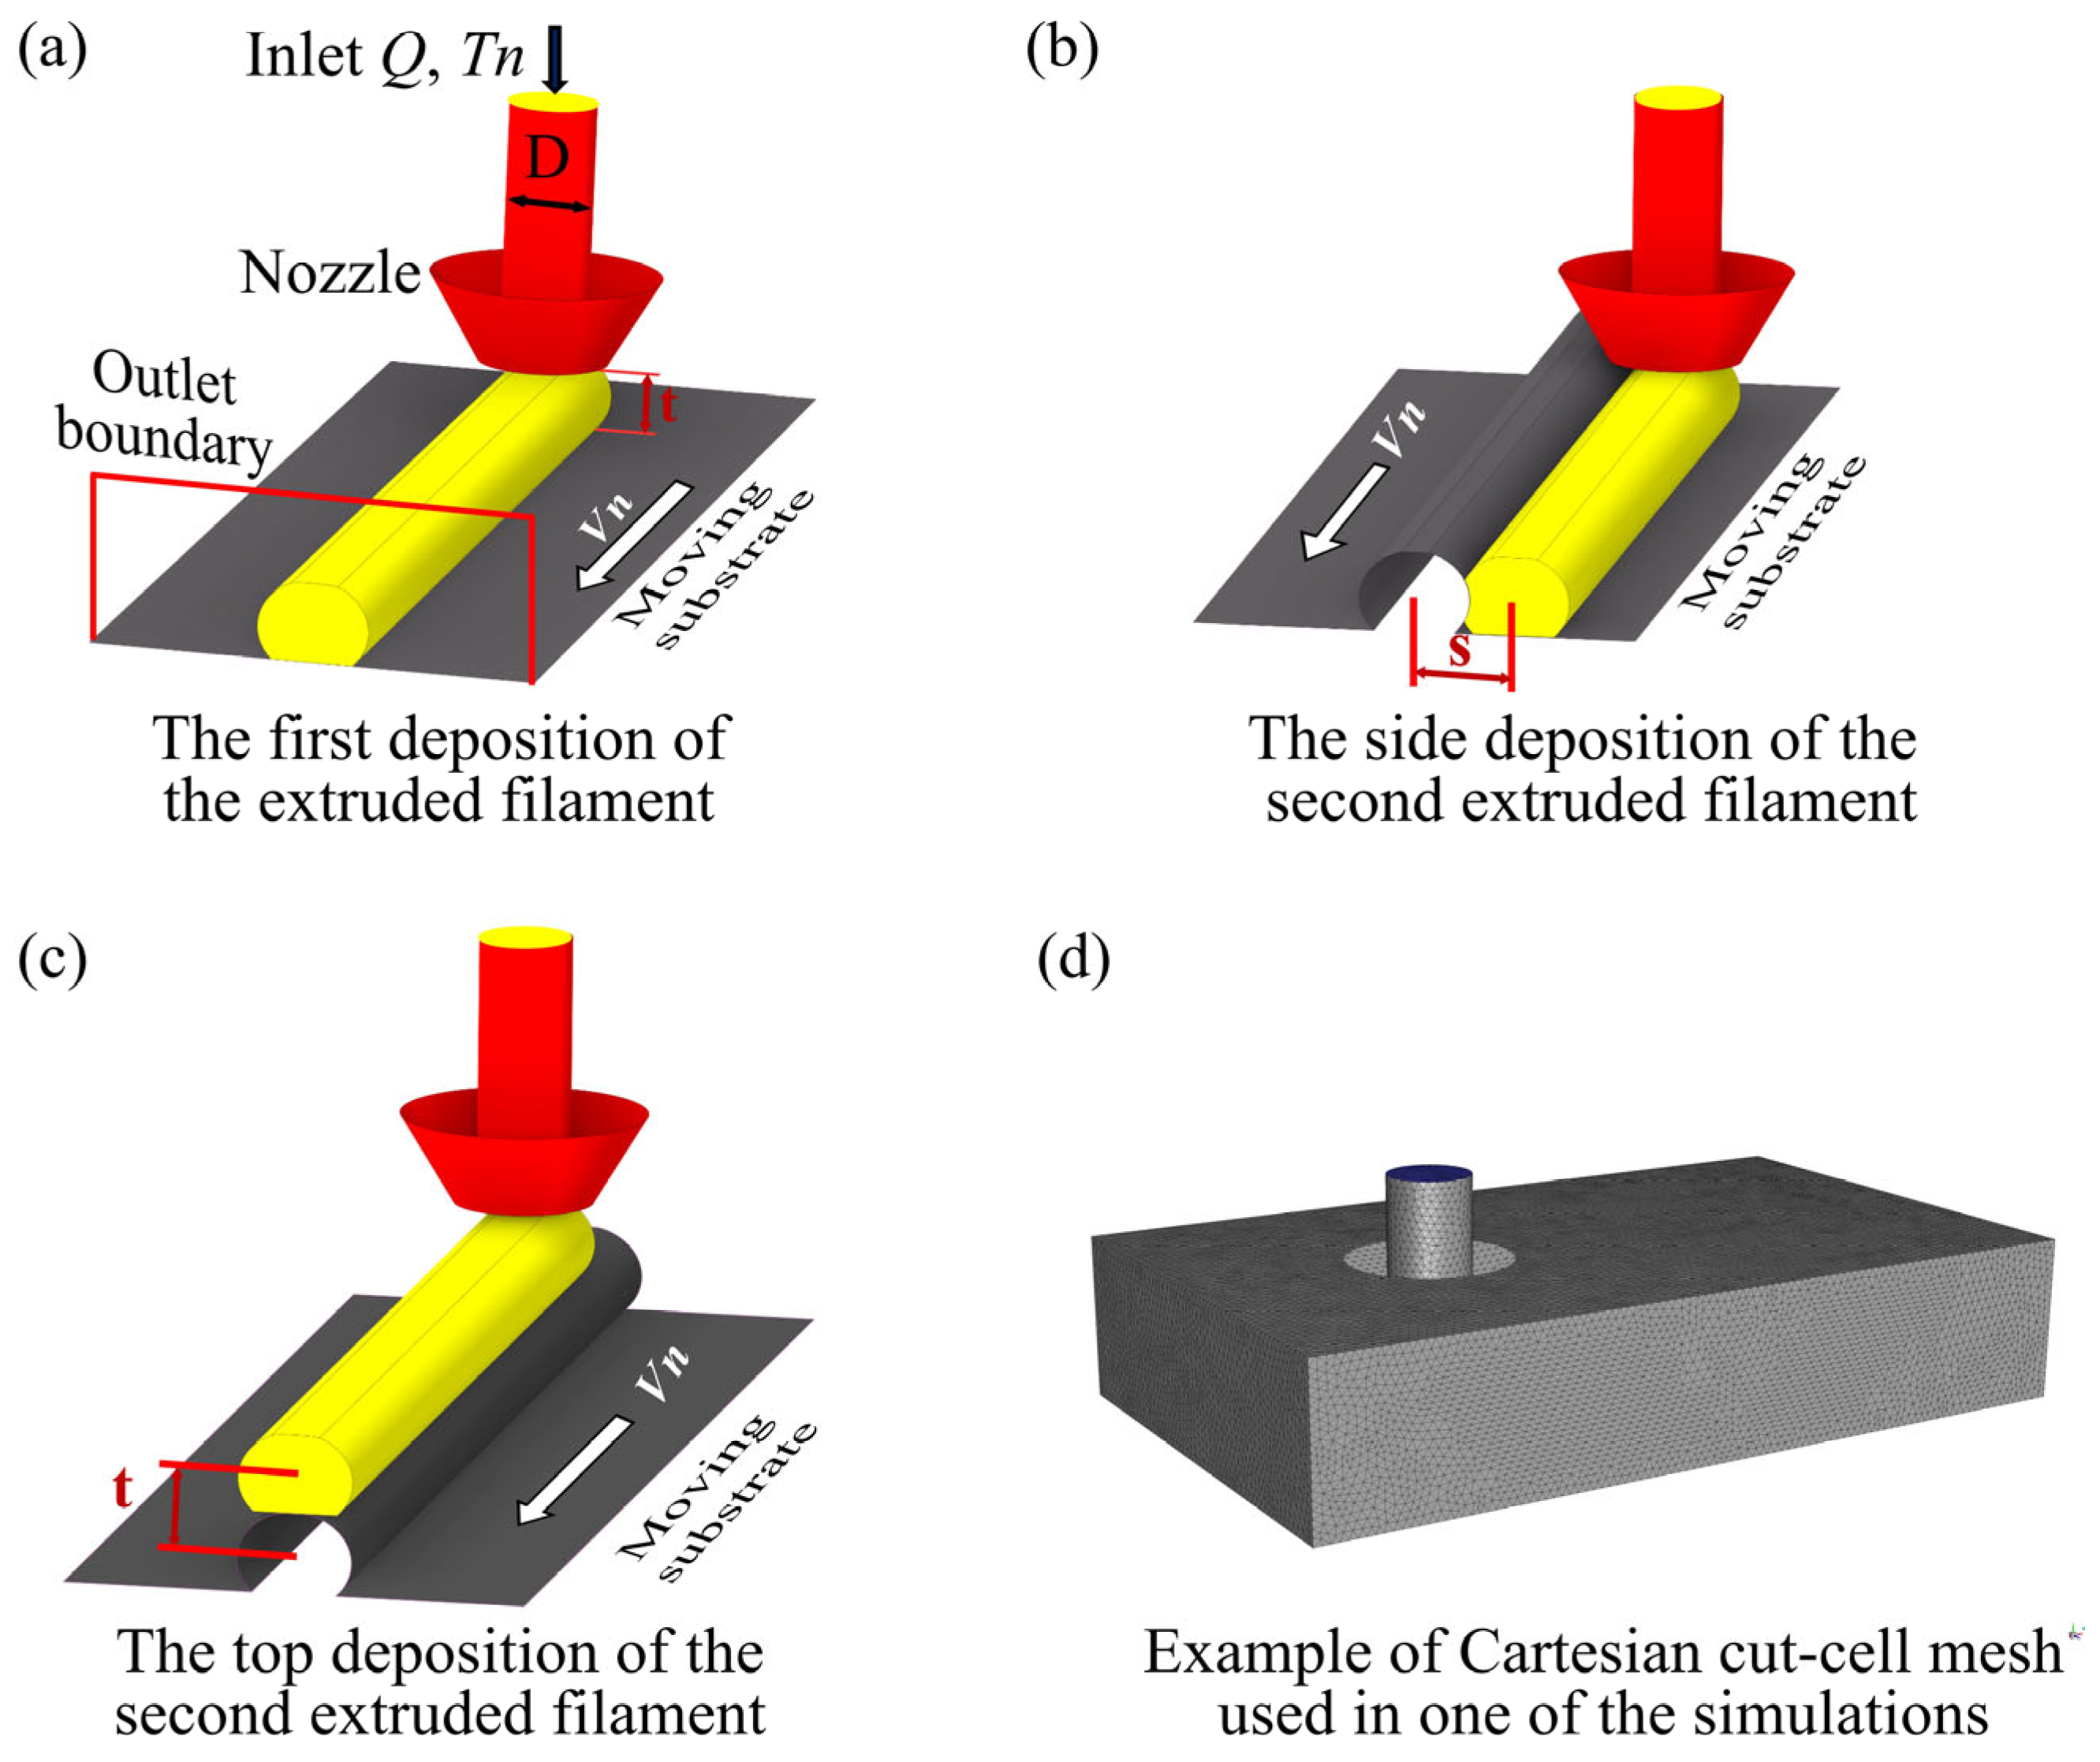
The geometry of the single-filament deposition simulation model is shown in Figure 3a. In the multi-filament deposition simulation, the influence of previously deposited filaments on the shape of subsequent filaments is considered. Specifically, after each filament deposition simulation concludes, its cross-sectional shape is measured at the outlet boundary. This cross-section is then used to create a solid, which is merged with the existing substrate to form a new geometric boundary for the deposition of the next filament. According to the deposition path planning, the geometry of the new substrate is translated horizontally for adjacent filaments in the same layer or vertically for a new layer, until all filaments have been deposited. Finally, by analyzing the mesostructure of the simulated RVE, its porosity and surface roughness are evaluated, and the effects of printing speed and temperature on the final quality of the “aligned” and “skewed” deposition configurations are investigated. The geometric models for “side deposition” and “top deposition” in multi-filament deposition are shown in Figure 3b,c. The simulations were performed in the general finite element analysis software ANSYS Fluent 2021 R1, with the computational domain discretized using a tetrahedral mesh. The maximum control volume size was set to 0.02 mm, and mesh details are shown in Figure 3d. The mesh divides the domain into control volumes for discretizing the governing equations. The governing equations were discretized based on the finite volume method, and the Semi-Implicit Method for Pressure Linked Equations (SIMPLE) algorithm with momentum interpolation was used to decouple the velocity and pressure fields, with all unknown variables stored at the same node. During computation, the numerical solver first calculates the discrete velocity and pressure values at the center of each control volume, with values at other locations obtained through interpolation.

Post-Processing and Validation of Numerical Simulation

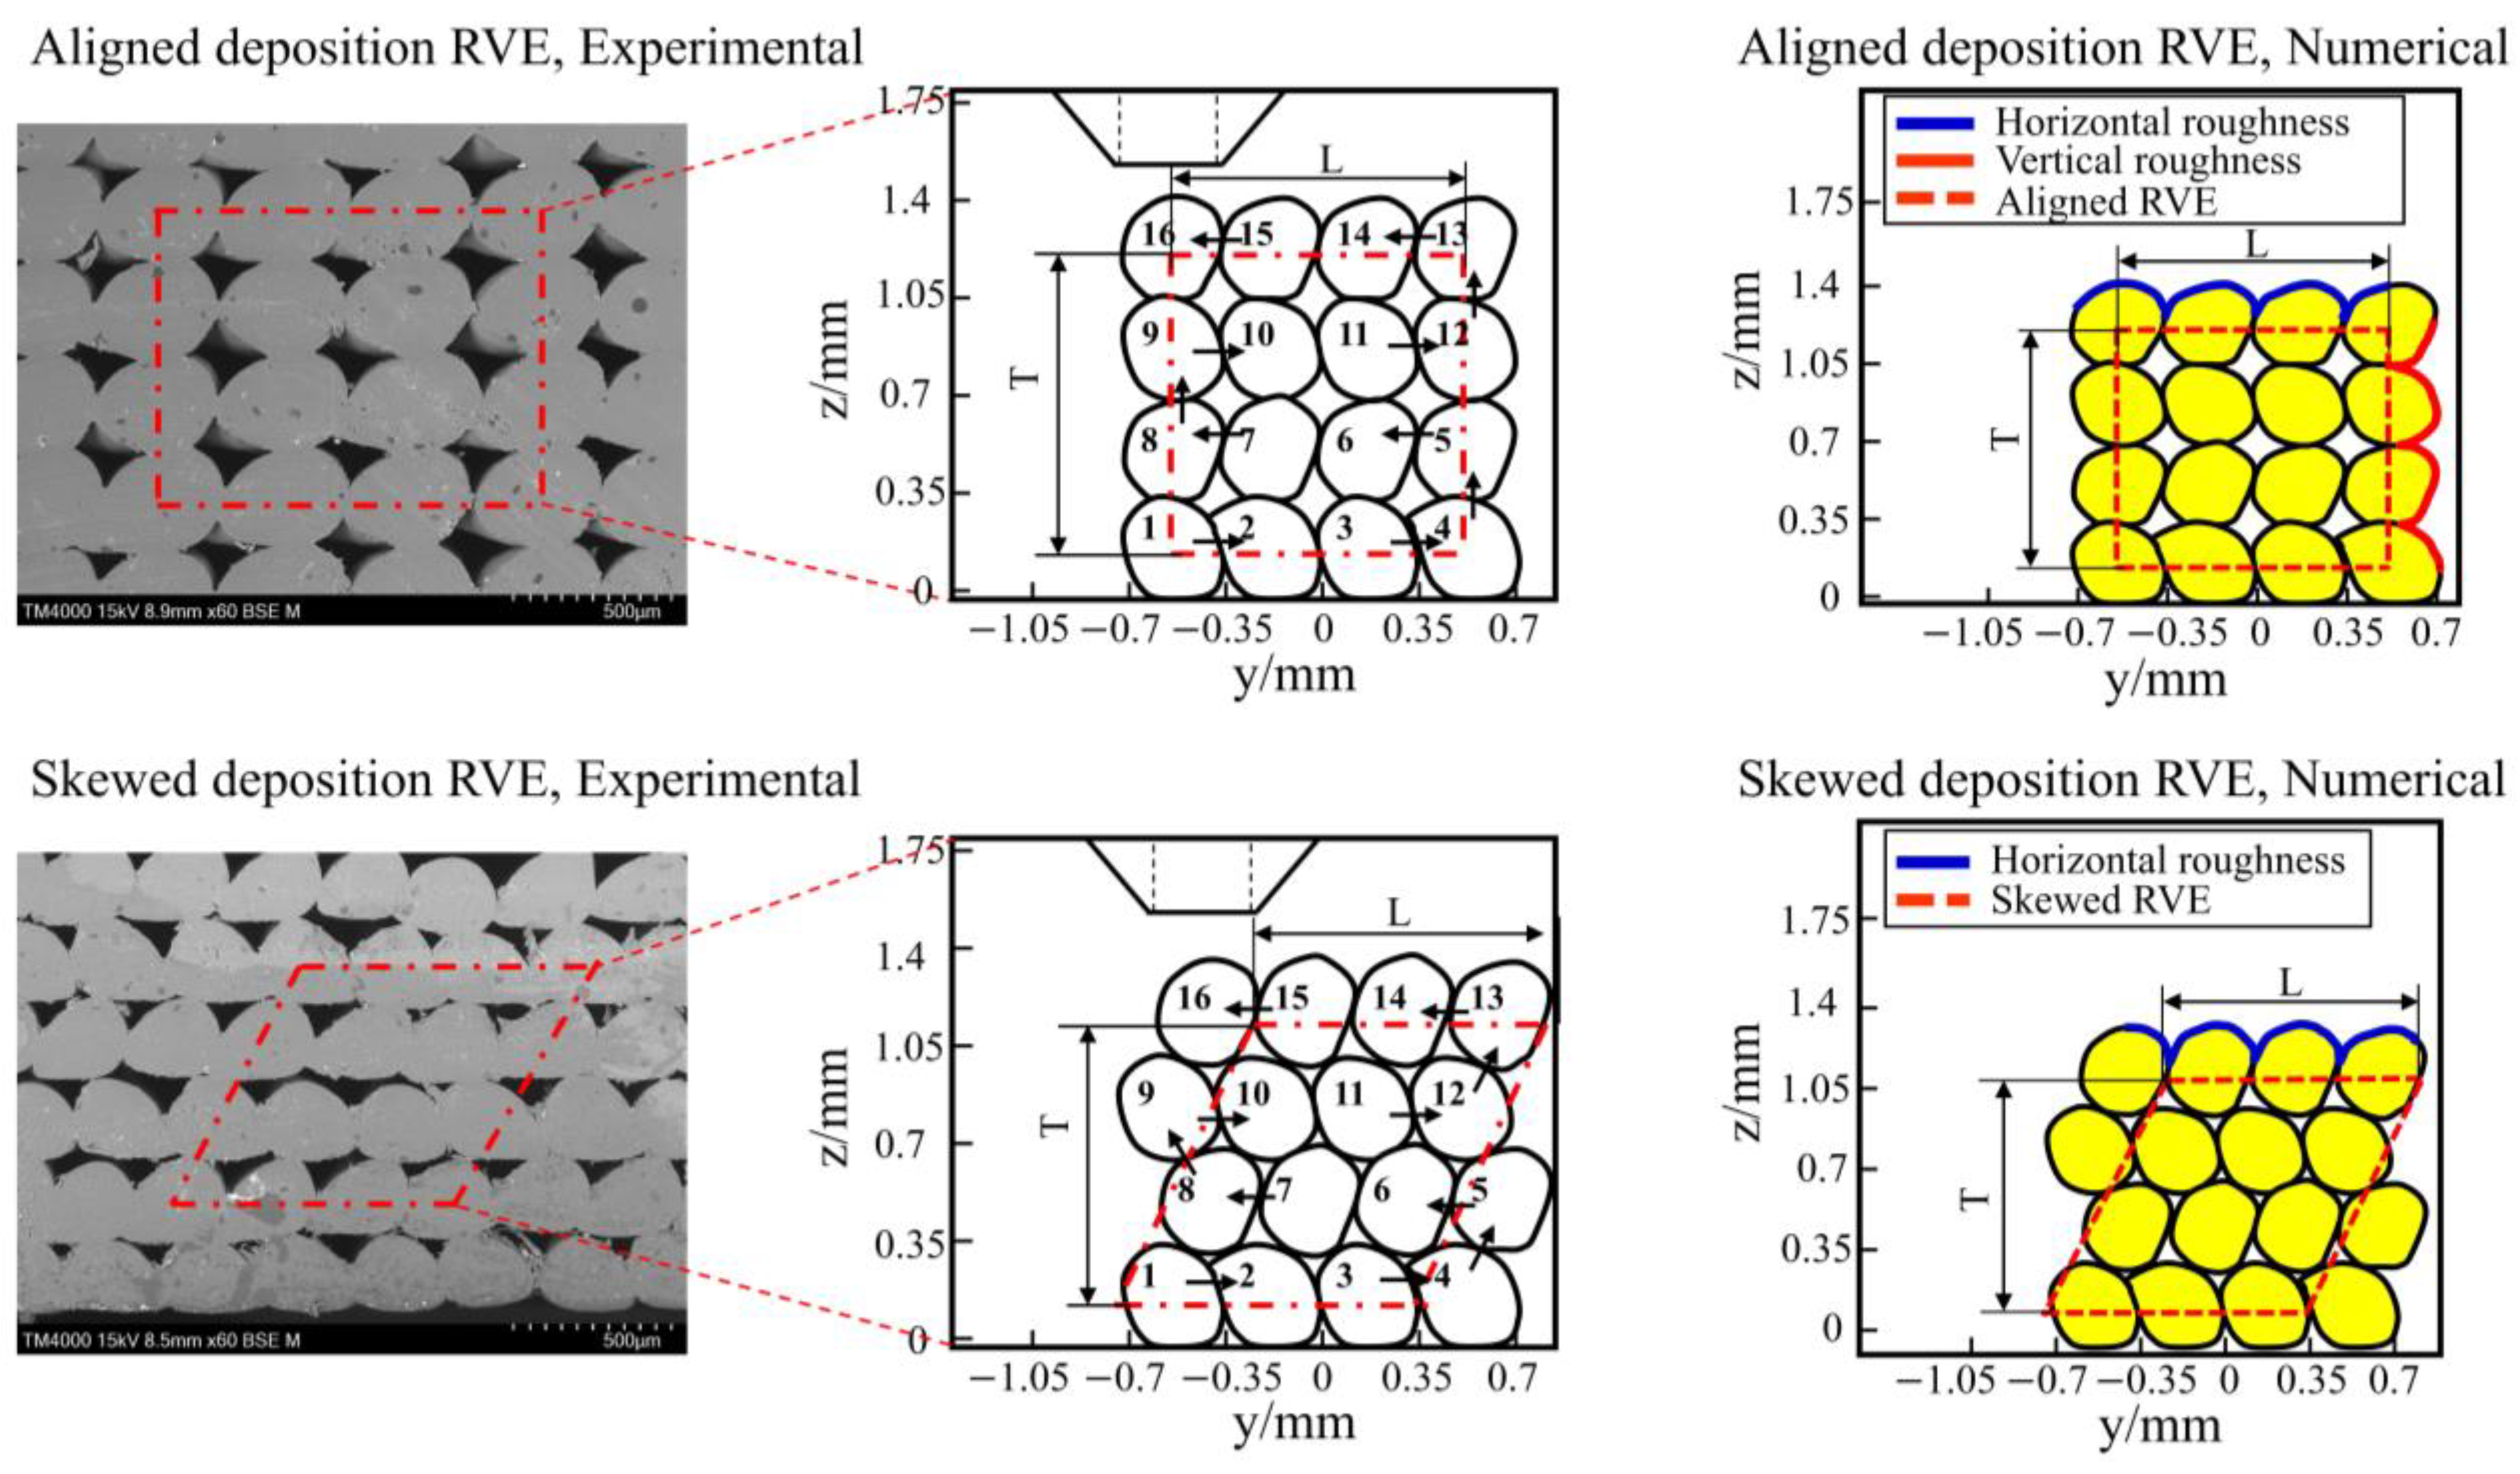
After the simulation, the profiles of the deposited PLA/GNP filaments were extracted from the numerical results and analyzed in MATLAB 9.0. The mesostructure of the representative volume element (RVE) was constructed by combining the profiles of all deposited PLA/GNPs filaments. The RVE was constructed as follows: it consists of 4 deposited layers, with each layer containing 4 filaments. Each layer is composed of regularly arranged filaments deposited periodically with a distance s between them. In the aligned configuration, each layer is stacked in the same pattern. In the skewed configuration, each layer is offset by an interval of s/2. Figure 4 shows a comparison of the mesostructures of the RVEs for the aligned and skewed deposition configurations. The deposition sequence for a total of 16 PLA/GNPs filaments is indicated by the numbers and arrows in the figures for each configuration.
To validate the accuracy of the CFD model, the simulation results were compared with experimental data. Experiments were conducted on a CreatBot DE 3D printer with printing parameters identical to those in the simulation. The filament morphology, dimensional accuracy, and porosity of the printed specimens were measured using a microscope and a high-precision 3D scanner. Finally, the experimental results were compared with the simulation predictions.

2.4. Mesostructure Characterization and Analysis Methods

2.4.1. Characterization of Filament Cross-Sectional Morphology

The numerical simulation results of the cross-sectional morphology and dimensions of deposited PLA/GNP filaments under different printing parameters were compared with experimental measurements. The experimental procedure was as follows: nine segments of PLA/GNP composite filaments were printed on a build plate using a CreatBot DE printer (Henan Suwei Electronic Technology Co., Ltd., Zhengzhou, China) according to the printing parameters specified in Table 2. After the printed filaments cooled and solidified, they were cut perpendicular to the printing direction with a blade, and the cross-sectional morphology was observed using a scanning electron microscope (SEM, VEGA3-LMH, TESCAN Corporation, Brno, Czech Republic). The open source image processing software ImageJ 1.47 was used to extract the cross-sectional profiles of the deposited filaments from both the numerical results and the SEM images for data processing and analysis. The shape, thickness, and width of the extracted profiles were calculated using a thresholding algorithm, with the specific process referencing our previous study [34].

2.4.2. Porosity Morphology and Analysis

Porosity is a key indicator of the density of 3D-printed parts and directly affects their mechanical properties. In this study, porosity is represented by the area fraction of pores in the RVE. The RVE corresponds to the area enclosed by the red dashed lines in Figure 4. For the aligned deposition configuration, the RVE is a rectangle, whereas for the skewed deposition configuration, it is a tilted parallelogram. The porosity is calculated as the area fraction of pores within the RVE defined by the red dashed lines, using the following equation:
p -   =   1 V R   ·   i = 1 n V i
where p - is the mesostructure porosity; V R is the area of the RVE; and V i is the area of the i-th pore in the mesostructure. Additionally, the numerically simulated mesostructures were compared with the cross-sections of the 3D-printed parts. Nine PLA/GNP samples were printed on a CreatBot DE printer according to the parameters in Table 2. After printing, the samples were cut along a plane perpendicular to the printing direction. The cross-sections were polished to remove impurities from the pores, sputter-coated with gold, and observed under an SEM to examine the mesostructure, including filament shape and void formation.

2.4.3. Roughness Analysis

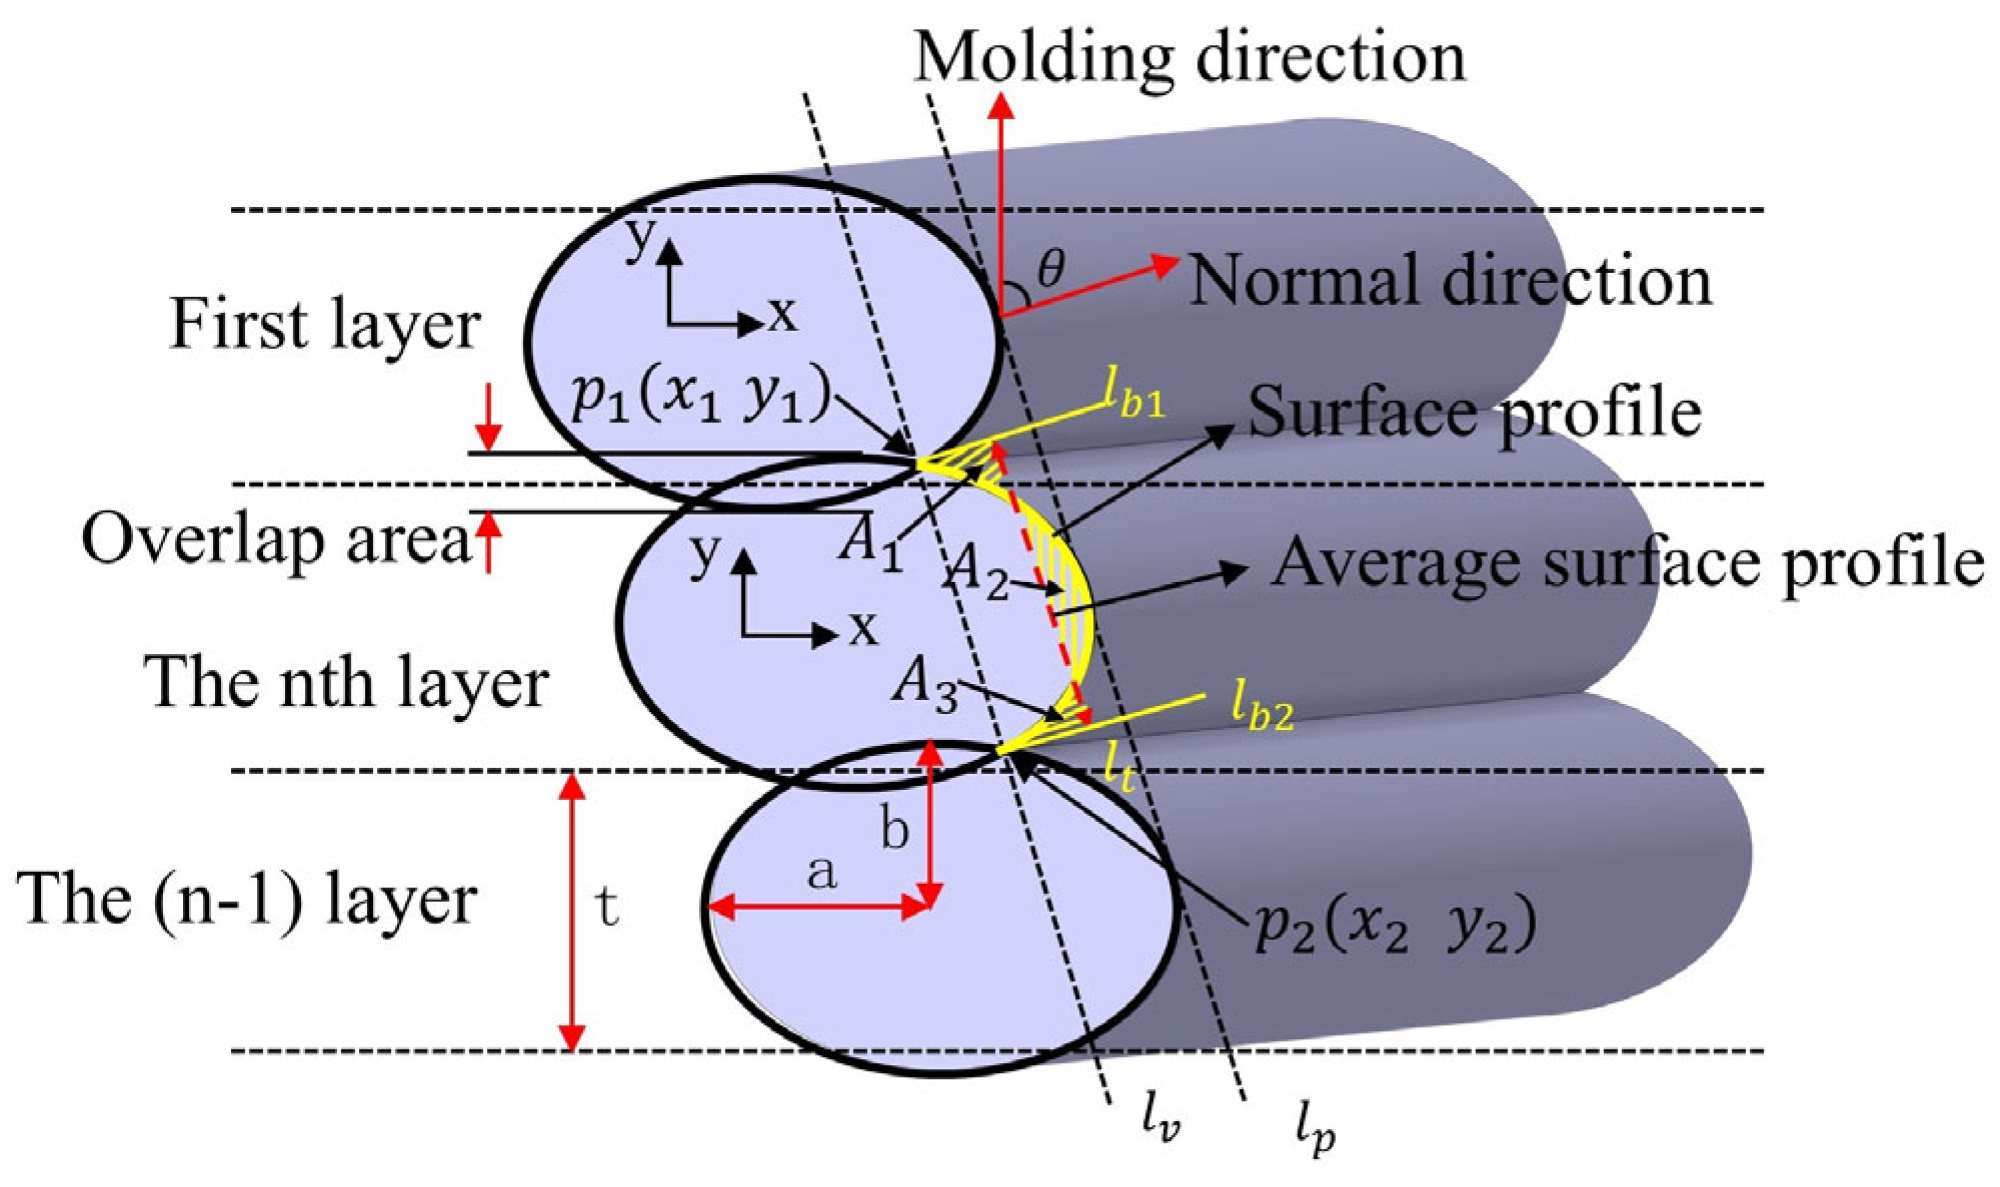
In this study, surface roughness was measured by combining SEM cross-sectional profile extraction with profile roughness calculation. According to the ISO 4287 standard [36], surface roughness parameters are defined by a continuous profile equation. In general quality control, the most commonly used parameter is the arithmetic mean roughness ( R a ), which characterizes the roughness value by calculating the arithmetic mean deviation of the absolute profile heights. In this method, the arithmetic mean centerline (baseline) of each PLA/GNP mesostructure profile is first calculated such that the sum of the areas enclosed by the profile above the centerline equals the sum of the areas below it. The arithmetic mean deviation, R a , is then determined by calculating the distances of various points on the profile from the arithmetic mean centerline. Figure 5 illustrates the calculation of the arithmetic mean deviation, R a , of a 3D-printed part’s surface profile.
In the figure, the yellow solid line represents the surface profile of the PLA/GNP mesostructure, and the red dashed line with double arrows represents the arithmetic mean centerline of the profile. The areas above and below the centerline satisfy the relationship: A 1   +   A 3   =   A 2 . To ensure calculation accuracy, the sampling length of the PLA/GNPs mesostructure surface profile included at least four peaks and valleys. The horizontal and vertical profiles of the aligned deposition configuration are highlighted in blue and red, respectively, for surface roughness calculation. Note that for the skewed configuration, only the horizontal roughness was calculated, and the corresponding horizontal profile is highlighted in blue. The equation for calculating the arithmetic mean deviation R a of the PLA/GNPs mesostructure surface profile is as follows:
R a   =   1 l 0 l y d x
where R a is the arithmetic mean deviation of the surface profile; l is the sampling length of the surface profile; and y is the distance from a point on the surface profile to the profile centerline. The surface roughness of the mesostructure in this study was approximately calculated as follows:
R a   =   1 n   i   =   1 n y i
where y i represents the distance from the i-th sampling point to the profile centerline, and n is the total number of sampling points. Specimens with both unidirectional aligned and angular-ply configurations were prepared, with five specimens for each printing parameter set for testing. To meet the accuracy requirement of at least four peaks and valleys in the sampling length, a profile measurement length of 1.36–1.52 mm was selected, using 100 sampling points. The sampling points were equally spaced along the profile using piecewise polynomial interpolation. The surface roughness of the mesostructures under different nozzle speeds and temperatures was calculated, and the surface roughness of the experimental and numerically calculated profiles was compared.

2.4.4. Dimensional Accuracy Analysis

The point coordinates on three mutually perpendicular surfaces of the printed PLA/GNPs samples were measured using a Hexagon bridge-type coordinate measuring machine (CMM) (Guangzhou Tezhun Instrument Co., Ltd. Guangzhou, China). For each surface, 78 measurement points were selected. The measured coordinates were used to calculate the dimensional accuracy of the measured surface in a specific direction. The dimensional accuracy for each surface in a specific direction is represented by the root mean square (RMS) deviation between the actual and nominal positions of the measured points. The formula for calculating the RMS deviation between the actual and nominal positions of the printed sample surface in the x-axis direction is as follows [37]:
RMS x   =   ( x 1 act     x n nomt ) 2   +     +   ( x n act     x n nom ) 2 n
where RMS x is the root mean square deviation in the x-axis direction; x 1 act is the x-coordinate of measurement point 1; x n act is the x-coordinate of measurement point n; and x n nomt is the nominal position of the measured surface in the x-axis direction. The same method was used to measure and calculate the RMS deviation of the PLA/GNP workpiece dimensions under different printing parameters, and the arithmetic mean of the dimensional accuracy in each direction was calculated.

2.4.5. Tensile Strength Analysis

Printed specimens were designed according to the ASTM D638 standard [38] and printed on a CreatBot DE printer. Three specimens were printed for each set of process parameters, totaling 27 tensile specimens. Apart from the key control parameters of nozzle speed and nozzle temperature specified in the table, all other printing parameters, such as build orientation, scan angle, infill density (100% adopted in this study), and layer thickness, were kept constant for all samples.

3. Results and Discussion

3.1. Effect of Printing Parameters on Deposited Filament Cross-Sectional Morphology

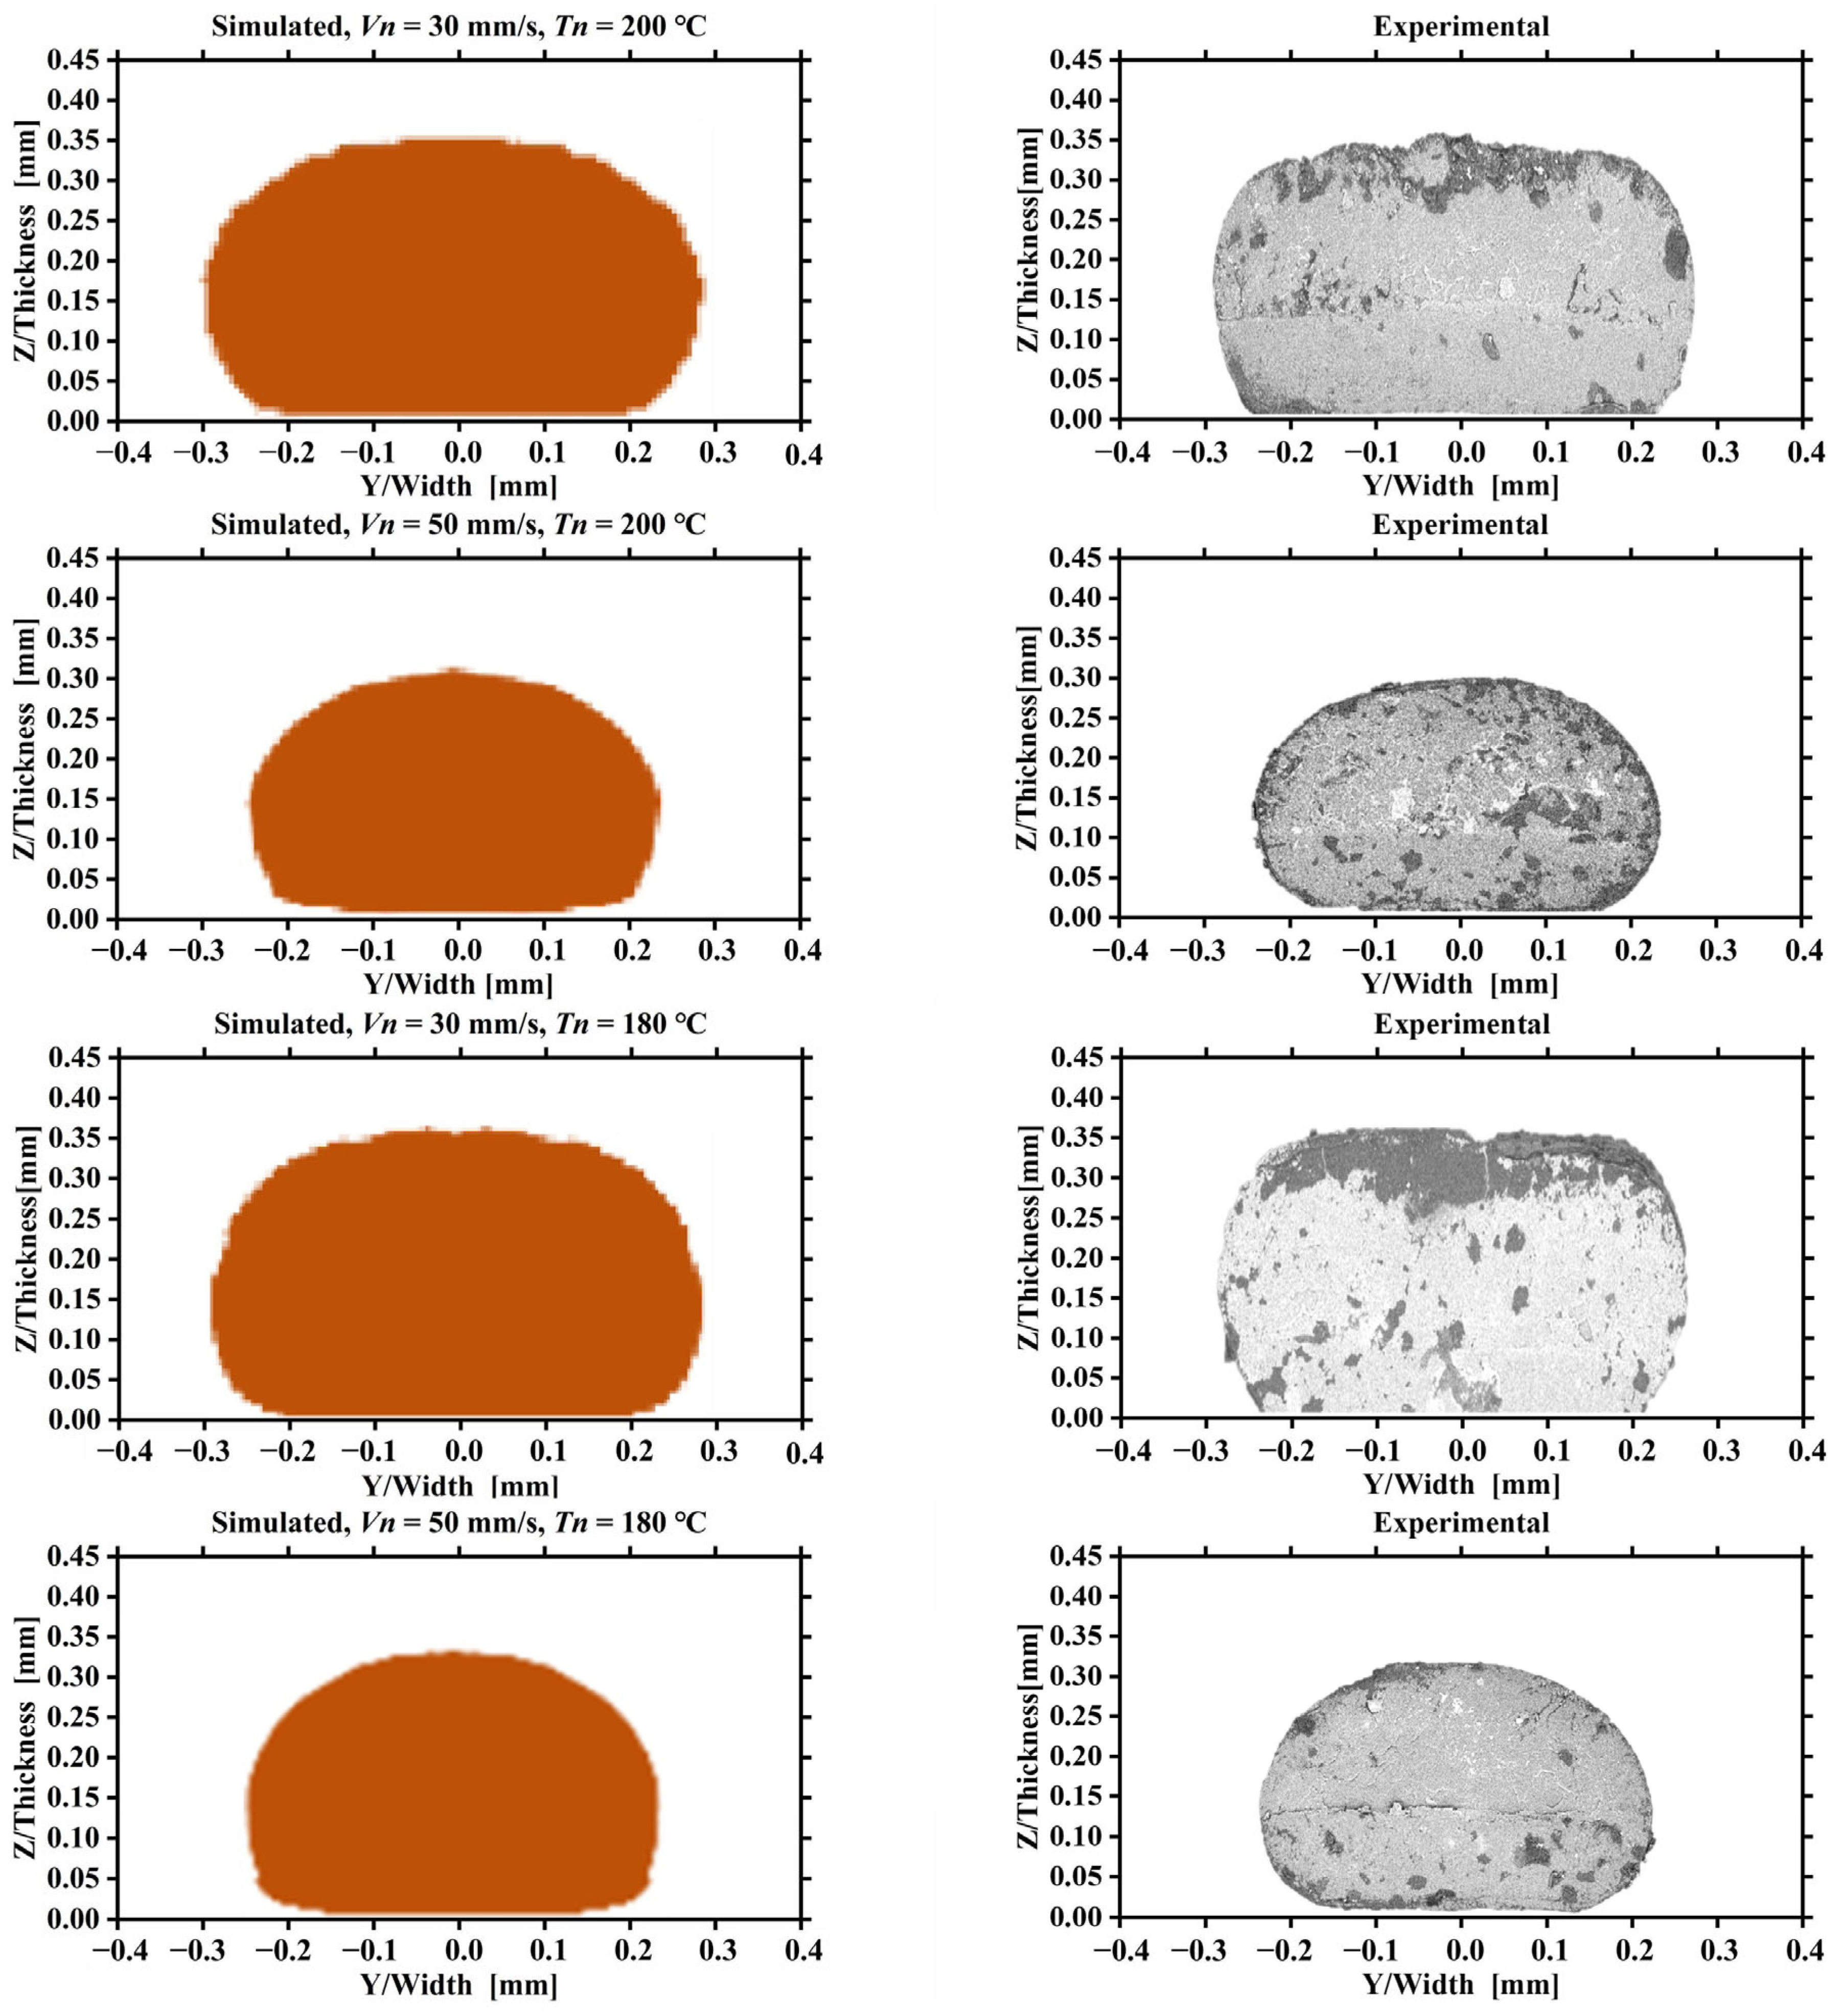
Figure 6 shows a comparison of the cross-sectional shapes of deposited PLA/GNP composite filaments obtained through numerical simulation (left column) and experimental observation (right column) under the nozzle speeds and temperatures specified in Table 2. The comparison reveals that the trends in cross-sectional morphology from the numerical simulations are highly consistent with the experimental measurements under different printing parameters, which validates the accuracy of the numerical simulation. The cross-sectional shape of the deposited PLA/GNP filament is highly sensitive to both nozzle speed and temperature. At high nozzle speeds and low nozzle temperatures, the filament cross-section is circular, while at low nozzle speeds and high nozzle temperatures, it becomes flattened. As the nozzle speed Vn decreases and the nozzle temperature Tn increases, the filament cross-section changes from nearly circular to a flat elliptical shape with rounded edges. The reason for this is that at a higher nozzle speed (Vn = 50 mm/s) and a lower nozzle temperature (Tn = 180 °C), less PLA/GNP material is deposited per unit length due to the fixed gap distance and constant feed rate. Consequently, the PLA/GNP filament is not compressed by the nozzle after exiting, resulting in a nearly circular cross-section. Conversely, when the nozzle speed is reduced to 30 mm/s, more PLA/GNP material is deposited per unit length due to mass conservation. Under a fixed gap, this causes the PLA/GNP filament to be squeezed by the lower face of the nozzle and flow sideways after exiting. As observed in the SEM images, a visible indentation is present in the top center of the PLA/GNP filament deposited at Vn = 30 mm/s, confirming the compression and lateral flow of the filament at low nozzle speeds. Under low nozzle speed conditions (Vn = 30 mm/s), an increase in nozzle temperature enhances this lateral flow. Due to mass conservation, both a decrease in nozzle speed and an increase in nozzle temperature enhance the lateral flow of the deposited filament, causing its cross-section to become flatter. Therefore, these process conditions can lead to reduced printing accuracy and should be avoided.

3.2. Effect of Printing Parameters on Pore Morphology and Porosity

Figure 7 shows the comparison of the pore morphology between the simulated results and the experimental measurement. The SEM images of the pore morphology indicate that the shape of the pores in the mesostructure is determined not only by the nozzle speed and temperature but also by the deposition configuration. For the aligned deposition configuration, at high nozzle speeds and low nozzle temperatures, the filaments are circular, and the pores are diamond-shaped. As the nozzle speed decreases and the nozzle temperature increases, the circular filaments and diamond-shaped pores become flattened. For the skewed deposition configuration, at high nozzle speeds and low nozzle temperatures, the pores are hourglass-shaped. Conversely, at low nozzle speeds and high nozzle temperatures, the hourglass-shaped pores are split into two triangular pores. This phenomenon occurs because at higher nozzle temperatures and speeds, the flowability of the deposited filament is enhanced, promoting bonding between the newly deposited filament and the previously deposited ones, thus increasing the bonding area and filling some of the pore channels. A comparison between the CFD-predicted and experimentally measured pore shapes in the mesostructure shows good agreement, indicating that the CFD model established in this study can accurately simulate the internal mesostructure of 3D-printed parts.
Furthermore, the porosity of the mesostructure, calculated using Equation (10), shows that porosity increases with increasing nozzle speed and decreasing nozzle temperature; a combination of high nozzle temperature and low nozzle speed results in lower porosity. Under the same printing parameters, the skewed deposition configuration of the PLA/GNPs mesostructure has a lower porosity than the aligned deposition configuration. Moreover, the difference in porosity between the aligned and skewed configurations becomes more pronounced as the nozzle temperature increases. Within the range of printing parameters studied, the lowest porosity for both aligned and skewed configurations was achieved at Vn = 30 mm/s and Tn = 220 °C.

3.3. Effect of Printing Parameters on Roughness

Figure 8 shows the comparison of the roughness profiles of the horizontal and vertical surfaces of the aligned deposition 3D-printed PLA/GNP composite material obtained from experimental measurements and numerical simulations under different printing parameter conditions. The surface profiles show that as the nozzle speed decreases and the nozzle temperature increases, the shape of the deposited filament changes from circular to an elongated ellipse, resulting in a smoother wall surface (profile surface) for the mesostructure. Nozzle temperature has a more significant impact on the surface roughness of the PLA/GNP mesostructure than changes in nozzle speed. For example, at a constant speed of 50 mm/s, increasing the nozzle temperature from 180 °C to 220 °C significantly reduced the average horizontal surface roughness ( R a ) from 35 µm to 12 µm, an improvement of 65%. This is because a higher temperature reduces the melt viscosity and enhances its flowability, causing the cross-section of the deposited filament to change from circular to a flatter elliptical shape. This change in shape allows for better filling of the gaps between adjacent filaments, resulting in a smoother surface. Additionally, it was observed that at a constant temperature, such as 200 °C, decreasing the printing speed from 50 mm/s to 30 mm/s also improved the surface roughness from 28 µm to 18 µm. This is because a lower speed provides a longer relaxation time for the molten material, allowing it to spread and fill more completely before solidifying, thus reducing the grooves between layers. Furthermore, the analysis shows that the effect of printing parameter changes is more pronounced on the horizontal surface than on the vertical surface. Under the same parameters, the skewed deposition configuration achieved a lower surface roughness than the aligned configuration, with a surface quality improvement of about 20–30%.

3.4. Effect of Printing Parameters on Dimensional Accuracy and Tensile Strength

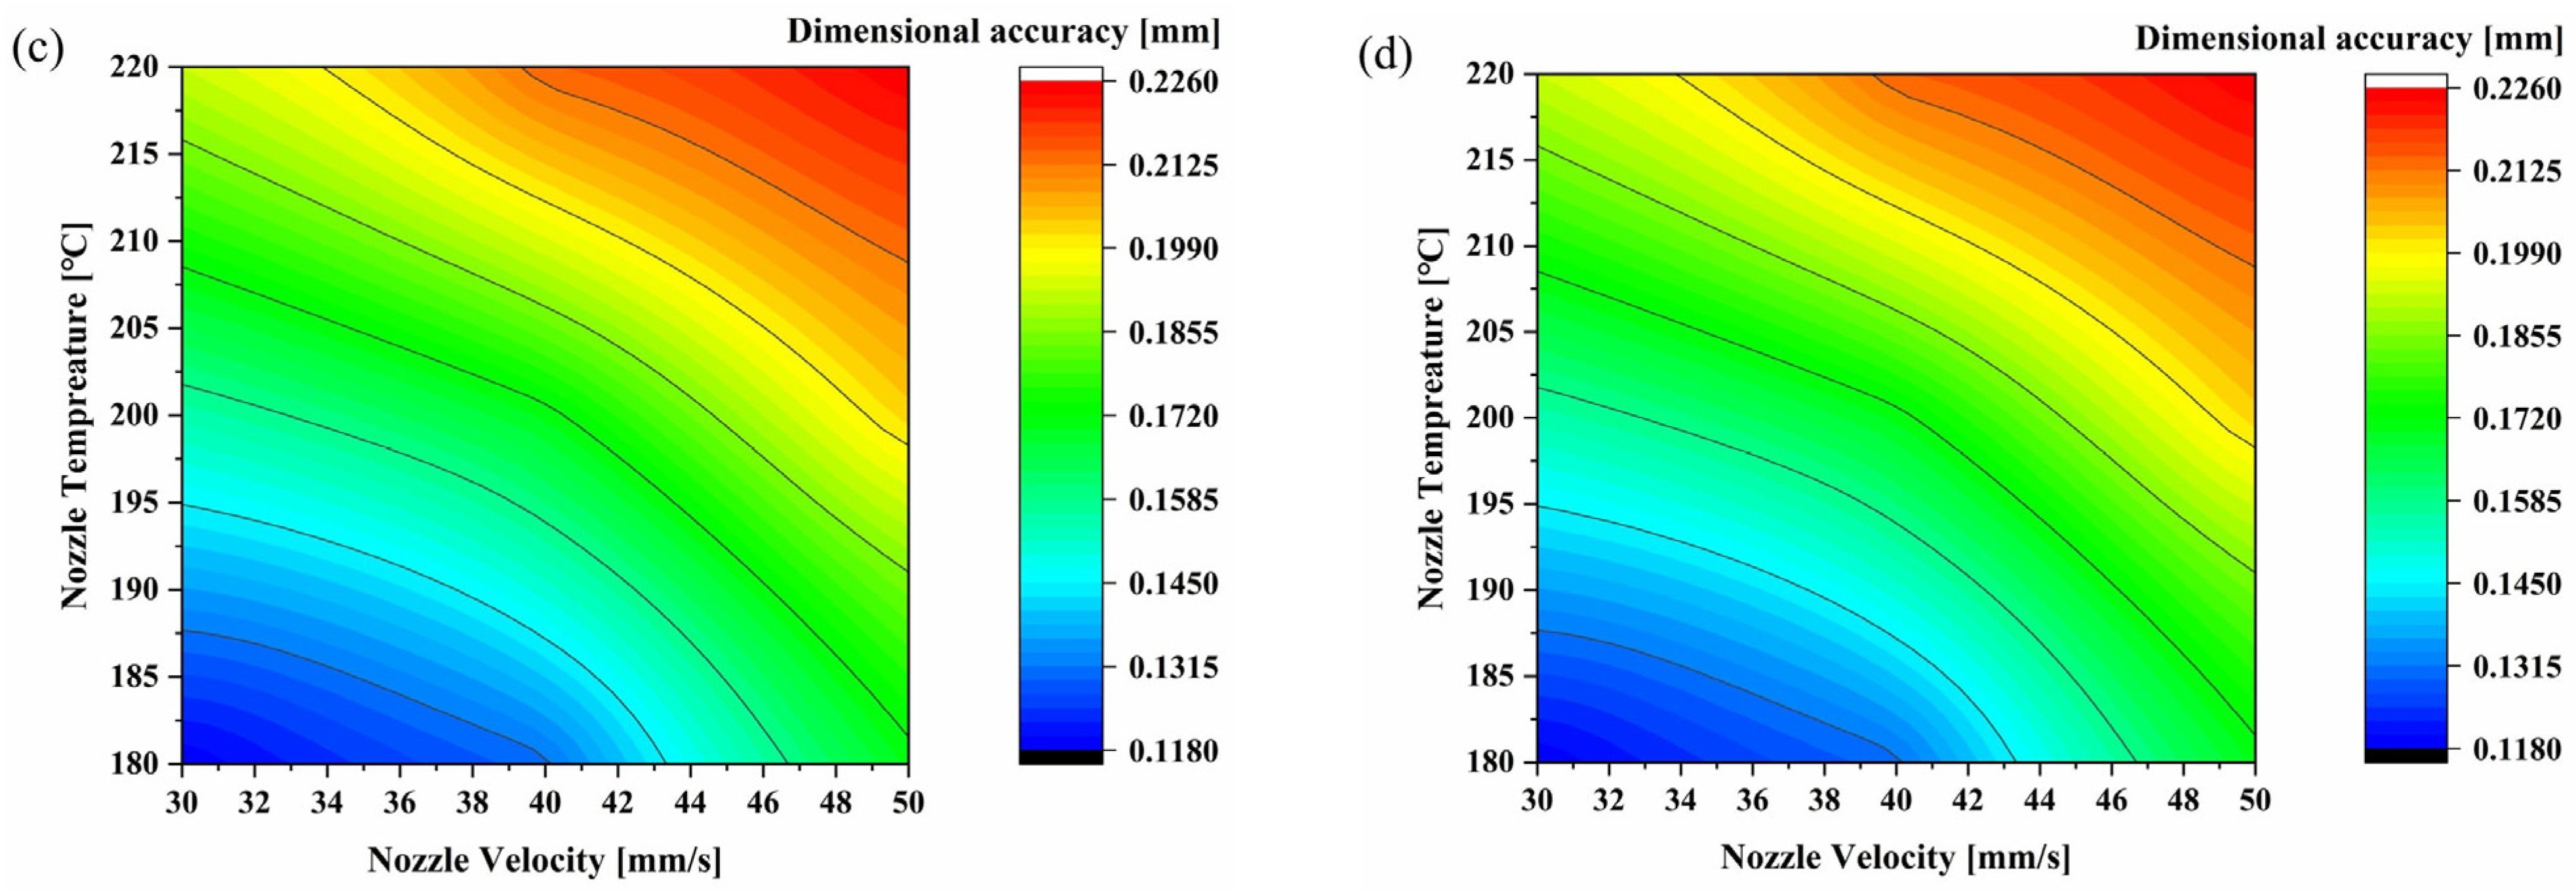
Figure 9a–c show contour plots of the effect of printing parameters on the dimensional accuracy of the 3D-printed parts. The results indicate that as the printing speed and temperature decrease, the root mean square (RMS) deviation of the dimensions of the printed PLA/GNP samples decreases, and the printing accuracy improves. Regarding the effect of speed, when the printing temperature was constant at 220 °C, increasing the printing speed from 30 mm/s to 50 mm/s caused the average RMS deviation of the sample in the X-axis to increase from 0.16 mm to 0.23 mm, a 43.6% decrease in accuracy. Regarding the effect of temperature, when the printing speed was fixed at 60 mm/s, increasing the printing temperature from 190 °C to 220 °C also worsened the average RMS deviation in the X-axis from 0.13 mm to 0.21 mm, a 53.8% decrease in printing accuracy. This phenomenon occurs because the combination of low temperature and low speed provides a longer cooling and solidification time for the printed filament, effectively suppressing internal stresses and deformations caused by thermal shrinkage, thus improving the final dimensional accuracy. Additionally, the study found a significant anisotropy in dimensional accuracy. Under the same printing parameters, the highest dimensional accuracy was achieved in the Z-axis (stacking direction), with RMS deviations as low as 0.10 mm. In contrast, the lowest dimensional accuracy was in the X-axis (main filament laying direction), with deviation values typically more than 30% higher than in the Z-axis, primarily due to the greater accumulation of thermal stress in the X-direction.
Figure 9d shows a contour plot of the strength of the PLA/GNP-printed specimens under different printing parameters. The results show that the printed specimens in the upper-left region of the contour plot exhibit higher mechanical properties, with a tensile strength greater than 59 MPa. In this region, the corresponding nozzle temperature is greater than 202 °C, and the nozzle speed is greater than 40 mm/s. This indicates that a higher nozzle temperature and a higher nozzle speed result in higher tensile strength. This is because at higher nozzle temperatures, the permeability and flowability of the extruded PLA/GNP melt are enhanced, which increases the bonding area and strength between adjacent filaments. For pure PLA material, numerous studies have shown that the tensile strength of the material printed by FDM technology is usually within the range of 45–50 MPa [39]. In contrast, in this study, the addition of 2 wt% GNPs, under optimized processing conditions, enabled the tensile strength of the composite material to exceed the upper limit of pure PLA material by 18%. This indicates that GNPs, as a nano-reinforcing filler, can effectively enhance the material’s load-bearing capacity when well combined with the PLA matrix and in conjunction with the optimized printing process. Moreover, within the optimized processing window, a higher nozzle temperature significantly reduces the viscosity of the PLA/GNP melt, enhancing its fluidity. This enhanced fluidity enables the molten filament to better spread and fill the gaps between adjacent filaments after deposition, thereby forming larger and more effective fusion interfaces and resulting in a higher macroscopic tensile strength. A comprehensive analysis of the effects of printing parameters on dimensional accuracy and mechanical strength reveals a critical process trade-off: the low-temperature, low-speed conditions required for high dimensional accuracy conflict with the high-temperature, high-speed conditions needed for high mechanical strength. Specifically, low temperatures (e.g., 180 °C) effectively suppress thermal shrinkage, reducing dimensional deviation to below 0.12 mm, but leading to insufficient interlayer bonding due to poor melt flowability, causing the tensile strength to drop below 50 MPa. Conversely, high temperatures (e.g., 220 °C) enhance melt flowability, increasing the tensile strength to over 60 MPa, but the intense thermal effects also increase the dimensional deviation to over 0.25 mm. Therefore, producing functional parts with both excellent accuracy and strength requires identifying and applying an optimal “processing window”. Based on the data from this study, a compromised parameter range—a nozzle temperature set of 210–215 °C and a printing speed maintained at 30–35 mm/s—was found to be the best choice for balancing performance. Within this window, the tensile strength of the printed parts can be stabilized at around 56 MPa, while the dimensional RMS deviation can be controlled within 0.18 mm, achieving an effective balance between the two performance indicators and providing reliable process guidance for the practical application of PLA/GNP composites.
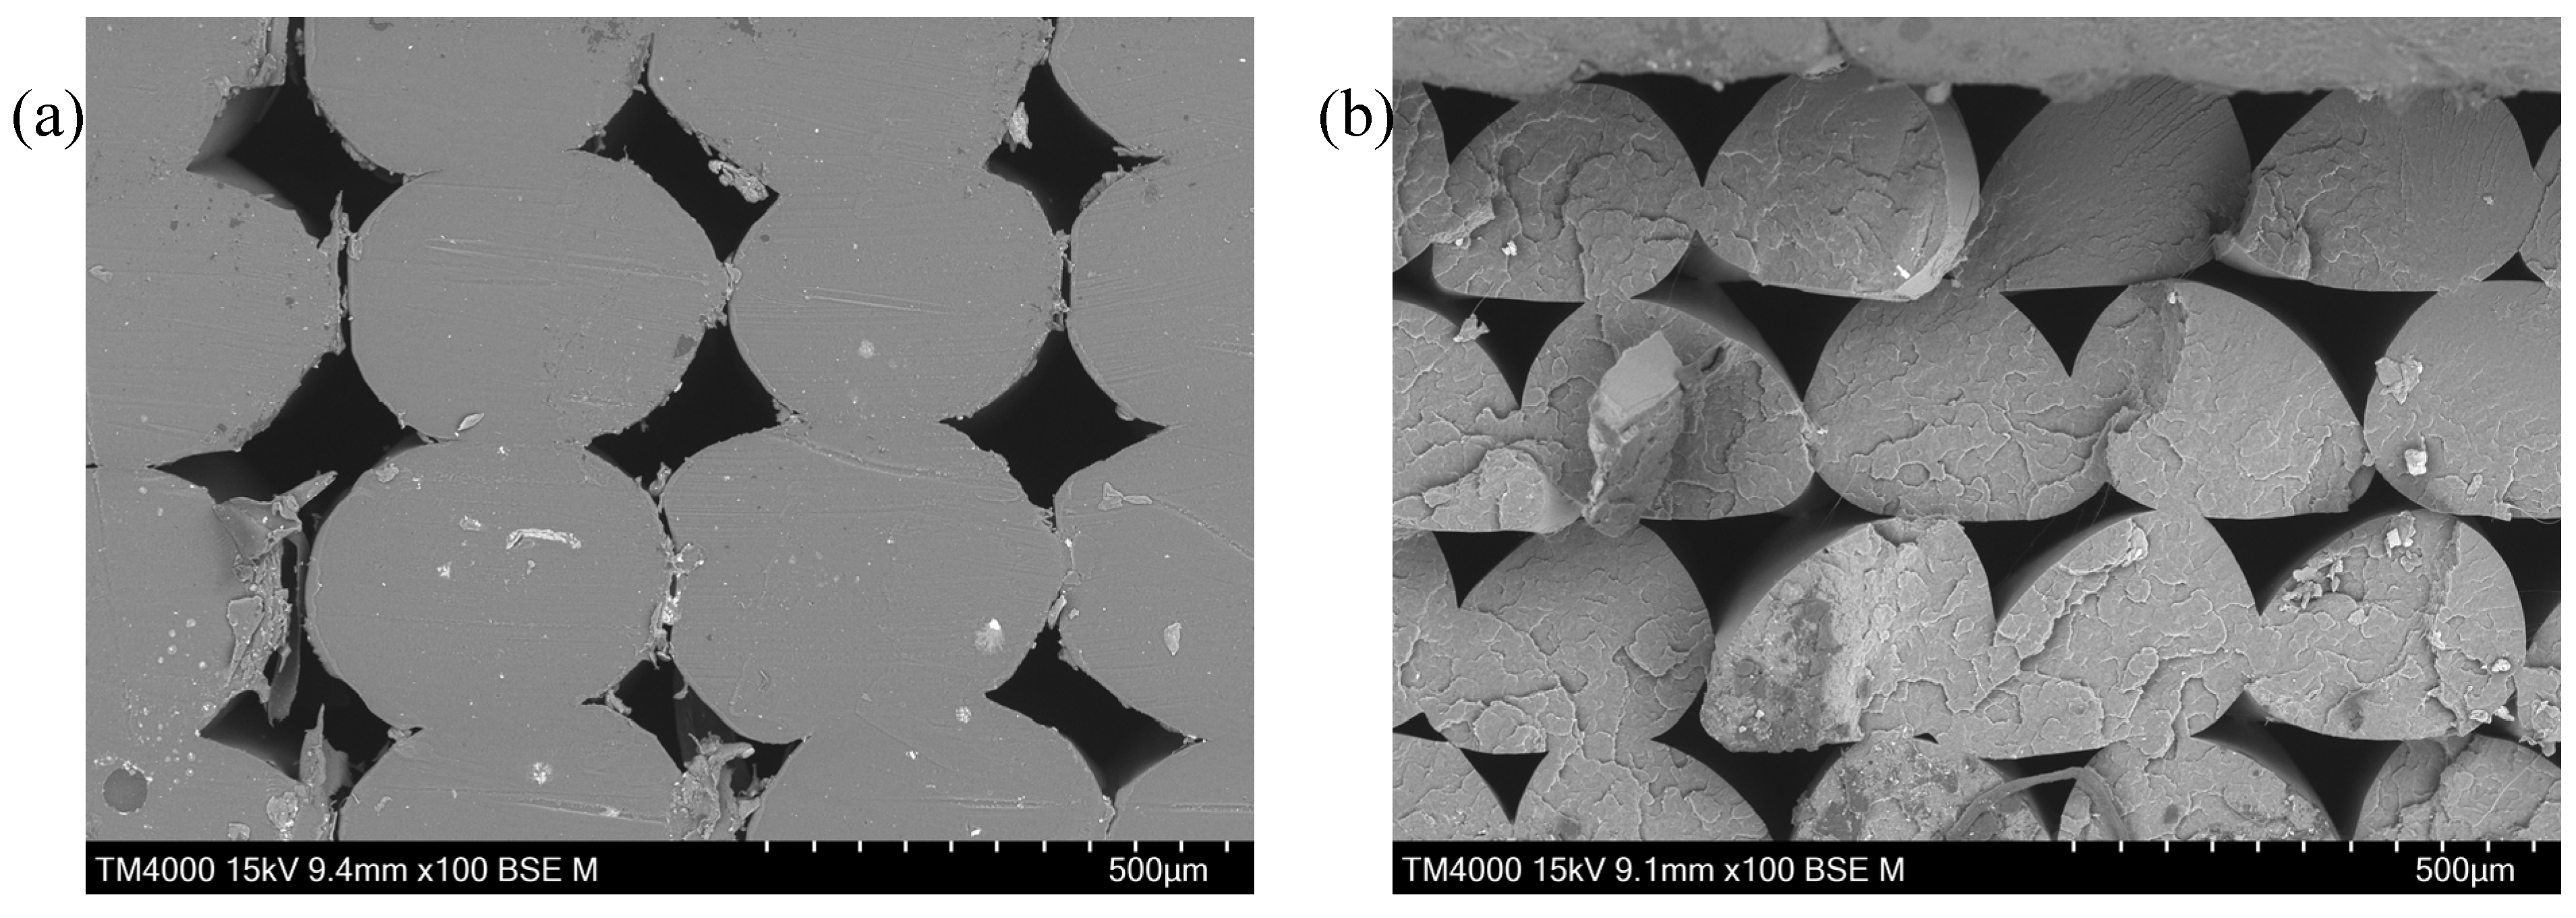
Figure 10a shows the SEM images of the fracture surface of the printed sample after tensile failure under high printing temperature and velocity conditions. The figure demonstrates a more compact and uniform fracture surface. The interlayer interfaces between the filaments are blurred, indicating that the melt was fully spread during deposition and achieved excellent interlayer fusion. The number of tiny pores on the fracture surface is very small, and their shapes are irregular. Under high temperature conditions, GNPs have better fluidity and may be observed to be pulled out or undergo shear failure on the fracture surface, indicating good interface bonding. This indicates that the excellent interlayer fusion and low porosity are the direct reasons for its high tensile strength, which is highly consistent with the results predicted by our CFD model of reduced melt viscosity and enhanced spreading ability at high temperatures. Figure 10b shows the SEM images of the fracture surface of the printed sample after tensile failure under low printing temperature and velocity conditions. This figure exhibits distinct layering and a porous structure. The interlayer boundaries between the filaments are clearly visible, and there are obvious large-sized, unfilled voids or holes. The fracture mode is mainly interlayer separation rather than the failure of the material itself. The low temperature and high speed cause the melt to solidify rapidly without sufficient spreading and bonding, leaving a large number of triangular or semi-circular pores. This indicates that the poor process parameters lead to a high porosity and weak interlayer bonding, which is the main reason for the significant decrease in its tensile strength. This directly verifies the prediction of the CFD model regarding the insufficient flattening degree of the filaments under low temperature and high speed, and clarifies the decisive influence of mesoscopic structural defects on mechanical properties.

4. Conclusions

This study established and experimentally validated a computational fluid dynamics (CFD) model to predict the effects of nozzle temperature and printing speed on the mesoscopic structure, dimensional accuracy, and mechanical properties of 3D-printed PLA/GNP composites. The simulation results consistently aligned with experimental data, confirming the model’s accuracy in capturing the complex interplay between processing conditions and final part quality. The key findings elucidate the correlation between printing parameters and the resulting material microstructure. Specifically, lower printing speeds and higher nozzle temperatures lead to a flatter filament cross-section, which reduces both porosity and surface roughness. Furthermore, the skewed deposition strategy proved superior to the aligned configuration, yielding parts with lower porosity and a smoother surface finish under identical conditions. Furthermore, this study clarifies the critical trade-off relationship between dimensional accuracy and tensile strength. Optimal dimensional accuracy is achieved with low temperatures and speeds, which minimize thermal deformation. In contrast, maximum tensile strength requires high temperatures and speeds to ensure strong interlayer adhesion. By navigating this trade-off, an optimal processing window was identified. A nozzle temperature of 210–215 °C and a printing speed of 30–35 mm/s balances these competing objectives, producing components with robust tensile strength (approximately 56 MPa) while maintaining good dimensional accuracy (RMS deviation under 0.18 mm). These findings provide critical process–structure–property relationships and offer valuable engineering guidance for the fabrication of high-performance PLA/GNP composite parts.
Although this model accurately predicted the core process–structure–performance relationship, it still has limitations, such as the idealized assumptions about the printing process and the failure to consider the influence of the microdistribution of GNPs on the anisotropic behavior of the material. Future research should focus on developing more precise “process-microstructure-performance” integrated multi-physics field models, fully coupling melt flow, thermal stress evolution, and crystallization kinetics, to more accurately predict the warpage deformation of complex geometric components. At the same time, combining this model with machine learning algorithms is expected to achieve global optimization of multi-dimensional process parameters. Moreover, extending this modeling method to other high-performance composite material systems and conducting verification with in situ monitoring technology will be an important direction for promoting the development of advanced material additive manufacturing. Finally, extending the validated modeling methods in this study to different filling densities (such as 20% or 50%) and systematically investigating the effects of these densities on the mesostructure, pore morphology, and final mechanical properties will be another crucial future research direction.

Author Contributions

Conceptualization, M.L.; Data curation, C.N., Q.L. and X.L.; Formal analysis, M.L., Y.X. and H.C.; Funding acquisition, M.L.; Investigation, C.N. and P.L.; Methodology, M.L. and P.L.; Software, M.L. and Y.X.; Supervision, P.L.; Visualization, C.N.; Writing—original draft, M.L.; Writing—review and editing, P.L. All authors have read and agreed to the published version of the manuscript.

Funding

This project was sponsored by the National Natural Science Foundation of China (Grant No. 52565033), the Doctoral Research Project of Guangxi University of Science and Technology (Grant No. XiaoKeBo24Z35).

Institutional Review Board Statement

Not applicable.

Data Availability Statement

The original contributions presented in this study are included in the article. Further inquiries can be directed to the corresponding author.

Acknowledgments

We would like to thank the Analytical & Testing Centre of Northwestern Polytechnical University.

Conflicts of Interest

The authors declare that they have no conflicts of interest.

References

  1. Cano-Vicent, A.; Tambuwala, M.M.; Hassan, S.S.; Barh, D.; Aljabali, A.A.; Birkett, M.; Arjunan, A.; Serrano-Aroca, Á. Fused deposition modelling: Current status, methodology, applications and future prospects. Addit. Manuf. 2021, 47, 102378. [Google Scholar] [CrossRef]
  2. Ahn, S.J.; Lee, H.; Cho, K.J. 3D printing with a 3D printed digital material filament for programming functional gradients. Nat. Commun. 2024, 15, 3605. [Google Scholar] [CrossRef] [PubMed]
  3. Cheng, H.; Tang, M.; Zhang, J.; Wang, H.; Zhou, J.; Wang, Q.; Qian, Z. Effects of rCF attributes and FDM-3D printing parameters on the mechanical properties of rCFRP. Compos. Part B Eng. 2024, 270, 111122. [Google Scholar] [CrossRef]
  4. Zhang, R.X.; Yu, L.; Chen, K.; Xue, P.; Jia, M.; Hua, Z. Amelioration of interfacial properties for CGF/PA6 composites fabricated by ultrasound-assisted FDM 3D printing. Compos. Commun. 2023, 39, 101551. [Google Scholar] [CrossRef]
  5. Faizaan, M.; Shenoy Baloor, S.; Nunna, S.; Mallya, R.; Rao Udupi, S.; Ramanath Kini, C.; Kada, S.R.; Creighton, C. A study on the overall variance and void architecture on MEX-PLA tensile properties through printing parameter optimization. Sci. Rep. 2025, 15, 3103. [Google Scholar] [CrossRef]
  6. Phan, D.D.; Horner, J.S.; Swain, Z.R.; Beris, A.N.; Mackay, M.E. Computational fluid dynamics simulation of the melting process in the fused filament fabrication additive manufacturing technique. Addit. Manuf. 2020, 33, 101161. [Google Scholar] [CrossRef]
  7. Rashid, A.A.; Koç, M. Fused filament fabrication process: A review of numerical simulation techniques. Polymers 2021, 13, 3534. [Google Scholar] [CrossRef]
  8. Comminal, R.; Serdeczny, M.P.; Pedersen, D.B.; Spangenberg, J. Numerical modelling of the strand deposition flow in extrusion-based additive manufacturing. Addit. Manuf. 2018, 20, 68–76. [Google Scholar] [CrossRef]
  9. Penumakala, P.K.; Santo, J.; Thomas, A. A critical review on the fused deposition modelling of thermoplastic polymer composites. Compos. Part. B Eng. 2020, 201, 108336. [Google Scholar] [CrossRef]
  10. Shah, A.K.; Palit, A.; Williams, M.A.; Wilson, P.F.; Jain, A. Microstructural alteration and its impact on the effective stiffness of short carbon fibre-reinforced PLA in fused deposition modelling. Compos. Part A Appl. Sci. Manuf. 2025, 199, 109229. [Google Scholar] [CrossRef]
  11. Sun, H.; Hwang, U.; Kim, S.; Sung, J.; Kim, T.; Suhr, J.; Park, I.K.; Nam, J.D. Reversible Thixotropic Rheological Properties of Graphene-Incorporated Epoxy Inks for Self-Standing 3D Printing. ACS Macro Lett. 2025, 14, 135–141. [Google Scholar] [CrossRef] [PubMed]
  12. dos Anjos, E.G.R.; Brazil, T.R.; de Melo Morgado, G.F.; Antonelli, E.; Rezende, M.C.; Pessan, L.A.; Moreira, F.K.V.; Marini, J.; Passador, F. Renewable PLA/PHBV blend-based graphene nanoplatelets and carbon nanotube hybrid nanocomposites for electromagnetic and electric-related applications. ACS Appl. Electron. Mater. 2023, 5, 6165–6177. [Google Scholar] [CrossRef]
  13. Gerdefaramarzi, R.S.; Ebrahimian, H.M.; Khodaei, M. 3D printed poly (lactic acid)/poly (ε-caprolactone)/graphene nanocomposite scaffolds for peripheral nerve tissue engineering. Arab. J. Chem. 2024, 17, 105927. [Google Scholar] [CrossRef]
  14. Ponnamma, D.; Yin, Y.; Salim, N.; Parameswaranpillai, J.; Thomas, S.; Hameed, N. Recent progress and multifunctional applications of 3D printed graphene nanocomposites. Compos. Part. B Eng. 2021, 204, 108493. [Google Scholar] [CrossRef]
  15. Li, Y.; Feng, Z.; Huang, L.; Essa, K.; Bilotti, E.; Zhang, H.; Peijs, T.; Hao, L. Additive manufacturing high performance graphene-based composites: A review. Compos. Part A Appl. Sci. Manuf. 2025, 124, 9–22. [Google Scholar] [CrossRef]
  16. Park, S.; Shou, W.; Makatura, L.; Matusik, W.; Fu, K.K. 3D printing of polymer composites: Materials, processes, and applications. Matter 2022, 5, 43–76. [Google Scholar] [CrossRef]
  17. Milovanović, A.; Golubović, Z.; Kirin, S.; Babinský, T.; Šulák, I.; Milošević, M.; Sedmak, A. Manufacturing parameter influence on FDM polypropylene tensile properties. J. Mech. Sci. Technol. 2023, 37, 5541–5547. [Google Scholar] [CrossRef]
  18. Eksi, S.; Karakaya, C. Effects of Process Parameters on Tensile Properties of 3D-Printed PLA Parts Fabricated with the FDM Method. Polymers 2025, 17, 1934. [Google Scholar] [CrossRef]
  19. Shanmugam, V.; Babu, K.; Kannan, G.; Mensah, R.A.; Samantaray, S.K.; Das, O. The thermal properties of FDM printed polymeric materials: A review. Polym. Degrad. Stab. 2024, 228, 110902. [Google Scholar] [CrossRef]
  20. Li, S.; Cheng, P.; Ahzi, S.; Peng, Y.; Wang, K.; Chinesta, F.; Correia, J.P.M. Advances in hybrid fibres reinforced polymer-based composites prepared by FDM: A review on mechanical properties and prospects. Compos. Commun. 2023, 40, 101592. [Google Scholar] [CrossRef]
  21. Xu, X.; Ren, H.; Chen, S.; Luo, X.; Zhao, F.; Xiong, Y. Review on melt flow simulations for thermoplastics and their fiber reinforced composites in fused deposition modelling. J. Manuf. Process. 2023, 92, 272–286. [Google Scholar] [CrossRef]
  22. Mosleh, N.; Dariushi, S.; Esfandeh, M. An experimental and numerical investigation on mechanical properties of 3D printed continuous glass tow pre-reinforced composites. Rapid Prototyp. J. 2022, 28, 1284–1296. [Google Scholar] [CrossRef]
  23. Šeta, B.; Sandberg, M.; Brander, M.; Mollah, M.T.; Pokkalla, D.K.; Kumar, V.; Spangenberg, J. Numerical modelling of fibre orientation in multi-layer, isothermal material-extrusion big area additive manufacturing. Addit. Manuf. 2024, 92, 104396. [Google Scholar]
  24. Serdeczny, M.P.; Comminal, R.; Mollah, M.T.; Pedersen, D.B.; Spangenberg, J. Viscoelastic simulation and optimisation of the polymer flow through the hot-end during filament-based material extrusion additive manufacturing. Virtual Phys. Prototyp. 2022, 17, 205–219. [Google Scholar] [CrossRef]
  25. Ren, S.; Han, Z.; Xiong, Y.; Wei, H.; Xiao, J.; Wen, L.; Lei, M.; Hou, X. Crystallization-induced residual deformation evolution in thermoplastics during material extrusion and subsequent annealing. Mech. Mater. 2025, 206, 105345. [Google Scholar] [CrossRef]
  26. Samy, A.A.; Golbang, A.; Harkin-Jones, E.; Archer, E.; Tormey, D.; McIlhagger, A. Finite element analysis of residual stress and warpage in a 3D printed semi-crystalline polymer: Effect of ambient temperature and nozzle speed. J. Manuf. Process. 2021, 10, 70. [Google Scholar] [CrossRef]
  27. Hirt, C.W.; Nichols, B.D. Volume of fluid (VOF) method for the dynamics of free boundaries. J. Comput. Phys. 1981, 39, 201–225. [Google Scholar] [CrossRef]
  28. Osher, S.; Sethian, J.A. Fronts propagating with curvature-dependent speed: Algorithms based on Hamilton-Jacobi formulations. J. Comput. Phys. 1988, 79, 12–49. [Google Scholar] [CrossRef]
  29. Serdeczny, M.P.; Comminal, R.; Pedersen, D.B.; Spangenberg, J. Numerical simulations of the mesostructure formation in material extrusion additive manufacturing. Addit. Manuf. 2019, 28, 419–429. [Google Scholar] [CrossRef]
  30. Qiu, W.; Xu, X.; Dong, K.; Wang, Y.; Xiong, Y. Recent advances in 4D printing of fibre-reinforced polymer composites: A review and outlook. Compos. Part. B Eng. 2024, 283, 111645. [Google Scholar] [CrossRef]
  31. Anerao, P.; Kulkarni, A.; Munde, Y. A review on exploration of the mechanical characteristics of 3D-printed biocomposites fabricated by fused deposition modelling (FDM). Rapid Prototyp. J. 2024, 30, 430–440. [Google Scholar] [CrossRef]
  32. Awasthi, P.; Banerjee, S.S. Fused Deposition Modelling of Thermoplastics Elastomeric Materials: Challenges and Opportunities. Addit. Manuf. 2021, 6, 102177. [Google Scholar]
  33. Wang, Y.; Lei, M.; Wei, Q.; Wang, Y.; Zhang, J.; Guo, Y.; Saroia, J. 3D printing biocompatible l-Arg/GNPs/PLA nanocomposites with enhanced mechanical property and thermal stability. J. Mater. Sci. 2022, 55, 5064–5078. [Google Scholar] [CrossRef]
  34. Lei, M.; Wei, Q.; Li, M.; Zhang, J.; Yang, R.; Wang, Y. Numerical simulation and experimental study the effects of process parameters on filament morphology and mechanical properties of FDM 3D printed PLA/GNPs nanocomposite. Polymers 2022, 14, 3081. [Google Scholar] [CrossRef]
  35. Mulbah, C.; Kang, C.; Mao, N. A review of VOF methods for simulating bubble dynamics. Prog. Nucl. Energy 2022, 154, 104478. [Google Scholar] [CrossRef]
  36. ISO 4287; Geometrical Product Specification (GPS)—Surface Texture: Pro-file Method—Terms, Definition and Surface Texture Parameters. International Organization for Standardization (ISO): Geneva, Switzerland, 1997.
  37. Bochmann, L.; Bayley, C.; Helu, M.; Transchel, R.; Wegener, K.; Dornfeld, D. Understanding error generation in fused deposition modelling. Surf. Topogr. Metrol. Prop. 2015, 3, 014002. [Google Scholar] [CrossRef]
  38. ASTM D638-14; Standard Test Method for Tensile Properties of Plastics. ASTM International: West Conshohocken, PA, USA, 2014.
  39. Schwartz, J.J.; Hamel, J.; Ekstrom, T.; Ndagang, L.; Boydston, A.J. Not all PLA filaments are created equal: An experimental investigation. Rapid Prototyp. J. 2020, 26, 1263–1276. [Google Scholar] [CrossRef]
Figure 1. SEM image of the fracture surface of the starting feedstocks: (a) sheet-like aggregation of GNPs after twin-screw extrusion blending; (b) uniformly dispersed GNPs aggregation after the secondary extrusion in the single screw extruder.
Jcs 09 00585 g001
Figure 2. Numerical simulation method for 3D printing of polymer composites: (a) schematic of the 3D printing process; (b) 3D geometry of the computational model.
Jcs 09 00585 g002
Figure 3. Geometric models for mesostructure numerical simulation: (a) single-filament deposition model; (b) “side deposition” model for multi-filament deposition; (c) “top deposition” model for multi-filament deposition; (d) example of the Cartesian cut-cell mesh used in the simulations.
Jcs 09 00585 g003
Figure 4. Comparison of the mesostructure of representative volume elements for aligned and skewed deposition configurations.
Jcs 09 00585 g004
Figure 5. Schematic for calculating the arithmetic mean deviation R a of a 3D-printed part’s surface profile.
Jcs 09 00585 g005
Figure 6. Comparison of simulated (left) and experimental (right) cross-sectional morphologies of deposited PLA/GNP composite filaments under different printing parameters.
Jcs 09 00585 g006aJcs 09 00585 g006b
Figure 7. Comparison of simulated (left column) and experimental (right column) results for mesostructure morphology.
Jcs 09 00585 g007
Figure 8. Effect of printing parameters on surface roughness: (a) horizontal surface roughness; (b) vertical surface roughness.
Jcs 09 00585 g008aJcs 09 00585 g008b
Figure 9. Effect of printing parameters on dimensional accuracy and tensile strength: (a) X-axis dimensional accuracy; (b) Y-axis dimensional accuracy; (c) Z-axis dimensional accuracy; (d) tensile strength.
Jcs 09 00585 g009aJcs 09 00585 g009b
Figure 10. SEM image of the fracture surface of the printed sample after tensile failure under different printing conditions: (a) high printing temperatures and velocity condition; (b) low printing temperatures and velocity condition.
Jcs 09 00585 g010
Table 1. Summary of material properties used in the numerical simulation.
ParametersSignalValue
Density of PLA/GNP nanocomposite (kg/m3) ρ p 1300
Viscosity of PLA/GNP nanocomposite (Pa·s, range-function of T) μ p 20–8000
Thermal conductivity of the nanocomposite (W/mK) k p 0.195
Specific heat capacity of nanocomposite (J/kg K) c p , p 2000
Surface tension coefficient (kg/s2) σ 0.04
Density of the air (kg/m3) ρ a 0.9
Viscosity of the air (Pa·s) μ a 2.3 × 10⁻⁵
Thermal conductivity of the air (W/mK) k a 0.034
Specific heat capacity of the air (J/kgK) c p , a 1000
Table 2. Summary of the printing parameters used in the simulation.
ParametersSymbolValueUnit
Nozzle velocityVn30, 40, 50mm/s
Nozzle temperatureTn180, 200, 220°C
Air temperatureTa25°C
Nozzle diameterD0.4mm
Feed rateQfr5.024mm3/s
Substrate temperatureTs25°C
Gap distanceg0.4mm
Disclaimer/Publisher’s Note: The statements, opinions and data contained in all publications are solely those of the individual author(s) and contributor(s) and not of MDPI and/or the editor(s). MDPI and/or the editor(s) disclaim responsibility for any injury to people or property resulting from any ideas, methods, instructions or products referred to in the content.