Article

Behaviour Analysis of Timber–Concrete Composite Floor Structure with Granite Chip Connection

Faculty of Civil and Mechanical Engineering, Institute of Civil Engineering, Riga Technical University, 1048 Riga, Latvia
*
Authors to whom correspondence should be addressed.
J. Compos. Sci. 2025, 9(10), 538; https://doi.org/10.3390/jcs9100538
Submission received: 1 August 2025 / Revised: 14 September 2025 / Accepted: 18 September 2025 / Published: 2 October 2025
(This article belongs to the Special Issue Behaviour and Analysis of Timber–Concrete Composite Structures)

Abstract

This study investigates the mechanical behaviour of timber–concrete composite (TCC) floor members with an innovative adhesive connection reinforced by granite chips, glass fibre yarn net in the epoxy adhesive layer, and polypropylene (PP) fibres in the concrete layer. Laboratory tests involved three groups of specimens subjected to three-point bending over a span of 500 mm with specimen lengths of 550 mm. Group A specimens exhibited crack initiation at approximately 8 kN and partial disintegration at an average load of 11.17 kN, with maximum vertical displacements ranging from 1.7 to 2.5 mm at 8 kN load, increasing rapidly to 4.3 to 5 mm post-cracking. The addition of reinforcing fibres decreased the brittleness of the adhesive connection and improved load-bearing capacity. Finite element modeling using the newly developed Verisim4D software (2025 v 0.6) and analytical micromechanics approaches demonstrated satisfactory accuracy in predicting the composite behavior. This research highlights the potential of reinforcing the adhesive layer and concrete with fibres to enhance the ductility and durability of TCC members under flexural loading.

1. Introduction

1.1. Incorporation of Granite Chunks into a Timber–Concrete Composite

Integrating granite chips into a timber–concrete composite (TCC) floor structure has emerged as a promising strategy to enhance the interfacial behaviour between the timber, typically cross-laminated timber (CLT), and the overlaid concrete slab. Buka-Vaivade et al. [1] have demonstrated that glueing granite chips onto the surface of the CLT panel creates a rigid connection between the layers. This connection increases the composite action by effectively transferring stresses between the disconnected materials, potentially increasing the system’s overall stiffness and load-bearing capacity.
The physical role of granite chips in this context is twofold. First, as a high-strength aggregate with excellent durability, granite chips are an efficient bridging material that mitigates potential slip between the timber and concrete layers. Second, their incorporation into the adhesive interface can lead to a more homogeneous stress distribution and improve the bond quality at the connection, which is critical for ensuring long-term performance under service loading. Studies have indicated that including recycled aggregates, such as granite cutting residues, can enhance the mechanical properties of concrete pavements [2].
Timber–concrete composite floors offer substantial advantages over conventional wood or concrete floors. Movaffaghi et al. [3] noted that TCC floors can effectively address issues such as excessive deflection and insufficient acoustic separation by leveraging the complementary properties of timber (e.g., tensile strength, lightweight) and concrete (e.g., compressive strength, rigidity). Moreover, Shi et al. [4] provide evidence to suggest that the long-term behaviour of these composites—encompassing benefits like enhanced fire resistance, vibration control, and durability—is superior to that of traditional systems. The use of granite chips in these composite layers is associated with performance improvements, as the rigid connection they facilitate is a key contributor to the overall mechanical and serviceability performance of the floor system.
In addition to performance advantages, sustainability is a crucial driver in modern construction practices. Incorporating granite chips, particularly if sourced from recycled or waste streams, aligns with environmental sustainability goals by reducing the reliance on virgin materials and lowering the ecological footprint of the overall structure. Eslami et al. [5] have conducted life cycle assessments that underscore the potential environmental benefits of TCC systems. Their findings indicate that integrating recycled components such as granite chips may further enhance the sustainability credentials of TCC floors, making them an attractive option for green and resilient building design.
The combination of timber and concrete leverages the strengths of both materials, providing flexibility, durability, and enhanced load-bearing capacity, which are essential in tall and expansive structures. Ilgın and Aslantamer highlight the rising use of such composite systems in high-rise residential buildings, noting their capability to enhance both space efficiency and structural integrity [6].
The environmental benefits of mass timber composite systems are significant, as discussed by Nepal et al. [7], who explore how the incorporation of mass timber materials in construction can lead to substantial carbon reductions in the United States. The use of engineered wood products, such as cross-laminated timber (CLT), takes advantage of timber’s carbon-sequestering properties while decreasing reliance on more carbon-intensive materials like steel and concrete [8]. Furthermore, Ustinovichius et al. [9] elucidate the advantages specific to mass timber, including ease of assembly, lightweight nature, and favorable life-cycle emissions, positioning it as a competitive alternative in modern construction practices.
In contrast to conventional materials, mass timber configurations enhance ecological outcomes and performance metrics such as acoustics and fire resistance. Pastori et al. [10] investigate how combining timber with concrete in ventilated façade systems can address some of the acoustic limitations typically associated with lighter timber constructions. Moreover, as the industry progresses, standards and regulations have evolved; the updated International Building Code (IBC) now allows the use of mass timber in taller structures, reflecting a significant shift in building practices and regulations [7].
Advancements in floor systems made from timber composites also depend on innovation in prefabricated designs. Gutiérrez et al. [11] demonstrate how prefabricated composites, including novel floor systems integrating steel and timber, improve construction efficiency while showing significant enhancements in load-bearing capacity and stability. These collaborations in material engineering augment the versatility of mass timber solutions, enabling them to meet diverse architectural demands without sacrificing structural integrity.
In the field of design and infrastructure, cross-laminated timber is prominent due to its robustness and unique attributes. The application of CLT is extensively documented across mass timber projects in North America, where builders utilize its capacity for rapid assembly and reduced construction waste. At the same time, the architectural community increasingly appreciates its aesthetic qualities, which align with contemporary sustainability goals [12].

1.2. Complex Behaviour of Timber–Concrete Composites

The timber–concrete composite (TCC) system demonstrates a complex behaviour governed by the inherent material properties of timber and concrete and the performance of their connecting elements. Experimental and numerical investigations have confirmed that effective load transfer between the concrete slab and timber beam results from careful connector design, ensuring that the tensile strength of timber is complemented by the compressive capacity of concrete [13,14]. These connections—including mechanical fasteners like coach screws and notched systems—have been shown to provide adequate ductility and stiffness under both static and dynamic loads [15,16].
Research has extensively focused on the mechanics of the interface, where slip and uplift phenomena are critical to the overall performance of TCC members. For instance, Jian-Ying et al. [17] provided theoretical and experimental insights into the slip and uplift behaviour along the interlayer, highlighting that adequate connection stiffness is essential for mitigating excessive deformations. Similarly, Denouwé et al. [18] demonstrated that the presence of an interlayer can significantly modify the shear strength and stiffness by altering the effective bond characteristics between materials; moreover, studies by Liu et al. [19] have shown that innovative connector configurations, such as steel tube connectors, can enhance ductility and ultimate load capacity, which is key to maintaining structural integrity under variable load conditions.
Dynamic considerations also play an integral role in understanding TCC behaviour. The dynamic properties, including vibration characteristics and damping, have been identified as essential parameters influencing serviceability. Complementary experimental studies have demonstrated that composite beams tend to have fundamental natural frequencies well above the critical comfort threshold, thereby ensuring a stable dynamic response even under cyclic or transient forces [14,16,20]. The interplay between mass distribution, connection rigidity, and composite action is critical in optimising TCC systems for short- and long-span applications.
Furthermore, recent analytical models have been developed to predict the long-term performance of TCC systems under sustained loads and environmental variations [4]. These models integrate non-linear load-slip relationships and material creep properties, facilitating improved predictions of service life and maintenance needs. Complementary analytical procedures, as discussed by Mirdad et al. [21], further emphasise that parameters such as screw spacing and timber thickness are pivotal to the long-term behaviour of the system. Additionally, comprehensive reviews on connection performance have provided guidelines for calibrating numerical models that factor in ductility and energy dissipation capacity [22].
Timber and timber-based composites have gained significant popularity lately, especially in global efforts to mitigate climate change. Each m3 of timber stores around 0.9 tons of CO2 over its life cycle, thus acting as a “carbon storage” and significantly reducing greenhouse gas emissions. In addition, replacing steel and concrete with wood reduces CO2 emissions by 1–2.5 tons per cubic meter on average [23]. These properties make wood an indispensable material for sustainable construction.
Recent research on timber–concrete composite (TCC) floor systems, especially those using cross-laminated timber (CLT) panels, has made significant strides in enhancing both structural performance and economic efficiency. Thai et al. [24] conducted comprehensive multi-objective optimization studies on long-span composite floors, highlighting that serviceability limit state constraints, such as deflection and vibration, alongside fire-related ultimate limit state constraints, primarily govern the design. Their parametric analyses demonstrated that longer floor spans require increased use of both timber and concrete, with timber accounting for a substantial portion of the total cost. Additionally, the choice of CLT panel type, concrete grade, and connector design heavily influences the balance between cost and performance. Importantly, their work emphasises that simplified optimisation methods can be effectively applied by engineers to achieve economically viable and high-performing floor solutions while complying with construction standards.
Complementing these findings, Shahnewaz et al. [25] provided experimental and numerical investigations into deconstructable TCC beams, offering valuable insights into the structural behaviour and feasibility of panelized slabs. This research supports the broader push towards sustainable, reusable composite floor systems, which are crucial for reducing waste and facilitating end-of-life disassembly. Although current optimisation efforts primarily focus on structural and economic criteria, gaps remain concerning the integration of environmental impact assessments and comparisons with alternative floor systems, such as fully timber or fully concrete floors [26]. Addressing these aspects in future studies by incorporating environmental objectives and handling data uncertainties will be essential to promote eco-responsible, resilient multi-story buildings utilising timber-concrete composites.
Timber–concrete composite (TCC) is a modern solution in structural engineering that combines the advantages of timber and concrete while reducing their weaknesses. Wood, a lightweight, renewable and environmentally friendly material, offers flexibility and sustainability, while concrete is distinguished by its high compressive strength and durability. The combination of these materials improves the performance of structures and contributes to global efforts to create a sustainable and climate-neutral environment. TCC structures also significantly reduce the overall self-weight of the structures, allowing for more economical foundation design and simplified transportation.
The role of adhesive connections in TCC structures is critical to their performance. Adhesive connection provides a strong, elastic connection between the timber and the concrete, allowing full load distribution and improving structural integrity and stiffness of the composite cross-section. Recent studies have shown that enhanced bonding solutions, such as the incorporation of granite chips, significantly improve the load-bearing capacity of TCC panels by 28.1% [27] up to 40% [28]. Also, other publications have observed that epoxy-bonded wood and concrete could form a strong and rigid interface to transfer the shear in TCC panels subjected to quasi-static bending, without failure and visible slip, while also noticing that the shortcomings of TCC decks were brittle [29]. Therefore, it is necessary to find ways to decrease the brittleness of the adhesive connection. These findings highlight the potential of advanced bonding technologies to transform the design and application of TCC structures.
The shear connection between timber and concrete can be evaluated as semi-rigid due to the slip that occurs at their interface. The calculation approach is outlined in the technical standard EN 1995-1-1/Annex B [30], commonly referred to as the γ-method, which expresses the degree of shear connection using a coefficient γ. The formula for this coefficient is as follows:
  γ 1 = 1 + π 2 E 1 A 1 s K L 2 1
γ 1 —coefficient γ of ith part of cross-section.
  E 1 —Young’s modulus of elasticity of ith part of cross-section.
  A 1 —area of ith part of cross-section.
  s —spacing of fasteners longitudinal with axis of beam.
  K —slip modulus of fasteners (K ser for service limit state—SLS, K u for ultimate limit state—ULS).
  L —span of the beam.
If there is no shear connection between the timber and the concrete, the value of the coefficient γ1 is 0. If they are completely rigidly connected, the value of γ1 is 1. This means that, in all real cases, the value of the γ1 coefficient lies between 0 and 1.
The influence of the mechanical properties of the concrete and epoxy glue layers on the decrease in brittleness of the adhesive glued connections was investigated in the current study. Previous investigations have shown that adding polypropylene fibres to the concrete layer of the TCC panels enables a decrease in the brittleness of the adhesive timber-to-concrete connections and prevents the specimens from disintegrating during their collapse [27]. The possibility of decreasing the brittleness of the adhesive timber-to-concrete connections in TCC members subjected to flexure by the reinforcement of the epoxy glue layer with glass fibre yarns was checked in the current study.
This study analyses the behaviour of TCC slab structures with an adhesive granite-chip connection method, providing insights into their structural properties and the potential for adhesive connection improvement. Three types of TCC test subjects were prepared, each containing 10 elements, totalling 30. TCC test elements comprised a 40 mm thick (29-layer) plywood, 550 mm long and 100 mm wide, and a 20 mm thick concrete layer on top. A type element had no additions; type B elements had glass fibre yarn net reinforcing the epoxy glue layer. Type D had polypropylene fibres in the concrete layer and glass fibre yarns as a net reinforcing the epoxy glue layer. The span of the three-point bending test was 500 mm. The test results were compared to the finite element method and other analytical calculations.
Finite element method (FEM) models created to simulate the behaviour of TCC span from relatively simple to rather intricate. The authors used ANSYS (2022 R1 Student Version) software to verify the results of previous experiments. In these models, the concrete layer was modelled as either a SOLID-type or a layer of SHELL element, and timber was modelled as BEAM or SHELL-type elements with an orthotropic material model. While the most significant challenge is the mathematical model of structural timber elements, other authors have used continuum damage mechanics to attain the projected brittle nature of the failure, also using cohesive elements to model cracking caused by connecting steel elements [31,32,33]. Since most TCC elements in the literature are made by using mechanical connectors such as screws or dowels, the connections between concrete and timber are usually modelled as elastic spring elements, which are defined by the load–displacement curves obtained from the connectors’ slip test properties.
An elaborate FEM model was developed to verify the lab experiment results, using newly developed Verisim4D software [34]. Both concrete and timber were modelled as solid finite elements. When defining timber mechanical properties for the FEM model, the non-uniformity of this material was reflected by the multi-axial failure and plasticity in parallel and perpendicular actions to the grain. The connection zone of the FEM model was created as a non-linear cohesive zone, governed by normal and shear stress–displacement curves.
So, the current study aims to improve the behaviour of TCC members subjected to flexure by the epoxy glue layer reinforced by the glass fibre yarn net. The possibility of predicting the behaviour of the TCC members using the newly developed Verisim4D software should also be checked.

2. Materials and Methods

2.1. General Approach

The influence of the adhesive layer’s mechanical properties on the behaviour of timber–concrete composite members subjected to bending was investigated analytically and through laboratory experiments. Different analytical methods can be used for behaviour analyses of timber–concrete composite members. They were compared first, and a micromechanics approach for layered material was chosen for further analytical analysis. Laboratory specimens with a length of 550 mm and a span of 500 mm were analyzed first by the micromechanics approach for layered material and tested in laboratory conditions. Three groups of laboratory specimens were prepared and tested by three-point bending. The first group includes the specimens with a 40 mm thick plywood bottom layer joined with the top concrete layer by the granite chip method. The second group comprises identical specimens with the glass yarn net reinforcement within the adhesive layer. The final group of specimens is characterized by the adhesive layer reinforced by the glass yarn net and the concrete layer with the added polypropylene fibres. The groups of specimens are comprehensively described in Section 2.3. The load–displacement curves and failure mode observed for three groups of the laboratory specimens allow us to conclude about the influence of the adhesive and concrete layers and additional reinforcement on the behaviour of the timber–concrete composite member subjected to bending.
The FE method modelled all three types of laboratory specimens in the newly developed software “Verisim4D”. Comparison of the results obtained by the laboratory experiment with results derived from FEM and micromechanics approach for layered material offers the possibility of the application of the methods for the behaviour prediction of timber–concrete composite members with and without additional reinforcements of the adhesive and concrete layers.

2.2. Comparison of Analytical Design Methods for Timber–Concrete Composite Members with Reinforced Adhesive Layer

It is essential to choose an appropriate design method that reflects the interaction of the different materials, the properties of the connection and the deformation of the structure to analyze the behaviour of a timber–concrete composite (TCC) member with adhesive connection. Several theoretically analytical approaches were considered in the current study: composite equations, CEREMA method, semi-analytical Vh-s relation (Bazant approach), gamma method (current EC5, annexe B.) [30] and layered material macro-mechanics. Each design method has its advantages and limitations, and their choice affects the accuracy, complexity, and applicability of the calculations in practice.
The composite equations (governing equations of a composite beam) are based on a system of differential equations describing the distribution of deformation and shear forces between the timber and concrete layers. Their main advantage is the ability to accurately describe sliding at the interface, but this method requires precise material parameters and is relatively complex to apply manually.
The CEREMA method, a simplified form of this approach with sinusoidal slip distribution, is helpful for cases with simple loading conditions (e.g., uniformly distributed loads) but unsuitable for complex loading cases or structures with non-uniform geometry.
The semi-analytical Vh-s method (Bazant and Wittek) allows the inclusion of non-linear coupling behaviour often observed in mechanical couplings. Its most significant advantage is the possibility to simulate the stiffness reduction of the connection after a certain level of loading, which makes the method suitable for structures with adhesive timber-to-concrete connections and structures with dowel or pin connections. However, it is not ideal for adhesive joints, as these are most likely to be elastic to fracture, and it is not possible to accurately determine the transition points between behavioural segments without experimental data.
The Gamma method, on the other hand, is a simplified calculation approach used to estimate the effective bending stiffness assuming partial composite action. Its main advantages are its ease of implementation and suitability for structural design (also used in the Eurocode 5). However, the method was initially intended for structures with three or fewer load-bearing layers, so its direct application to TCC with an adhesive layer requires further adaptations (e.g., using the Equivalent Gamma Method approach). In addition, the gamma method cannot represent the distribution of shear strains over the span, which is essential in the case of locally stiffer or weaker connection sections.
The macro-mechanics of layered composite materials, based on the elastic properties of the separate layers, provides a comprehensive approach that considers the properties of each layer separately and allows the calculation of deformation and bending behaviour in different directions. This method is particularly well suited to cases where one of the layers (in this case, the adhesive layer with fibre reinforcement) influences the behaviour of the structure. The method has the advantage of high accuracy, the possibility to include orthotropic materials (e.g., plywood), and the direct link to composite theory. The disadvantages are the complexity of the calculation and the need to develop a total stiffness matrix for the composite.
A comparison of all the above-mentioned methods is given in Table 1.
So, the macro-mechanics of layered materials was chosen for further analytical analysis in the current study.

2.3. Design Method for a Timber–Concrete Composite Member Subjected to Bending

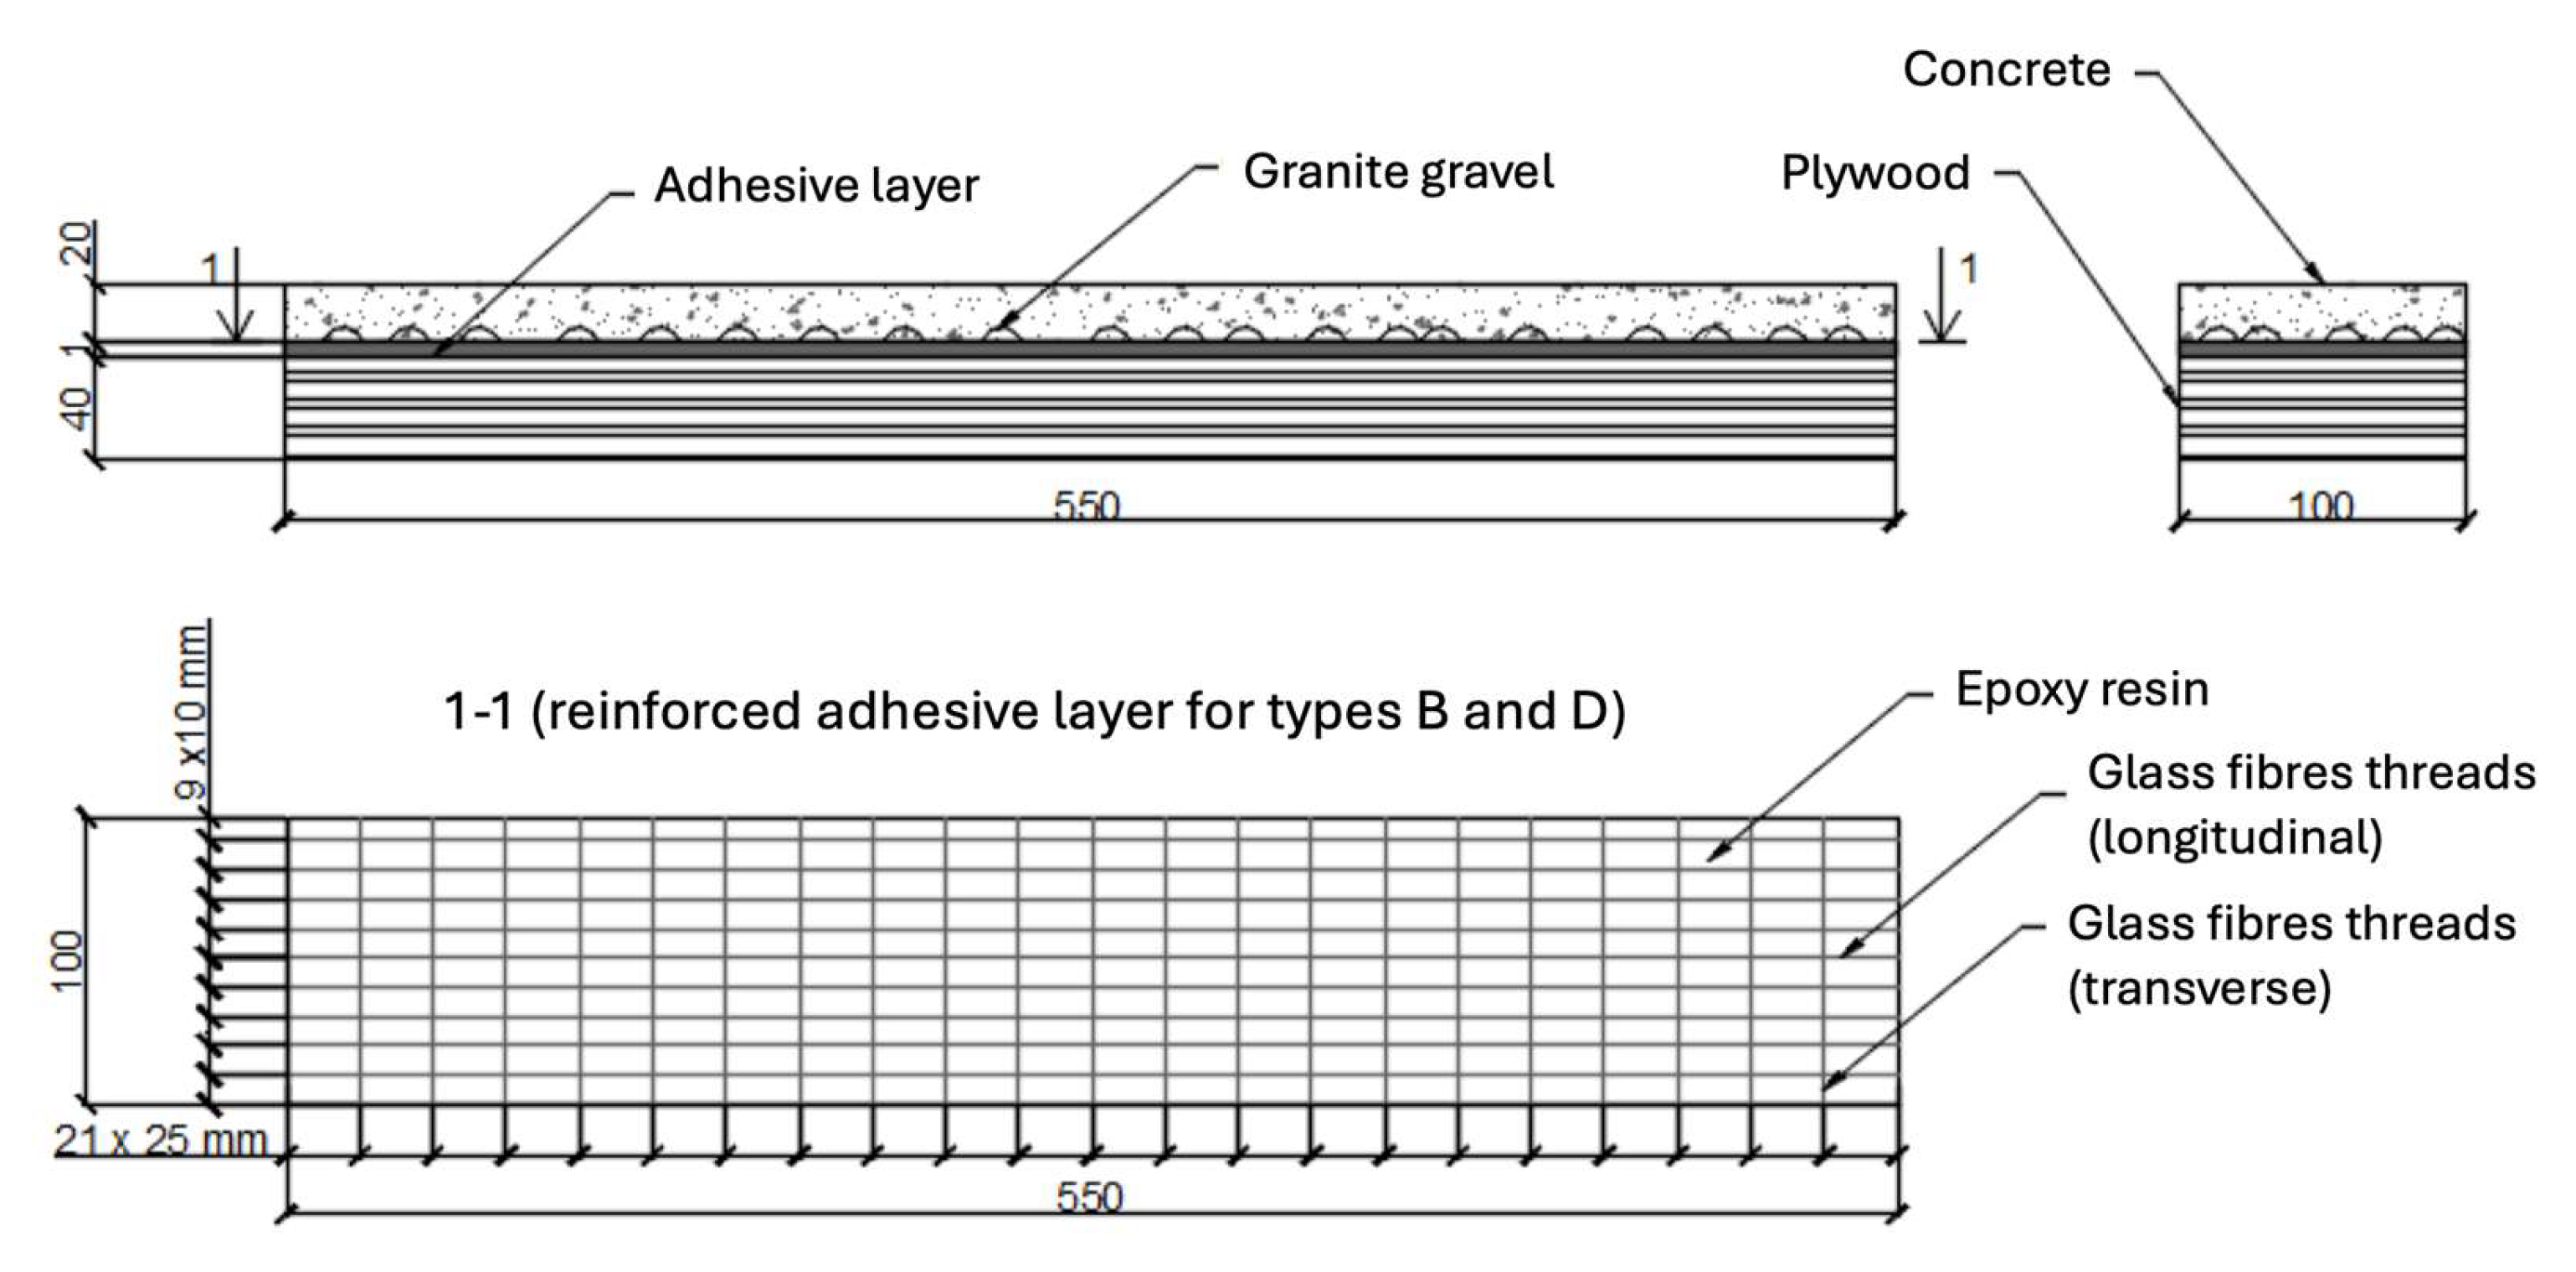
Based on the elastic properties of the separate layers, the macro-mechanics of layered composite materials were selected and considered for the analytical prediction of vertical displacements of timber–concrete composite members subjected to bending. The analytical prediction of vertical displacements is necessary for the results obtained by the FEM software “Verisim4D”. The timber–concrete composite specimens with the length, width and depth of cross-sections equal to 550 mm, 100 mm and 61 mm, described in the next Section 2.4, were analyzed. The design scheme and main geometric parameters of the specimens are shown in Figure 1.
The effective modulus and Poisson’s ratio of the reinforced epoxy matrix (adhesive connection layer) should be initially determined. It is assumed that the adhesive layer reinforced by the glass fibre net is integrated at two levels, which form two separate reinforcement layers in the epoxy glue matrix: the first layer is oriented in the longitudinal direction and the second in the transverse direction. After evaluating the properties of the two fibre layers, the overall effective mechanical properties are calculated, which allows this reinforced adhesive layer to be modelled as an isotropic material in future calculations.
The specimen is considered to consist of one isotropic and two orthotropic layers. The concrete layer is regarded as an isotropic one. The epoxy glue reinforced by the fibreglass net and a plywood base is considered an orthotropic layer. The stiffness matrices for the concrete layer are shown in Equation (1).
E, G and ν are the modulus of elasticity, shear modulus and Poisson’s ratio, respectively. The stiffness matrices for the concrete layer are shown in Equation (2).
Q i = Q 11 Q 12 0 Q 12 Q 22 0 0 0 Q 66
where
  C = E 1 1 ν 12 ν 21 ;   Q 22 = E 2 1 ν 12 ν 21 ;   Q 12 = ν 12 E 2 1 ν 12 ν 21 = ν 21 E 1 1 ν 12 ν 21 ;   Q 66 = G 12
E 12 , G 12 and ν 12 are the modulus of elasticity, shear modulus and Poisson’s ratio of the epoxy glue reinforced by the fibre glass net and a plywood layer in the longitudinal direction. E 21 , G 21 and ν 21 are the same values but in the transversal direction.
The maximum vertical displacements of the specimens are determined by Equation (3):
  Δ p = P l 3 48 E I = P l 3 A 11 48 b A 11 D 11 B 11 2
where A11, B11 and D11 are the stiffeners matrixes of the whole specimen, determined by Equations (4)–(6).
  A i j = k = 1 n Q i j ¯ k z k z k 1
B i j = 1 2 k = 1 n Q i j ¯ k z k 2 z k 1 2
D i j = 1 3 k = 1 n Q i j ¯ k z k 3 z k 1 3
where z k z k 1 are the thicknesses of the specimen’s layers.

2.4. Laboratory Experiment

A laboratory experiment was carried out to validate the FEM model created by the newly developed software Verisim4D and by the design method for timber–concrete composite member subjected to flexure, explained in the previous Section 2.3. Three groups of specimens (A, B and D) were prepared and tested.
All three groups are characterized by exact dimensions: the length, width and depth of cross-sections were equal to 550 mm, 100 mm and 61 mm, respectively (Figure 2).
Plywood members with dimensions 550 × 100 × 40 were used as a base for all three groups of specimens. The direction of the grains’ outer layer was perpendicular to the specimens’ longitudinal axis. The modulus of elasticity of plywood in the longitudinal direction is equal to 12 GPa. Poisson’s ratio of plywood in the same direction is equal to 0.2. The tensile and compressive strength of the plywood in the longitudinal direction are equal to 40 and 30 MPa, respectively. The shear strength of the plywood is equal to 2.25 MPa. The density of the plywood is equal to 0.8 kN/m3.
C30/37 class concrete (LVS EN 1992-1-1:2005 [36]) was used as the specimen’s top layer material. The modulus of elasticity and Poisson’s ratio equal 33 GPa and 0.2, respectively. Tensile and compressive strengths of the concrete are equal to 2.9 and 30 MPa, respectively. Two-component (A and B) epoxy glue XEPOX G with a modulus of elasticity and Poisson’s ratio equal to 3 GPa and 0.35 was used for plywood connection with the concrete layer. Tensile strength and strength in shear of the epoxy glue are equal to 30 and 25 MPa, correspondingly. The mixture of components A and B causes an exothermic reaction and forms a three-dimensional structure. Granite chips provided a plywood-to-concrete connection with dimensions 8–16 mm. The density of the concrete was equal to 2.4 kN/m3. The process of specimen preparation with the adhesive timber-to-concrete connection by the granite chip method was the same as in the previous investigations, described in detail in [1,13,18].
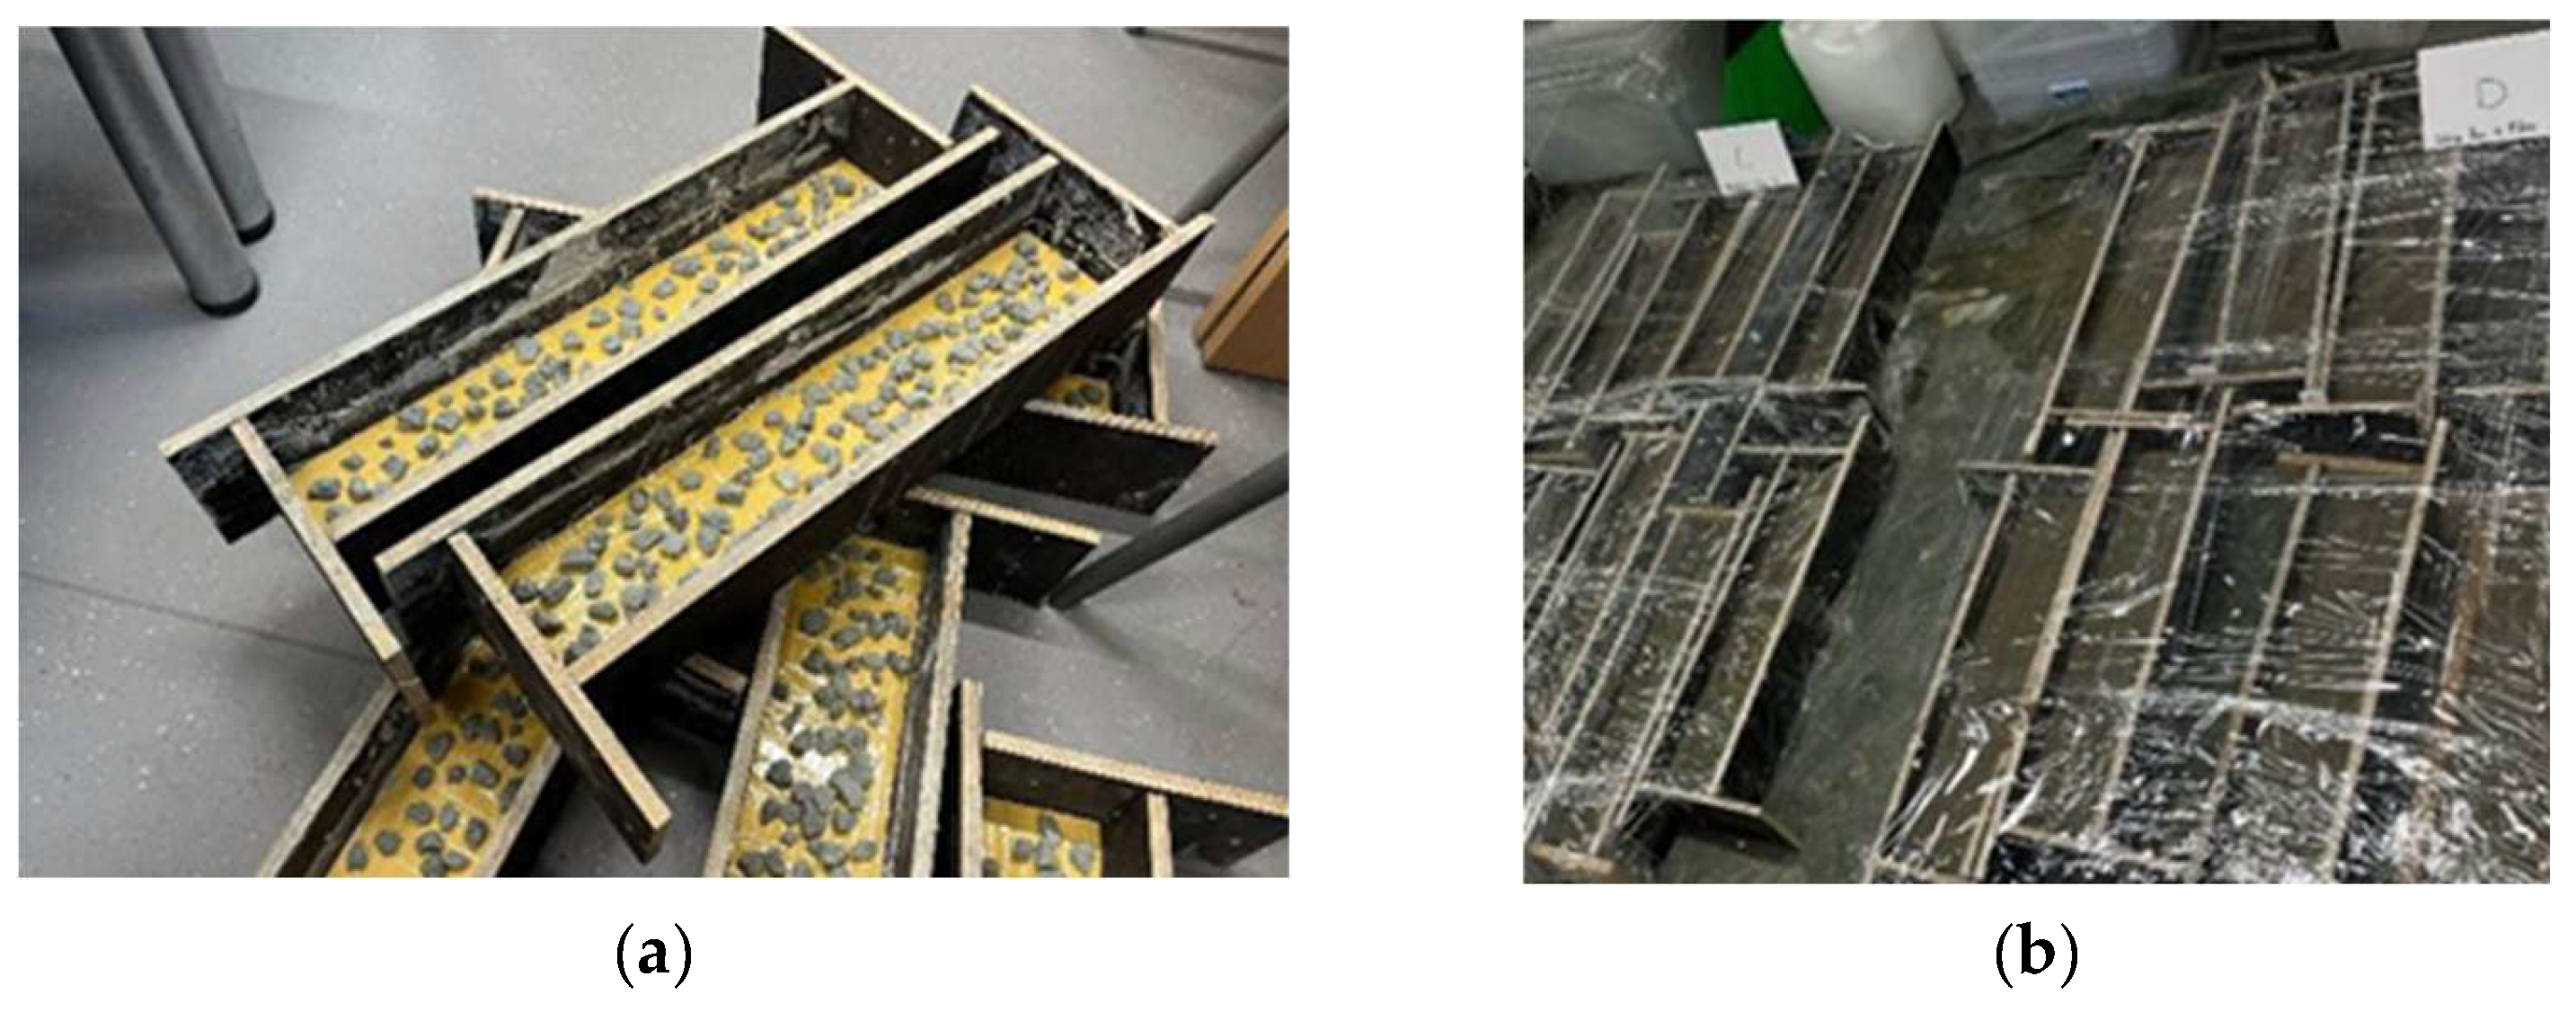
Group A’s specimens differ by the absence of epoxy glue and concrete layer strengthening. They are considered as etalons for the evaluation of the effects of the epoxy glue and concrete layer strengthening on the behaviour of the considered composite timber-to-concrete specimens. Two significant stages of group A specimen production are shown in Figure 3.
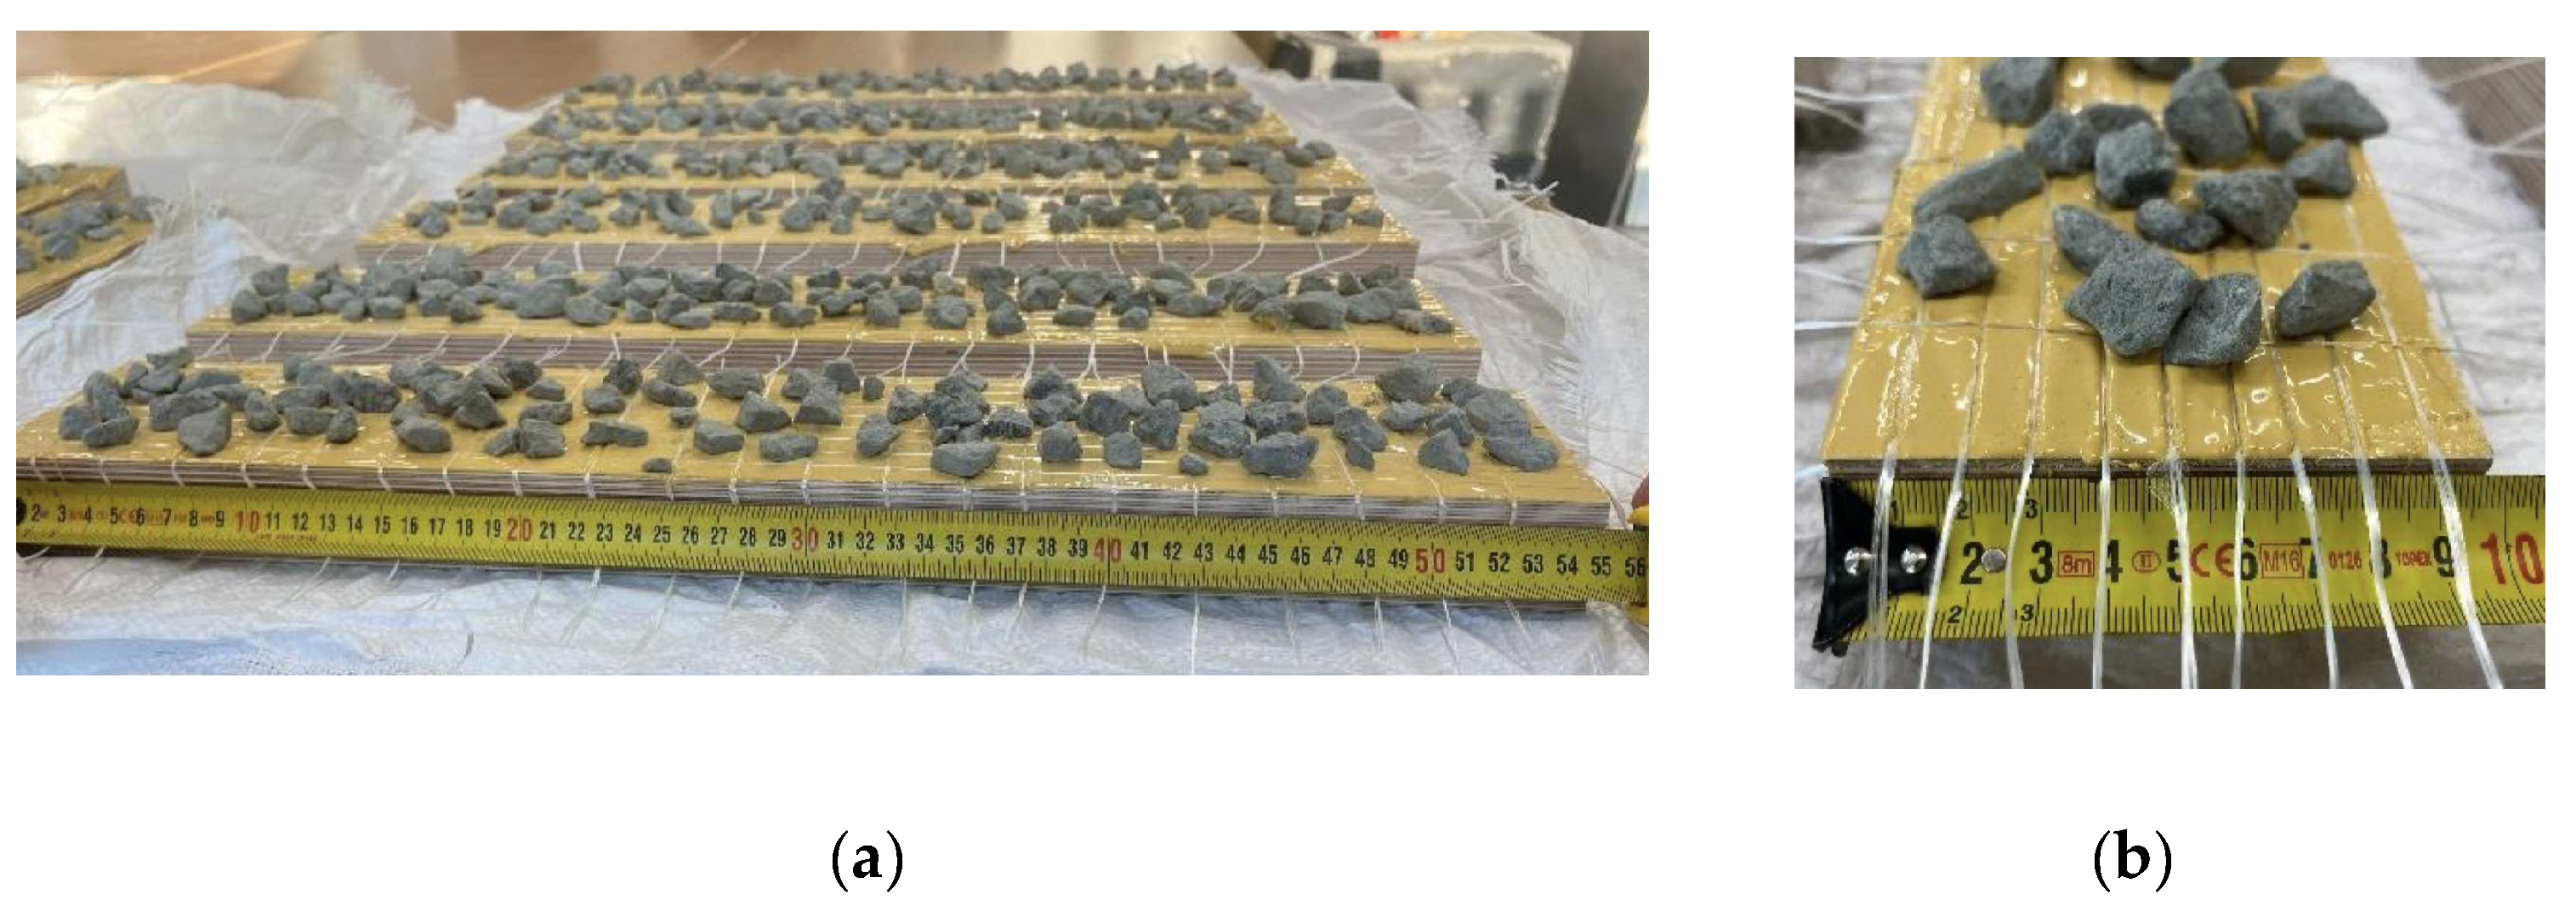
The group B specimens differed due to the strengthening of the epoxy glue layer by the net, consisting of the glass fibre yarns TNT 371404531 with a modulus of elasticity of 70 GPa, Poisson’s ratio’s ratio of 0.22 and tensile strength of 2000 MPa. The epoxy glue layer reinforcement scheme by the fibre yarn net is shown in Figure 4.
The group D specimens differed from the group B specimens by the addition of the MAPEI PP-Fiber M6 polypropylene fibres to the concrete layers.
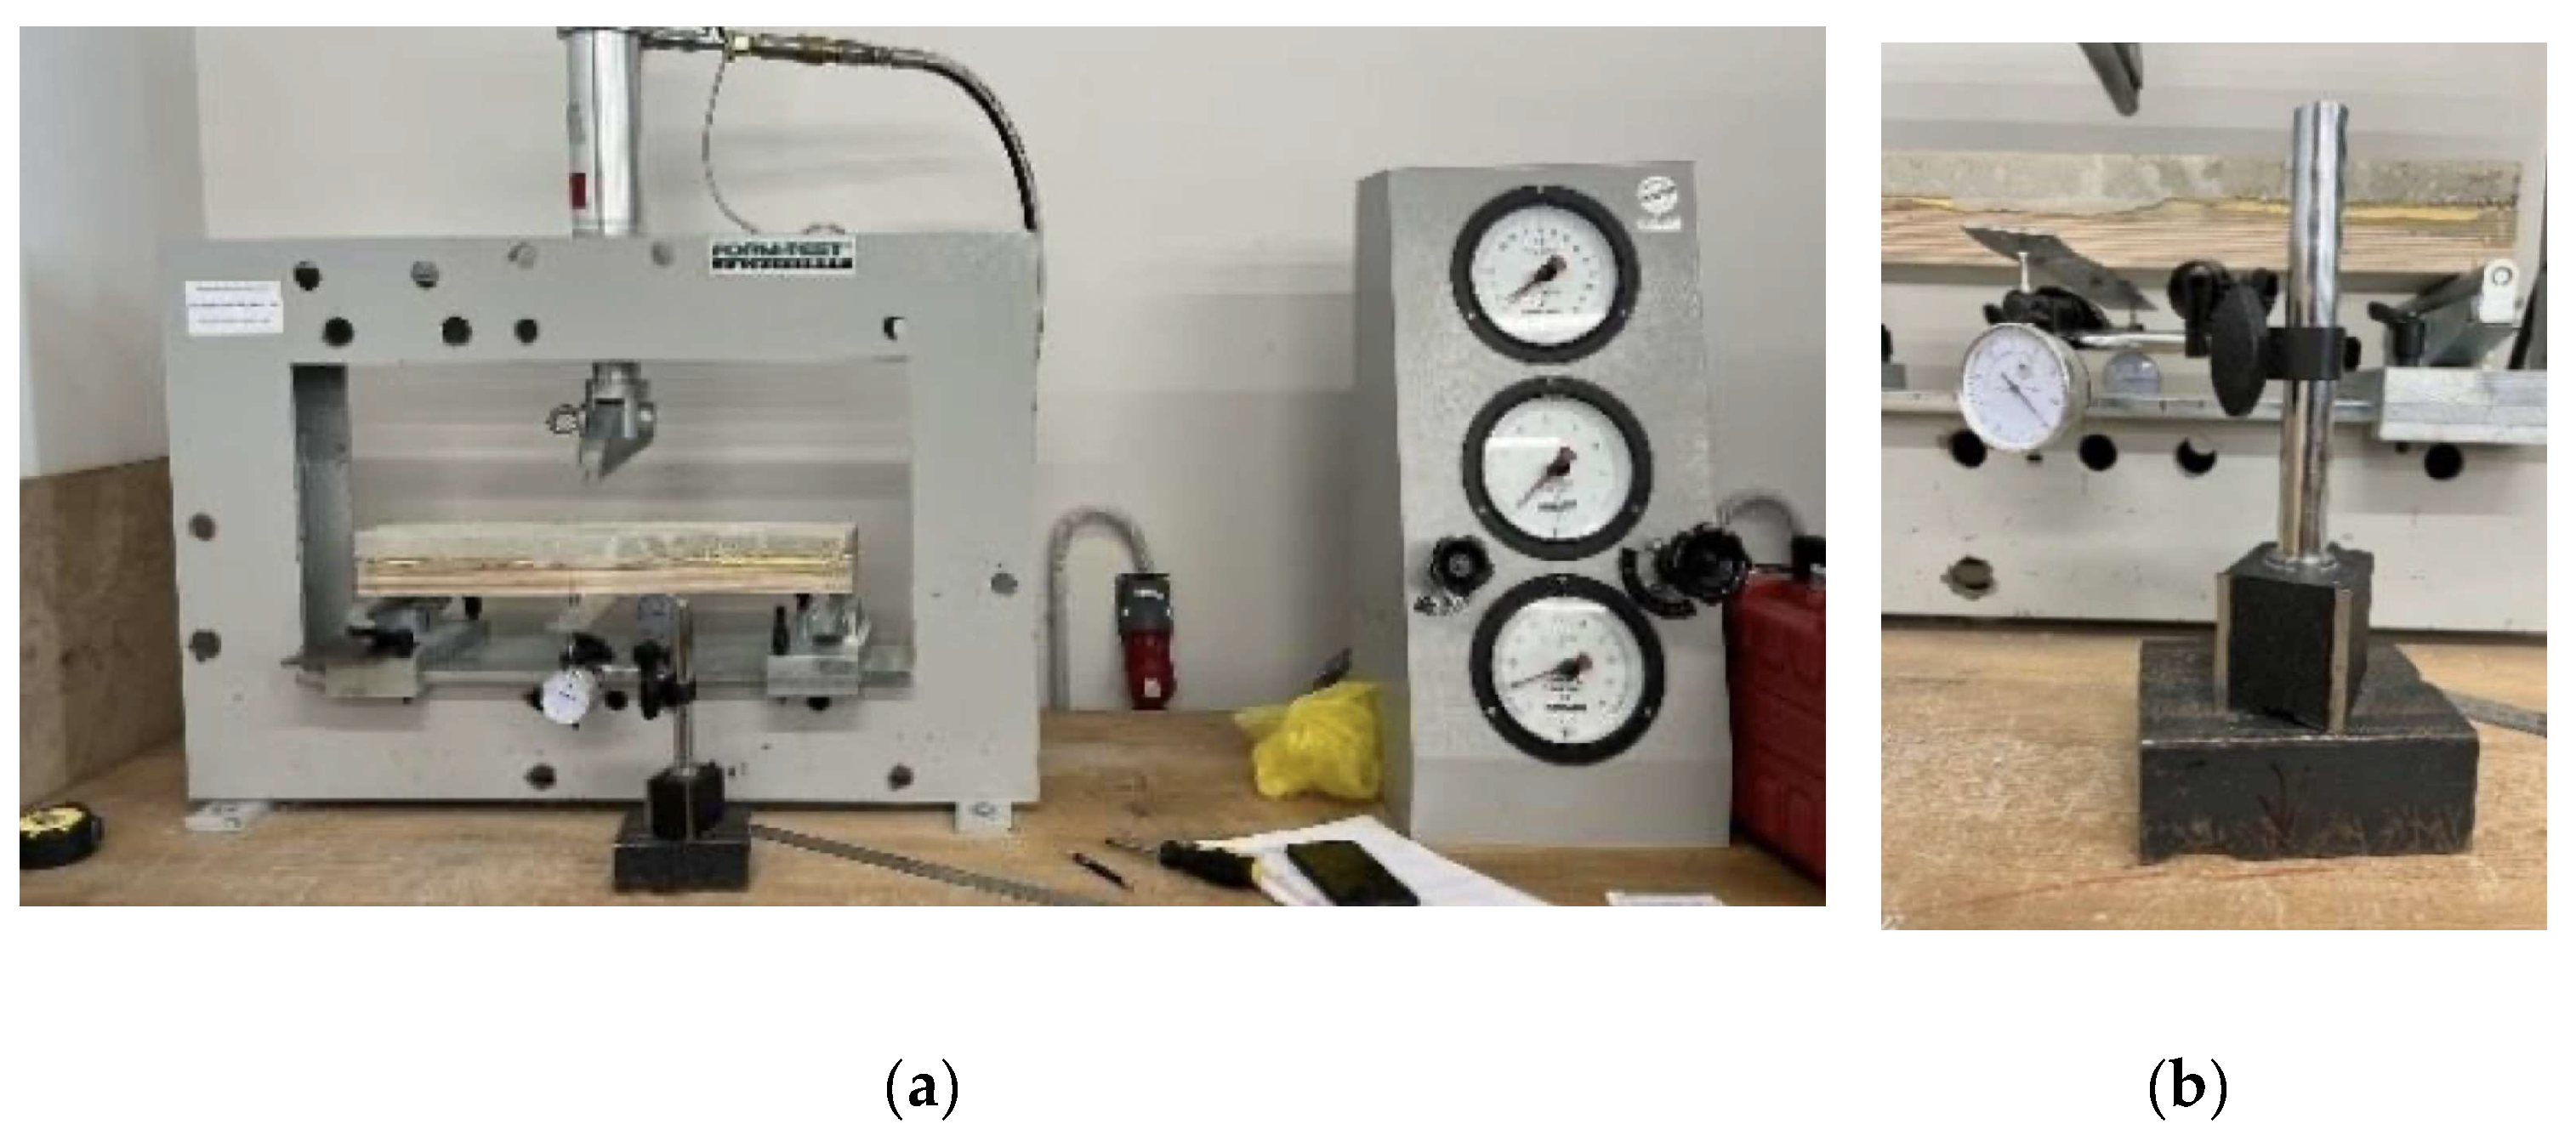
The three-point bending scheme tested all three groups of specimens using the device FORM+TEST UPB 86/200 (Figure 5). Each specimen was loaded three times to 8 kN with steps equal to 2 kN. The design value of the load-carrying capacity of A group of specimens in 8 kN was determined analytically by the macro-mechanics of layered materials and by the software “Verisim 4D”. After the first two loadings, the load was removed, but after the third loading, the load was increased until the collapse of the specimen. The maximum vertical displacements in the middle of the specimen’s span were determined at each loading stage by two mechanical indicators with a precision of 0.01 mm.
The maximum vertical displacements of the specimens were determined analytically by the macro-mechanics of layered composite materials and by the software “Verisim 4D”. Section 3 “Results and Discussions” presents the laboratory specimens testing results.

2.5. Finite Element Models

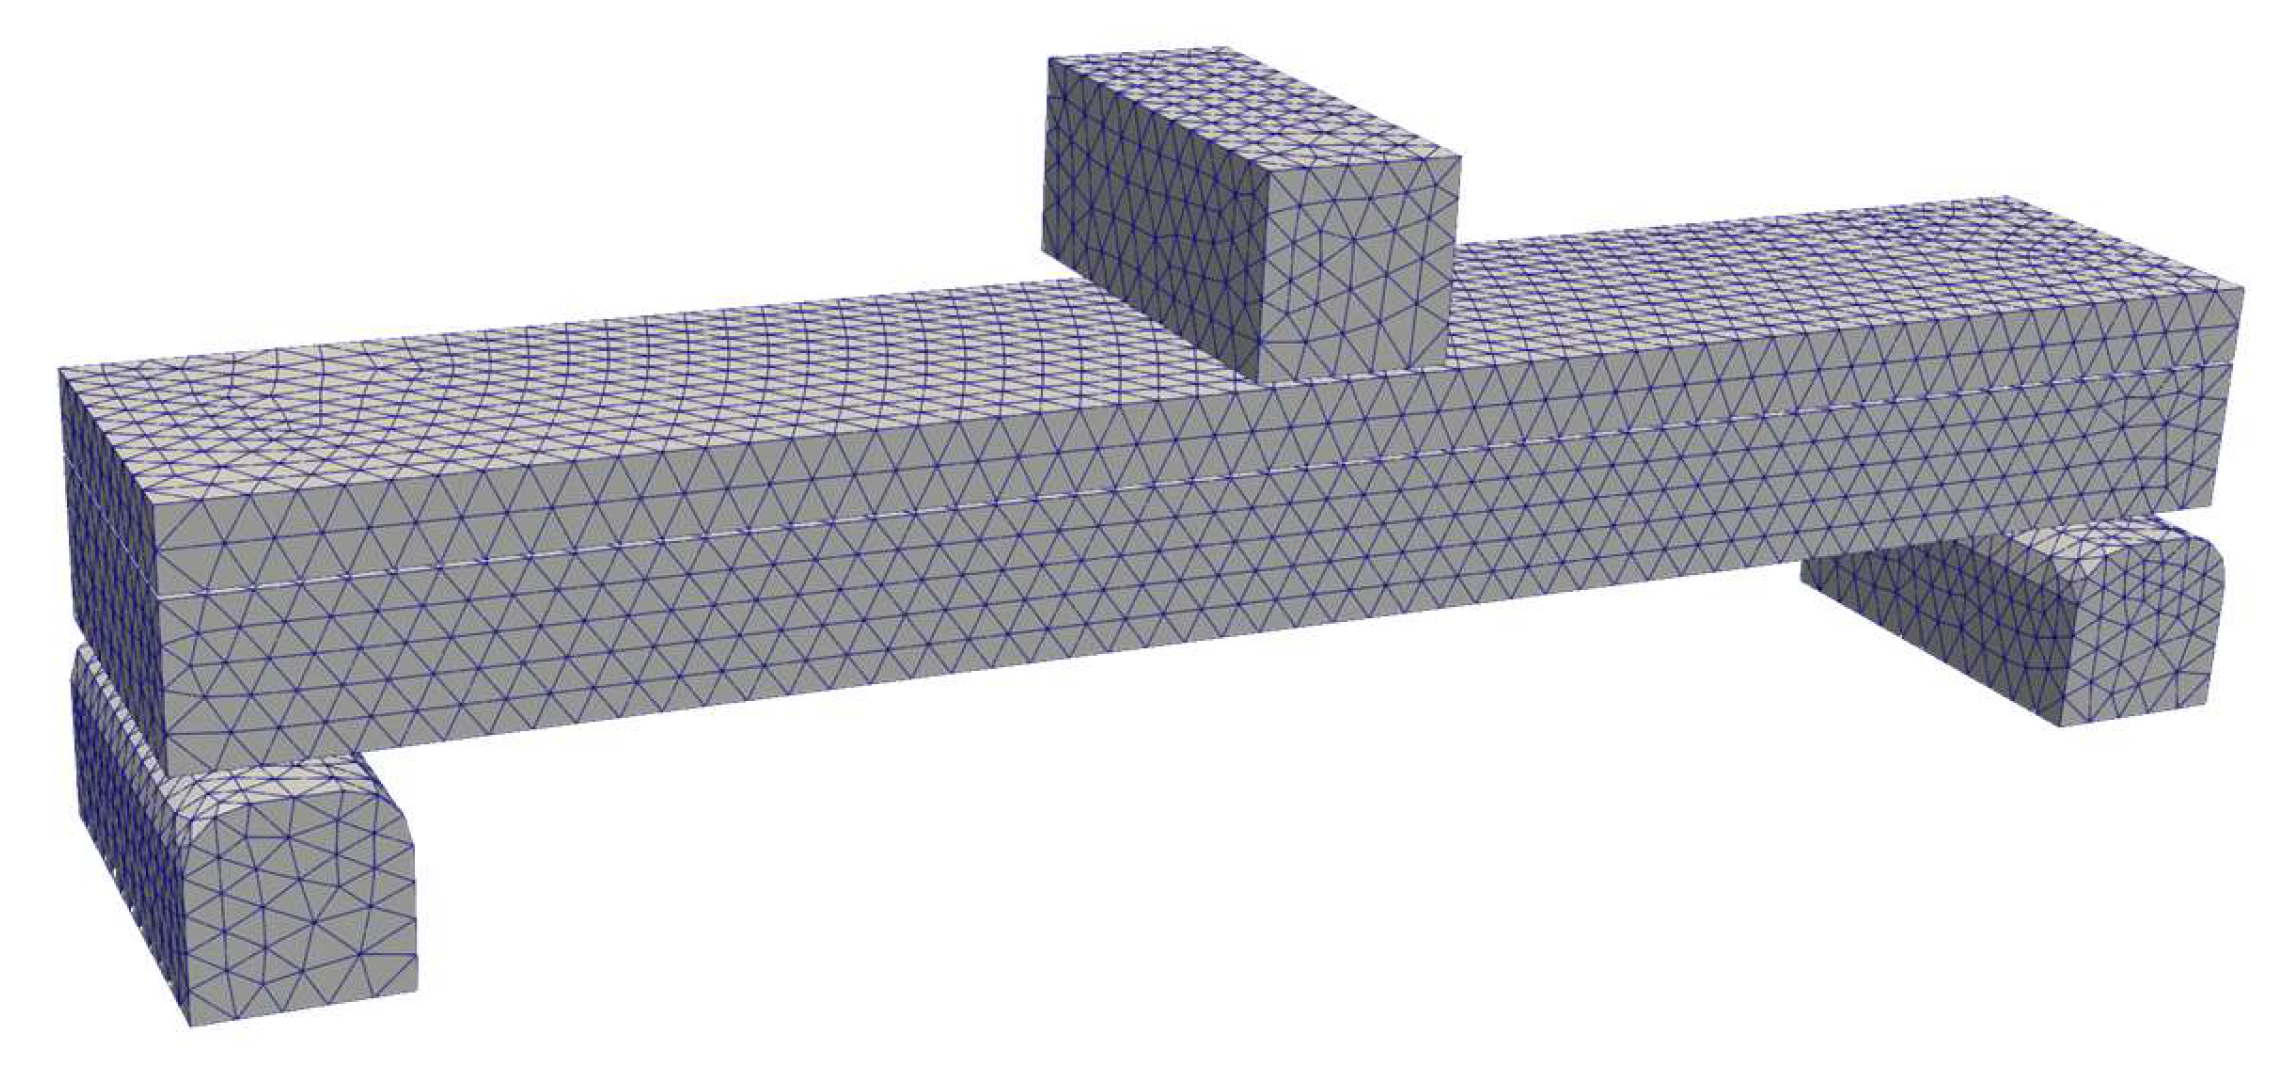
A non-linear finite element model was implemented within the Versim4D platform. Concrete and timber were modelled as solid 10-node tetrahedron finite elements (Figure 6). A non-linear cohesive zone element was used to model the interface between timber and concrete. Based on previous research of plywood and CLT slabs [37,38,39], plywood can be effectively modelled as a tailored damage plasticity model for timber. Similarly, for concrete or fibre–concrete, previous research [40,41] reveals that the damage plasticity model is one of the most appropriate for this case.

2.5.1. Concrete Material Model

A damage plasticity model was used to describe concrete non-linear behaviour. A material model was developed using the principial stress space and “rotated” crack approach [42]. The multi-axial yield surface was modelled according to the Fib Model Code 2010 [43] approach:
  α J 2 f c m 2 + λ J 2 f c m + β I 1 f c m 1 = 0
where J 2 is the shear stress invariant, I 1 is the hydrostatic stress invariant, α ,   λ ,   β are the material parameters [MC2010] and f c m is the mean compressive strength.
Tensile damage calculation was based on continuum damage mechanics. For each principial tensile stress component, the damage parameter d was calculated by assuming a exponential stress softening curve:
  f t , i = f t m ( 1 d i ) ,
( 1 d i ) = 1 + 3 × w i , r e l 3 × e 6,93 × w i , r e l w i , r e l × 0.0274 ,
where relative crack opening w i , r e l = c m o d , i c m o d , c r i t , critical crack opening c m o d , c r i t = 5.14 G f f t m , and crack opening in i-th direction ( i = 1,2 , 3 ) is calculated as c m o d , i = L c h × ε c r , i , where L c h is the characteristic length of solid finite element (calculated as cubic root of element volume), and ε c r , i is the fracture strain in i-th principial direction and G f is the fracture energy.
It is assumed that the damage variable can only grow and its value changes from 0 to 1.

2.5.2. Timber Material Model

The timber material model is based on the theory described in [44]. To simplify and reduce computation time, the strain rate effects are not included. The following main features are captured with this model:
  • Transversal anisotropy for stiffness and strength.
  • Multi-axial failure criteria divided in two parts—parallel to grain mode and perpendicular mode.
  • Multi-axial plasticity for compression.
  • Strain-hardening plasticity perpendicular to grains.
The following stress notation will used:
  • σ 11 normal stress in fibre (axial) direction.
  • σ 22 normal stress in radial direction.
  • σ 33 normal stress in tangential direction.
For simplicity, material properties in the radial and tangential directions are assumed to be the same.
For the parallel modes, the failure criterion is composed of two terms involving two of the five stress invariants of a transversely isotropic material. These invariants are I 1 = σ 11 , I 2 = σ 12 2 + σ 13 2 . The failure surfaces are defined in the following way:
  f I = σ 11 2 f 0 2 + σ 12 2 + σ 13 2 f v 2 ,
where axial strength is defined as tensile or compressive strength f 0 = f t , 0 ,   σ 11 > 0 or f 0 = f c , 0 ,   σ 11 < 0 , where f v is the shear strength parallel to grain.
For the perpendicular modes, the failure criterion is composed of two terms involving two of the five stress invariants of a transversely isotropic material.
These invariants are I 3 = σ 22 + σ 33 , I 4 = σ 23 2 σ 22 × σ 33 . The failure surface is shown below.
  f p = σ 22 + σ 33 2 f 90 2 + σ 23 2 σ 22 σ 33 f r o l l ,
where the values for the material perpendicular to grain strength are different for tension and compression f 90 = f t , 90 ,   where   σ 22 + σ 33 > 0 or f 90 = f c , 90 ,   where   σ 22 + σ 33 < 0 , and where f r o l l is the rolling shear strength.
It is observed experimentally that when wood is compressed perpendicular to fibres (radial or tangential direction), the structure becomes more dense and a hardening effect happens.
This hardening effect is taken into account by modifying the compressive strength:
  f c , 90 * = f c , 90 × k h ,
where the modification factor k h > 1 is calculated in the following way. Initially, we obtain the total equivalent perpendicular to fibre strains:
  ε t o t , p = ε 22 2 + ε 33 2 + 2 ε 23 2 ,
With the compressive yield, we can record the initial yielding strain as ε p , 0 = ε t o t , p
Using D , the material parameter is normalized to the actual compression yielding strain level:
  k p = ε t o t , p ε p , 0 D ε p , 0 ,
And finally, the compressive strength increase factor can be calculated:
  k h = 1 + B × ε t o t , p 1 3 + k p 1     ε t o t , p D 3 ,
At a certain stress level, wood can have fracture damage perpendicular to fibres. A continuum damage approach is used to estimate this damage by calculating damage variables d I and d p . When the damage parameter is 0, then no damage has happened, and when it is 1, then the material is fully damaged (no stiffness and no internal stress).
It is assumed that if tension failure has happened in the fibre direction, then it has effects perpendicular to the fibre direction:
  d m = max { d δ I ,   d δ p } ,
where δ I is the crack opening displacement in parallel mode and δ p is the same but in the perpendicular mode.
And the stress field is corrected in the following way:
  σ 11 σ 22 σ 33 σ 12 σ 13 σ 23 = 1 d I σ 11 * 1 d m σ 22 * 1 d m σ 33 * 1 d I σ 12 * 1 d I σ 13 * 1 d m σ 23 *
Post-cracking behaviour is mainly governed by the value of fracture energy. For the parallel failure mode, we can calculate the equivalent fracture energy:
  G I = G I , 0 σ 11 2 f t , 0 2 + G I I , 0 σ 12 2 + σ 13 2 f v 2 ,   when   σ 11 > 0 ,
G I = G I I , 0 f v 2 σ 12 2 + σ 13 2 ,   when   σ 11 < 0 ,
where G I , 0 is the mode I fracture energy parallel to grain and, G I I , 0 is the mode II fracture energy parallel to grains.
And it is assumed that the post-failure curve is linear. The equivalent strain in parallel mode is therefore estimated:
  ε c h , I = ε 11 2 + 2 ( ε 12 2 + ε 13 2 ) ,   when   σ 11 > 0 ,
ε c h , I = 2 ( ε 12 2 + ε 13 2 ) ,   when   σ 11 < 0 ,
For regularization purposes, there is a calculated equivalent finite element length L c h = V 1 3 , where V is the volume of the finite element.
And the regularized total crack opening displacement is calculated as δ I = L c h × ε c h , I . The critical strain level, when the damage variable is 1, can be calculated from the fracture energy:
  δ c r = 2 G I f t , 0 + δ 0 ,
where δ 0 is the displacement level when cracking starts to happen.
And finally, the damage variable is calculated:
  d I ( δ I ) = δ I δ 0 δ c r δ 0 ,
The damage variable can only grow (no self-healing possible) and values are in range d I = [ 0 , d m a x ] . Maximal damage d m a x is typically in the range [ 0.99 ,   1 ] .
In a similar way, damage perpendicular to fibres is calculated. The only difference is for equivalent fracture energy and equivalent strain calculations:
  G 90 = G I , 90 σ 22 2 + σ 33 2 f t , 90 2 + G I I , 90 σ 23 2 σ 22 σ 33 f r o l l 2 ,   when   σ 22 + σ 33 > 0 ,
G 90 = G I I , 90 f r o l l 2 σ 23 2 σ 22 σ 33 ,   when   σ 22 + σ 33 < 0 ,
where G I , 90 is the mode I fracture energy perpendicular to grains and G I I , 90 is the mode II fracture energy perpendicular to grains.
And it is assumed that the post-failure curve is linear. The equivalent strain in parallel mode is estimated:
  ε c h , 90 = ε 22 2 + ε 33 2 + 2 ( ε 23 2 ) ,   when   σ 22 + σ 33 > 0 ,
ε c h , 90 = 2 ( ε 23 2 ) ,   when   σ 22 + σ 33 < 0 ,

2.5.3. Cohesive Zone Element Between Timber and Concrete

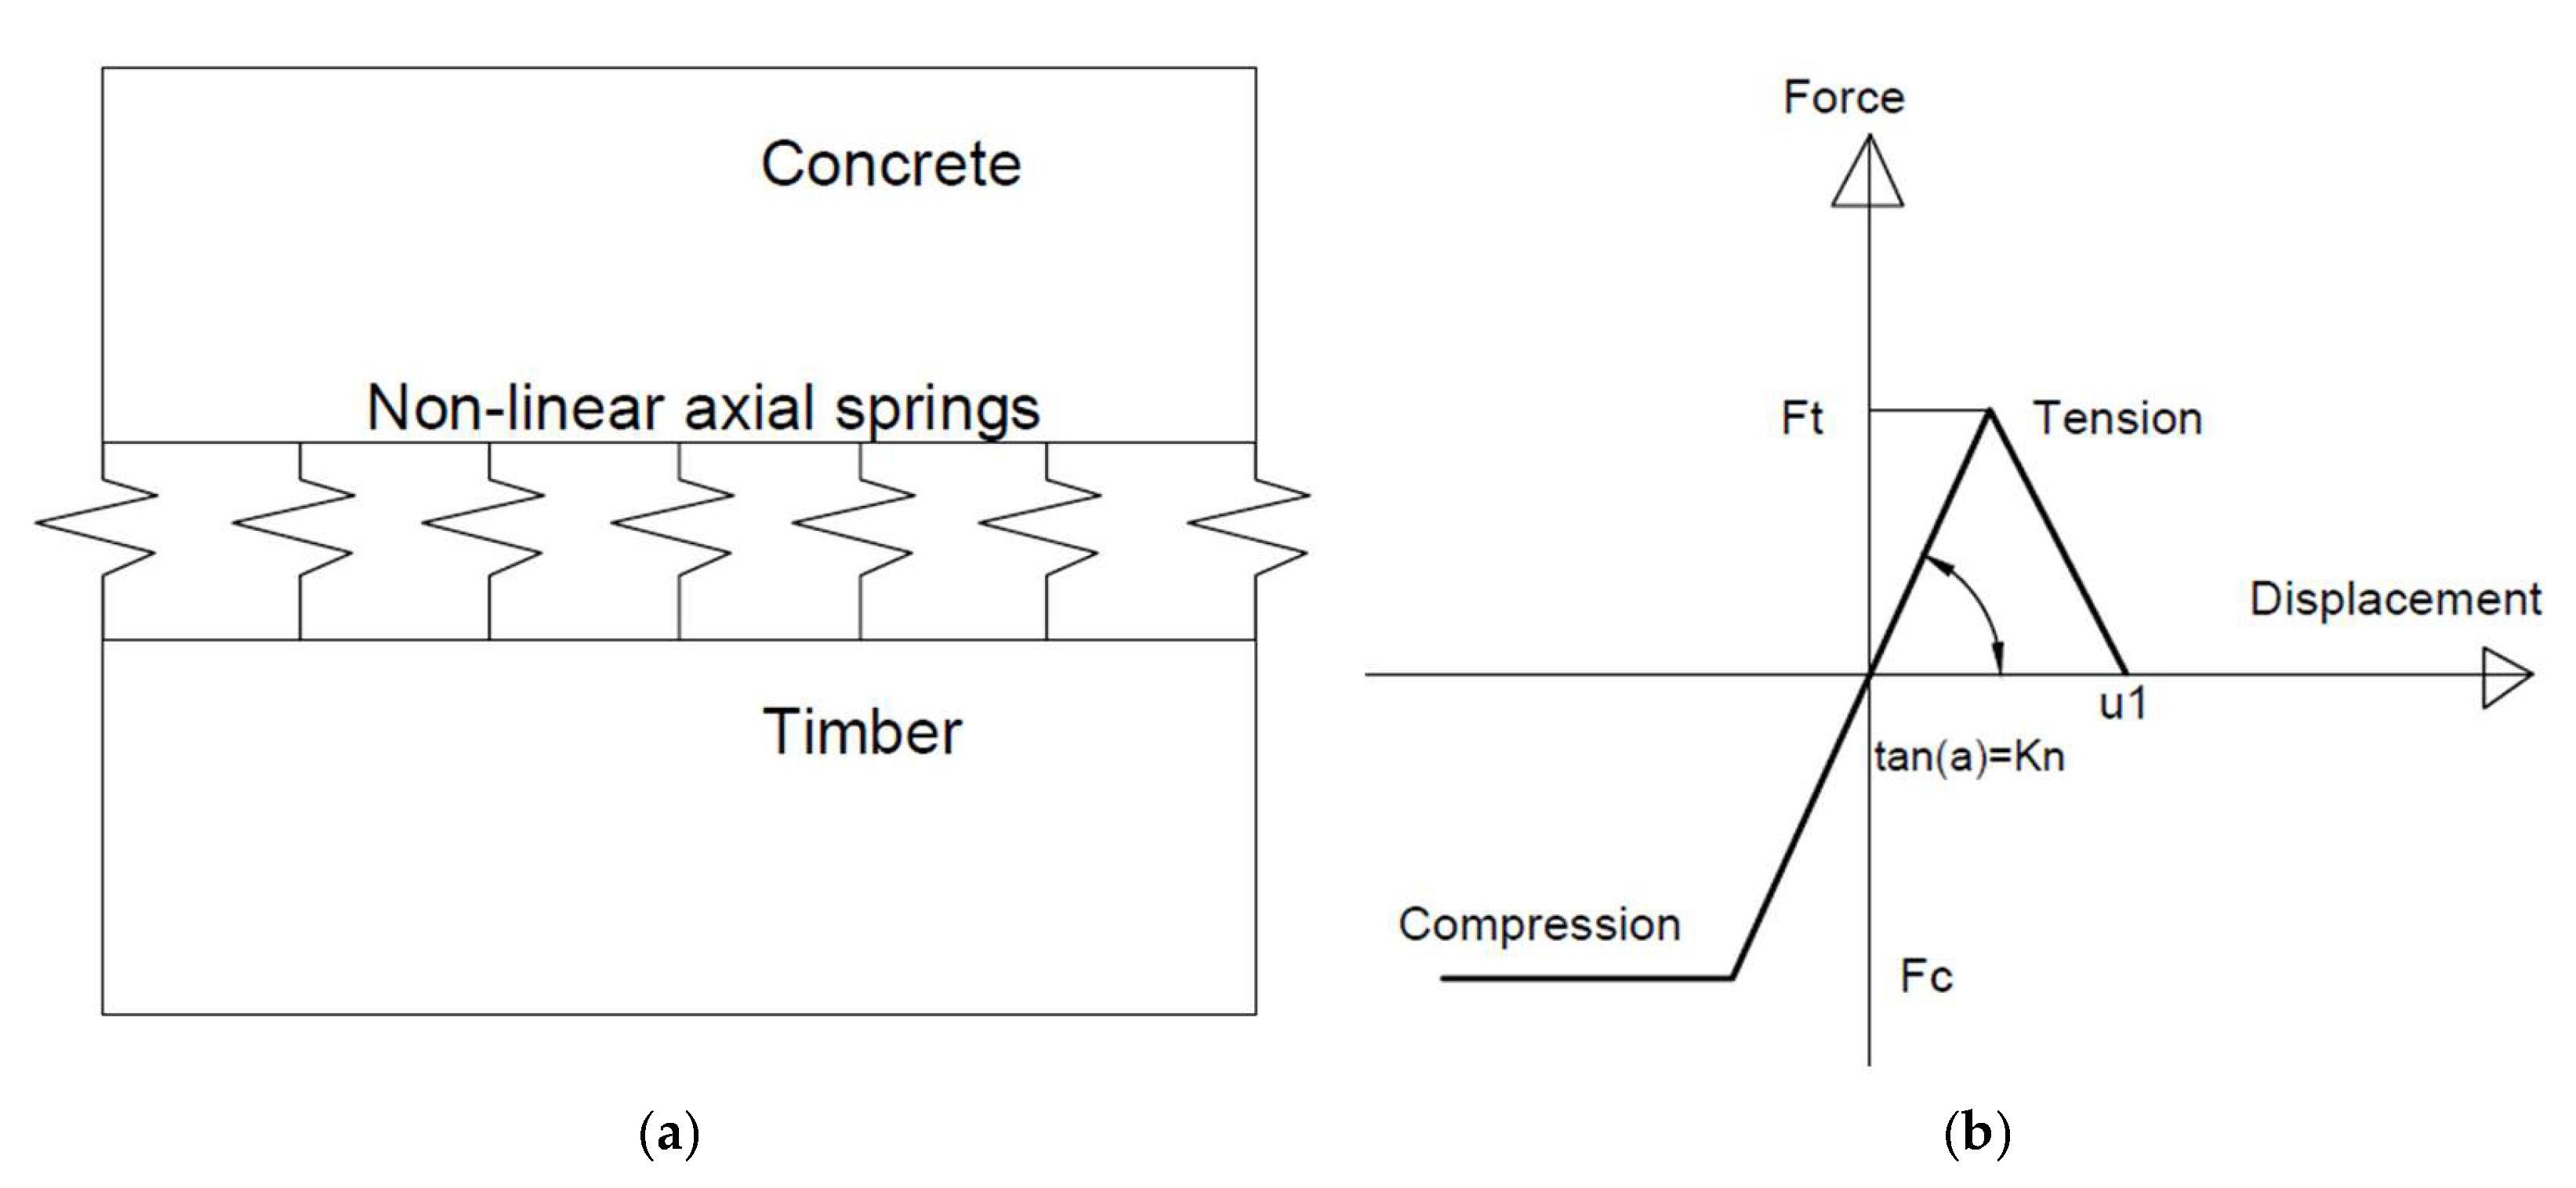
The cohesive behaviour is divided into normal and shear behaviour (Figure 7). The surface spring in the normal direction is described by elastic–plastic behaviour in compression and elastic–damage behaviour in tension. The non-damaged stiffness spring surface stiffness is K n , tension strength F t , peak displacement at tension failure u 1 and yield compression strength F c .
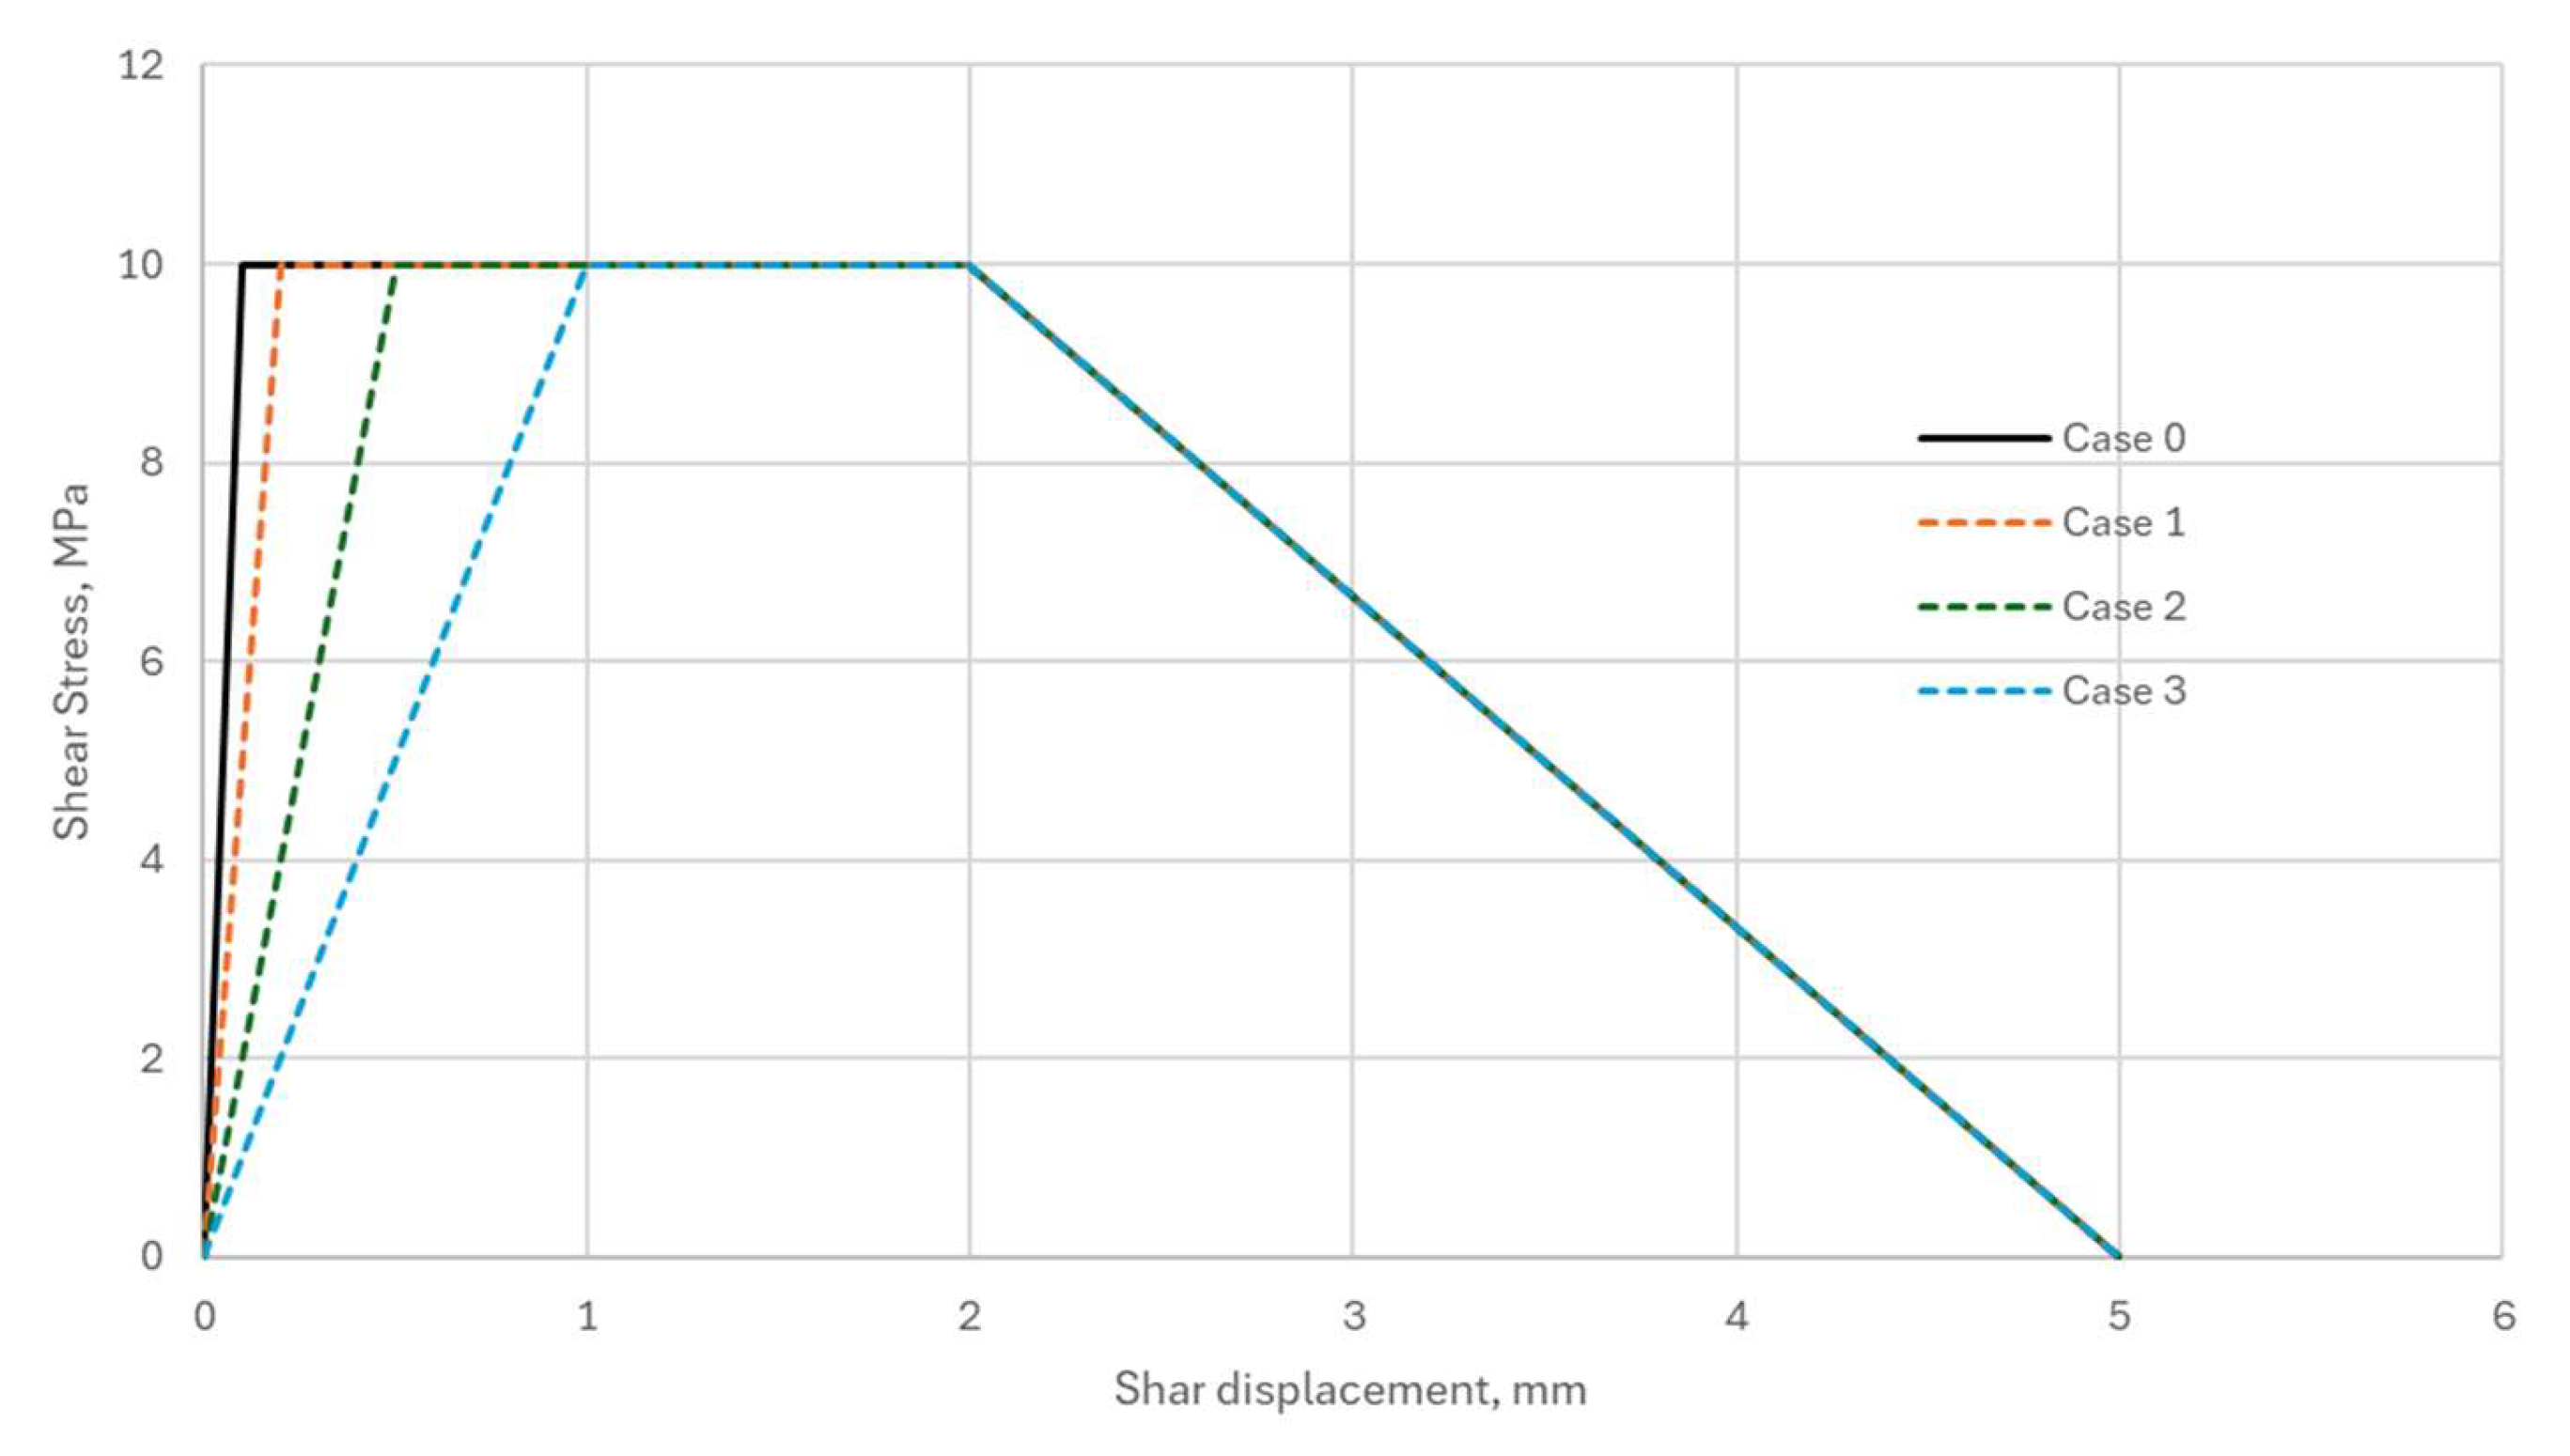
Shear behaviour is governed by a tri-linear curve, and shear strength F s , shear stiffness K s and peak displacements in shear u 1 ,   u 2 (Figure 8).

3. Results and Discussions

3.1. Influence of the Adhesive and Concrete Layer Mechanical Properties on the Behaviour of Timber–Concrete Composite Member Subjected to Flexure

Three groups of laboratory specimens were investigated by the simplified design method explained before in Section 2.4, by the laboratory experiment and by the newly developed FEM software Verisim4D. The design scheme for three groups of laboratory specimens is three-point bending, shown in Figure 1. The experiment was carried out by progressive specimen loading, recording the maximum vertical displacements and cracking process, and the critical load values at which partial or complete disintegration of the specimen’s layers and failure of the specimens occurred were determined.

3.1.1. Description of Experimental Results

Group A includes ten specimens, signed from A-1 to A-10. For group A specimens, the maximum vertical displacements increased in proportion to the load. After partial or complete disintegration of the specimens, the maximum vertical displacements increased rapidly. Partial disintegration was observed on average at 11, 17 kN, but the development of cracks started at 8 kN. The maximum vertical displacements values at 8 kN load ranged from 1.7 to 2.5 mm, but after crack initiation, it exceeded 4.3 to 5 mm (see Figure 9). The results of specimen A-1, after the 6 kN applied load, at the first loading, showed much higher results than the results of the other specimens. A possible explanation is an initial defect in the specimen which resulted in partial disintegration of the material at this load and did not ensure full composite performance.
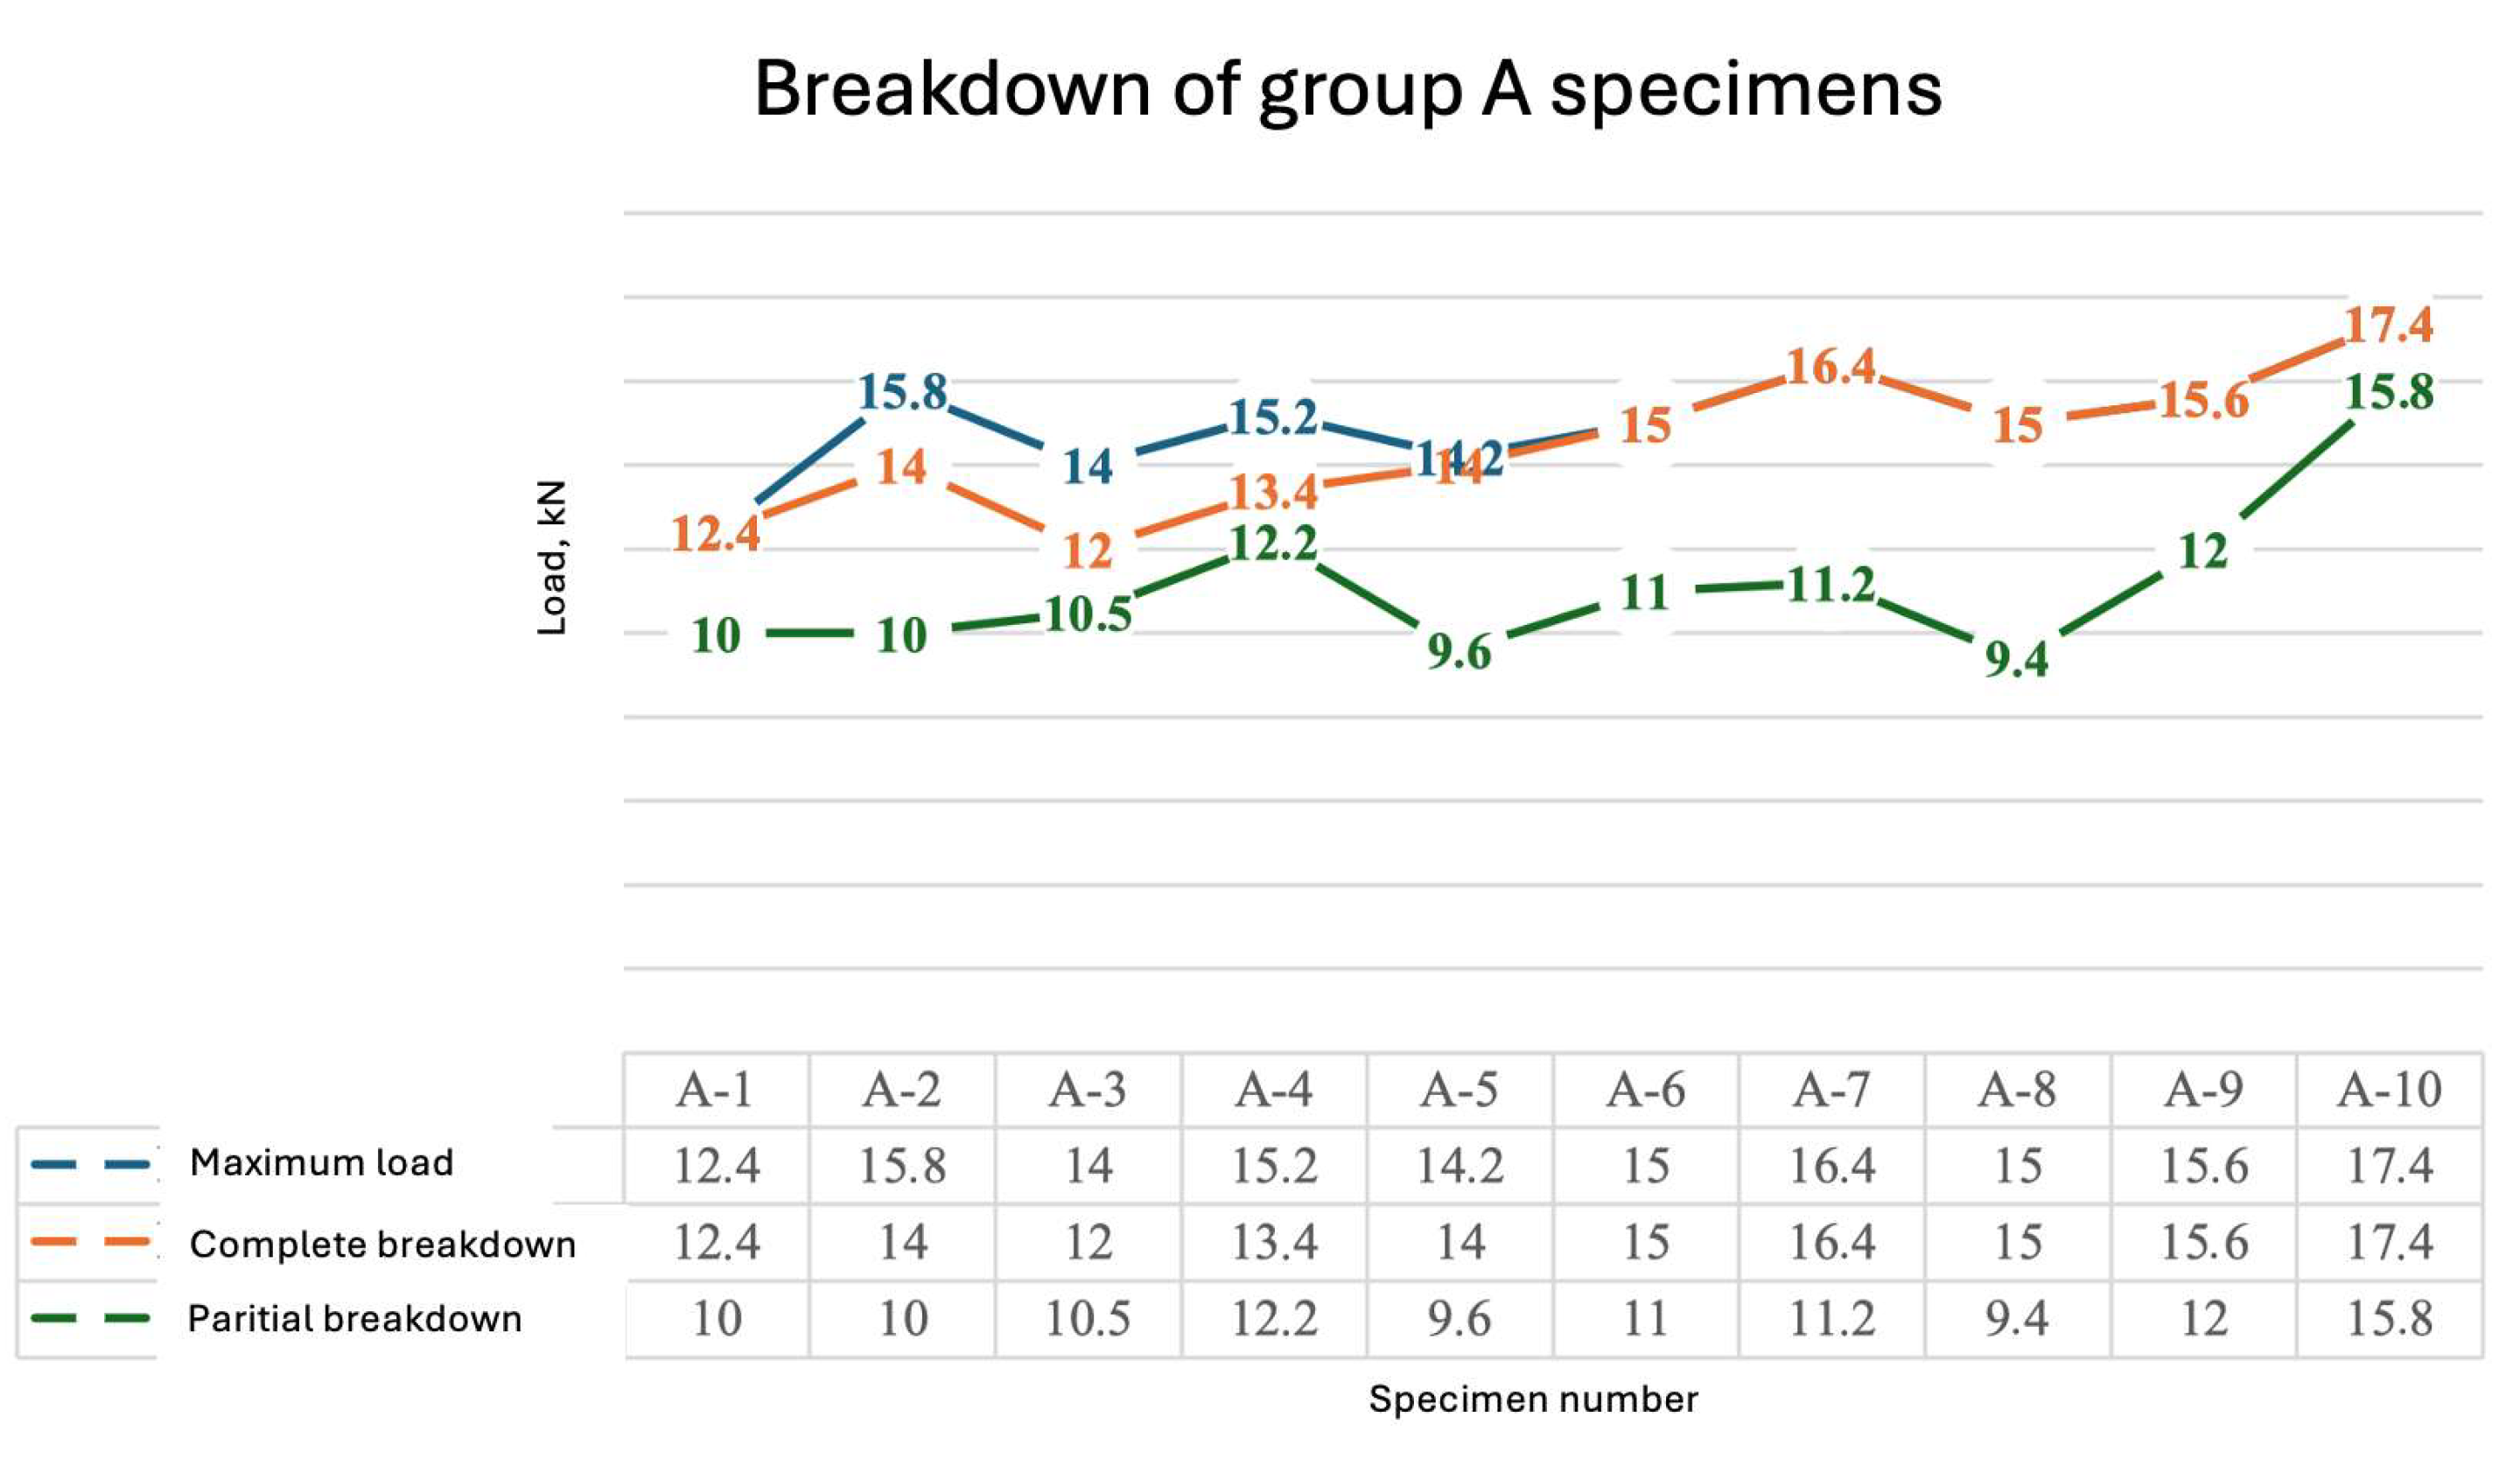
Figure 10 illustrates the load value at which the specimens reached their maximum load-carrying capacity, as well as the partial and complete disintegration of the separate layers. The results showed that the group A specimens without cracks reached a maximum load of 12.4–17.4 kN, while the specimens with cracks before testing showed lower load capacities but often higher load capacities.
The average load capacity of group A specimens is 15.1 kN. It was observed that in cases where the specimens disintegrated completely before reaching the maximum load, they were able to withstand a further load of approximately 1.87 kN until their ultimate load capacity was reached. Partial disintegration had no significant effect on the ultimate capacity; however, specimen A-10, which underwent partial disintegration at 15.8 kN, showed the highest ultimate capacity of 17.4 kN.
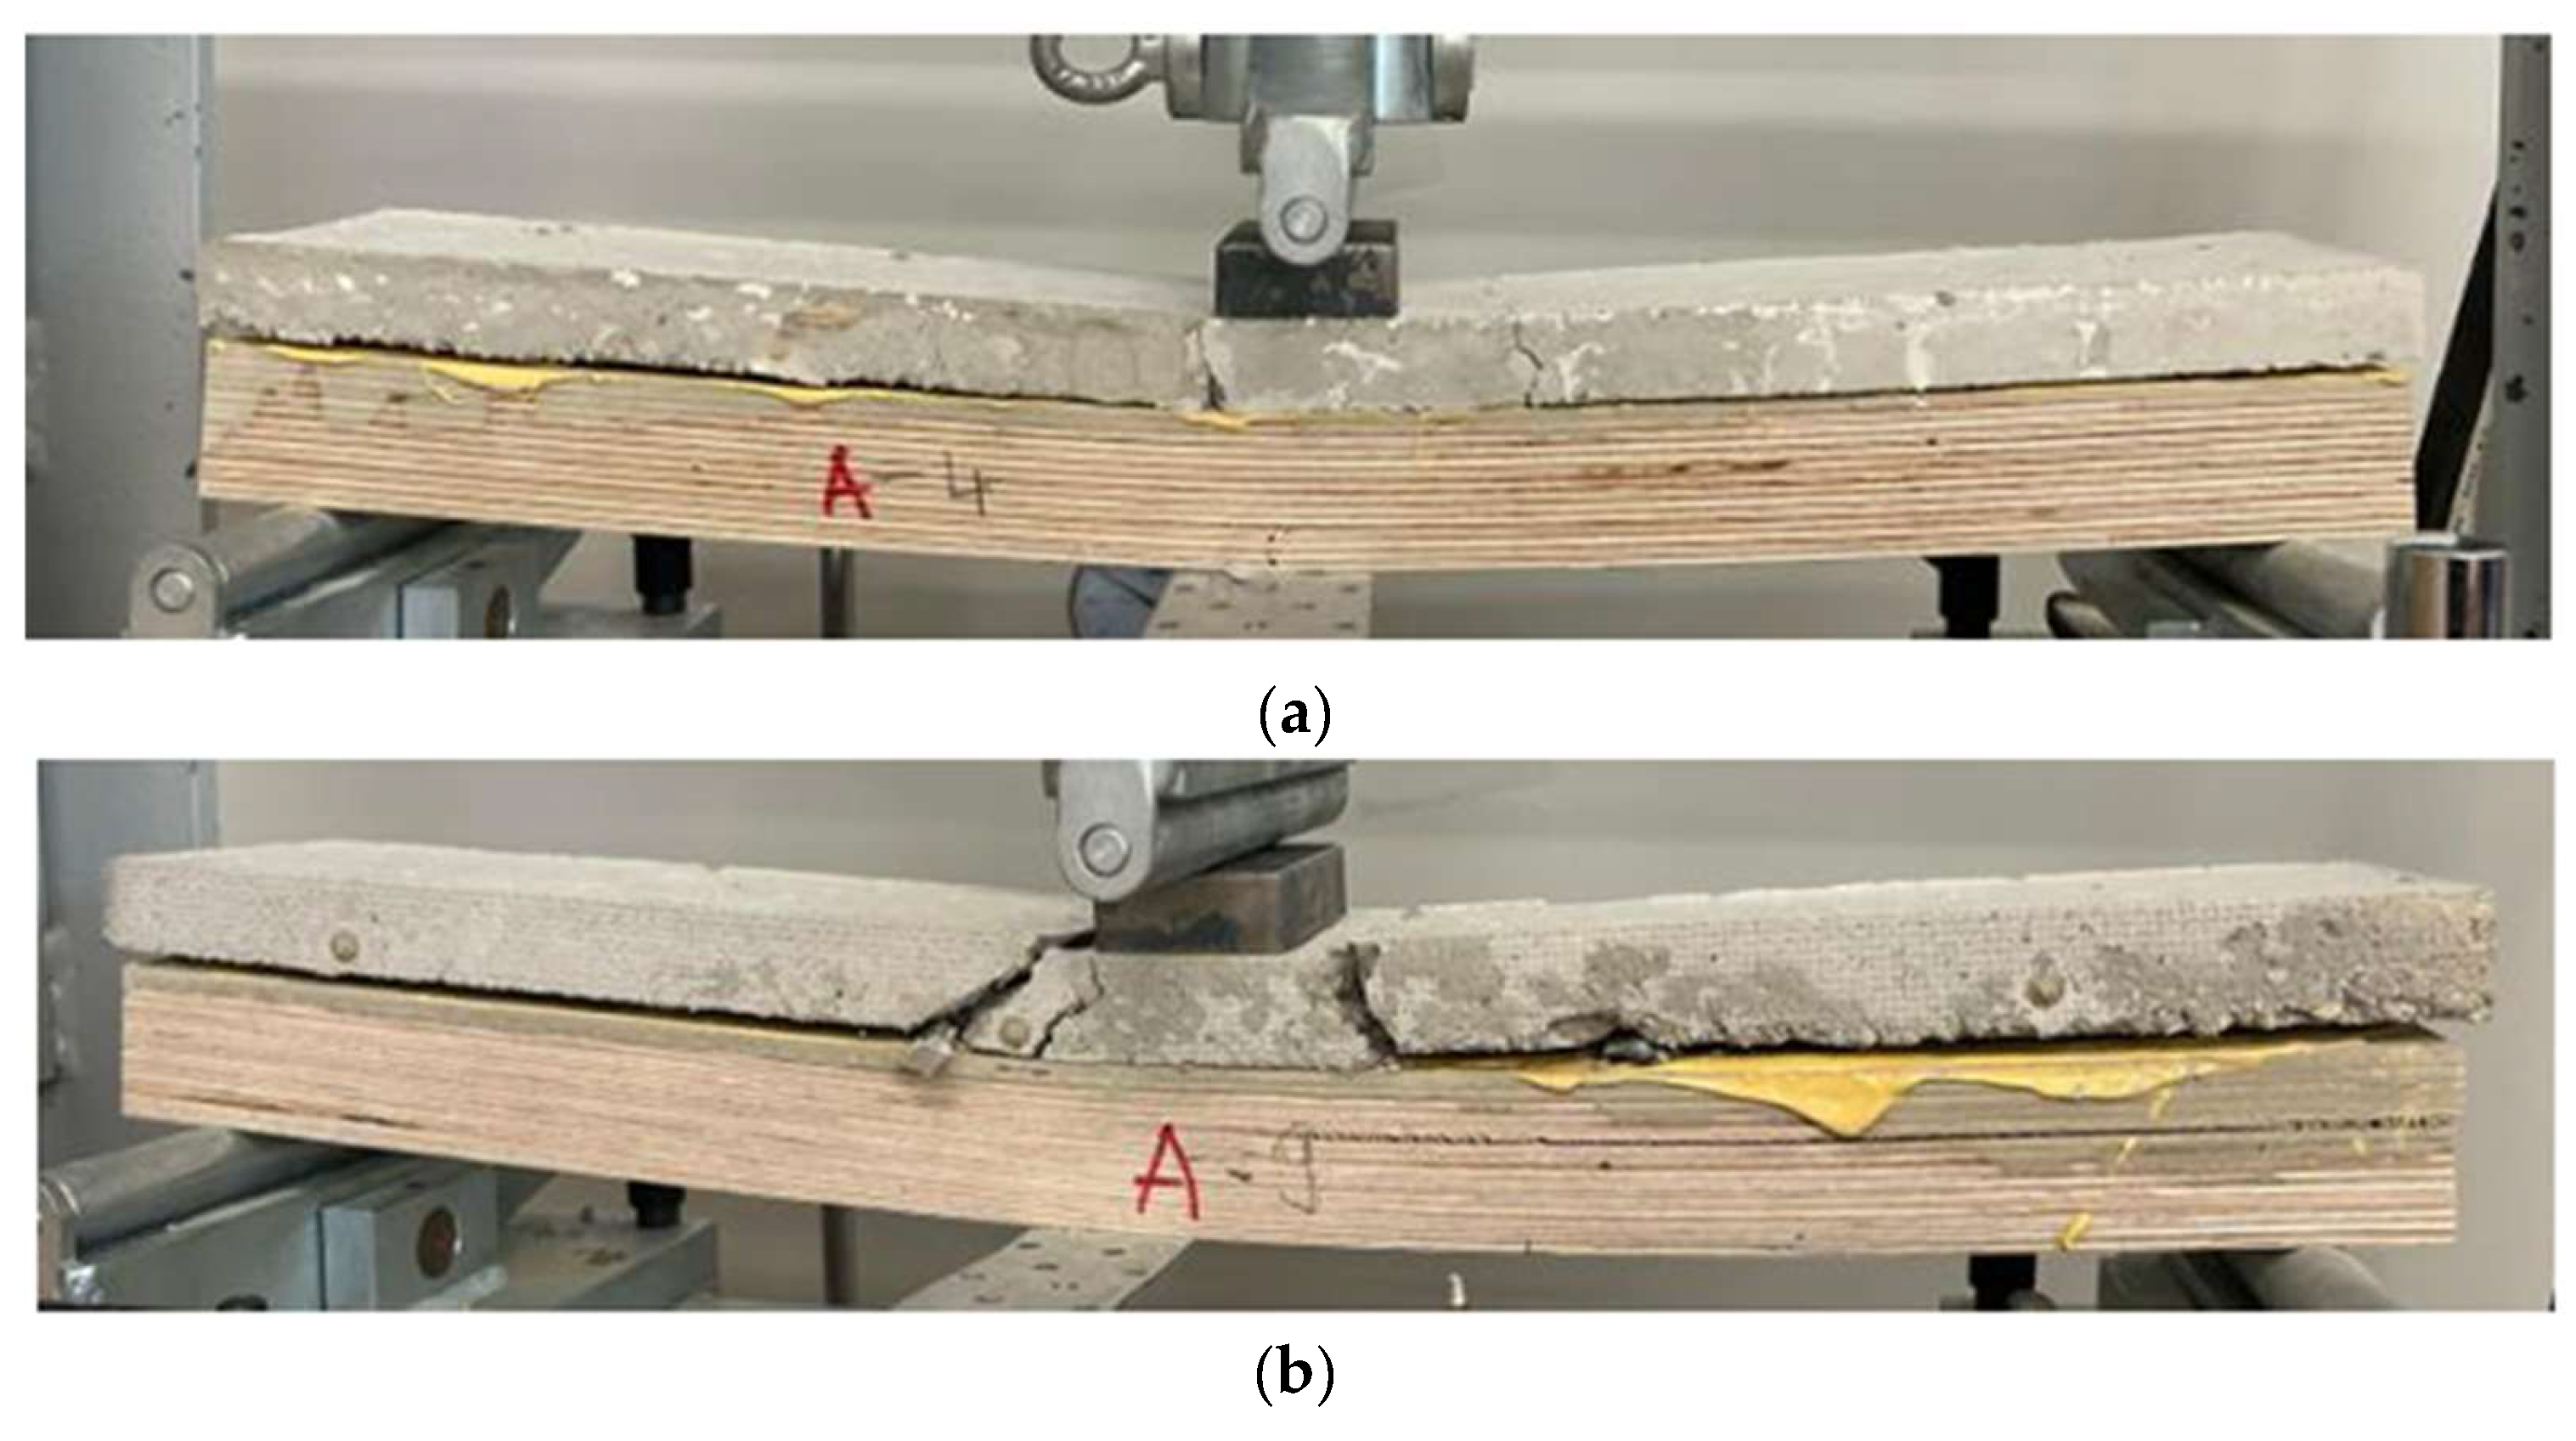
Group A specimens are characterised by a relatively simpler and more clearly traceable failure process under the growing load. Initially, cracks developed in the concrete layer immediately below the point of applied load, where concentrated stresses developed. It was often observed that the upper concrete layer failed first, followed logically by the failure of the plywood layer, as this is directly below the concrete and takes part of the load after failure of the upper layer. This type of failure indicates a logical failure in which each layer acts up to its limit (see Figure 11a).
Layer separation in these specimens started most often on one side and gradually continued on the other side at higher loads until the concrete and plywood delamination for the entire specimen. This type of failure was visually evident and could be considered as a standard failure process. However, in some cases, horizontal cracks were also observed directly in the plywood layer, indicating the onset of shear failure. Such cracks develop transversely to the applied load and indicate that the plywood is no longer able to carry the increasing shear force. These failures were less common but provide important information about possible weak areas in the structure at high loads (see Figure 11b).
In general, group A specimens failed consistently and progressively, with characteristic cracking in the load application zone and progressive delamination, which became more pronounced at maximum loads.
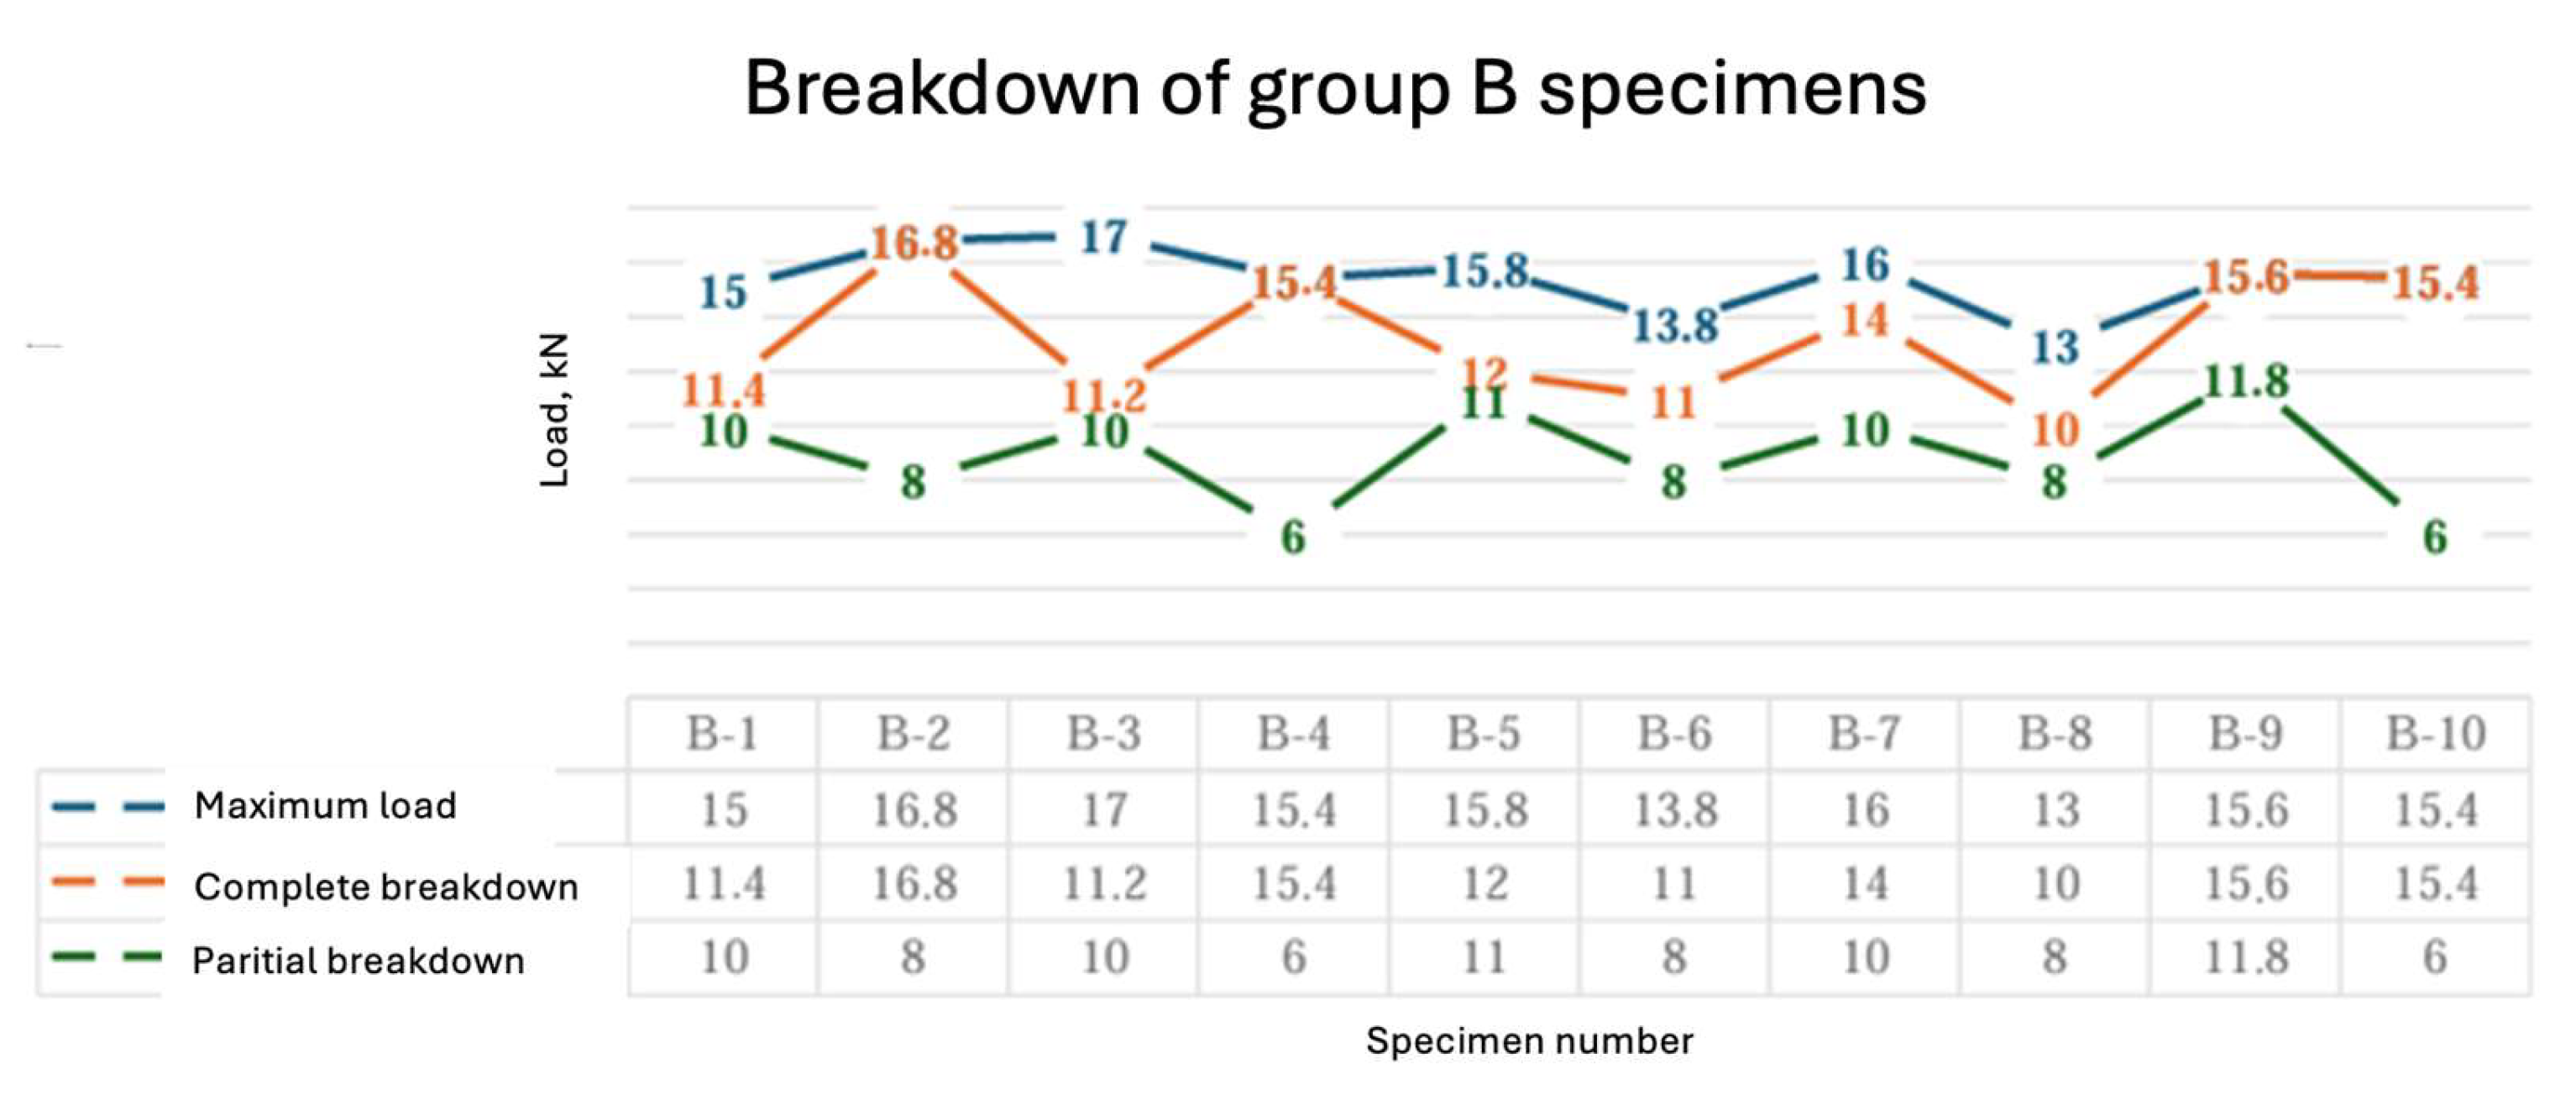
Group B specimens with reinforcement of the epoxy glue layer by the s net, consisting of glass fibre yarns, showed a less predictable failure behaviour and exhibited markedly different values of the maximum vertical displacements (Figure 12). Overall, the maximum vertical displacements were on average similar to those of type A specimens. Some specimens (e.g., B-1 and B-3) showed a steady increase in bearing capacity up to 15–17 kN (with smaller deflections also observed), while others (B-2 and B-4) showed early crack initiation already at 6–8 kN load. These differences are probably due to heterogeneous adhesion distribution between the layers or to weaknesses in the manufacturing process. Interestingly, group B specimens showed a decrease in the buckling value before specimen failure compared to group A, indicating the influence of fibres on the structural behaviour before critical loading.
The maximum load in group B ranged from 13 to 17 kN, but some specimens (e.g., B-10) collapsed due to shear. The average load capacity of group B specimens is 15.38 kN. If the group B specimens were fully de-extended before the maximum load was reached, they were able to withstand approximately 3.5 kN more before reaching their ultimate capacity (Figure 13). Partial disintegration, on the other hand, had no significant effect on the load-bearing capacity of the specimens.
In the group B specimens, where glass fibre yarns were used as reinforcement in the epoxy adhesive layer between the plywood and the concrete top layer, an interesting structural collapse was observed. In general, these specimens exhibited more complex behaviour than the specimens in Group A where no such reinforcement was used.
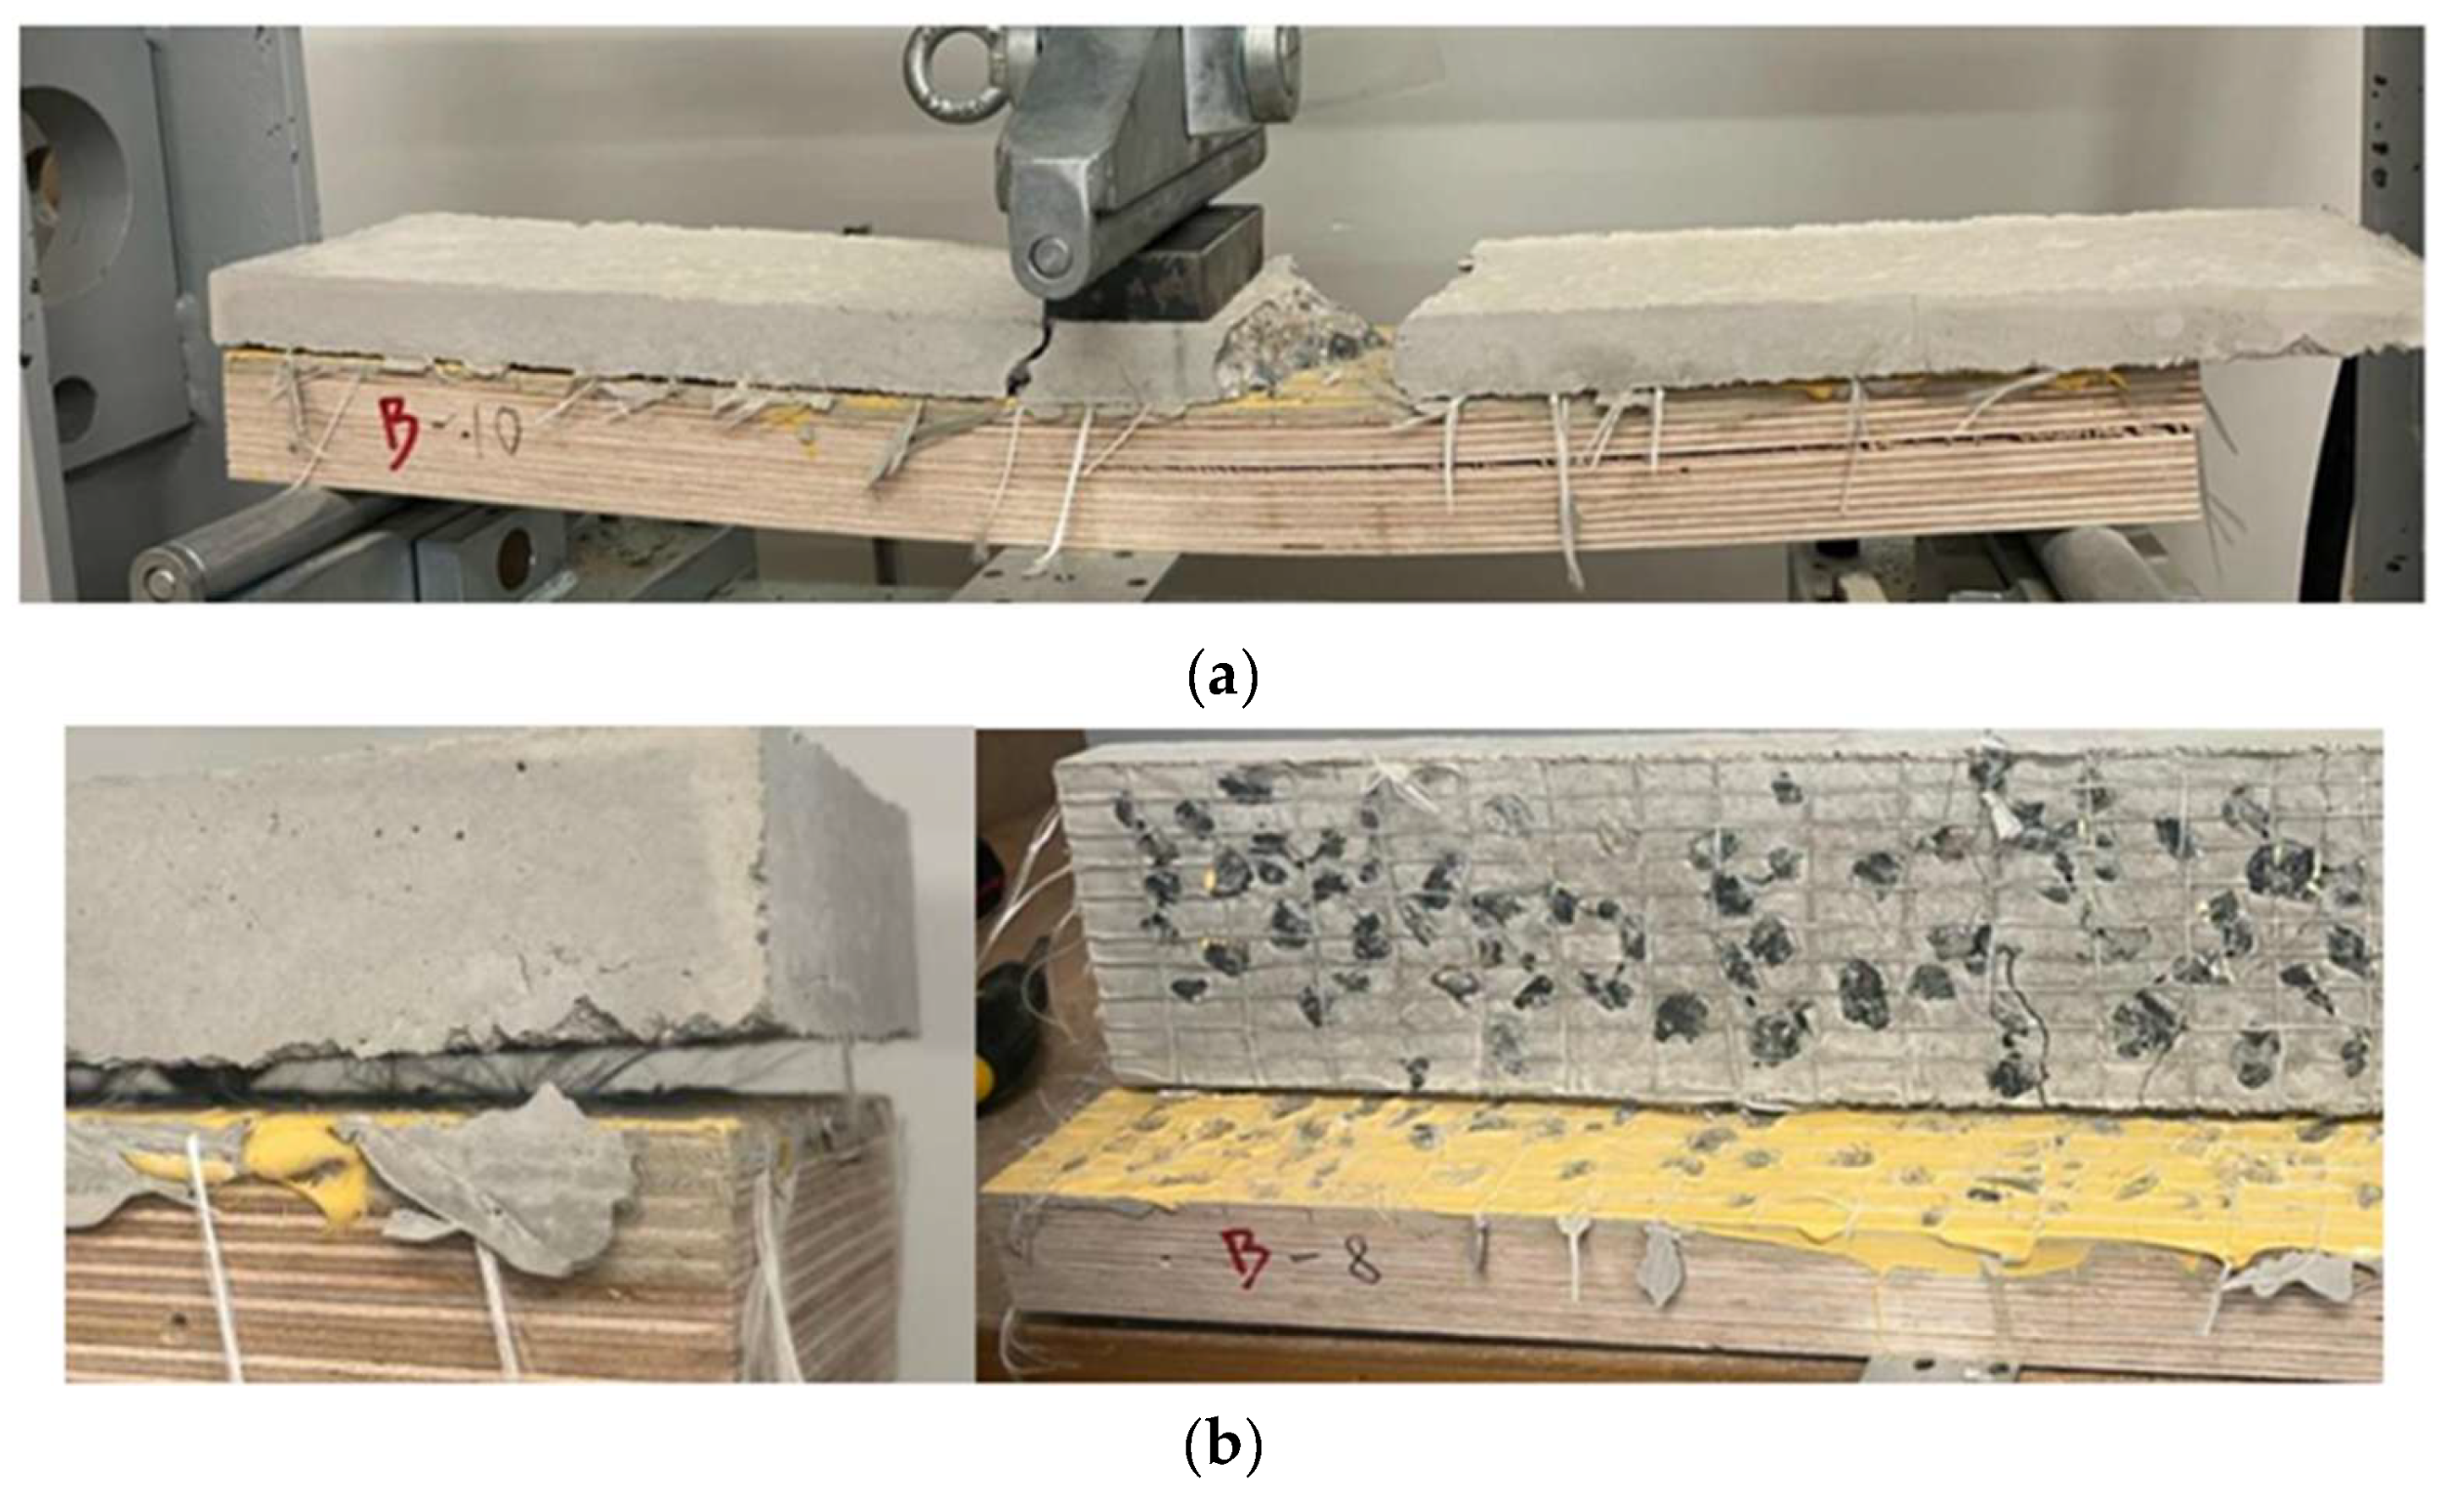
An important aspect that clearly stands out in several Group B samples is the type of collapse and its localization. In cases where horizontal cracks formed in the plywood, shear failure was assumed to have occurred—this is a typical indication that the shear forces between the layers have exceeded the capacity of the plywood. This phenomenon can be observed, for example, in specimen B-10 (Figure 14), where the crack has developed almost exactly parallel to the interlaminar butt within the plywood and visually runs along the direction of the fibres of the material.
In addition, in several samples, clear deformations can be observed in the epoxy adhesive layer between the plywood and the concrete, indicating delamination—a loss of adhesion between the layers. This form of failure occurs when the adhesive layer is no longer able to provide sufficient bonding and is most often exacerbated by the development of cracks in other layers of the material. As a result of delamination, the upper concrete layer partially or completely detaches from the structure, effectively losing the mechanical bond with the plywood bottom layer.
In addition, another major degradation process is observed in the Group B samples—the degradation of glass fibre filaments. After loading, many samples show that the fibres are no longer continuous but have broken into smaller filaments, which have lost their original structure. The filament disintegration can be seen particularly well in Figure 14b, where the split fibres can be seen near the concrete layer.
Fibre breakdown is probably one of the factors that cause the concrete to separate more suddenly and dramatically, as seen for example in Figure 14a, where a fragment of concrete has visibly separated together with part of the fibre reinforcement. This observation may indicate that the fibres, having reached their limit, broke and rapidly transferred the load to other layers of the material, causing local failure.
In general, these observations underline that glass fibre reinforcement affects the behaviour of group B specimens before critical loading, but it also leads to more complex failure modes. Collapse in the concrete and plywood layer, delamination in the adhesive layer and fibre breakdown after loading are the three main failure modes that dominate the behaviour of these specimens. They also reveal potential challenges in the design of such composite structures—in particular in terms of the quality of material bonding, the consistency of glass fibre filament layouts and the accuracy of the manufacturing technology.
Comparing the groups A and B, it can be concluded that the reinforcement of the glass fibre yarns provided a slight increase in load capacity and changed the failure behaviour of the material. While the specimens in Group A showed a relatively steady decrease in load capacity after reaching the critical load, the specimens in Group B showed a slow loss of capacity, indicating the ability of the fibres to maintain the structural integrity even after cracking. However, the lack of interlayer adhesion or fibreglass filament separation remain the main challenges limiting the effectiveness of this technology.
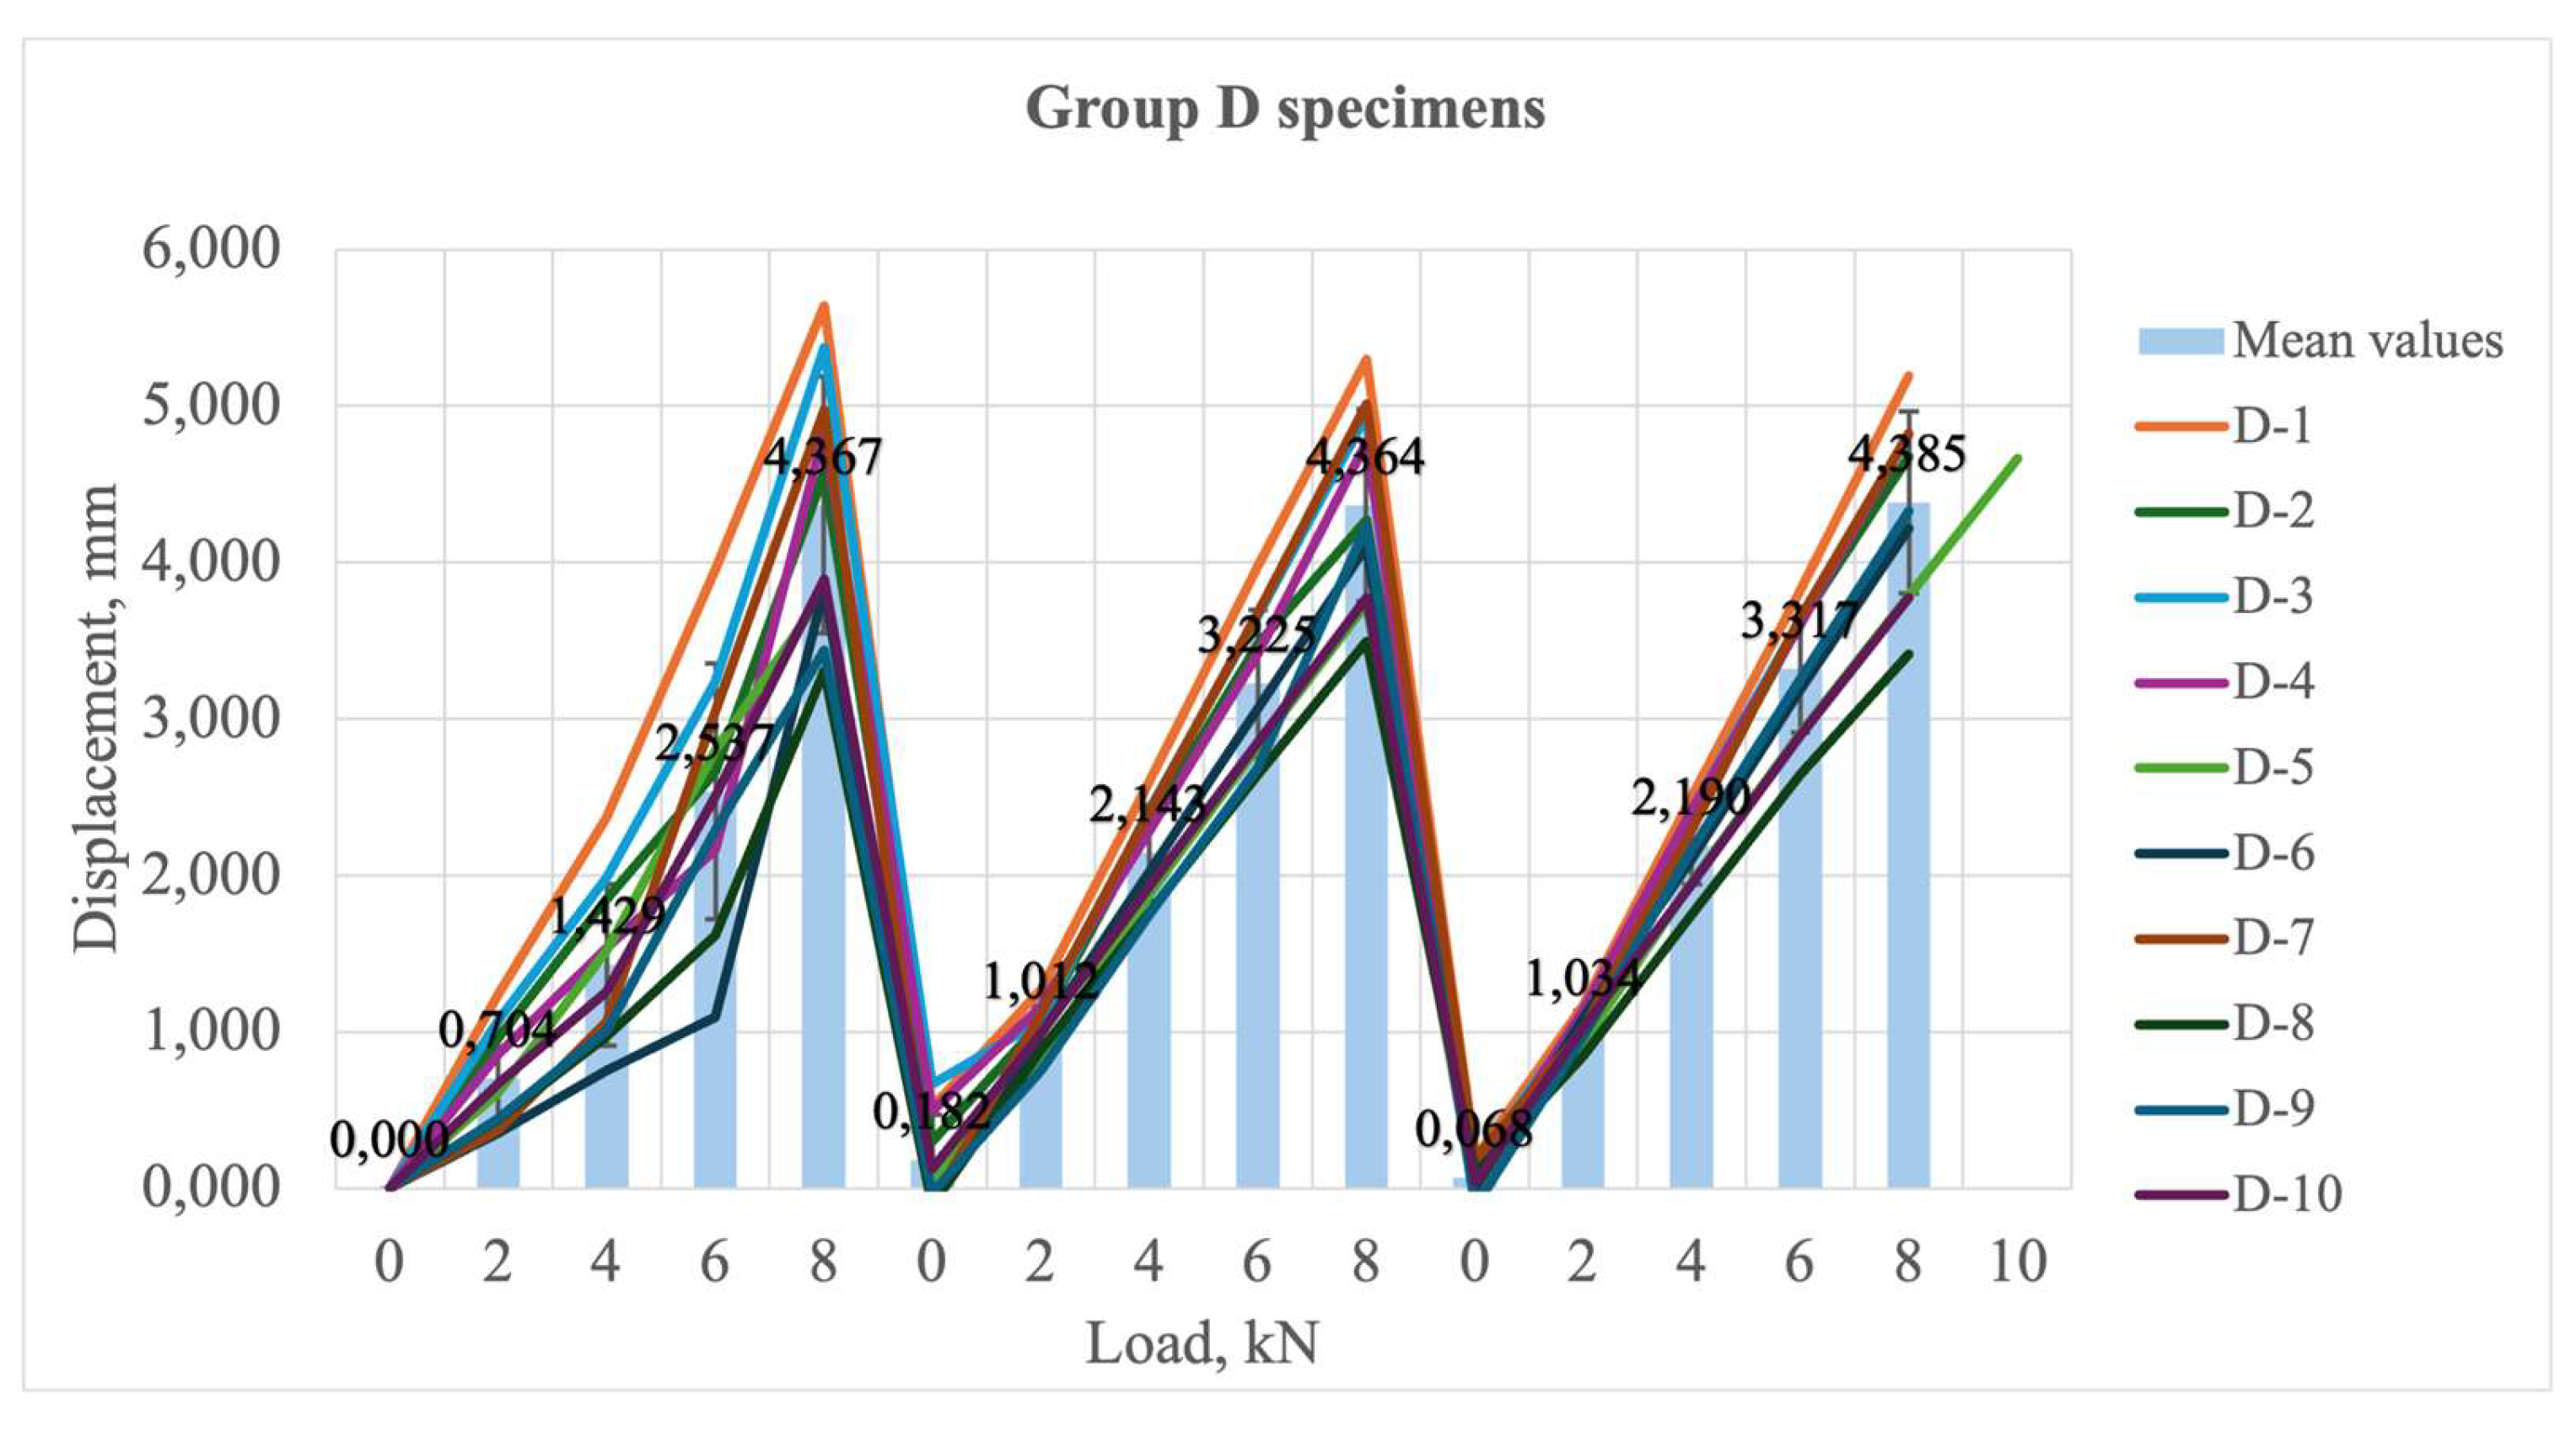
For group D, the deflections increased in proportion to the load and the deflection values were more similar to those of group B. Compared with the samples of groups A and B, the deflection values of the samples of Group D were higher. Also, for these samples, after partial or complete disintegration of the samples, the deflections increased rapidly. Partial disintegration was observed at 5–7.8 kN, on average at 6.2 kN. The average elastic strain at 6 kN ranged from 1.1 to 3.2 mm, while after partial disintegration it exceeded 2.2 to 4 mm (Figure 15). It is interesting to observe that partial disintegration was only observed during the first loading of the specimens.
The maximum load for group D samples ranged from 12 to 17.8 kN. The average load capacity for group B specimens was 15.26 kN. The specimens in this group showed partial disintegration at the first loading and at low loads, averaging 6.2 kN. The specimens of groups D-5 and D-10 were partially disintegrated before loading; therefore, a value of 0 kN is given. Complete disintegration of the specimens occurred mostly when the ultimate load was reached. If the group D specimens disintegrated completely before reaching the maximum load, they were able to resist approximately 3.5 kN until their ultimate load was reached (Figure 16).
Compared to group A and group B, group D samples showed a different behaviour of the concrete layer—it did not disintegrate into such fine parts. This behaviour was mainly due to the addition of polypropylene fibres to the concrete, which significantly reduced crack formation and limited the flexural effects. As a result, the cracks were smaller and more evenly distributed. However, the presence of fibres did not significantly improve the inter-layer adhesion, which continued to be a weak link in the specimen. In this case, the largest deformations were observed in the plywood layer. The nature of the failure suggests that the specimens failed under combined loading, with both bending and rolling shear components predominating. Most of the cracks were concentrated below the point of load application, except for specimen D-2, where cracks initially developed directly under the load but continued to propagate laterally, indicating possible uneven load transfer or local weakness of the material (Figure 17).
Group D specimens showed a more stable and uniform increase in deflection versus load compared to group B, as well as more similar deflection values. However, the use of additional fibres in the concrete layer may have influenced the nature of the deformation, leading to higher displacement values, potentially affecting the serviceability of the structure. Partial disintegration was often observed at low loads (~6.2 kN), but complete collapse occurred mostly only after the load-carrying capacity of the specimens was exceeded. The specimens retained the ability to take additional loads after partial disintegration. The addition of polypropylene fibres to the concrete prevents the specimen’s disintegration but did not affect on the timber-to-concrete connection. The most significant deformations were observed in the plywood layer and the specimen’s failure was due to combined bending and shear.

3.1.2. Comparison of Results, Obtained by Laboratorian Experiment, FEM and Analytical Analyses

Given that the subject of the study is a wood–concrete composite beam slab with a reinforced adhesive bond, the following comparisons of results will be made with this particular structure, i.e., the experimental test group B specimens. Also, the analytical calculations and FEM modelling were based on the parameters of group B specimens.
Comparing the FEM results with the experimental results shows good agreement between the theoretically predicted and actually observed deformation zones. The crack development during the experiment was mainly observed in the structural zones with the highest stress concentrations, which is also consistent with the results predicted by the FEM model. The stress analysis was carried out directly along the longitudinal axis, as this axis represents the main tension/compression direction occurring in three-point bending. Since the load is applied in the middle of the span, the stresses develop mainly in the longitudinal direction, where both tension in the lower part of the structure and compression in the upper part occur. Therefore, the distribution of stresses along the longitudinal axis best describes potential failure or cracking locations. In the FEM model, stress increases were observed at these same locations, indicating local weak areas in the structure. The coincidence of these zones with the experimentally observed cracks confirms that FEM modelling is an effective tool to predict the behaviour of a structure under load, including the identification of critical zones. For comparison, see Figure 18.
Several trends can be observed when comparing the experimentally and analytically obtained deflections for the group A, B, and D specimens (Figure 19). The lowest deflections were obtained by an analytical calculation based on the assumption of a completely rigid connection. The maximum vertical deflection of 0.748 mm was observed at a load of 8 kN. In comparison, the FEM model (based on more detailed input of material properties and shear modelling) predicted a deflection of 0.842 mm, indicating a very good agreement between the results—the difference between the methods is only about 11.8%. The agreement of the results with theoretical calculations and FEM analysis (assuming a rigid connection) shows that this methodology is reliable.
To analyse in more depth the differences between the experimental and theoretical deflection values of the group B samples, a FEM model was additionally built where a larger offset between the layers was taken into account. In the following section, the FEM model with higher interlayer shear will be referred to as “submissive joint” in this work. At an 8 kN load, the FEM model with a compliant connection between the layers showed a maximum deflection value of 1.036 mm. A difference of 34.24% was observed when compared to the deflection value of the group B specimen (1.464 mm). Furthermore, the analysis of the deflection comparison graph (Figure 20) shows that the light green curve (FEM model with a compliant connection) is closer to the orange curve (results for the group of group B specimens). These results suggest that the behaviour of the group B sample group is closer to the model with a compliant connection than that of a rigid adhesive connection.
Comparing the experimentally determined load capacity values (Figure 19) with the FEM model-calculated maximum loads, there are differences between the laboratory results and the model predictions. The average bearing capacity of the laboratory experiment for Type B specimens is 15.38 kN, while the FEM model predicts 18.9 and 12.9 kN for rigid and compliant connections, respectively.
Comparing these values with the experimental results, the model with a compliant joint shows a smaller percentage difference of 17.54%, while the model with a rigid joint differs by 20.54%. Although this does not achieve a perfect match in either case, the model that considers a compliant connection between the layers provides a closer match in bearing capacity and deflection values.
In addition, the observations from the experimental part of the test should be highlighted: all tested specimens disintegrated during loading, showing the brittle behaviour of the connection. The exception was specimen D-10, which did not disintegrate during loading and collapsed at a higher load of 16.4 kN, exceeding the group average (group D: 15.26 kN) by 7.5%. This observation could mean that a completely rigid connection between the materials was obtained and a more complete composite effect was developed, meaning the experimental values for group B would be closer to the theoretically calculated results, as well as to those obtained by FEM analysis.
Although group B specimens achieved higher load capacities than groups A and D, they exhibited higher adhesive timber-to-concrete connection weakness due to imperfect adhesion. All group B specimens disintegrated (at lower loads than groups A or D), and a division of the glass yarns into smaller parts was observed.

3.1.3. Influence of the Adhesive Layer Reinforcement on the Behaviour of the Timber–Concrete Members Subjected to Flexure

By comparing the different specimen types and the calculation method results, the study observes the effect of the glass fibre thread reinforcement on the structure’s load-bearing capacity. Group B specimens with integrated thread reinforcement showed an average load capacity of 15.38 kN compared to 15.10 kN for group A (without reinforcement) specimens. Group D specimens also showed a higher value than Type A but lower than Type B at 15.26 kN (group D specimens). The difference in the experimental load capacity between groups B and A is about 1.9%, while between groups B and D, it is only 0.8%.
Experimental data showed that in all sample types, complete disintegration can occur before the maximum vertical load is applied. The average load at which such disintegration was observed was 14.52 kN for group A specimens, 13.28 kN for group B specimens and 14.72 kN for group D specimens.
Despite the complete disintegration of the structure, the specimens maintained a certain load-bearing margin until the final moment of failure. After disintegration, the unreinforced adhesive layer group A specimens still resisted approximately 1.87 kN. On the other hand, the specimens of group B and type D, where the adhesive layer was reinforced with glass fibre yarns, showed a significantly higher residual load capacity of 3.5 kN on average.
These results show that glass fibre reinforcement improves the behaviour of the specimens, providing increased durability even after loss of rigid connection between the specimen layers. This confirms the positive effect of the epoxy glue layer reinforcement by the glass yarn net. However, it should be noted that the effect of the epoxy glue layer reinforcement on the load-carrying capacity is insufficient and should be investigated in more detail in future investigations.
Group B specimens generally showed slightly higher load-carrying capacity and less deflection before critical load compared to the other specimen groups. This behaviour is attributed to the effect of the glue layer reinforcement by the glass yarn net, which improved the stiffness and load capacity of the structure up to a certain point. At the same time, using additional fibres in the concrete layer (as in group D) may affect the deformation mode, leading to higher displacement values and potentially affecting the serviceability of the structure.
In the previous comparison between experimental results and FEM simulation data, it was observed that the behaviour of the group B specimens was closer to that of a compliant model than to a rigid model, which could be explained by disintegration or delamination of the specimen under load.
If the specimens had not delaminated, the results would probably be in better agreement with the theoretical calculations and predictions of the FEM analysis, especially for the model with a rigid connection between the specimen layers. This indicates the significant influence of the quality of interlaminar adhesion on the overall load capacity and deformation behaviour of the separate layers. In view of the above, it is recommended that further studies be carried out to assess the reinforcement potential in the adhesive layer more fully. Possible directions include the following:
  • Varying the number, orientation and location of reinforcement to identify the optimum configuration;
  • Investigate the adhesion quality of reinforcement with different reinforcement materials in the adhesive layer to achieve a more effective composite effect.
Overall, the existing research base provides an initial understanding of the effect of glass fibre reinforcement in the adhesive layer. Still, more research is needed to draw valid conclusions on the effectiveness of reinforcement.

3.2. Simulation Validation with Experiments

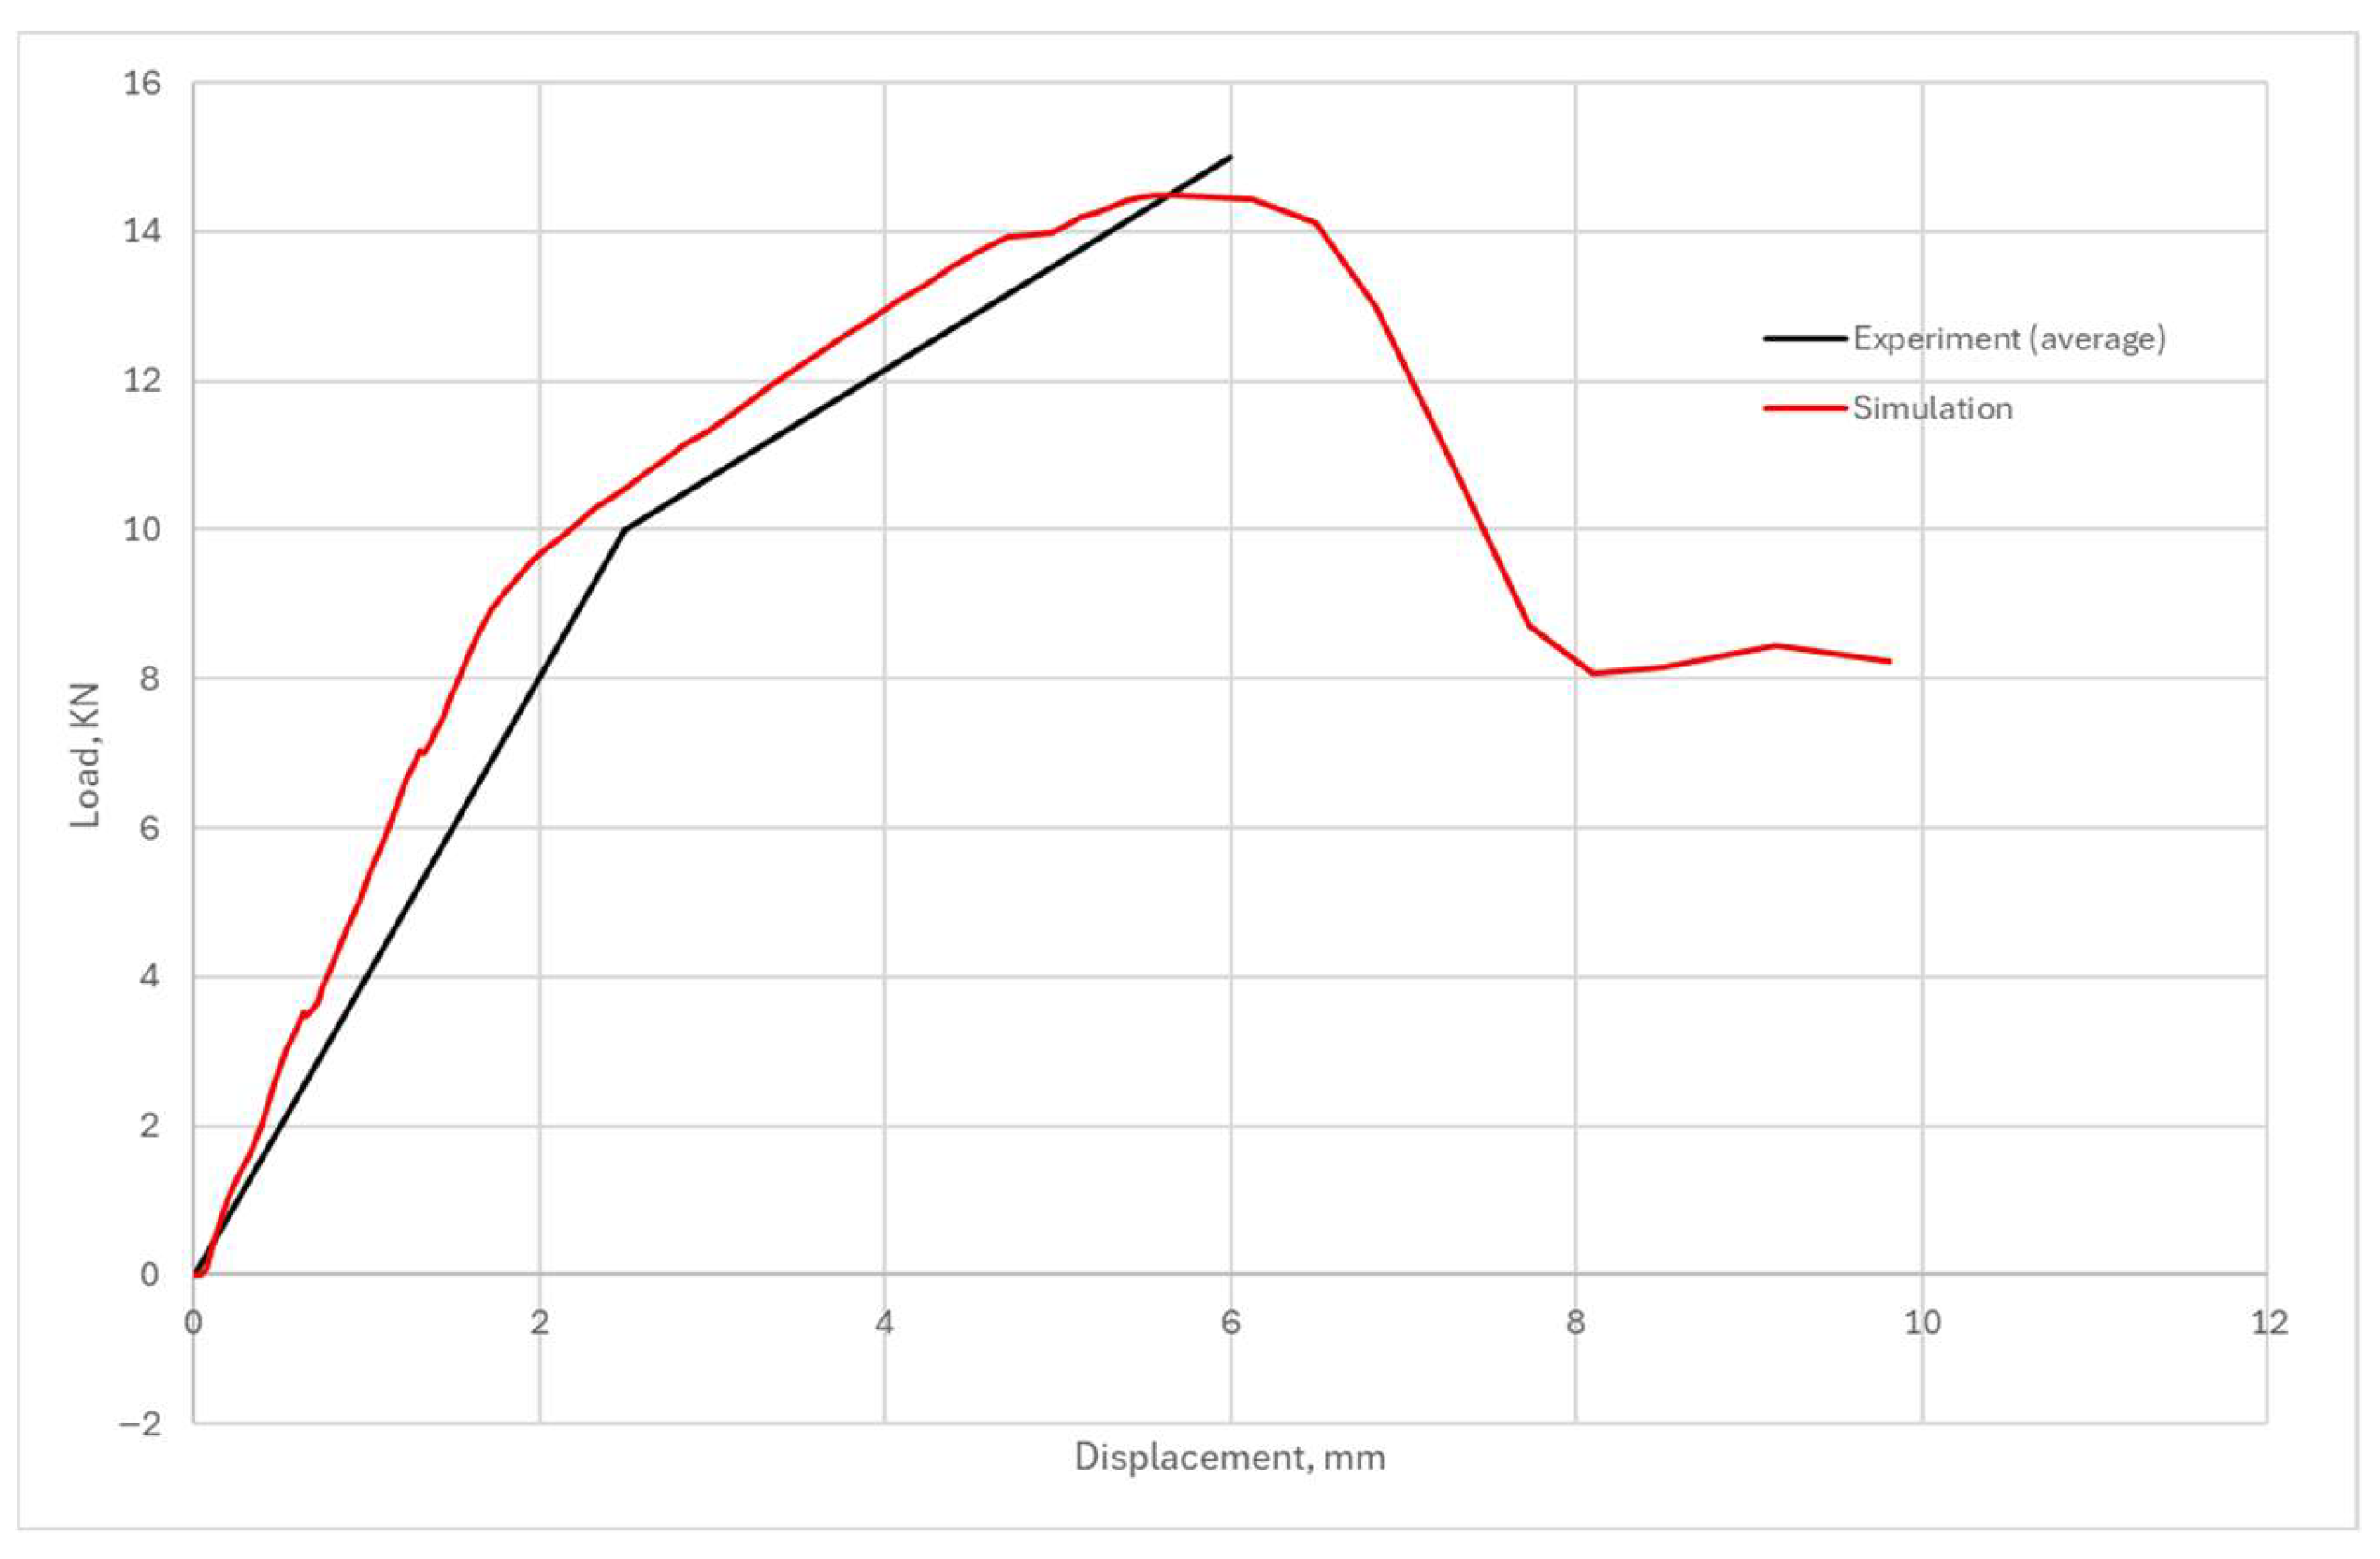
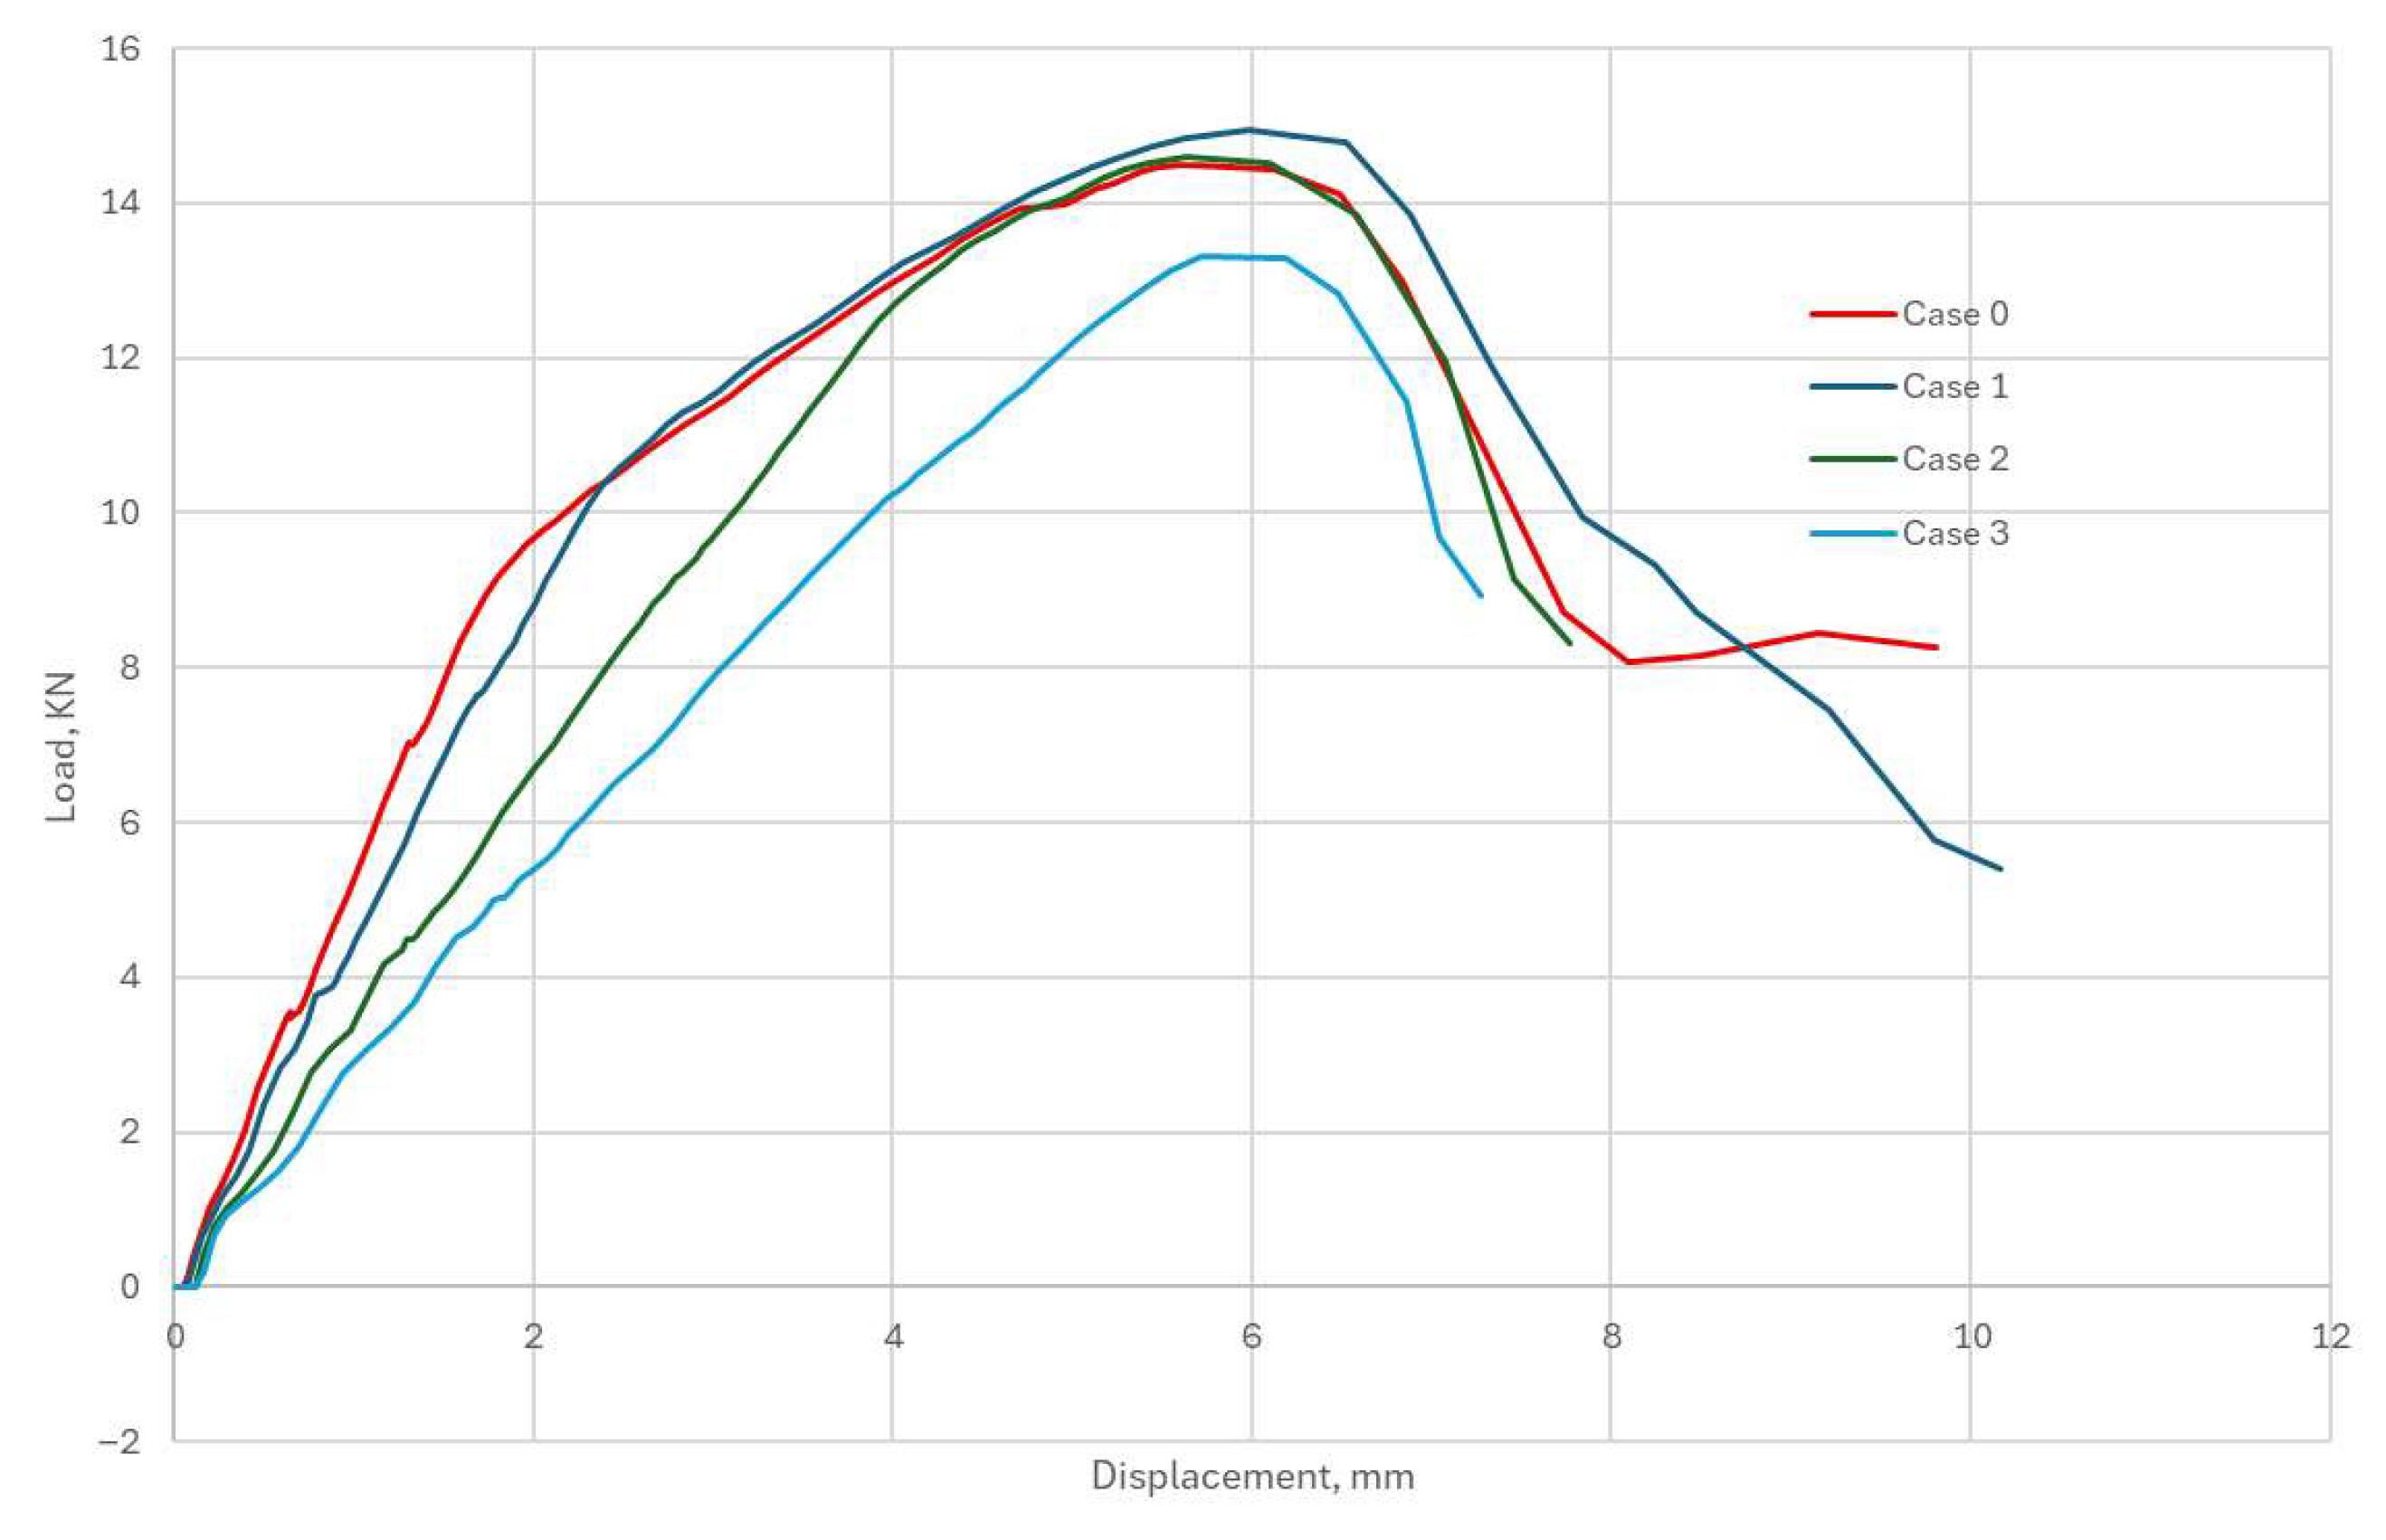
The simulation model was validated with the obtained experimental measurements. Concrete and timber (see Table 2) material properties were obtained for that purpose. Based on glue properties, it was assumed that the tensile strength of the glue layer was equal to 1 MPa and the compressive strength was 3 MPa (similar to concrete strength perpendicular to grain, see Figure 20). Shear stiffness and strength function depending on shear displacements are shown in Figure 21. This function was tailored to combine the numerical results with experimental results. It can be seen in Figure 22 that the assumed and obtained material properties demonstrate good accuracy compared to the experimentally measured load-displacement curve.
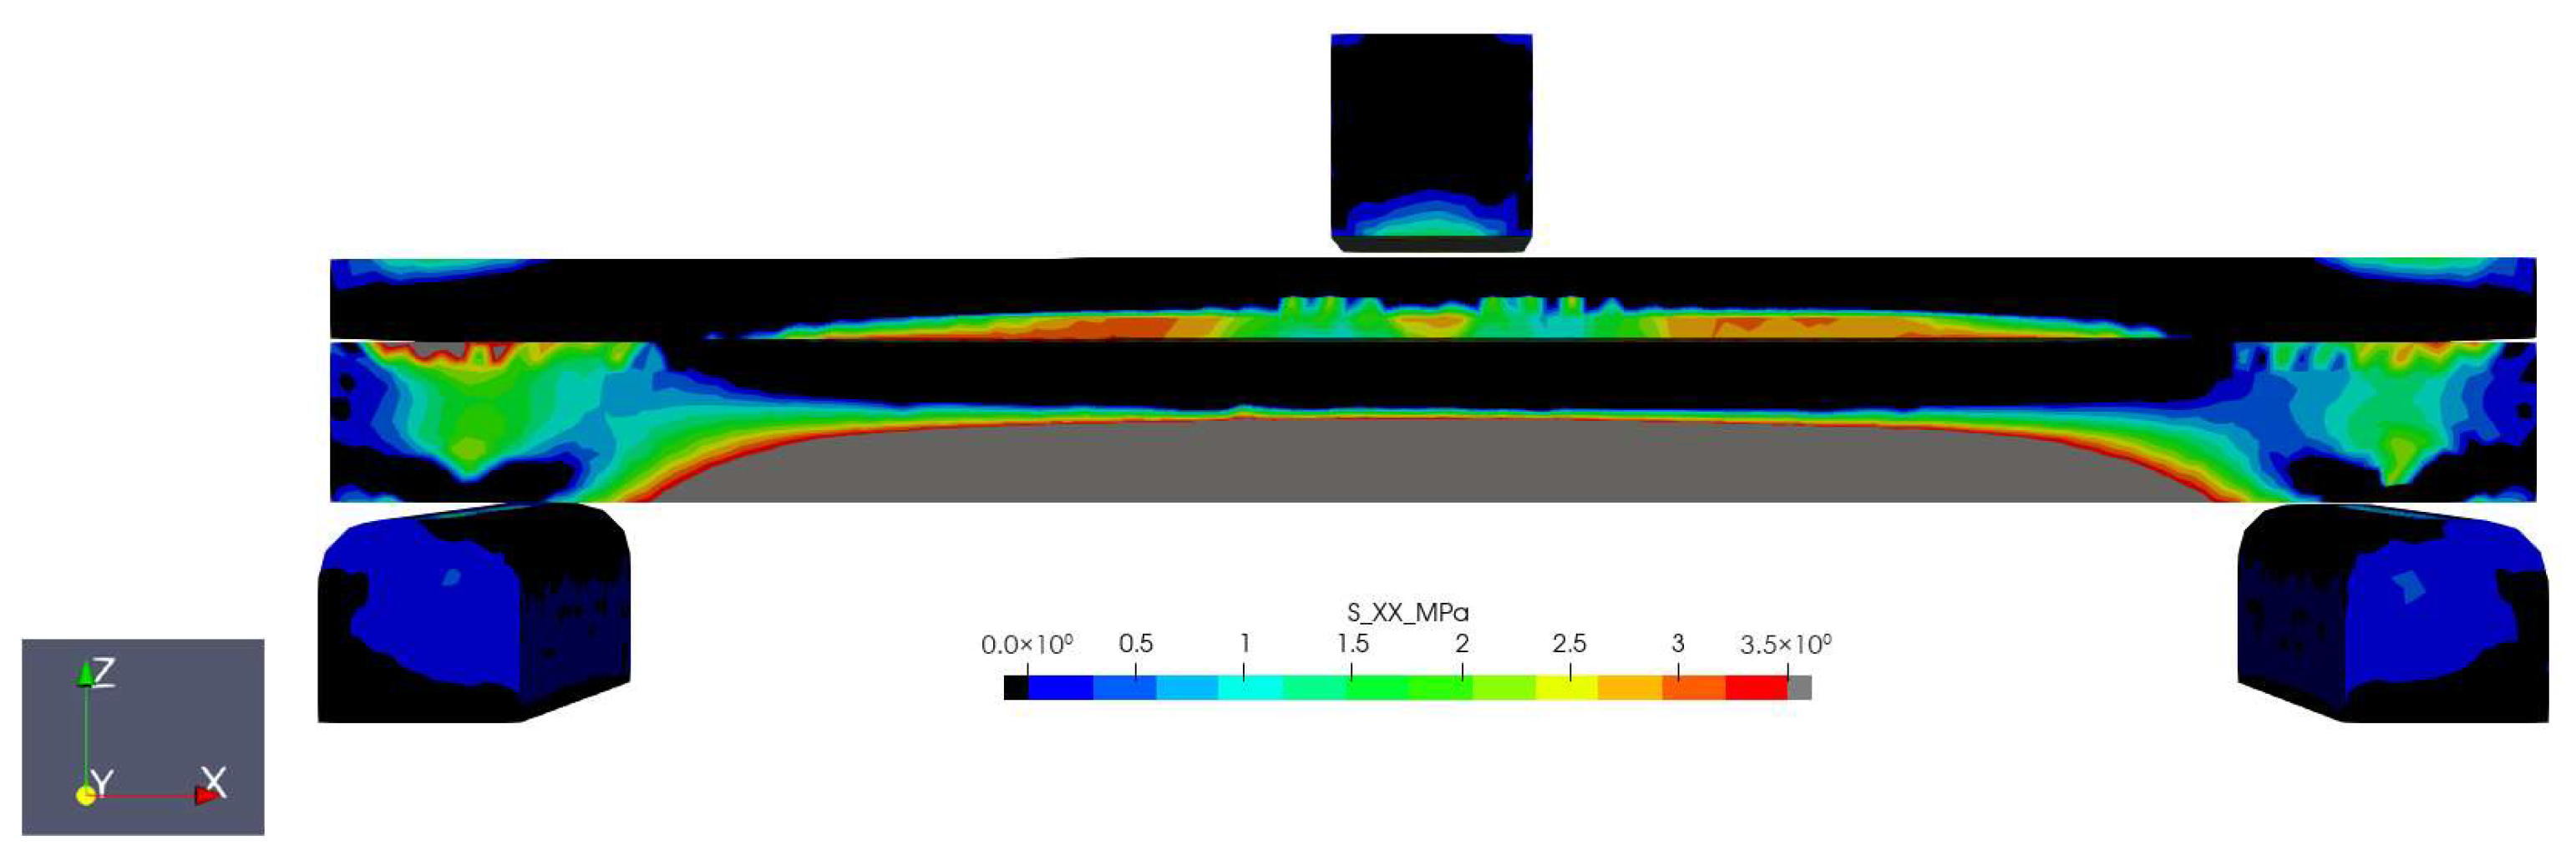
It can be observed that there is significant local compression–tensile splitting stress around the load application area (see local damage in Figure 23). The experimental failure mode also showed such local concrete damage around the load application area (see Figure 19a).
At 14 KN, the load level tensile stress in timber reached 30 MPa (see Figure 24), which is the tensile strength of timber and a sample of the final failure load. Due to local bending and compression in the load application area, the concrete underwent tensile stress on the bottom part of the concrete layer (see Figure 25). Deformations of the sample show minor slip displacements in the glue and sample, which generally work similar to rigid connections.
By using the validated numerical FEM model, we performed a numerical study to understand better how the stiffness of a glued joint can affect the overall sample strength and stiffness. Three additional shear load–slip curves (Figure 26) were implemented in the FEM model and the results were checked. Cases 0, 1, 2 and 3 had 1×, 2×, 5× and 10× times smaller joint stiffness values (see Table 3). According to the obtained load-displacement curves (see Figure 27), it was visible that up to 5 times smaller glued joint stiffness will not have a significant impact on structural strength. When there was 10× smaller joint stiffness, the peak load was about 7% smaller. For 2× smaller joint stiffness, the overall structural bending stiffness was not significantly affected.

4. Conclusions

This study investigated the mechanical behaviour of timber–concrete composite (TCC) members featuring an epoxy adhesive layer reinforced by a glass fibre yarn net and polypropylene fibres added to the concrete layer. Laboratory three-point bending tests on specimens with dimensions 550 mm × 100 mm × 61 mm demonstrated significant improvements in flexural stiffness and load-bearing capacity when applied reinforcement. An analytical macro-mechanics layered material model effectively predicted the experimental results and validated by finite element simulations conducted using the newly developed Verisim4D software. The reinforced adhesive layer increased the load-bearing capacity by up to 28–40%, aligning with enhancements reported for granite chip bonding methods and reducing brittleness. These findings confirm the efficacy of combining reinforcement with advanced numerical and analytical modelling to improve the structural performance of TCC members.
New findings were identified as a result of this study:
  • Applying the macro-mechanics layered material model to epoxy adhesive layers reinforced by a glass fibre yarn net, enabling vertical displacement predictions within less than 5% error compared to laboratory results.
  • The introduction of an epoxy adhesive reinforcement method increased the load-bearing capacity of TCC specimens by approximately 30% compared to unreinforced specimens and simultaneously reduced the brittleness of the adhesive connection.
  • Verification of the Verisim4D finite element software for modelling non-linear behaviour of the reinforced adhesive layer and concrete, achieving close agreement with experimental load-displacement curves across all three specimen types.
  • Critical assessment of different analytical design methods for TCC members with reinforced adhesive layers, culminating in the selection of the layered macro-mechanics approach that best captures the mechanical interactions and slip behaviour in such composites.

Author Contributions

Conceptualization, A.H., E.B. and D.S.; methodology, J.S., E.B. and D.S.; software, J.S.; validation, A.H., E.B. and D.S.; formal analysis, J.S.; investigation, A.H.; resources, E.B.; data curation, J.S.; writing—original draft preparation, E.B., D.S., J.S. and A.Z.; writing—review and editing, V.L.; visualization, A.H., J.S. and V.L.; supervision, J.S., E.B. and D.S.; project administration, D.S. and J.S.; All authors have read and agreed to the published version of the manuscript.

Funding

This research was funded by Doctoral academic career grant No. 1067, European Union Recovery and Resilience Facility funded project No. 5.2.1.1.i.0/2/24/I/CFLA/003 “Consolidation and management changes” at Riga Technical University, Liepaja University, Rezekne Academy of Technologies and the Latvian Maritime Academy and Liepaja Maritime College towards excellence in higher education, science and innovation.

Data Availability Statement

The original contributions presented in this study are included in the article. Further inquiries can be directed to the corresponding authors.

Conflicts of Interest

The authors declare no conflicts of interest.

References

  1. Buka-Vaivade, K.; Serdjuks, D.; Podkoritovs, A.; Pakrastins, L.; Mironovs, V. Rigid Connection with Granite Chips in the Timber-Concrete Composite. Environ. Technol. Resour. Proc. Int. Sci. Pr. Conf. 2021, 3, 36–39. [Google Scholar] [CrossRef]
  2. Cardoso, W.; Baptista, R.C.; Machado, T.A.P.; Galdino, A.G.d.S.; Di Felice, R. Evaluation of the Incorporation of Marble and Granite Cutting Residues in Concrete for the Production of Interlocking Paving Floors. Rev. Ifes Ciência 2021, 7, 1–17. [Google Scholar] [CrossRef]
  3. Movaffaghi, H.; Pyykkö, J.; Yitmen, I. Value-Driven Design Approach for Optimal Long-Span Timber-Concrete Composite Floor in Multi-Storey Wooden Residential Buildings. Civ. Eng. Environ. Syst. 2020, 37, 100–116. [Google Scholar] [CrossRef]
  4. Shi, B.; Zhou, X.; Tao, H.; Yang, H.; Wen, B. Long-Term Behavior of Timber–Concrete Composite Structures: A Literature Review on Experimental and Numerical Investigations. Buildings 2024, 14, 1770. [Google Scholar] [CrossRef]
  5. Eslami, H.; Yaghma, A.; Bhagya Jayasinghe, L.; Waldmann, D. Influence of Different End-of-Life Cycle Scenarios on the Environmental Impacts of Timber-Concrete Composite Floor Systems. In Proceedings of the World Conference on Timber Engineering (WCTE 2023), Oslo, Norway, 19–22 June 2023; pp. 982–988. [Google Scholar]
  6. Ilgın, H.E.; Aslantamer, Ö.N. Analysis of Space Efficiency in High-Rise Timber Residential Towers. Appl. Sci. 2024, 14, 4337. [Google Scholar] [CrossRef]
  7. Nepal, P.; Prestemon, J.P.; Ganguly, I.; Kumar, V.; Bergman, R.D.; Poudyal, N.C. The Potential Use of Mass Timber in Mid-to High-Rise Construction and the Associated Carbon Benefits in the United States. PLoS ONE 2024, 19, e0298379. [Google Scholar] [CrossRef]
  8. Monteiro, S.R.S.; Dias, A.M.P.G.; Lopes, S.M.R. Transverse Distribution of Concentrated Loads in Timber–Concrete Floors: Parametric Study. Proc. Inst. Civ. Eng.-Struct. Build. 2020, 173, 340–351. [Google Scholar] [CrossRef]
  9. Ustinovichius, L.; Turskis, Z.; Miedziałowski, C.; Vaišnoras, M. Implementation of Wood-Framed Buildings in the Nordic Region: A MADAMOS (an Integrated Multi-Criteria Decision-Making Approach for Profitable Realisation Alternatives) Method. Buildings 2024, 14, 1020. [Google Scholar] [CrossRef]
  10. Pastori, S.; Salehi, M.-S.; Radl, S.; Mazzucchelli, E.S. A Fast-Calibrated Computational Fluid Dynamic Model for Timber–Concrete Composite Ventilated Façades. Buildings 2024, 14, 3567. [Google Scholar] [CrossRef]
  11. Gutiérrez, N.; Negrão, J.; Dias, A.; Guindos, P. Bibliometric Review of Prefabricated and Modular Timber Construction from 1990 to 2023: Evolution, Trends, and Current Challenges. Sustainability 2024, 16, 2134. [Google Scholar] [CrossRef]
  12. Şahin, N.; Biçer, Ö.P. Development of Cross-Laminated Timber and Current Standards in Türkiye. SETSCI Conf. Proc. 2024, 20, 32–36. [Google Scholar] [CrossRef]
  13. Siqueira, T.P.L.; da Glória, M.Y.R.; Martinelli, E.; Toledo Filho, R.D. Development and Validation of a Theoretical Model for Flexural Behaviour in Timber-Concrete and Bamboo-Concrete Composite Beams. Buildings 2025, 15, 2021. [Google Scholar] [CrossRef]
  14. Wen, B.; Tao, H.; Shi, B.; Yang, H. Dynamic Properties of Timber–Concrete Composite Beams with Crossed Inclined Coach Screw Connections: Experimental and Theoretical Investigations. Buildings 2023, 13, 2268. [Google Scholar] [CrossRef]
  15. Cvetković, R.; Ranković, S.; Mišulić, T.K.; Kukaras, D. Experimental Analysis of Mechanical Behaviour of Timber-Concrete Composite Beams with Different Connecting Systems. Buildings 2024, 14, 79. [Google Scholar] [CrossRef]
  16. Wen, B.; Shi, B.; Tao, H.; Yang, H.; Huang, B. Experimental Investigations on Vibration Performance of Timber-Concrete Composite Beams Using Lightweight Aggregate Concrete. In Proceedings of the World Conference on Timber Engineering (WCTE 2023), Oslo, Norway, 19–22 June 2023; pp. 1888–1893. [Google Scholar]
  17. Theoretical and Experimental Research on Slip and Uplift of the Timber-Concrete Composite Beam: BioResources. Available online: https://bioresources.cnr.ncsu.edu/ (accessed on 23 July 2025).
  18. Denouwé, D.D.; Messan, A.; Fournely, E.; Bouchair, A. Influence of Interlayer in Timber-Concrete Composite Structures with Threaded Rebar as Shear Connector-Experimental Study. Am. J. Civ. Eng. Archit. 2018, 6, 38–45. [Google Scholar] [CrossRef]
  19. Cao, J.; Yu, D.; Zhang, J. Mechanical Properties of Timber-Concrete Connections with Steel Tube Connectors. Sustain. Struct. 2022, 2, 17. [Google Scholar] [CrossRef]
  20. Buka-Vaivade, K.; Serdjuks, D.; Pakrastins, L. Cost Factor Analysis for Timber–Concrete Composite with a Lightweight Plywood Rib Floor Panel. Buildings 2022, 12, 761. [Google Scholar] [CrossRef]
  21. Mirdad, M.A.H.; Khan, R.; Chui, Y.H. Analytical Procedure for Timber−Concrete Composite (TCC) System with Mechanical Connectors. Buildings 2022, 12, 885. [Google Scholar] [CrossRef]
  22. Soalih, H.A.; Demir, S. Current Practice and Recent Developments of Shear Connectors for Timber Concrete Composite Applications: A State of the Art Review. JSEAM 2023, 6, 422–440. [Google Scholar] [CrossRef]
  23. Sandak, A.; Brzezicki, M.; Sandak, J. 9—Trends and Perspectives in the Use of Timber and Derived Products in Building Façades. In New Materials in Civil Engineering; Samui, P., Kim, D., Iyer, N.R., Chaudhary, S., Eds.; Butterworth-Heinemann: Oxford, UK, 2020; pp. 333–374. ISBN 978-0-12-818961-0. [Google Scholar]
  24. Van Thai, M.; Galimard, P.; Elachachi, S.M.; Ménard, S. Multi-Objective Optimisation of Cross Laminated Timber-Concrete Composite Floor Using NSGA-II. J. Build. Eng. 2022, 52, 104285. [Google Scholar] [CrossRef]
  25. Shahnewaz, M.; Jackson, R.; Tannert, T. Reinforced Cross-Laminated Timber-Concrete Composite Floor Systems. Eng. Struct. 2023, 291, 116395. [Google Scholar] [CrossRef]
  26. Derikvand, M.; Fink, G. Bending Properties of Deconstructable Cross-Laminated Timber-Concrete Composite Floor Elements. Wood Mater. Sci. Eng. 2022, 17, 253–260. [Google Scholar] [CrossRef]
  27. Khorsandnia, N.; Valipour, H.R.; Crews, K. Finite Element Modeling of Timber-Concrete Composite Beams under Short-Term Loadings. In ECCOMAS 2012-European Congress on Computational Methods in Applied Sciences and Engineering, e-Book Full Papers; Vienna University of Technology: Vienna, Austria, 2012; pp. 859–867. [Google Scholar]
  28. Briuka, E.; Serdjuks, D.; Akishin, P.; Sahmenko, G.; Podkoritovs, A.; Ozolins, R. Behaviour Analysis of Beam-Type Timber and Timber-Concrete Composite Panels. Appl. Sci. 2024, 14, 7403. [Google Scholar] [CrossRef]
  29. Fu, Q.; Yanb, L.; Kasal, B. Bending Behavior of Adhesively-Bonded Engineered Wood-Concrete Composite Decks. Acta Polytech. CTU Proc. 2022, 33, 175–180. [Google Scholar] [CrossRef]
  30. Yeoh, D.; Fragiacomo, M.; Deam, B. Experimental Behaviour of LVL–Concrete Composite Floor Beams at Strength Limit State. Eng. Struct. 2011, 33, 2697–2707. [Google Scholar] [CrossRef]
  31. Clouston, P.; Bathon, L.A.; Schreyer, A. Shear and Bending Performance of a Novel Wood–Concrete Composite System. J. Struct. Eng. 2005, 131, 1404–1412. [Google Scholar] [CrossRef]
  32. Bogensperger, T.; Krenn, H. Ribbed Clt Elements with Cut-Backs. In Proceedings of the World Conference on Timber Engineering 2025, Brisbane, Australia, 22–26 June 2025; pp. 1104–1111. [Google Scholar]
  33. VeriSim4D FEM Software by InDEM. Available online: https://indem.engineering (accessed on 1 August 2025).
  34. EN 1995-1-1; Erocode 5: Design of Timber Structures—Part 1-1: General—Common Rules and Rules for Buildings. CEN: Brussels, Belgium, 2004.
  35. EN 1995-1-1. Available online: https://www.phd.eng.br/wp-content/uploads/2015/12/en.1995.1.1.2004.pdf (accessed on 17 September 2025).
  36. EN 1992-1-1. Available online: https://www.phd.eng.br/wp-content/uploads/2015/12/en.1992.1.1.2004.pdf (accessed on 17 September 2025).
  37. Sliseris, J.; Frolovs, G.; Rocens, K.; Goremikins, V. Optimal Design of GFRP-Plywood Variable Stiffness Plate. Procedia Eng. 2013, 57, 1060–1069. [Google Scholar] [CrossRef]
  38. Sliseris, J.; Andrä, H.; Kabel, M.; Wirjadi, O.; Dix, B.; Plinke, B. Estimation of Fiber Orientation and Fiber Bundles of MDF. Mater. Struct. 2016, 49, 4003–4012. [Google Scholar] [CrossRef]
  39. Buka-Vaivade, K.; Sliseris, J.; Serdjuks, D.; Sahmenko, G.; Pakrastins, L. Numerical Comparison of HPFRC and HPC Ribbed Slabs. IOP Conf. Ser. Mater. Sci. Eng. 2019, 660, 012054. [Google Scholar] [CrossRef]
  40. Gailitis, R.; Sliseris, J.; Korniejenko, K.; Mikuła, J.; Łach, M.; Pakrastins, L.; Sprince, A. Long-Term Deformation Properties of a Carbon-Fiber-Reinforced Alkali-Activated Cement Composite. Mech. Compos. Mater. 2020, 56, 85–92. [Google Scholar] [CrossRef]
  41. Sliseris, J.; Korjakins, A. Numerical Modeling of the Casting Process and Impact Loading of a Steel-Fiber-Reinforced High-Performance Self-Compacting Concrete. Mech. Compos. Mater. 2019, 55, 29–40. [Google Scholar] [CrossRef]
  42. Červenka, V.; Jendele, L.; Červenka, J. ATENA Program Documentation Part 1; Cervenka Consulting: Praha, Czech Republic, 2021. [Google Scholar]
  43. Walraven, J. Fib Model Code for Concrete Structures 2010: Mastering Challenges and Encountering New Ones. Struct. Concr. 2013, 14, 3–9. [Google Scholar] [CrossRef]
  44. Yvonne, D. Murray Manual for LS-DYNA Wood Material Model 143; US Department of Transportation: Washington, DC, USA, 2007; p. 166. [Google Scholar]
  45. Latvijas Finieris Group. Plywood Handbook 2022; Latvijas Finieris Group: Riga, Latvia, 2022. [Google Scholar]
Figure 1. Design scheme and main geometric parameters of the specimens.
Jcs 09 00538 g001
Figure 2. Geometrical parameters of laboratory specimens.
Jcs 09 00538 g002
Figure 3. Production of the group A specimens: (a) placement of specimens in the moulds; (b) filling of the moulds with concrete.
Jcs 09 00538 g003
Figure 4. Production of group B specimens: (a) placement of glass fibre net; (b) placement of glass fibre net.
Jcs 09 00538 g004
Figure 5. Testing of specimens by the device FORM+TEST UPB 86/200: (a) specimens placed in the testing device; (b) mechanical indicator.
Jcs 09 00538 g005
Figure 6. Finite element model of 3-point bending test.
Jcs 09 00538 g006
Figure 7. Description of cohesive zone spring in normal direction: (a) normal surface spring schematic view; (b) non-linear load–displacement curve in normal direction of cohesive zone spring.
Jcs 09 00538 g007
Figure 8. Description of cohesive zone spring in shear direction (a) shear surface spring schematic view; (b) non-linear load-displacement curve in shear direction of cohesive zone spring.
Jcs 09 00538 g008
Figure 9. Dependence of the maximum vertical displacements on the vertical load, applied as a concentrated force in the middle of the span, for group A specimens.
Jcs 09 00538 g009
Figure 10. The load value at which the specimens reached their maximum load-carrying capacity, as well as the partial and complete disintegration of the separate layers for group A specimens.
Jcs 09 00538 g010
Figure 11. Mode of failure of the A group of specimens: (a) specimen A-4; (b) specimen A-9.
Jcs 09 00538 g011
Figure 12. Dependence of the maximum vertical displacements on the vertical load, applied as a concentrated force in the middle of the span, for group B specimens.
Jcs 09 00538 g012
Figure 13. The load value at which the specimens reached their maximum load-carrying capacity, as well as the partial and complete disintegration of the separate layers for group B specimens.
Jcs 09 00538 g013
Figure 14. Mode of failure of the B group of specimens: (a) specimen B-10; (b) specimen B-8.
Jcs 09 00538 g014
Figure 15. Dependence of the maximum vertical displacements on the vertical load, applied as a concentrated force in the middle of the span, for group D specimens.
Jcs 09 00538 g015
Figure 16. The load value at which the specimens reached their maximum load-carrying capacity, as well as the partial and complete disintegration of the separate layers for group D specimens.
Jcs 09 00538 g016
Figure 17. Mode of failure of the D group specimens: (a)—specimen D-2; (b)—specimen D-4.
Jcs 09 00538 g017aJcs 09 00538 g017b
Figure 18. Comparison of group B specimen deformations predicted by the software Verisim4D: (a) deformation and failure mode of the group B specimen B-3; (b) local axial (longitudinal) stress concentration of the group b specimens predicted by the software Verisim4D.
Jcs 09 00538 g018aJcs 09 00538 g018b
Figure 19. Maximum vertical displacements obtained by the A, B and D group specimens in the course of the laboratory experiment, by the FEM and analytical analyses.
Jcs 09 00538 g019
Figure 20. Assumed curve of cohesive zone element in the normal direction.
Jcs 09 00538 g020
Figure 21. Assumed calibrated curve of cohesive zone element in shear direction.
Jcs 09 00538 g021
Figure 22. Simulation result comparison with average experimental results.
Jcs 09 00538 g022
Figure 23. Damage variable d (state_04, 0—no damage, 1—fully damaged) at 14 KN load.
Jcs 09 00538 g023
Figure 24. Horizontal stress Sxx (MPa) at 14 KN load.
Jcs 09 00538 g024
Figure 25. Horizontal stress Sxx (MPa) at 14 KN load shows only tensile regions in the range 0 to 3.5 MPa (corresponding to concrete tensile strength).
Jcs 09 00538 g025
Figure 26. Cases were analysed to check how joint stiffness affects the structural behaviour.
Jcs 09 00538 g026
Figure 27. Load–displacement curve depending on the joint’s stiffness.
Jcs 09 00538 g027
Table 1. Comparison of analytical design methods for timber-concrete composite members with strengthened adhesive layer.
Title of the MethodAdvantagesLimitations/DisadvantagesSuitability for Adhesive Timber-to-Concrete
Connections
The composite equations
(governing equations of a composite beam)
Accurate model of slip and shear force distributionComplex analysis, difficult to use without softwareAverage—calibration of parameters required
The CEREMA methodSolution for sinusoidal load, relatively simpleSuitable for simple loads,
does not consider the non-linearity of the connection
Low—over-simplified
The semi-analytical Vh-s methodPossible analysis of the non-linear behaviour of the connection (softening phase)Not suitable for compliant
connections, iterative
and complex
Average—can be used for the adhesive connections with limitations
The Gamma methodSimple, practical
application; Can be extended by the information from EN 1995-1-1 [35]
Limited in number of layers, does not accept shear deformations along lengthAverage—limitations related to the multilayered structures
Micromechanics approach for layered materialPossibility of orthotropic layers analysis, high precisionPrecise information regarding the mechanical properties of all the layers is requiredHigh—precisely shows the effect of adhesive layer
Finite element methodAccurate and general methodMany input parameters that are not easy to define, less transparent results.Very high- can consider all important mechanical effects
Table 2. Material properties used in the simulation for the timber model.
MaterialProperty NameValueUnitReference
ConcreteGradeC30/37-Calc. from compressive strength
Modulus of elasticity33GPaCalc. from compressive strength
Compressive strength40MPaExp. Measured
Tensile strength3.5MPaCalc. from compressive strength
Fracture energy147.6Pa×mCalc. from compressive strength
Poissons ratio0.2-Recommended value in EN 1992
Density2400.0kg/m3Exp. Measured
TimberPlywood type, gradeRiga Ply, S-[41]
Modulus of elasticity in grain direction, E L 6.5GPa [45]
Modulus of elasticity perpendicular to grains, E T , E R 0.37GPa [45]
Poissons ratio in L-T and T-L plane, v L T ,   v T L 0.002- [45]
Poissons ratio in R-T plane, v R T 0.2- [45]
Shear modulus in L-T and L-R plane, G L T ,   G L R 0.69GPa [45]
Shear modulus in T-R plane, G T R 0.15GPa [45]
Tensile strength parallel to grains30MPa [45]
Compressive strength parallel to grains17MPa [45]
Tensile strength perpendicular to grains0.4MPa [45]
Compressive strength perpendicular to grains2.2MPa [45]
Rolling shear strength3.2MPa [45]
Shear strength parallel to grains5MPa [45]
Fracture energy, mode I- splitting, parallel to grains0.5MPa×cm [44]
Fracture energy, mode I- splitting, perpendicular to grains0.005MPa×cm [44]
Fracture energy, mode II- shearing, parallel to grains8.38MPa×cm [44]
Fracture energy, mode II- shearing, perpendicular to grains0.078MPa×cm [44]
B,D parameters30- [44]
Density800kg/m3Exp. Measured
Table 3. Cohesive zone element spring stiffness and strength properties for all 4 cases.
CaseInitial Stiffness, MPa/mmDisplacement at Yield Point, mmPeak Shear Stress, MPa
Case 01000.110
Case 1500.210
Case 2200.510
Case 310110
Disclaimer/Publisher’s Note: The statements, opinions and data contained in all publications are solely those of the individual author(s) and contributor(s) and not of MDPI and/or the editor(s). MDPI and/or the editor(s) disclaim responsibility for any injury to people or property resulting from any ideas, methods, instructions or products referred to in the content.