Article

Dynamic Mechanical Behavior of Nanosilica-Based Epoxy Composites Under LEO-like UV-C Exposure

by
Emanuela Proietti Mancini
,
Flavia Palmeri
and
Susanna Laurenzi
*
Department of Astronautical Electrical and Energy Engineering, Sapienza University of Rome, Via Salaria 851-881, 00138 Rome, Italy
*
Author to whom correspondence should be addressed.
Current address: California Institute of Technology, 1200 E. California Boulevard, MC 105-50, Pasadena, CA 91125-4600, USA.
J. Compos. Sci. 2025, 9(10), 529; https://doi.org/10.3390/jcs9100529
Submission received: 17 June 2025 / Revised: 9 September 2025 / Accepted: 15 September 2025 / Published: 1 October 2025
(This article belongs to the Special Issue Mechanical Properties of Composite Materials and Joints)

Abstract

The harsh conditions of the space environment necessitate advanced materials capable of withstanding extreme temperature fluctuations and ultraviolet (UV) radiation. While epoxy-based composites are widely utilized in aerospace due to their favorable strength-to-weight ratio, they are prone to degradation, especially under prolonged high-energy UV-C exposure. This study investigated the mechanical and chemical stability of epoxy composites reinforced with nanosilica at 0, 2, 5, and 10 wt% before and after UV-C irradiation. Dynamic mechanical analysis (DMA) revealed that increased nanosilica content enhanced the storage modulus below the glass transition temperature (Tg) but reduced both Tg and the damping factor. Following UV-C exposure, all samples showed a decrease in storage modulus and Tg; however, composites with higher nanosilica content maintained better property retention. Frequency sweeps corroborated these findings, indicating improved instantaneous modulus but accelerated relaxation with increased nanosilica. Fourier-transform infrared (FTIR) spectroscopy of UV-C-exposed samples demonstrated significant oxidation and carboxylic group formation in neat epoxy, contrasting with minimal spectral changes in nanosilica-modified composites, signifying improved chemical resistance. Overall, nanosilica incorporation substantially enhances the thermomechanical and oxidative stability of epoxy composites under simulated space conditions, highlighting their potential for more durable performance in low Earth orbit applications.

1. Introduction

Despite their advantages, polymer matrix composites (PMCs) are susceptible to degradation and erosion under extreme conditions, such those of the low Earth orbit (LEO) environment [1]. Spanning altitudes of approximately 200 to 2000 km above Earth’s surface, LEO is characterized by a combination of aggressive factors. Among the various environmental factors, UV radiation is one of the primary causes of degradation of polymeric materials in LEO [2]. In Low Earth Orbit, solar UV radiation consists of vacuum UV (100–200 nm) and near-field UV (200–400 nm), representing 8% of the total solar constant, 1.36 kW/m2 [3]. UV-C radiation possesses sufficient energy to break molecular bonds, including C-C, C-O, and C-H bonds, as well as functional groups within polymers [4,5]. This degradation can occur via chain scission, leading to mass loss and formation of volatile fragments (it influences surface erosion), or via cross-linking, resulting in surface changes without mass loss [6,7]. Such alterations affect the thermo-optical properties, such as the formation of color centers or darkening of glass and ceramics, as well as the mechanical properties of polymers. Maintaining thermo-optical stability is crucial for LEO missions, as it influences a material’s ability to dissipate heat and maintain a stable operational temperature [8]. To understand the effects of the harsh LEO environment, extensive material exposure studies have been conducted over the past decade through the Materials International Space Station Experiment (MISSE) project [3]. Several investigations have centered on both the advancement of polymers and PMCs tailored for space environments and the consequences of UV-C radiation on these materials, leading to the creation of protective surface treatments like silicon oxide coatings [9] that provide resilience against UV erosion [10]. However, this approach adds additional weight to space structures, making it less desirable for applications where weight reduction is critical. Alternatively, incorporating nanoparticles within the polymer matrix offers a promising solution to enhance material resilience against UV effects [11]. The incorporation of nanoparticles in polymeric materials has led to significant advancements in composite performance, opening new possibilities in aerospace engineering. Due to their exceptionally high surface area-to-volume ratio, nanoparticles interact effectively with the polymer matrix, enhancing the material’s mechanical strength, thermal stability, and morphological properties [12,13]. Nanosilica is particularly valued for its light weight, high strength, resistance to heat and thermal stability [14]. This additive has been already successfully used in epoxy resins to create advanced composite materials with applications ranging from adhesives to encapsulants in microelectronics, demonstrating improvements in overall material robustness and resistance to radiation [15,16]. In the context of space, nanosilica has shown promise as a radiation shield, enhancing UV-C protection and reducing polymer degradation under the harsh conditions of LEO [17]. Adding nanosilica to the polymer matrix provides a reinforced structure that mitigates radiation damage and preserves the chemical and mechanical properties of materials over extended periods [18]. This study focuses on the potential of nanosilica not only to improve UV protection but also to enhance the mechanical resilience of the material, thereby reducing the erosion and embrittlement typically experienced by polymers in orbit. So far, however, there is no existing research specifically exploring the mechanical performance of nanosilica-reinforced polymer composites both before and after UV-C exposure [16]. Similar studies focusing on pre- and post-UV-C exposure behavior have been reported for glass fiber reinforced polymer (GFRP)/epoxy composites reinforced with multi-walled carbon nanotubes (MWCNTs) [19], cycloaliphatic epoxy resins modified with octa-functional polyhedral oligomeric silsesquioxane (POSS) [20], and epoxy composites reinforced with virgin or recycled Carbon Fibers (vCFs/rCFs) [21]. Chennareddy et al. [19] found that the addition of MWCNTs not only improved the tensile strength of unexposed samples but also reduced the loss of strength after UV exposure. Suliga et al. [20] investigated the role of octa-POSS in improving epoxy resistance to atomic oxygen (AO) and UV exposure, attributing the observed enhancement to the formation of a protective silicon dioxide (SiO2) layer at the nanocomposite surface. Tortorici et al. [21] reported that UV-C irradiation further hardened the resin, shifting the glass transition temperature to higher values in both virgin and recycled carbon fiber composites. For our specific purpose, to balance enhanced performance with processability, nanosilica contents of 2%, 5%, and 10% were selected. Higher loadings (15–25%) led to severe agglomeration due to insufficient resin, rendering the mixtures unprocessable and unsuitable for mold casting. Limiting the content to 2–10% ensured both effective reinforcement and workable material behavior. These enhancements are crucial for long-term space missions, where material durability is critical to mission success and sustainability. This research investigates nanosilica-reinforced composites across various temperature and frequency domains to characterize short- and long-term material responses, with a particular emphasis on structural changes induced by UV-C exposure [22,23].

2. Materials and Methods

2.1. Sample Preparation

The epoxy resin used in this study is the Cycom® 823 RTM by Cytec (Greenville, TX, USA), a liquid anhydride-cured system with a 4:1 (A:B) mixing ratio and a shelf life of one year at temperatures below 28 °C or two years at −18 °C [24]. The nanosilica employed is SIGMA FUMED SILICA (Sigma-Aldrich/Merck, St. Louis, MO, USA), consisting of spherical particles (~7 nm) with a specific surface area of 390 ± 40 m2/g.
Nanosilica-epoxy composites were prepared with filler contents of 2, 5, and 10 wt%. A THINKY ARE-250 (Thinky Corporation, Tokyo, Japan), a planetary centrifugal mixer with integrated defoaming capability, was used for processing. The optimized protocol involved mixing the resin, hardener, and nanoparticles for 10 min at 1500 rpm with a revolution-to-rotation speed ratio of 2.5:1, followed by defoaming for 10 min at 600 rpm with a speed ratio of 36.7:1 [25]. The blended mixtures were poured into silicone molds and cured following the manufacturer’s guidelines. The curing process was conducted in an oven, starting at room temperature and ramping up to 125 °C at a rate of 6 °C/min. After maintaining the target temperature for one hour, the system was cooled back to 25 °C at the same rate. Epoxy composites with varying nanosilica contents (three replicates per concentration) were then subjected to UV-C radiation exposure.

2.2. UV-C Irradiation

UV-C exposure was performed using an 8 W low-pressure UV lamp (model 3UV-38, UVP LLC, Upland, CA, USA) emitting at 254 nm, with an intensity of 1 mW/cm2, measured using an HD 2302.0 photoradiometer with an LP 471 UV-C probe (100–280 nm) (Delta OHM, Padova, Italy). The irradiation occurred within an aluminum foil-lined enclosure, with the lamp positioned 85 mm from the samples [21]. According to NASA’s guidelines, UV-C light in LEO at 254 nm has an intensity of approximately 2.27 × 10⁻² mW/cm2 [26,27]. Given a year consists of 3.1536 × 10⁷ seconds, the total energy dose over one year in LEO is 716 J/cm2. Dividing this dose by the lamp’s intensity (1 mW/cm2) results in approximately 8 days. Therefore, samples were irradiated for around 8 days to simulate the cumulative UV-C exposure experienced over one year in LEO. The sample temperature during irradiation has been monitored using a thermocouple (Delta OHM, Padova, Italy) and remained stable at approximately 45 °C throughout the process.

2.3. Dynamic Mechanical Analysis

Dynamic mechanical analysis (DMA) was performed using a DMA-1 analyzer (METTLER TOLEDO, Greifensee, Switzerland) in single cantilever configuration. Prior to testing, a displacement sweep was conducted to identify the linear viscoelastic range, establishing 20 µm as the optimal displacement amplitude for all specimen types [28]. Two testing modes were employed: temperature scans, with fixed frequency and amplitude, and frequency scans across a range of 0.1 Hz to 1 Hz (Appendix A), with fixed temperature and amplitude. Temperature scans were performed over two ranges: from +25 °C to +150 °C and from −100 °C to +25 °C. The data generated from these scans were then used to construct master curves. This construction relies on the time–temperature superposition principle (TTSP), a fundamental concept in viscoelasticity. TTSP asserts that the influence of temperature and frequency on a material’s viscoelastic behavior is fundamentally equivalent and interchangeable [29]. By strategically shifting the frequency-dependent data acquired at various temperatures relative to a chosen reference temperature, the resulting master curve provides a powerful tool. It allows for the extrapolation and prediction of the material’s behavior in regimes that lie beyond the direct measurement limitations of instruments [30,31,32,33,34]. Employing this approach, the long-term viscoelastic performance of both the neat epoxy samples and those modified with nanosilica was evaluated. This evaluation was conducted before and after the samples were exposed to UV-C radiation, allowing for a comprehensive understanding of the material’s durability.
To analyze long-term material behavior beyond experimental limits, a two-step method was used: first, frequency response data were fitted to a viscoelastic model; then, the resulting model parameters predicted the time-dependent mechanical response. Specifically, the viscoelastic behavior was mathematically modeled using a Prony series expansion to represent both the storage modulus (E′(ω)) and the loss modulus (E″(ω)) as functions of frequency:
E ω = E 0 i = 1 N ω τ i 2 1 + ω τ i 2
E ω = i = 1 N ω τ i 2 1 + ω τ i 2
where N is the number of relaxation modes, E0 is the instantaneous modulus, Ei are the Prony coefficients, τi are the relaxation times.
Experimental data was fitted to Prony series using the method in [35] to determine parameters in Equations (1) and (2). Two unknown sets were optimized separately: SET-I (E0, τi) with pre-estimated bounds (from high-frequency data and log(duration/N)) optimized by PSO. SET-II (Ei), where moduli are linearly dependent, was determined by LLSS after SET-I optimization. This approach allowed for efficient parameter evaluation based on data characteristics. Throughout the whole optimization process, the relative error is taken as the objective function J (3):
J = ω E 0 E ω 1 i = 1 N E i E ω 1 1 + ω τ i 2 2 + ω 1 i = 1 N E i E ω ω τ i 1 + ω τ i 2 2
To begin the optimization process, the SET-I parameters are randomly initialized using the PSO algorithm. Then, the SET-II parameters are computed such that ∂J/∂Gi = 0, according to the LLSS method. Once the Ei values are determined, the objective function J is computed, and the SET-I parameters are updated using the PSO algorithm. In this work, the PSO is run with a total of 500 particles, a maximum of 2000 iterations, a maximum wait of 200 iterations, and a convergence tolerance of 10−6.

2.4. Differential Scanning Calorimetry

Differential scanning calorimetry (DSC) was performed on epoxy composites containing different nanofiller loadings (0–10 wt%) prior to UV-C exposure. The aim was to determine the glass transition temperature (Tg), establish correlation with dynamic mechanical analysis (DMA) data, and verify the absence of residual curing within the investigated temperature range. Measurements were conducted with a Pyris 8500 calorimeter (PerkinElmer, Waltham, MA, USA) on three specimens of each type. The thermal program consisted of heating from 20 °C to 200 °C at a rate of 10 °C/min to assess the initial thermal behavior of the material.

2.5. FTIR

Fourier-transform infrared (FTIR) spectroscopy was carried out using a Nicolet Summit FTIR spectrometer (Thermo Fisher Scientific, Waltham, MA, USA) in attenuated total reflectance (ATR) mode to assess chemical changes induced by UV-C exposure [36]. Spectra were recorded in the 500–4000 cm−1 range at a resolution of 4 cm−1, with each spectrum averaged over 64 scans. The analysis aimed to identify chemical modifications in the samples’ molecular structures resulting from UV-C irradiation [21].

3. Results

3.1. Cryogenic-Temperature Tests

Low-temperature testing (Figure 1) shows increased storage modulus versus 25 °C, consistent with high temperature trends. However, as shown in Table 1, this increase lessens with more nanosilica: 39.2% for neat resin vs. 32.4% for 10 wt% nanosilica composites.
Figure 1 also shows β-relaxation (−80 °C to −70 °C), a minor relaxation from localized short molecular segment movement, secondary to the α-relaxation (glass transition at +25 °C to +150 °C) [37]. The β-relaxation’s origin is debated but linked to the amorphous phase [22]. Higher nanosilica shifts this relaxation to lower temperatures, with specific temperatures and standard deviations in Table 1.

3.2. Comparative Analysis of Temperature-Dependent Behavior in UVC-Irradiated and Non-Irradiated Samples

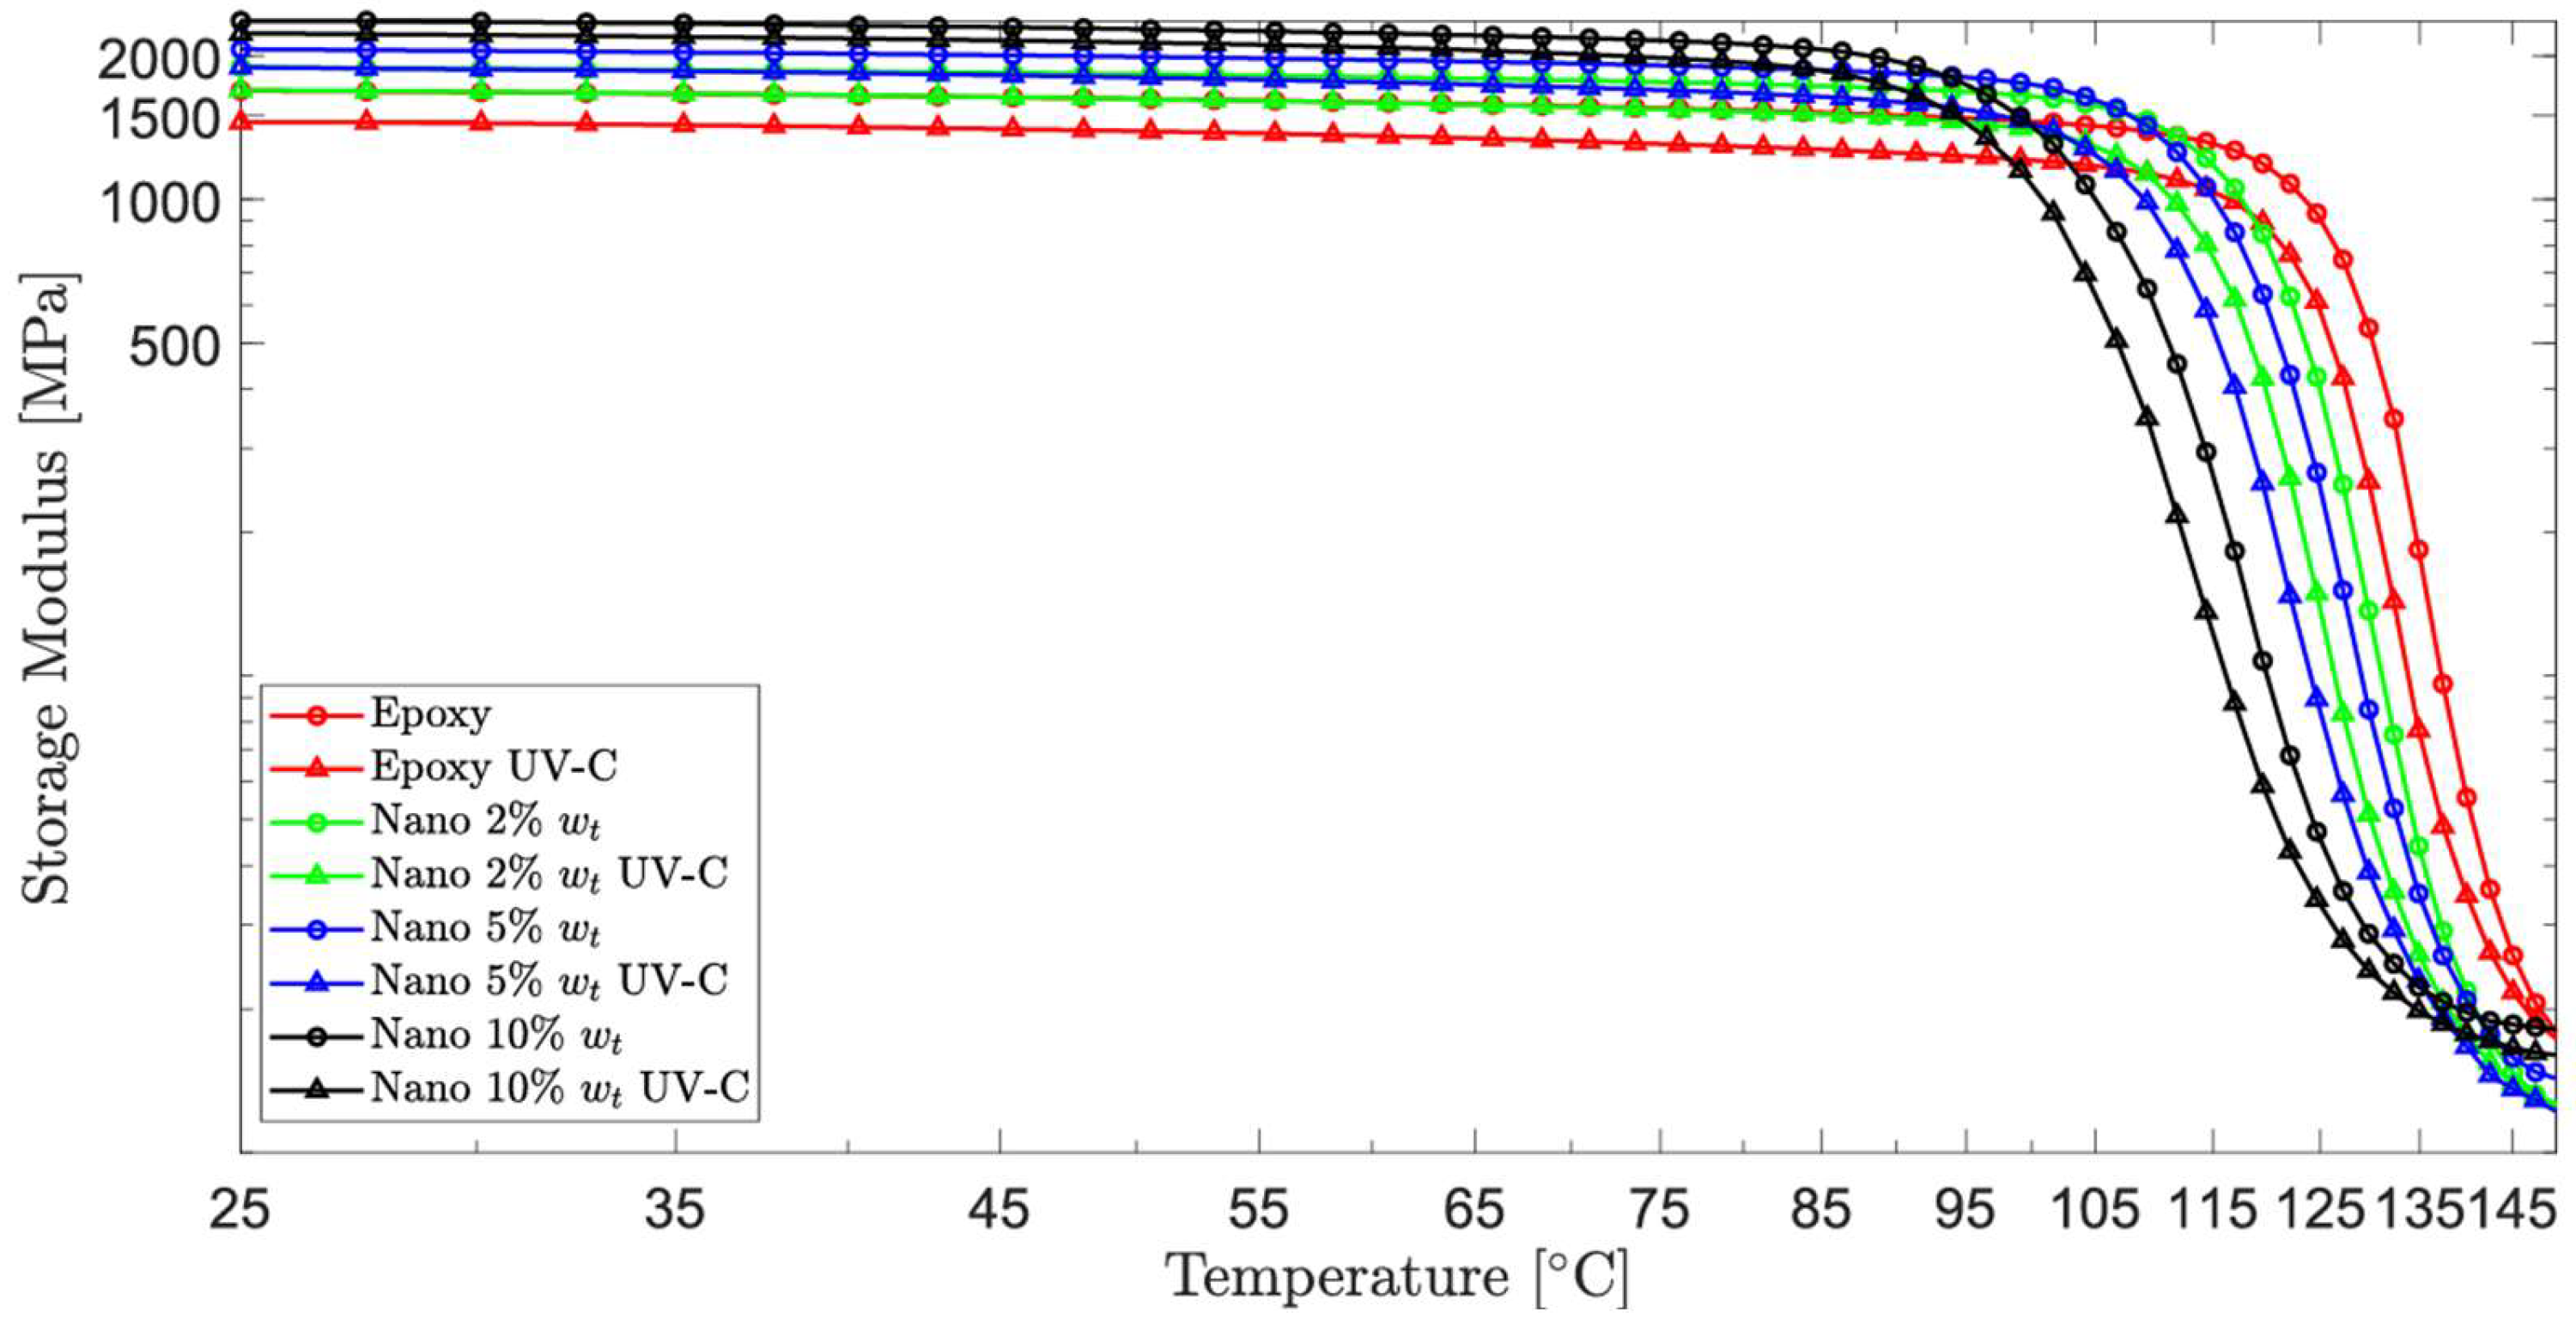
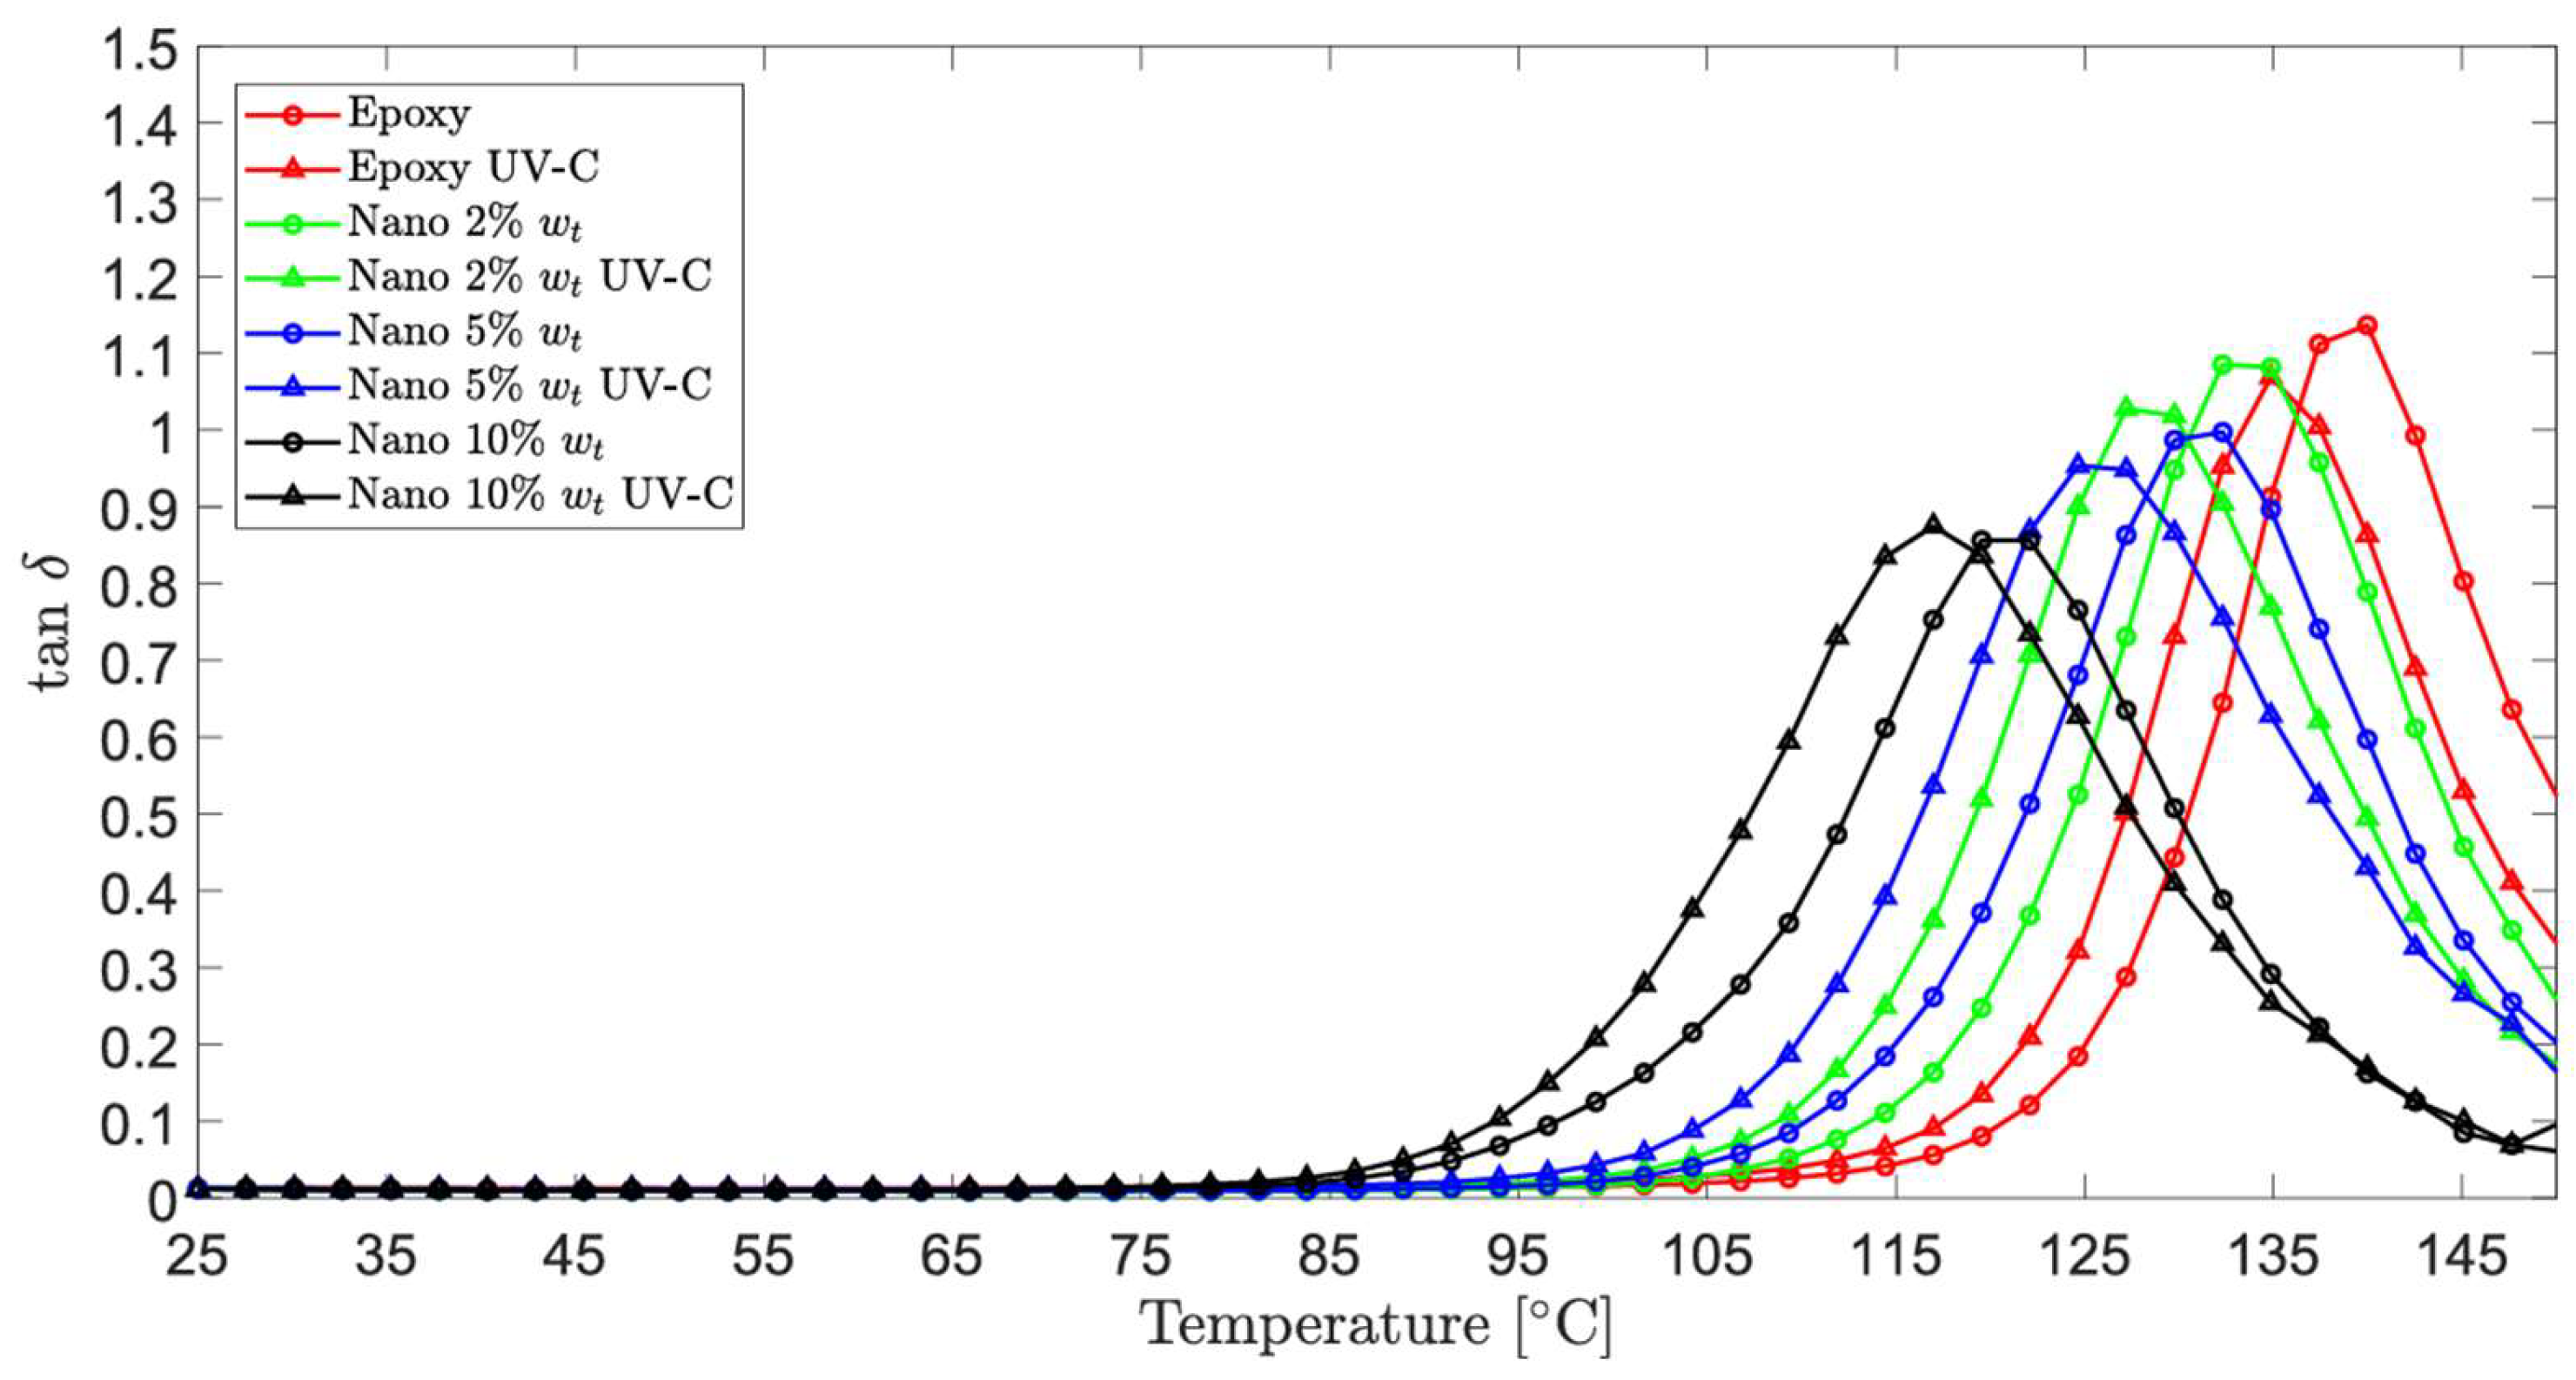
Figure 2 and Figure 3 present the average storage modulus E′ and tanδ responses for neat epoxy and composites with 2%, 5%, and 10% nanosilica, comparing unexposed and UV-C-exposed conditions. At lower temperatures (approximately 25–80 °C), all samples exhibit a relatively high and stable storage modulus (E′), characteristic of a rigid, glassy behavior. In this region, increasing the nanosilica content leads to a higher E′, indicating enhanced stiffness due to the reinforcing effect of the nanoparticles. Between 100 °C and 120 °C, a pronounced drop in storage modulus is observed across all formulations, corresponding to the glass transition region of the epoxy matrix, where the material transitions from a glassy to a rubbery state. Beyond Tg, E′ continues to decline with temperature, though at a reduced rate, reflecting the increasing softness and flexibility of the material in the rubbery phase.
Notably, the temperature at which the sharp decline in E′ begins shifts toward lower values as the nanosilica content increases, suggesting a reduction in Tg. This indicates that the addition of nanosilica, while improving stiffness in the glassy state, slightly compromises thermal stability.
It should also be noted that analysis of the second modulus plateau is constrained by the tested temperature range: at 150 °C, a fully developed stabilization region has not yet been reached, making any conclusions regarding post-transition behavior premature.
The tanδ peak corresponds to the glass transition temperature (Tg) and the material’s damping capacity. A tanδ > 1 indicates a dominant viscous component and high energy dissipation. Increased nanosilica content (Figure 3) progressively reduces peak height, diminishing damping. Samples with 2% and 5% nanosilica have tanδ > 1, while with 10% it is <1, indicating a dominant elastic response and less dissipation. Increased nanosilica also lowers Tg, consistent with storage modulus data. The analysis is limited to 25–150 °C, so damping behavior beyond this range is speculative. Table 2 details glass transition temperatures (Tonset from storage modulus, Tpeak from tanδ) and damping factors for unexposed samples. Tonset progressively decreases with more nanosilica, indicating reduced thermal stability (8%, 11%, and 22% lower for 2%, 5%, and 10% nanosilica, respectively, compared to neat epoxy). This confirms that while nanosilica increases stiffness, it lowers the glass transition region.
The glass transition temperature (Tg), considered as Tpeak (Table 2), consistently decreases with increasing nanosilica content (by 4%, 5%, and 13% for 2%, 5%, and 10% loadings). This reduction, observed in both Tonset and Tpeak, is attributed to a lower cross-linking density [38] and increased free volume [39]. The presence of nanosilica nanoparticles hinders the epoxy network formation during curing and weakens intermolecular forces, both contributing to a lower Tg. The increased free volume, introduced by the presence of rigid nanosilica particles, allows greater segmental motion of the polymer chains and facilitates thermal transitions at lower temperatures, thus lowering the glass transition temperature [39]. In addition, nanosilica can interfere with the crosslinking reaction during curing, particularly if surface-modified, leading to a reduction in the network density and further enhancing molecular mobility [40]. Furthermore, nanosilica acts as a plasticizer, shifting the tanδ peak to lower temperatures [41]. Density also increases with higher nanosilica concentrations (10 wt% > 5 wt% > 2 wt% > 0 wt%) due to the expanding interfacial area and interphase volume fraction [42]. In parallel, the storage modulus (E′) (Figure 2, Table 2) shows improvements with increasing nanosilica (12%, 22%, and 40% gains), resulting from enhanced load transfer and stress distribution at the filler–matrix interface [43,44]. Conversely, the damping factor decreases with higher nanosilica content (4%, 12%, and 24% reduction), indicating reduced energy dissipation and molecular mobility during the glass transition [44], which is also reflected in the decreasing tanδ peak height, signifying restricted segmental motion [45].
Although the mechanisms leading to reduced Tg and those responsible for reduced damping, may appear contradictory, they arise from distinct yet interrelated phenomena occurring at different structural levels within the nanocomposite material. The decrease in Tg reflects bulk material behavior and is influenced by global changes in the network structure, such as increased free volume and lower crosslink density. In contrast, the decrease in damping is predominantly governed by localized effects near the nanoparticle surface, where the polymer experiences restricted motion due to interfacial bonding and confinement. The overall effect depends strongly on the dispersion of the nanosilica and the quality of the filler–matrix interface [11]. Well-dispersed nanosilica with strong interfacial adhesion can simultaneously decrease Tg through network plasticization and reduce damping by limiting molecular mobility near the particle surface [11].
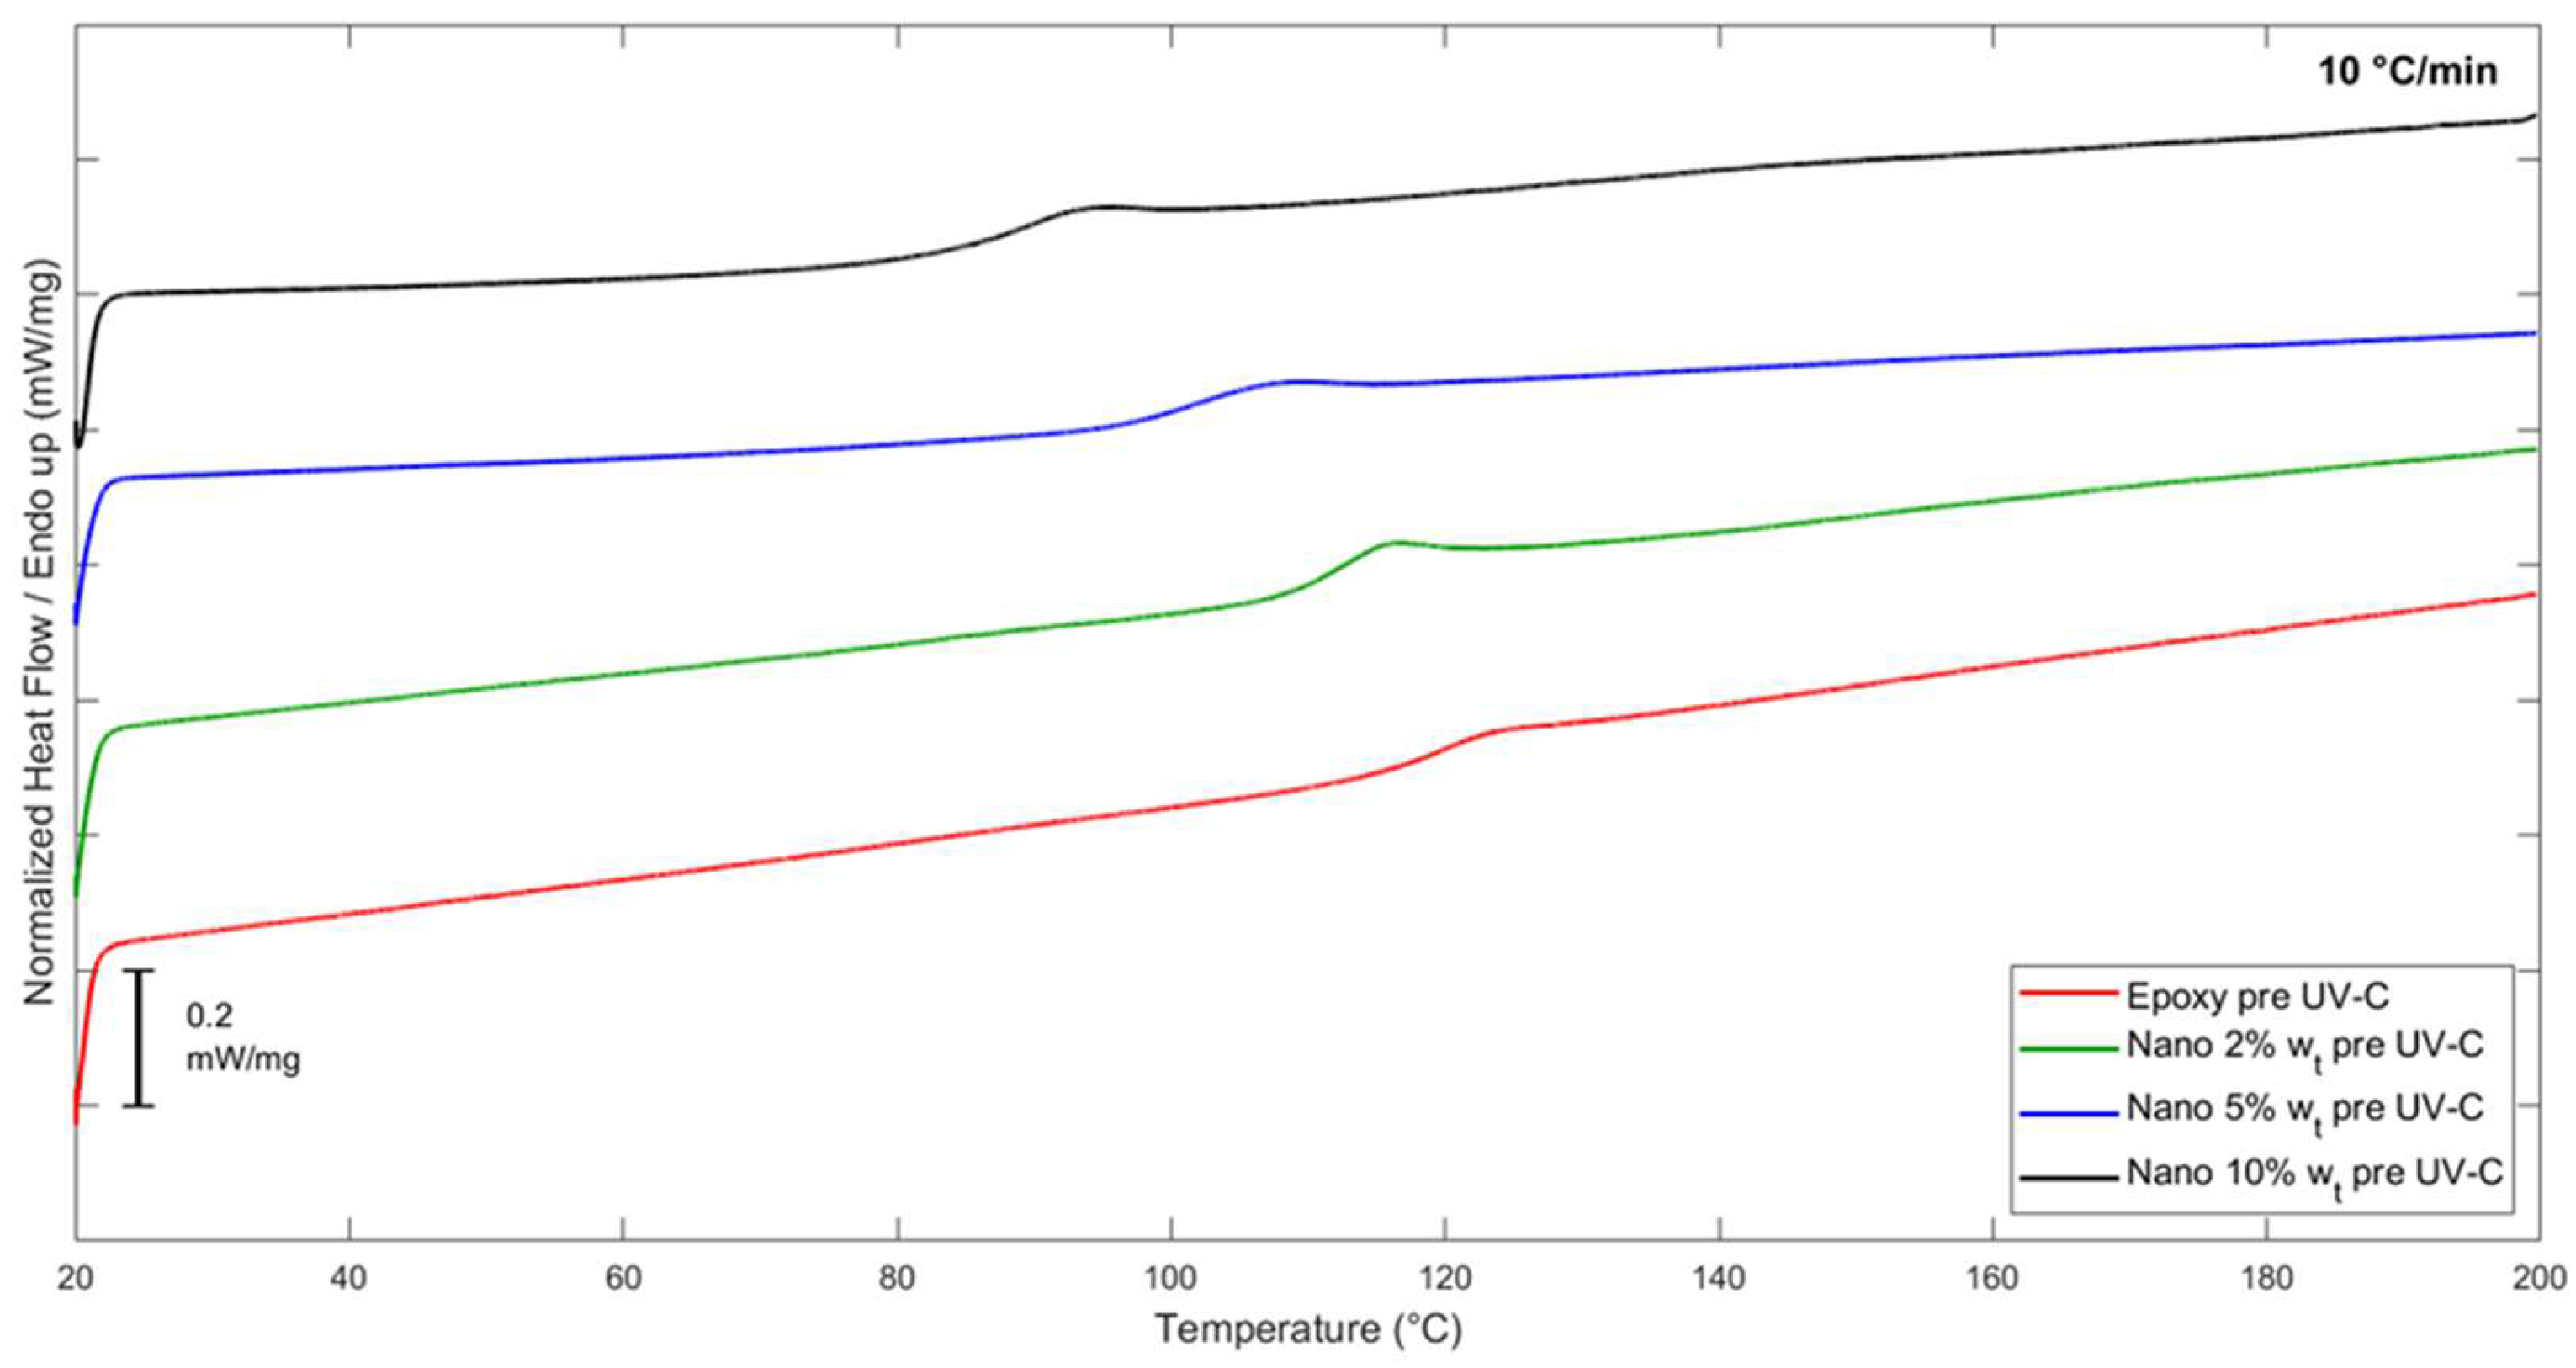
DSC analysis was conducted to evaluate the thermal behavior of the material before UV-C exposure (Figure 4).
DSC analysis shows that the glass transition temperature (Tg) closely matches the values obtained from DMA temperature sweeps (25–150 °C, Tonset). A progressive decrease in Tg with increasing nanosilica content is observed: neat epoxy prior to UV-C exposure exhibits a Tg of 120.45 ± 0.69 °C, while epoxy with 2 wt% nanofiller shows 111.94 ± 1.10 °C. For 5 wt% and 10 wt% nanosilica, Tg further decreases to 105.79 ± 1.25 °C and 95.43 ± 0.23 °C, respectively. Although rigid fillers are generally expected to constrain chain mobility and raise Tg, the opposite trend suggests that nanosilica alters the epoxy network in ways that increase segmental mobility. Likely mechanisms include a local reduction in effective crosslink density due to particle–matrix interactions, the formation of less constrained interphase regions, or enhanced free volume associated with particle agglomeration. The absence of residual cure within the DSC scanning range confirms that the systems were fully cured before testing, indicating that the observed Tg depression is an intrinsic effect of nanosilica incorporation rather than incomplete curing.
Exposure to UV-C radiation simulating one year in LEO caused a notable decrease in storage modulus across all samples. Neat epoxy experienced a 14% reduction, while composites with 2 wt%, 5 wt%, and 10 wt% nanosilica showed progressively smaller reductions (11%, 8%, and 6%) (Table 3), demonstrating nanosilica’s protective effect against UV-induced mechanical degradation, with the 10 wt% sample showing the highest resistance. Post-irradiation, both Tg values (Tonset and Tpeak) decreased (Table 3), likely due to chain scission in the epoxy matrix, reducing cross-link density [46,47]. Neat resin and the 10 wt% nanosilica composite exhibited a 2–3% Tg reduction, whereas the 2 wt% and 5 wt% composites showed a slightly larger 4% decrease. A concurrent decline in the damping factor further suggests matrix degradation resulting from UV-C exposure.
UV-C exposure reduces the damping factor in all samples (Table 3), signifying less energy dissipation. The reduction is inversely proportional to nanosilica content: highest in neat epoxy (7%) and lowest in 10 wt% nanosilica (1%). This highlights nanosilica’s protective role against UV-C degradation, helping maintain damping and improving durability in UV-exposed conditions.
The mechanical response of nanosilica–epoxy composites after UV-C irradiation was compared with literature reports on carbon fiber–reinforced composites (vCFs/rCFs) [21], MWCNT-reinforced glass fiber composites [19], and epoxy resins modified with octa-functional POSS [20]. A consistent trend across all systems, including nanosilica composites, is a reduction in storage modulus (E′) following UV-C exposure. For instance, in carbon fiber–reinforced composites, E′ decreased by 9.5% (vCF) and 10.8% (rCF) after irradiation [21]. In nanosilica–epoxy systems, however, the reinforcing role of nanosilica is evident: E′ increases with filler loading in the glassy region, and the relative reduction in E′ after UV-C exposure diminishes with increasing filler content (from 14% for neat epoxy to 6% for 10 wt% nanosilica). This protective effect parallels that of octa-POSS in reducing mass loss and erosion [20], and of MWCNTs in mitigating tensile strength degradation [19]. In contrast, marked discrepancies arise when examining the glass transition temperature (Tg). In nanosilica composites, both Tonset and Tpeak decrease after UV-C exposure, consistent with chain scission and reduced crosslink density. This trend differs from carbon fiber composites, where Tg increased post-irradiation due to additional curing and higher crosslink density [21], and from MWCNT-containing systems, which exhibited slight Tg improvements [19]. Furthermore, nanosilica lowered Tg even prior to irradiation—a behavior attributed to reduced crosslink density and increased free volume—whereas other nanofillers reported in the literature typically maintain or raise Tg by restricting chain mobility [19,20,21]. Finally, the observed reduction in damping factor in nanosilica composites after UV-C exposure, indicative of matrix degradation and diminished energy dissipation, contrasts with the increase reported for vCF/epoxy composites [21].
Together, these findings suggest that the interaction of nanosilica with the epoxy network is fundamentally distinct from other nanofillers, with UV-C exposure favoring chain scission rather than UV-induced crosslinking.

3.3. Frequency Response of Nanosilica–Epoxy Composites

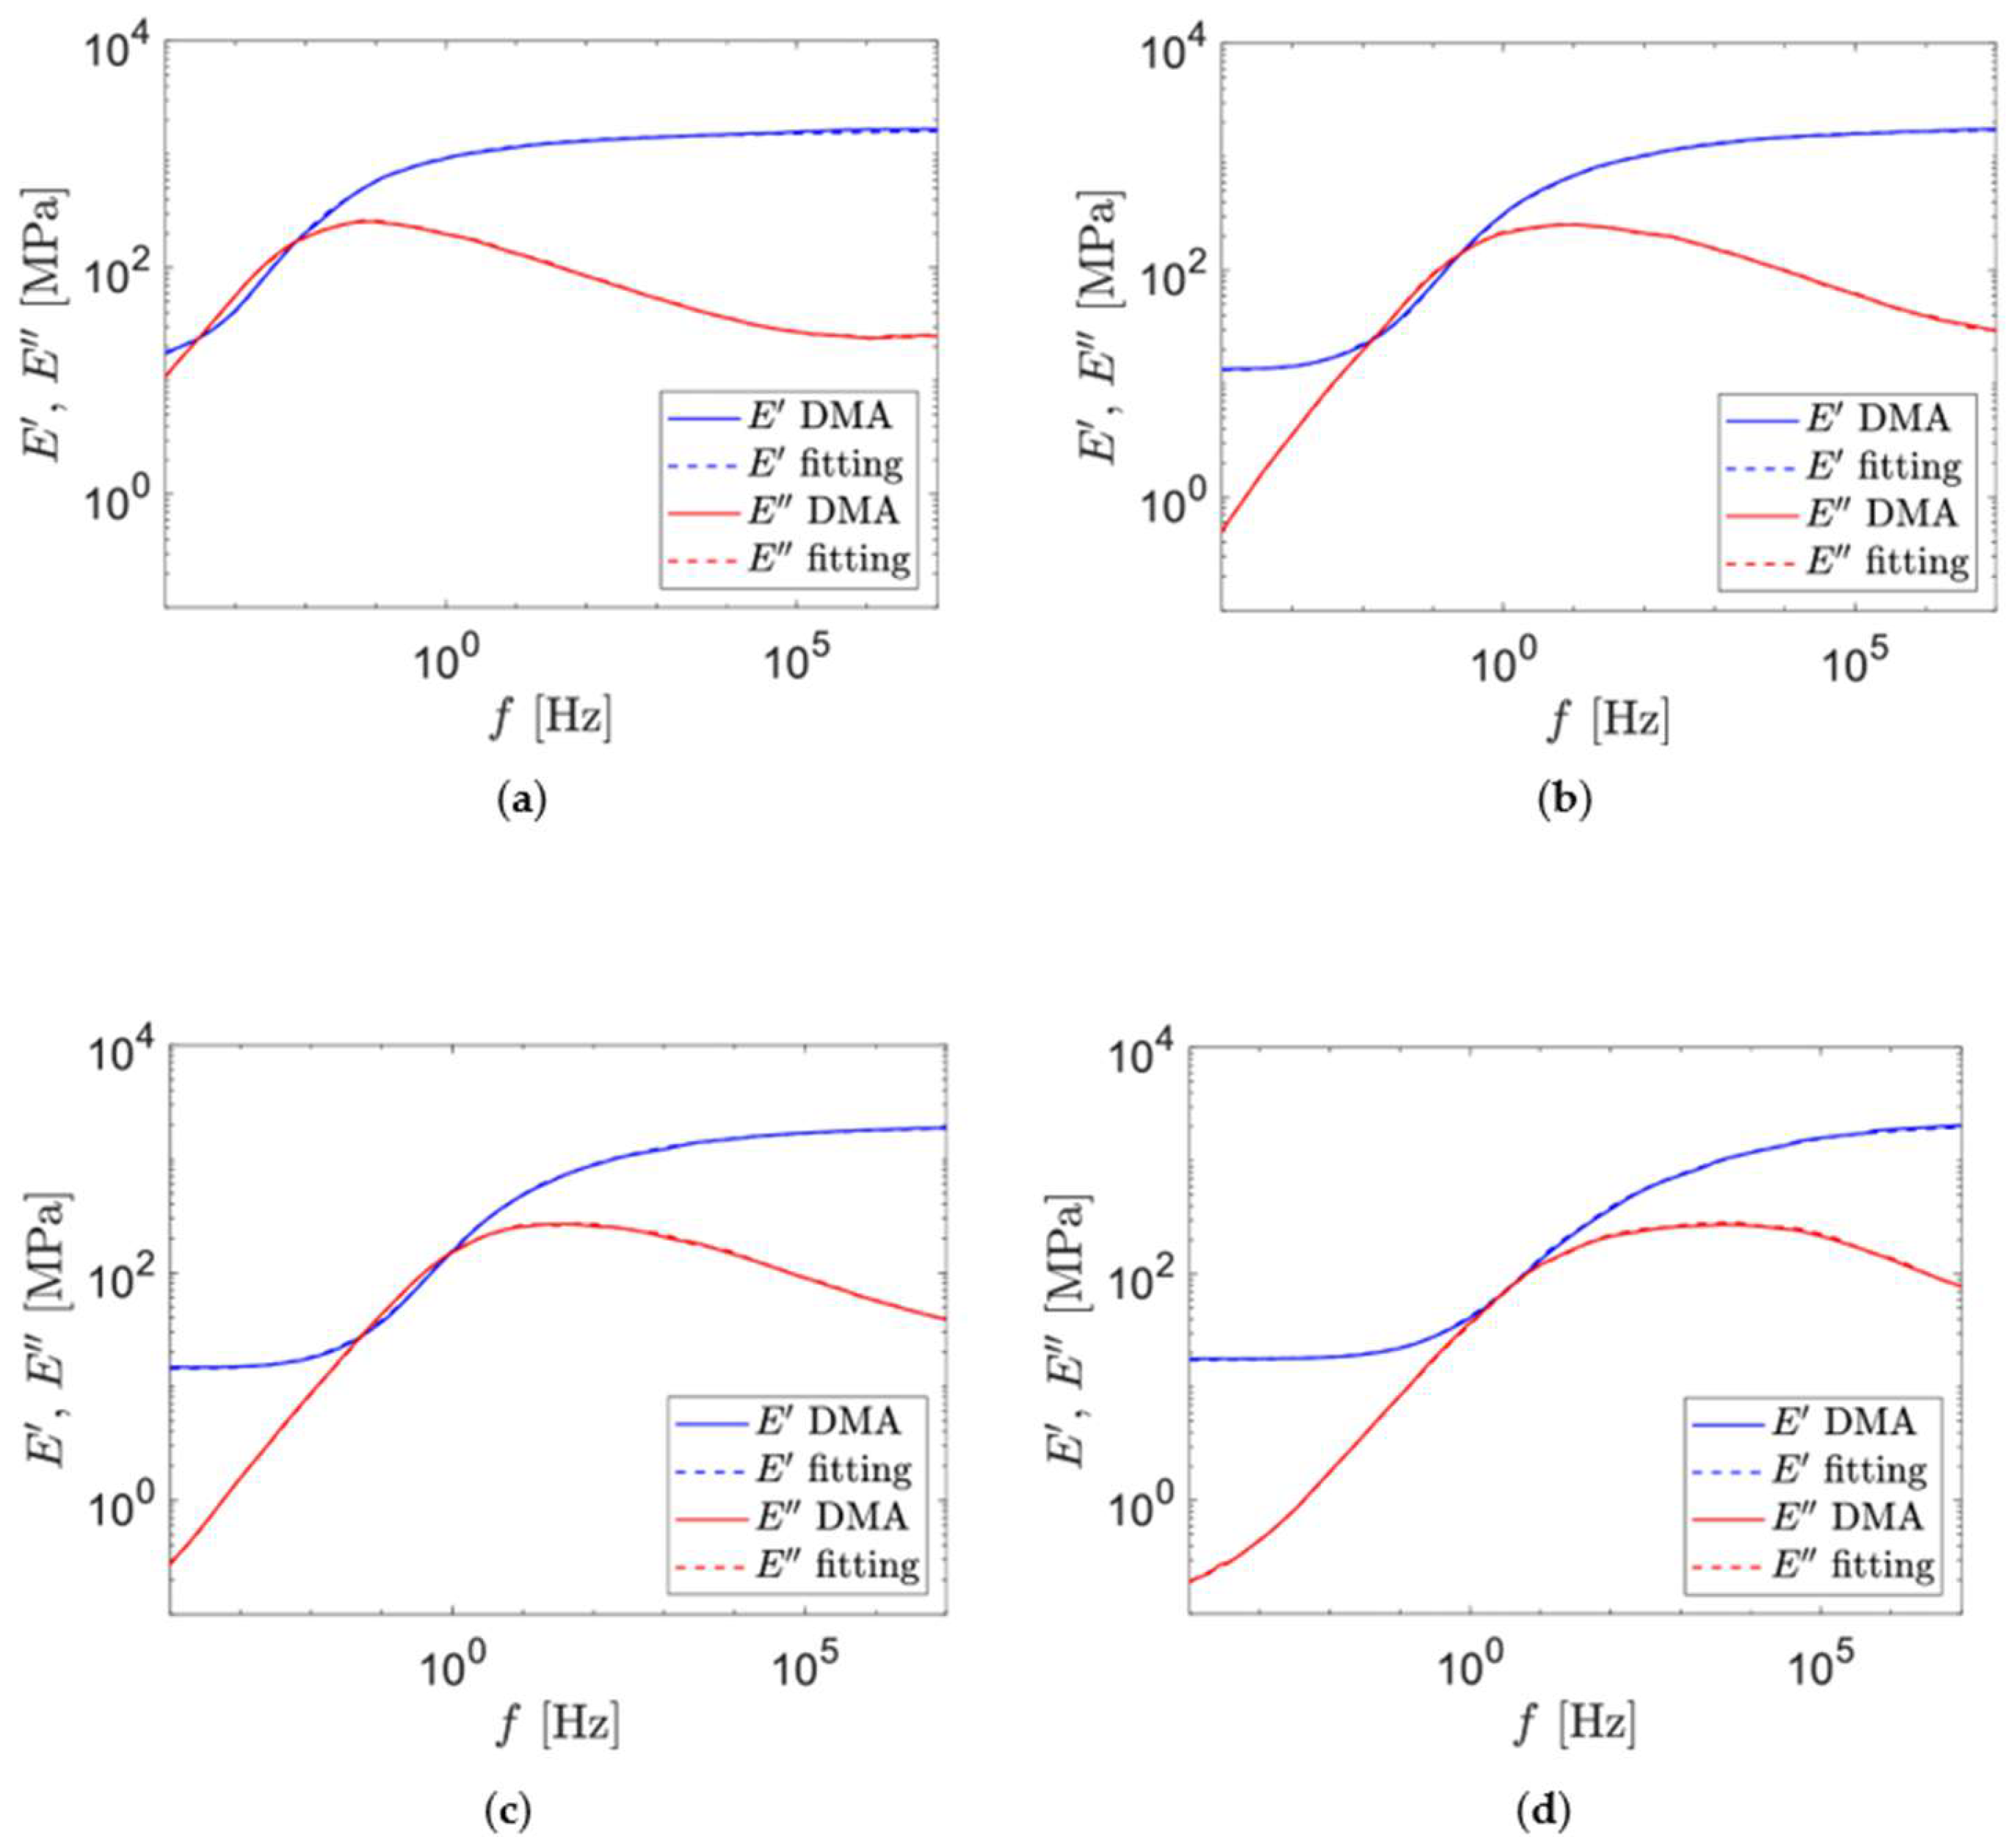
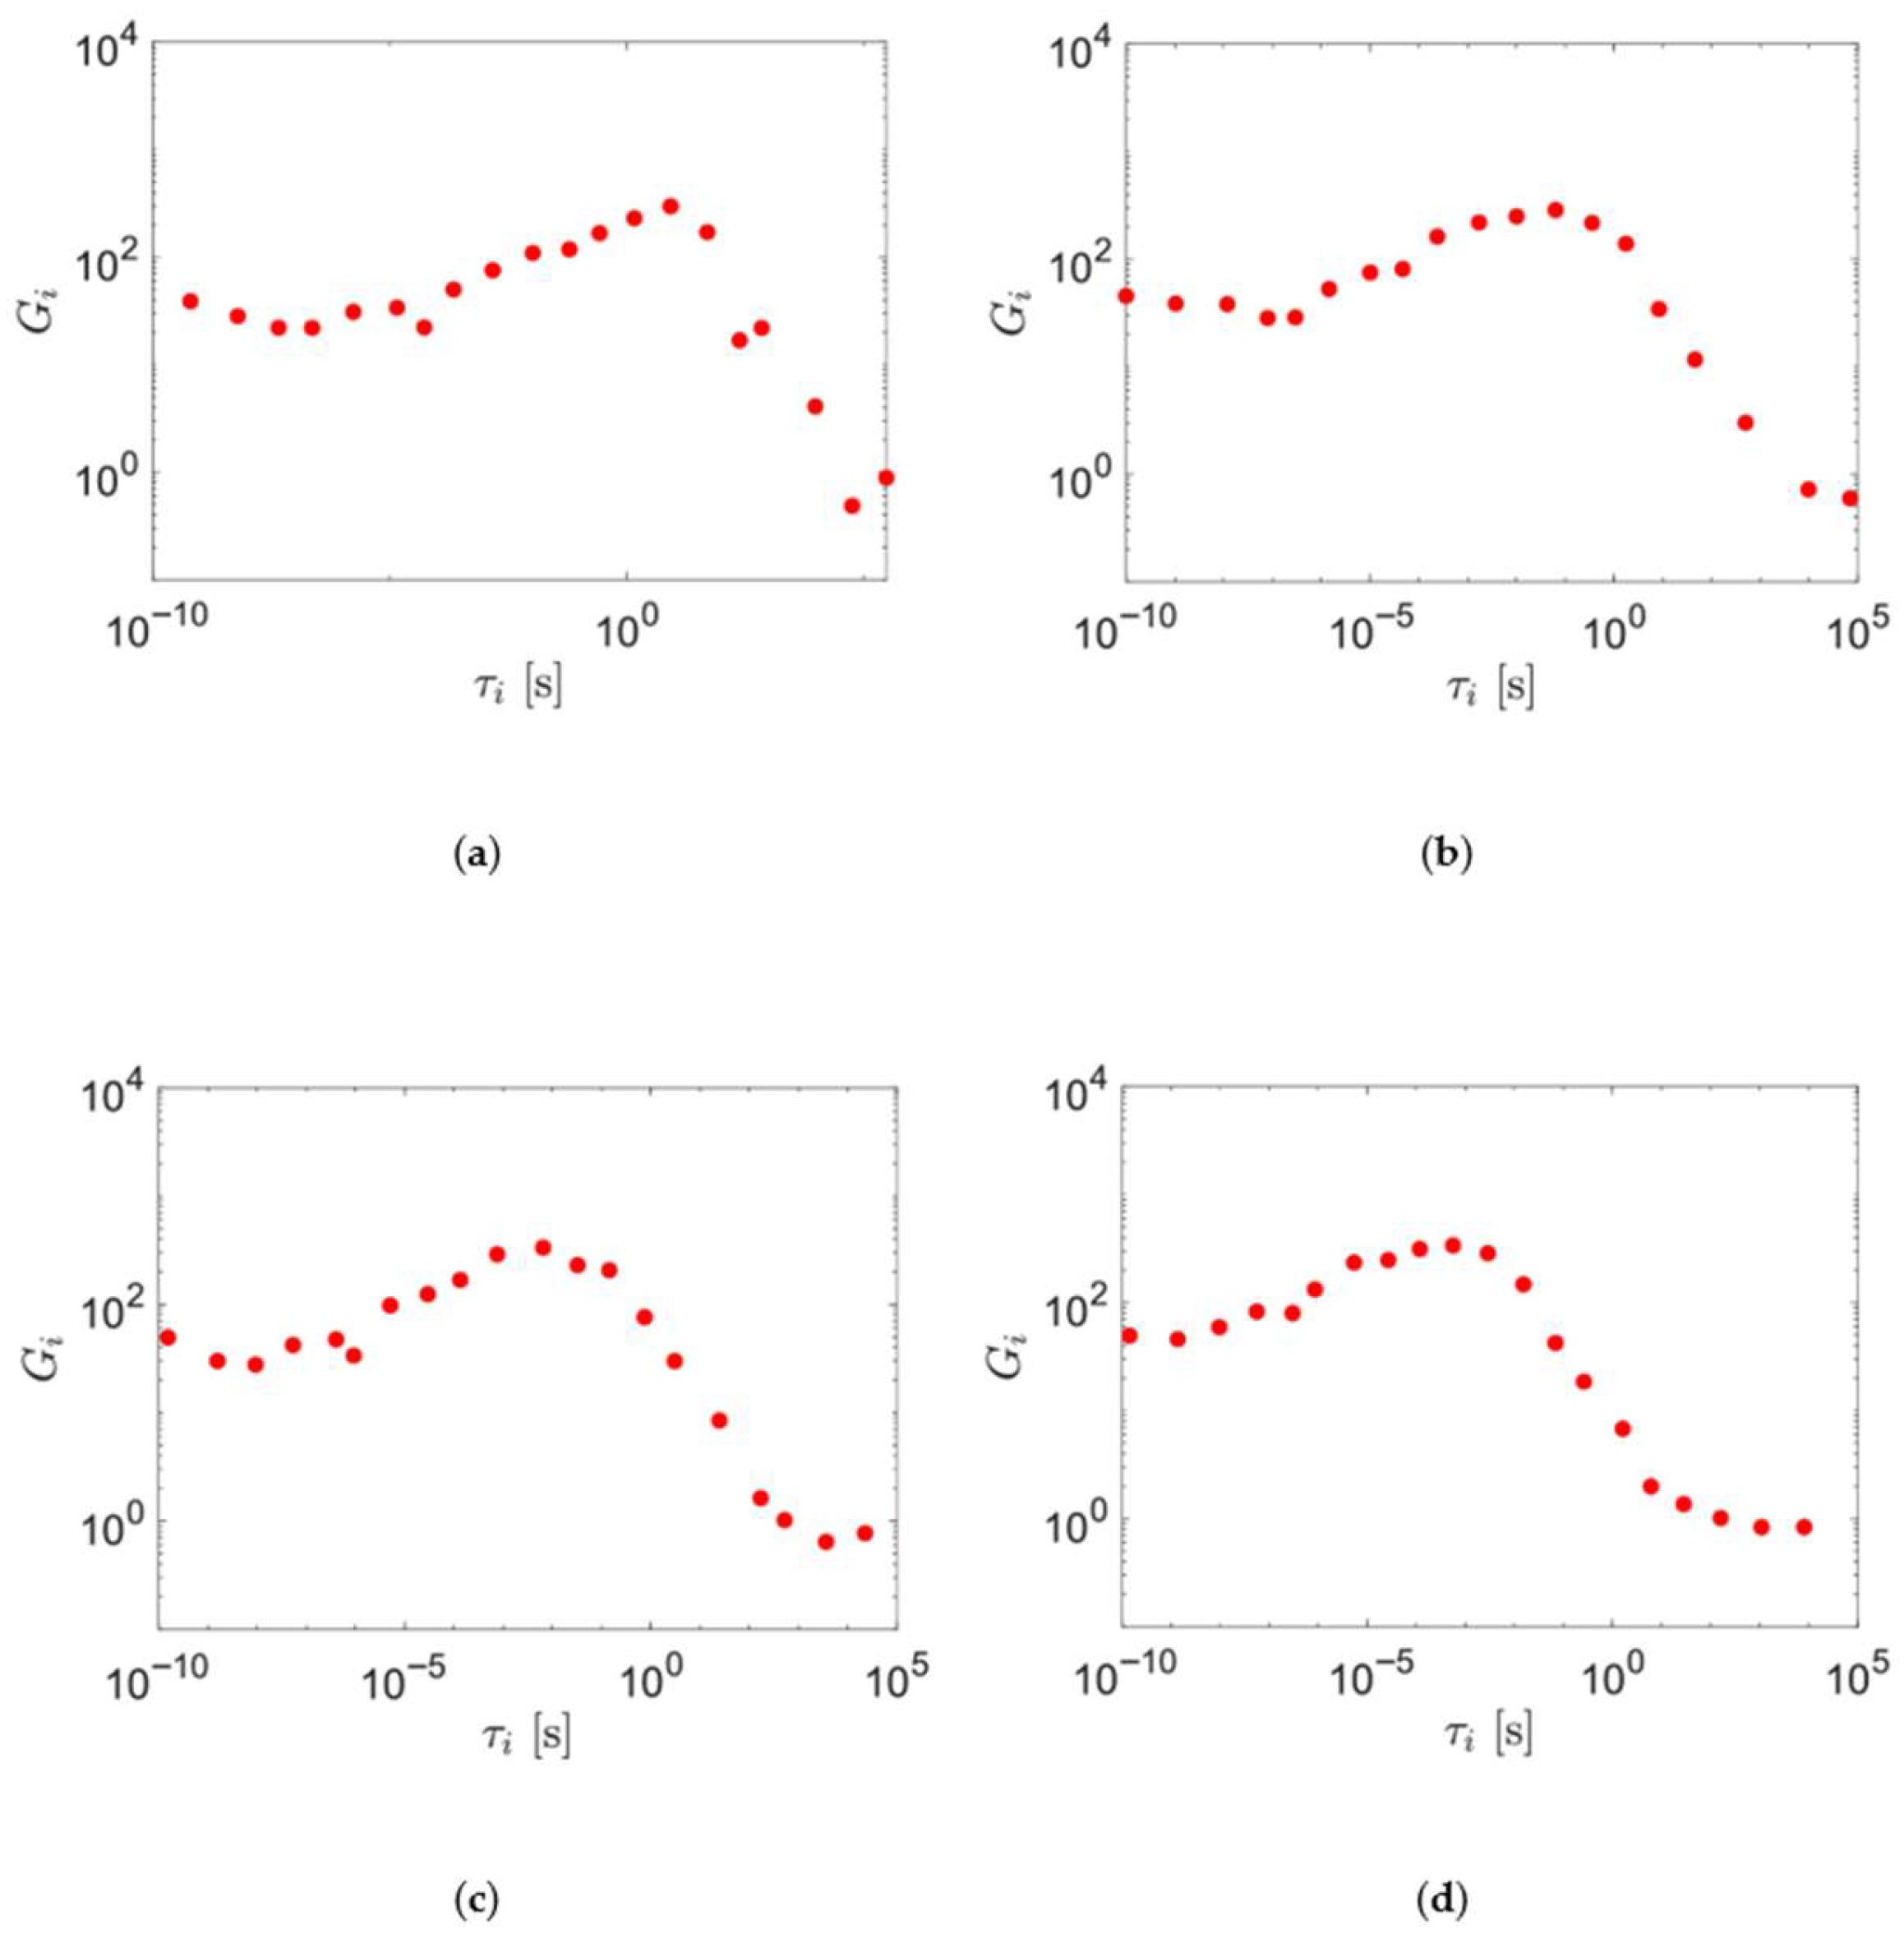
Master curves, derived from averaging three independent specimens, were established at a reference temperature (Tref) of 120 °C, mirroring thermal conditions encountered in Low Earth Orbit (LEO) where sun-exposed surfaces can reach this approximate temperature, despite significant fluctuations due to satellite orientation. Experimental fittings of these master curves for non-irradiated specimens are shown in Figure 5. Solid lines represent averaged storage (blue) and loss (red) moduli from triplicate samples, with dashed lines indicating their strong fitted correlations, a finding supported by Prony series coefficient analysis (Figure 6). At low frequencies (prolonged loading), the storage modulus remains low across samples, signifying increased material flexibility due to polymer chain relaxation. Conversely, in the high-frequency regime (rapid stress), the storage modulus approaches a higher plateau, indicating a rigid, glassy response with restricted molecular mobility. Notably, increasing nanosilica content elevates this high-frequency plateau, enhancing stiffness under rapid deformation. The transition region, characterized by a marked increase in storage modulus with frequency, reflects a shift from rubbery to glassy behavior. Higher nanosilica concentrations shift this transition to lower frequencies, implying that the nanofiller alters polymer chain relaxation dynamics, effectively slowing their response to applied stress. Consequently, the nanocomposite with 10 wt% nanosilica demonstrates a significantly enhanced ability to dissipate mechanical energy, as evidenced by the increased height of the loss modulus peak, indicating improved conversion of mechanical energy into thermal energy. Comparing this curve to lower filler content reveals that higher nanoparticle concentration increases the loss modulus magnitude and shifts its peak to lower frequencies. This shift suggests that nanoparticles restrict polymer chain mobility within the epoxy matrix, leading to greater energy dissipation and a delayed mechanical response, especially at low frequencies. The trend of higher Gi values at lower τi, consistently decreasing as τi increases for the resin, aligns with typical viscoelastic spectra [48].
UV-C irradiated samples underwent identical frequency domain testing at a reference temperature of 120 °C (relevant to LEO conditions). Figure 7 shows the experimental master curves and fittings for these samples, while Figure 8 presents the correlation between their Prony series coefficients (Gi and τi), providing insight into post-irradiation viscoelastic behavior. The frequency domain curves and Prony series correlations for irradiated samples show trends consistent with unexposed specimens. Once determined, Prony series coefficients allow modeling of the time-dependent relaxation modulus (Equation (2)), which reflects the material’s ability to dissipate stress over time, crucial for long-term applications.
Figure 9 presents the relaxation modulus of all materials, comparing UV-C exposed and unexposed samples to assess the effects of irradiation on viscoelastic behavior. At short times (10−9 to 10−6 s), all systems exhibit high relaxation modulus values, consistent with the 25–150 °C measurements and indicative of a rigid glassy state dominated by elastic response. The composite material containing 10 wt% nanosilica displays the highest initial stiffness. As relaxation time increases (10−6 to 100 s), the relaxation modulus decreases in all materials, reflecting the intrinsic viscoelastic response as molecular chains undergo stress relaxation. The rate of modulus decay is strongly dependent on filler content: higher nanosilica loadings correspond to faster relaxation, whereas neat epoxy retains its stiffness for longer. After one second, the relaxation modulus of neat epoxy decreases by 48%, compared with reductions of 86%, 94%, and 98% for the 2 wt%, 5 wt%, and 10 wt% nanocomposites, respectively. These results indicate that nanosilica accelerates relaxation processes, likely due to interfacial effects and altered chain mobility.
At longer timescales (100 to 104 seconds), the modulus continues to decline until the curves for the 2 wt%, 5 wt%, and 10 wt% nanocomposites flatten out, approaching the equilibrium. In contrast, the pure epoxy does not reach a second plateau even at 104 seconds. Nonetheless, among all nanocomposites, the 10 wt% sample (black curve) maintains the highest relaxation modulus at extended times.
These results indicate that, although higher nanosilica loadings accelerate the initial decline in relaxation modulus, both the instantaneous and long-term modulus values remain higher in composites with greater filler content. Moreover, increasing nanosilica content progressively reduces the sensitivity of the viscoelastic response to UV-C exposure.

3.4. Fourier-Transform Infrared Analysis

The FTIR spectra obtained for each sample will be presented and discussed in detail in the following section. The analysis of characteristic absorption peaks will provide crucial information on the chemical composition of the materials under investigation and on any structural modifications induced by the applied treatments.
For the neat epoxy sample, Table 4 lists the significant peaks at: 2924 cm−1, generally representative of the asymmetric stretching of CH2 groups [49,50]; 1728 cm−1, often associated with ester groups or other C=O-containing functional groups, which may be present in certain modified epoxy resins [50]; 1601 cm−1; 1508 cm−1 and 1491 cm−1; 1451 cm−1; 1235 cm−1, characteristic of epoxy groups [51]; 1158 cm−1 and 1112 cm−1; 1038 cm−1, specific to ethers and linked with the epoxy group [52]; 819 cm−1, typically observed in aromatic compounds [52]; and 750 cm−1, indicating the presence of aromatic rings [52].
The incorporation of nanosilica into the epoxy resin alters its absorption spectrum, resulting in the emergence of new peaks [52]. Specifically, the spectrum of an unirradiated epoxy sample with 2% nanosilica by weight was analyzed (Figure 10). Samples containing 2% nanosilica display new peaks (Table 5) that are absent in pure epoxy resin samples: 3024 cm−1 [52]; 2957 cm−1, typical of CH2 groups (methylene) [52]; 1375 cm−1, associated with methyl (CH3) groups in C-(CH3)2 structures [52]; 1100 cm−1, characteristic of siloxane linkages [53]; and 599 cm−1, typical of siloxane structures [54]. The spectra for unirradiated samples with 5% and 10% nanosilica were also examined and are consistent with those for 2% nanosilica.
The analysis has been applied also to the spectrum of the pure epoxy specimen after UV-C irradiation. The peak assignments are detailed in Table 6, consistent with those for the unirradiated samples. In contrast to the neat epoxy resin that has not been exposed to UV-C, the irradiated resin shows marked differences. The primary modification observed is the appearance of a new peak at 3505 cm−1, attributed to the O–H stretching vibration of carboxylic acids. This may result from oxidation processes triggered by UV-C radiation, especially in the presence of oxygen, leading to the formation of carboxylic groups (COOH) [47]. To quantify the correlation between the degree of oxidation and nanofiller content, the intensity of the 3505 cm−1 peak in the different UV-C irradiated formulations has been analyzed. The intensity of this peak is directly related to the degree of oxidation. The measured intensities were 0.0112 for neat epoxy, 0.0092 for epoxy with 2 wt% nanosilica, and 0.0050 and 0.0075 for the 5 wt% and 10 wt%, respectively. The progressive reduction in peak intensity with increasing nanofiller content indicates that nanosilica mitigates UV-C–induced oxidation, with the strongest effect observed at 5 wt%. The slight increase detected at 10 wt% may suggest a saturation threshold or non-linear behavior at higher loadings, which warrants further investigation. Oxidation in LEO can be significantly more pronounced than on Earth due to the high concentration of atomic oxygen at altitudes between 100 and 650 km [55]. At these heights, UV-C radiation can photo-dissociate molecular oxygen, producing atomic oxygen, which is highly reactive. This atomic oxygen tends to react readily with various materials, including metals, resulting in oxide formation. Such interactions can cause the formation of volatile compounds and lead to surface degradation, a phenomenon known as atomic oxygen erosion. This process results in mass loss and deterioration of the thermo-optical and mechanical properties of materials exposed to LEO.
Another observed change is the disappearance of the peak at 1235 cm−1. This could suggest that radiation induces additional cross-linking within the polymer, leading to a denser network structure. As polymer chains bond more tightly, unreacted curing agents within the epoxy resin become involved in the reaction, altering the conditions for these bond vibrations. This can shift the vibration frequency, either moving the peak to another position or reducing its visibility [47].
The absorbance spectra of irradiated samples containing nanosilica (epoxy with 2%, 5%, and 10% nanosilica by weight) were also analyzed using the same peak identification approach as for unexposed samples. As illustrated in Figure 10, the primary characteristic peaks showed no variation, suggesting that the functional groups were unaffected by UV-C exposure. This, on one hand, could suggest that, even with low levels of nanofiller, the material remains chemically stable following UV-C irradiation. However, on the other hand, the absence of detectable chemical changes via FTIR alone does not definitively confirm their absence, since certain chemical reactions involving functional groups might not be discernible using this technique [14].

4. Conclusions

Dynamic Mechanical Analysis (DMA) revealed that nanosilica significantly enhances the mechanical performance of epoxy resin, particularly under conditions simulating Low Earth Orbit. The storage modulus increased with nanosilica content, with the 10 wt% composite exhibiting the greatest stiffness, attributed to improved interfacial adhesion and stress transfer within the matrix. Increasing nanosilica content led to a reduction in the glass transition temperature (Tg) of the nanocomposites (as seen from DMA and DSC analysis), likely due to decreased cross-link density and network disruption. The filler also exhibited a plasticizing effect, contributing to lower Tg and reduced viscoelastic energy dissipation. The damping factor, which reflects the material’s ability to dissipate energy, decreased as the nanosilica content increased. This is indicative of a reduction in the polymer’s ability to undergo molecular movement, likely due to the restricted mobility of the polymer chains influenced by the presence of the nanosilica particles. Temperature evaluations from −100 °C to +25 °C showed that the storage modulus increased at low temperatures compared to +25 °C, although the increase was less pronounced with higher nanosilica concentrations. This suggests that the presence of nanosilica makes the material more resistant to temperature-induced changes in its mechanical properties. Additionally, the β-relaxation transition, linked to localized polymer chain movements, shifted to lower temperatures as the nanosilica content increased. UV-C exposure led to a general degradation of mechanical properties, including reductions in storage modulus, glass transition temperature, and damping factor. While the 10 wt% nanosilica composite showed greater resistance, samples with lower nanosilica content experienced more pronounced changes in relaxation behavior, highlighting the limited protective effect of nanosilica against UV-induced damage.
Analysis of the time-dependent relaxation modulus showed that the rate of relaxation increased with greater nanosilica content. However, the composite material with 10 wt% nanosilica exhibited the highest relaxation modulus over extended periods. Exposure to UV-C radiation further accelerated this relaxation process across all samples. However, this acceleration was less pronounced in the 10 wt% nanosilica composites, which retained a comparatively higher relaxation modulus than the others.
In summary, the DMA findings highlight the substantial impact of nanosilica on the mechanical characteristics of epoxy resins, leading to improvements in stiffness, energy dissipation, and thermal stability. Nevertheless, while nanosilica enhances the initial mechanical performance of these composites, its effectiveness in reducing long-term degradation, particularly under UV-C exposure, is limited, with higher concentrations providing only partial protection. Further refinement of the nanosilica loading could prove advantageous in developing more durable materials for use in space environments. FTIR analysis revealed substantial chemical alterations in samples after UV-C exposure. Specifically, pure epoxy exhibited a new peak, indicating carboxylic acid formation due to oxidation, likely exacerbated in LEO by atomic oxygen. Simultaneously, the disappearance of another peak suggested radiation-induced cross-linking and a denser network. In contrast, epoxy samples containing 2%, 5%, and 10% nanosilica showed no significant changes in their main FTIR peaks following UV-C exposure. This implies that even small amounts of nanosilica can provide chemical stability against UV-C degradation. However, it is important to note that the absence of detectable FTIR changes does not entirely exclude the possibility of other, less apparent chemical alterations occurring within the material.
Based on the results, the optimal nanosilica content should be selected according to the expected operating temperature range, in order to maximize stiffness and UV-C resistance without approaching the glass transition temperature. Thus, nanosilica loading may be increased up to the limit imposed by the service temperature, ensuring the best combination of mechanical performance and UV-C resistance without compromising thermal stability associated with glass transition behavior.
The primary objective of this study was to demonstrate the effectiveness of nanosilica incorporation in enhancing the resistance of epoxy composites to UV-C radiation under simulated space conditions. This specific focus was chosen to maintain clarity and depth in addressing the targeted issue. Nevertheless, we acknowledge the importance of a more comprehensive assessment of low Earth orbit (LEO) conditions, including atomic oxygen erosion and thermal cycling. These additional factors are critical, and their exclusion may lead to an overestimation of the isolated protective role of nanosilica in a broader space environment context.

Author Contributions

Conceptualization, E.P.M. and S.L.; methodology, S.L.; validation, E.P.M.; formal analysis, F.P.; investigation, E.P.M. and F.P.; data curation, F.P.; writing—original draft preparation, E.P.M.; writing—review and editing, F.P. and S.L.; supervision, S.L.; project administration, S.L.; funding acquisition, S.L. All authors have read and agreed to the published version of the manuscript.

Funding

This research was funded by Sapienza University of Rome, grant number RG1221816C43DA9B.

Data Availability Statement

Data will be made available on request.

Acknowledgments

E. Proietti Mancini is grateful to the Rome Technopole for the support in the framework of the Project ECS 0000024 Rome Technopole—CUP B83C22002820006, NRP Mission 4 Component 2 Investment 1.5, Funded by the European Union—NextGenerationEU.

Conflicts of Interest

The authors declare that they have no known competing financial interests or personal relationships that could have appeared to influence the work reported in this paper.

Abbreviations

The following abbreviations are used in this manuscript:
DMADynamic Mechanical Analysis
DSCDifferential Scanning Calorimetry
FTIRFourier-Transform Infrared Spectroscopy
LEOLow Earth Orbit
PMCsPolymeric Matrix Composites
TgTemperature of glass transition
TTPSTime–Temperature Superposition Principle
UVUltraviolet

Appendix A

Another campaign of DMA measurements with a broader frequency range was conducted for a comprehensive DMA characterization and to enhance the reliability of TTSP extrapolation. The frequency range was extended to three decades (0.1–100 Hz), within the limitations of the specific instrument available in our laboratory (DMA-1, Mettler Toledo). Comparative analysis was conducted on the master curve built from isothermal segments ranging from 0.1 to 1 Hz, shown in Figure A1, and the new master curve using isothermal segments built on an extended range (0.1–100 Hz), shown in Figure A2. This analysis revealed that the viscoelastic behavior was consistent while extending the frequency range. This result strengthens our confidence in the applicability of the TTSP for the material under study and suggests that, even with a frequency range that is not extremely broad, our method is robust for evaluating the material’s time-dependent behavior.
Figure A1. Master curve constructed with a frequency range from 0.1 to 1 Hz.
Jcs 09 00529 g0a1
Figure A2. Master curve constructed with a frequency range from 0.1 to 100 Hz.
Jcs 09 00529 g0a2

References

  1. Shimamura, H.; Miyazaki, E. Investigations into Synergistic Effects of Atomic Oxygen and Vacuum Ultraviolet. J. Spacecr. Rocket. 2009, 46, 241–247. [Google Scholar] [CrossRef]
  2. Lu, T.; Solis-Ramos, E.; Yi, Y.; Kumosa, M. UV degradation model for polymers and polymer matrix composites. Polym. Degrad. Stab. 2018, 154, 203–210. [Google Scholar] [CrossRef]
  3. Yagnamurthy, S.; Chen, Q.; Chen, C.; Chasiotis, I. Erosion yield of epoxy–silica nanocomposites at the lower earth orbit environment of the International Space Station. J. Compos. Mater. 2012, 47, 107–117. [Google Scholar] [CrossRef]
  4. Gordo, P.; Frederico, T.; Melicio, R.; Duzellier, S.; Amorim, A. System for space materials evaluation in LEO environment. Adv. Space Res. 2020, 66, 307–320. [Google Scholar] [CrossRef]
  5. Zhang, B.; Clausi, M.; Heck, B.; Laurenzi, S.; Santonicola, M.G.; Kleperis, J.; Antuzevics, A.; Reiter, G.; Aleshin, A.N.; Lobach, A.S. Changes in Surface Free Energy and Surface Conductivity of Carbon Nanotube/Polyimide Nanocomposite Films Induced by UV Irradiation. ACS Appl. Mater. Interfaces 2021, 13, 24218–24227. [Google Scholar] [CrossRef]
  6. Jang, J.-H.; Hong, S.-B.; Kim, J.-G.; Goo, N.-S.; Yu, W.-R. Accelerated Testing Method for Predicting Long-Term Properties of Carbon Fiber-Reinforced Shape Memory Polymer Composites in a Low Earth Orbit Environment. Polymers 2021, 13, 1628. [Google Scholar] [CrossRef] [PubMed]
  7. Grossman, E.; Gouzman, I. Space environment effects on polymers in low earth orbit. Nucl. Instrum. Methods Phys. Res. Sect. B Beam Interact. Mater. At. 2003, 208, 48–57. [Google Scholar] [CrossRef]
  8. Toto, E.; Laurenzi, S.; Paris, C.; Santonicola, M.G. Combined Effects of Solar Radiation and High Vacuum on the Properties of Graphene/Polysiloxane Nanocomposites in Simulated Space Environment. J. Compos. Sci. 2023, 7, 215. [Google Scholar] [CrossRef]
  9. Jin, S.B.; Son, G.S.; Kim, Y.H.; Kim, C.G. Enhanced durability of silanized multi-walled carbon nanotube/epoxy nanocomposites under simulated LEO space environment. Compos. Sci. Technol. 2013, 87, 224–231. [Google Scholar] [CrossRef]
  10. De Groh, K.K.; Banks, B.A. Atomic Oxygen Erosion Data from the MISSE 2–8 Missions. NASA Technical Memorandum, 2019. Available online: https://ntrs.nasa.gov/citations/20190025445 (accessed on 13 September 2024).
  11. Chen, C.; Justice, R.S.; Schaefer, D.W.; Baur, J.W. Highly dispersed nanosilica–epoxy resins with enhanced mechanical properties. Polymer 2008, 49, 3805–3815. [Google Scholar] [CrossRef]
  12. Sprenger, S. Nanosilica-Toughened Epoxy Resins. Polymers 2020, 12, 1777. [Google Scholar] [CrossRef]
  13. Ranjbar, Z.; Ashhari, S.; Jannesari, A.; Montazeri, S. Effects of nanosilica on the Anticorrosive properties of epoxy coatings. Prog. Color Color. Coat. 2013, 6, 119–128. [Google Scholar] [CrossRef]
  14. Prabhakaran, R. Nano composites for Space Applications. J. Aerosp. Sci. Technol. 2015, 67, 1–17. [Google Scholar]
  15. Lee, D.W.; Yoo, B.R. Advanced silica/polymer composites: Materials and applications. J. Ind. Eng. Chem. 2016, 38, 1–12. [Google Scholar] [CrossRef]
  16. Guo, Q.; Zhu, P.; Li, G.; Wen, J.; Wang, T.; Lu, D.; Sun, R.; Wong, C. Study on the effects of interfacial interaction on the rheological and thermal performance of silica nanoparticles reinforced epoxy nanocomposites. Compos. Part B: Eng. 2017, 116, 388–397. [Google Scholar] [CrossRef]
  17. Allahverdi, A.; Ehsani, M.; Janpour, H.; Ahmadi, S. The effect of nanosilica on mechanical, thermal and morphological properties of epoxy coating. Prog. Org. Coat. 2012, 75, 543–548. [Google Scholar] [CrossRef]
  18. Sprenger, S. Epoxy resin composites with surface-modified silicon dioxide nanoparticles: A review. J. Appl. Polym. Sci. 2013, 130, 1421–1428. [Google Scholar] [CrossRef]
  19. Chennareddy, R.; Tuwair, H.; Kandil, U.F.; ElGawady, M.; Reda Taha, M.M. UV-resistant GFRP composite using carbon nanotubes. Constr. Build. Mater. 2019, 220, 679–689. [Google Scholar] [CrossRef]
  20. Suliga, A.; Jakubczyk, E.M.; Hamerton, I.; Viquerat, A. Analysis of atomic oxygen and ultraviolet exposure effects on cycloaliphatic epoxy resins reinforced with octa-functional POSS. Acta Astronaut. 2018, 142, 103–111. [Google Scholar] [CrossRef]
  21. Tortorici, D.; Toto, E.; Santonicola, M.G.; Laurenzi, S. Effects of UV C exposure on composite materials made of recycled carbon fibers. Acta Astronaut. 2024, 220, 367–373. [Google Scholar] [CrossRef]
  22. Khanna, Y.P.; Turi, E.A.; Taylor, T.J.; Vickroy, V.V.; Abbott, R.F. Dynamic mechanical relaxations in polyethylene. Macromolecules 1985, 18, 1302–1309. [Google Scholar] [CrossRef]
  23. Wolfrum, J.; Eibl, S.; Lietch, L. Rapid evaluation of long-term thermal degradation of carbon fiber epoxy composites. Compos. Sci. Technol. 2009, 69, 523–530. [Google Scholar] [CrossRef]
  24. CYCOM® 823 RTM Resin System. Technical Data Sheet; Solvay: Brussels, Belgium, 2016. [Google Scholar]
  25. THINKY CORPORATION. Planetary Centrifugal Mixer THINKY MIXER ARE-250 Instruction Manual; THINKY CORPORATION: Tokyo, Japan, 2022. [Google Scholar]
  26. Kemnitz, R.A.; Cobb, G.R.; Singh, A.K.; Hartsfield, C.R. Characterization of simulated LEO space environment effects on acid-spun carbon nanotube yarns. Mater. Des. 2019, 184, 108178. [Google Scholar] [CrossRef]
  27. Anderson, J.B.; Smith, R.E. Natural Orbit Environment Guidelines for Use in Aerospace Vehicle Development; NASA Technical Memorandum 4527; NASA: Huntsville, AL, USA, 1994.
  28. Determination of the Linear Viscoelastic Region of a Polymer Using a Strain Sweep on the DMA 2980. Available online: https://www.tainstruments.com/pdf/literature/TS61.pdf (accessed on 2 March 2025).
  29. Ljubić, D.; Stamenović, M.; Smithson, C.; Nujkić, M.; Međo, B.; Putić, S. Time: Temperature superposition principle: Application of WLF equation in polymer analysis and composites. Zaštita Mater. 2014, 55, 395–400. [Google Scholar]
  30. Zarrelli, M.; Skordos, A.A.; Partridge, I.K. Thermomechanical analysis of a toughened thermosetting system. Mech. Compos. Mater. 2008, 44, 181–190. [Google Scholar] [CrossRef]
  31. Lange, J.; Manson, J.A.E.; Hult, A. Build-up of structure and viscoelastic properties in epoxy and acrylate resins cured below their ultimate glass transition temperature. Polymer 1996, 37, 5859–5868. [Google Scholar] [CrossRef]
  32. Muller-Pabel, M.; Agudo, J.A.R.; Gude, M. Measuring and understanding cure-dependent viscoelastic properties of epoxy resin: A review. Polym. Test. 2022, 114, 107701. [Google Scholar] [CrossRef]
  33. Woo, E.; Seferis, J.; Schaffnit, R. Viscoelastic characterization of high-performance epoxy matrix composites. Polym. Compos. 1991, 12, 273–280. [Google Scholar] [CrossRef]
  34. Saseendran, S.; Wysocki, M.; Varna, J. Evolution of viscoelastic behavior of a curing LY5052 epoxy resin in the rubbery state. Adv. Compos. Mater. 2017, 26, 553. [Google Scholar] [CrossRef]
  35. Cui, Z.; Brinson, L.C. A combination optimization method for the estimation of material parameters for viscoelastic solids. Int. J. Comput. Sci. Math. 2014, 5, 325–335. [Google Scholar] [CrossRef]
  36. Introduction to Fourier Transform Infrared Spectroscopy. Available online: https://www.chem.uci.edu/~dmitryf/manuals/Fundamentals/FTIR%20principles.pdf (accessed on 11 June 2024).
  37. Widmann, G.; Schawe, J.; Riesen, R. Interpret DMA curves, Part 1. METTLER TOLEDO. Available online: https://www.mt.com/mt_ext_files/Editorial/Generic/0/TA_UserCom15_0460929710242401_files/tauserc15e.pdf (accessed on 11 June 2024).
  38. Liu, Y.L.; Hsu, C.Y.; Wei, W.L.; Jeng, R.J. Preparation and thermal properties of epoxy–silica nanocomposites from nanoscale colloidal silica. Polymer 2003, 44, 5159–5167. [Google Scholar] [CrossRef]
  39. Sun, Y.Y.; Zhang, Z.Q.; Moon, K.S.; Wong, C.P. Glass transition and relaxation behavior of epoxy nanocomposites. J. Polym. Sci. Part B Polym. Phys. 2004, 42, 3849–3858. [Google Scholar] [CrossRef]
  40. Zheng, Y.; Chonung, K.; Wang, G.; Wei, P.; Jiang, P. Epoxy/nano-silica composites: Curing kinetics, glass transition temperatures, dielectric, and thermal–mechanical performances. J. Appl. Polym. Sci. 2009, 111, 917–927. [Google Scholar] [CrossRef]
  41. Sperling, L.H. Basic Viscoelastic Definitions and Concepts. In Sound and Vibration Damping with Polymers; American Chemical Society: Washington, DC, USA, 1990. [Google Scholar]
  42. Khare, K.S.; Khare, R. Effect of carbon nanotube dispersion on glass transition in cross-linked epoxy–carbon nanotube nanocomposites: Role of interfacial interactions. J. Phys. Chem. B 2016, 117, 7444–7454. [Google Scholar] [CrossRef] [PubMed]
  43. Najmi, L.; Hu, Z. Effects of carbon nanotubes on thermal behavior of epoxy resin composites. J. Compos. Sci. 2023, 7, 313. [Google Scholar] [CrossRef]
  44. Gopalakrishnamurthy, P.K.; Sandur, C. Investigation of dynamic mechanical behavior of nanosilica filled carbon-Kevlar epoxy polymer hybrid nanocomposite. Ann. De Chim. Sci. Des Mater. 2022, 46, 141–146. [Google Scholar] [CrossRef]
  45. Kopsidas, S.; Olowojoba, G.B. Multifunctional epoxy composites modified with a graphene nanoplatelet/carbon nanotube hybrid. J. Appl. Polym. Sci. 2021, 138, 50890. [Google Scholar] [CrossRef]
  46. Al Azzawi, W.; Epaarachchi, J.A.; Leng, J. Investigation of ultraviolet radiation effects on thermomechanical properties and shape memory behavior of styrene-based shape memory polymers and its composite. Compos. Sci. Technol. 2018, 165, 266–273. [Google Scholar] [CrossRef]
  47. Shi, Z.; Zou, C.; Zhou, F.; Zhao, J. Analysis of the mechanical properties and damage mechanism of carbon fiber/epoxy composites under UV aging. Materials 2022, 15, 2919. [Google Scholar] [CrossRef]
  48. Brinson, H.F.; Brinson, L.C. Polymer Engineering Science and Viscoelasticity, 2nd ed.; Springer: New York, NY, USA, 2008; pp. 99–157. [Google Scholar]
  49. Sahmetlioglu, E.; Mart, H.; Yuruk, H.; Surme, Y. Synthesis and characterization of oligosalicylaldehyde-based epoxy resins. Chem. Pap. 2006, 60, 65–68. [Google Scholar] [CrossRef]
  50. Gonzalez, M.G.; Cabanelas, J.C.; Baselga, J. Applications of FTIR on epoxy resins-identification, monitoring the curing process, phase separation and water uptake. In Infrared Spectroscopy-Materials Science, Engineering and Technology, 2nd ed.; IntechOpen: Rijeka, Croatia, 2012; Volume 2, pp. 261–284. [Google Scholar]
  51. Yin, Q.; Yang, W.; Sun, C.; Di, M. Preparation and properties of lignin-epoxy resin composite. BioResources 2012, 7, 5737–5748. [Google Scholar] [CrossRef]
  52. FT-IR Spectra of Pure Silica Nanoparticles. Available online: https://www.researchgate.net/figure/FT-IR-spectra-of-pure-silica-nanoparticles_fig2_295092184 (accessed on 9 April 2025).
  53. Panwar, K.; Jassal, M.; Agrawal, A.K. In situ synthesis of Ag–SiO2 Janus particles with epoxy functionality for textile applications. Particuology 2014, 19, 107–112. [Google Scholar] [CrossRef]
  54. Petreanu, I.; Niculescu, V.C.; Enache, S.; Iacob, C.; Teodorescu, M. Structural Characterization of Silica and Amino-Silica Nanoparticles by Fourier Transform Infrared (FTIR) and Raman Spectroscopy. Anal. Lett. 2022, 56, 390–403. [Google Scholar] [CrossRef]
  55. Gheno, G.; Ganzerla, R.; Bortoluzzi, M.; Paganica, R. Accelerated weathering degradation behavior of polyester thermosetting powder coatings. Prog. Org. Coat. 2016, 101, 90–99. [Google Scholar] [CrossRef]
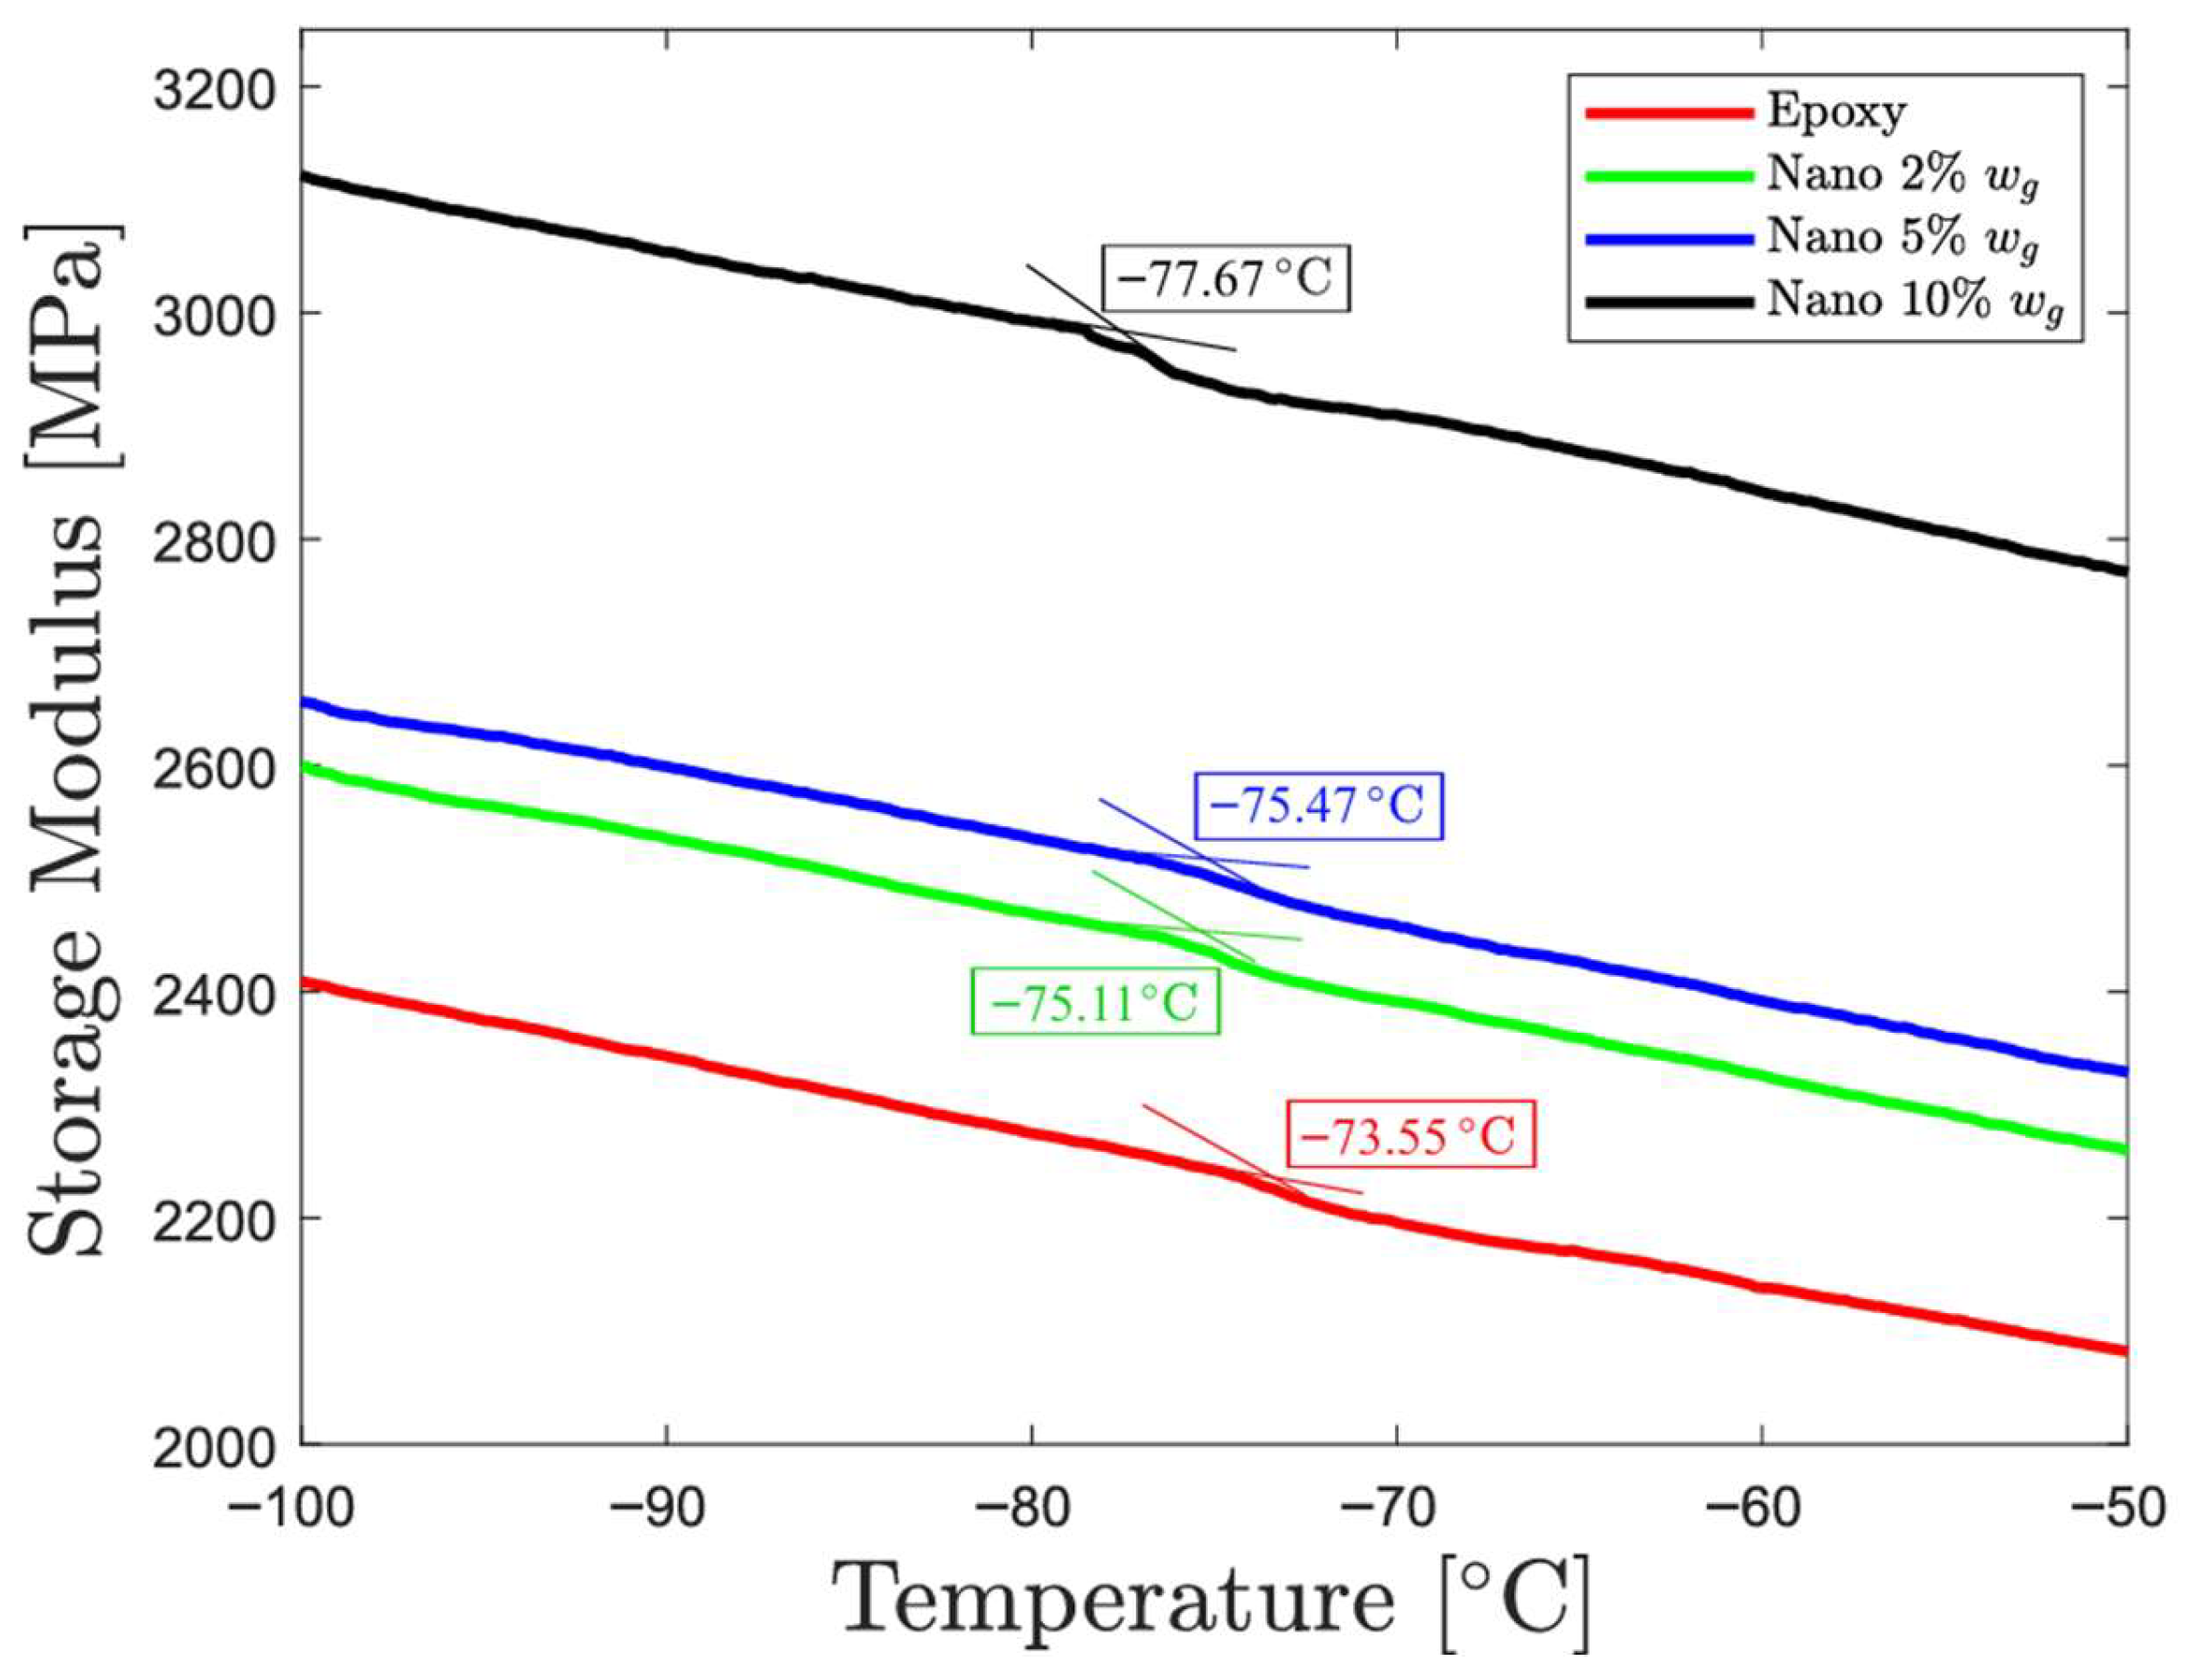
Figure 1. Mean temperature curves of storage modulus for −100 °C to 25 °C tests with a zoom on the β-relaxation temperature.
Jcs 09 00529 g001
Figure 2. Storage modulus of non-irradiated and irradiated specimens in logarithmic scale as function of the temperature.
Jcs 09 00529 g002
Figure 3. Tanδ of non-irradiated and irradiated specimens in logarithmic scale as function of the temperature.
Jcs 09 00529 g003
Figure 4. Differential scanning calorimetry (DSC) thermograms obtained from scans between 20 °C and 200 °C for nanosilica-based nanocomposites containing 0, 2, 5, and 10 wt% filler under pre-UV-C exposure conditions.
Jcs 09 00529 g004
Figure 5. Storage modulus and loss modulus as function of frequency: experimental curves (continuous line) and estimated curves using the Prony series before UV-C exposure. (a) epoxy specimens; (b) epoxy with 2 wt% of nanosilica; (c) epoxy with 5 wt% of nanosilica specimens; (d) epoxy with 10 wt% of nanosilica.
Jcs 09 00529 g005
Figure 6. Correlation between Gi and τi before UV-C exposure: (a) epoxy specimens; (b) epoxy with 2 wt% of nanosilica; (c) epoxy with 5 wt% of nanosilica; (d) epoxy with 10 wt% of nanosilica.
Jcs 09 00529 g006
Figure 7. Storage modulus and loss modulus as function of frequency: curves obtained from the DMA (continuous line) and curves estimated with the Prony series after UV-C exposure: (a) for the epoxy specimens; (b) for the epoxy with 2 wt% of nanosilica specimens; (c) for the epoxy with 5 wt% of nanosilica specimens; (d) for the epoxy with 10 wt% of nanosilica specimens.
Jcs 09 00529 g007
Figure 8. Correlation between Gi and τi after UV-C exposure: (a) for the epoxy specimens; (b) for the epoxy with 2 wt% of nanosilica specimens; (c) for the epoxy with 5 wt% of nanosilica specimens; (d) for the epoxy with 10 wt% of nanosilica specimens.
Jcs 09 00529 g008
Figure 9. Relaxation modulus as a function of time for epoxy resin samples containing 0 wt%, 2 wt%, 5 wt%, and 10 wt% nanosilica, before and after UV-C exposure.
Jcs 09 00529 g009
Figure 10. Absorbance spectra of the irradiated and unirradiated specimens and their peaks.
Jcs 09 00529 g010
Table 1. Average values of storage modulus (E′) at −100 °C and 25 °C and its percentage variation modulus compared to the value at 25 °C for the −100 °C to 25 °C tests.
wt% NanosilicaStorage Modulus
(MPa) at −100 °C
Storage Modulus (MPa) at 25 °CTβ-Relaxation (°C)
02409.79 ± 16.541731.33 ± 8.48−77.69 ± 0.81
22599.79 ± 42.351887.10 ± 24.96−75.47 ± 0.41
52656.55 ± 69.411954.57 ± 22.18−75.11 ± 0.26
103121.49 ± 17.302356.99 ± 8.46−73.55 ± 0.79
Table 2. Average values of storage modulus E′ at 25 °C, glass temperature Tg (Tonset), Tg (T peak), and damping factor of epoxy–nanosilica composites before UVC exposure.
wt% NanosilicaE′ (MPa)Tg (Tonset) (°C)Tg (Tpeak) (°C)Damping Factor
01689.45 ± 9.15119.81 ± 0.25138.73 ± 0.351.15 ± 0.07
21893.30 ± 3.31110.75 ± 0.90133.71 ± 0.091.10 ± 0.06
52063.70 ± 10.23107.06 ± 0.25131.30 ± 0.521.01 ± 0.02
102372.82 ± 9.7293.14 ± 0.24120.41 ± 1.210.87 ± 0.07
Table 3. Storage modulus, Tg (T onset), Tg (T peak) and damping factor for irradiated specimens.
wt%
Nanosilica
E′ (MPa)
Post UV-C
Tg (Tonset) (°C)
Post UV-C
Tg (Tpeak) (°C)
Post UV-C
Damping Factor
Post UV-C
01455.11 ± 4.73117.49 ± 0.32134.68 ± 0.561.07 ± 0.06
21694.98 ± 4.83106.06 ± 0.38128.46 ± 1.181.04 ± 0.01
51891.35 ± 0.43102.44 ± 0.18126.49 ± 0.850.97 ± 0.03
102228.95 ± 1.8491.21 ± 0.76116.81 ± 0.430.87 ± 0.02
Table 4. Assignments of the main absorption bands in the FTIR spectrum of unirradiated epoxy [49,50,51,52].
Wavenumber (cm−1)Assignment
2924C-H stretching
1728C=O bond
1601C=C stretching
1508, 1491C=C stretching
1451CH2 deformation
1235C-O-H asymmetric stretching
1158, 1112C-O stretching
1038C-O-C stretching
819C-O-C stretching
750C-H out of plane bending
Table 5. Assignments of the main absorption bands in the FTIR spectrum of unirradiated epoxy with nanosilica 2 wt% [52,53,54].
Wavenumber (cm−1)Assignment
3024C-H aromatic ring stretching
2957C-H stretching
1375 CH3 deformation
1100Si-O-Si symmetric stretching
599Si-O-Si bending
Table 6. Assignments of the main absorption bands in the FTIR spectrum of irradiated epoxy.
Wavenumber (cm−1)Assignment
3505O-H stretching
2961C-H stretching
1715C=O bending
1604C=C stretching
1507, 1490C=C aromatic ring stretching
1450CH2 deformation
1158C-O stretching
1035C-O-C stretching
822C-H aromatic stretching
749, 711C-H aromatic out of plane bending
Disclaimer/Publisher’s Note: The statements, opinions and data contained in all publications are solely those of the individual author(s) and contributor(s) and not of MDPI and/or the editor(s). MDPI and/or the editor(s) disclaim responsibility for any injury to people or property resulting from any ideas, methods, instructions or products referred to in the content.