Article

Optimization of Metakaolin-Based Geopolymer Composite for Repair Application

1
Faculty of Engineering, Beirut Arab University, Beirut 1105, Lebanon
2
Department of Civil and Environmental Engineering, University of Balamand, El Kourah P.O. Box 100, Lebanon
3
Faculty of Engineering, University of Wolverhampton, Wolverhampton WV1 1LY, UK
4
Faculty of Engineering, Alexandria University, Alexandria 5423021, Egypt
*
Authors to whom correspondence should be addressed.
J. Compos. Sci. 2025, 9(10), 527; https://doi.org/10.3390/jcs9100527
Submission received: 23 August 2025 / Revised: 17 September 2025 / Accepted: 23 September 2025 / Published: 1 October 2025
(This article belongs to the Section Polymer Composites)

Abstract

This paper assesses the feasibility of metakaolin (MK)-based geopolymer (GP) composite as an environmentally friendly substitute for cement-based composite in repair applications. The Taguchi orthogonal array method was used to find the optimum GP mix in terms of mechanical properties and adhesion to concrete substrates. Four key parameters, each with three levels, are investigated including the alkaline activator-to-MK ratio (A/M: 1, 1.2, 1.4), the sodium silicate-to-sodium hydroxide ratio (S/H: 2.0, 2.5, 3.0), sodium hydroxide (SH) molarity (12, 14, 16), and curing temperature (30, 45, 60 °C). The evaluated properties include flowability, compressive strength, splitting tensile strength, flexural strength, ultrasonic pulse velocity, and bond strength under various interface configurations. Experimental results demonstrated that the performance of MK-based GP composite was primarily governed by the A/M ratio and sodium hydroxide molarity. The Taguchi optimization method revealed that the mix design featuring A/M of 1.4, SS/SH of 2, 16 M sodium hydroxide, and curing at 60 °C yielded notable improvements in compressive and bond strengths compared to conventional cement-based composites.

1. Introduction

The rising demand for construction materials has not only led to the depletion of natural resources but also contributed to a significant increase in carbon dioxide (CO2) emissions, with a primary source being ordinary Portland cement production. A primary contributor to these emissions is ordinary Portland cement production, which accounts for roughly 7–8% of global human-caused CO2 emissions [1,2]. In response, researchers and environmentalists have been actively pursuing environmentally friendly substitutes for conventional cementitious binders [3,4].
Over the last decade, geopolymer (GP) composites have become a promising sustainable option in construction, offering a solution to environmental concerns [5,6]. GPs are materials based on calcium or aluminosilicate, created by the alkaline activation of industrial by-products or natural substances such as metakaolin (MK), fly ash, silica fume, and blast furnace slag [7]. These materials have a low carbon footprint and show better mechanical strength, thermal stability, and chemical resistance than cement-based composites [8]. For example, MK is a highly reactive pozzolanic material produced by heating kaolinite, and it has demonstrated considerable promise as a precursor for making GP mortars [9,10]. Its fine particle size and high alumina content allow it to dissolve efficiently in alkaline solutions, forming dense, amorphous aluminosilicate gels that improve the structural performance of the GP composite [11,12].
Achieving optimal GP polymerization is a challenging process that demands numerous experimental iterations to assess the effect of various factors such as binder type and content, activator solution components, and molarity on the behavior of fresh and hardened material properties. For MK-based GP composites, the most critical variables affecting performance include the molarity of sodium hydroxide (SH), the ratio of sodium silicate-to-sodium hydroxide (S/H), the proportion of alkaline solution to binder, and the applied curing conditions [7,8,13]. Various studies indicate that a higher molarity of SH improves the dissolution of MK particles, resulting in greater compressive and flexural strengths and better apparent density. Luo et al. [13] found that GP samples with a 14 M solution molarity achieved a compressive strength value of 49 MPa in 3 days of curing. Similarly, an increase in the S/H ratio is linked to enhanced GP gel formation and a denser microstructure; however, too much silica can disrupt the silicon-to-aluminum balance and hinder strength development [9,14]. The solution-to-binder ratio is also a crucial factor in the mix design. Albidah et al. [9] observed that compressive strength peaked at 58.5 MPa with an S/H ratio of 2.0; however, further increasing the ratio to 2.5 and 3 led to a decline in strength to 46.3 and 37.2 MPa, respectively, attributed to the presence of excess water and disturbance of the optimal silica–alumina balance. These results were supported by Jaya et al. [3], who found that a MK-to-alkaline solution ratio of 0.80 and 10 M solution molarity yielded the highest strength of 33 MPa, whereas exceeding this ratio led to greater porosity and weaker mechanical properties. Furthermore, the solution-to-binder ratio has a notable impact on both the fresh and hardened properties of the mixture. Elyamany et al. [15] observed that a greater solution-to-binder ratio led to a decrease in compressive and flexural strengths, which was attributed to surplus water and the dilution of the mixture’s reactive components.
Wang et al. [8] showed that curing at high temperatures substantially speeds up the geopolymerization process, leading to early increases in strength [16,17,18]. Moreover, Zhang et al. reported a maximum compressive strength of 115 MPa after curing a specimen for 60 days at 75 °C. In contrast, curing temperatures above 150 °C can degrade the material’s microstructure and increase its porosity due to thermal stress and moisture loss, which consequently diminishes its overall strength [19].
Yan et al. [20] assessed the effect of curing temperature on MK-based GPs, focusing on electrical conductivity, setting time, microstructure, and mechanical properties. The results revealed that increasing the curing temperature accelerates the dissolution, polymerization, and reprecipitation processes of geopolymerization, leading to a significant increase in electrical conductivity in the early stages due to enhanced hydroxide ion activity, and a shorter setting time [21,22,23]. While higher temperatures generally improve compressive strength, an optimal curing temperature of about 60 °C for 7 days achieved the highest compressive strength of 97.9 MPa [20]. Specimens exposed to lower temperatures resulted in slow dissolution and incomplete gel formation, leading to weaker, gelatinous structures [24]. Nevertheless, excessively high temperatures (80 and 100 °C) caused rapid setting, which hindered complete transformation into a compact structure and led to decreased strength due to microcracks and incomplete dissolution of MK [25].
Despite the available literature on MK-based GP composites, there is a lack of comprehensive understanding regarding how mix composition collectively influences key mechanical properties, particularly bond strength to existing materials for repair purposes. Prior studies have frequently investigated these variables individually, neglecting their interconnectedness and optimal combinations. To address this, the Taguchi method was employed in this study to identify the most influential parameters on mechanical performance and select the best proportions using a minimal number of experiments. The experimental plan utilized the Taguchi method, which enabled an organized evaluation of various factors with a limited number of tests. Four primary parameters were assessed at three levels: the alkaline solution-to-metakaolin ratio (A/M), the sodium silicate-to-sodium hydroxide ratio (S/H), the sodium hydroxide (SH) molarity, and the curing temperature. This research is expected to enhance the knowledge of GP mixes that use MK as the main binder, contributing to a more sustainable product for repair and strengthening applications with a reduced carbon footprint.

2. Experimental Program

2.1. Materials

MK, produced by calcining kaolinitic clay, and Portland cement conforming to ASTM C150 standards are used as binders in this study. The chemical compositions of the as-received cement and MK are summarized in Table 1. The activator for this research was an alkaline solution consisting of a mixture of sodium hydroxide (SH) and sodium silicate (SS). The sodium hydroxide solution was prepared by dissolving SH pellets in distilled water in the laboratory. The solution is generally prepared a day ahead to ensure it cools properly before being added to the dry materials, with the sodium hydroxide pellet quantity tailored to achieve the desired molarity in each liter of solution. It is important to note that cooling the solution is a crucial step in geopolymer preparation, as it prevents solution temperature from affecting the resulting properties such as workability and strength [6,8].
The fine aggregate used in this study complies with ASTM C33 [26], with a bulk specific gravity, maximum particle size, water absorption, and fineness modulus of 2.65, 4.75 mm, 5%, and 2.78, respectively. The particle size distribution is illustrated by the gradation curve in Figure 1.

2.2. Mixture Proportions

The development of GP mixes was conducted using the Taguchi experimental design [27,28]. The selected factors and their respective levels, utilized to optimize the properties of MK-based GP mortar, are detailed in Table 2. By employing orthogonal arrays with predefined levels for each factor, this method allows for a systematic investigation with minimal experimental variance and a reduced number of necessary samples [29,30]. Therefore, nine different mixes were developed and grouped into three sets to evaluate how various mix design parameters affect the mechanical properties of the MK-based GP (Table 3). The factors considered include the mass ratio of alkaline solution to MK (A/M) at levels of 1.0, 1.2, and 1.4; the ratio of sodium silicate-to-sodium hydroxide (S/H) at 2.0, 2.5, and 3.0; the molarity of SH solution at 12, 14, and 16 M; and the curing temperature set at 30, 45, and 60 °C. The total amounts of MK and alkaline activator (including water) ranged approximately from 377–426 kg/m3 and 426–531 kg/m3, respectively, resulting in an A/M ratio varying between 1.0 and 1.4. The factor levels were determined from both trial mixes and previous research to secure adequate flowability and strength characteristics [11]. Specimens were systematically prepared with specific variations in mix design factors to evaluate their influence on the fresh and hardened properties of the MK-based GP mortar. The mixture codification refers to A/M, S/H, SH solution molarity, and curing temperature.
In addition to the 9 mixes designed by the Taguchi approach, two conventional cement-based mix (i.e., serving as control) were evaluated. Labeled as C1 and C2, the mortar mixtures were formulated with water-to-cement ratios of 0.65 and 0.5, respectively, and a consistent cement-to-sand ratio of 1:3, achieving compressive strengths suitable for masonry mortar (15 MPa) and structural (25 MPa) applications. It should be noted that the binder content in the conventional cement mortar was 464 kg/m3, while this ranged from 377 to 427 kg/m3 depending on the A/M ratio in the GP mixes. The use of nearly equivalent binder contents played an important role in enabling an objective comparison between cement-based and GP mixtures. It is worth noting that the binder for cement-based mortar is Portland cement, while the binder for GP is MK.

2.3. Samples Preparation

The batching process was conducted in the laboratory under ambient conditions of 24 ± 2 °C temperature and 50 ± 5% relative humidity. The batching started by homogenizing the dry components (i.e., fine aggregates and binder), using a mechanical mixer for 3 min. The SH and SS were then gradually introduced and mixed for an additional 3 min to ensure a uniform blend. The freshly mixed mortar was poured into standard cube molds (5 cm), prismatic molds (16 cm × 4 cm × 4 cm), and cylindrical molds (4 cm diameter × 8 cm height). The specimens were compacted on a vibrating table for 10 s. Following casting, the specimens were cured for 24 h at a specified temperature to facilitate the initial geopolymerization reactions. To prevent water loss, this initial curing was conducted under controlled humidity conditions above 90%. The specific temperatures varied based on the mix group: G1 to G3 were cured at 30 °C, G4 to G6 at 45 °C, and G7 to G9 at 60 °C. After this initial heat curing period, the specimens were removed and stored in a controlled laboratory environment with consistent temperature and humidity until they reached their designated testing age.

2.4. Test Methods

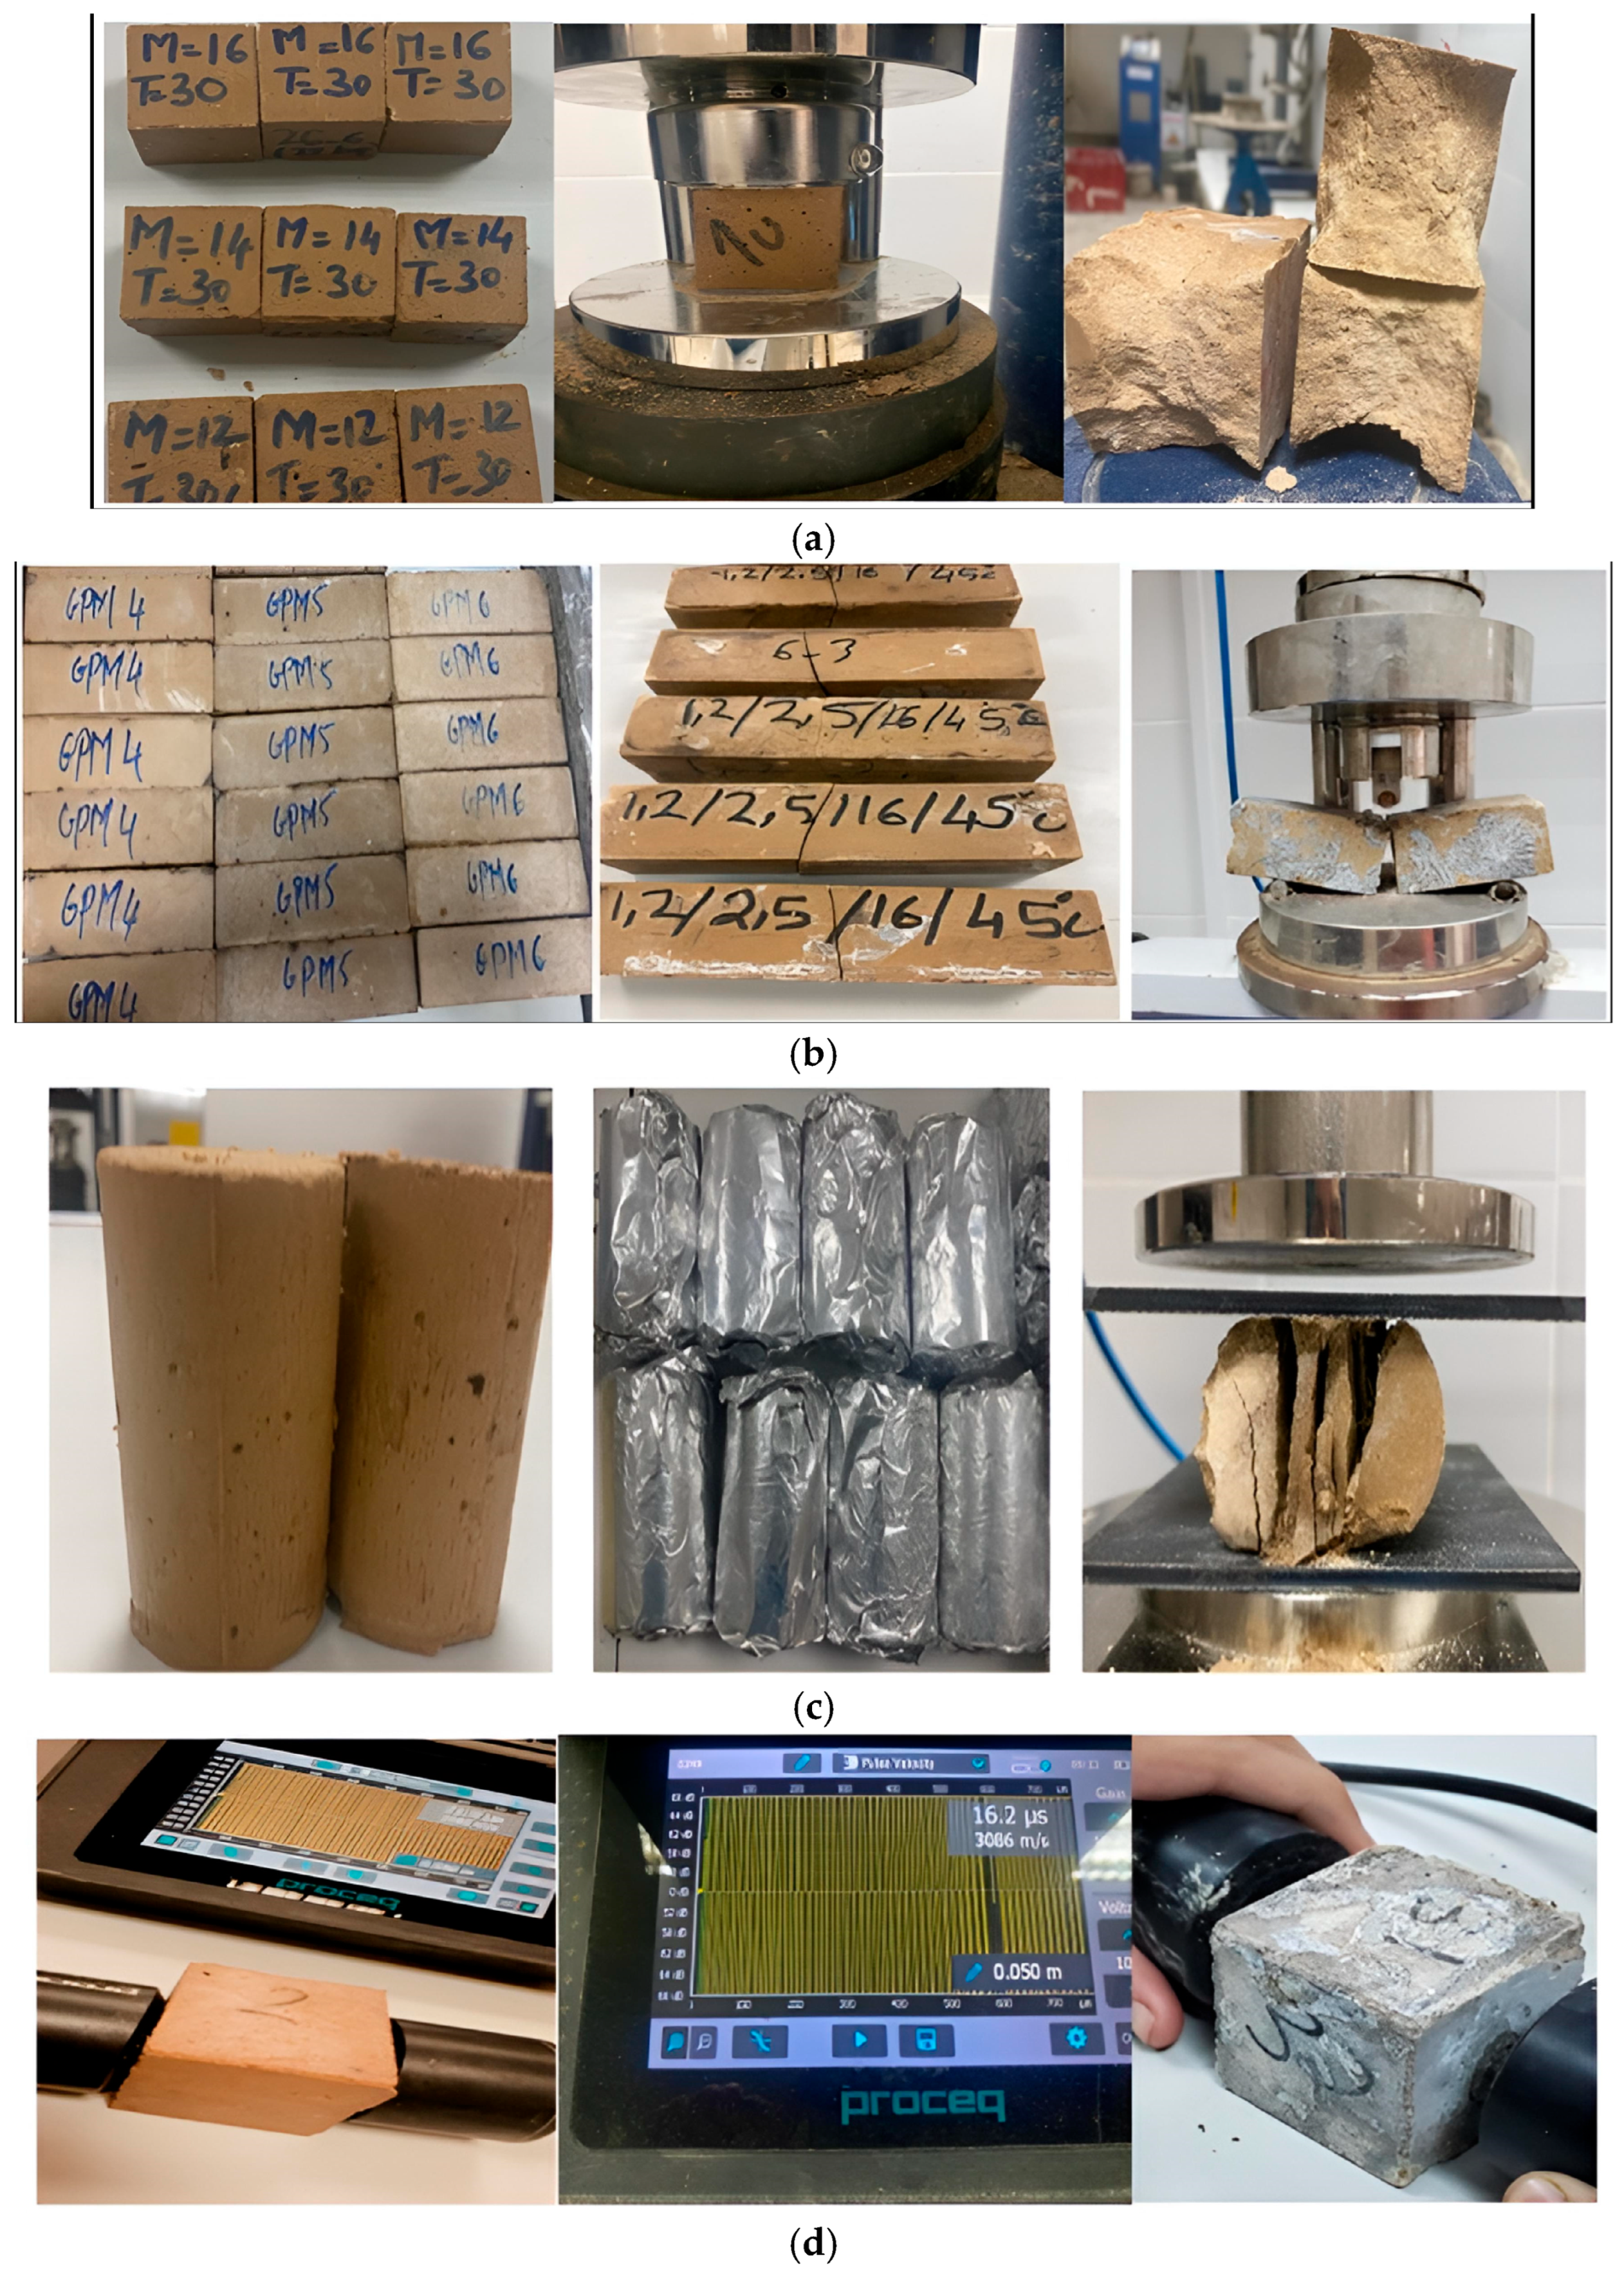
The flow table test, conducted in accordance with ASTM C1437 [31], was used to evaluate the workability of the fresh mortar mixtures. Fresh mortar was placed in the mold and subjected to 25 drops in 15 s. The final spread diameter was recorded to determine the flow value. The mechanical performance was evaluated through the compressive, flexural, and split tensile strengths. Compressive strength was determined in accordance with ASTM C109 [32] using cubic specimens which were tested at 7, 14, 28, and 56 days (Figure 2a). Flexural strength was measured according to ASTM C293 [33] using the prismatic specimens and tested at various curing ages (Figure 2b). The split tensile strength was conducted on cylindrical specimens according to ASTM C496 [34] (Figure 2c). The hardened specimens used for density and ultrasonic pulse velocity (UPV) tests were conducted on cubes of 5 cm in size. The UPV test was conducted in accordance with ASTM C597 [35] (Figure 2d). Both flexural and split tensile strength tests were conducted on the geopolymer specimens at 7 and 14 days of age, while the ultrasonic pulse velocity (UPV) test was performed at 7, 14, and 28 days.
The bond characteristics of geopolymer (GP) and cement-based mortars were assessed via a slant shear strength test. The study investigated three distinct interface conditions: GP mortar–GP mortar, cement mortar–cement mortar, and cement mortar–GP mortar. For each interface type, a total of 30 specimens were prepared. To examine how bonded length influences strength, interfaces were set at a 60° angle. The effective bond lengths were shortened to 4, 3, and 2 cm by masking the specimen edges while keeping the bond area centered (Figure 3). This method helped minimize edge effects and allowed for a more precise evaluation of bond performance [36,37,38]. Additional tests using the full inclined length were also conducted to further study the impact of bond length on overall bond strength. Each test condition was determined by averaging the results from three specimens. Before the molds were cast, the cement mortar substrates were cured for 28 days. For cement mortar–cement mortar interfaces, bond strength tests were carried out after 7 and 14 days of curing.

3. Results and Discussion

3.1. Flowability

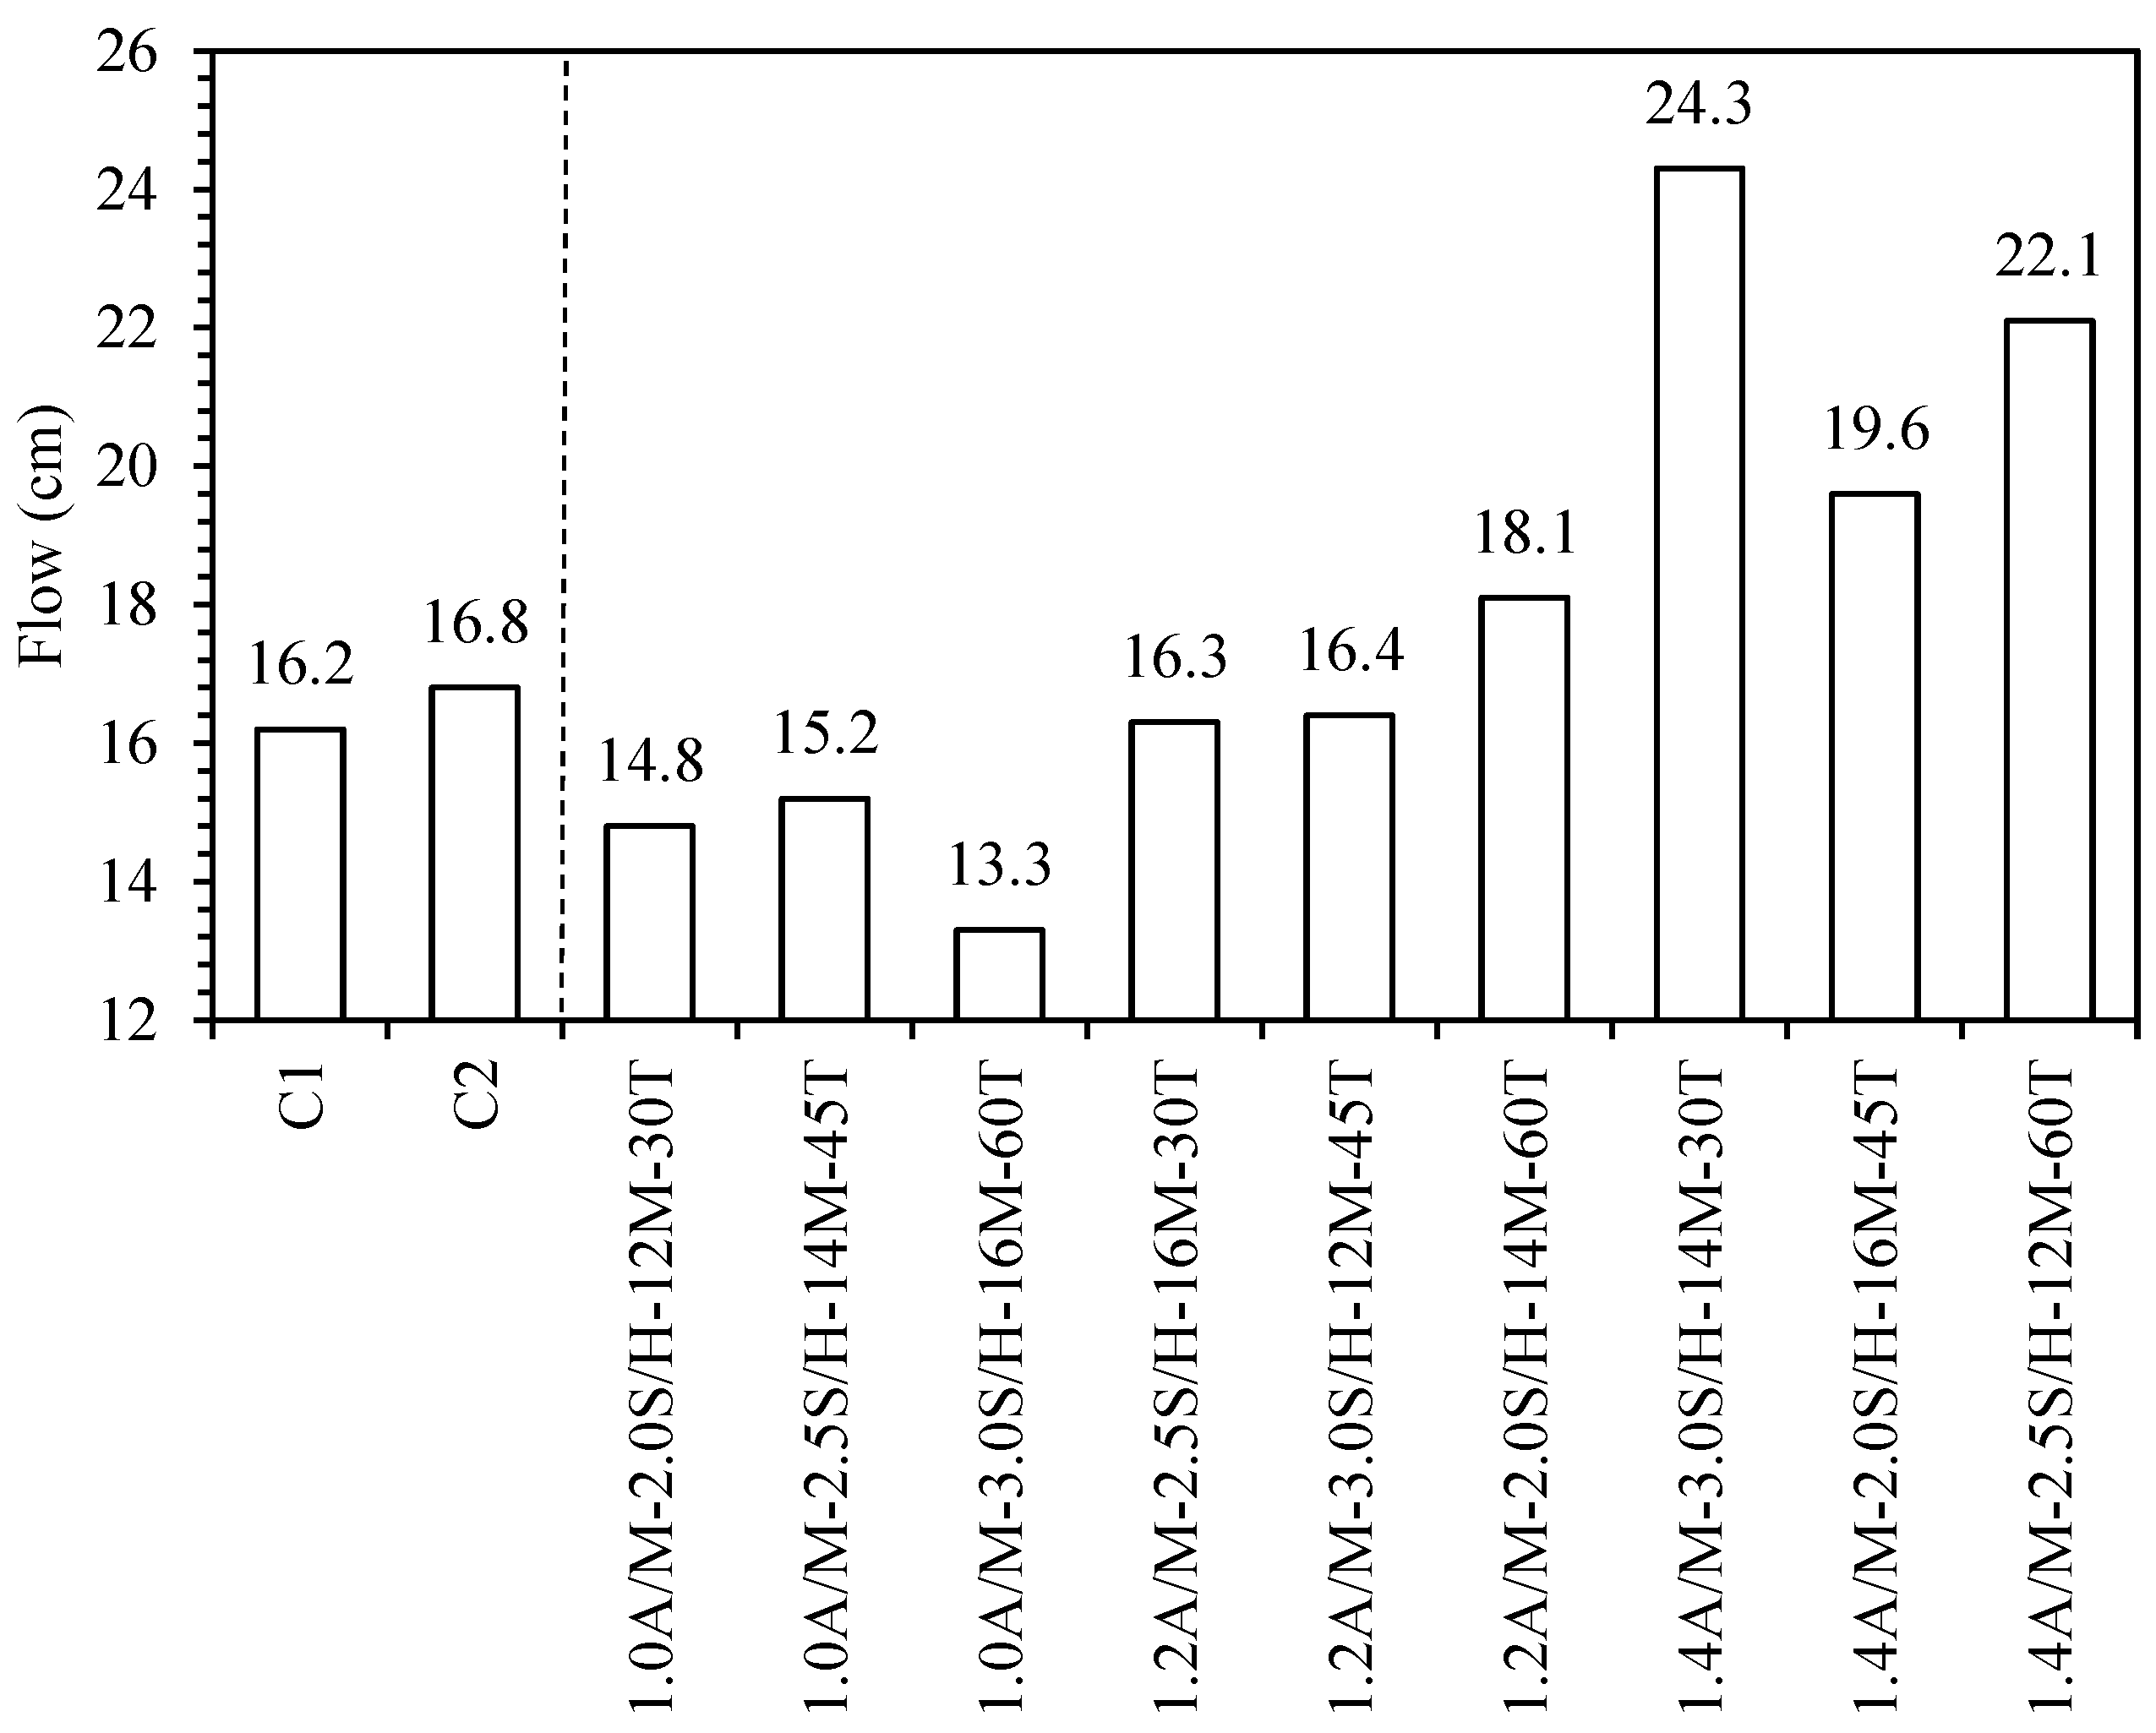
Figure 4 plots the flow values for the mortars. For any given mix, the increase in A/M resulted in a progressive enhancement in flowability; the average flow values increased from 14.4 to 16.9 and 22 cm as A/M increased from 1.0 to 1.2 and 1.4, respectively. This trend can be attributed to the reduction in internal friction due to the increased liquid content associated with higher A/M ratios [39]. It is worth noting that only mixtures with an A/M of 1.4 achieved flow values exceeding 20 cm. These observations show the significant influence of this ratio on the flow behavior, a finding further supported by its high contribution in the analysis of variance (ANOVA) presented later.
Conversely, the effects of S/H and SH molarity on the flowability of GP mixtures were relatively less pronounced. In fact, mixtures prepared with high S/H ratios and elevated SH molarity tended to exhibit lower flow values, which can be attributed to the increased viscosity of the alkaline activator resulting from the greater proportion of sodium silicate in the solution [40,41]. Similar findings have been reported elsewhere for ground granulated blast furnace slag, fly ash, and perlite-based GP composites [42]. Nevertheless, it is noteworthy that the flow behavior of MK-based GP mortars, prepared with MK and an alkaline solution, differs from that of cement-based mortars (C1 and C2) made with water and cement. This difference is mainly attributed to the distinct rheological properties imparted by the alkaline activator and water [43].

3.2. Compressive Strength

Table 4 summarizes the compressive strengths for the MK-based GP and cement mortars measured at 7, 14, 28, and 56 days. At the age of 7 days, strength values ranged from 15.5 to 34 MPa, with the lowest observed for 1.2A/M-3.0S/H-12M-45T mix which was produced with an A/M ratio of 1.2, S/H ratio of 3.0, 12 M SH solution, and cured at 45 °C temperature. While a low A/M often favors strength gain, the influence of other parameters appears to have a more dominant adverse effect. On the other hand, the 1.4A/M-2.0S/H-16M-45T mix exhibited the maximum 7-day compressive strength; this mix had an A/M ratio of 1.4, S/H ratio of 2.0, 16 M SH solution, and cured at 45 °C.
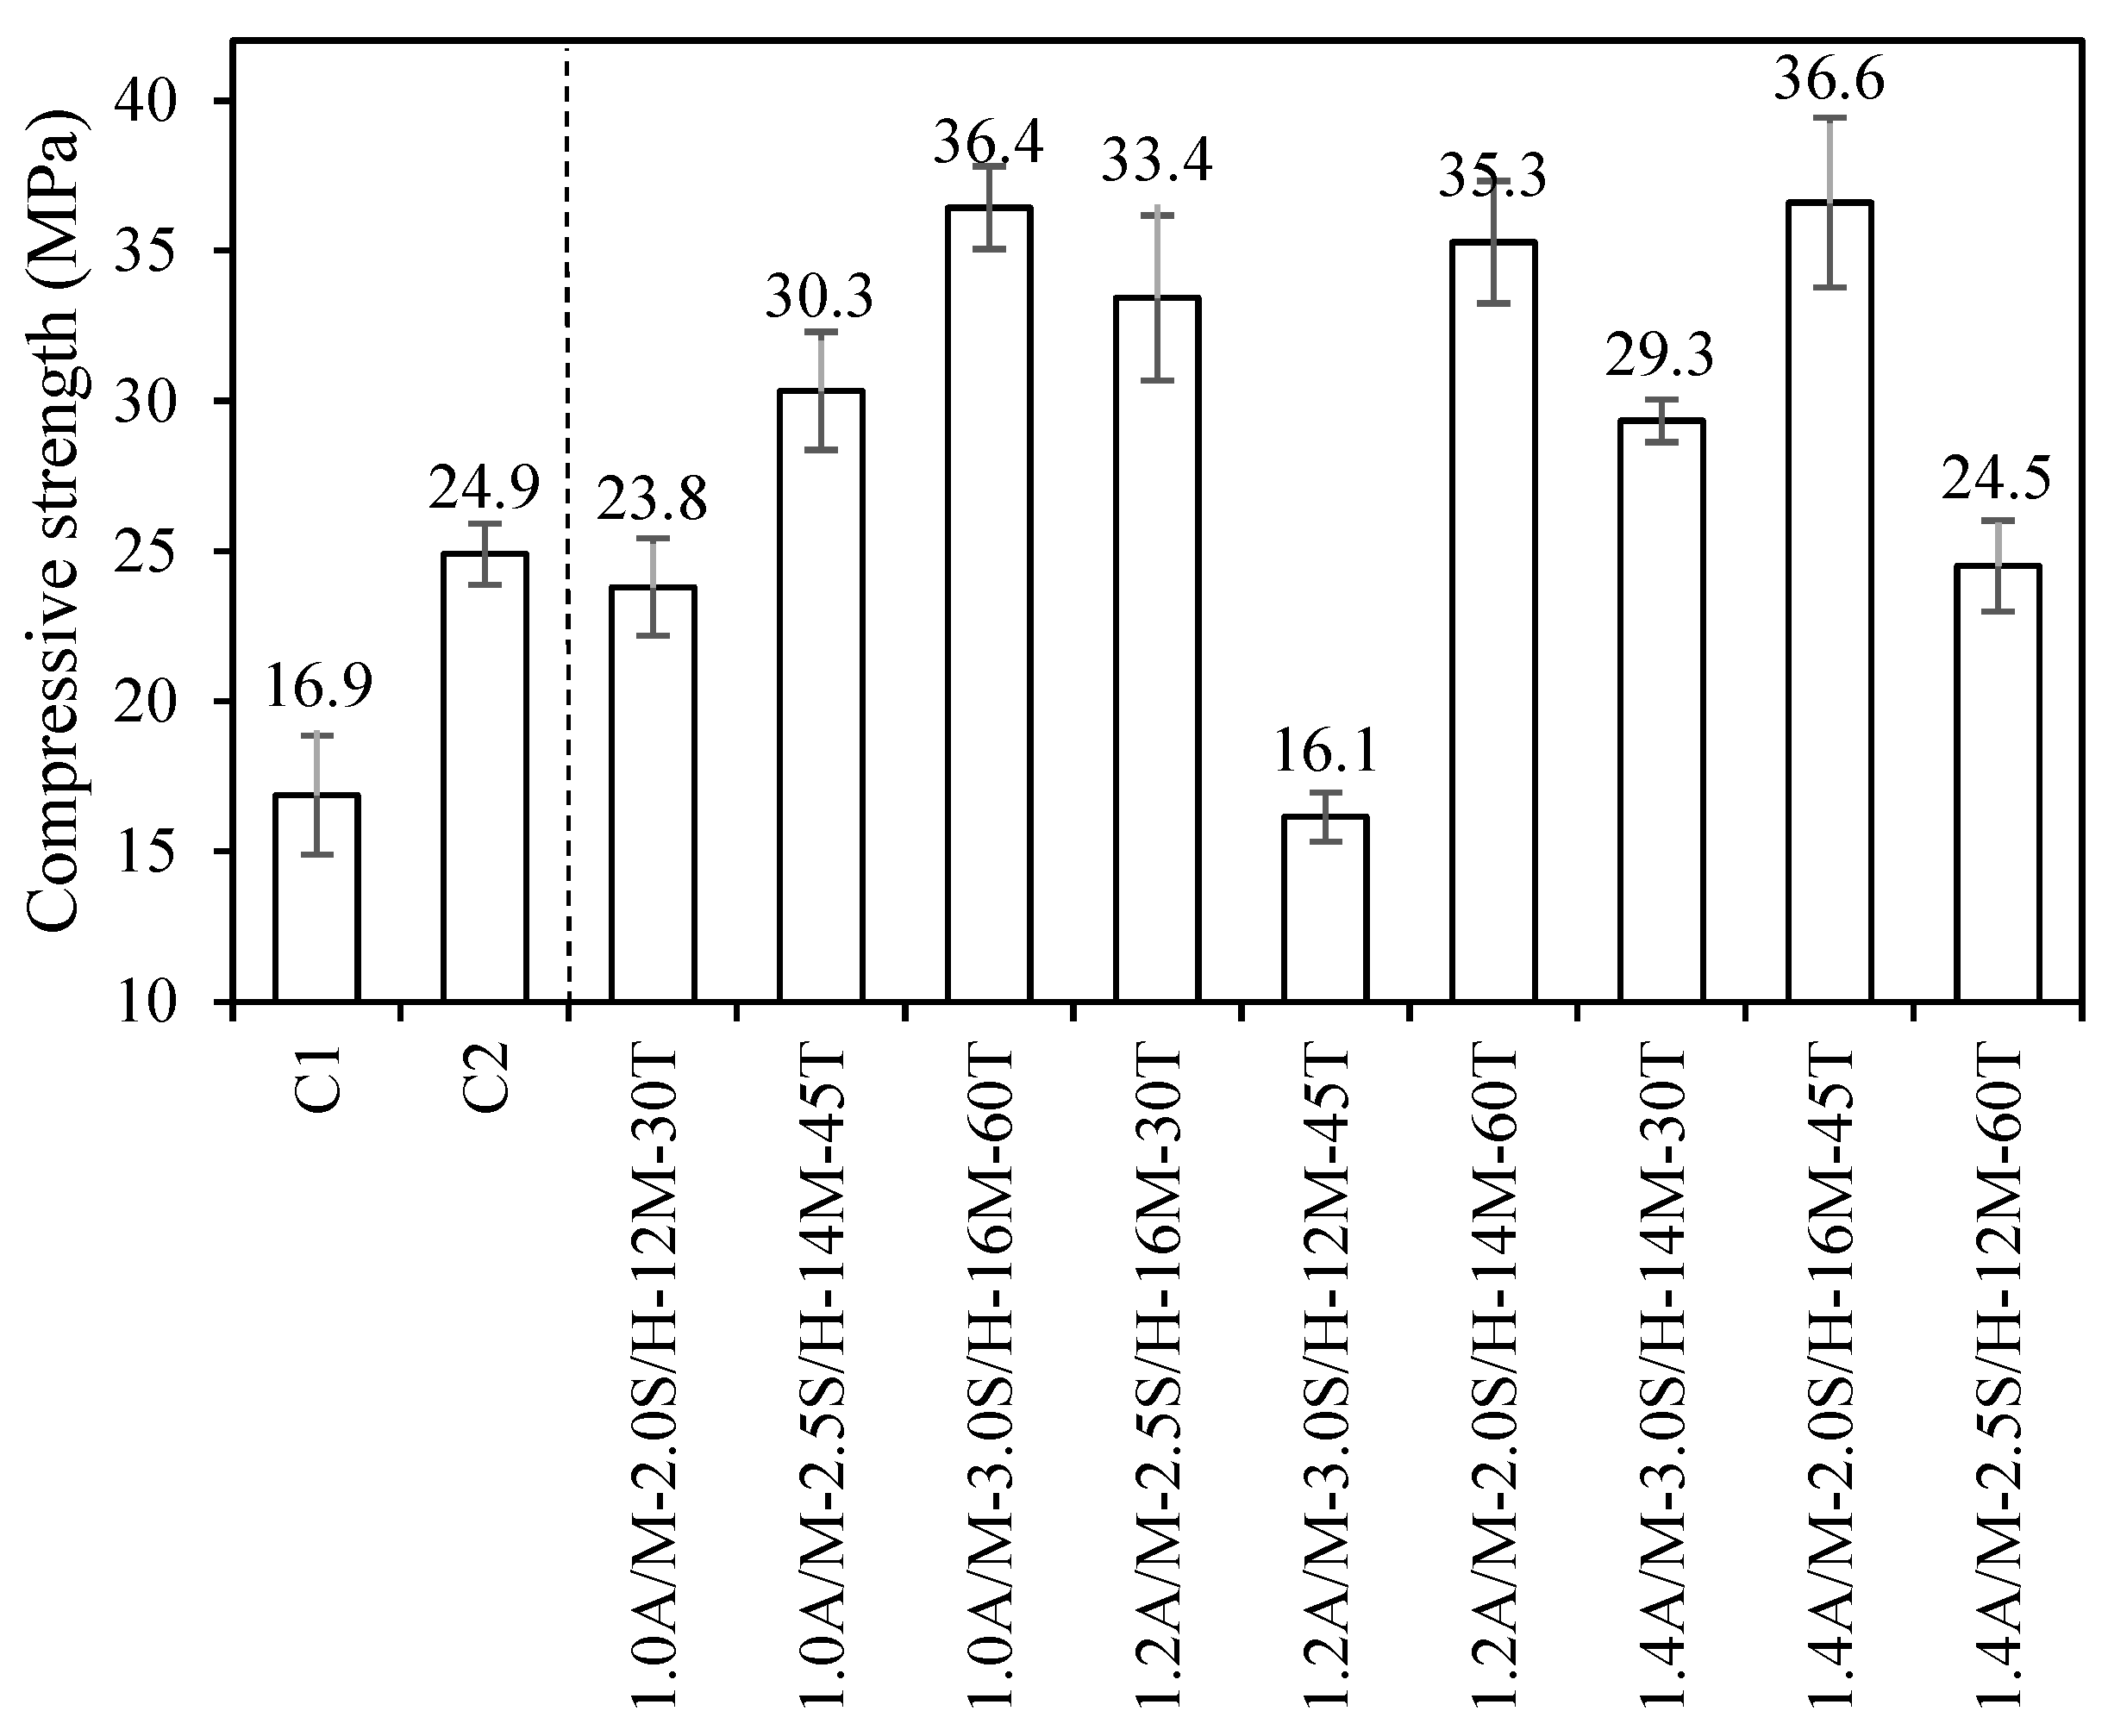
The compressive strengths at later ages (i.e., 14, 28, and 56 days) showed a similar pattern to the 7-day values. For example, the A/M-3.0S/H-16M-60T mix yielded the highest 28-day compressive strength of 34 MPa (Figure 5). An inverse correlation was observed between the A/M ratio and compressive strength, attributed to enhanced particle packing and lower porosity, akin to the influence of water-to-binder ratios in cement-based materials [42]. Additionally, a higher S/H ratio promoted silica dissolution and accelerated the activation reactions, thereby improving strength [39]. Increasing the SH molarity introduced more hydroxide ions, which boosted reaction kinetics and contributed to greater strength development [40]. Furthermore, curing at 60 °C resulted in a 50% strength enhancement, likely due to the elevated activation temperature that facilitated a faster geopolymerization [11]. It is worth noting that using one of these parameters in isolation may not lead to enhanced properties. For example, a mix with A/M ratio of 1.0 combined with either an SH molarity of 12 M or SS/SH ratio of 2.0 resulted in a 28-day compressive strength below 22.8 MPa.
As shown in Table 4, the percentage increase in strength was calculated over the intervals of 7–14 days, 7–28 days, and 7–56 days. The cement-based mixtures C1/C2 exhibited strength gains of 10.7/12.7%, 23/26.6%, and 26.1/36.2% over these respective periods. The strength progression from 7 to 56 days, particularly for the top-performing mixes such as 1.4A/M-2.0S/H-16M-45T, 1.0A/M-3.0S/H-16M-60T, 1.2A/M-2.0S/H-14M-60T, and 1.0A/M-2.5S/H-14M-45T which achieved 56-day strengths of 36.6, 36.5, 35.5, and 30.5 MPa respectively, reveals the variations in reactivity and effectiveness of curing conditions. The mixture labeled 11.0A/M-2.0S/H-12M-30T recorded the least strength progression over the 56-day curing period, with an increase of only 5.1%. This limited gain indicates a highly reactive early-stage GP system that rapidly formed a rigid and stable matrix, reaching its peak mechanical performance by day 7. This outcome is largely due to the use of a low-molarity activator and low curing temperature, both of which promoted early GP formation while limiting the extended reactivity needed for continued strength growth [11,39].

3.3. Flexural and Splitting Tensile Strengths

The flexural and splitting tensile strength results presented in Figure 6 for MK-based GP and cement-based mortars mirrored the trends observed in compressive strength. For each A/M level, the mixes 1.0A/M-3.0S/H-16M-60T, 1.2A/M-2.0S/H-14M-60T, and 1.4A/M-2.0S/H-16M-45T demonstrated superior flexural strength, attaining 9.6, 9.9, and 9.8 MPa, respectively. This enhancement is attributed to the synergistic effects of high SH molarity and elevated curing temperatures, both of which intensify the dissolution and polycondensation processes, leading to a more cohesive and resilient matrix. The significance of these parameters is also emphasized in the ANOVA findings, which confirm their critical roles in influencing mechanical performance. Furthermore, curing at 45–60 °C likely contributes to improved microstructural development, especially in the interfacial transition zone, which enhances tensile load transfer [11]. It is important to highlight that most GP mixes consistently exhibited higher flexural strength than the cement-based mortar, underscoring their potential as durable and high-strength alternatives.
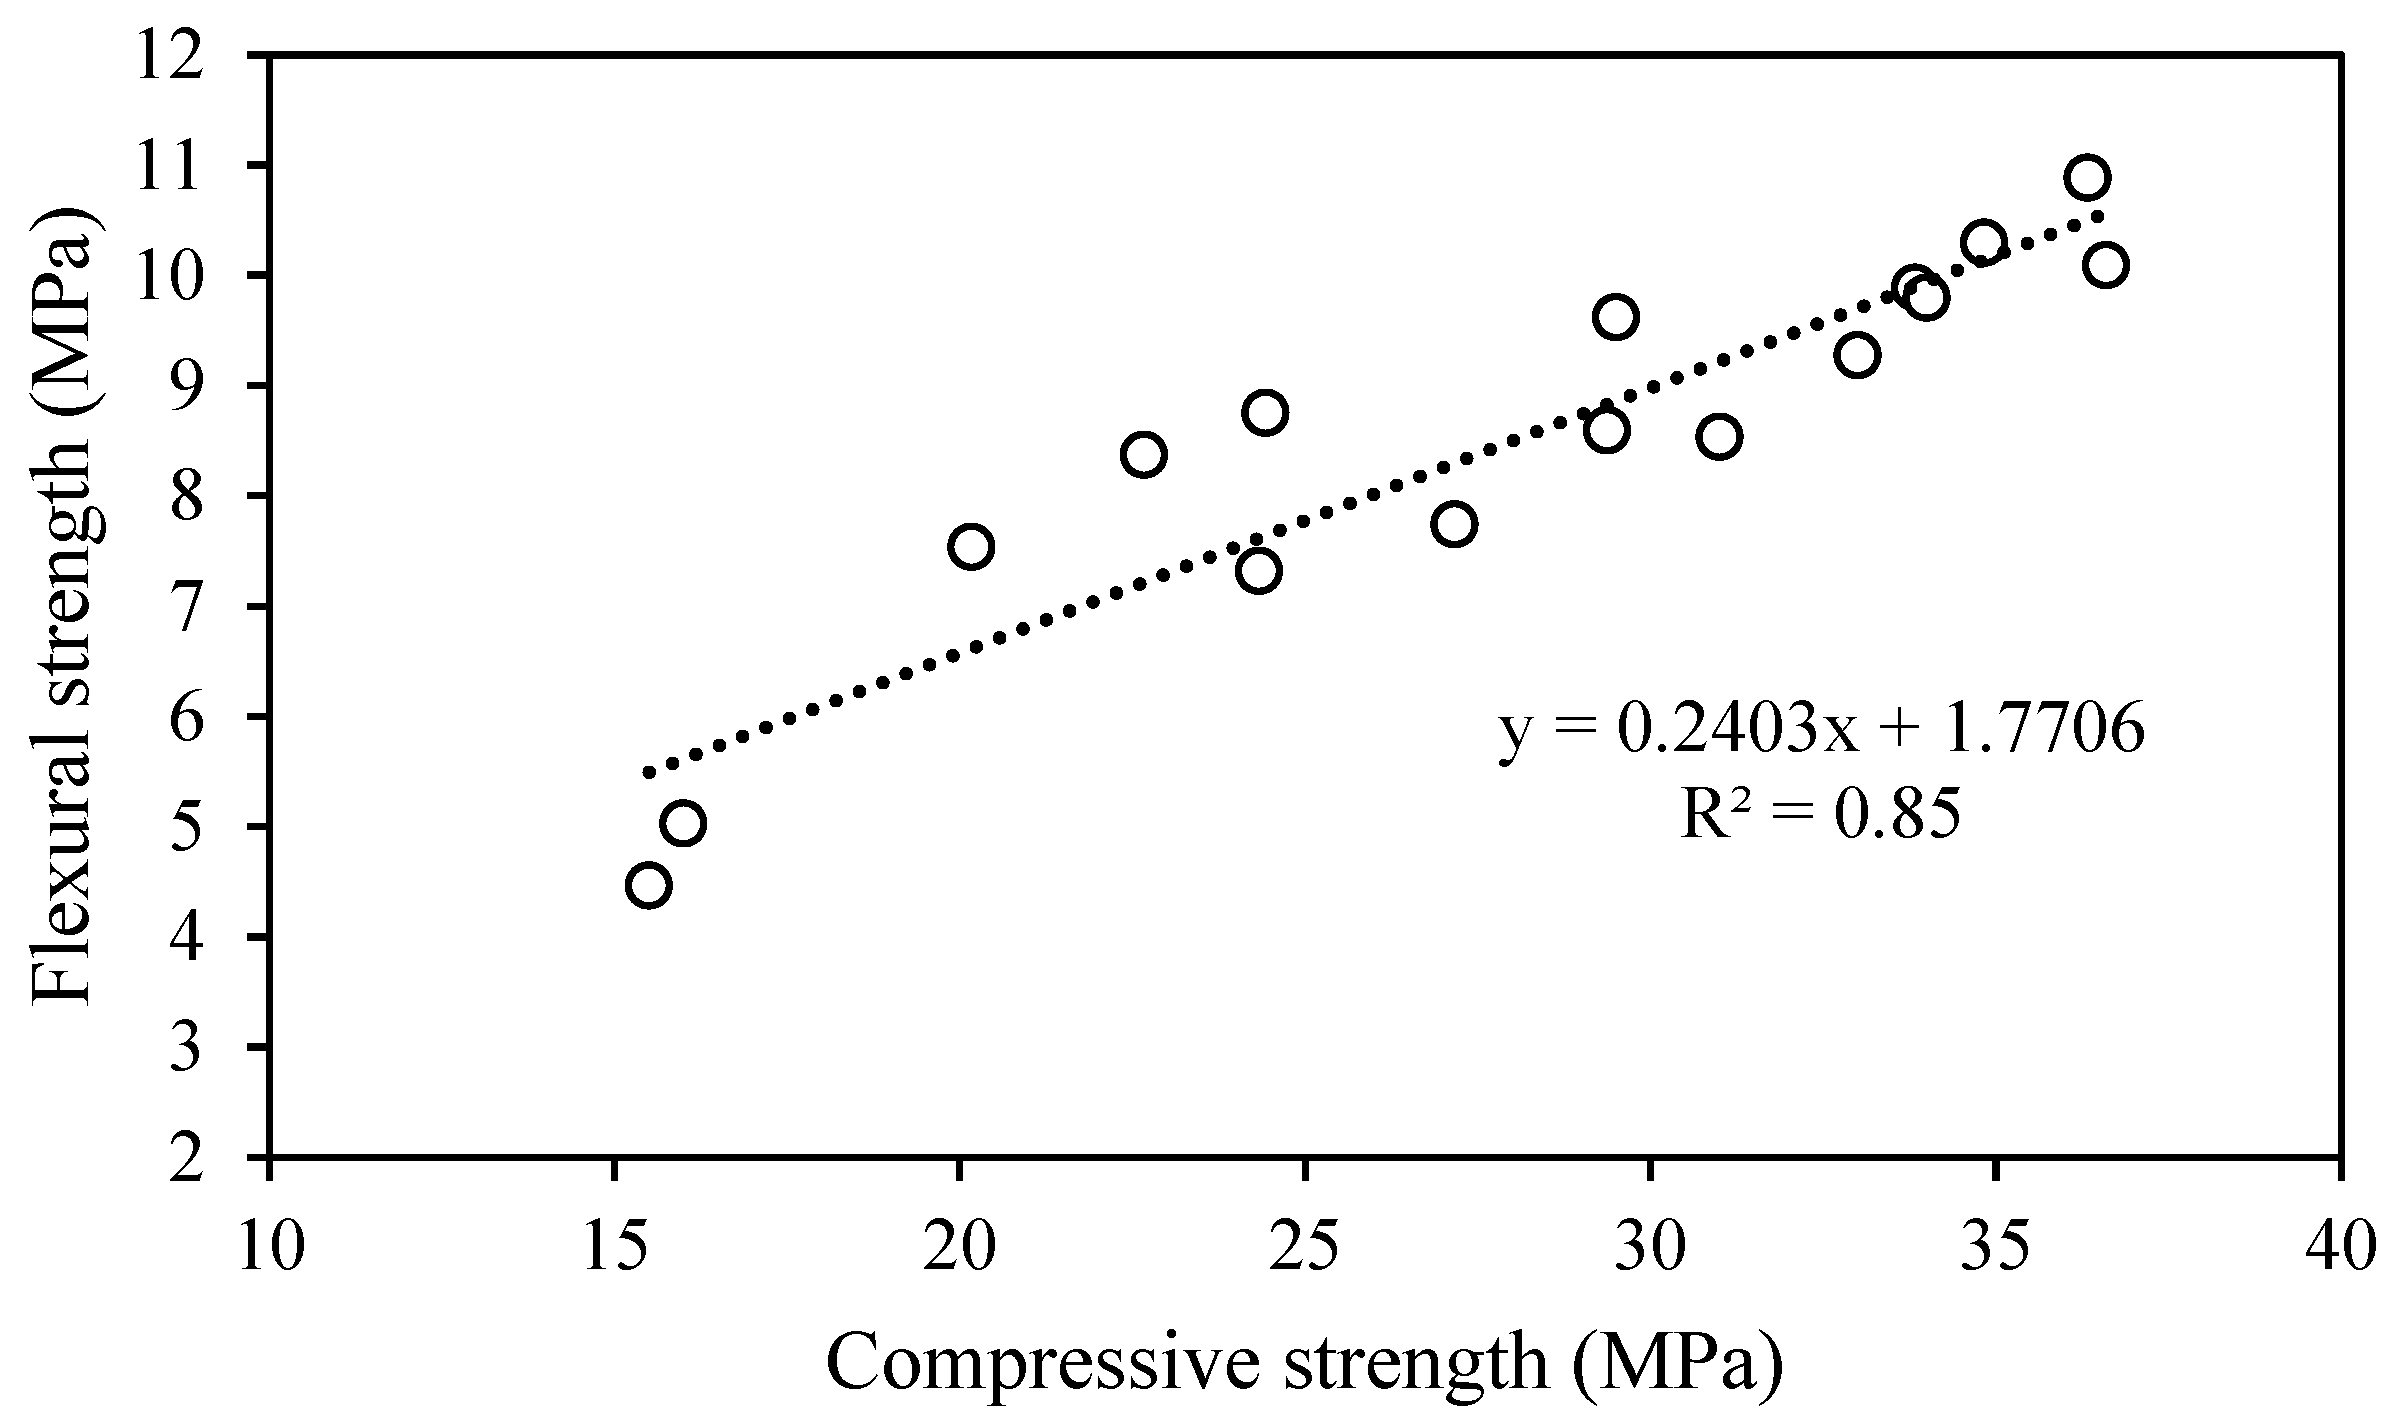
A strong correlation was found between flexural strength and compressive strength (Figure 7), enabling highly accurate prediction of flexural strength with an R2 value of 0.90 (or 0.85).

3.4. UPV

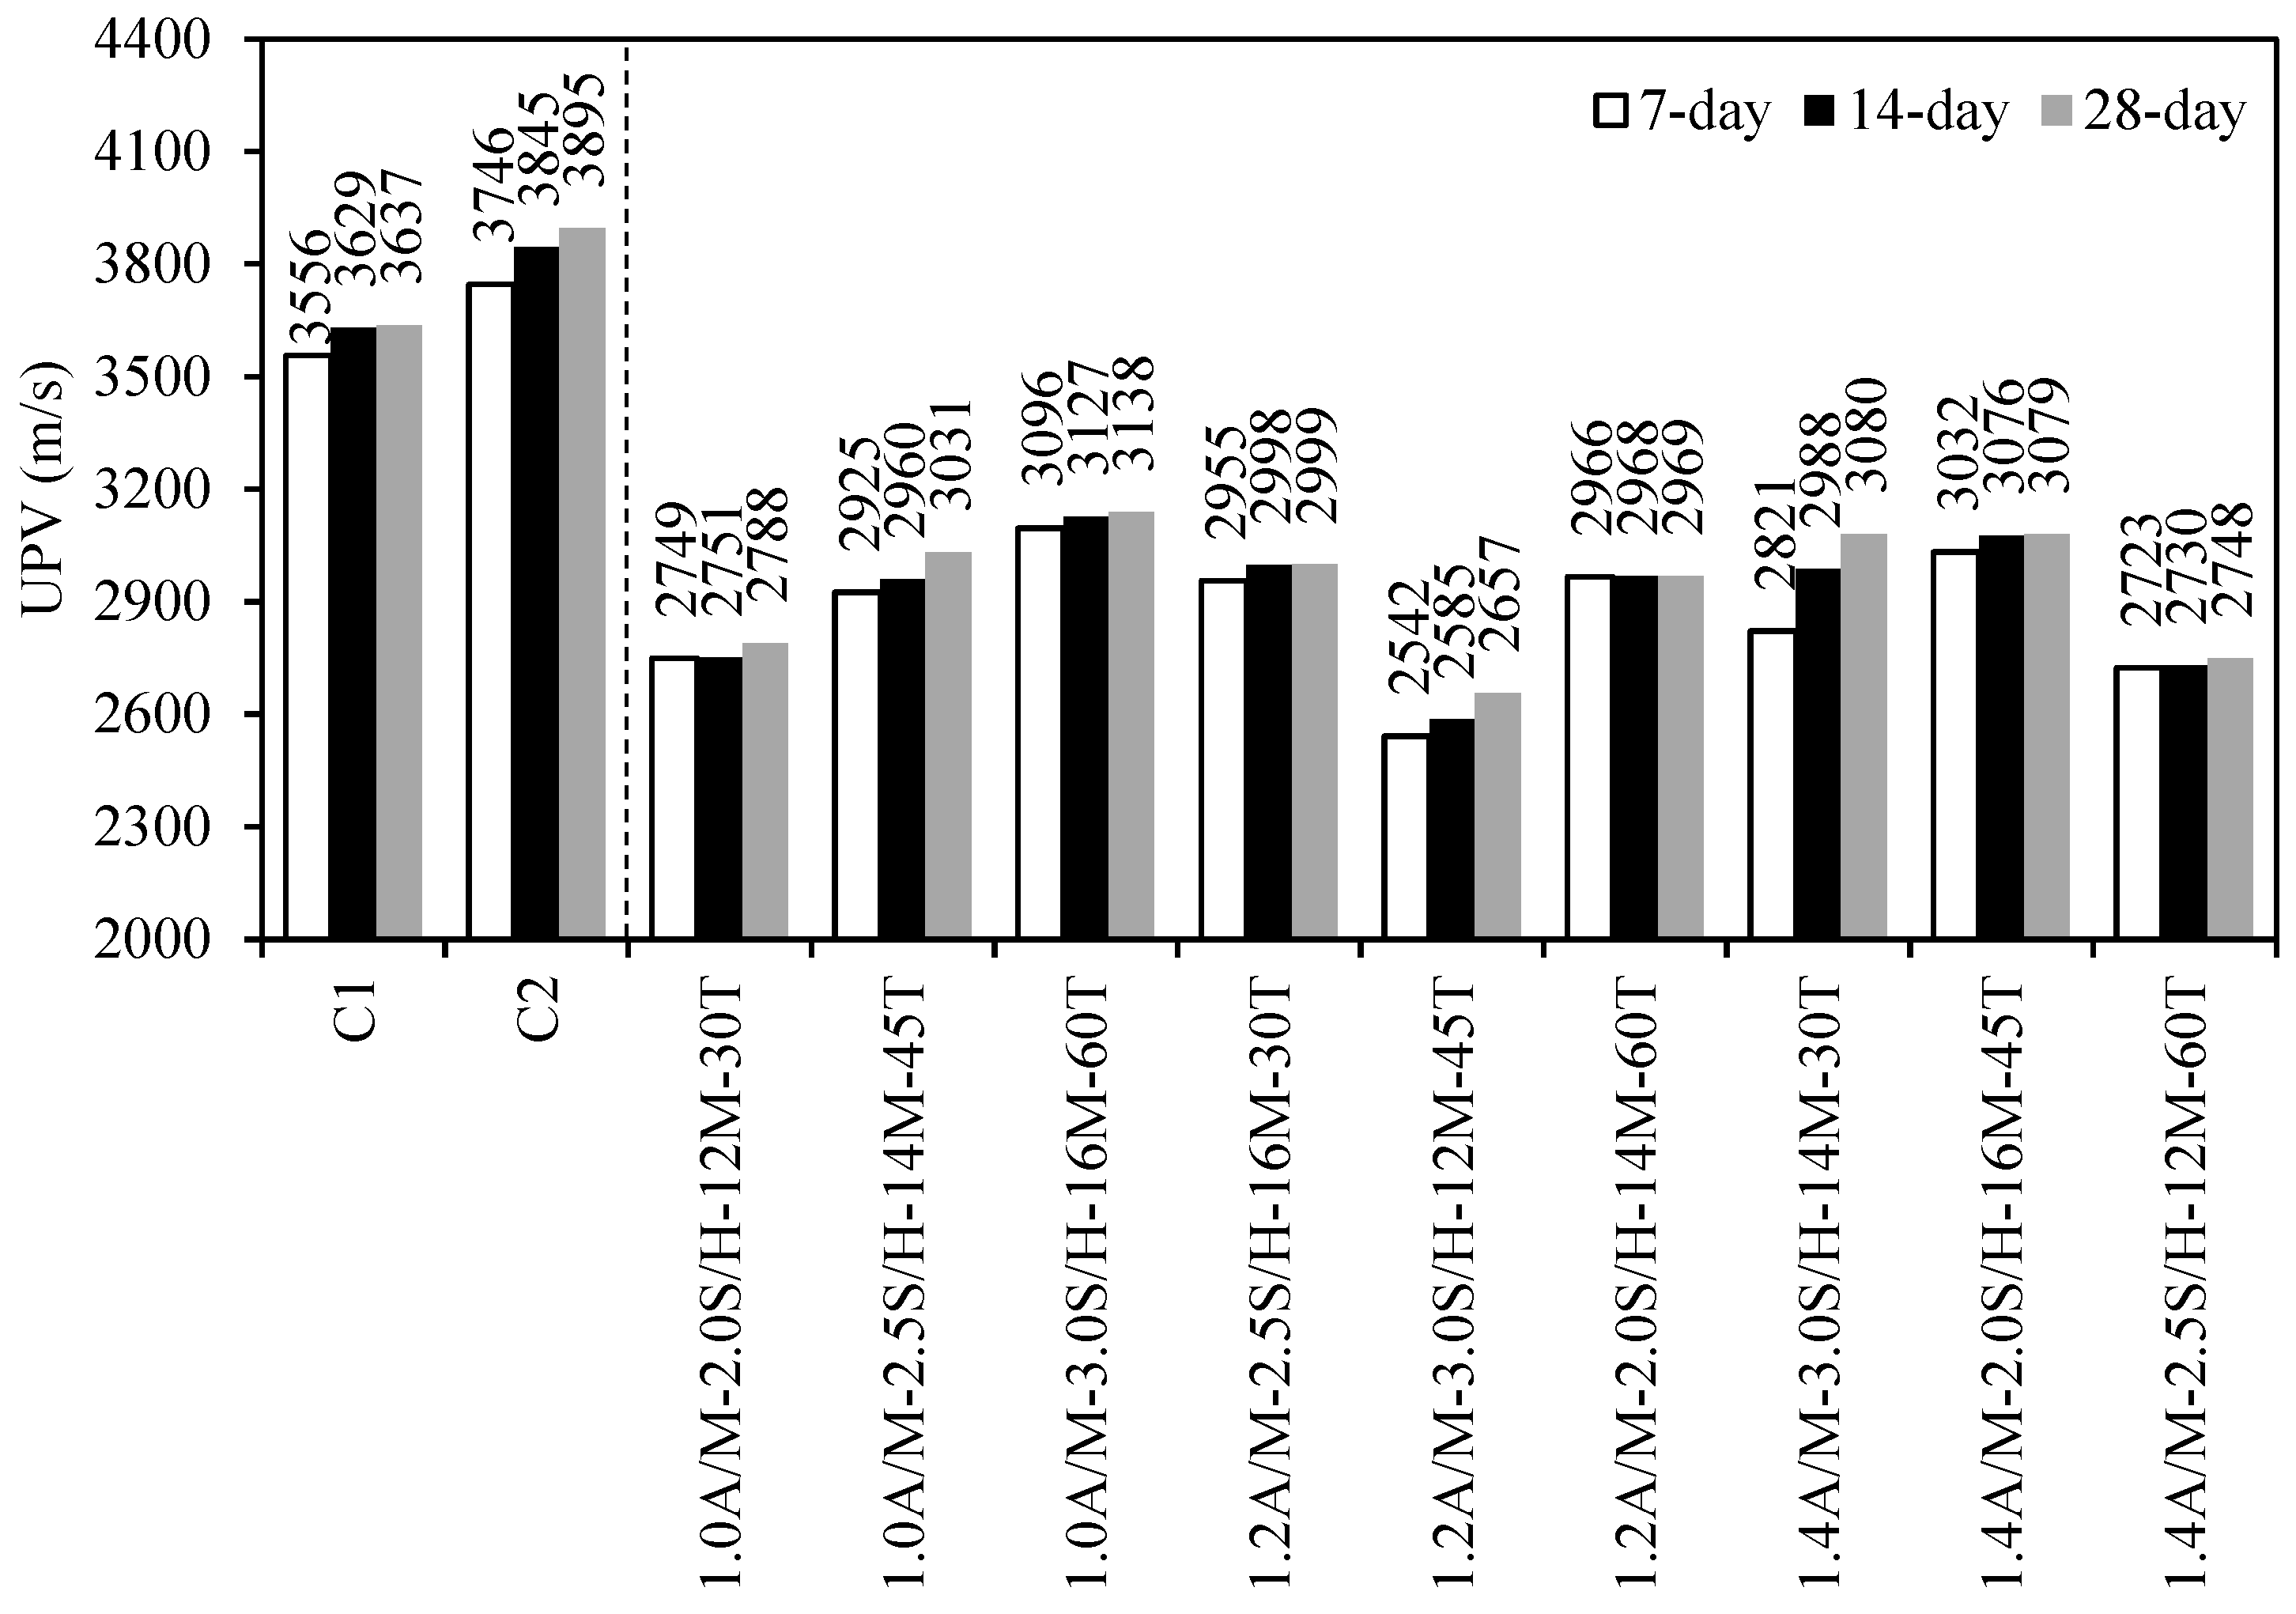
The UPV results determined after 7, 14, and 28 days reveal clear trends that closely align with the development in compressive strength, indicating improved microstructural integrity and densification with time (Figure 8). The cement-based mix recorded the highest UPV values across all ages, reaching 3637 m/s at 28 days, reflecting the denser and well-established hydration products typical of Portland cement systems. For the GP mixtures, the 1.0A/M-3.0S/H-16M-60T mix exhibited the highest UPV at 28 days (3138 m/s), consistent with its superior compressive strength performance.
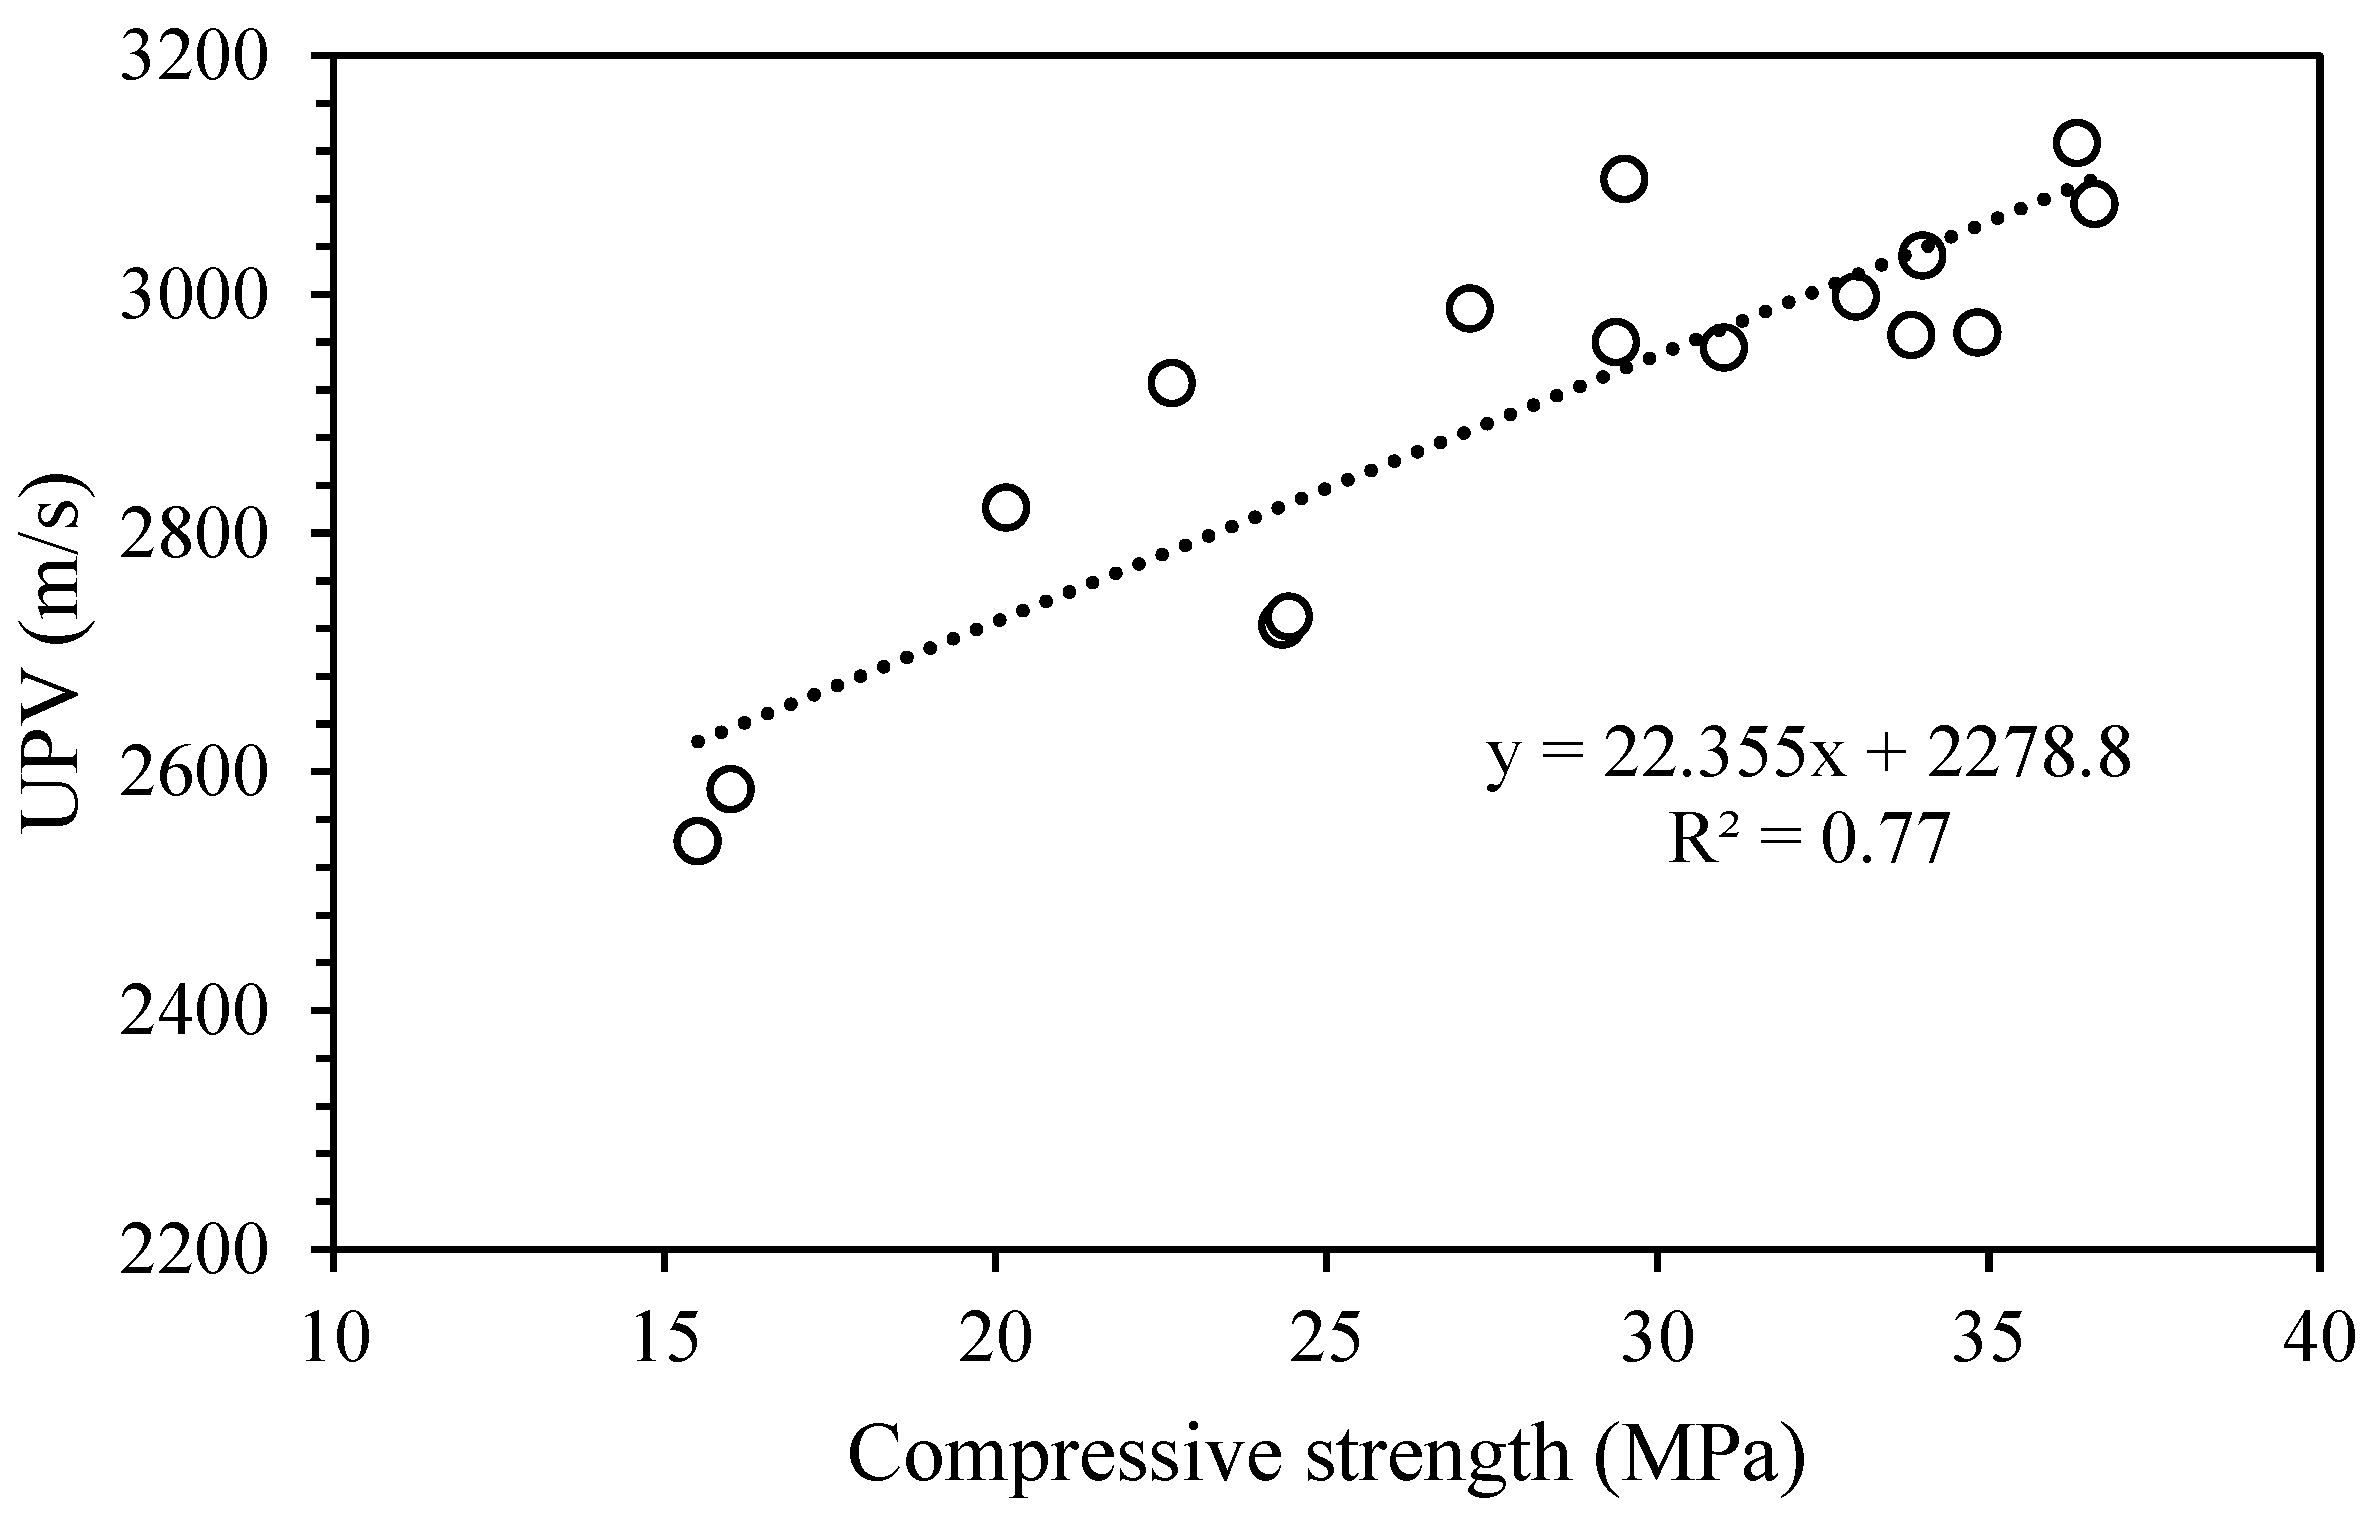
Similarly, 1.4A/M-2.0S/H-16M-45T and 1.0A/M-2.5S/H-14M-45T reached relatively high UPV values of 3079 m/s and 3031 m/s, respectively, corroborating the effectiveness of high SH molarity (14–16 M) and elevated curing temperatures (45–60 °C) in promoting compact and homogenous GP matrices [44,45]. Conversely, the 1.2A/M-3.0S/H-12M-45T and 1.4A/M-2.5S/H-12M-60T mixtures showed lower UPV values (2657 m/s and 2748 m/s, respectively at 28 days), indicating a more porous internal structure, again aligning with their lower compressive strengths. The limited development in UPV suggests insufficient geopolymerization, likely due to lower molarity or unfavorable A/M and S/H ratios [40]. It is worth highlighting that GP mixes consistently exhibited lower UPV readings compared with cement-based mortars, even in cases where compressive strengths were nearly identical. This can be explained by their relatively higher porosity, microcracking, and the presence of unreacted precursors, which decrease stiffness and disrupt ultrasonic wave propagation. Comparable findings were presented by Farhan et al., who reported 28-day UPV values of 3.52, 3.31, and 3.20 km/s for OPC-35, AAS-35, and FAGP-35, respectively, despite compressive strengths of 35.82, 36.44, and 35.91 MPa [43]. Additionally, UPV evolution over time was generally modest but positive for most GP mixes, with the most notable increases occurring between 7 and 28 days in high-performing mixes such as 1.4A/M-3.0S/H-14M-30T (from 2821 to 3080 m/s) and 1.0A/M-2.5S/H-14M-45T (from 2925 to 3031 m/s), reflecting progressive matrix densification. A moderate correlation was found between UPV and compressive strength (Figure 9), enabling prediction of compressive strength with an R2 value of 0.77.

4. Optimization of GP Mixtures

4.1. Taguchi Approach

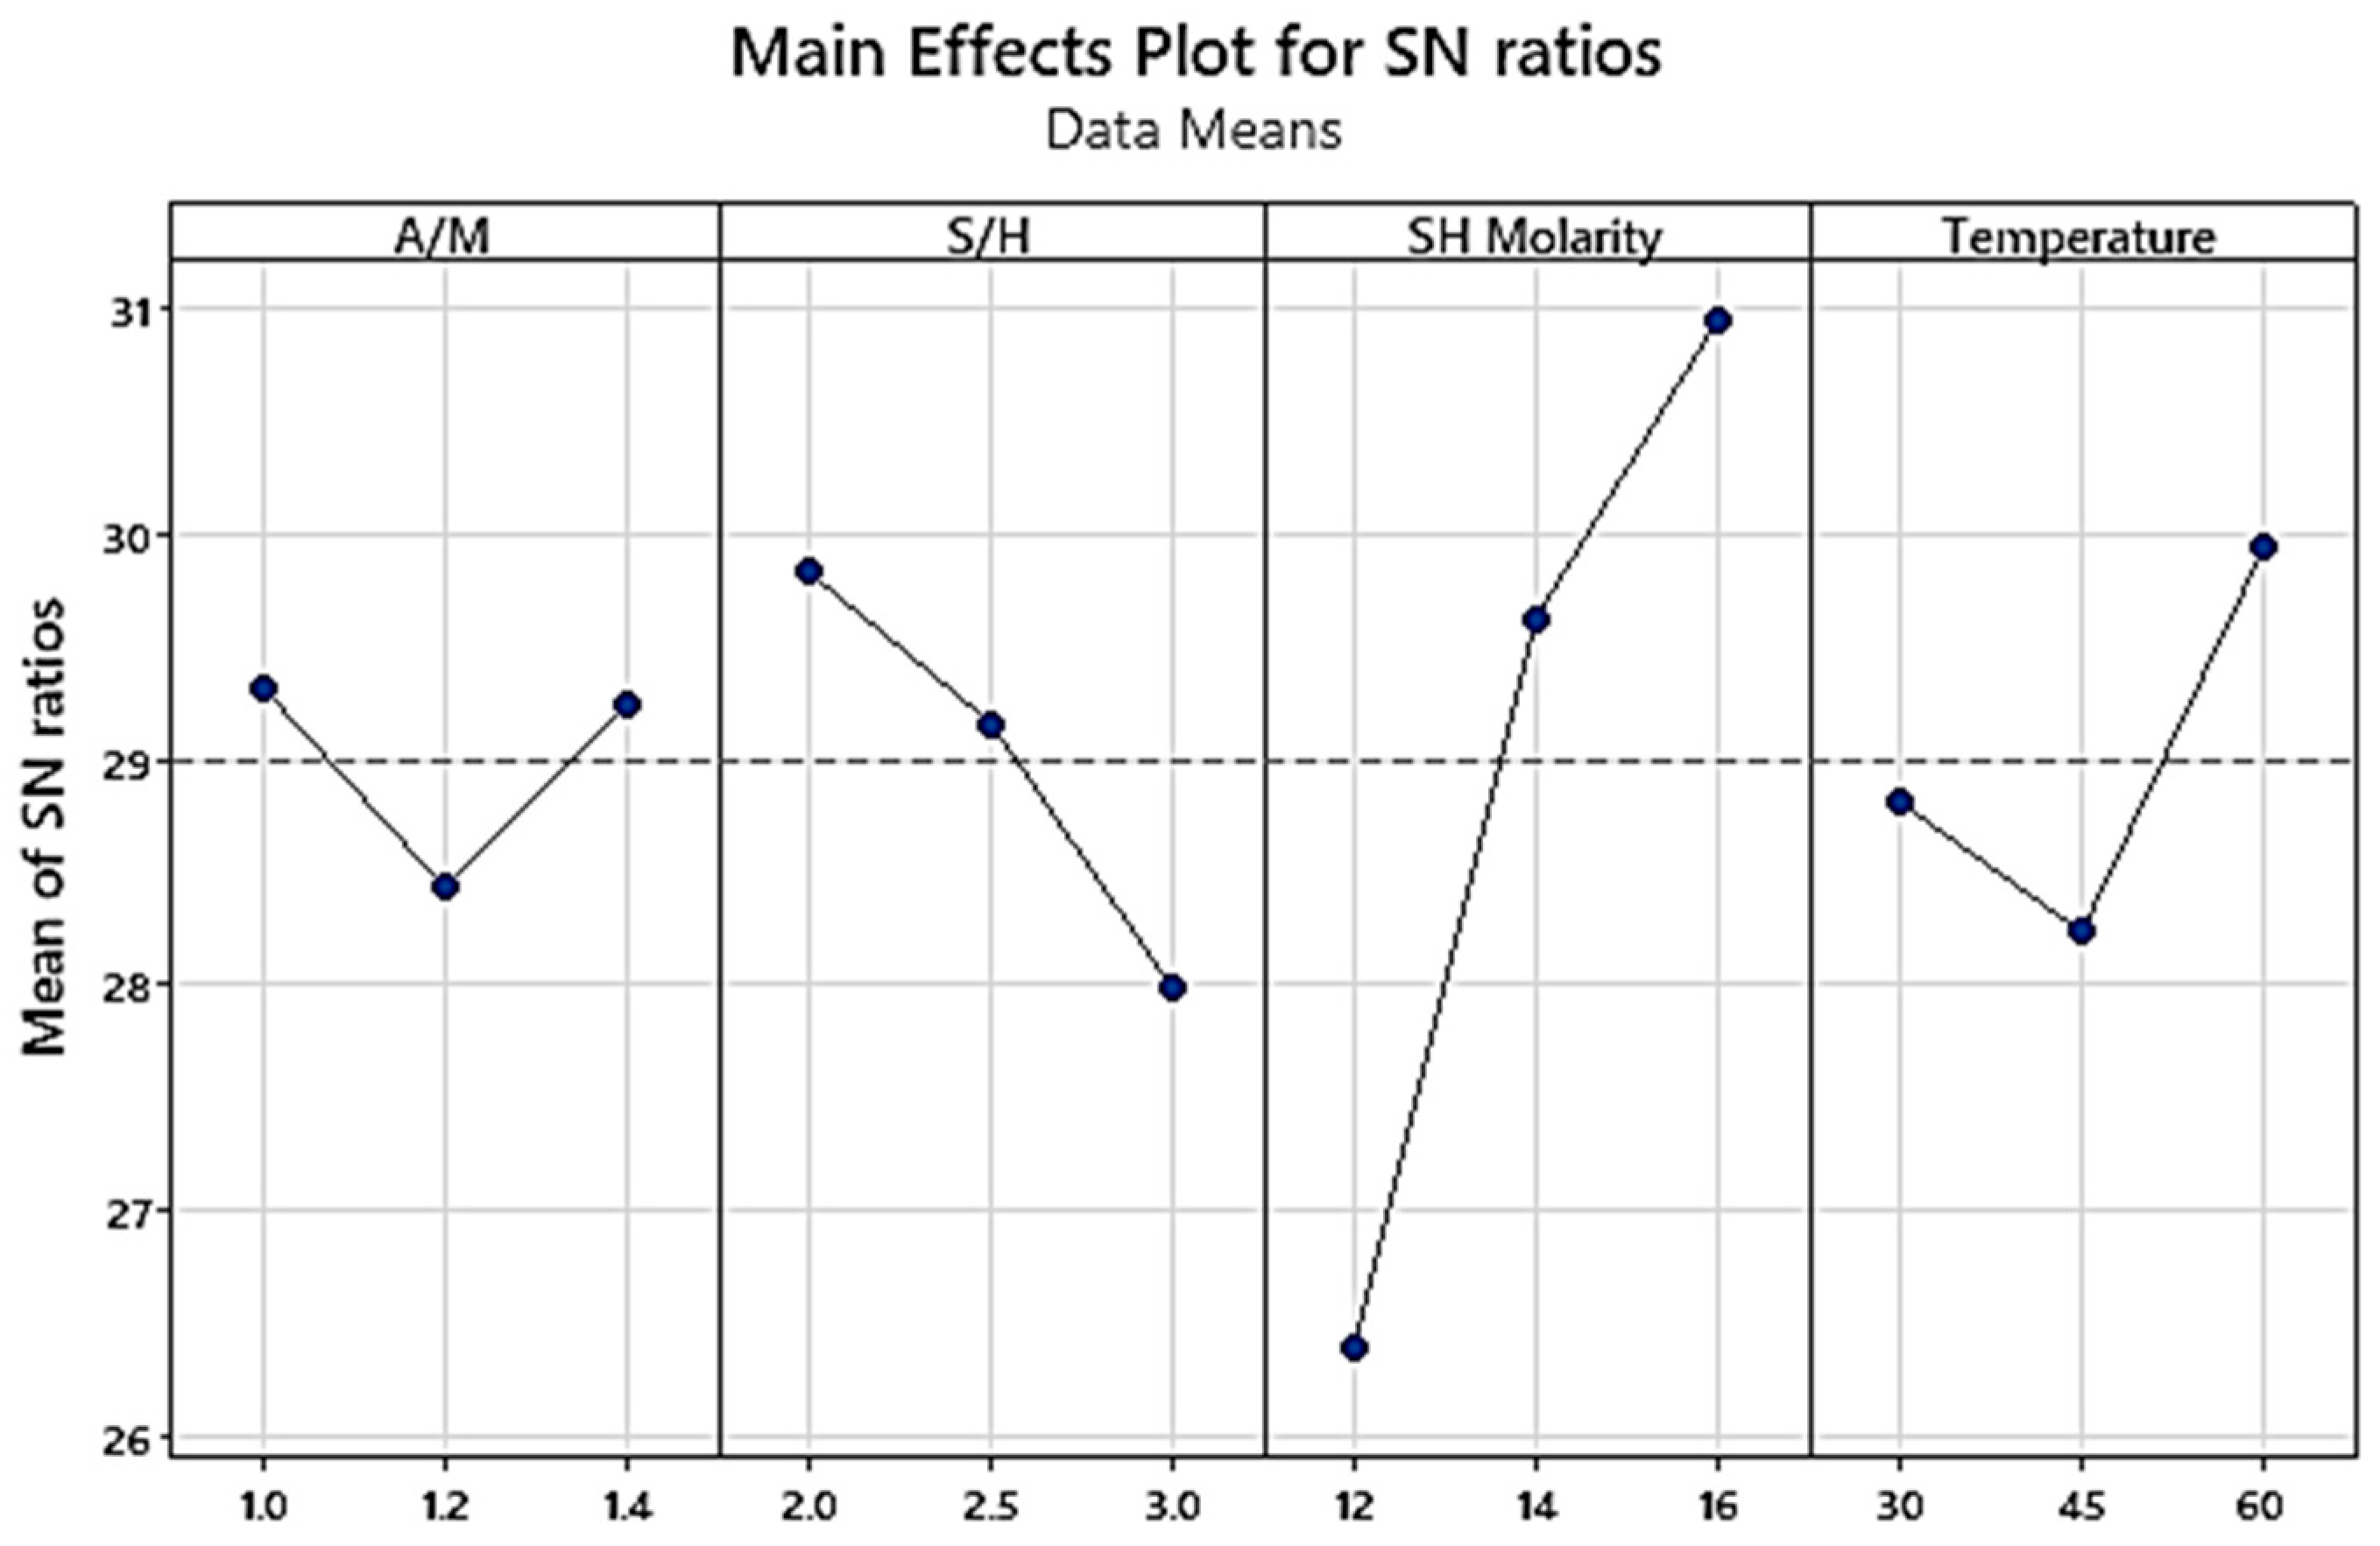
The Taguchi design method was applied to optimize the mechanical properties of MK-based GP mortars. Since compressive, flexural, and tensile strengths are interrelated, the identified optimal mix will be reproduced and tested using the slant shear method. According to the Taguchi results, the optimal mix for achieving the highest compressive and flexural strengths comprises an A/M ratio of 1.4, SS/SH 2.0, 16 M SH molarity, and curing at 60 °C, as shown in Figure 10. These parameters ensure a robust GP network by delivering adequate aluminosilicate content, a strong alkaline medium for dissolution, and a silicate balance that enhances reaction kinetics without hindering matrix development.

4.2. Analysis of Variance

The contribution of each mixture parameter to key performance indicators was evaluated using analysis of variance (ANOVA) at 95% confidence level to better understand their impact on fresh and hardened properties of MK-based GP mortars. The detailed calculations for the contribution factor values can be found elsewhere [46]. As shown in Table 5, SH molarity emerged as the most influential factor across all hardened properties, with contribution rates of 74.6%, 76.3%, and 89.8% for compressive strength, splitting tensile strength, and UPV, respectively. This dominance reflects the central role of alkaline activation in enhancing geopolymerization, promoting aluminosilicate dissolution, and forming a denser, stronger matrix. Such findings are in strong agreement with the experimental results previously discussed. In contrast, flowability was governed primarily by the A/M ratio, with an overwhelming contribution of 87.0%, indicating that the liquid-to-solid ratio is the key factor influencing fresh mix workability. The remaining factors, including SH molarity and curing temperature, had minimal effects on flow (11.1% and 1.8%, respectively), while the S/H ratio had an almost negligible influence (0.1%). This highlights that flow behavior is predominantly controlled by mix water availability rather than by chemical reactivity.
For flexural strength, the results showed a more distributed influence. While SH molarity still made the highest contribution (51.7%), curing temperature also played a significant role (27.2%), followed by the S/H ratio (14.9%). These results suggest that both chemical activation and thermal curing are critical for enhancing tensile-related performance, likely by improving the interfacial transition zones and reducing microcracks. Conversely, the A/M ratio consistently exhibited the lowest contribution across hardened properties, with values ranging from 0.9% to 6.3%, indicating its limited role compared to the dominant effect of SH molarity and, in some cases, curing temperature. Notably, its highest impact was on UPV (6.3%), reflecting a minor influence on matrix compactness.

4.3. Validation of the Optimum Mix—Bond Strength Testing

An additional experimental investigation was conducted to confirm the effectiveness of the optimum mix. Table 6 summarizes the hardened properties of this mix in comparison with G3 (1.0A/M-3.0S/H-16M-60T) and G5 (1.2A/M-3.0S/H-12M-45T), which represent the highest and lowest responses among the MK-based GP mixtures, and the control mixture C2, produced using only cement. The optimized mix was prepared using an A/M ratio of 1.4, an S/H ratio of 2, an SH molarity of 16, and a curing temperature of 60 °C. It can be observed that the compressive strength values of 39.9 MPa and 41.0 MPa were achieved at 7 and 14 days, respectively. These values are approximately twice as high as those recorded for the C2 mix, which reached 19.7 MPa and 22.2 MPa at the corresponding testing ages. Conversely, the flexural strength of the optimized mix at 14 days was 10.8 MPa, which is significantly higher than that of the C2 mix (7.3 MPa) and greatly outperforms the lowest-performing GP mix (G5), which exhibited only 5.0 MPa. Similarly, the split tensile strength at 14 days reached 10.0 MPa, reflecting a notable increase over the C2 mix, which recorded 7.4 MPa, and more than double that of G5, which reached only 4.1 MPa. These results highlight the superior tensile and flexural strength behavior of the optimized GP mix compared to the conventional cement-based mixture [47]. As for the UPV responses, the optimized mix achieved values of 2994 m/s at 7 days and 3026 m/s at 14 days. Although these values are lower than those of the C2 mix, which reached 3746 m/s and 3845 m/s, respectively, they still reflect good internal material integrity [48,49]. Nevertheless, three replicates for each bond length group to ensure the reliability of our data were used. The average value of the three replicates was retained. A modified slant shear test with reduced bond contact area was adopted to specifically induce adhesive failure at the interface, rather than a cohesive failure within one of the materials (monolithic failure). This was achieved by intentionally reducing the contact area between the two materials using a tape, which effectively concentrated the shear stress at the reduced interface. This approach ensured that the failure is interfacial rather than monolithic, allowing for a more accurate assessment of the bond strength at the interface [13,50].
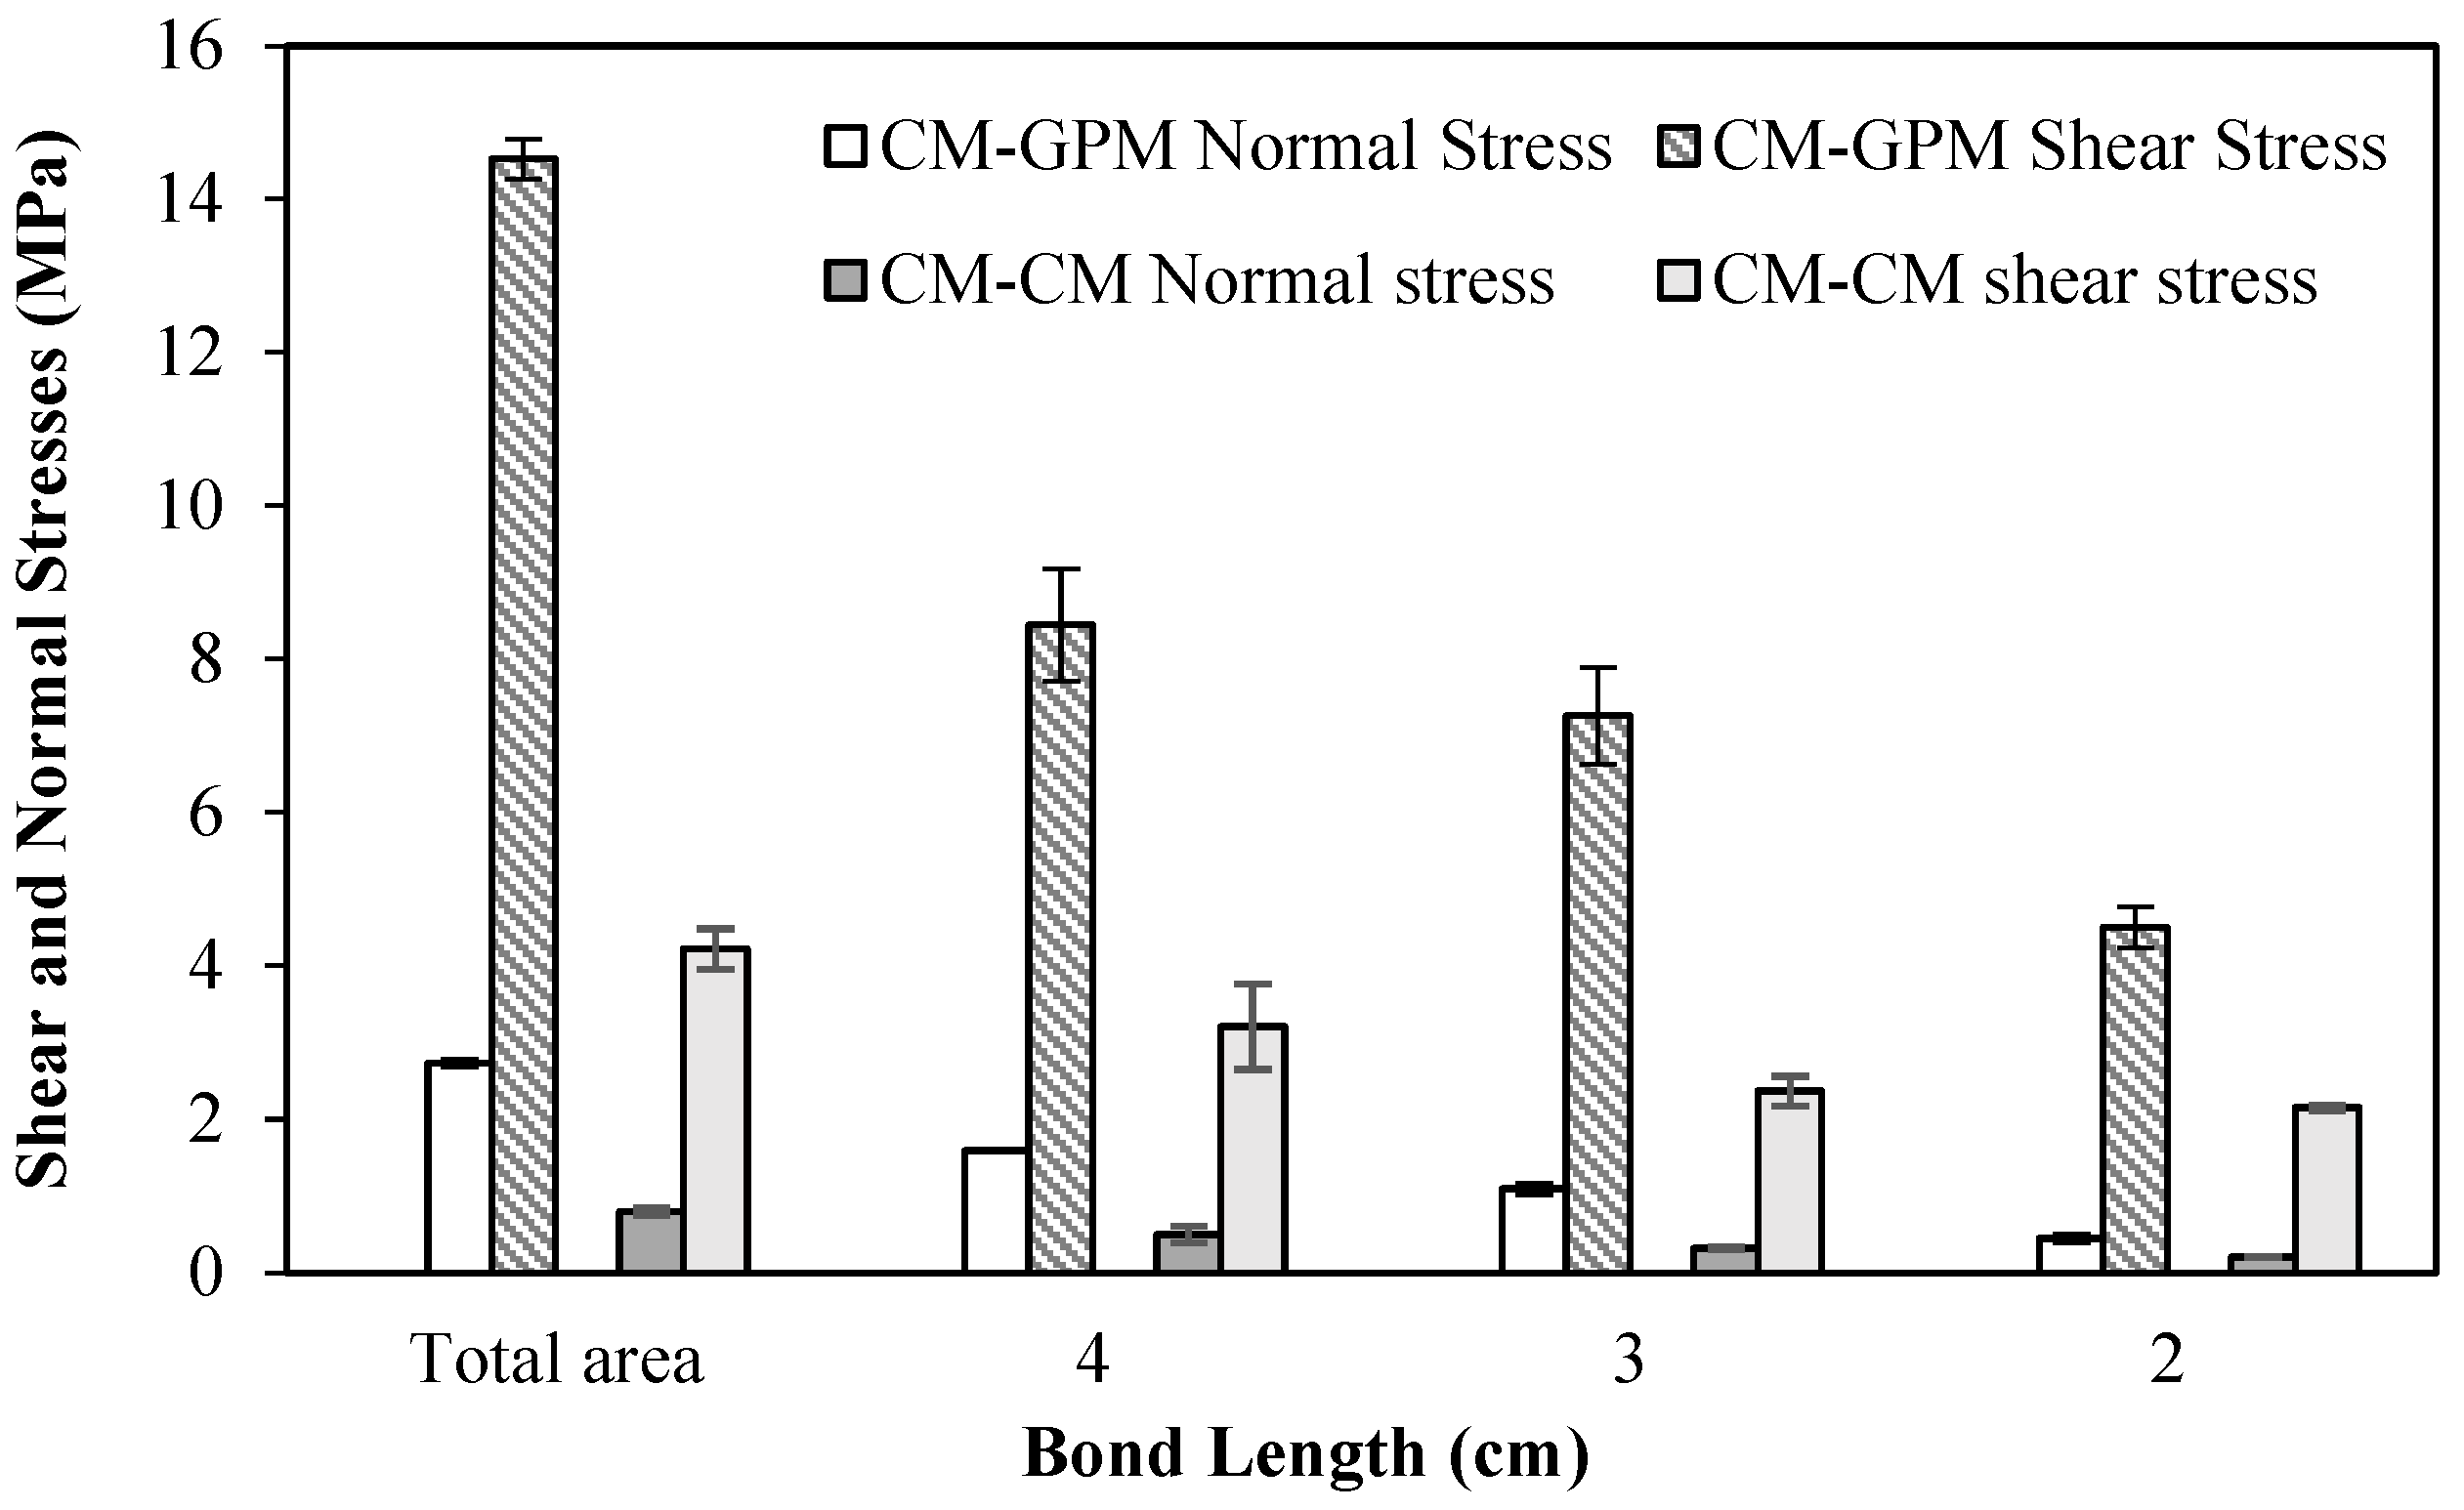
Figure 11 presents the normal and shear stress results for a smooth surface substrate with varying bond lengths, comparing the bonds among cement to cement mortars (CM-CM) and cement to geopolymer mortars (CM-GPM), where the geopolymer (GPM) represents the optimum mix. The initial cement mortar layer was cured for 28 days before the second mortar layer was added, which then underwent an additional 14 days of curing prior to testing.
The bond between CM-GPM specimens was observed to have higher shear and normal stresses compared to the CM-CM bond. For both CM-CM and CM-GPM specimens bonded across the full inclined surface, the failure mode was predominantly compressive and occurred along the vertical plane, so no failure was observed at the bonded interface, as shown in Figure 12. However, when the bonded length was reduced, bond failure did occur in both specimen types, as shown in Figure 11. This condition provides a more effective basis for comparing bond strength.
The outstanding bond strength between cement mortar and metakaolin-based geopolymer (GP) mortar is primarily due to the specific characteristics of GP materials. The geopolymerization process forms a durable, three-dimensional silicate network that enables a robust bond with the cement mortar. The shear bond strength was evaluated after 28 days, with values ranging from 21 to 31 MPa. These measurements were taken at a 45° angle across the entire inclined surface and are based on the average of three samples. These results indicate a strong bond between the GP mortar and the cementitious substrate and are consistent with the findings of this research.

5. Conclusions

This study investigates the impact of key mix parameters on the fresh and hardened properties of metakaolin (MK)-based geopolymer (GP) mortars in comparison with conventional cement-based mortars. The Taguchi design approach was applied to develop the experimental framework, and subsequent analysis identified the optimal mix formulation. Based on the findings, the following conclusions can be drawn:
This study examines the influence of key mix design parameters on the fresh and hardened properties of metakaolin (MK)-based geopolymer mortars in comparison with conventional cement-based mortars. The experimental framework was developed using the Taguchi design method, considering the alkaline activator-to-MK ratio (A/M), the sodium silicate-to-sodium hydroxide ratio (S/H), sodium hydroxide (SH) molarity, and curing temperature. Based on the findings, the following conclusions can be drawn:
  • The flowability of the GP mixtures was found to increase with a higher alkaline activator-to-metakaolin ratio (A/M). ANOVA analysis confirmed that A/M had the most pronounced effect on workability, whereas the impact of other parameters was statistically insignificant.
  • The compressive strength of MK-based geopolymer mortars surpassed 30 MPa when the A/M ratio, S/H ratio, SH molarity, and curing temperature were within the ranges of 1.0–1.4, 2.0–3.0, 14–16 M, and 45–60 °C, respectively. These conditions demonstrate the suitability of such combinations for targeted repair applications, particularly when compared to conventional cement-based mortars.
  • The results for flexural strength, splitting tensile strength, and ultrasonic pulse velocity (UPV) aligned with those of compressive strength. Mixtures produced with higher A/M ratios and elevated curing temperatures exhibited enhanced performance, likely due to a more compact and refined matrix structure.
  • The ANOVA results confirmed that A/M ratio and SH molarity were the most significant parameters affecting the mechanical behavior of the GP mixtures. Conversely, the SS/SH ratio and curing temperature showed comparatively lower influence on strength development within the tested range.
  • The Taguchi method revealed that a GP mix with an A/M ratio of 1.4, SS/SH ratio of 2, sodium hydroxide molarity of 16, and a curing temperature of 60 °C delivered optimal performance. This optimized mix achieved compressive strengths of 39.9 MPa at 7 days and 41.0 MPa at 14 days, matching the strength levels of the cement-based reference mortar, even though it contained less binder (377–427 kg/m3 for the geopolymer compared to 464 kg/m3 for cement).
  • GP mortars demonstrated superior bond strength compared to traditional cement-based composites. This can be attributed to the enhanced chemical bonding and denser matrix provided by the geopolymer structure, which improves the interfacial adhesion between layers or substrates.

Author Contributions

Conceptualization, A.E.-M. and M.E.E.D.; methodology, A.E.-M. and M.E.E.D.; software, L.H. and A.E.-M.; formal analysis, J.K., D.N., J.A., A.E. and M.E.E.D.; investigation, L.H. and M.E.E.D.; resources, A.E.-M., J.K., J.A. and A.E.; data curation, L.H.; writing—original draft preparation, L.H., A.E.-M. and M.E.E.D.; writing—review and editing, J.K., D.N., J.A. and A.E.; visualization, L.H., A.E.-M. and D.N.; supervision, J.K. All authors have read and agreed to the published version of the manuscript.

Funding

This research received no external funding.

Data Availability Statement

The raw data supporting the conclusions of this article will be made available by the authors on request.

Conflicts of Interest

The authors declare no conflict of interest.

References

  1. Pérez-Lombard, L.; Ortiz, J.; Pout, C. A review on buildings energy consumption information. Energy Build. 2007, 40, 394–398. [Google Scholar] [CrossRef]
  2. Antunes, M.; Santos, R.L.; Pereira, J.; Rocha, P.; Horta, R.B.; Colaço, R. Alternative Clinker Technologies for reducing carbon emissions in cement industry: A Critical review. Materials 2021, 15, 209. [Google Scholar] [CrossRef]
  3. Nasser Eddine, Z.; Barraj, F.; Khatib, J.; Elkordi, A. From Waste to Resource: Utilizing Municipal Solid Waste Incineration Bottom Ash and Recycled Rubber in Pervious Concrete Pavement. Innov. Infrastruct. Solut. 2023, 8, 319. [Google Scholar] [CrossRef]
  4. El Mir, A.; Nehme, S.G. Effect of Air Entraining Admixture on the Properties of Self-Compacting Concrete Incorporating Supplementary Cementitious Materials. Pollack Period. 2017, 12, 85–98. [Google Scholar] [CrossRef]
  5. Barraj, F.; Jahami, A.; Hatoum, A.; Ghanoum, M. 3—Geopolymers and Alkali-Activated Materials in Pervious Concrete. In Woodhead Publishing Series in Civil and Structural Engineering; El-Hassan, H., Hamouda, M., Eds.; Woodhead Publishing: Cambridge, UK, 2025; pp. 35–75. ISBN 978-0-443-21704-3. [Google Scholar]
  6. Altameemi, S.; Adeleke, B.O.; Kinuthia, J.M.; Oti, J. Understanding the Effect of Waiting for the Dissolution of Sodium Hydroxide in Geopolymer Concrete Mixes. Materials 2025, 18, 849. [Google Scholar] [CrossRef]
  7. Duxson, P.; Fernández-Jiménez, A.; Provis, J.L.; Lukey, G.C.; Palomo, A.; Van Deventer, J.S.J. Geopolymer technology: The current state of the art. J. Mater. Sci. 2006, 42, 2917–2933. [Google Scholar] [CrossRef]
  8. Skane, R.; Schneider, P.A.; Jones, F.; van Riessen, A.; Jamieson, E.; Sun, X.; Rickard, W.D. Predicting the Stability of Geopolymer Activator Solutions for Optimised Synthesis through Thermodynamic Modelling. Chem. Eng. J. 2025, 515, 163543. [Google Scholar] [CrossRef]
  9. Albidah, A.; Alghannam, M.; Abbas, H.; Almusallam, T.; Al-Salloum, Y. Characteristics of metakaolin-based geopolymer concrete for different mix design parameters. J. Mater. Res. Technol. 2020, 10, 84–98. [Google Scholar] [CrossRef]
  10. Shilar, F.A.; Ganachari, S.V.; Patil, V.B.; Khan, T.M.Y.; Javed, S.; Baig, R.U. Optimization of alkaline activator on the strength properties of geopolymer concrete. Polymers 2022, 14, 2434. [Google Scholar] [CrossRef] [PubMed]
  11. Dandachy, M.E.E.; Hassoun, L.; El-Mir, A.; Khatib, J.M. Effect of elevated temperatures on compressive strength, ultrasonic pulse velocity, and transfer properties of Metakaolin-Based geopolymer mortars. Buildings 2024, 14, 2126. [Google Scholar] [CrossRef]
  12. Mahendra, K.; Narasimhan, M.C. One part alkali-activated materials for construction—A review. Mater. Today Proc. 2023, 93, 182–188. [Google Scholar] [CrossRef]
  13. Hachem, A.A.; Khatib, J.M.; El Dandachy, M.E. Assessment of interfacial mortar-mortar bond and pure shear strength of metakaolin-based geopolymer. Int. J. Build. Pathol. Adapt. 2025, 43, 732–748. [Google Scholar] [CrossRef]
  14. Abadel, A.A.; Albidah, A.S.; Altheeb, A.H.; Alrshoudi, F.A.; Abbas, H.; Al-Salloum, Y.A. Effect of molar ratios on strength, microstructure & embodied energy of metakaolin geopolymer. Adv. Concr. Constr. 2021, 11, 127. [Google Scholar] [CrossRef]
  15. Siciliano, U.C.; Zhao, J.; Trindade, A.C.C.; Liebscher, M.; Mechtcherine, V.; De Andrade Silva, F. Influence of curing temperature and pressure on the mechanical and microstructural development of metakaolin-based geopolymers. Constr. Build. Mater. 2024, 424, 135852. [Google Scholar] [CrossRef]
  16. Nath, P.; Sarker, P.K. Effect of GGBFS on setting, workability and early strength properties of fly ash geopolymer concrete cured in ambient condition. Constr. Build. Mater. 2014, 66, 163–171. [Google Scholar] [CrossRef]
  17. Dave, S.V.; Bhogayata, A.; Arora, N.K. Mix design optimization for fresh, strength and durability properties of ambient cured alkali activated composite by Taguchi method. Constr. Build. Mater. 2021, 284, 122822. [Google Scholar] [CrossRef]
  18. Dai, S.; Wang, H.; An, S.; Yuan, L. Mechanical properties and microstructural characterization of metakaolin geopolymers based on orthogonal tests. Materials 2022, 15, 2957. [Google Scholar] [CrossRef]
  19. Vora, P.R.; Dave, U.V. Parametric studies on compressive strength of geopolymer concrete. Procedia Eng. 2013, 51, 210–219. [Google Scholar] [CrossRef]
  20. Mo, B.; Zhu, H.; Cui, X.; He, Y.; Gong, S. Effect of curing temperature on geopolymerization of metakaolin-based geopolymers. Appl. Clay Sci. 2014, 99, 144–148. [Google Scholar] [CrossRef]
  21. DeSilva, P.; Sagoe-Crenstil, K.; Sirivivatnanon, V. Kinetics of geopolymerization: Role of Al2O3 and SiO2. Cem. Concr. Res. 2007, 37, 512–518. [Google Scholar] [CrossRef]
  22. Rovnaník, P. Effect of curing temperature on the development of hard structure of metakaolin-based geopolymer. Constr. Build. Mater. 2010, 24, 1176–1183. [Google Scholar] [CrossRef]
  23. Khale, D.; Chaudhary, R. Mechanism of geopolymerization and factors influencing its development: A review. J. Mater. Sci. 2007, 42, 729–746. [Google Scholar] [CrossRef]
  24. Perera, D.S.; Uchida, O.; Vance, E.R.; Finnie, K.S. Influence of curing schedule on the integrity of geopolymers. J. Mater. Sci. 2007, 42, 3099–3106. [Google Scholar] [CrossRef]
  25. Provis, J.L.; Van Deventer, J.S. Geopolymerisation kinetics. 1. In situ energy-dispersive X-ray diffractometry. Chem. Eng. Sci. 2007, 62, 2309–2317. [Google Scholar] [CrossRef]
  26. ASTM C33/C33M-18; Standard Specification for Concrete Aggregates. ASTM International: West Conshohocken, PA, USA, 2018. [CrossRef]
  27. Bawab, J.; El-Hassan, H.; El-Dieb, A.; Khatib, J. Effect of Mix Design Parameters on the Properties of Cementitious Composites Incorporating Volcanic Ash and Dune Sand. Dev. Built Environ. 2023, 16, 100258. [Google Scholar] [CrossRef]
  28. Bawab, J.; El-Hassan, H.; El-Dieb, A.; Khatib, J. Synergetic Impact of Volcanic Ash and Calcium Carbide Residue on the Properties and Microstructure of Cementitious Composites. Constr. Build. Mater. 2024, 439, 137390. [Google Scholar] [CrossRef]
  29. El-Mir, A.; Fayad, E.; Assaad, J.J.; El-Hassan, H. Multi-Response Optimization of Semi-Lightweight Concrete Incorporating Expanded Polystyrene Beads. Sustainability 2023, 15, 8757. [Google Scholar] [CrossRef]
  30. El-Mir, A.; Fayad, T.; Assaad, J.J.; El Dandachy, M.E.; Khatib, J.; El-Hassan, H. Multi-Criteria Optimization of SBR-Modified Mortar Incorporating Polyethylene Terephthalate Waste. Case Stud. Constr. Mater. 2024, 20, e03295. [Google Scholar] [CrossRef]
  31. ASTM C1437-20; Standard Test Method for Flow of Hydraulic Cement Mortar. ASTM International: West Conshohocken, PA, USA, 2020. [CrossRef]
  32. ASTM C109/C109M-21; Standard Test Method for Compressive Strength of Hydraulic Cement Mortars (Using 2-in. or [50-mm] Cube Specimens). ASTM International: West Conshohocken, PA, USA, 2021. [CrossRef]
  33. ASTM C293/C293M-16; Standard Test Method for Flexural Strength of Concrete (Using Simple Beam with Center-Point Loading). ASTM International: West Conshohocken, PA, USA, 2016. [CrossRef]
  34. ASTM C496/C496M-17; Standard Test Method for Splitting Tensile Strength of Cylindrical Concrete Specimens. ASTM International: West Conshohocken, PA, USA, 2017. [CrossRef]
  35. ASTM C597-16; Standard Test Method for Pulse Velocity Through Concrete. ASTM International: West Conshohocken, PA, USA, 2016. [CrossRef]
  36. Momayez, A.; Ehsani, M.R.; Ramezanianpour, A.A.; Rajaie, H. Comparison of Methods for Evaluating Bond Strength between Concrete Substrate and Repair Materials. Cem. Concr. Res. 2005, 35, 748–757. [Google Scholar] [CrossRef]
  37. Muñoz, M.A.C.; Harris, D.K.; Ahlborn, T.M.; Froster, D.C. Bond Performance between Ultrahigh-Performance Concrete and Normal-Strength Concrete. J. Mater. Civ. Eng. 2014, 26, 4014031. [Google Scholar] [CrossRef]
  38. El-Hassan, H.; El-Mir, A.; El-Maaddawy, T. 7—The Effect of Curing Regimes on Fiber-Reinforced Alkali-Activated Composites; Çevik, A., Niş, A., Eds.; Elsevier: Amsterdam, The Netherlands, 2023; pp. 161–189. ISBN 978-0-443-15301-3. [Google Scholar]
  39. Najm, O.; El-Hassan, H.; El-Dieb, A. Optimization of Alkali-Activated Ladle Slag Composites Mix Design Using Taguchi-Based TOPSIS Method. Constr. Build. Mater. 2022, 327, 126946. [Google Scholar] [CrossRef]
  40. Najm, O.; El-Hassan, H.; El-Dieb, A. Optimization of Alkali-Activated Ladle Slag-Fly Ash Composites Using a Taguchi-TOPSIS Hybrid Algorithm. Clean. Eng. Technol. 2024, 23, 100836. [Google Scholar] [CrossRef]
  41. Hwalla, J.; El-Hassan, H.; El-Mir, A.; Assaad, J.J.; El-Maaddawy, T. Development of Geopolymer and Cement-Based Shotcrete Mortar: Impact of Mix Design Parameters and Spraying Process. Constr. Build. Mater. 2024, 449, 138457. [Google Scholar] [CrossRef]
  42. Hwalla, J.; El-Mir, A.; El-Hassan, H.; El-Dieb, A. Taguchi Method for Optimizing Alkali-Activated Mortar Mixtures Using Waste Perlite Powder and Granulated Blast Furnace Slag BT—International RILEM Conference on Synergising Expertise towards Sustainability and Robustness of Cement-Based Materials and Concrete Structures; Jędrzejewska, A., Kanavaris, F., Azenha, M., Benboudjema, F., Schlicke, D., Eds.; Springer Nature Switzerland: Cham, Switzerland, 2023; pp. 362–373. [Google Scholar]
  43. Farhan, N.A.; Sheikh, M.N.; Hadi, M.N.S. Investigation of Engineering Properties of Normal and High Strength Fly Ash Based Geopolymer and Alkali-Activated Slag Concrete Compared to Ordinary Portland Cement Concrete. Constr. Build. Mater. 2019, 196, 26–42. [Google Scholar] [CrossRef]
  44. Fang, G.; Ho, W.K.; Tu, W.; Zhang, M. Workability and Mechanical Properties of Alkali-Activated Fly Ash-Slag Concrete Cured at Ambient Temperature. Constr. Build. Mater. 2018, 172, 476–487. [Google Scholar] [CrossRef]
  45. Dehnavi, A.; Rajabi, M.; Bavarsiha, F. The effect of temperature, time of curing and Na2O/SiO2 molar ratio on mechanical and chemical properties of geopolymer cement. Metall. Mater. Eng. 2020, 27, 213–226. [Google Scholar] [CrossRef]
  46. El-Mir, A.; Tannouri, P.; Assaad, J.J.; Nasr, D.; Ghannoum, M.; Barraj, F.; El-Hassan, H. Performance Optimization of SBR-Modified Pervious Composite Incorporating Recycled Concrete Aggregates. J. Compos. Sci. 2025, 9, 372. [Google Scholar] [CrossRef]
  47. Duxson, P.; Mallicoat, S.; Lukey, G.; Kriven, W.; Van Deventer, J. The effect of alkali and Si/Al ratio on the development of mechanical properties of metakaolin-based geopolymers. Colloids Surf. A Physicochem. Eng. Asp. 2006, 292, 8–20. [Google Scholar] [CrossRef]
  48. Abbas, R.; Khereby, M.A.; Ghorab, H.Y.; Elkhoshkhany, N. Preparation of geopolymer concrete using Egyptian kaolin clay and the study of its environmental effects and economic cost. Clean Technol. Environ. Policy 2020, 22, 669–687. [Google Scholar] [CrossRef]
  49. Enoh, M.K.E.; Ushie, D.O. Effect of sodium silicate to hydroxide ratio and sodium hydroxide Concentration on the Physico-Mechanical Properties of Geopolymer Binders. East Afr. J. Eng. 2023, 6, 113–121. [Google Scholar] [CrossRef]
  50. van Tonder, P. Tensile and Shear Response of Concrete with Nano-Materials. Steps Civil Constr. Environ. Eng. 2024, 2, 1–6. [Google Scholar] [CrossRef]
Figure 1. Particle size analysis of fine aggregates.
Jcs 09 00527 g001
Figure 2. Photos of (a) compressive, (b) flexural, (c) split tensile, and (d) UPV tests.
Jcs 09 00527 g002
Figure 3. Bond strength samples of CM-GPM and CM-CM with varying bonded lengths: (a) full area, (b) 4 cm, (c) 3 cm, and (d) 2 cm.
Jcs 09 00527 g003
Figure 4. Flow responses for MK-based GP and cement mortars (ask about temperature and flowability, 30, 45, 60).
Jcs 09 00527 g004
Figure 5. Compressive strength for MK-based GP and cement mortars at 28 days.
Jcs 09 00527 g005
Figure 6. (a) Flexural and (b) splitting tensile strengths for mortars.
Jcs 09 00527 g006
Figure 7. Relationships between the flexural and compressive strength response.
Jcs 09 00527 g007
Figure 8. Ultrasonic pulse velocity for MK-based GP and cement-based mortars.
Jcs 09 00527 g008
Figure 9. Relationships between the UPV and compressive strength response.
Jcs 09 00527 g009
Figure 10. Effect of control parameters on the mean S/N ratio of compressive strength.
Jcs 09 00527 g010
Figure 11. Bond Strength Performance of CM-GPM and CM-CM based on varying bond lengths.
Jcs 09 00527 g011
Figure 12. Failure Mode of CM-CM and CM-GPM specimens bonded across full inclined surface.
Jcs 09 00527 g012
Table 1. Compositional analysis of cement and metakaolin.
Al2O3NaOHSiO2Na2OK2OFe2O3TiO2MgOCaOLOIDensity
Cement4.3-21.40.52-3.1-2.762.91.843.15
MK38.5-58.7-0.850.720.50.380.21.672.6
Table 2. Designated Factors and Their Levels for Optimizing GP Mortar.
Parameters, P Levels
123
P1: A/M, by mass11.21.4
P2: S/H, by mass22.53
P3: SH molarity121416
P4: Curing temperature304560
Table 3. Taguchi mix design ratio.
Mix IDMix Codification *A/MS/HSH MolarityTemperature (°C)
G11.0A/M-2.0S/H-12M-30T121230
G21.0A/M-2.5S/H-14M-45T12.51445
G31.0A/M-3.0S/H-16M-60T131660
G41.2A/M-2.5S/H-16M-30T1.22.51630
G51.2A/M-3.0S/H-12M-45T1.231245
G61.2A/M-2.0S/H-14M-60T1.221460
G71.4A/M-3.0S/H-14M-30T1.431430
G81.4A/M-2.0S/H-16M-45T1.421645
G91.4A/M-2.5S/H-12M-60T1.42.51260
* A/M-SS/SH-SH molarity-Curing temperature.
Table 4. Compressive strength of MK-based GP and cement mortar mixtures.
Mix IDCompressive Strength (MPa)Increase in Strength
7-Day14-Day28-Day56-Day7–14 Days (%)7–28 Days (%)7–56 Days (%)
C113.715.216.917.310.723.026.1
C219.722.224.926.812.726.636.2
1.0A/M-2.0S/H-12M-30T22.823.423.824.02.54.25.1
1.0A/M-2.5S/H-14M-45T22.729.430.330.529.633.834.6
1.0A/M-3.0S/H-16M-60T29.536.336.436.523.223.523.7
1.2A/M-2.5S/H-16M-30T31.033.033.433.56.57.88.1
1.2A/M-3.0S/H-12M-45T15.516.016.116.23.24.14.5
1.2A/M-2.0S/H-14M-60T33.834.835.335.53.04.34.9
1.4A/M-3.0S/H-14M-30T20.227.229.329.634.745.546.8
1.4A/M-2.0S/H-16M-45T34.036.636.636.67.67.67.6
1.4A/M-2.5S/H-12M-60T24.324.424.524.50.40.70.7
Table 5. Percentage of contribution of parameters to fresh and hardened properties.
PropertyContribution (%)
A/MS/HSH MolarityTemperature
Flow870.111.11.8
Compressive strength3.311.974.610.2
Flexural strength6.214.951.727.2
Splitting tensile strength0.95.776.317.1
UPV6.31.089.82.9
Table 6. Values of quality criteria and improvements in optimal mixture design.
ResultsMin (Mix G5)Max (Mix G3)C2Optimum GP
7-day fc (MPa)15.529.519.739.9
14-day fc (MPa)16.036.322.241.0
7-day fr (MPa)4.59.66.29.3
14-day fr (MPa)5.010.97.310.8
7-day fs (MPa)3.65.55.88.0
14-day fs (MPa)4.19.07.410.0
7-day UPV (m/s)2542309637462994.3
14-day UPV (m/s)2585312638453025.8
Disclaimer/Publisher’s Note: The statements, opinions and data contained in all publications are solely those of the individual author(s) and contributor(s) and not of MDPI and/or the editor(s). MDPI and/or the editor(s) disclaim responsibility for any injury to people or property resulting from any ideas, methods, instructions or products referred to in the content.