Article

Epoxy and Bio-Based Epoxy Glass Fiber Composites: Taguchi Design of Experiments and Future Applications

by
Svetlana Risteska
1,2,*,
Ivan Vasileski
1,
Evgenija Gjorgjieska Angelovska
1 and
Aleksandar Pižov
1
1
Laminati Kom D.O.O., Aleksandar Makedonski 122, 7500 Prilep, North Macedonia
2
Faculty of Technology, Goce Delcev University, Krste Misirkov 10-A, P.O. Box 201, 2000 Stip, North Macedonia
*
Author to whom correspondence should be addressed.
J. Compos. Sci. 2025, 9(10), 513; https://doi.org/10.3390/jcs9100513
Submission received: 14 August 2025 / Revised: 15 September 2025 / Accepted: 19 September 2025 / Published: 23 September 2025
(This article belongs to the Special Issue Sustainable Biocomposites, 3rd Edition)

Abstract

Epoxidized soybean oil (ESO) is the oxidation product of soybean oil with hydrogen peroxide and either acetic or formic acid obtained by converting the double bonds into epoxy groups, which is non-toxic and of higher chemical reactivity. Oxidized soybean oil (ESO) has gained significant attention as a renewable and environmentally friendly alternative to petroleum-based epoxy resins. Derived from soybean oil through epoxidation of its unsaturated fatty acids, ESO offers a bio-based platform with inherent flexibility, low toxicity, and excellent chemical resistance. When used as a reactive diluent or primary component in epoxy formulations, ESO enhances the sustainability profile of coatings, adhesives, and composite materials. This study explores the mechanical properties of ESO-based epoxy systems, with particular attention to formulation strategies, crosslinking agents, and performance trade-offs compared to conventional epoxies. The incorporation of ESO not only reduces the reliance on fossil resources but also imparts tunable thermal and mechanical properties, making it suitable for a range of industrial and eco-friendly applications. The results underscore the potential of ESO as a viable component in next-generation green materials, contributing to circular economy and low-impact manufacturing. For the application of these materials in pultrusion and FW technologies, the Taguchi method is used to determine the most influential process parameters.

1. Introduction

Epoxy resins are a key class of thermosetting polymers, widely used in advanced composites, electronics, coatings, and adhesives due to their excellent mechanical, thermal, and chemical properties. The shift toward sustainable materials has driven considerable interest in bio-based resins, including polylactic acid (PLA), polyhydroxyalkanoates (PHA), lignin-derived resins, and epoxidized vegetable oils such as soybean, linseed, and castor. These epoxidized vegetable oils can be chemically functionalized to act as reactive modifiers, reducing viscosity, enhancing flexibility, and increasing bio-based content [1,2,3,4,5,6,7,8,9,10,11,12,13,14,15,16,17,18,19,20]. It has become an integral part of the epoxy network, which allows for the partial substitution of petroleum-based epoxies (such as DGEBA) with a bio-based raw material [5,6,7,8,9,10,11,12]. Recent reviews [10,11,12,13,14,15,16,17,18,19,20] provide comprehensive insights into these bio-based alternatives, emphasizing their potential for high-performance polymer applications. Their performance depends on the oil source, degree of unsaturation, and epoxidation efficiency. Despite their renewable origin and lower toxicity, bio-based polymers often exhibit lower thermal stability, reduced stiffness, and processing challenges compared to conventional petroleum-derived thermosets.
Epoxidized soybean oil (ESO) has emerged as one of the most practical and commercially viable bio-based modifiers for epoxy resins. ESO contains multiple epoxy functional groups introduced via the epoxidation of unsaturated fatty acid chains, enabling chemical integration with epoxy matrices during curing. Owing to its renewable origin, biodegradability, and commercial availability, ESO represents a promising candidate for partially substituting petroleum-based resins in structural composites. Previous studies have demonstrated that incorporating ESO into epoxy systems enhances toughness, ductility, and processability, while moderately reducing stiffness and glass transition temperature. Such property modifications are particularly relevant for continuous manufacturing processes, including pultrusion and filament winding, where both reduced viscosity and improved damage tolerance are advantageous. Several investigations have confirmed that ESO incorporation up to approximately 20% allows the neat resin system to maintain—and in certain cases, enhance—its mechanical and thermal performance [11,12,13,14,15,16,17,18,19,20,21,22,23,24,25,26,27,28,29,30,31,32,33,34,35].
ESO addition has consistently been reported to decrease Tg, reflecting increased chain mobility and reduced stiffness [35,36,37,38,39,40,41,42,43,44,45,46,47,48,49,50,51,52,53,54,55]. Although this leads to marginally lower thermal stability, the trade-off often benefits applications requiring improved toughness and flexibility [7]. Acting as a reactive diluent, ESO can reduce epoxy blend viscosity by up to 30%, thereby facilitating fiber wet-out and impregnation during pultrusion [9]. This viscosity reduction is critical for enhancing production line speed and throughput, underscoring both a research gap and an opportunity for systematic evaluation under industrially relevant continuous processing conditions [14,15]. For example, Chebotar et al. [20] investigated plant oil-based acrylic monomers derived from hydrogenated sunflower, palm, and castor oils for biomedical applications.
Furthermore, a recent study by Zhang et al. [21] demonstrated that surface modification of alumina nanoparticles can effectively enhance matrix toughness and stiffness, highlighting the importance of both the type of silane and the nanoparticle concentration for optimizing composite properties. These findings are particularly relevant for fiber-reinforced polymer composites (CFRP/GFRP), where the matrix–nanoparticle interface plays a crucial role in load transfer and interlaminar shear strength. Incorporating silane-modified Al2O3 nanoparticles into the epoxy matrix of such composites can improve flexural strength, stiffness, and fracture toughness, while careful control of nanoparticle concentration is essential to prevent agglomeration and ensure uniform mechanical performance across the laminate.
Altuna et al. [7] examined ESO incorporation up to 100% in epoxy resins cured with MTHPA. Increasing ESO reduced Tg due to the plasticizing effect of soybean oil and also lowered compression strength and modulus, while impact strength peaked at 40% ESO (~0.4 kJ/m2). These studies highlight the influence of commercial ESO on bio-based thermosets. In parallel, Zhu et al. [54] compared commercial ESO with newly synthesized epoxidized methyl soyate (EMS) and epoxidized allyl soyate (EAS). Their results showed that EAS-based systems exhibited superior tensile, flexural, and thermomechanical properties, with the highest Tg observed at 30% bio-content. Studies with epoxidized castor oil (ECO) blended with DGEBA epoxies showed that higher ECO content (up to 40–50%) reduced Tg and rigidity but improved flexibility. Notably, incorporating 30 wt% ECO increased flexural strength (from 88 to 117 MPa), while the modulus remained largely unaffected [16,55].
Although the role of ESO in pure epoxy matrices has been extensively studied, its application in structural composites remains underexplored. Most existing studies [20,21,22,23,24,25,26,27,28,29,30,54,55] focus on neat epoxy resins, either unmodified or modified with various biomaterials. In contrast, this study contributes to the limited research on ESO incorporation into composite structures. While the optimal ESO content (≈20–30%) has been previously reported, this study provides a novel perspective by evaluating ESO-modified epoxy in composite parts and pultruded profiles—a continuous manufacturing method that produces high-performance and dimensionally consistent composites. By examining both resin modification and its interaction with key processing parameters such as pulling speed, die temperature, resin formulation, and fiber content, this work offers practical insights into the performance and applicability of ESO-modified composites.
In this study, epoxidized soybean oil (ESO) was systematically evaluated as a bio-based modifier for diglycidyl ether of bisphenol A (DGEBA) epoxy matrices reinforced with glass fibers. The research combines experimental characterization with a Taguchi design approach for pultrusion process optimization, thereby offering both fundamental insights and practical implications for industrial composite manufacturing. By situating ESO within the broader framework of sustainable polymer research, this study highlights its potential contribution to the development of environmentally friendly, high-performance composite materials. The incorporation of ESO as a partial replacement for DGEBA in molded profiles has dual function. First, ESO acts as an internal plasticizer, enhancing matrix flexibility and toughness. Second, it directly substitutes a fraction of DGEBA proportional to the level of ESO introduced. This dual functionality is particularly advantageous, as the plasticizing effect of ESO reduces the need for additional modifiers, simplifying the technological process in pultrusion. Moreover, because ESO is generally more cost-effective than DGEBA, this contributes to lowering overall production costs while maintaining satisfactory structural and functional performance.

2. Materials and Methods

2.1. Materials

DGEBA-type epoxy resin (KER 828) with epoxy equivalent weight of 184–190 g/eq. was purchased from Kumho P&B Chemicals, Inc., Yeosu-si, Korea. ESO (epoxidized soybean oil) was purchased from Shandong Aosen New, Material Technology Co., Ltd., Jinan, China. It has Oxirane Oxygen > 6.5 wt%. MTHPA (Methyltetrahydrophthalic anhydride) from Reaksiyon Kimya, Istanbul, Turkey and EPH 866 (Tetrahydromethylphthalic anhydride) from Westlake distributer Brenntag (Beograd, Serbia) were used as a curing agent and BDMA (Benzyldimethylamine) from Huntsman distributer Brenntag, (Beograd, Serbia) was used as a catalyst. Glass mat (MAT300 + VEIL50), glass roving, and glass fabric plain 200 g/m2 from Chang Zhou Matex Composites, Ltd., Changzhou, China. were used as reinforcements in the composite samples. Additional materials such as internal release mold type ILCHO from ILCO Chemikalien, Erkelenz, Germany, GmbH and filler CaCO3 from Omya Hellas, Thessaloniki, Greece, were used for next fabricate pultruded rods. The chemical structures of all polymers and reagents used are given in Figure 1.
Epoxidized soybean oil (ESO) functions as a bio-based plasticizer and reactive monomer (replacement of DGEBA), conferring both enhanced flexibility and improved sustainability to the resulting polymer network. Diglycidyl ether of bisphenol A (DGEBA) constitutes the principal epoxy backbone, ensuring structural integrity and mechanical robustness. The curing agents (MTHPA and EPH 866) induce crosslinking, thereby generating a three-dimensional network, while the strategic incorporation of fillers (CaCO3) further augments mechanical performance and thermal stability.
To tailor the curing kinetics and optimize the polymer architecture, two distinct curing agents—MTHPA and EPH 866—were employed. The choice of curing agent significantly influences the mechanical and thermal behavior of ESO-containing formulations. Given that MTHPA yielded superior mechanical properties, subsequent thermal characterizations were conducted exclusively on MTHPA-cured specimens to ensure consistency and reliability in the analysis. Pultrusion typically employs semi-permanent release agents, as the continuous process demands stability and minimal mold maintenance. In these experiments, a release mold was used, ILCHO 224.
Characteristics of the materials used in this study are shown in Table 1.

2.2. Preparation of Plates for Samples

In this section, the configuration for tests on the pure resin systems (epoxy and the bio-based resin Section 2.2.1) and on the composite specimens from epoxy and bio-based resin obtained with the investigated resins (Section 2.2.2) are described.

2.2.1. Preparation of Plates from Pure Resin System

A bio-epoxy resin system was prepared by incorporating epoxidized soybean oil (ESO) into a conventional DGEBA resin system. The ESO/DGEBA ratio varied across three compositions: 100/0, 30/70, and 0/100. The resin formulation ESO/DGEBA ratio comprising curing agent (MTHPA or EPH 866) 85% and BDMA 3%, was mixed at room temperature for 10 min.
The resulting mixture was then poured into a glass dish and placed in an oven at 40 °C for 30 min to eliminate trapped air bubbles. Afterward, it was transferred into a metal mold lined with a release film and cured at 85 °C for 1 h, followed by a post-curing step at 125 °C for 1 h. The corresponding plate markings are listed in Table 2.

2.2.2. Preparation of Composite Plates

There were 6/12 different composite plates that were fabricated in the laboratories of Laminati Kom D.O.O. in Prilep. Laminate panels measuring 100 mm × 200 mm were produced by stacking eight mat/fabric layers for each of the six different types. The content of the constituents in the manufacture plates was 60 wt% reinforcements. All composite plates were cured at 85 °C for 1 h and post-cured at 125 °C for 1 h. The designations of the composite plates are listed in Table 3.

2.3. Methods for Mechanical/Thermal Tests of Samples from Plates

In this section, the configuration for bending tests on the pure resin and composite samples (Section 2.3.1) and on DSC tests on the composite specimens (Section 2.3.2) are described.

2.3.1. Bending Tests of Samples from Plates

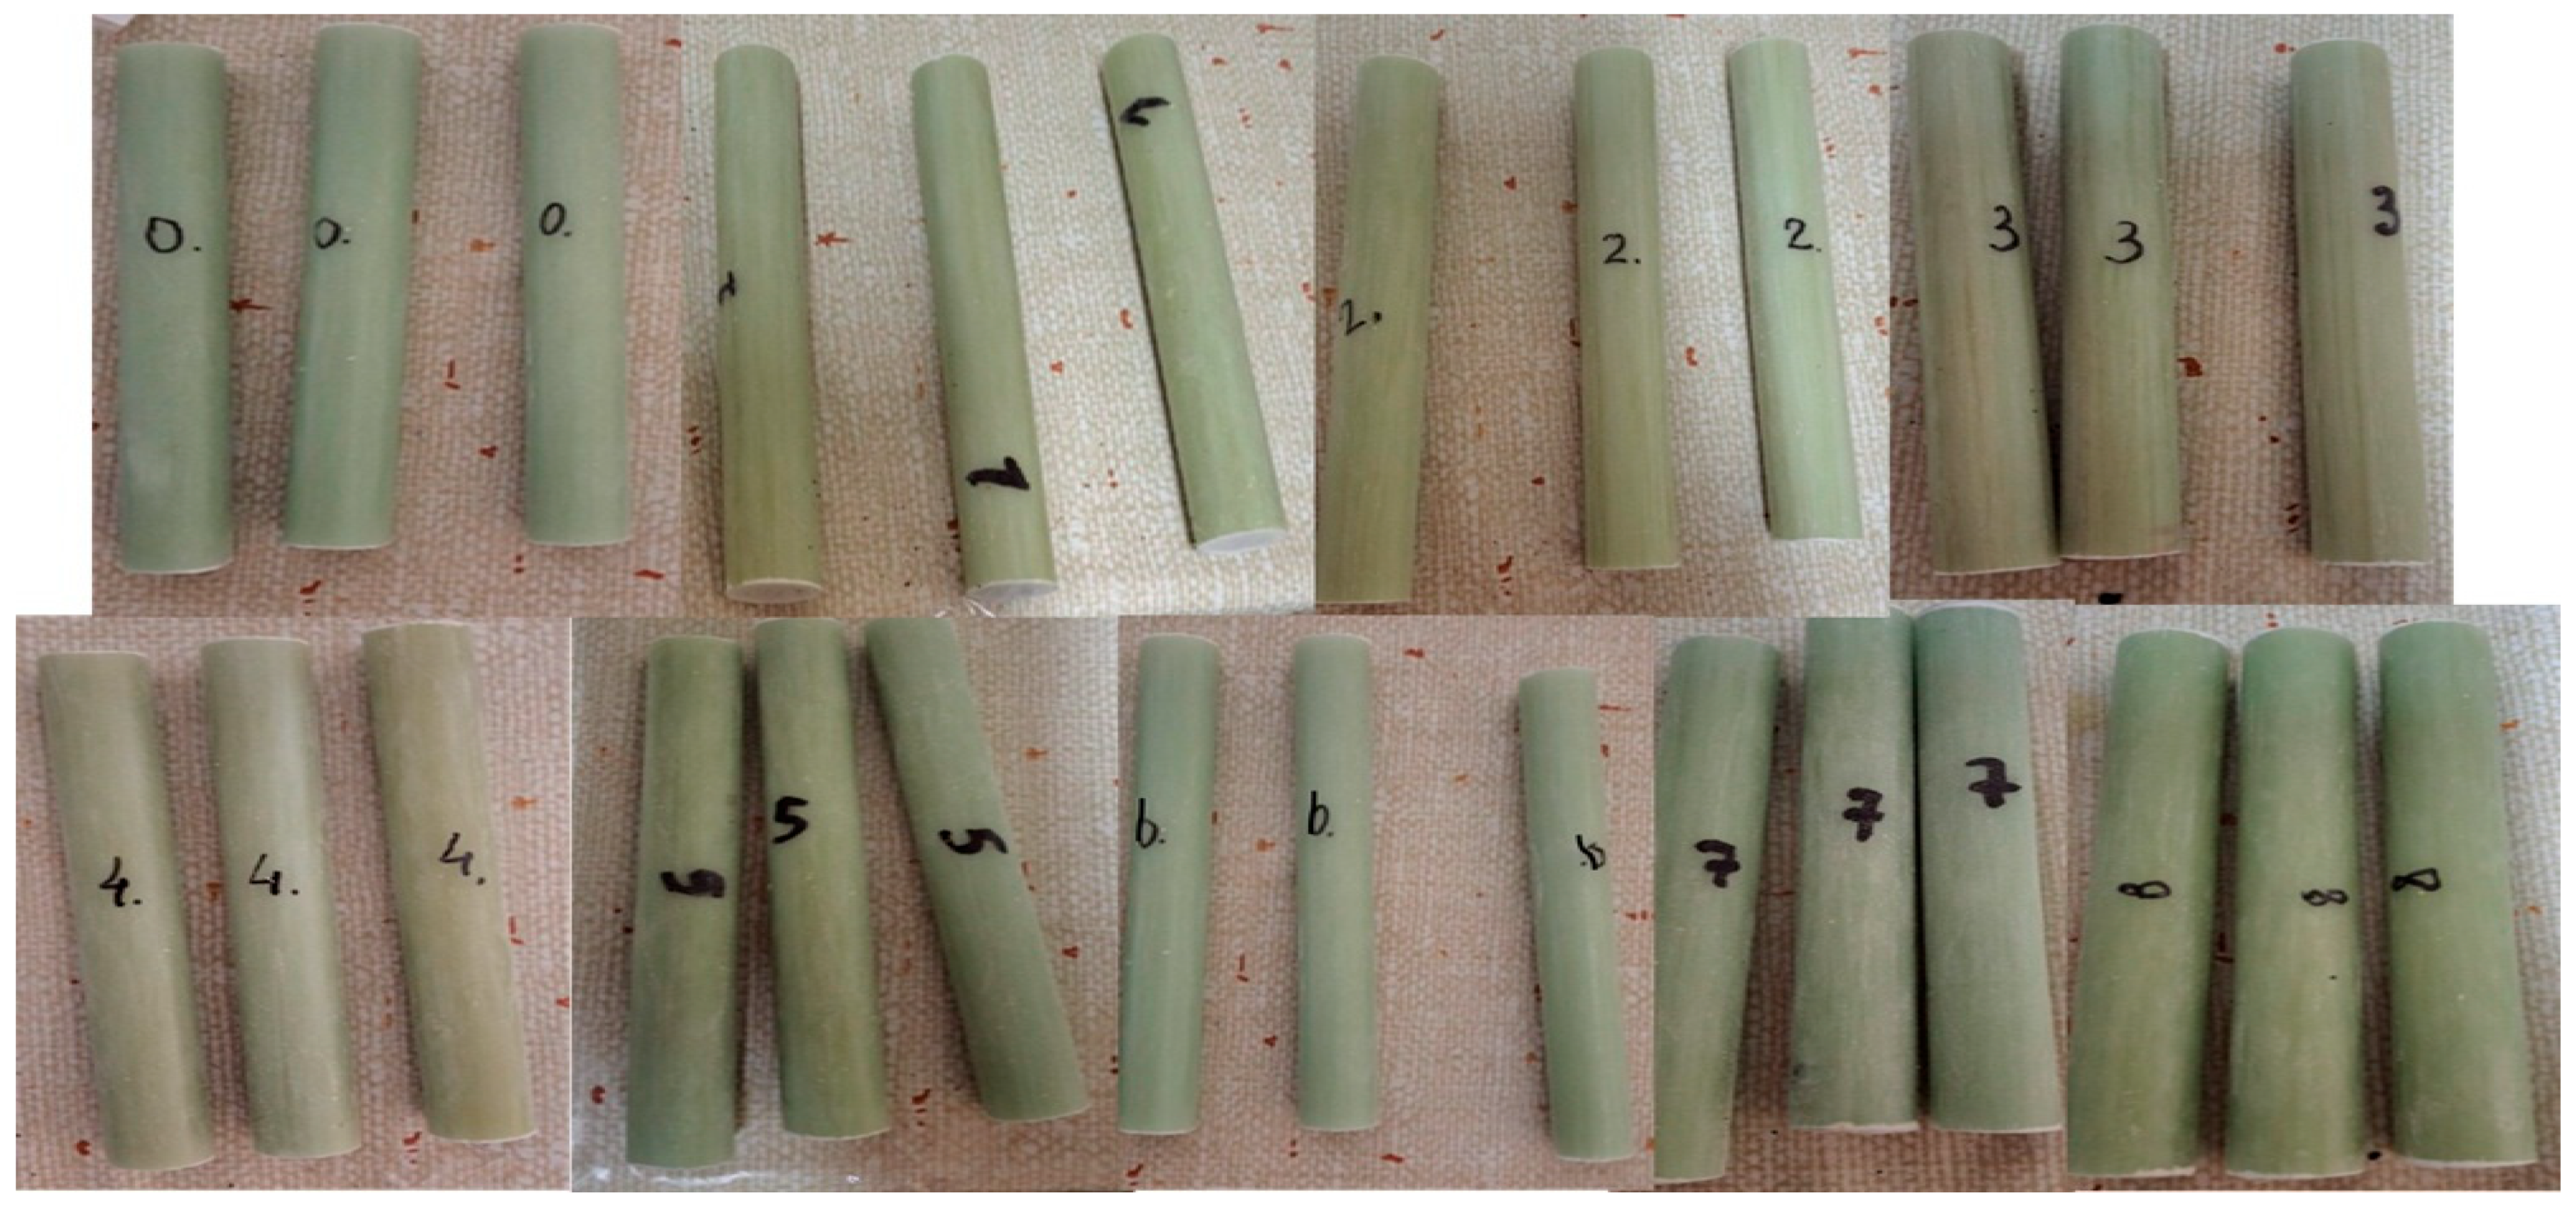
Firstly, bending tests were performed on the pure resin samples. The specimens were cut from manufactured resin plates (I-1,2,3 and II-1,2,3), with geometries defined according to the ASTM D790 (EN ISO 14125) standard [36,37], as shown in Figure 2. Secondly, bending tests were conducted on the composite samples. These specimens were cut from the manufactured composite plates (III-1,2,3; IV-1,2,3; V-1,2,3; and VI1,2,3), with dimensions also conforming to the ASTM D790 (EN ISO 14125) standard [36,37], as illustrated in Figure 3.
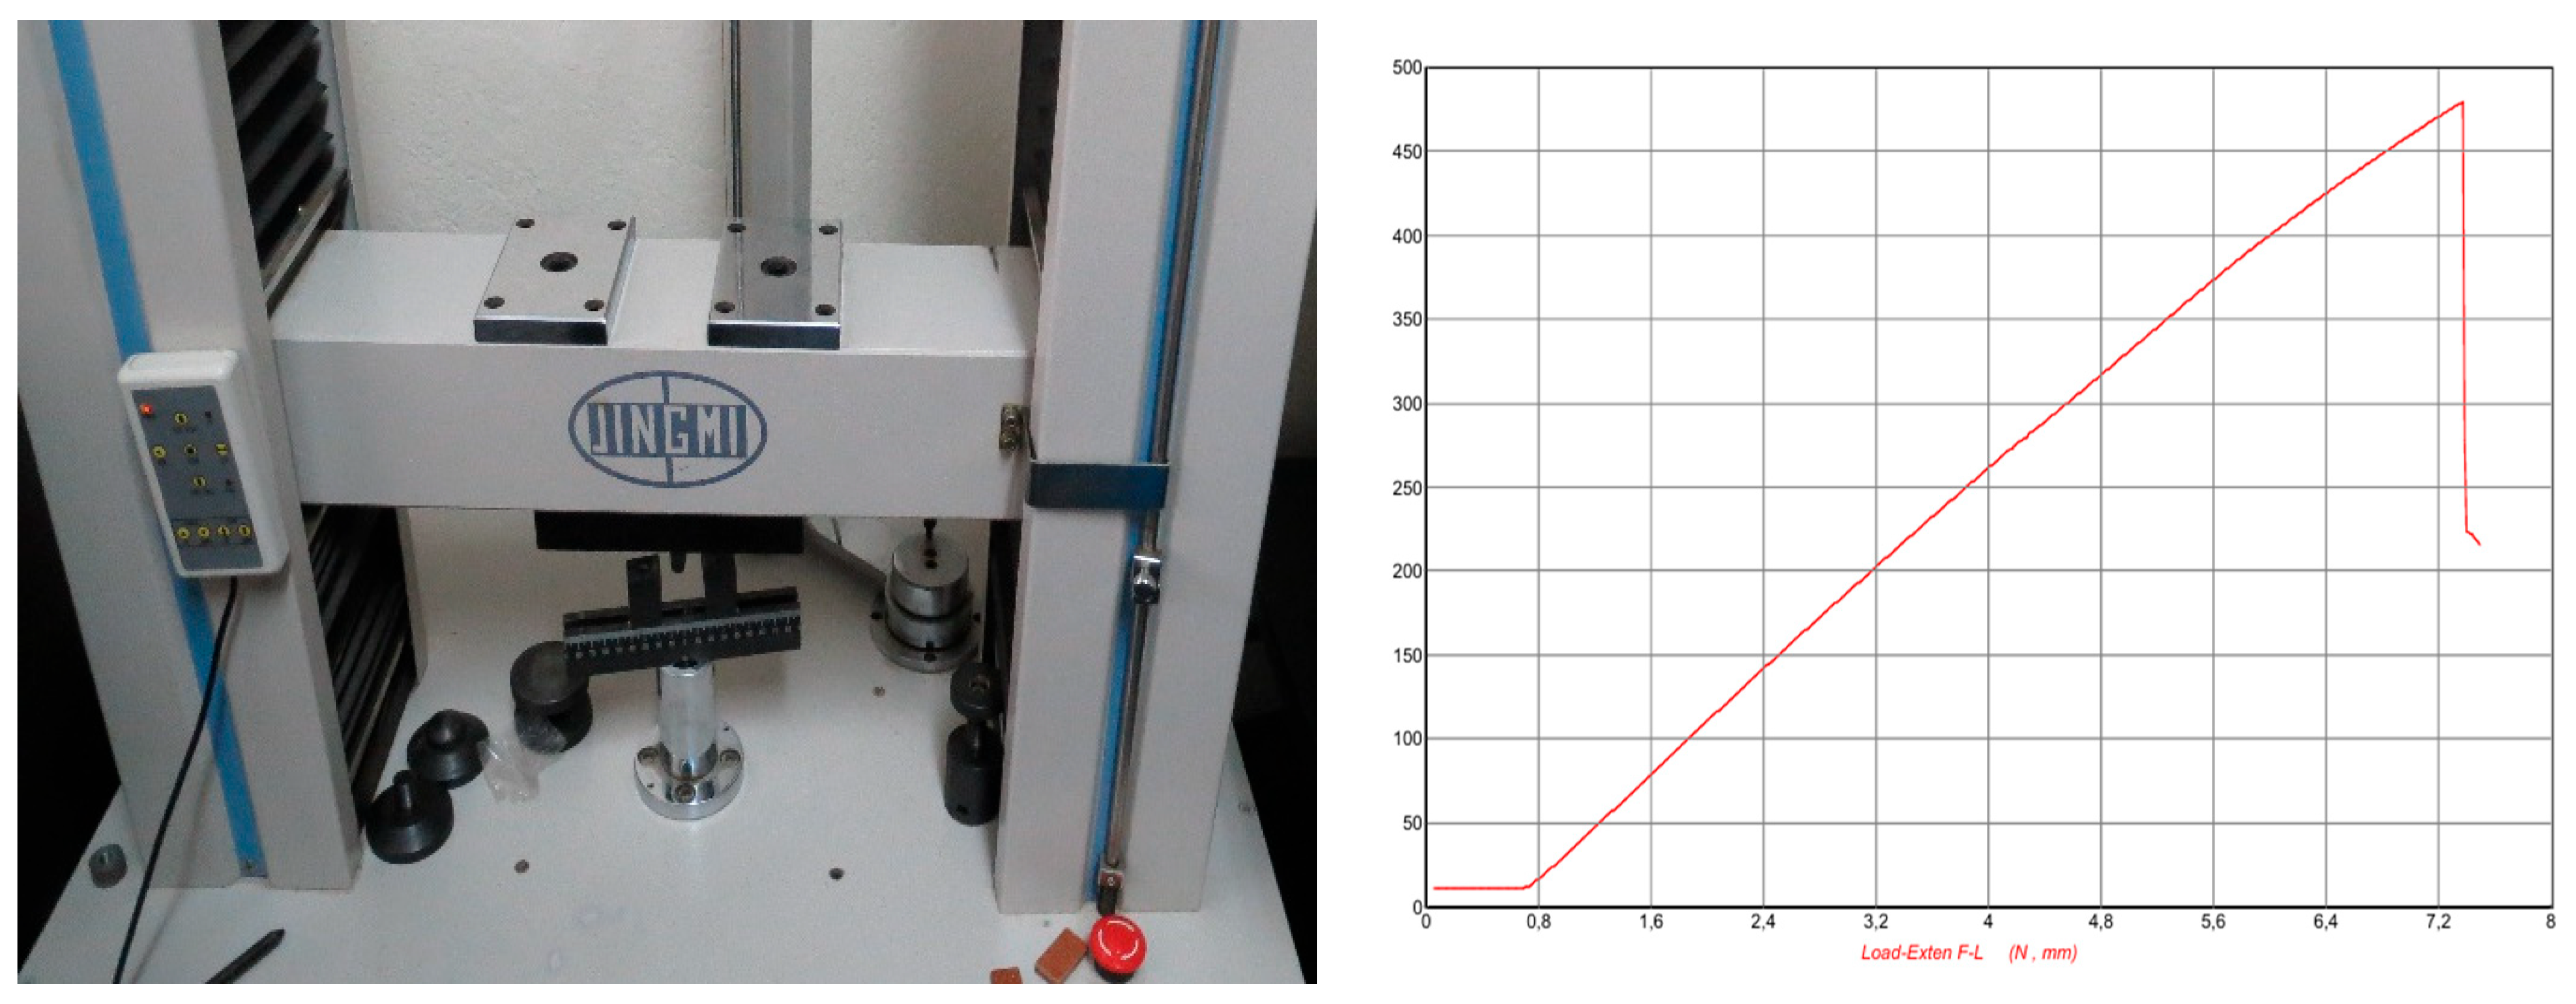
The dimensions (length, width, and thickness) of each specimen were measured using a micrometer. Flexural properties of all specimens were evaluated using the same universal testing machine (UTM) JINGMI WDT-W-50B, Chengde Precision Testing Machine Co., Ltd., Chengde, China, shown in Figure 4. For each formulation, five samples were tested to determine the average values of flexural properties, including Young’s modulus, flexural strength, and elongation at break.
The flexural strength ( σ f ), flexural modulus of elasticity ( E f ), and flexural strain ( ε f ) of the composite samples were calculated using Equations (1)–(3):
σ f =   3 F L 2 b h 2  
where:
  • F —applied load to the specimen (N);
  • b   —width of the specimen (mm);
  • h   —thickness of the specimen (mm);
  • L —length of the span between the supports (mm).
E f =   L 3 4 b h 3 F s
ε f =   6 s h L 2
where:
  • Δ F / Δ s —slope of the load ( Δ F ) versus deflection ( Δ s ) curve, which represents the rate of change of load with respect to deflection (N/mm);
  • s —maximum deflection of the specimen at the center (mm).

2.3.2. Thermal Analysis (DSC) of Samples from Plates

To determine the Tg of the composite plate samples, the differential scanning calorimetry (DSC) method was used. Since the hardener MTHPA gave better mechanical properties, DSC analyses were performed exclusively on samples prepared with this hardener (the specimens I-1, I-2, I-3; III-1, III-2, III-3; and V-1, V-2, V-3).
DSC measurements were performed on an AT451 instrument, Anytester, Hefei, China (Figure 5a), which operates over a temperature range of 25–600 °C. DSC measurements were performed on powdered samples (15–20 mg) under a nitrogen purge of 50–75 mL/min. The glass transition temperature (Tg) was determined from specimens taken from each plate, which were analyzed over the temperature range of 25–250 °C at a heating rate of 20 °C/min. Figure 5b shows the DSC curve for sample III-3, along with the Tg determined by the instrument software.
A detailed analysis of how Tg is obtained from the DSC instrument software is provided with Figure 5c,d. The glass transition temperature (Tg) is determined by DSC as a shift in the baseline of the curve. As shown in Figure 5c, point A (T-onset in Figure 5d) marks the start of deviation. By extending the baselines before and after the transition, the midpoint (point C Figure 5c analog point Tendset in Figure 5d) is found, and its tangent intersects the baseline at point B. According to standard [38], point B (in Figure 5c) is used as Tg.

2.4. Taguchi Method

The Taguchi Method is a statistical approach developed by Genichi Taguchi to improve the quality of manufactured goods and processes. It is widely used in engineering, product design, and quality control to identify the best combination of factors that minimize variation and optimize performance [19,23].
In the fabrication of bio-epoxy composites, as mentioned earlier, material formulation and processing parameters are classified as two categories of influencing factors. The second step is to select the levels of each functional factor with minimal noise data effect that can cause the variation of product quality and characteristics. Finally, tolerance design can employ higher levels of material characteristics to improve product quality [39,40,41,42,43,44].
In this study, the effects of material formulation and processing parameters on the mechanical properties of composites were investigated using a Taguchi L8 orthogonal array. This study employed a Taguchi L8 orthogonal array to investigate the effects of six factors (A–F) at two levels on the mechanical properties of composites. Eight experimental runs were conducted, with each run replicated five times to ensure reliability and reproducibility. The combination of factors for the eight experiments given in Table 4 and Table 5.
Flexural strength was chosen as the primary response variable in this study due to its fundamental role in characterizing the mechanical performance of fiber-reinforced composites. This property reflects not only the intrinsic strength of the resin system but also the effectiveness of fiber–matrix adhesion, the degree of resin impregnation, and the influence of processing parameters during composite fabrication. As such, flexural strength can be regarded as an integrative measure that provides a reliable assessment of the overall structural integrity of pultruded composites. Its relevance is particularly pronounced in load-bearing applications, where the ability to sustain bending stresses without failure is directly related to long-term performance and durability. To ensure that the optimization process favors conditions that maximize this critical property, the “larger-the-better” criterion of the signal-to-noise (S/N) ratio was adopted within the Taguchi design framework. This approach emphasizes experimental settings that yield higher flexural strength values, thereby contributing to improved load-bearing capacity, resistance to mechanical degradation, and extended service life of the developed composite materials.

2.5. Manufacture and Tests of Pultruded Rods Samples

2.5.1. Manufacturing Fiberglass Composites Rods by Pultrusion

Following comprehensive laboratory experimentation and the application of the Taguchi method to optimize process parameters, the subsequent phase involved the fabrication of specimens via the pultrusion technique. Glass fiber-reinforced composite rods were produced using an industrial pultrusion line at Laminati Kom (Prilep, R. North Macedonia), employing a range of bio-based resin formulations.
The Taguchi analysis confirms that factor A, representing the ESO content at 30% in the Taguchi optimization, exerts a negligible effect on the mechanical properties (only about 0.77%) and can, therefore, be considered insignificant. This suggests that the incorporation of up to 30% ESO in an epoxy system (DGEBA/MTHPA/BDMA) does not result in notable changes in the mechanical performance of pultruded profiles. Nevertheless, the question remains as to how variations in Factor A might influence pultrusion when combined with optimization of the other factors. Based on these considerations, the following parameters were selected to produce pultruded profiles: Factor A = specifically 0%, 20%, 25%, 27%, 30%, 45%, and 60% ESO; Factor B = MTHPA and EPH 866; Factor C = 2 min mixing time; Factor D = f (glass fiber); Factor E = 0 and 10 wt% CaCO3 and Factor F = 80 °C mixing temperature for ESO + DGEBA.
The selection of parameters and number of trials marked with labels R0–R8 is given in Table 6.
Epoxidized soybean oil (ESO) was incorporated into the base epoxy resin system at different weight fractions in order to formulate modified resin matrices with tailored properties. To enhance processability and ensure smooth demolding, an internal lubricant (release mold ILCHO) was introduced, while calcium carbonate (CaCO3) was added as an inorganic filler to further improve dimensional stability and reduce shrinkage. As reinforcement, continuous unidirectional E-glass roving with a linear density of 4800 tex was employed, resulting in a fiber content of approximately 78 wt% in the final composite structure. The pultruded composite rods produced under these conditions had a nominal diameter of 16 mm.
The composite specimens (designated R0–R8), corresponding to the different ESO-modified resin formulations, were fabricated using a laboratory-scale pultrusion machine (schema in Figure 6). The die used for pultrusion had a total length of 1100 mm, and curing of the resin system (containing varying ESO concentrations) was carried out at a die temperature maintained between 180 and 190 °C. To prevent premature gelation of the resin at the die entrance, the maximum processing temperature was carefully controlled and kept below 200 °C. The pulling speed was set at 200 mm/min, with minor fluctuations observed during continuous operation.

2.5.2. Method Tests of Pultruded Rods Samples

Shear and Compression Strength
Shear strength was evaluated using the three-point bending method in accordance with ASTM D4475-96 [52]. Tests were conducted at room temperature utilizing a 50 kN universal testing machine, operating at a crosshead speed of 1.3 mm/min. The specimens had a total length of 120 mm and a span length of 50 mm. Samples were fabricated with varying epoxidized soybean oil (ESO) content—specifically 0%, 20%, 25%, 27%, 30%, 45%, and 60%—with three replicates prepared for each composition (see Table 5 for detailed sample information).
The apparent shear strength (S) was calculated using the following equation:
S   =   0.849 · F / d 2
where:
  • S = apparent shear strength (N/mm2 or MPa);
  • F = breaking load (N);
  • d = specimen width (mm).
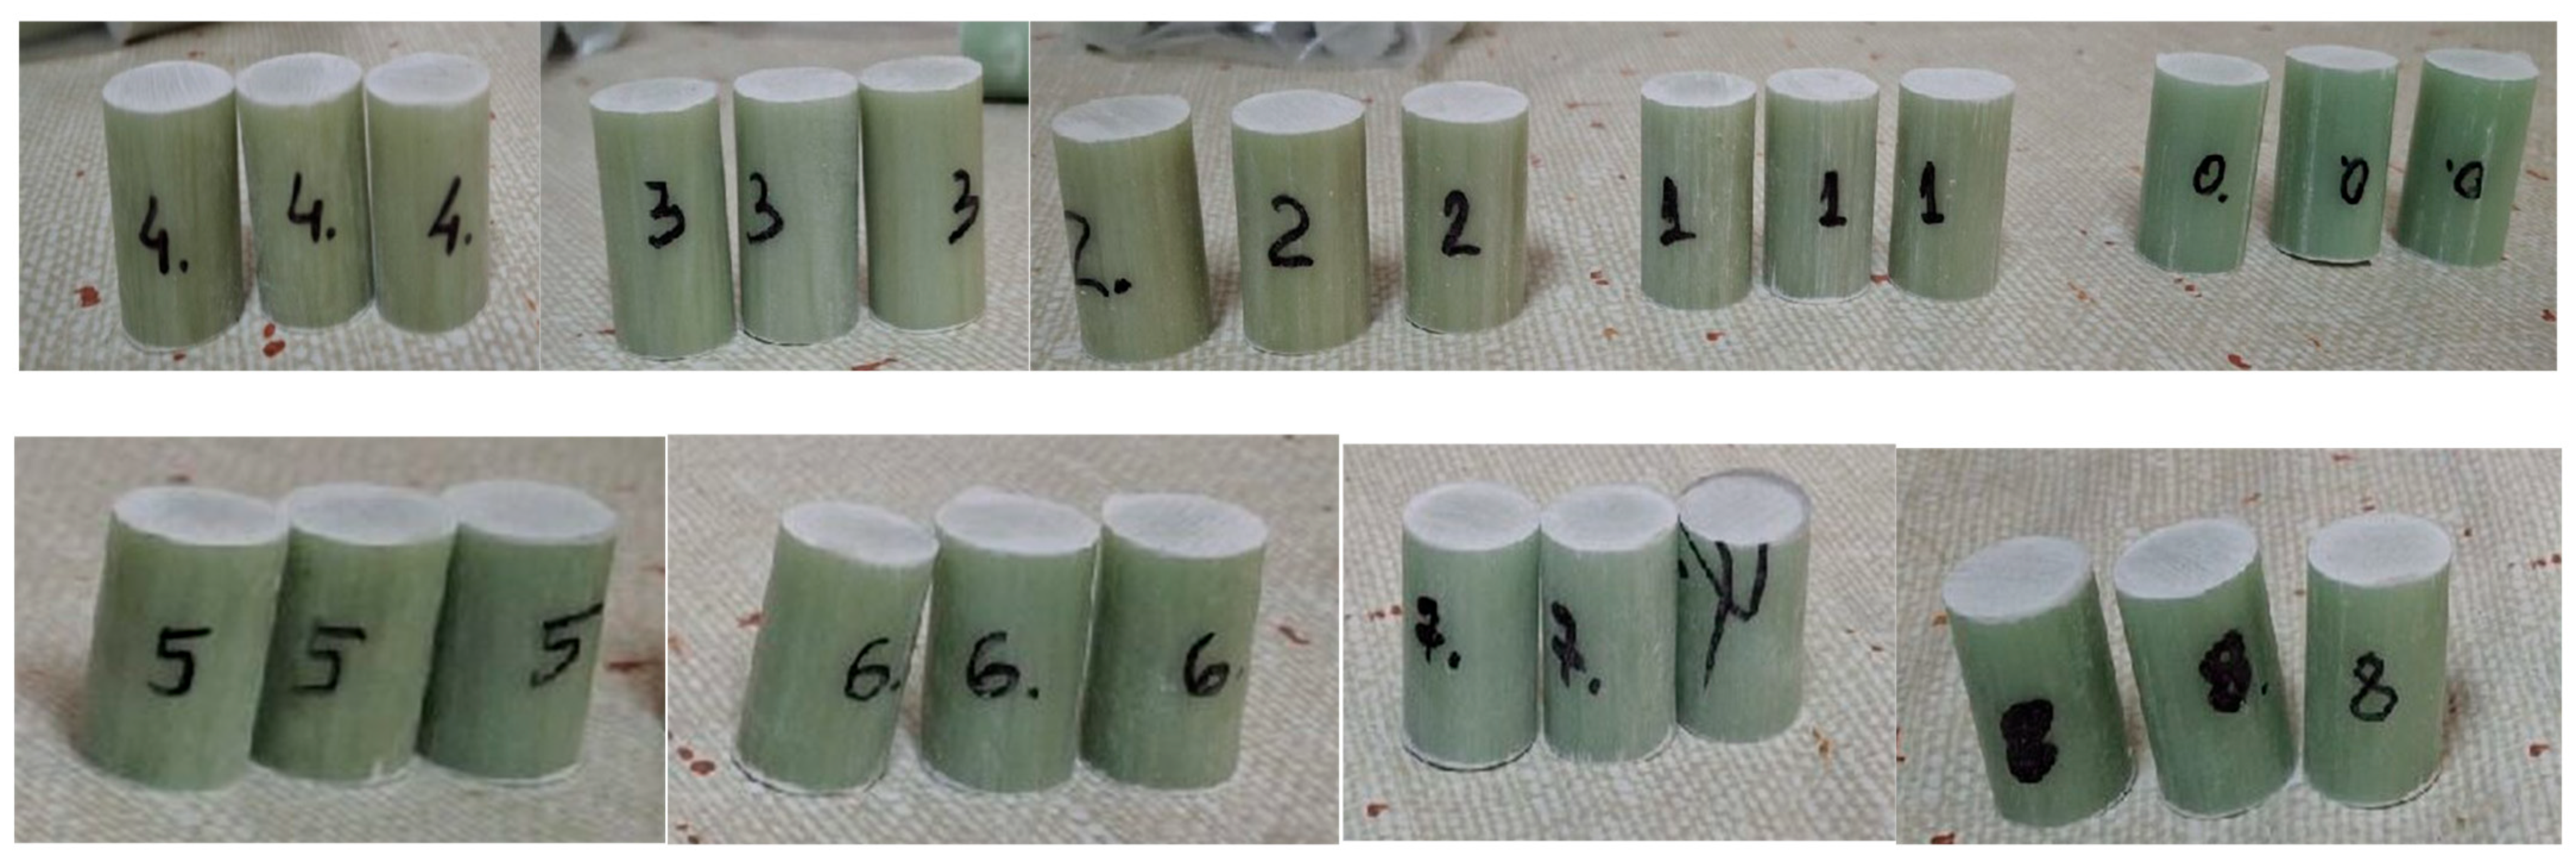
Compression is the ability of a composite material to withstand a load by changing its size. The compression test was performed at room temperature according to the ASTM D695 test method [53]. Overlapped composite specimens—glass profiles cut to 25–30 mm, were each tested using a universal testing machine in Laminati Kom with a cross-section speed of 5 mm/min. The specimens were prepared with different percentages of ESO, namely 20%, 25%, 27%, 30%, 45%, and 60% of ESO and three specimens were reaped from each batch from R0–R8 (Figure 7 and Figure 8).
Thermal Analysis (DSC/TGA) of Pultruded Rods Samples
The thermal properties of the pultruded composite rods were evaluated using differential scanning calorimetry (DSC) and thermogravimetric analysis (TGA).
The DSC measurements for the pultruded composite rods were conducted using the same instrument and methodology as for the plate specimens in Section 2.3.2, including identical sample preparation, heating rate, temperature range, and nitrogen atmosphere. All measurements were performed in triplicate to ensure reproducibility, and average values are reported in Reported in Section DSC Analysis for Determining Tg of Samples R0–R8.
TGA analyses were conducted using a thermogravimetric analyzer TG (type THEMYS ONE+, Setaram, Geneva, Switzerland), under a nitrogen flow of 50–75 mL/min. The samples with a mass of approximately 10–20 mg were heated from room temperature to 800 °C at a rate of 20 °C/min. in accordance with ASTM E-1868 [22]. The onset of degradation temperature (Td) and weight loss profiles were recorded to evaluate the thermal stability of the composite rods.

3. Results and Discussion

3.1. Tests of Samples from Palates

3.1.1. Bending Test of Samples from Palates

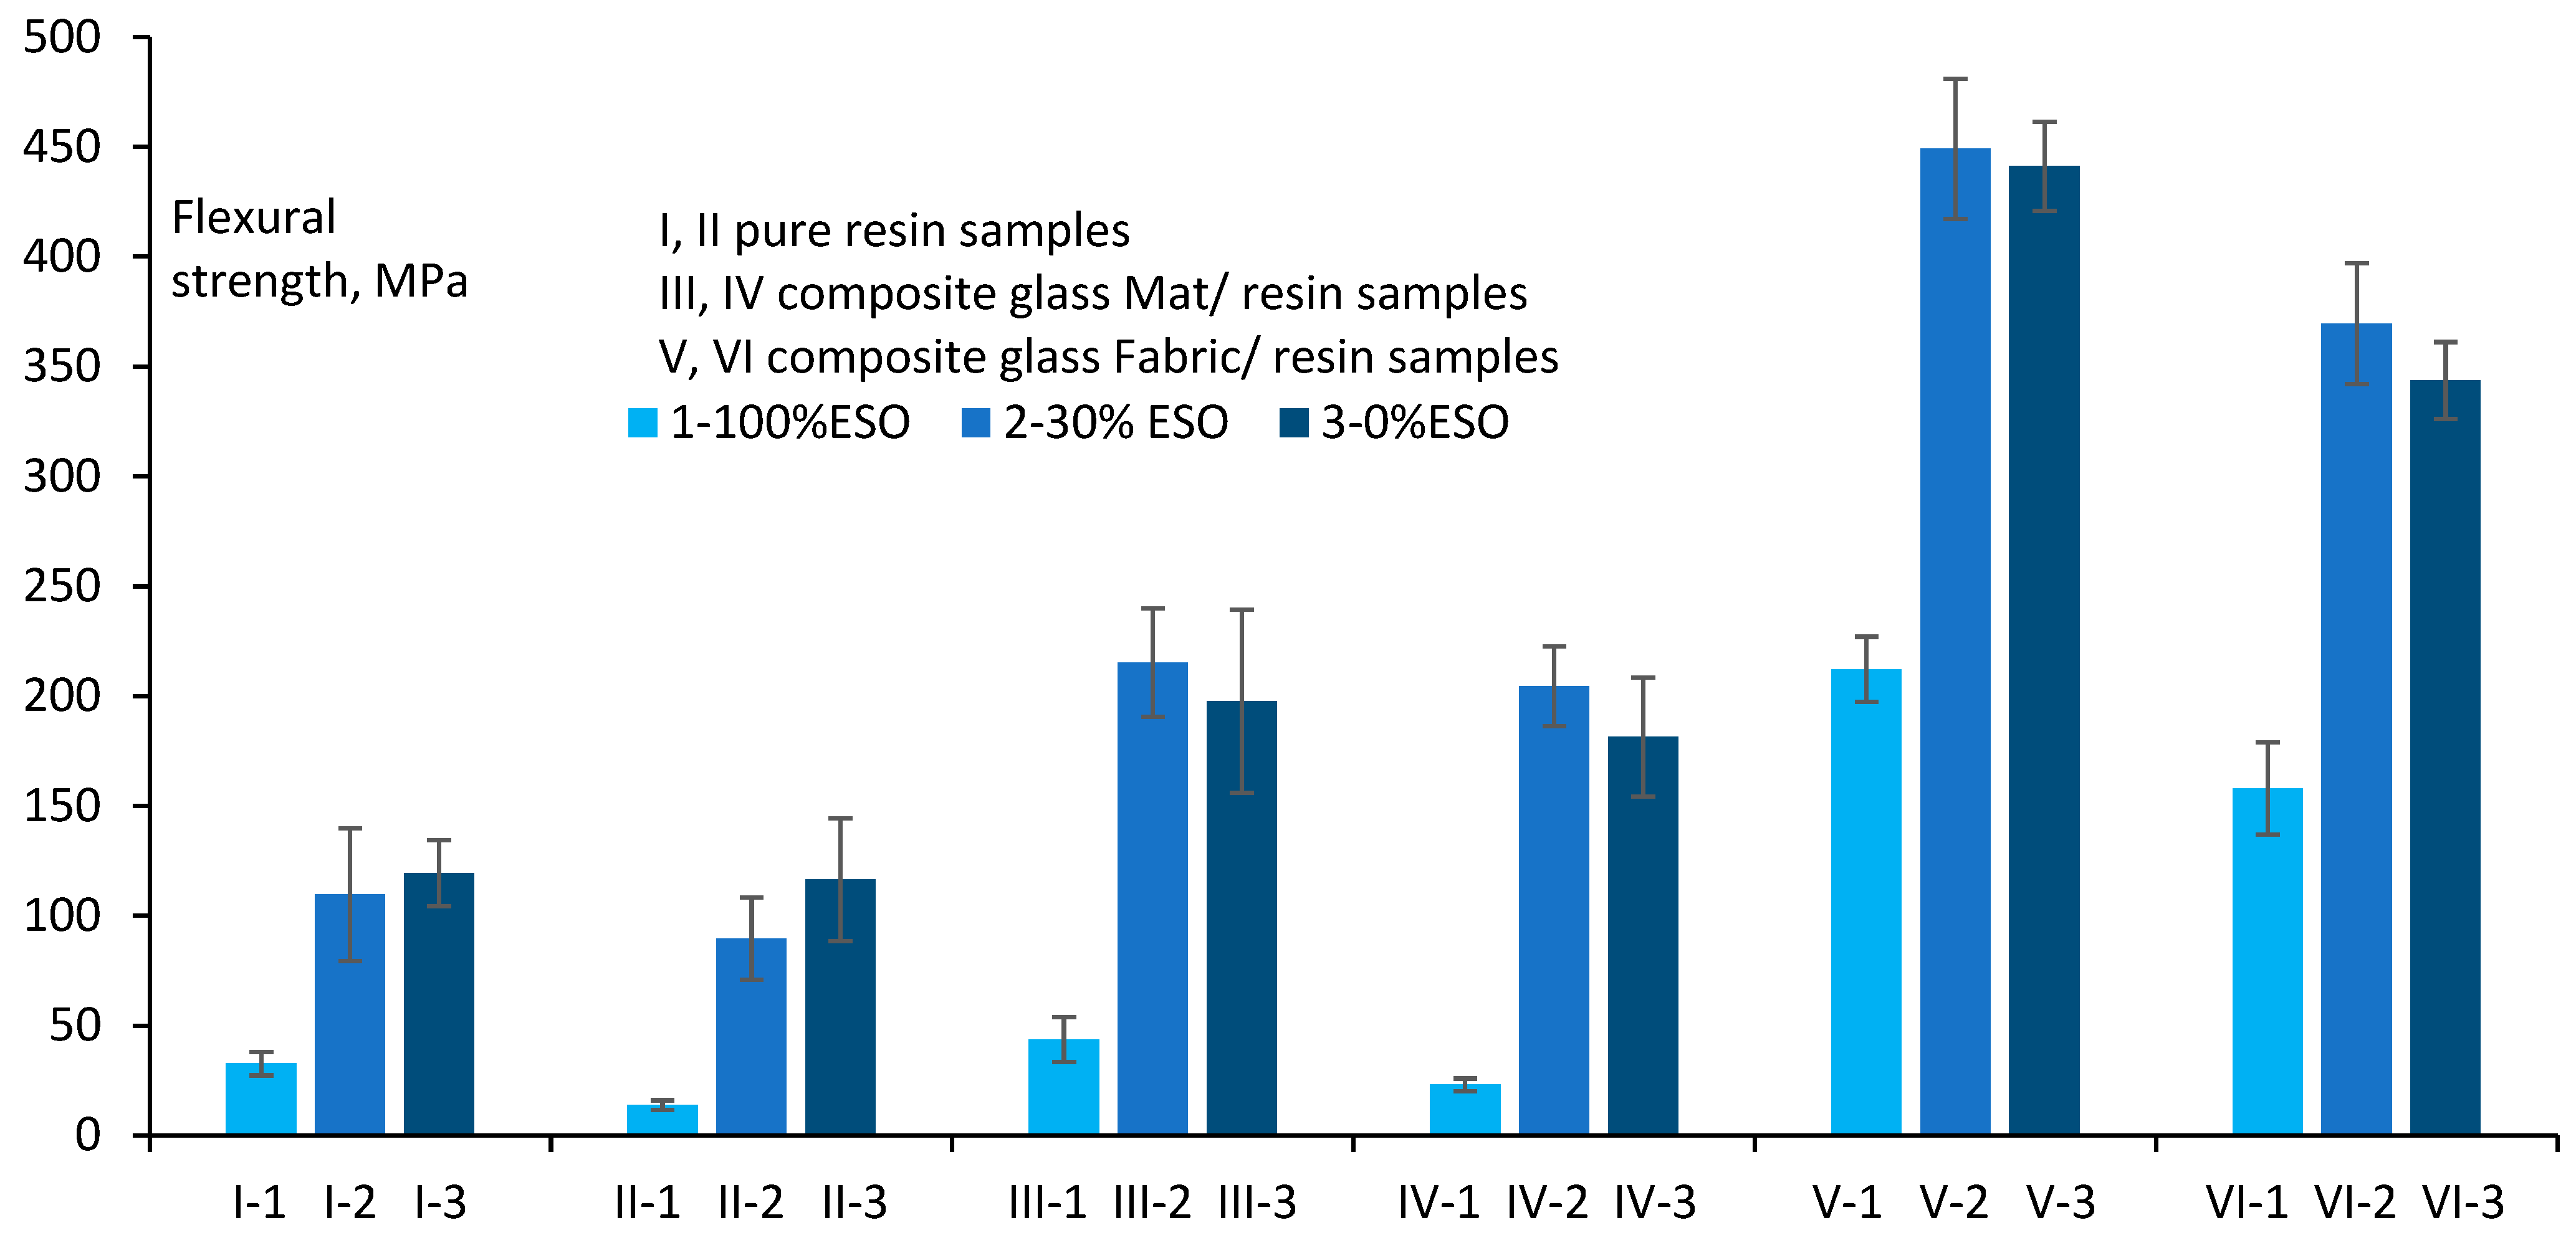
The mechanical properties of neat polymer and composite samples (Section 2.2.1 and Section 2.2.2) are presented in Figure 9 and Figure 10.
Neat ESO specimens (I-1/3 and II-1/3) exhibit flexural strength approximately 70% lower than neat DGEBA samples. The maximum flexural strength of pure DGEBA is around 130 MPa (0 wt% ESO), while the minimum, for 100 wt% ESO, is approximately 40 MPa. Overall, flexural strength decreases with increasing ESO content, consistent with ESO acting as a plasticizer that softens the resin and increases chain mobility. Although the literature reports a slight increase in σ f at 10 wt% ESO [23], our samples with 30 wt% ESO showed reduced σ f , highlighting the dominant softening effect at this concentration. In contrast, the flexural modules of neat DGEBA and the 30 wt% ESO-modified resin remains nearly identical (Figure 10, I-1/3 and II-1/3), indicating that moderate plasticization primarily affects strength rather than stiffness in neat resin systems.
For composite samples (Figure 9 III-2/3, IV-2/3, V-2/3, and VI-2/3) the σ f values increased, especially the samples with 30 wt% ESO, significantly increased mechanical strength compared to neat ESO and DGEBA epoxy. Strength values are higher than pure resin (up to ~230 MPa), showing that the mat reinforcement improves mechanical properties. The fabric composites (V, VI) have the highest flexural strength of all (up to ~420 Mpa), as expected since the glass fabric has greater mechanical properties than the glass mat.
An increased ESO content (30 wt%) leads to a reduction in flexural strength, particularly in neat resins. Nevertheless, a balanced formulation—such as incorporating 30 wt% ESO with glass mat or fabric reinforcement—can offer an effective compromise between mechanical performance and environmental sustainability, considering the bio-based nature of ESO.
The results for the flexural modulus presented in Figure 10 indicate that all composites containing 30 wt% ESO and 70 wt% DGEBA (III-2, IV-2, V-2, and VI-2) exhibited improved performance compared to the corresponding composites prepared with pure DGEBA epoxy resin (III-3, IV-3, V-3, and VI-3). In contrast, for the neat resin (examples I and II), the flexural modulus decreases with increasing ESO content. This behavior can be attributed to the structural role of ESO: incorporation of flexible aliphatic segments reduces crosslink density and increases polymer chain mobility, resulting in lower stiffness and higher flexibility.
In composites containing fibers, however, moderate ESO content (up to 30 wt%) leads to slight plasticization of the matrix, which improves fiber–matrix adhesion and stress transfer. As a result, the inherent high stiffness of the fibers dominates, enhancing the overall flexural modulus of the composite. In neat resin systems without reinforcing fibers, this beneficial effect is absent, so any ESO addition directly decreases stiffness. These observations are consistent with composite mechanics theory, where the effectiveness of stress transfer at the fiber–matrix interface critically determines the mechanical response. Moreover, the results suggest that tuning the resin composition allows optimization of both matrix flexibility and interfacial adhesion, providing a pathway to maximize composite performance.
These observations suggest that glass fiber–reinforced composites can accommodate ESO contents of 30 wt% or higher without significant deterioration—and in some cases with slight improvement—of their flexural mechanical properties, whereas the same ESO concentrations lead to a pronounced reduction in performance for neat resin samples.

3.1.2. DSC Analysis of Samples from Palates

As described in Section 2.3.2, thermal analyses of the plate samples were performed solely by DSC to determine the glass transition temperature (Tg). This approach was considered sufficient to assess the presence and approximate value of Tg, particularly for formulations containing 30 wt% ESO.
Consequently, in this section, the configuration for determining Tg (DSC analysis) on the samples I-1, I-2, I-3; III-1, III-2, III-3; and V-1, V-2, V-3 specimens are described. The glass transition temperatures (Tg) were determined from the midpoint of the step change in the heat flow. It can be observed that the incorporation of ESO influences Tg, with higher ESO content slightly lowering the Tg due to its plasticizing effect. The comparative Tg values are summarized in Figure 11.
From Figure 11 Tg decreases with increasing percentage of ESO. At 0% ESO, Tg is around 130 °C (average of all three measurements ~131 °C). At 30% ESO, Tg drops to about 118 °C (average ~118 °C). At 100% ESO, Tg sharply falls to approximately 62 °C. The differences between measurements I, III, and V are small but clear: Tg slightly increases from the first (I) to the last (V) measurement but remains close. From 0% to 30% ESO, Tg decreases by about 13% (from ~131 to ~118 °C). From 30% to 100% ESO, Tg decreases much more, by about 47% (from ~118 to ~62 °C). Overall, from 0% to 100%, Tg decreases by about 53%. ESO acts as a plasticizer, reducing the Tg of the system.
The results obtained are in good agreement with previously reported findings in the literature [5,7,9,13]. Increasing the ESO content enhances the mobility of the polymer chains, which consequently leads to a reduction in the glass transition temperature (Tg). This effect is nonlinear: at lower concentrations (0–30 wt%), the decrease in Tg is relatively modest, whereas at higher concentrations (30–100 wt%) the reduction becomes more pronounced. Such behavior is consistent with the well-established role of ESO as a plasticizer in epoxy networks, where its incorporation disrupts the rigidity of the thermally crosslinked structure, thereby softening the polymer matrix.

3.2. Results from Taguchi Method

Building upon preliminary small-scale laboratory tests, it was demonstrated that incorporating 30 wt% epoxidized soybean oil (ESO) with 70 wt% DGEBA into the reference epoxy formulation not only preserved, but in some cases even improved, specific mechanical properties. These results highlight the dual benefit of ESO incorporation: maintaining or enhancing mechanical and thermal performance while simultaneously introducing a biodegradable and renewable component into the epoxy network. Such an approach contributes to the broader goal of developing sustainable composite materials with reduced environmental impact.
In order to systematically assess the feasibility of applying ESO-modified epoxy systems in pultrusion processes, a mathematical model was established. For this purpose, critical input parameters were defined, experimental combinations were generated according to the Taguchi design, additional samples were manufactured, and flexural strength was evaluated (Section 2.4. The results of all eight experimental runs, corresponding to the factor levels presented in Table 3, are provided in Table 7. Furthermore, based on the Taguchi L8 orthogonal array, statistical measures including standard deviation (S), log(S), and signal-to-noise ratio (S/N ratio) were determined for each condition, as shown in Table 8. The optimization was carried out using the “larger-the-better” criterion, which facilitated the identification of significant factors under both technical and economic considerations, as expressed in the following equation:
S / N = 10   l o g 1 n i = 1 n 1 y i 2
The above analyses of Table 4 and Table 7 are summarized in Table 8, and Figure 12 and Figure 13, where the levels of key factors optimizing the response are listed.
The main effects plots for flexural strength and the S/N ratio (Figure 12) provide a clear representation of the influence of the examined factors on the mechanical performance of the composites. Among the studied variables, Factor D (fiber content) exhibits the most significant impact on flexural strength. Increasing the fiber content from level 0 to 60 resulted in a substantial improvement, with flexural strength rising from approximately 83.85 MPa to nearly 215.25 MPa, accompanied by a notable increase in the S/N ratio. This trend demonstrates not only an enhancement in the average flexural performance but also improved robustness and reproducibility of the results. Such behavior is in line with theoretical expectations and corroborates well-established findings in the literature, which emphasize the critical contribution of fiber reinforcement to the load-bearing capacity and structural reliability of polymer composites.
In comparison, Factors B (type of hardener), C (mixing time), and E (filler content, % CaCO3) exerted moderate to relatively minor effects, whereas Factors A (ESO content) and F (mixing temperature) produced only slight variations in both the mean flexural strength and the S/N ratio. The overall ranking of factor significance, therefore, confirms that the predominant contribution originates from Factor D (fiber content), followed by Factor B (type of hardener: MTHPA or EPH 866) and Factor E (filler content: CaCO3). The remaining factors, namely up to 30% ESO content and mixing temperature, can be regarded as negligible within the present optimization framework for flexural strength.
Nevertheless, the introduction of ESO (up to 30%) remains relevant from a sustainability perspective. Even though its effect on flexural performance is limited, ESO contributes as a renewable, biodegradable, and partially bio-based component within the epoxy formulation. This aligns with the broader objective of developing environmentally responsible composites, where mechanical optimization can be achieved predominantly through fiber reinforcement and hardener selection, while ESO incorporation addresses ecological considerations without severely compromising structural integrity.
The Taguchi analysis confirms that the optimization of the factors in Experiment No. 8 is crucial for achieving higher flexural strength. Accordingly, the optimal combination determined from this analysis is: A = 0–30 wt% ESO; B = MTHPA hardener; C = 2 min mixing time; D = glass fiber (f); E = 0–10 wt% CaCO3; F = 80 °C mixing temperature for ESO + DGEBA Factor A, corresponding to a 30% ESO content in the Taguchi optimization, has a minimal impact on the mechanical properties—approximately 0.77%—and can thus be regarded as negligible. This indicates that incorporating up to 30% ESO into the epoxy system (DGEBA/MTHPA/BDMA) does not significantly alter the mechanical performance of pultruded profiles. However, it remains important to consider how variations in Factor A could affect the pultrusion process when combined with the optimization of other factors in Section 3.3.

3.3. Test of Samples from Pultruded Rods

And with the combinations given in Section 2.4, pultruded rods were produced and tested, and the test results are given in the following Section 3.3.1 and Section 3.3.2.

3.3.1. Mechanical Properties of Pultruded Rods

For each group (R0–R8) of three samples, the breaking force (F) used in the above equation was obtained from the experimental load-displacement diagrams. The shear strength values were averaged, and the standard deviation was computed. The final results are presented in Figure 14. A total of 27 samples were tested, consisting of three replicates per rod across nine rods.
The shear strength data showed a continuous decrease in resistance with increasing ESO, even from low concentrations (about 20%). This indicates that ESO negatively affects the shear bonds within the material. A comparable phenomenon has been reported in previous studies [37,38,39,40,41,42,43,44,45,46], where weaker interfacial bonds and microdefects were observed to reduce shear strength, despite improvements in other mechanical properties.
The content of ESO in the material has a different effect on strength depending on the type of load. For compressive loading (Figure 15), the addition of ESO up to about 20% can improve the resistance of the material due to better structural connectivity or improved dispersion. However, higher amounts of ESO have a negative effect on the strength, probably due to the violation of homogeneity and the appearance of defects. For shear loading (Figure 14), ESO has a consistently negative effect, with even small amounts of ESO reducing shear strength. This may indicate that ESO weakens intermolecular or interfacial bonds that are critical for shear strength.
These results show that the compressive strength increases with the addition of ESO up to about 20%, where a maximum of 350 MPa is recorded, followed by a significant decrease at higher concentrations. Comparable findings have been reported by multiple authors, who documented similar phenomena under related experimental conditions [45,46,47,48,49,50,51], who also identified an optimal ESO content around 15–25% for maximum composite strength. They state that the beneficial effect of the modifier results from the improved flexibility and better dispersion of ESO in the epoxy matrix, which enhances the compression resistance. On the other hand, at higher percentages of ESO, a decrease in mechanical properties was observed, which can be explained by microstructural changes and the formation of defects, which is in accordance with the observations of Kumar et al. [34,36]. They point out that an excessive amount of ESO can lead to phase separation and a decrease in interfacial cohesion, which weakens the material.
The difference in behavior between pressure and shear can be explained by the fact that shear forces require a tighter and more homogeneous structure of intermolecular bonds, while a certain flexibility brought by ESO may be more useful in compressive and bending loads. The optimal ESO content should be carefully selected depending on the type of loading to which the material will be exposed. If the goal is to increase compressive strength, 20% ESO is optimal. But if shear resistance is important, it is advisable to minimize ESO.

3.3.2. Thermal Properties (DSC/TGA) of Pultruded Rods

The thermal behavior of the analyzed samples was investigated by DSC and TGA, with the results presented in Figure 16, Figure 17 and Figure 18. Table 9 and Table 10 summarizes the glass transition temperature (Tg) and thermal degradation data for all compositions.
DSC Analysis for Determining Tg of Samples R0–R8
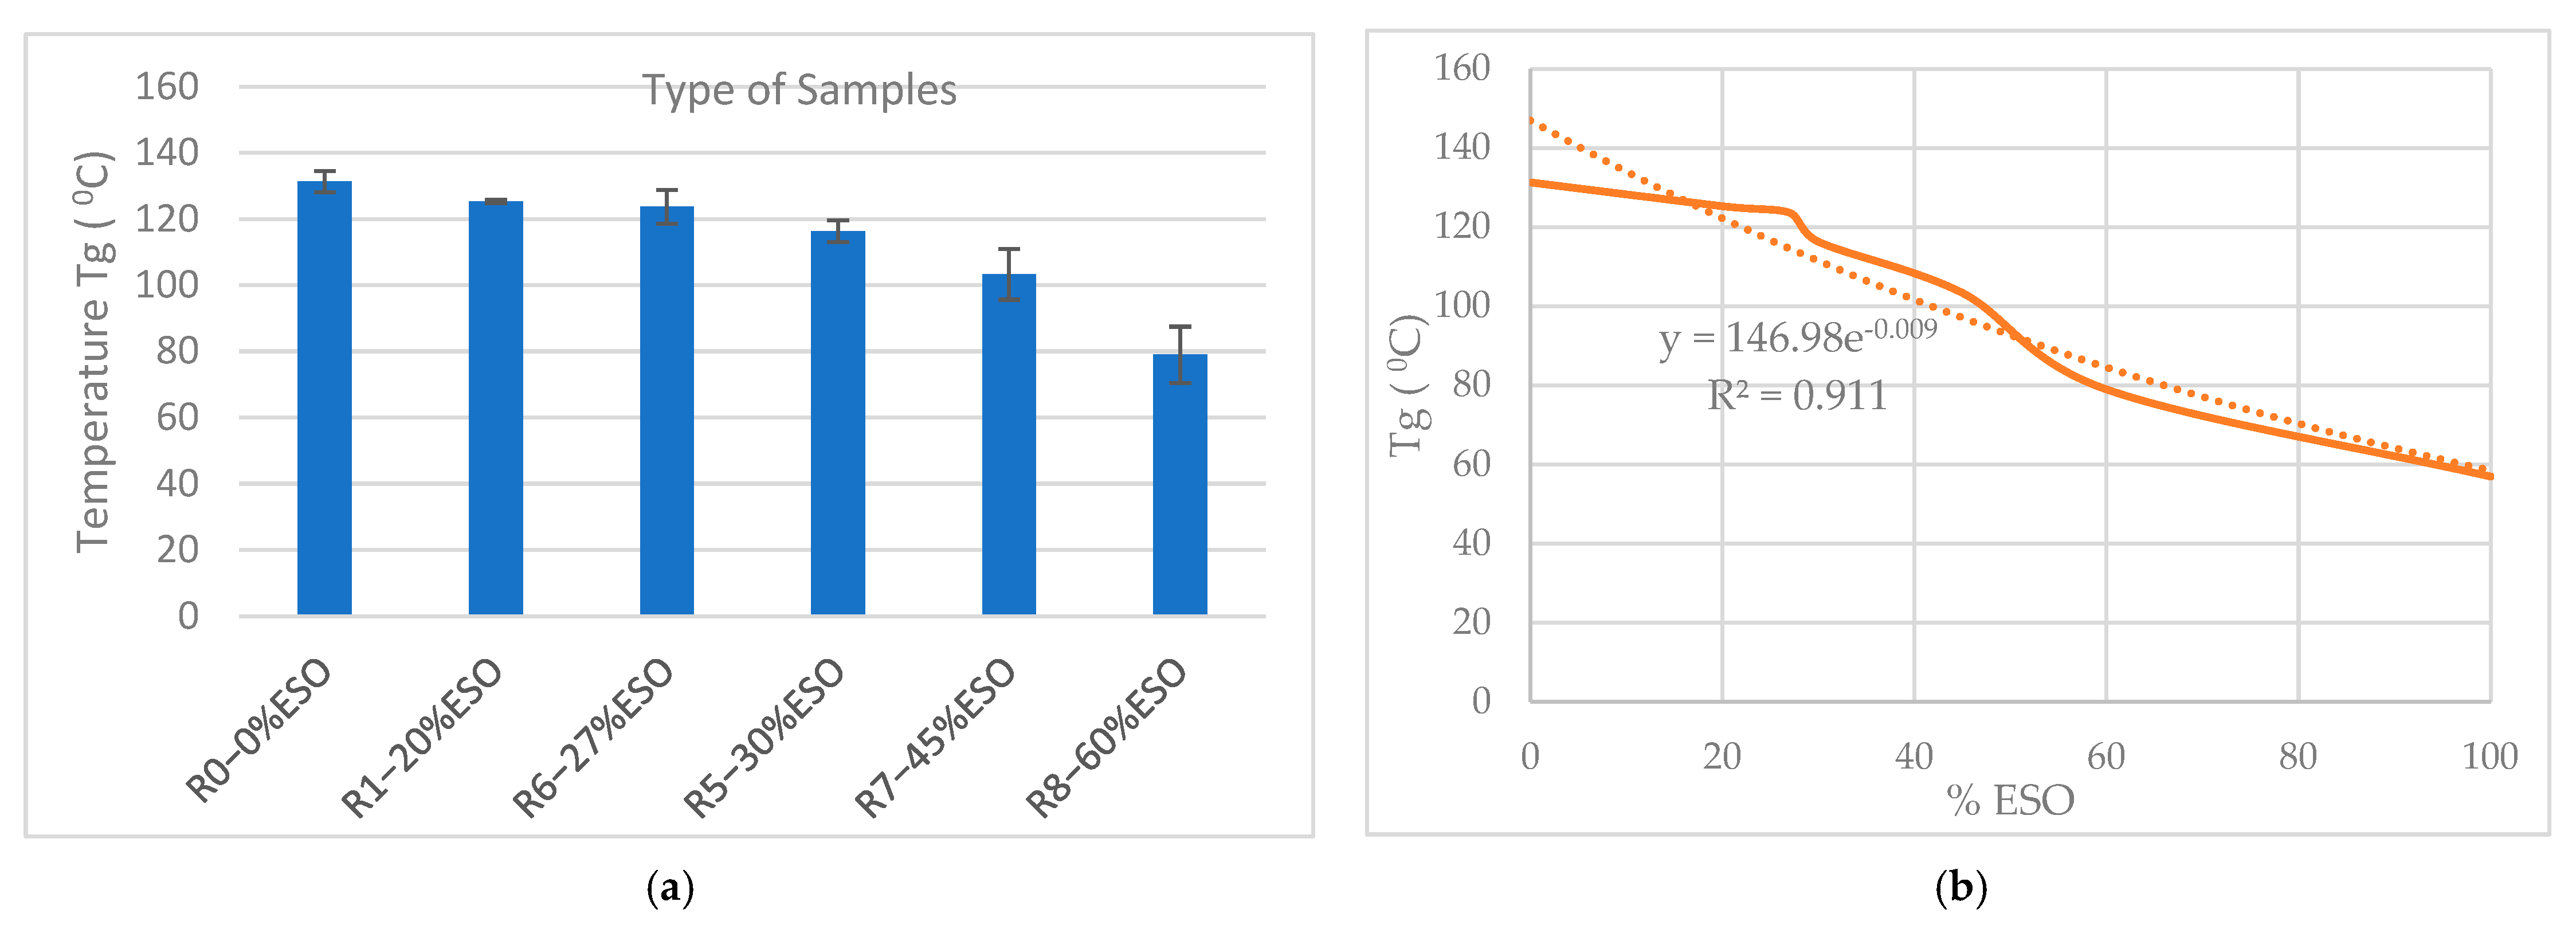
The graphs presented in Figure 16 illustrate the effect of ESO content on the glass transition temperature (Tg) of the epoxy matrix. The bar chart (Figure 16a) clearly indicates that increasing ESO content from 0% to 50% results in a gradual decrease in Tg. For the pure epoxy resin (R0, 0% ESO), Tg is the highest (~135 °C). At 20–27% ESO, Tg remains relatively high (around 120–125 °C), suggesting that the crosslinked network is largely preserved at these ESO levels. With a further increase to 39% and 45% ESO, Tg decreases to approximately 110 °C, indicating that ESO acts as a plasticizer and reduces the rigidity of the network. The lowest Tg is observed at 50% ESO (~80 °C), representing a significant drop compared to the neat resin.
Linear regression analysis (Figure 16b) demonstrates an exponential relationship between Tg and ESO content, with a coefficient of determination (R2 = 0.911), indicating a strong correlation. The observed decrease in Tg with increasing ESO reflects the plasticizing effect of ESO, which lowers the crosslink density and enhances polymer chain mobility. Within the 0–30 wt% ESO range, Tg decreases gradually from 131.3 °C to 116.3 °C, indicating that the network retains most of its connectivity and structural rigidity. Beyond 30 wt% ESO, Tg drops more sharply, reaching 57 °C at 100 wt% ESO, which demonstrates pronounced plasticization and softening of the material.
The three independent Tg measurements exhibit minor variations, confirming good reproducibility. However, larger deviations are observed at higher ESO content, likely due to increased chain mobility and the resulting difficulty in precisely determining Tg. These findings highlight the critical role of ESO as a plasticizer and underscore the balance between flexibility and network integrity in epoxy/ESO systems.
TGA Analysis of Samples R0–R8
TGA analysis was used in this study to determine the thermal stability and degradation behaviors of DGEBA epoxy, ESO, and its blends in pultruded rods (R0–R8). Figure 17 shows the TGA curves of the anhydride cured DGEBA epoxy, ESO, and epoxy/20%ESO blend system, at a 20 °C/min heating rate in a nitrogen atmosphere. The thermal stability parameters such as, Toneset, T5, T10, T50, Tendset, and glass fiber residue weight (%) at 700 °C (R700) are presented in Table 10.
The anhydride cured ESO system demonstrated a two-stage thermal degradation temperature with Tonset degradation occurring at 283 °C and final degradation (Tendset) occurring at 595 °C with 78% glass fiber residue. The initial stage degradation correlating with the release of the low molecular weight compound, such as unreacted MTHPA, shows a lower thermal stability, while the cured virgin epoxy resin exhibited higher initial and comparable.
Furthermore the 5%, 10%, and 50% weight loss thermal degradation (T5, T10, T50) of the 60%ESO (R8) and DGEBA epoxy (R0) is observed at 230 °C, 290 °C, and 370 °C, respectively, much lower than that of DGEBA epoxy (340 °C, 368 °C, 400 °C) because of reduced the crosslink density of the ESO bioresin system. Similar results have been reported by Kumar et al. [34].
TGA analysis (Figure 18) shows that the temperature at 5% mass loss (T_d5%) decreases from ~340 °C for neat DGEBA to ~230 °C for 100 wt% ESO, while the temperature at maximum degradation rate (T_dmax) declines from ~400 °C to ~330 °C. The decrease is gradual up to 50–60 wt% ESO, after which a sharper decline indicates reduced thermal stability at higher ESO contents. The presence of polar ester bonds in ESO contributes to early thermal decomposition (~300 °C). Although MTHPA crosslinks with ESO, the resulting network is less rigid than that of DGEBA, leading to initial degradation of alkyl and ester groups, followed by slower network decomposition if DGEBA is present.
Several studies in the literature [5,7,9,10,11,12,34] have investigated the thermal characteristics of modified epoxy resins containing different amounts of ESO (10, 20, 30, 40, and 100%). However, there is still limited research focused on the thermal analysis of composites, particularly glass fiber–reinforced systems with ESO-modified epoxy matrices. The few available studies are often restricted to finished products, such as pultruded profiles, and mainly provide preliminary insights. The thermal analyses presented here represent only an initial step toward understanding the behavior of such composites. To obtain a more comprehensive picture, further investigations are required, including techniques such as dynamic mechanical analysis (DMA), kinetics for different modified ESO epoxy systems and optical and scanning electron microscopy (SEM). These methods will enable a deeper evaluation of how varying ESO content influences the thermal stability, morphology, and overall performance of the final composite materials.

4. Conclusions

In this study, blends of epoxidized soybean oil (ESO) with bisphenol-A–based epoxy resin (DGEBA) were systematically investigated. The obtained results show strong agreement with previously reported data, thereby reinforcing the reliability of the present findings and providing valuable insights into the modification mechanisms imparted by ESO. Such consistency with the literature highlights the broader scientific and industrial relevance of these formulations and establishes a solid foundation for the rational design of tailored polymer matrices.
This study demonstrates that the application of the Taguchi design methodology enables the identification of parameters with negligible influence on mechanical performance, allowing their fixation as constants in subsequent processing routes such as pultrusion. In particular, the incorporation of ESO up to 30 wt% was shown to exert no statistically significant effect on the studied mechanical properties, suggesting that ESO can be introduced into the epoxy network without compromising structural integrity. Moreover, the feasibility of further increasing the fraction of renewable or partially renewable constituents—either by raising the ESO content or introducing aliphatic epoxies—was confirmed within the operational limits of the system.
Importantly, the formulation containing 30 wt% ESO in the DGEBA matrix exhibited optimal mechanical behavior, balancing enhanced toughness with industrial applicability. This composition is particularly suitable for pultruded components where improved flexibility is required without sacrificing strength and stiffness. Additionally, the economic advantage of ESO compared to DGEBA represents a further benefit, reducing production costs while maintaining satisfactory performance.
Future work should focus on advanced microstructural characterization and an expanded set of thermo-mechanical analyses (e.g., DMA) to clarify the functional role of ESO within the polymer network and to enable fine-tuning of the formulations. Such investigations will support the development of high-performance, cost-effective, and more sustainable epoxy systems for demanding engineering applications.

Author Contributions

Conceptualization, S.R. and I.V.; methodology, S.R. and A.P.; software, A.P.; validation, S.R., I.V. and A.P.; formal analysis, S.R. and A.P.; investigation, S.R. and A.P.; resources, I.V. and E.G.A.; data curation, S.R.; writing—original draft preparation, S.R. and A.P.; writing—review and editing, I.V. and E.G.A.; visualization, A.P.; supervision, I.V. and E.G.A.; project administration, A.P. and E.G.A.; funding acquisition, I.V. and E.G.A. All authors have read and agreed to the published version of the manuscript.

Funding

This research received no external funding.

Data Availability Statement

The data presented in this study are available from the corresponding author upon request.

Acknowledgments

The composite production was carried out in company Europrofil. A.D. Krusevo. The mechanical/thermal analysis was performed at the company Laminati Kom Prilep N. Macedonia, and the optical analyses were performed at the Faculty of Technology, Goce Delcev University Stip (North Macedonia). The authors are very grateful to all these institutions for their support in undertaking this research project.

Conflicts of Interest

Authors Svetlana Risteska, Ivan Vasileski, Evgenija Gjorgjieska Angelovska and Aleksandar Pižov were employed by the company Laminati Kom D.O.O. The remaining authors declare that the research was conducted in the absence of any commercial or financial relationships that could be construed as a potential conflict of interest.

Abbreviations

The following abbreviations are used in this manuscript:
ESOEpoxidized soybean oil
DGEBADiglycidyl ether of bisphenol A
MTHPAMethyl tetrahydro phthalic anhydride
BDMABenzyl dimethyl amine from Huntsman
DSCDifferential scanning calorimetry
TGAThermogravimetric analysis
TgGlass-transition temperature

References

  1. Mohanty, A.K.; Misra, M.; Drzal, L.T.; Selke, S.E.; Harte, B.R.; Hinrichsen, G. Natural fibers, biopolymers, and biocomposites: An Introduction. In Natural Fibers, Biopolymers, and Biocomposites; Mohanty, A.K., Misra, M., Drzal, L.T., Eds.; Taylor & Francis Group: Boca Raton, FL, USA, 2005; pp. 1–36. [Google Scholar]
  2. Soroudi, A.; Jakubowicz, I. Recycling of bioplastics, their blends and bio composites: A review. Eur. Polym. J. 2013, 49, 2839–2858. [Google Scholar] [CrossRef]
  3. Pickering, S.J. Recycling technologies for thermoset composite materials—Current status. Compos. Part A Appl. Sci. Manuf. 2006, 37, 1206–1215. [Google Scholar] [CrossRef]
  4. Fombuena, V.; Bernardi, L.; Fenollar, O.; Boronat, T.; Balart, R. Characterization of green composites from biobased epoxy matrices and bio-fillers derived from seashell wastes. Mater. Des. 2014, 57, 168–174. [Google Scholar] [CrossRef]
  5. Chen, Y.; Liting, Y.; Wu, J.; Ma, L.; Finlow, D.E.; Lin, S.; Song, K. Thermal and mechanical properties of epoxy resin toughened with epoxidized soybean oil. J. Therm. Anal. Calorim. 2013, 113, 939–945. [Google Scholar] [CrossRef]
  6. Senthilkumar, K.; Ungtrakul, T.; Chandrasekar, M.; Kumar, T.S.M.; Rajini, N.; Siengchin, S.; Pulikkalparambil, H.; Parameswaran pillai, J.; Ayrilmis, N. Performance of Sisal/Hemp Bio-based Epoxy Composites Under Accelerated Weathering. J. Polym. Environ. 2021, 29, 624–636. [Google Scholar] [CrossRef]
  7. Altuna, F.; Esposito, L.; Ruseckaite, R.; Stefani, P. Thermal and Mechanical Properties of Anhydride-Cured Epoxy Resins with Different Contents of Biobased Epoxidized Soybean Oil. J. Appl. Polym. Sci. 2011, 120, 789–798. [Google Scholar] [CrossRef]
  8. Samper, M.; Fombuena, V.; Boronat, T.; Garcia-Sanoguera, D.; Balart, R. Thermal and Mechanical Characterization of Epoxy Resins (ELO and ESO) Cured with Anhydrides. J. Am. Oil Chem. Soc. 2012, 89, 1521–1528. [Google Scholar] [CrossRef]
  9. Wang, Z.; Cao, N.; He, J.; Du, R.; Liu, Y.; Zhao, G. Mechanical and anticorrosion properties of furan/epoxy-based basalt f iber-reinforced composites. J. Appl. Polym. Sci. 2017, 134, 44799. [Google Scholar] [CrossRef]
  10. Wu, M.S.; Jin, B.C.; Li, X.; Nutt, S. A recyclable epoxy for composite wind turbine blades. Adv. Manuf. Polym. Compos. Sci. 2019, 5, 114–127. [Google Scholar] [CrossRef]
  11. Liu, G.; Jin, C.; Huo, S.; Kong, Z.; Chu, F. Preparation and properties of novel bio-based epoxy resin thermosets from lignin oligomers and cardanol. Int. J. Biol. Macromol. 2021, 193, 1400–1408. [Google Scholar] [CrossRef]
  12. Mattar, N.; de Anda, A.R.; Vahabi, H.; Renard, E.; Langlois, V. Resorcinol-Based Epoxy Resins Hardened with Limonene and Eugenol Derivatives: From the Synthesis of Renewable Diamines to the Mechanical Properties of Biobased Thermosets. ACS Sustain. Chem. Eng. 2020, 8, 13064–13075. [Google Scholar] [CrossRef]
  13. Capretti, M.; Giammaria, V.; Santulli, C.; Boria, S.; Del Bianco, G. Use of Bio-Epoxies and Their Effect on the Performance of Polymer Composites: A Critical Review. Polymers 2023, 15, 4733. [Google Scholar] [CrossRef] [PubMed]
  14. Gonçalves, F.A.M.M.; Santos, M.; Cernadas, T.; Ferreira, P.; Alves, P. Advances in the development of biobased epoxy resins: Insight into more sustainable materials and future applications. Int. Mater. Rev. 2021, 67, 119–149. [Google Scholar] [CrossRef]
  15. Ramon, E.; Sguazzo, C.; Moreira, P.M.G.P. A Review of Recent Research on Bio-Based Epoxy Systems for Engineering Applications and Potentialities in the Aviation Sector. Aerospace 2018, 5, 110. [Google Scholar] [CrossRef]
  16. Park, S.; Jin, F.; Lee, J. Effect of Biodegradable Epoxidized Castor Oil on Physicochemical and Mechanical Properties of Epoxy Resins, Macromol. Chem. Phys. 2004, 205, 2048–2054. [Google Scholar]
  17. Niedermann, P.; Szebényi, G.; Toldy, A. Effect of Epoxidized Soybean Oil on Curing, Rheological, Mechanical and Thermal Properties of Aromatic and Aliphatic Epoxy Resins. J. Polym. Environ. 2014, 22, 525–536. [Google Scholar] [CrossRef]
  18. Lim, S.J.; Kim, D.S. Effect of functionality and content of epoxidized soybean oil on the physical properties of a modified diglycidyl ether of bisphenol A resin system. J. Appl. Polym. Sci. 2021, 138, app50441. [Google Scholar] [CrossRef]
  19. Salam, H.; Dong, Y.; Davies, I.J.; Pramanik, A. Optimization of material formulation and processing parameters in relation to mechanical properties of bioepoxy/clay nanocomposites using Taguchi design of experiments. J. Appl. Polym. Sci. 2018, 135, 45769. [Google Scholar]
  20. Chebotar, A.; Domnich, B.; Panchenko, Y.; Donchak, V.; Stetsyshyn, Y.; Voronov, A. Thermal behavior of polymers and copolymers based on plant oils with differing saturated and monounsaturated content. Polym. Int. 2025, 74, 179–285. [Google Scholar]
  21. Zhang, T.; Chao, X.; Liang, J.; Wang, B.; Sun, M. Enhanced Mechanical Properties of Epoxy Composites Reinforced with Silane- Modified Al2O3 Nanoparticles: An Experimental Study. J. Compos. Sci. 2025, 9, 252. [Google Scholar] [CrossRef]
  22. ASTM E1868-10; Standard Test Method for Total Carbon and Organic Carbon in Water by High Temperature Combustion. ASTM International: West Conshohocken, PA, USA, 2012.
  23. Risteska, S.; Stefanovska, M.; Samakoski, B. Factorial Design of Experiment vs. Taguchi Approach in Filament Wound Composites. In Proceedings of the 6th International Symposium on Industrial Engineering, Belgrade, Serbia, 24–25 September 2015. [Google Scholar]
  24. Jin, F.-L.; Park, S.-J. Impact-strength improvement of epoxy resins reinforced with a biodegradable polymer. Mater. Sci. Eng. A 2008, 478, 402–405. [Google Scholar] [CrossRef]
  25. Bagheri, S.; Nejad, M. Fully biobased composite made with epoxidized lignin, reinforced with bamboo fibers. Polym. Compos. 2023, 44, 3926–3938. [Google Scholar] [CrossRef]
  26. Jin, F.; Park, S. Thermomechanical behavior of epoxy resins modified with epoxidized vegetable oils. Polym. Int. 2008, 57, 577–583. [Google Scholar] [CrossRef]
  27. Di Mauro, C.; Malburet, S.; Genua, A.; Graillot, A.; Mija, A. Sustainable Series of New Epoxidized Vegetable Oil-Based Thermosets with Chemical Recycling Properties. Biomacromolecules 2020, 21, 3923–3935. [Google Scholar] [CrossRef] [PubMed]
  28. España, J.M.; Sánchez-Nacher, L.; Boronat, T.; Fombuena, V.; Balart, R. Properties of Biobased Epoxy Resins from Epoxidized Soybean Oil (ESBO) Cured with Maleic Anhydride (MA). J. Am. Oil Chem. Soc. 2012, 89, 2067–2075. [Google Scholar] [CrossRef]
  29. Li, J.; Du, Z.; Li, H.; Zhang, C. Porous epoxy monolith prepared via chemically induced phase separation. Polymer 2009, 50, 1526–1532. [Google Scholar] [CrossRef]
  30. Liu, Z.; Erhan, S.; Calvert, P. Solid freeform fabrication of epoxidized soybean oil/epoxy composite with bis or polyalkyleneamine curing agents. Compos. Part A 2007, 38, 87–93. [Google Scholar] [CrossRef]
  31. Bhosale, S.H.; Singh, V.V.; Rangasai, M.C.; Bandyopadhyay-Ghosh, S.; Ghosh, S.B. Integration of biobased functionalized feedstock and plastisol in epoxy resin matrix toward developing structural jute biocomposites with enhanced impact strength and moisture resistance properties. Polym. Composites. 2016, 37, 391–397. [Google Scholar] [CrossRef]
  32. Chen, Y.; Xi, Z.; Zhao, L. Curing kinetics of bio-based epoxy resin based on epoxidized soybean oil and green curing agent. AIChE J. 2017, 63, 147–153. [Google Scholar] [CrossRef]
  33. Toldy, A. Development of Environmentally Friendly Epoxy Resin Composites. Doctoral Thesis, Budapest University of Technology and Economics, Budapest, Hungary, 2017. [Google Scholar]
  34. Kumar, S.; Samal, S.K.; Mohanty, S.; Nayak, S.K. Epoxidized soybean oil-based epoxy blend cured with Anhydride based crosslinker: Thermal and Mechanical Characterization. Ind. Eng. Chem. Res. 2017, 56, 687–698. [Google Scholar] [CrossRef]
  35. Boursier Niutta, C.; Ciardiello, R.; Tridello, A.; Paolino, D.S. Epoxy and Bio-Based Epoxy Carbon Fiber Twill Composites: Comparison of the Quasi-Static Properties. Materials 2023, 16, 1601. [Google Scholar] [CrossRef]
  36. ASTM D790-17; Standard Test Methods for Flexural Properties of Unreinforced and Reinforced Plastics and Electrical Insulating Materials. ASTM International: West Conshohocken, PA, USA, 2017.
  37. EN ISO 14125; Fibre-Reinforced Plastic Composites—Determination of Flexural Properties. International Organization for Standardization: Geneva, Switzerland, 1998.
  38. ISO 11357-1; Plastics—Differential Scanning Calorimetry (DSC) Part 1: General Principles. International Organization for Standardization: Geneva, Switzerland, 2023.
  39. Ganesh Gupta, K.B.N.V.S.; Hiremath, M.M.; Prusty, R.K.; Ray, B.C. Development of advanced fiber-reinforced polymer composites by polymer hybridization technique: Emphasis on cure kinetics, mechanical, and thermomechanical performance. J. Appl. Polym. Sci. 2020, 137, 49318. [Google Scholar] [CrossRef]
  40. Hazer, B.; Kalaycı, Ö.A. High fluorescence emission silver nano particles coated with poly (styrene-g-soybean oil) graft copolymers: Antibacterial activity and polymerization kinetics. Mater. Sci. Eng. C 2017, 74, 259–269. [Google Scholar] [CrossRef] [PubMed]
  41. Veloso-Fernández, A.; Ruiz-Rubio, L.; Yugueros, I.; Moreno-Benítez, M.I.; Laza, J.M.; Vilas-Vilela, J.L. Improving the Recyclability of an Epoxy Resin through the Addition of New Biobased Vitrimer. Polymers 2023, 15, 3737. [Google Scholar] [CrossRef] [PubMed]
  42. Sanivada, U.K.; Brito, F.P.; Moreira, I.P.; Fangueiro, R. Optimization of Processing Parameters of Compression Molding Process by Application of Taguchi and Minitab. Mater. Proc. 2022, 8, 31. [Google Scholar]
  43. Mohsin, I.; He, K.; Li, Z.; Zhang, F.; Du, R. Optimization of the Polishing Efficiency and Torque by Using Taguchi Method and ANOVA in Robotic Polishing. Appl. Sci. 2020, 10, 824. [Google Scholar] [CrossRef]
  44. Yusuf, S.S.; Islam, M.N.; Ali, M.H.; Akram, M.W.; Siddique, M.A. Towards the optimization of process parameters for impact strength of natural fiber reinforced composites: Taguchi method. Adv. Mater. Sci. 2020, 20, 54–70. [Google Scholar] [CrossRef]
  45. Owaid, A.A.; Kaygusuz, H.; Mohammed, F.M. Effect of reinforcing materials on mechanical properties of composite material using Taguchi method. J. Phys. Conf. Ser. 2021, 1973, 012246. [Google Scholar] [CrossRef]
  46. Bagci, M.; Imrek, H. Application of Taguchi method on optimization of testing parameters for erosion of glass fiber reinforced epoxy composite materials. Mater. Des. 2013, 46, 706–712. [Google Scholar] [CrossRef]
  47. Beylergil, B.; Al-Nadhari, A.; Yildiz, M. Optimization of Charpy-impact strength of 3D-printed carbon fiber/polyamide composites by Taguchi method. Polym. Compos. 2023, 44, 2846–2859. [Google Scholar] [CrossRef]
  48. Pawar, J.; Malagi, R.R.; Jadhav, M.; Pawar, G. Enhanced biodegradability and mechanical properties in green composites: A Taguchi approach. Discov. Appl. Sci. 2025, 7, 47. [Google Scholar] [CrossRef]
  49. Zhu, J.; Chandrashekhara, K.; Flanigan, V.; Kapila, S. Manufacturing and mechanical properties of soy-based composites using pultrusion. Compos. Part A 2004, 35, 95–101. [Google Scholar] [CrossRef]
  50. Wang, R. Manufacturing of Vegetable Oils-Based Epoxy and Composites for Structural Applications. Doctoral Dissertation, Missouri University of Science and Technology, Rolla, MO, USA, 2014. [Google Scholar]
  51. Mustata, F.; Tudorachi, N.; Rosu, D. Curing and thermal behavior of resin matrix for composites based on epoxidized soybean oil/diglycidyl ether of bisphenol A. Compos. Part B 2011, 42, 1803–1812. [Google Scholar] [CrossRef]
  52. ASTM D4475-96; Standard Test Method for Apparent Horizontal Shear Strength of Pultruded Reinforced Plastic Rods By The Short-Beam Metho. ASTM International: West Conshohocken, PA, USA, 2017.
  53. ASTM D695-23; Standard Test Method for Compressive Properties of Rigid Plastics. ASTM International: West Conshohocken, PA, USA, 2023.
  54. Zhu, J.; Chandrashekhara, K.; Flanigan, V.; Kapila, S. Curing and mechanical characterization of a soy-based epoxy resin system. J. Appl. Polym. Sci. 2004, 91, 3513–3518. [Google Scholar] [CrossRef]
  55. Sudha, G.S.; Kalita, H.; Mohanty, S.; Nayak, S. Biobased Epoxy Blends from Epoxidized Castor Oil: Effect on Mechanical, Thermal, and Morphological Properties. Macromol. Res. 2017, 25, 420–430. [Google Scholar] [CrossRef]
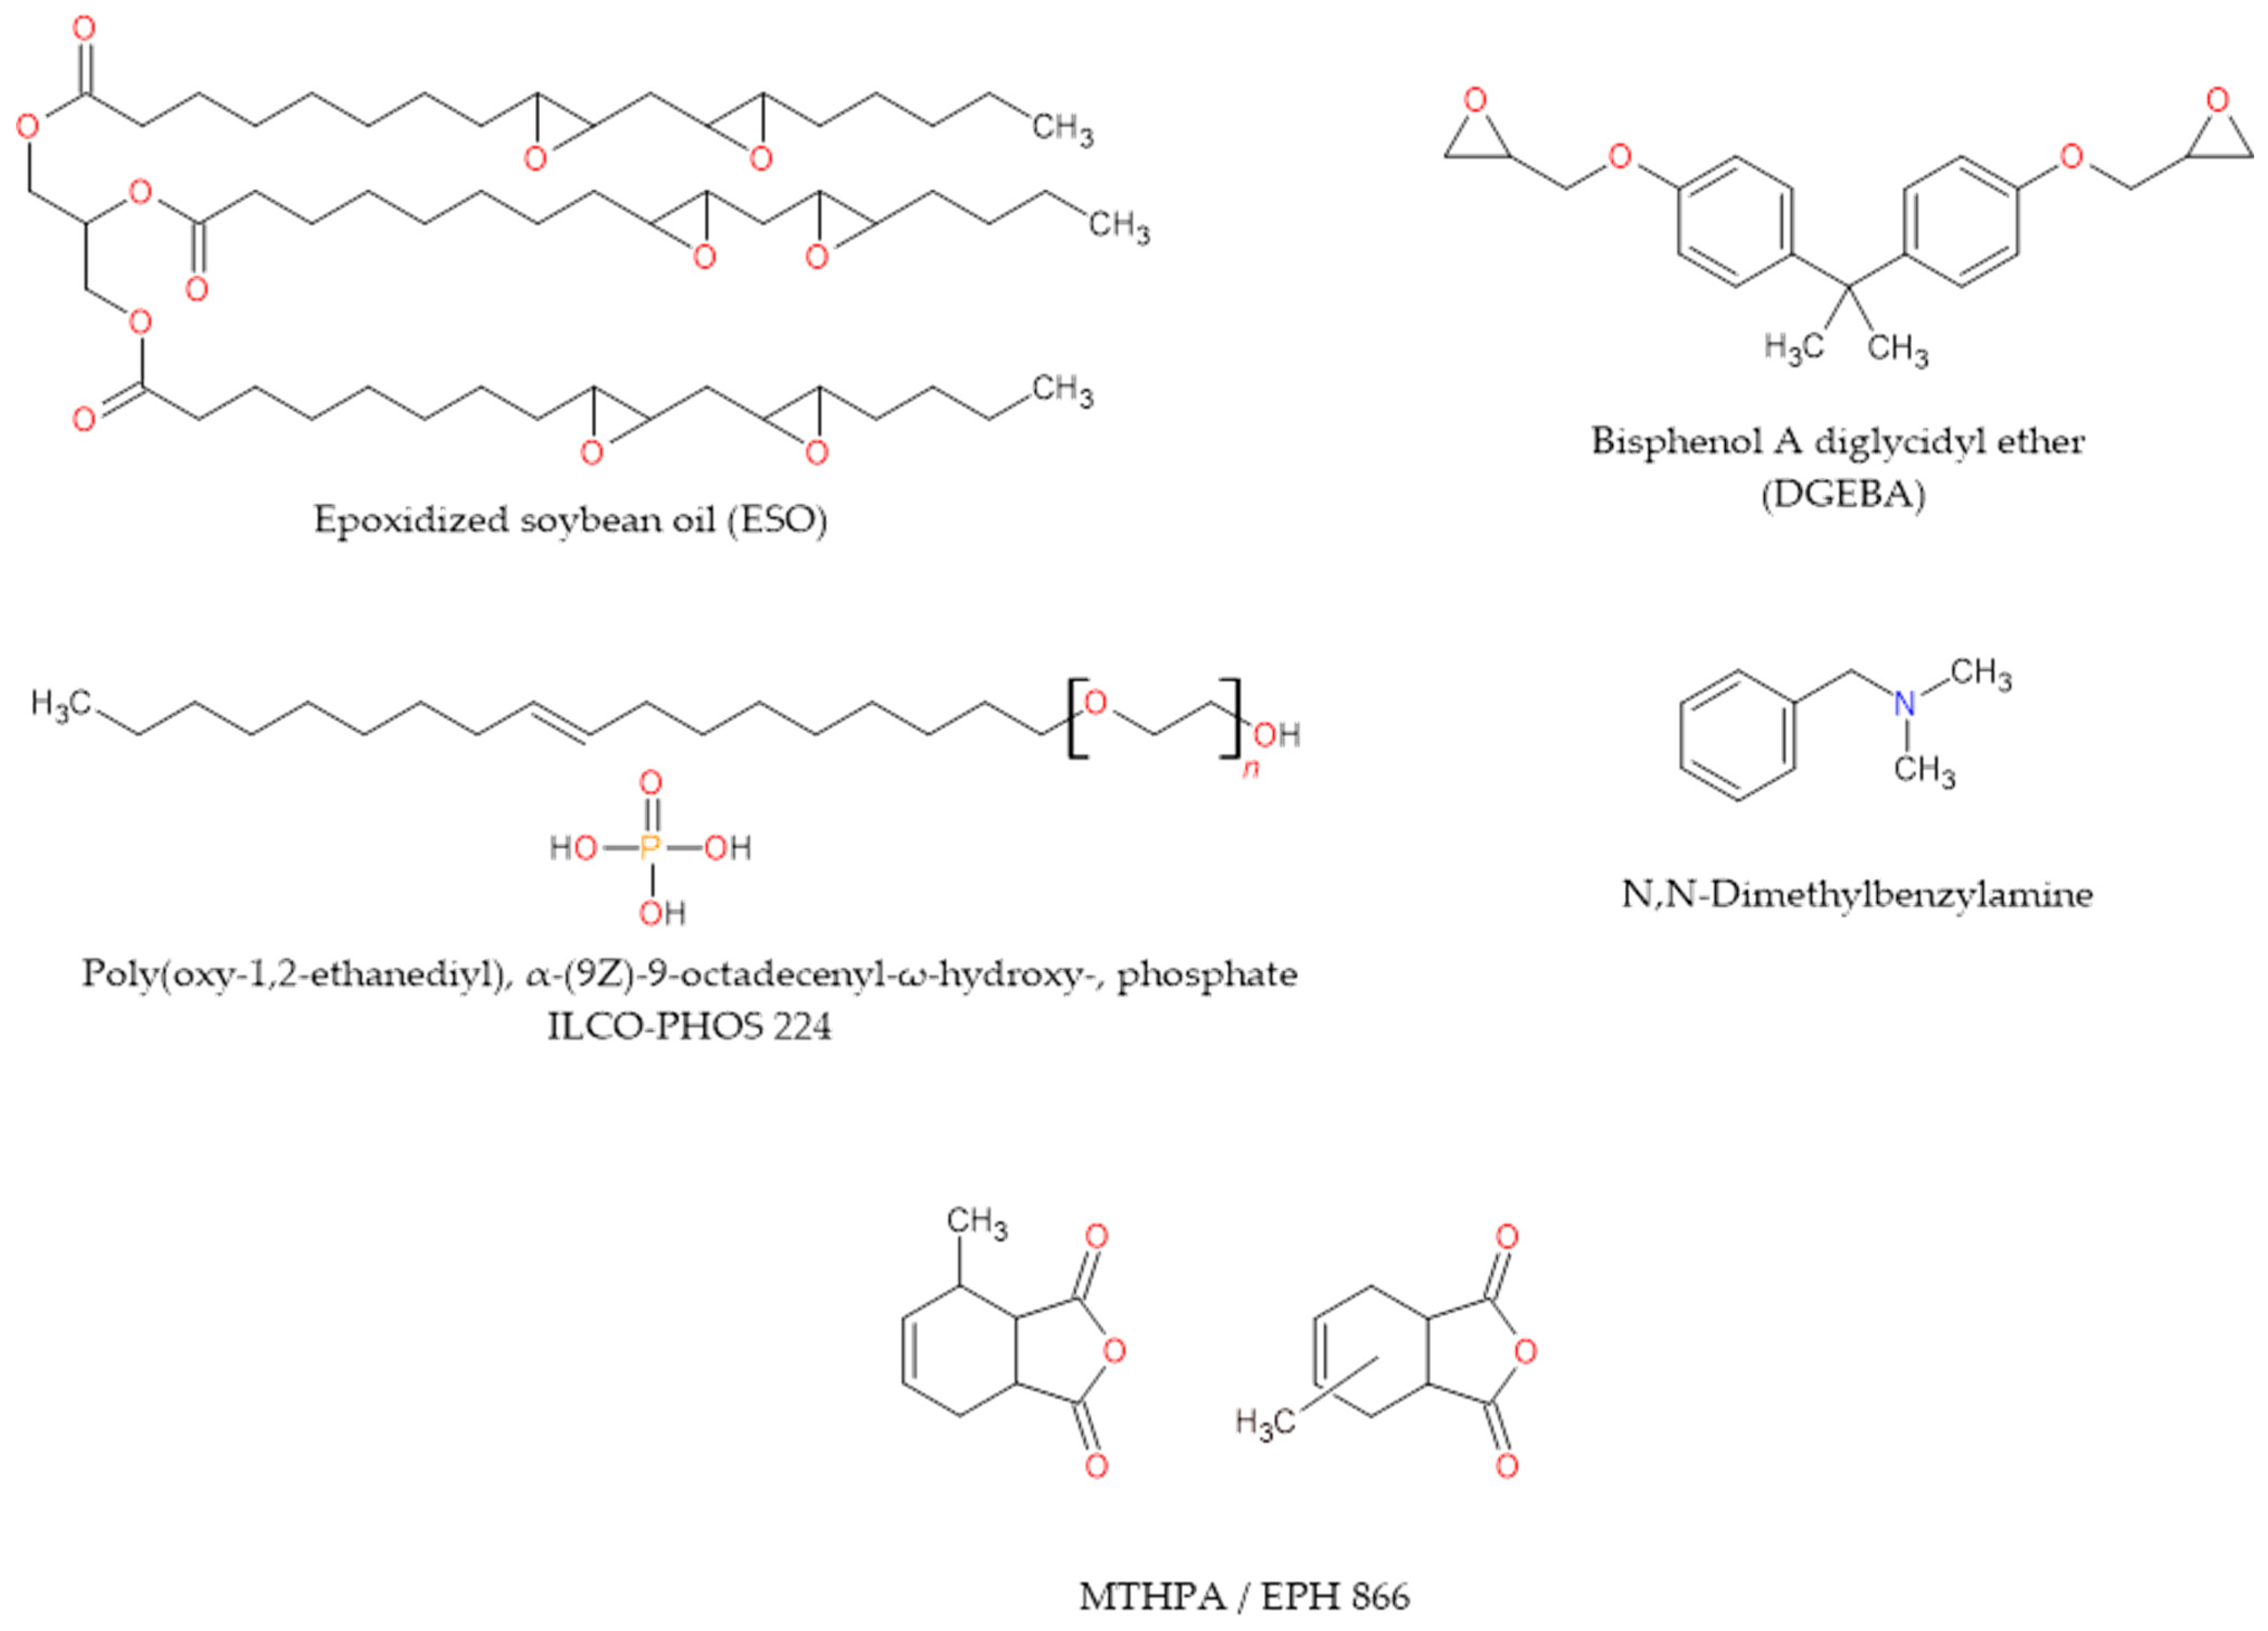
Figure 1. The chemical structures of all polymers and reagents.
Jcs 09 00513 g001
Figure 2. Prepared samples for bending testing I-1, I-2, I-3 and II-1, II-2, II-3.
Jcs 09 00513 g002
Figure 3. Prepared samples for bending testing III-1, III-2, III-3 and IV-1, IV-2, IV-3.
Jcs 09 00513 g003
Figure 4. Universal testing machine and diagram F–L.
Jcs 09 00513 g004
Figure 5. (a) AT 451 DSC instrument, (b) DSC diagram from sample III-3, (c,d) diagram/method for determining Tg.
Jcs 09 00513 g005
Figure 6. The schematic representation of the pultrusion process.
Jcs 09 00513 g006
Figure 7. Prepared specimens (R0–R8) for shear tests.
Jcs 09 00513 g007
Figure 8. Prepared specimens (R0–R8) for compression tests.
Jcs 09 00513 g008
Figure 9. Flexural strength (3pbt test) of all samples: I−1, I−2, I−3; II−1, II−2, II−3; III−1, III−2, III−3; IV −1, IV−2, IV−3; V−1, V−2, V−3; and VI−1, VI−2, VI−3.
Jcs 09 00513 g009
Figure 10. Flexural modules (3pbt test) of all samples: I−1, I−2, I−3; II−1, II−2, II−3; III−1, III−2, III−3; IV−1, IV−2, IV−3; V−1, V−2, V−3; and VI−1, VI−2, VI−3.
Jcs 09 00513 g010
Figure 11. Comparation of Tg at samples. (a) I-1, I-2, I-3; (b) III-1, III-2, III-3; and (c) V-1, V-2, V-3.
Jcs 09 00513 g011
Figure 12. Main effects (mean and S/N).
Jcs 09 00513 g012
Figure 13. % Contribution vs. factors (A, B, C, D, E and F).
Jcs 09 00513 g013
Figure 14. Shear strength vs. %ESO in pultruded rods R0–R8.
Jcs 09 00513 g014
Figure 15. Compression strength vs. %ESO in pultruded rods R0–R8.
Jcs 09 00513 g015
Figure 16. Tg calculation from DSC (a) Average Tg for samples with different % at ESO (R0–R8) (b) diagram Tg vs %ESO.
Jcs 09 00513 g016
Figure 17. TGA of samples R0–R8.
Jcs 09 00513 g017
Figure 18. TGA of epoxy system (DGEBA/MTHPA/BDMA) with wt% ESO.
Jcs 09 00513 g018
Table 1. Characteristics of the materials.
Epoxy ResinCuring Agent 1Curing Agent 2CatalystRelease MoldFillerEpoxidized Soybean OilReinforcement
Nonwoven/Fiber
TypeKER 828MTHPAEPH 866BDMAILCHO
224
CaCO3ESOE Glass—MatE Glass
Roving
E Glass Fabric
Density at 20 °C g/cm31.161.19–1.211.19–1.230.892–0.8981.032.70.988–0.9982.51–2.632.5–2.62.51–2.6
Viscosity at 25 °C mPas12,000–14,00050–7055–75902300Particles
<2 µm
325///
EEW/AEW g/eq.184–190163166///220–246///
Epoxy value % / / / / //>6.5///
Iodine value %//////<5///
Acid value mg KOH/g//////<0.5///
weigh g/m2/tex///////3504800200
Table 2. Manufacture of the plates from pure resins.
Marking
/Code
Plate
I-1
Plate
I-2
Plate
I-3
Plate
II-1
Plate
II-2
Plate
II-3
ESO%100300100300
DGEBA%070100070100
Type Curing Agent 85%MTHPAMTHPAMTHPAEPH 866EPH 866EPH 866
Catalyst 2–3%BDMA
Table 3. Manufacture of composite plates.
Marking
/Code
Plate
III-1
Plate
III-2
Plate
III-3
Plate
IV-1
Plate
IV-2
Plate
IV-3
Reinforcements8 layers of MAT continue glass fiber
Resin systemModified epoxy system
ESO%100300100300
DGEBA%070100070100
Type Curing Agent MTHPAMTHPAMTHPAEPH 866EPH 866EPH 866
CatalystBDMA
Marking
/Code
Plate
V-1
Plate
V-2
Plate
V-3
Plate
VI-1
Plate
VI-2
Plate
VI-3
Reinforcements%8 layers of glass fabric (woven plain)
Resin system%Modified epoxy system
ESO%100300100300
DGEBA%070100070100
Type Curing AgentMTHPAMTHPAMTHPAEPH 866EPH 866EPH 866
CatalystBDMA
Table 4. L8, 6 factors (A, B, C, D, E and F) with two levels 1 (min) and 2 (max).
RunABCDEF
1111111
2111222
3122112
4122221
5212121
6212212
7221122
8221211
Table 5. L8 Taguchi method.
Trial
Number
No.
ESO Content (wt%)
A
Curing Agent Type
B
Mechanical
Mixing Time (Min)
C
Fiber Content (wt%)
D
CaCO3 Content (wt%)
E
Mixing
Temperature (°C)
F
10EPH 86620025
20EPH 8662601080
30MTHPA100080
40MTHPA10601025
530EPH 8661001025
630EPH 8661060080
730MTHPA201080
830MTHPA260025
Table 6. Test specimens.
Trial
No.
DGEBA
(wt%)
ESO
(wt%)
CaCO3
(wt%)
Hardener
1 MTHPA/
2 EPH 866 (wt%)
Catalyst BDMA
(wt%)
Lubricant Mold
ILCHO 224 (wt%)
R010001085 12–31
R180201085 12–31
R28020085 12–31
R38020085 22–31
R475251085 12–31
R573271085 12–31
R670301085 12–31
R755451085 12–31
R840601085 12–31
1 is hardener MTHPA, 2 is EPH 866, in column 85 with index 1 or 2.
Table 7. Flexural strength and S/N from Taguchi method L8.
No. Exp.Flexural Strength (MPa)y (med)S/N
12345
176.6878.9371.4889.62102.5283.8538.26
2162.22224.55171.22190.78158.78181.5144.97
3100.1958.1297.0387.84105.3489.7038.41
4269.51163.43188.25176.28191.23197.7445.56
526.3336.456.6752.7347.3843.9031.79
6217.72185.31217.8217.88183.97204.5446.13
7115.48122.26127.1656.26127.42109.7239.35
8196.65189.97206.97245.05237.59215.2546.53
Table 8. Range of parameters according to Taguchi method L8.
LevelABCDEF
141.8040.2942.2836.9542.3340.53
240.9542.4640.4745.8040.4242.21
Δ0.852.171.818.851.911.68
Rank624135
Table 9. The temperature of glass transition (Tg) from DSC curves of samples R0–R8.
TrialDGEBAESOTg °C
No.(wt%)(wt%)Tg1Tg2Tg3Tg_avg
R01000135130129131.3
R18020126125.4125125.5
R28020127.3128124126.4
R38020125.1127126126.0
R47525123.5125121123.2
R67327128125118123.7
R57030120115114116.3
R7554511010595103.3
R8406087807079.0
Table 10. The thermal degradation behaviours of samples R0–R8.
TrialESOTeperature °C
No.(wt%)TonsetT5T10T50Tp1Tp2TendestR (%)
R0028034036840040453259521.5
R12027032034539540053059122
R22026832234340040053059022.2
R32027032034540140053059121.8
R42526730033539040053059022.5
R62726529533038538553059122
R53026029032538036553058922.3
R74525024030036036052558721.8
R86024023029037035652558022.1
Disclaimer/Publisher’s Note: The statements, opinions and data contained in all publications are solely those of the individual author(s) and contributor(s) and not of MDPI and/or the editor(s). MDPI and/or the editor(s) disclaim responsibility for any injury to people or property resulting from any ideas, methods, instructions or products referred to in the content.