Article

Innovative Flexible Conductive Polymer Composites for Wearable Electrocardiogram Electrodes and Flexible Strain Sensors

by
María Elena Sánchez Vergara
1,2,
Joaquín André Hernández Méndez
1,
Carlos Ian Herrera Navarro
1,
Marisol Martínez-Alanís
1,
Selma Flor Guerra Hernández
3 and
Ismael Cosme
3,*
1
Faculty of Engineering, Universidad Anahuac México, Av. Universidad Anáhuac 46, Col. Lomas Anáhuac, Huixquilucan 52786, Mexico
2
Polytechnic University of Cuautitlán Izcalli, Av. Lago de Guadalupe, Colonia Lomas de San Francisco Tepojaco, Cuautitlán Izcalli 54720, Mexico
3
National Institute of Astrophysics, Optics and Electronics (INAOE), Luis Enrique Erro # 1, Tonantzintla 72840, Puebla, Mexico
*
Author to whom correspondence should be addressed.
J. Compos. Sci. 2025, 9(10), 512; https://doi.org/10.3390/jcs9100512
Submission received: 3 September 2025 / Revised: 16 September 2025 / Accepted: 19 September 2025 / Published: 23 September 2025
(This article belongs to the Special Issue Biomedical Composite Applications)

Abstract

This work reports the fabrication of innovative flexible conductive polymer composites (FCPCs), composed of poly (2,3-dihydrothieno-1,4-dioxin)-poly (styrenesulfonate) (PEDOT:PSS), polypyrrole (PPy) and copper phthalocyanine (CuPc). These FCPCs were deposited by the drop-casting technique on flexible substrates such as polyethylene terephthalate (PET), Xuan paper and ethylene–vinyl acetate (EVA) foam sheets. Wearable photoactive electrocardiogram (ECG) electrodes and flexible strain sensors were fabricated. Morphological characterization by SEM revealed a stark contrast between the smooth, continuous PEDOT:PSS films and the rough, globular PPy films. EDS confirmed the successful and homogeneous incorporation of the CuPc, evidenced by the strong spatial correlation of the nitrogen and copper signals. The highest mechanical resistance was present in the FCPCs on PET with a limit of proportionality between 4074–6240 KPa. Optical parameters were obtained by Ultraviolet–Visible Spectroscopy and their Reflectance is below 15% and could be used as photoelectrodes. Three Signal Quality Indexes (SQIs) were used to evaluate the ECG signal obtained with the electrodes. The results of all the SQIs demonstrated that the obtained signals have a comparable quality to that of a signal obtained from commercial electrodes. To evaluate the flexible strain sensors, the change in output voltage caused by mechanical deformation was measured.

1. Introduction

With the development of material technology, the burgeoning field of smart wearable devices has become a critical area of research, driving the need for advancements in sensor technology [1], especially in health-related applications [2]. Electrocardiographic (ECG) monitoring is the most common application area of original and innovative materials for the manufacture of new sensors [2]. Electrocardiography is a technique in which the electrical activity of the heart is recorded through electrodes that are placed on the skin, graphing the voltage variation over time [3]. ECG electrodes are sensors used to transduce ionic current from the body to electric current through a circuit [4]. An ECG electrode is essentially composed of substrate, support, matrix, and conductive parts [5]. Progress in materials development has been focused on three primary electrode types. (i) For dry composite electrodes, several studies report on polydimethylsiloxane (PDMS)-based electrodes, such as zeolite/PDMS systems, silver nanorods–reduced graphene oxide (RGO)–PDMS, and silver nanorods–PDMS, which offer a variable impedance [6] from 93.9 ± 0.7 kΩ to 6.2 ± 3.7 kΩ (40 Hz–1 kHz) and a signal-to-noise ratio (SNR) around 12 dB [7]. (ii) Textile-based electrodes—whether silver-plated nylon, cotton with silver/stainless steel nanoparticle yarn, or silver-printed cotton/polyester fabric—capture signals directly via their conductive structures, achieving impedance values below 2 kΩ and SNR in the 30–54.4 dB range [8]. Finally, (iii) hybrid hydrogel–carbon nanotube composite electrodes function as a wet system and present an impedance around 294.5 Ω with an SNR of 54.4 dB that delivers low impedance and robust signal capture [4]. It is important to mention that, despite these advancements, the gel-type silver/silver chloride (Ag/AgCl) electrodes, which use an electrolyte (gel) between the skin and electrode, are still the most widely used in clinical settings [3,4].
Another common application area of materials engineering in healthcare includes human motion detection [9]. Flexible strain sensors have recently attracted wide attention as a core member within the wearable electronics family [10]. These are a type of resistive sensors that primarily detect resistance changes due to mechanical stretching or deformation [1,11], which can transduce physical activity signals into different visual electrical signals [9]. The architecture of strain sensors is usually layered, including the substrate, the composite sensing film, and the top electrode/buffer [12,13]. Such sensors must be able to generate high-quality signals while having characteristics such as low bending stiffness, low modulus, and a clearly elastic response to strain [14]. Consequently, there are two main approaches to producing flexible electronic devices. The first approach involves using inorganic materials such as nanosized metals [14]. These intrinsically stretchable conductive electrodes are built by embedding percolation networks of one-dimensional conductive materials, such as metallic nanowires and carbon nanotubes, in an elastomer matrix to accommodate large external deformation without incurring large strain along the one-dimensional materials [15]. Ag nanowires or Au nanoparticles are commonly used as sensing elements for flexible sensors [14]. Compared with organic materials, nanosized inorganic materials usually show much better electronic or optoelectronic properties, making inorganic materials another group of candidates for flexible electronics [14,16]. The second approach focuses on exploring new organic materials capable of withstanding large deformations. In fact, organic materials like polymers are intrinsically flexible, and their electronic and optoelectronic properties can be tuned by incorporating various functional additives or nanostructures into the polymer backbone. For example, flexible thin-film transistors and flexible photodetectors have been fabricated with many organic semiconductors and showed very good response to external physical signals [14]. In recent years, much effort has been put into developing intrinsically stretchable organic semiconductors for organic solar cells (OSCs), organic light-emitting electrochemical cells (OLECs), organic light-emitting diodes (OLEDs), and organic field-effect transistors (OFETs) [15]. Efforts have also been made to assemble various types of organic materials, including polymers and biomolecules, with nanomaterials such as graphene to generate a variety of nanocomposites with greater stretchability and healing capacity, higher stiffness, electrical conductivity, and exceptional thermal stability for flexible lighting and display technologies [17].
Among organic semiconductors, phthalocyanines possess many outstanding properties such as planarity, symmetry and electron localization which make them a perfect choice for use in optoelectronic applications such as solar cells, light-emitting diodes, or sensors [18], as well as chemical sensors, liquid crystals, Langmuir–Blodgett films, catalysts, non-linear optical materials, and optical data storage materials [19]. Specifically, copper phthalocyanine (CuPC) is described as a planar, fourfold-symmetric molecule with a central copper atom coordinated by nitrogen atoms in a macrocyclic ring (see Figure 1a) [20]. Its frontier orbitals are arranged so that the highest occupied molecular orbital (HOMO) localizes on the pyrrole rings (with doubly occupied a1u), a copper-centered b1g orbital is singly occupied, and the lowest unoccupied orbitals (LUMO and LUMO+1) reside on the inner pyrrole and benzene rings, respectively [20]. Crystalline CuPc is most often found in two phases: viz. alfa and beta, which crystallize in orthorhombic and monoclinic crystal systems, respectively [21]. It exhibits unique structural and optical properties, including strong light absorption and high stability [22] with a bandgap of 1.62–2.90 eV depending on incident photon energy [23]. CuPc has potential in electronic devices, demonstrating semiconductor properties in organic field-effect transistors with carrier mobilities of ~10−3 cm2/Vs [24].
On the other hand, conductive polymers have been significantly attractive for a wide range of electronic applications due to their key advantages, such as their easy handling, solution- and low-cost processability, chemical diversity, tuneability, and biocompatibility, as well as their unique combination of mechanical and optoelectronic properties [25]. Among the conductive polymers, poly (3,4-ethylene dioxythiophene) polystyrene sulfonate (PEDOT:PSS) stands out as the most successful and the one that has been most widely studied practically and commercially [25]. It is a conductive polymer (see Figure 1b) widely used in organic electronics due to its stability, flexibility, and consistently high electrical conductivity [25,26]. These properties have led to it being used as a hole transport material in organic electronic devices for more than 20 years [27]. Consequently, these characteristics make it an attractive candidate for low-cost, low-temperature, and solution-processed electrode materials that can achieve high-performing, flexible, and stretchable thin-film devices. Unlike most organic materials, this water-soluble conjugated polymer is highly stable against chemical and physical exposure. It exhibits mechanical flexibility, optical transparency and electrical conductivity, properties that are essential for applications in bioelectronics (sensors, actuators), charge storage devices, and electrochromic displays [28].
Several studies have shown that polypyrrole (PPy) significantly influences electrical conductivity and charge transport in organic electronic devices. PPy plays a pivotal role in organic electronics because its π-conjugated backbone (see Figure 1c) can be oxidized to generate delocalized polarons/bipolarons. The incorporation of counter-anions (“doping”) yields conductivities up to 10 Scm−1 while preserving mechanical compliance [29]. This polymer combines intrinsic advantages—high environmental stability, reversible redox activity, and straightforward, low-temperature synthesis—with extrinsic design versatility, enabling homopolymers, copolymers and nanocomposites that interface efficiently with electrodes, dielectrics, and biological media [30]. Recent device architectures use in-situ polymerization of PPy onto nanofibrous or textile scaffolds, forming continuous, percolated pathways that deliver metal-like conductivities (72 Scm−1) together with fracture strengths > 27 MPa, metrics essential for stretchable supercapacitors, bio-electrodes, and wearable sensors [31]. Due to its chemical stability, high conductivity upon doping, high charge-carrier density, facile processability, compatibility with soft substrates, and nonlinear optical properties, PPy is among the most widely experimentally studied conjugated organic polymers [32].
Currently, there is a need for flexible and stretchable wearable devices to improve human body monitoring. The objective of this work is to develop new flexible conductive polymer composites (FCPCs) based on the organic semiconductor CuPc, embedded in PPy and PEDOT:PSS polymer matrices. The novelty of this work lies in the simple and low environmental impact manufacturing of FCPCs for ECG electrodes and in the production of flexible strain sensors on flexible substrates such as polyethylene terephthalate (PET), Xuan paper and ethylene–vinyl acetate (EVA) based on CuPc, which has not been studied as a main component of this type of device.

2. Materials and Methods

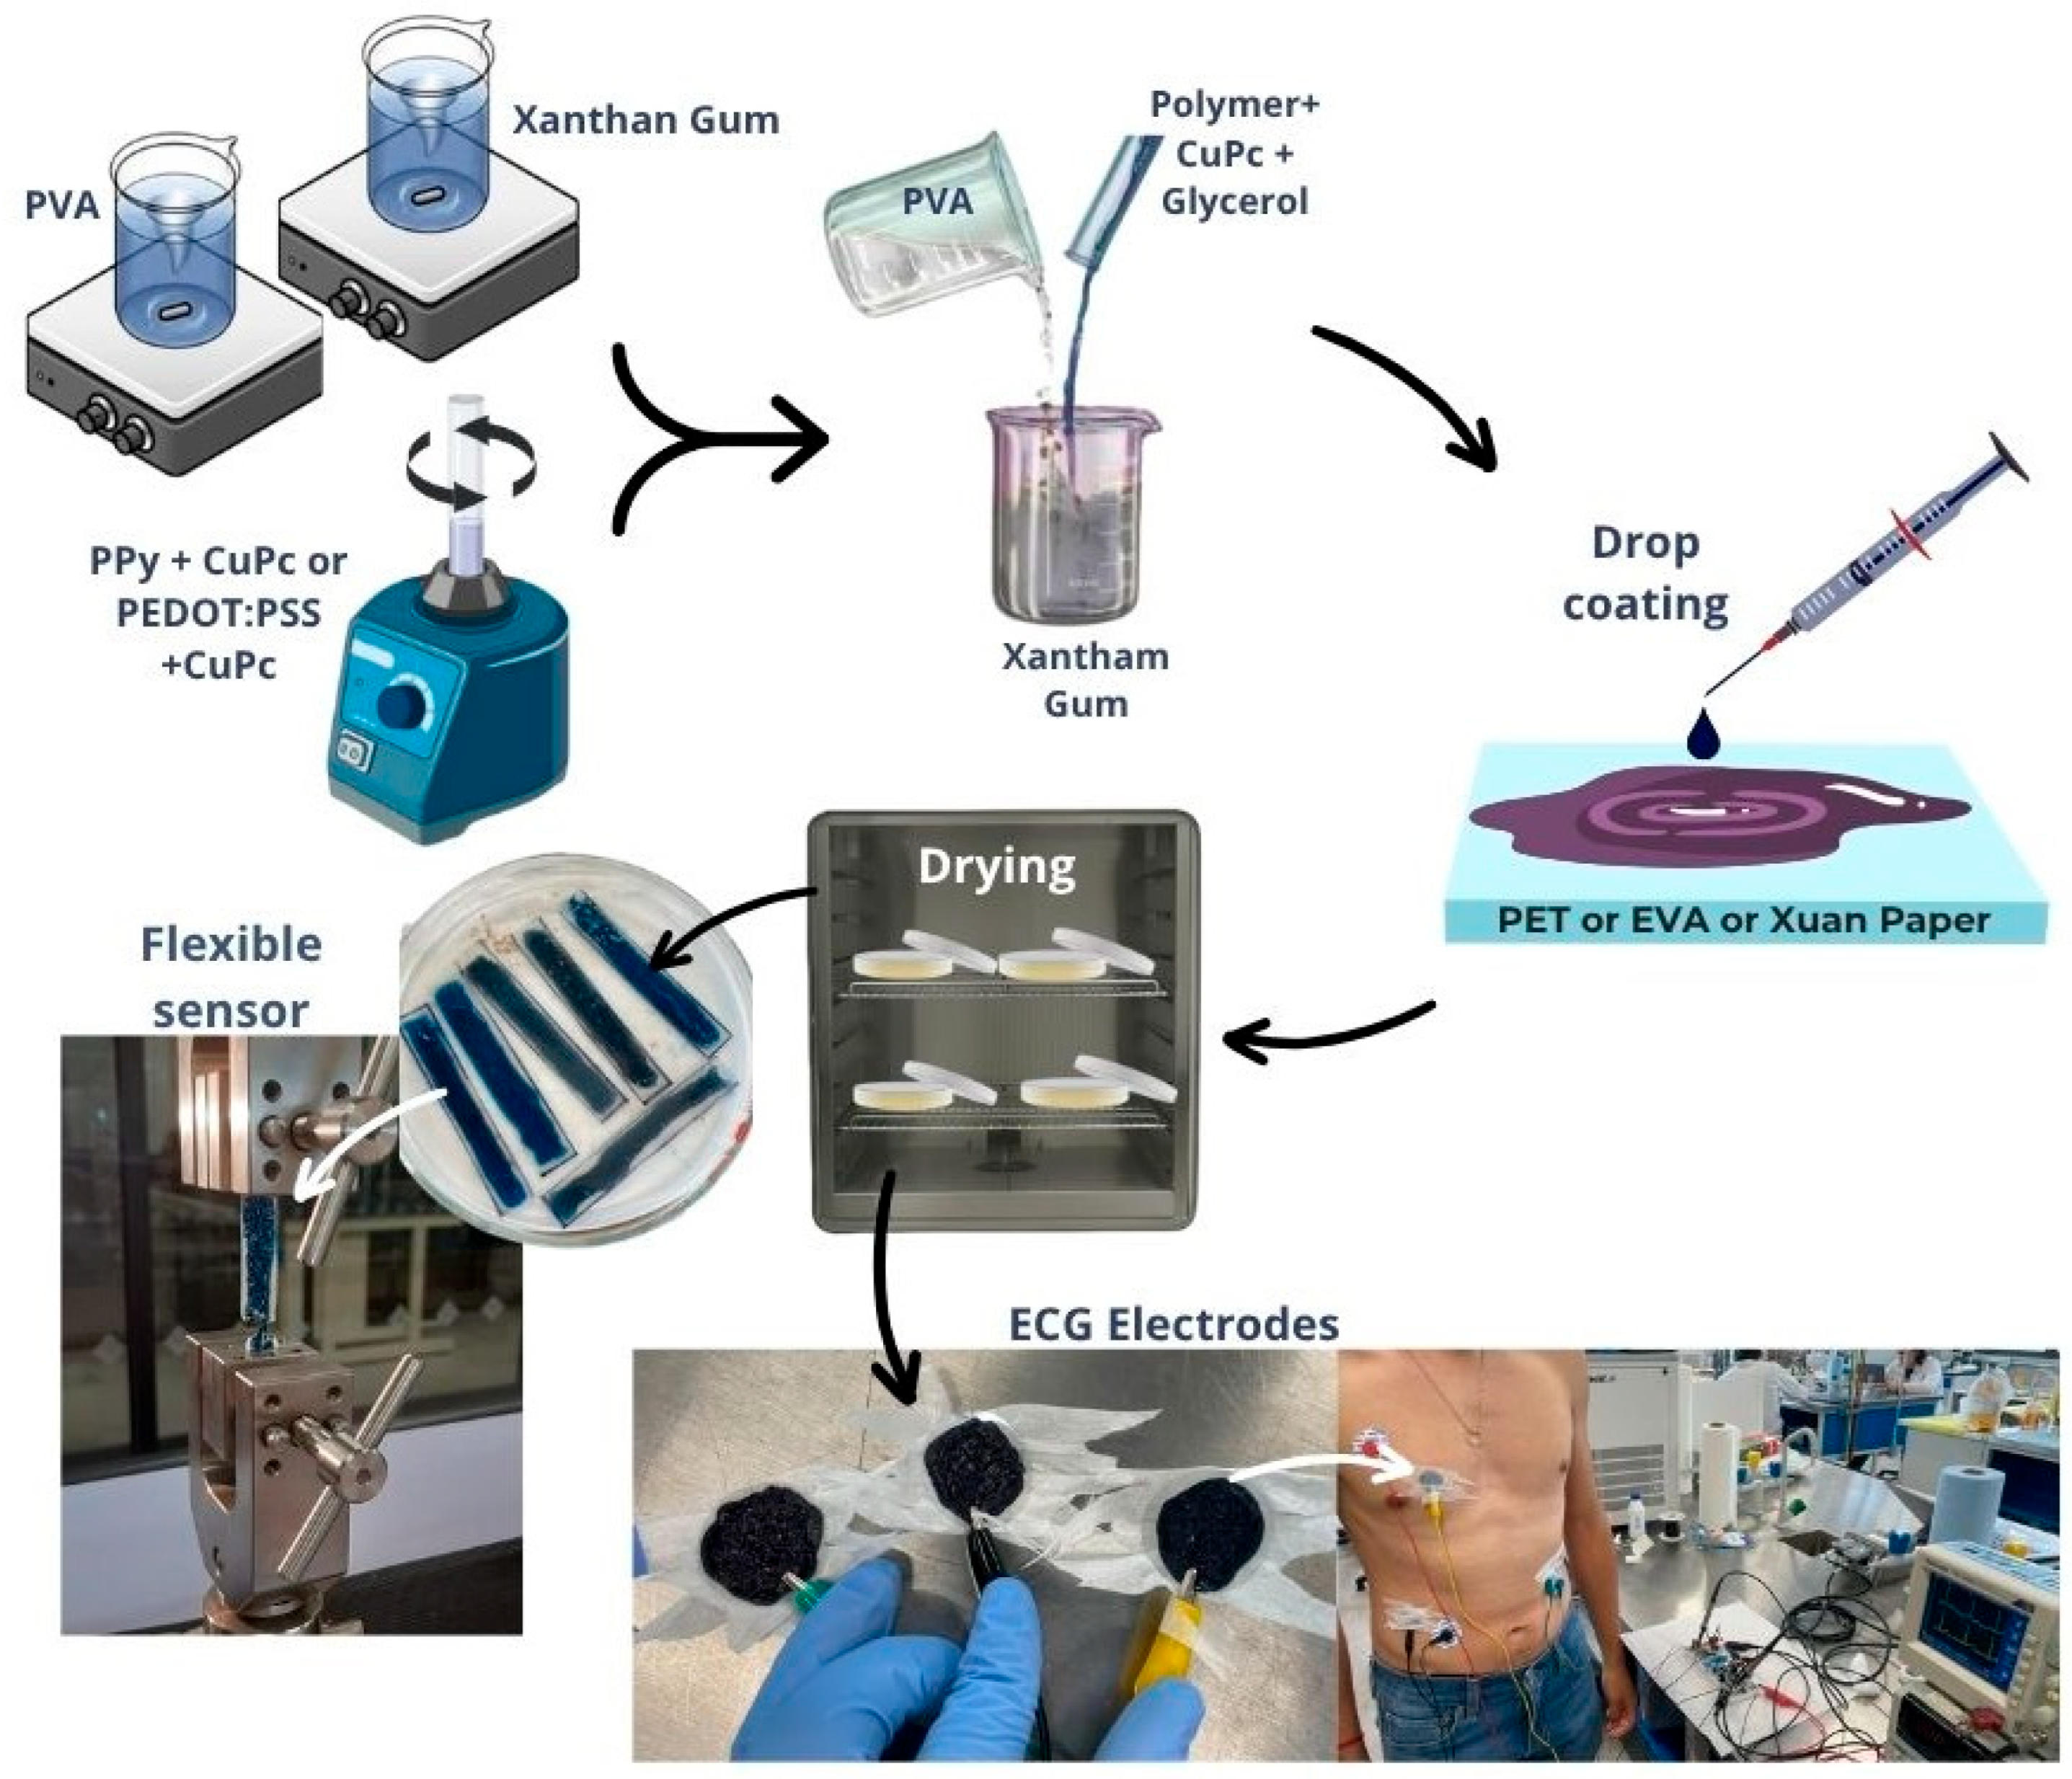
All solvents, the glycerol, the polyvinyl alcohol 99+% hydrolyzed (PVA), the copper (II) phthalocyanine ≥ 98% (CuPc; C32H16CuN8), the poly (2,3-dihydrothieno-1,4-dioxin)-poly (styrenesulfonate) 1.3 wt% aqueous dispersion (PEDOT:PSS), and the polypyrrole pressed pellet (PPy; [C4H3N]n) (see Figure 1) were obtained from commercial suppliers (Sigma-Aldrich, Saint Louis, MO, USA). The xanthan gum ([C35H49O29]n) was obtained from a commercial source (Verdessence™ Xanthan, Cosmopolita, Mexico City, Mexico). All polymers and compounds were used as purchased from commercial sources and have not been purified prior to use. The entire manufacturing process for the materials, electrodes and sensors is summarized in the diagram in Figure 2. The amounts of each FCPC component, with the exception of CuPc, were added following the guidelines for PEDOT:PSS and pullulan-based materials proposed by M.-H. Lee et al. [33,34]. In contrast, this is the first time, to our knowledge, that FCPCs are manufactured with CuPc. As a result, the added amounts for PPy- and PEDOT: PSS-based materials were determined experimentally. Saturated solutions of CuPc in these polymers were prepared, and then it was verified that they generated electrical conduction in solid state when deposited on the substrates.
Preparation of PPy-CuPc and PEDOT:PSS-CuPc conductive ink. To prepare the PPy conductive ink for the ECG electrodes and flexible strain sensors, 9 g of the polymer was diluted in 35 mL of dimethyl sulfoxide (DMSO). This mixture was stirred and heated at 70 °C for 4 h. Afterward, 8 mg of CuPc was added to the mixture along with 4.5 g of glycerol and stirred for 15 min until a homogeneous mixture was obtained. The PEDOT:PSS hybrid ink was prepared by dispersing 10 mL of PEDOT-PSS with 2.5 mg of CuPc and 4.5 g of glycerol. As with the PPy-CuPc ink, the PEDOT:PSS blend was stirred for 15 min. However, heating was not required due to the intrinsic liquid-state properties of PEDOT:PSS, which facilitated the mixing process. Both mixtures were then dispersed and homogenized using the G560 shaker (Bohemia, New York, NY, USA).
Preparation of PVA-xanthan/PPy-CuPc and PVA-xanthan/PEDOT:PSS-CuPc conductive polymer composites (FCPCs). As can be seen in Figure 2, the FCPCs were fabricated using a common solution of PVA and xanthan gum (PVA–xanthan) to improve the bonding strength of the conductive ink and the substrate material and the skin [35,36]. To prepare the PVA solution, 0.2 g of PVA powder was dissolved in 9 mL of distilled water to create a 10 wt% aqueous solution. The mixture was stirred at 90 °C for 5 min until the PVA was fully dissolved and the solution was homogeneous. Similarly, the xanthan gum solution was prepared by dissolving 0.2 g of the biopolymer in water and heating it at 100 °C for 4 min. Both mixtures were combined and stirred at 90 °C for 4 min, and subsequently, the PPy-CuPc and PEDOT:PSS-CuPc solutions were incorporated into their respective PVA-xanthan gum blends.
Deposit and Characterization of FCPCs. All electrodes and sensors were fabricated via drop-casting, using approximately 2.2 mL of the PVA-xanthan/PPy-CuPc and PVA-xanthan/PEDOT:PSS-CuPc composites. After the drop-casting deposition, the films were dried at 90–100 °C for 6 h to remove residual water. Subsequently, the sensors were cured at 70 °C for 12 h in a Briteg SC-92898 drying oven (Instrumentos Científicos, S.A. de C.V., Mexico City, Mexico). The films were deposited onto three different substrates: Xuan paper, polyethylene terephthalate (PET) ([C10H8O4]n) and ethylene–vinyl acetate (EVA; [C2H4]n [C4H6O2]m) foam sheets (see Figure 2). The morphologic features were analyzed using a Hitachi SU3500 (Hitachi, Tokyo, Japan) scanning electron microscope (SEM). Tensile tests were performed using a Shimadzu AGS-X universal testing machine with a nominal capacity of 10 kN. TRAPEZIUM LITE X software was used to record stress–strain curves, manage test control, and activate automatic functions (SHIMADZU Corporation, Sanjo, Kyoto, Japan). FCPC samples for the tensile test were deposited on rectangular substrates of EVA sheets, PET and Xuan paper. Each substrate was cut to measure 10 cm high and 2 cm wide. Since 0.5 cm was needed at each end of the sample to place the equipment’s ejection jaws, 9 cm was left as the effective test area. The thickness of each sample was measured using a Micrometer SW-81390301 (Fumetax, Hangzhou, China) with a range of 0–25 mm. The results for each of the FCPCs on the different substrates, as well as the thicknesses for the substrates without the FCPCs, are presented in Table 1. Thickness changes are a result of differences in adhesive forces and surface tension between the FCPC and the substrate. Reflectance and Kubelka–Munk functions were analyzed to determine the optical band gap of the films deposited on each substrate. These measurements were conducted using a Unicam 300 UV-Vis spectrophotometer (Thermo Fisher Scientific Inc., Waltham, MA, USA) over a wavelength range of 200–1100 nm.
Electrical evaluation of ECG electrodes and flexible strain sensors. To test the performance of the ECG electrodes, a simple ECG circuit with two acquisition channels was built. Both channels were identical, comprising an instrumentation amplifier with a gain of 100, a 4th-order high-pass filter with a cutoff frequency of 0.5 Hz, and a 4th-order low-pass filter with a cutoff frequency of 50 Hz. The objective of having two channels was to simultaneously measure the ECG signal with both commercially available electrodes and the fabricated electrodes to compare the quality of the obtained signals.
A test subject was connected to the ECG circuit as observed in Figure 2. The fabricated electrodes were connected side by side with commercially available electrodes for comparison (Kendall Medi-trace 200 series, Covidien, Dublin, Ireland). Three electrodes were used to obtain each signal. The electrode connected to the lower right side of the abdomen was used as reference, while the signal was obtained from the voltage difference between the lower left side of the abdomen and the upper right side of the abdomen. For each of the fabricated electrodes, a signal between 2 and 4 s in length was obtained using an oscilloscope (TBS1102B-EDU, Tektronix, Beaverton, OR, USA).
The ECG signal is very sensitive to noise. To ensure its use as a diagnostic tool, researchers have developed a series of Signal Quality Indexes (SQIs) to help detect noise [35,36]. Three of these SQIs were used to evaluate the signal quality of the ECG signal obtained with the electrodes: (1) comparison of multiple beat detectors in the same signal (bSQI), (2) evaluation of the kurtosis of the signal (kSQI) and (3) calculating the spectral density of the signal within a specific physiological bandwidth (sSQI) [35].
bSQI. One of the main uses of the ECG is QRS detection to estimate heart rate. Different algorithms are used for this purpose, and each is sensitive to different types of noise. Comparing the accuracy of each algorithm to detect the QRS complex can be used as a measure of the quality of the ECG signal. For this evaluation, two well-known, open source QRS detection algorithms (available at https://physionet.org/ (accessed on 10 August 2025)) were used: one based on digital filtering and integration to highlight the QRS complex [37,38] and the other based on length transformation after filtering [39]. bSQI is calculated based on the detection of these two algorithms as [36]
b S Q I ( k ) = N m a t c h e d k N a l l ( k ) ,
where Nmatched is the number of beats that both algorithms detected within a time window of 150 ms, and Nall is the number of all the beats detected by at least one of the algorithms. A good quality ECG will have a value close to 1, indicating that all beats were detected by both algorithms.
kSQI. Kurtosis is a statistical measure that describes the distribution of data relative to its mean. It is a measure of how Gaussian-like a signal is. A clean ECG signal with sinus rhythm usually has a kurtosis larger than 5 [40] and can be used as an indicator of signal quality. kSQI is calculated as [35]
k S Q I = 1 N i = 1 N x i x ¯ σ 4 ,
where xi refers to the ECG signal that has N points, x ¯ is the mean of the signal and σ is the standard deviation.
sSQI. The QRS spectral energy is concentrated around 10 Hz within a 10 Hz frequency band [41]. The power spectral density (PSD) in this band, compared to the PSD in the complete ECG signal, is used as a measure of signal quality. To calculate this, the spectral distribution ratio (SDR) was obtained. The SDR of an ECG segment is calculated as the ratio of the sum of the power (P) of the QRS complex (between 5 Hz and 14 Hz) and the sum of the power of the whole ECG signal (between 5 Hz and 50 Hz) [36]:
s S Q I k = f = 5 f = 14 P k d f f = 5 f = 50 P k d f ,
Low sSQI values (<0.5) indicate the presence of high-frequency noise, while high values (>0.8) indicate the presence of artifacts such as electrode motion. If the sSQI value is between these two ranges (>0.5 and <0.8), the ECG signal is considered to have good quality [36].
These three SQIs were measured in the signals obtained from both commercial and fabricated electrodes, with the expectation of obtaining similar results.
To evaluate the flexible strain sensors, the change in output voltage caused by mechanical deformation was measured. Since these sensors have a high resistance, their sensitivity was increased by connecting them to a circuit containing a Wheatstone Bridge and an instrumentation amplifier. The Wheatstone Bridge was balanced to remove the effect of baseline resistance, allowing the circuit to focus solely on the change in resistance. With the bridge balanced, the sensors were flexed and extended several times, while observing the corresponding change in voltage using an oscilloscope (TBS1102B-EDU, Tektronix, Beaverton, OR, USA).

3. Results and Discussion

3.1. Morphological and Compositional Characterization of FCPCs

In this work, FCPCs were fabricated to be used as electrodes for ECG monitoring and as flexible strain sensors. Although several components used in this work are different, the function of each of the components in the FCPCs is based on the work done by M.-H. Lee et al. [33,34]: (i) PPy and PEDOT:PSS as electrically conductive media, (ii) CuPc was used as a semiconductor and responsible for the optical behavior of the material, (iii) glycerol was used as a plasticizer and secondary dopant to improve the electrical conductivity of PPy and PEDOT:PSS, (iv) xanthan gum was used as a binder and (v) PVA as an additive to improve the ductility and stability of the dispersion formed by the previous components.
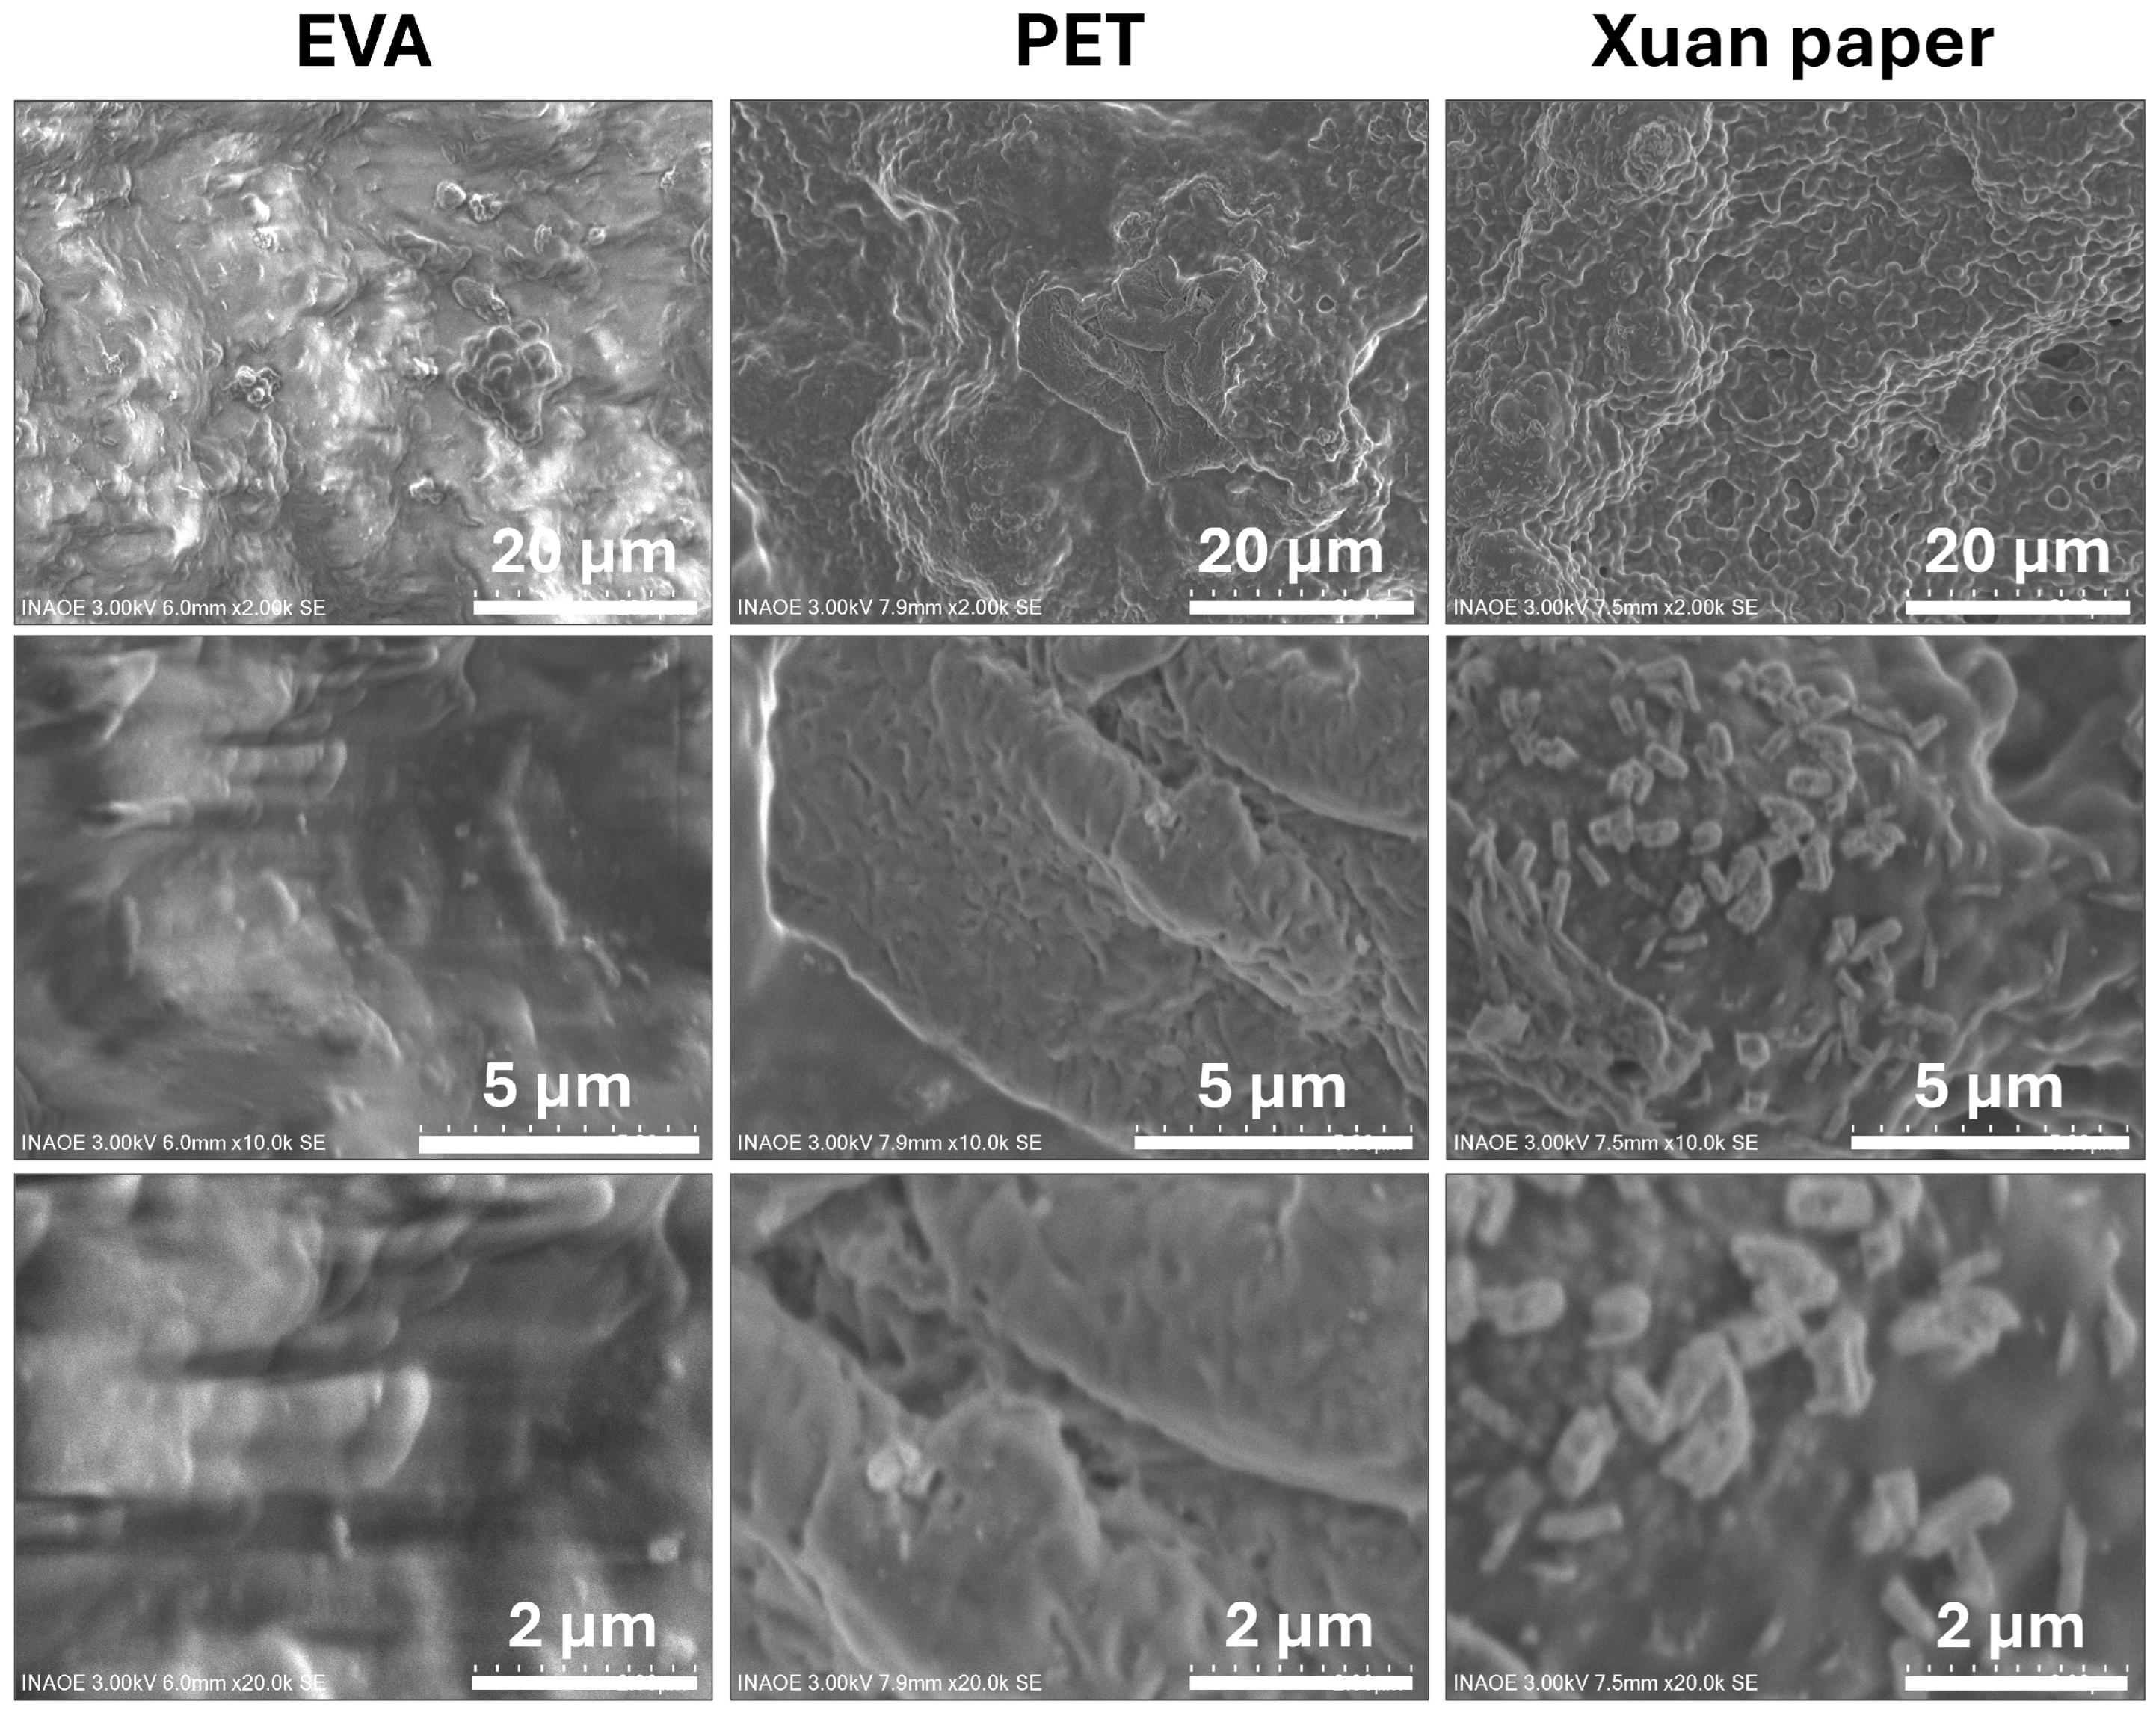
The morphology and composition of the prepared PVA-xanthan/PPy-CuPc and PVA-xanthan/PEDOT:PSS-CuPc FCPCs were studied by SEM and EDS, respectively. Figure 3 presents the resulting surface morphology of the PPy-CuPc composite film deposited on the three different substrates: EVA, PET, and Xuan paper. The micrographs are arranged in a matrix, allowing for a direct comparison of each substrate (columns) at three increasing levels of magnification (rows: 20 µm, 5 µm, and 2 µm scales). On the EVA surface (column 1), the film exhibits a classic botryoidal or “cauliflower-like” morphology, composed of large globular structures with significant porosity and deep crevices between them. The notable brightness in some areas of these micrographs is attributed to a sample charging effect, likely stemming from the insulating nature of the substrate. At higher magnifications, these globules are seen to be composed of smaller, fused sub-micrometric nodules with a fine, granular texture. The coating on PET (column 2) is more continuous but shows a dense packing of globular domains that appear smaller and more compact than those on the EVA substrate. At higher magnifications, the surface resembles a bed of tightly packed, rounded nodules with well-defined boundaries. On Xuan paper (column 3), the PPy coating clearly conforms to the underlying fibrous structure, decorating the individual paper fibers with a granular layer. At the highest magnification, this coating is resolved into individual, sub-micron spherical or rice-grain-shaped nanoparticles populating the surface of the fibers.
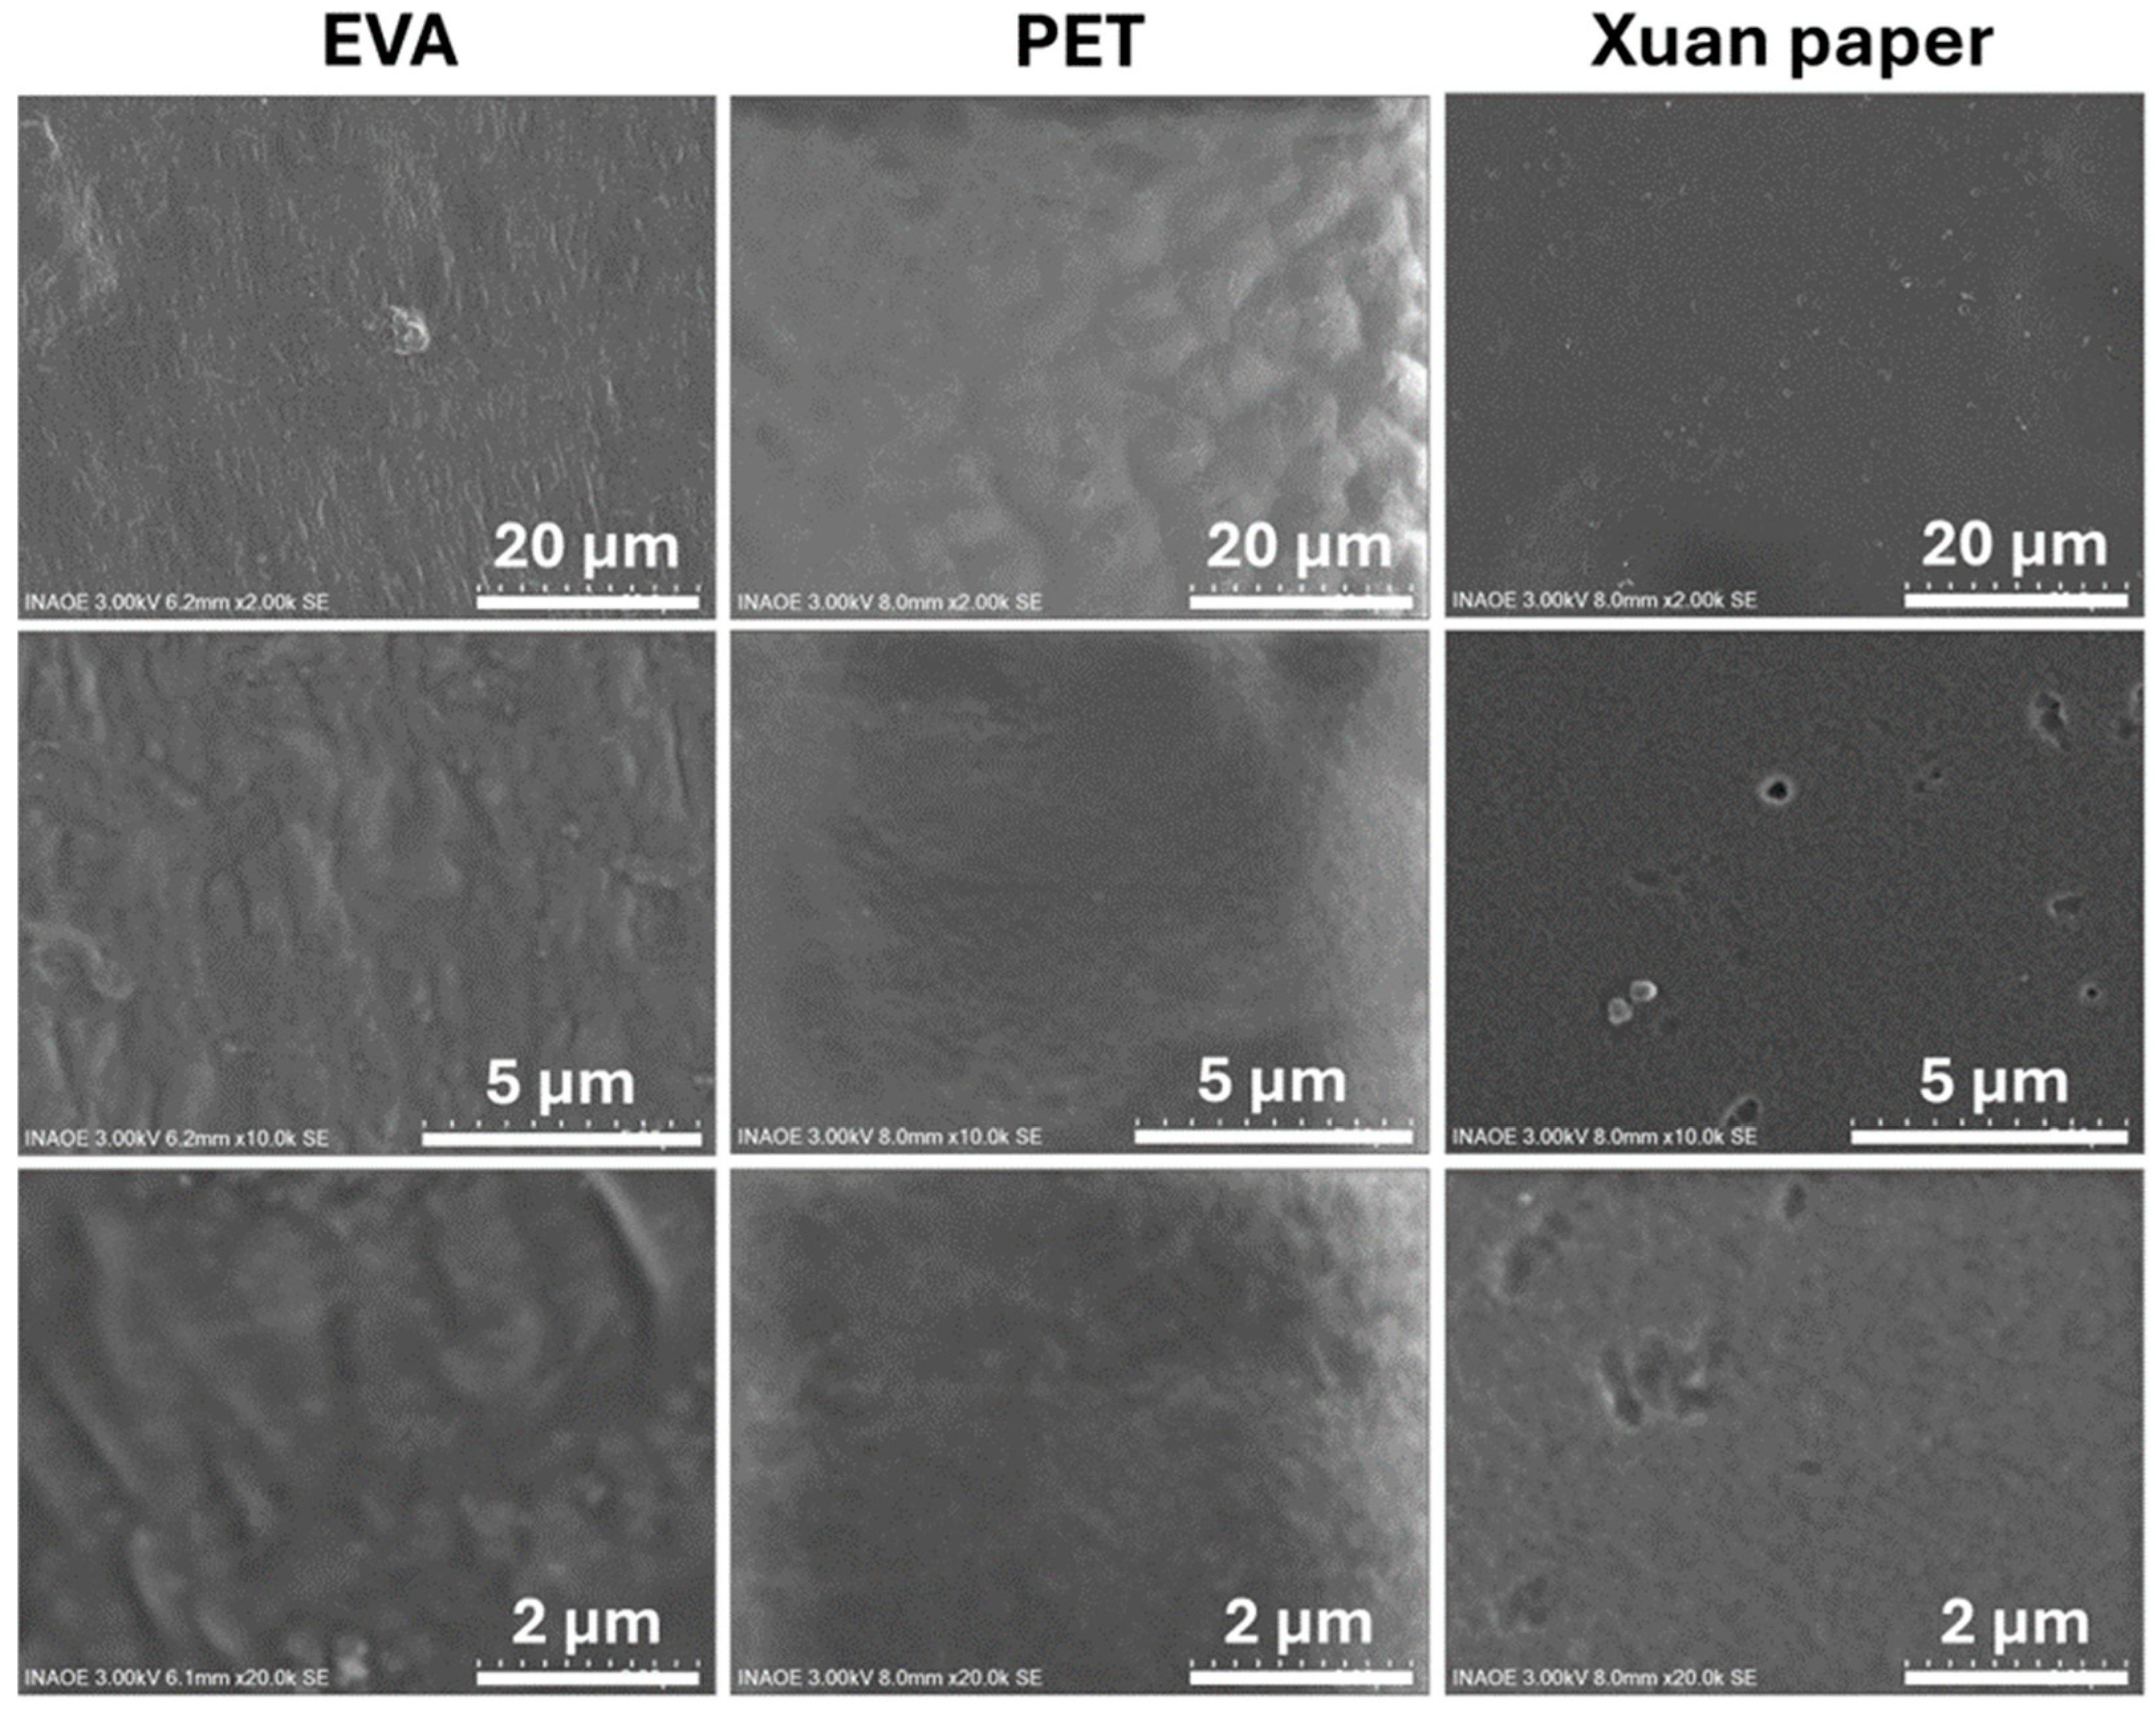
Figure 4 shows a comparative analysis of the surface morphology of the PEDOT:PSS-CuPc composite film on the EVA, PET, and Xuan paper substrates. The image is organized as a matrix where each column represents a different substrate, and each row corresponds to an increasing level of magnification (from top to bottom: 20 µm, 5 µm, and 2 µm scales). The morphology of the PEDOT:PSS-CuPc films, shown in Figure 4, is notably smoother and more continuous across all substrates when compared to the PPy-based composites. On the EVA substrate (column 1), the film conforms to the substrate’s wavy relief, exhibiting a fine, continuous texture with some anisotropic striations but no visible open pores. The coating on PET (column 2) is also continuous and presents a characteristic isotropic nodular topography, described as “orange-peel morphology” with a shallow relief. Finally, on Xuan paper (column 3), while the film remains continuous, it displays some surface imperfections such as dispersed depressions and micro-cavities. At high magnification, all PEDOT:PSS films show a consistent, fracture-free texture.
The SEM analysis reveals stark differences between the two types of films. The PEDOT:PSS-CuPc composites consistently formed smooth and continuous coatings on all three substrates, with only minor surface features. In sharp contrast, the PPy-CuPc films exhibited a significantly rougher, granular, and globular morphology, creating a porous and cavernous surface across all substrates. These distinct topographies suggest different film growth mechanisms and are expected to influence the final device performance. The high surface area of the porous PPy structure could be advantageous for sensing applications, while the uniform nature of the PEDOT:PSS film may ensure more consistent skin contact for ECG electrodes.
Energy-Dispersive X-ray Spectroscopy (EDS) analysis confirmed the elemental composition of the films, with the quantitative results summarized in Table 2. The composition of the PPy films was distinctive. As expected, the nitrogen (N) content was notably higher in these films, reaching up to 3.15% on PET, which is consistent with the presence of nitrogen atoms in both the pyrrole monomer ring and the phthalocyanine. In contrast, the N content in the PEDOT:PSS samples was much lower (≤0.83%) since it originates only from the CuPc. The copper (Cu) concentration was also significantly higher in the PPy films, peaking at 1.70% on PET. A particular finding was the detection of sodium (Na) at 1.88% exclusively in the PPy sample on EVA, which may be a residue from the polymer’s synthesis process.
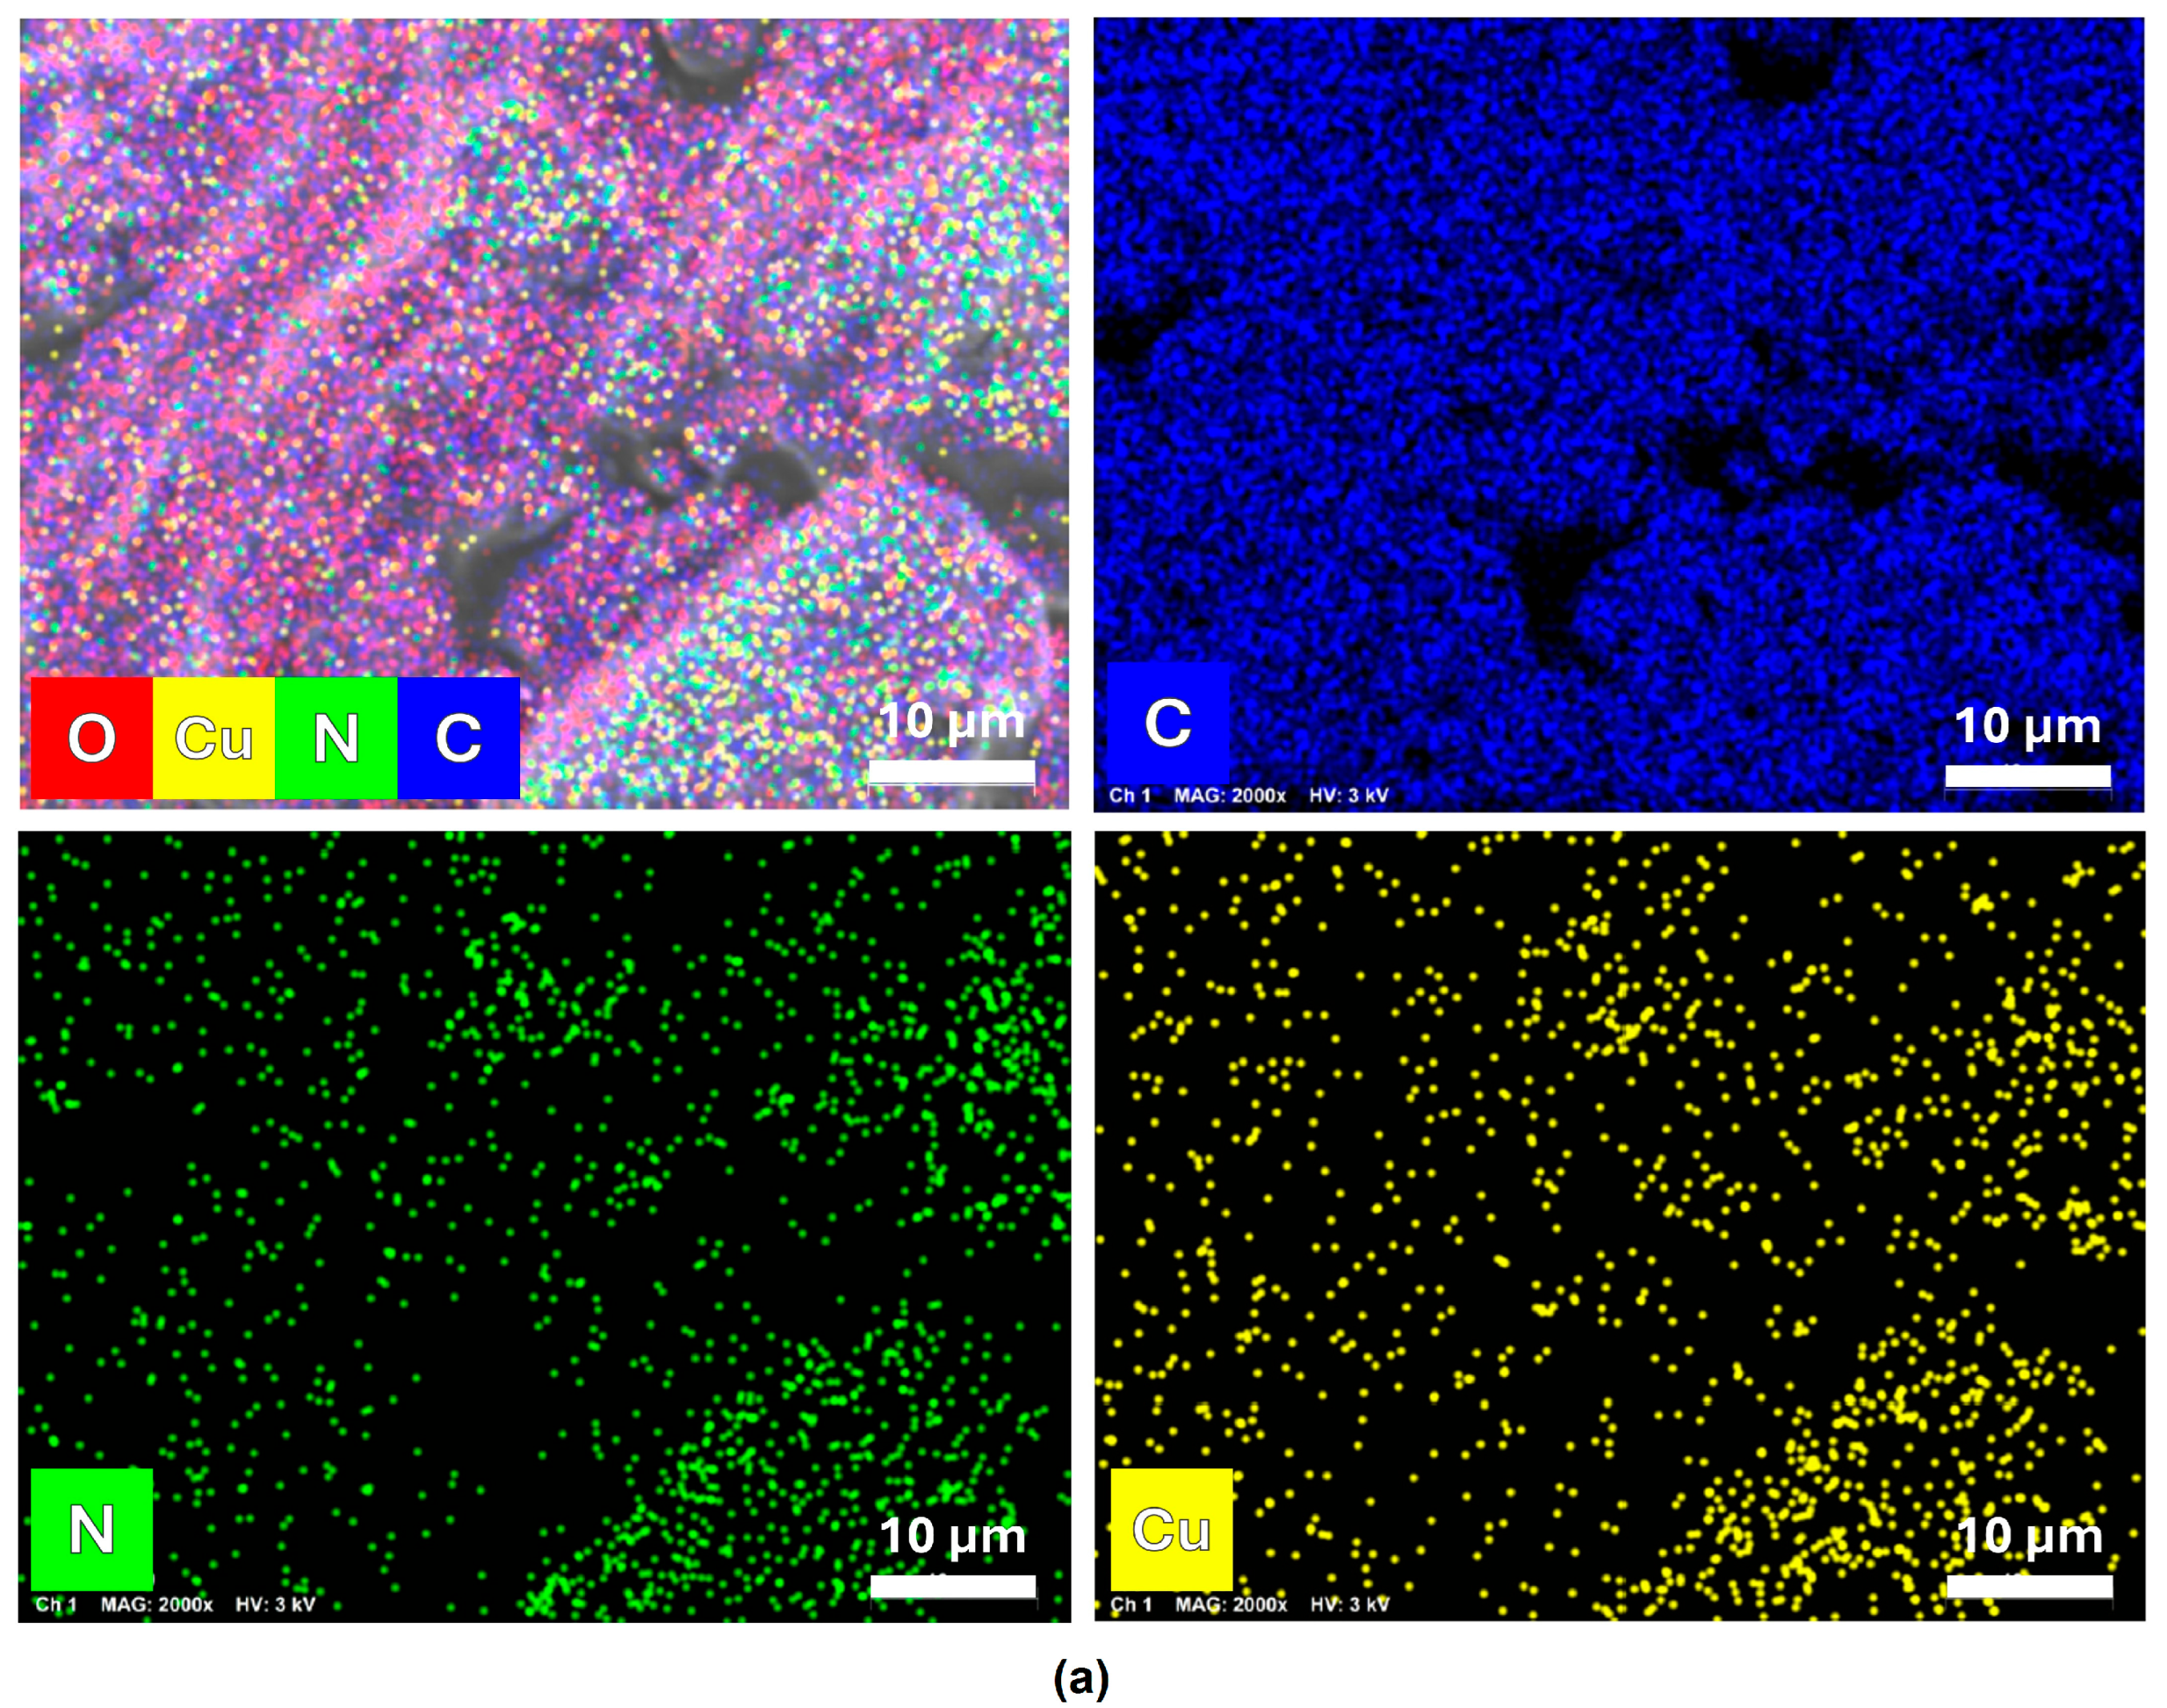
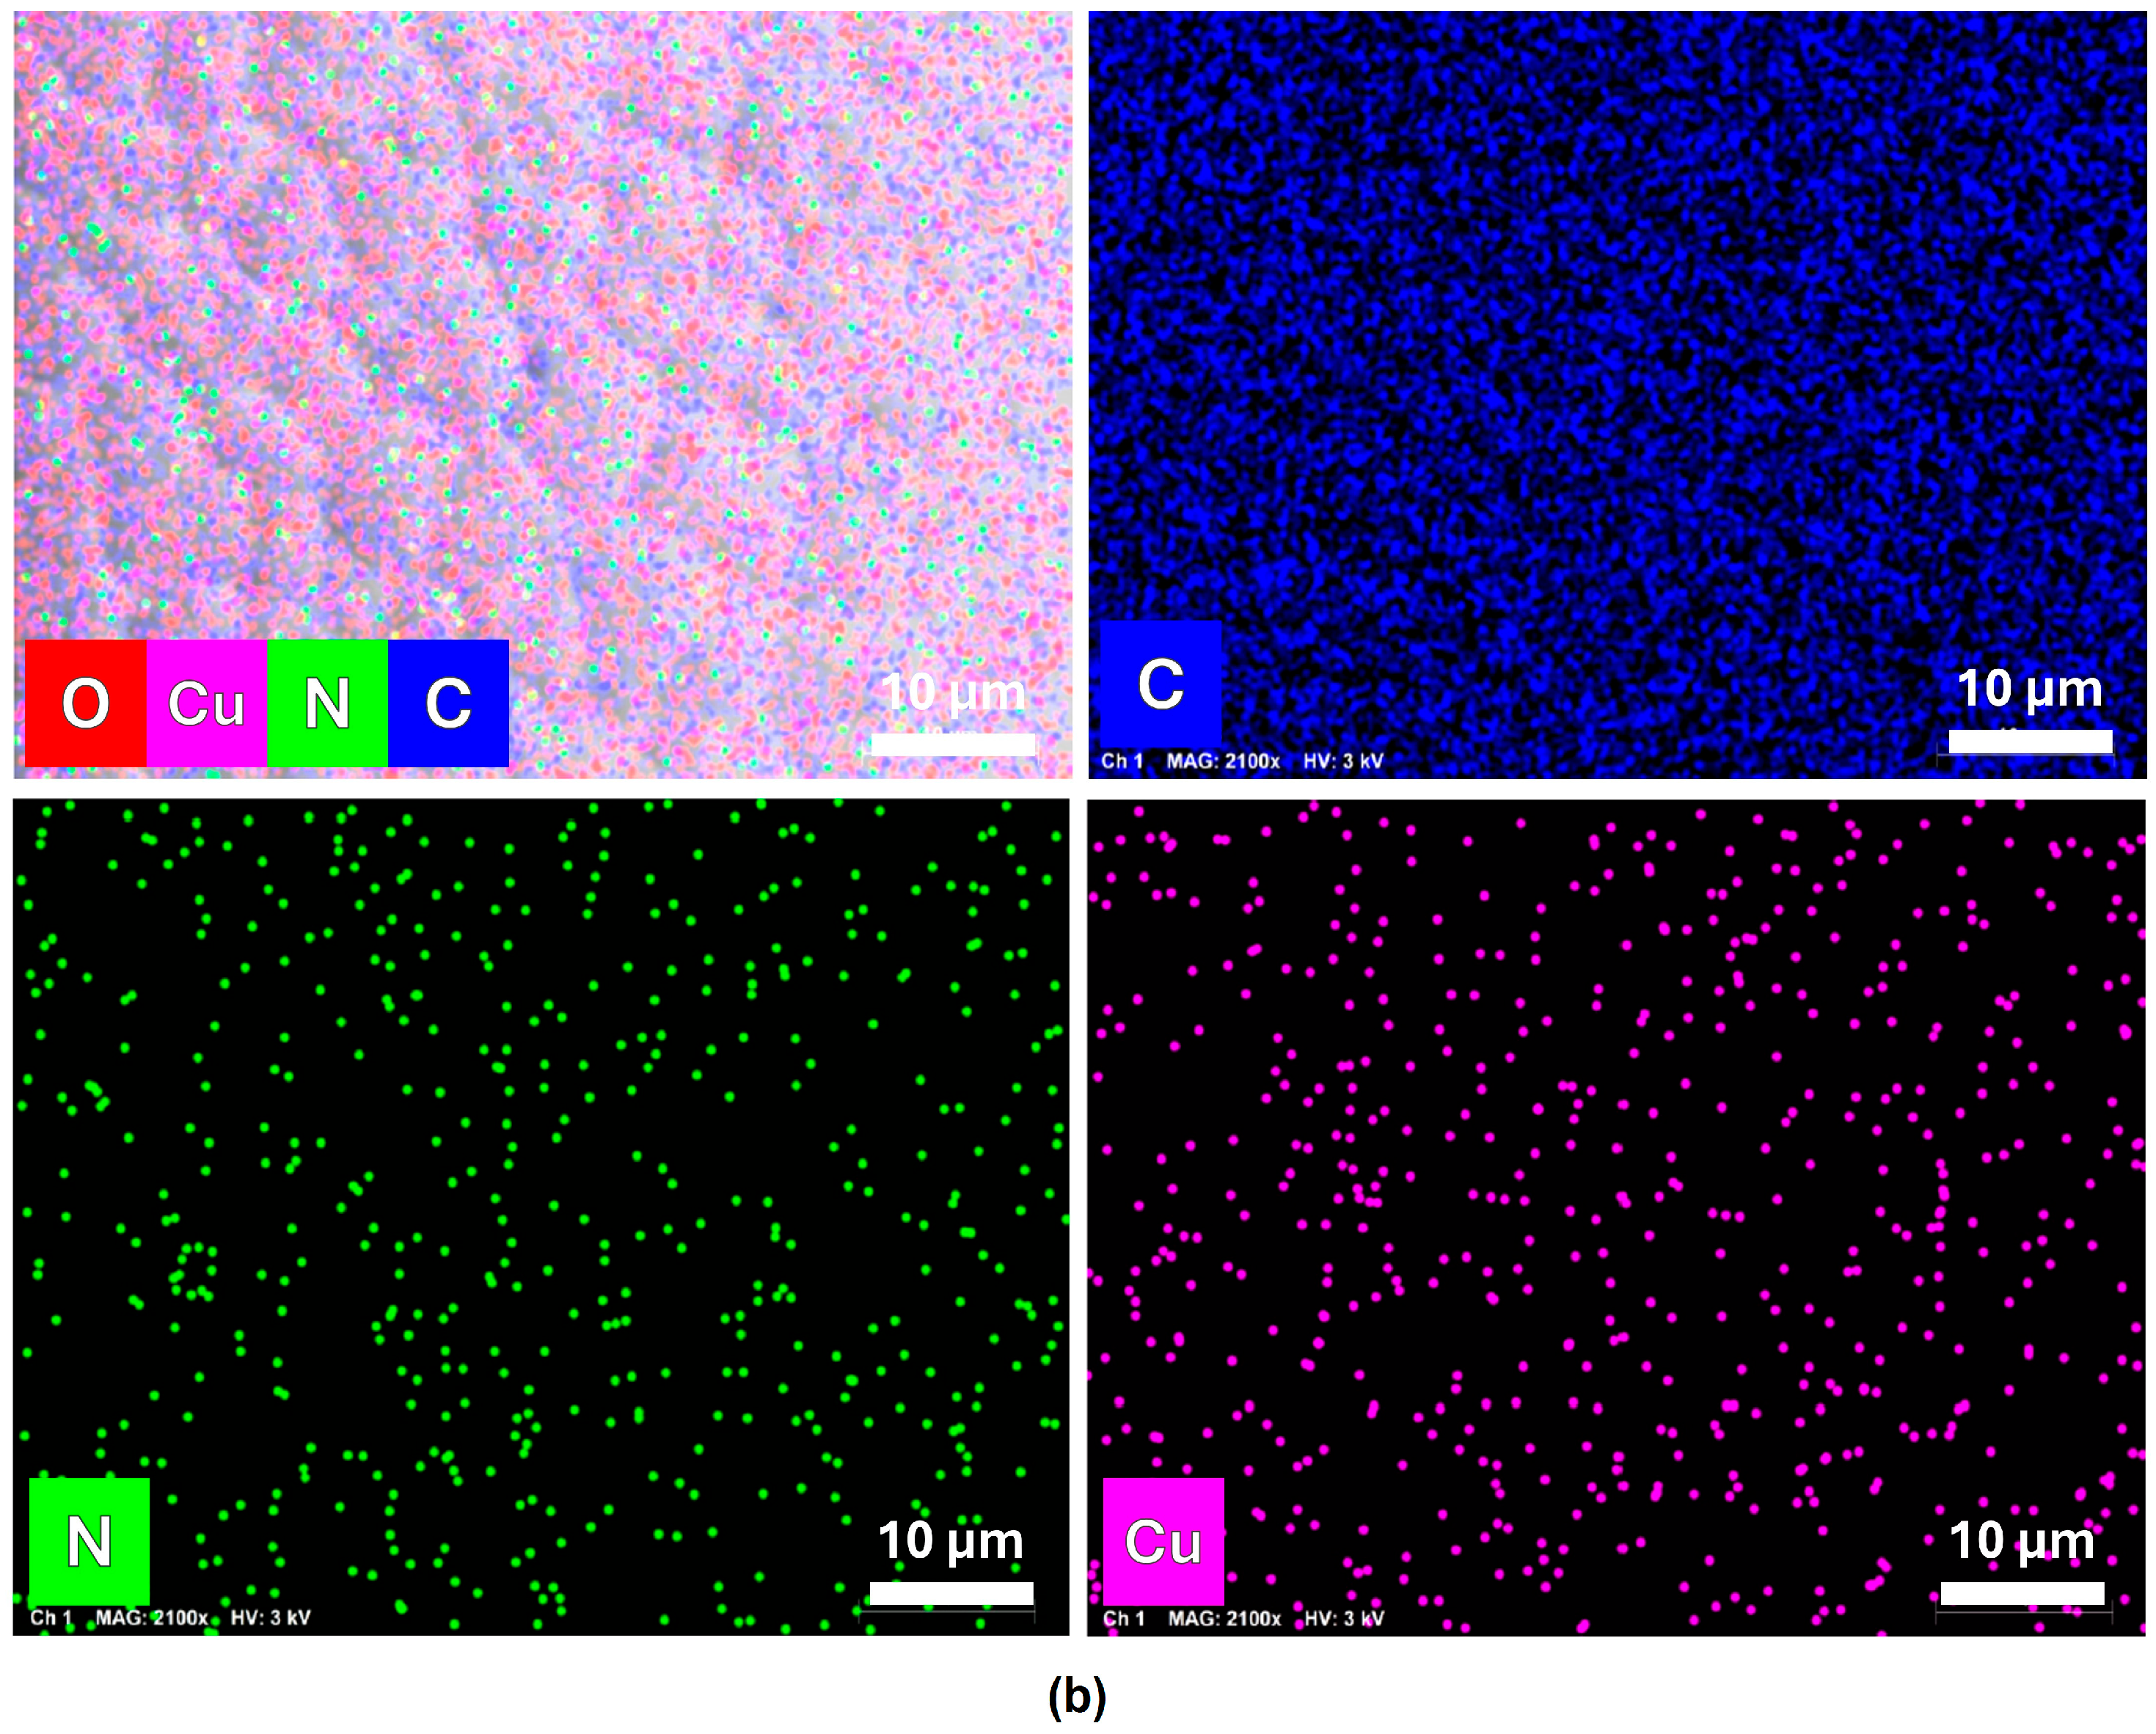
To visually confirm the successful integration of the CuPc, Figure 5 presents the EDS elemental maps for the two samples with the highest detected copper concentrations: PVA-xanthan/PPy-CuPc on PET (Figure 5a) and PVA-xanthan/PEDOT:PSS-CuPc on Xuan paper (Figure 5b). The strong spatial correlation between nitrogen (N) and copper (Cu) confirms the homogeneous integration of the CuPc.
The maps for carbon (C) and oxygen (O) confirm their expected distribution as the main components of the polymers and substrates. More importantly, the distribution maps for nitrogen (N) and copper (Cu) show a strong spatial correlation for both composites. In the PPy sample (Figure 5a), the N and Cu signals follow the globular morphology of the polymer, while in the PEDOT:PSS sample (Figure 5b), they are homogeneously dispersed throughout the continuous film. The weak and sometimes undetectable concentration of Cu in some of the samples reported in Table 2 is an expected outcome and does not contradict the successful incorporation of the CuPc. This is primarily because the elemental concentration of Cu within the phthalocyanine macrocycle is so low that its signal is close to the equipment’s detection limit. The most compelling evidence for the phthalocyanine integration comes from the spatial co-localization of the N and Cu signals, visually confirmed in Figure 5. This consistent pattern matching is definite proof that the CuPc is homogeneously integrated at a molecular level, as both N and Cu originate from the same molecule. The non-detection of Cu in other samples (Table 2) can be attributed to signal scattering on rougher substrates or concentrations falling below the instrument’s detection threshold.

3.2. Stress–Strain Behavior of FCPCs

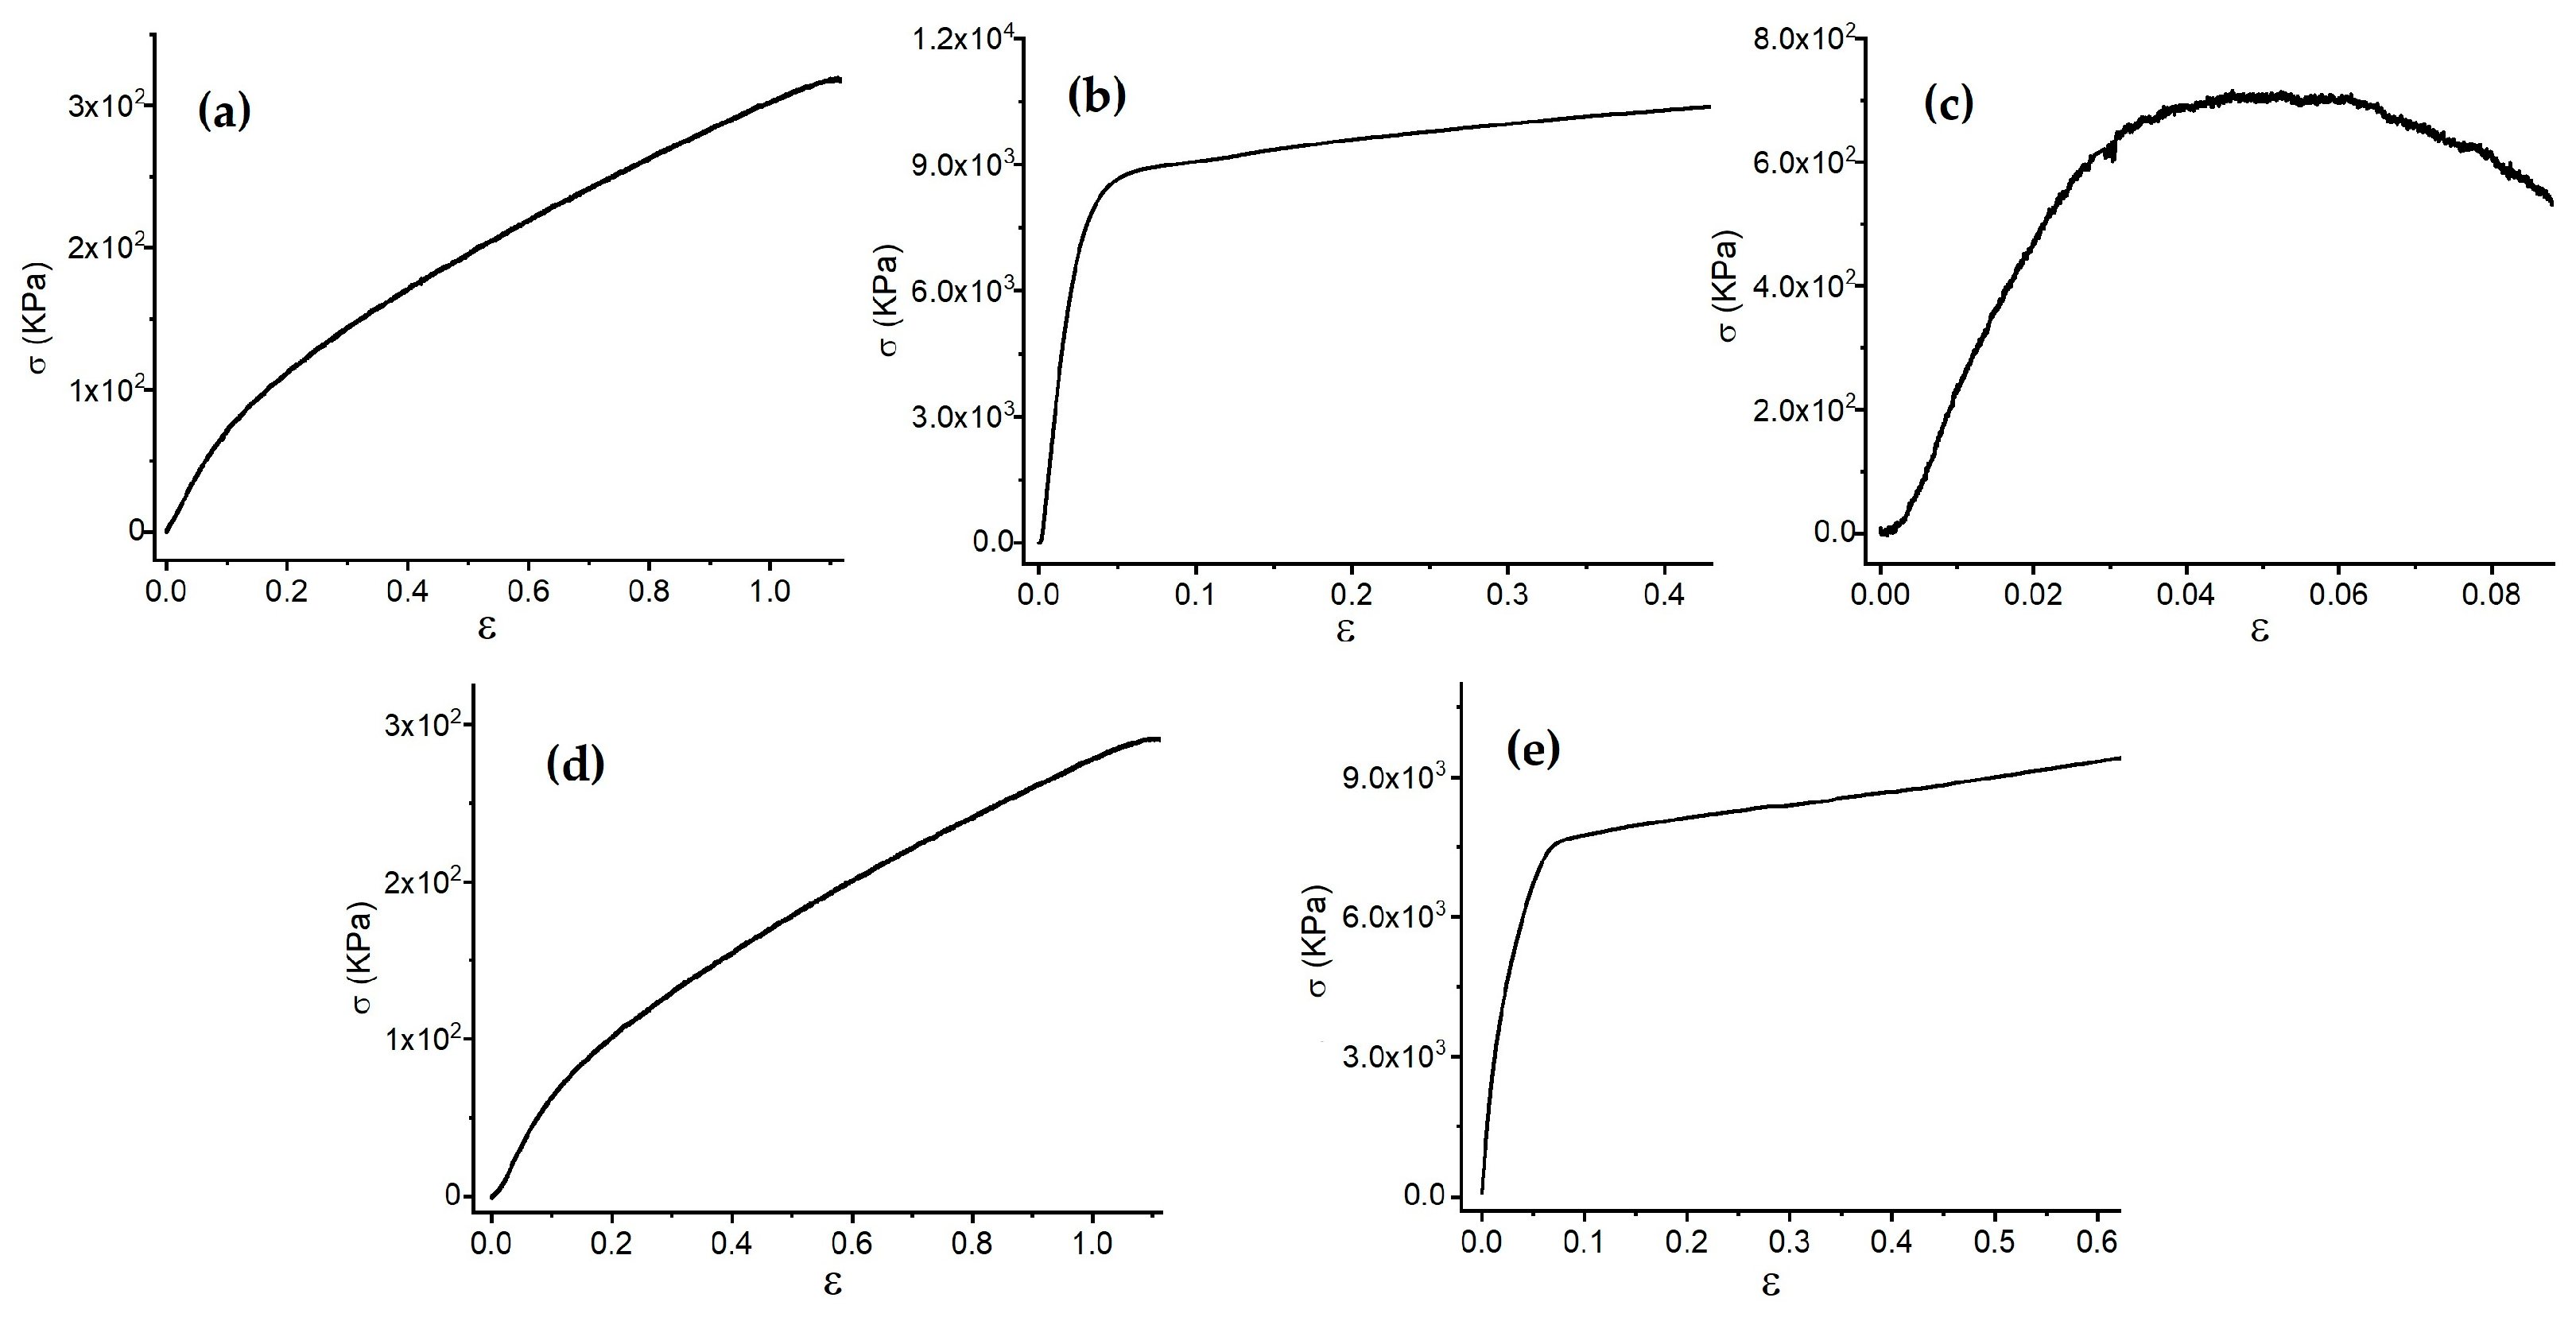
The PVA-xanthan/PPy-CuPc and PVA-xanthan/PEDOT:PSS-CuPc FCPCs were fabricated to be used as ECG electrodes and flexible strain sensors. To achieve this, the materials must be flexible, as they must adapt to the skin surface, and they must be biologically compatible with human skin. Gel-free adhesion is also preferred and, most importantly, they must conduct electrical signals from the skin to the measuring devices with low electrical noise and a stable response over time. To achieve the desired flexibility, compatibility, and adherence to the skin, xanthan gum was used. This biodegradable, non-toxic, and ecological polysaccharide has been previously used in conjunction with PEDOT:PSS by some authors of this work [42], since it modifies the rheological properties of PEDOT:PSS and improves its deposition on hydrophobic surfaces. To ensure the mechanical stability of the flexible electrodes and sensors, stress–strain studies were performed. The curves obtained for the two materials on the different substrates are presented in Figure 6, and the main mechanical parameters are summarized in Table 3. The sample dimensions were previously presented in the Methodology section. As can be seen in the graphs, and consistent with the findings of Liu, X. et al. [43], the performance of electrodes and sensors mainly depends on the mechanical properties of the substrate materials. With respect to PVA-xanthan/PPy-CuPc FCPC, significant differences are observed in the curves because of the type of substrate used. Furthermore, it is interesting that although PPy is a more rigid and fragile polymer than other conductive polymers, the presence of the substrate favors both elastic and plastic behavior. In the stress–strain curve for the substrate on PET (Figure 6b), the elastic zone and the plastic zone are clearly observed, divided by a fluency zone of the material. Regarding the stress–strain curve on Xuan paper (Figure 6c), the yield zone is not shown, although the elastic and plastic zones are visible. Finally, the EVA material presents a curve with a very small elastic zone (Figure 6a). Particularly in flexible strain sensors, the elastic zone and its corresponding proportionality limit are of great importance, because when the stretching behavior of the sensor exceeds the elastic region, irreversible damage can occur. The detection limit of a sensor is the strain range in which the sensor emits a stable feedback signal [43]. If the stress on the sensor exceeds its elastic limit, a permanent deformation is generated, and the sensor no longer responds proportionally to the stress applied to it. According to the proportionality limit values reported in Table 3, it is evident that the FCPC that would have the best performance under service conditions is the one on PET, followed by Xuan paper and finally EVA. These results are related to the morphology studied by SEM (see Figure 3): the FCPC on PET is more continuous, presenting a dense and compact packing formed by rounded nodules, which distribute the stress more evenly. On Xuan paper, the FCPC is incorporated into the individual paper fibers with a granular layer formed by individual nanoparticles, spherical or rice grain-shaped, which also adequately distribute the stresses. Finally, in the morphology of the FCPC on EVA, the generation of a botryoidal morphology is observed with large globular structures with porosity and cracks, which decrease the strength of the material.
The mechanical behavior of the PVA-xanthan/PEDOT:PSS-CuPC FCPC on the different substrates also differs, although the shape of the stress–strain curves is characteristic of the presence of PEDOT:PSS. These results are similar to those presented by Chen, Y. et al. [44] for a PEDOT:PSS-based tattoo electrode for long-term ECG measurement, and by Zhang, L. et al. [45] for a stretchable dry electrode with PEDOT:PSS, waterborne polyurethane (WPU) and D-sorbitol. It is important to note that the performance of the material on Xuan paper was zero; the material suffered cracks and had very low mechanical strength. However, the use of Xuan paper in FCPC cannot be ruled out yet, because although cracks as defects should be avoided, the sensitivity of crack-based strain sensors can be improved [46]. Wang et al. [47] fabricated crack-based strain sensors, and with the increase of strain in a reasonable range, crack propagation took place regularly, which improved the stretchability of their strain sensor. On the other hand, Figure 6e shows the curve for the PVA-xanthan/PEDOT:PSS-CuPc material on PET, in which the presence of the elastic and plastic zones can be observed, separated from each other by the yield zone. The curve for the EVA material (Figure 6d) presents a very small elastic zone, like the case of the PPy polymer. Like the PPy-based FCPC, the PEDOT:PSS-based FCPC shows its highest elastic resistance when deposited on PET. However, the EVA material also presents an adequate mechanical performance, considering that under service conditions, the stress parameters that this FCPC supports would not be reached. These polymers are characterized by weak intermolecular interactions, which produce their viscoelastic behavior. As a result, they exhibit a large plastic zone. When relating the mechanical behavior of the materials to their morphology (see Figure 4), it is observed that the FCPC on PET is continuous and presents an isotropic nodular topography, which favors high mechanical strength. In the case of the EVA, the FCPC adapts to this substrate, presenting a fine and continuous texture that also generates adequate mechanical strength. Finally, for the FCPC on Xuan paper, the low mechanical properties are probably due to surface imperfections, such as depressions and microcavities in the morphology. However, future work could explore using an ultra-reinforced Xuan paper with ultra-long hydroxyapatite (HAP) nanowires, as reported by L.-Y. Dong et al. [48,49]. Although the study of this ultra-reinforced Xuan paper has focused on its high fire resistance, the HAP nanowires that comprise it are a form of inorganic nanofiber material that could also increase the mechanical properties of Xuan paper without affecting the performance of the FCPC. Additionally, HAP is the main inorganic mineral of human bone and teeth and has excellent biocompatibility [48]. A simple option to increase the resistance of Xuan paper is the one proposed by J. Li et al. [50], where the paper is reinforced by immersing it in Polyvinylamine (PVAm). This procedure could be used in future work, also attempting the use of PVA, since the introduction of such a polymer into the Xuan paper fibers can increase its mechanical properties.
Table 3 compares the mechanical parameters obtained for the two FCPCs on the different PET, Xuan paper, and EVA substrates with those obtained on substrates without the composite material. The mechanical properties of substrates are highest when they are uncoated, particularly in the PVA-xanthan/PEDOT:PSS-CuPc case. According to Kang, T.W. et al. [51], PEDOT:PSS may have some elongation limitations when used in composite materials. However, although EVA is the substrate with the lowest mechanical parameters, they are still in the order of KPa. These values are well above the requirements for FCPCs used in flexible strain sensors under normal service conditions [43,45,46,47]. Furthermore, strain range is one of the main considerations for flexible sensors used in joint areas such as fingers and elbows. Strain range is the maximum strain at which a sensor can maintain stable sensing performance under repeated loading and unloading, and it depends on the sensor materials and structure [52]. Table 3 presents the strain range of the stress–strain curves since, as mentioned above, efficient detection is important for sensors. This is only achieved if the sensor remains within its elastic zone, ensuring it can return to its original dimensions after the stress to which it is subjected is removed. The presence of PVA and xanthan gum in PVA-xanthan/PPy-CuPc and PVA-xanthan/PEDOT:PSS-CuPc FCPCs significantly increases the deformation resistance of the sensors. Most of the failure causes of strain sensors are due to fatigue, plastic deformation, or fracture of the substrate under large strains, while graphene-based sensors have high durability. However, the sensors obtained in this work present a higher strain range than sensors with graphene, such as those made of G/PHMS/PVA/Cu [53]. Regarding sensor breakage, it is observed that the greatest mechanical resistance is obtained with PET as a substrate and the PPy matrix. Nevertheless, rupture strength values for all samples are in the order of KPa, making them suitable for use as flexible sensors.

3.3. Evaluation of Optical Parameters in FCPCs

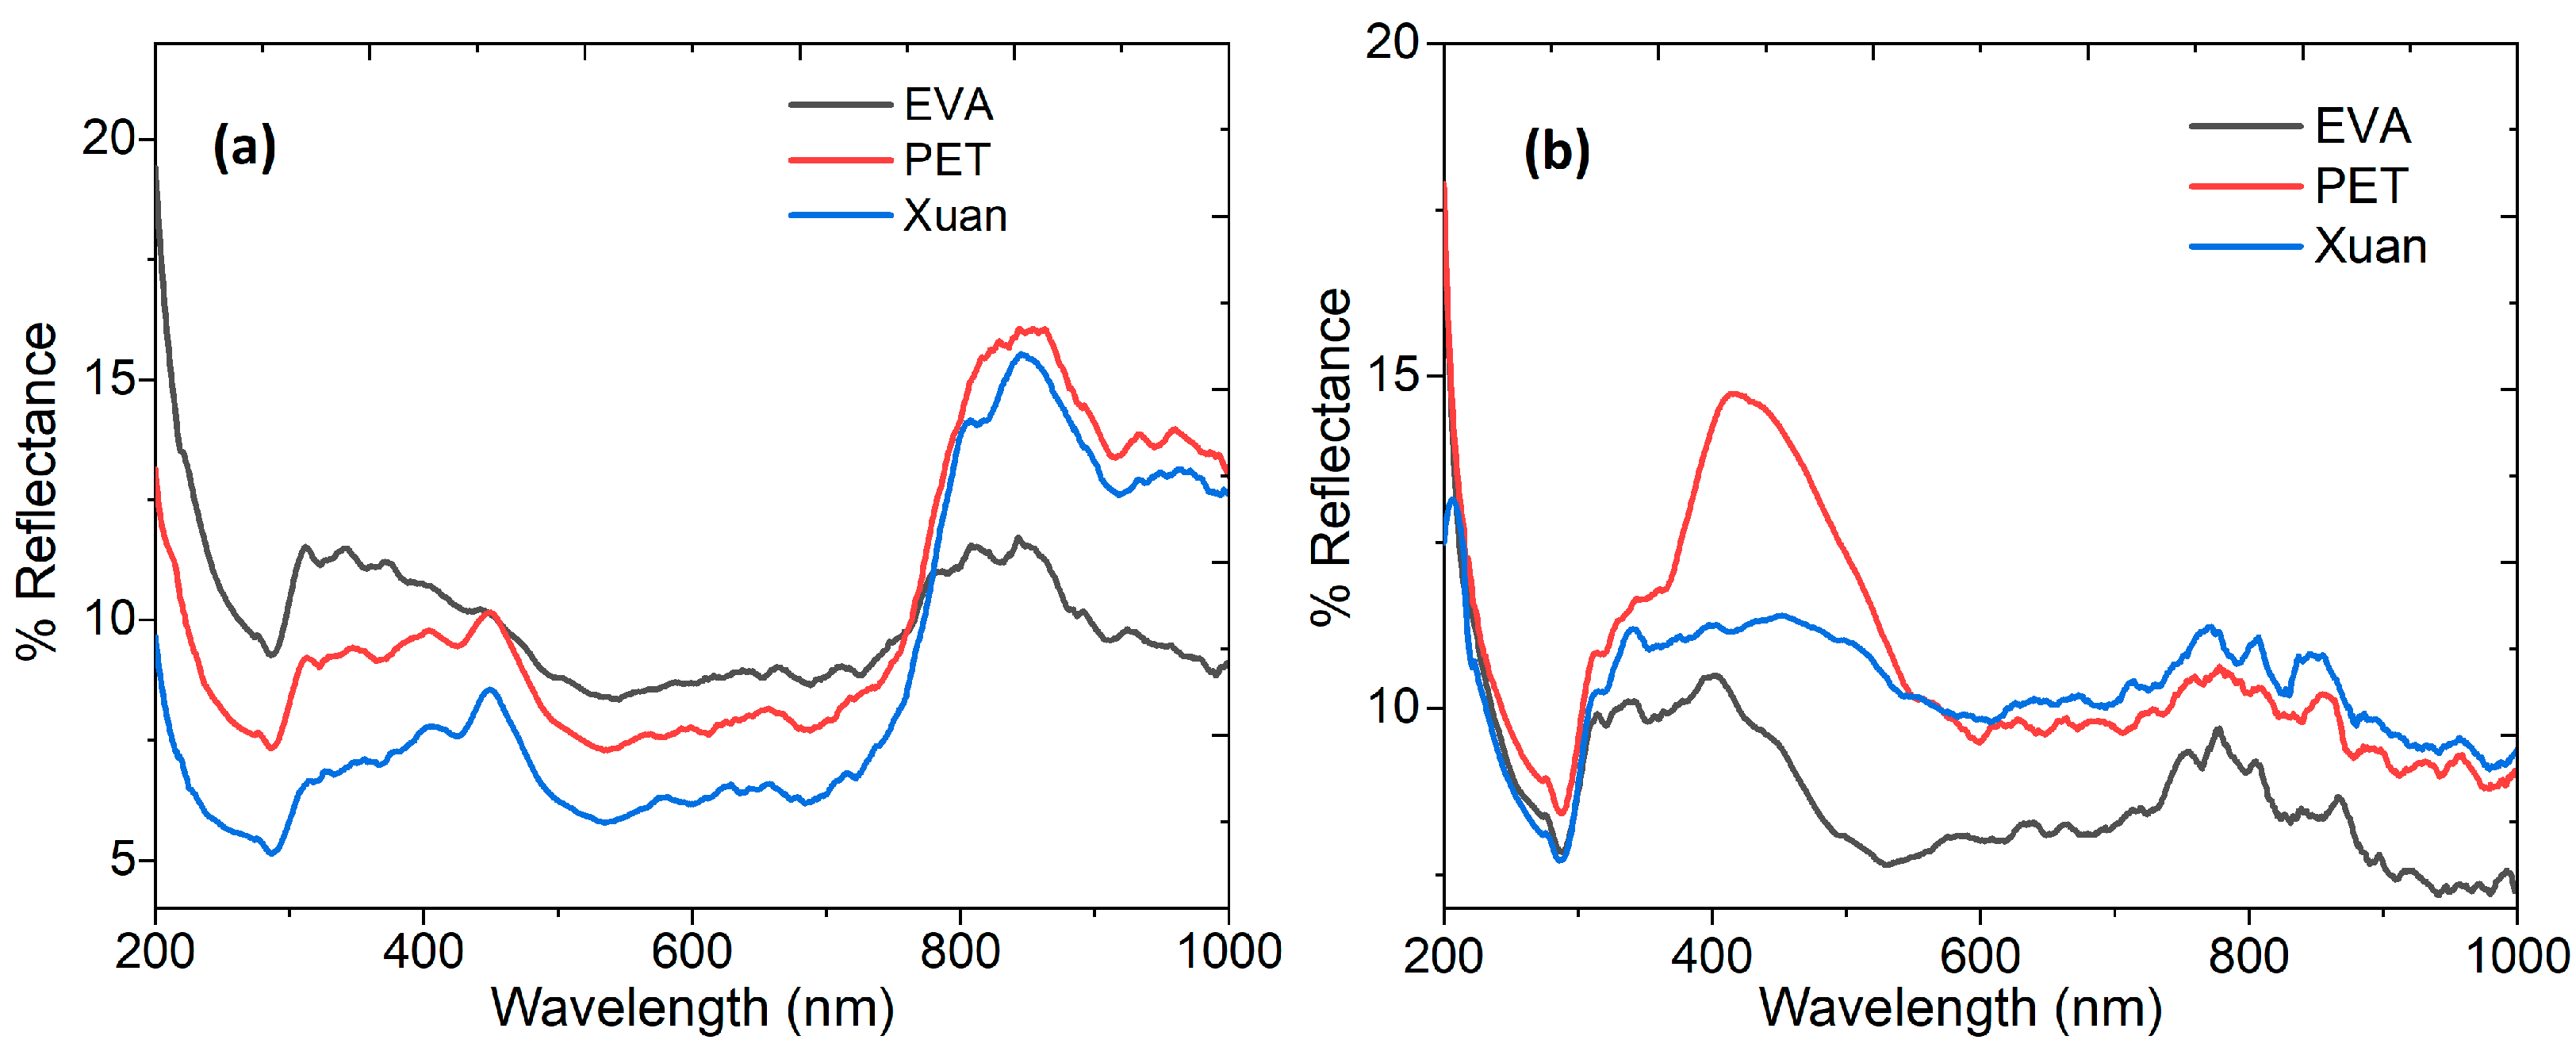
The PVA-xanthan/PPy-CuPc and PVA-xanthan/PEDOT:PSS-CuPc FCPCs were evaluated with UV-vis spectroscopy to obtain the diffuse reflectance (R) of each one on the different substrates. Optical properties such as reflectance are not relevant in traditional ECGs, because these are completely electrical systems. However, this work proposes the development of electrodes for biomedical technologies in which optoelectronic or photoactive sensors are used, such as ECG systems integrated with optical sensors, such as oximeters or smartwatches. These systems require low R values for PVA-xanthan/PPy-CuPc and PVA-xanthan/PEDOT:PSS-CuPc to enhance light absorption. CuPc is photoactive, and when combined with conductive polymers such as PEDOT:PSS or PPy, its photoelectrode properties can be significantly improved. Figure 7 shows the R spectra for the two materials deposited on the different substrates. Regardless of the type of substrate used, the R is below 15% and at its maximum value at λ > 780 nm for PVA–xanthan/PPy-CuPc and 350 < λ < 600 nm for PVA-xanthan/PEDOT:PSS-CuPc. The EVA substrate had the lowest R value, followed by Xuan paper and finally PET. This could be related to the opaque nature of EVA, the translucency of Xuan paper, and the transparency of PET. Additionally, the Q-band of CuPc can be observed in the spectra between 750 and 900 nm, even in the presence of all the polymeric materials that make up the composite films. This band is associated with the electronic transitions π→π* of the 18 conjugated π electrons of the structure of the phthalocyanine [54]. In the spectra, it is also possible to observe the B-band in the region between 300 and 530 nm, which represents a d-band association with the Cu atom, leading to π-d transitions due to the partially filled d-orbitals of the metal in CuPc [54]. The results obtained in both R spectra indicate that CuPc maintains its optical absorption (Q and Soret bands) even in the presence of Xanthan gum, PVA and PPy or PEDOT:PSS. This behavior promotes selective absorption of the electrodes, especially in red and UV lights. The presence of CuPc had already been detected with EDS studies, and its optical behavior is maintained in the FCPCs. On the other hand, the low R obtained in all cases confirms the previous results, demonstrating that PVA-xanthan/PPy-CuPc and PVA-xanthan/PEDOT:PSS-CuPc could be used as photoelectrodes.
The performance of ECG electrodes and flexible strain sensors mainly depends on the electrical properties of the semiconductor or conductor materials. To evaluate the charge transport capacity of each FCPC, the optical band gap was determined using the Kubelka–Munk function (K–M or F(R)), obtained through R [55]:
F K M = 1 R 2 2 R
This equation applies to materials with high light scattering and absorbing particles in a matrix, as is the case with CuPc embedded in PPy-based matrices and PEDOT:PSS in PVA–xanthan [55,56,57].
To determine the band gap (Eg), the Tauc equation was used [58]:
α ( h ν ) B ( h ν E g ) n
where α is the absorption coefficient; hν is the photon energy (h = Planck’s constant and ν = 1/λ); B is a proportionality constant; and the exponent n depends on the type of electronic transitions. In this case, n = 2 for indirect allowed transitions related to the amorphous character of PVA-xanthan/PPy-CuPc and PVA-xanthan/PEDOT:PSS-CuPc. The coefficient α is directly proportional to F(K − M), and in the Tauc equation it can be replaced by F(K − M):
( h ν × F K M B h ν E g n
By plotting (hν × F(K − M))1/2 as a function of hν, the linear portion of this curve is fitted with a straight line, and subsequently, the intersection of this line with the photon energy axis gives Eg [30,56,57,58]. Table 4 summarizes the band gap calculations obtained for each FCPC on the different substrates. For PPy materials, the lowest Eg value was obtained when deposited on Xuan paper, and for PEDOT:PSS materials, the lowest value was obtained with PET. However, the obtained values are very close to each other, and all are within the range of organic semiconductors. This indicates that FCPCs are suitable as conductive active materials in ECG electrodes and flexible strain sensors. Apparently, the presence of CuPc combined with the conductive polymers PPy and PEDOT:PSS will be able to capture bioelectrical signals, reducing resistance and increasing signal fidelity, which should be verified with the evaluation of the performance of both the electrodes and the sensors.

3.4. Electrical Evaluation of ECG Electrodes and Flexible Strain Sensors

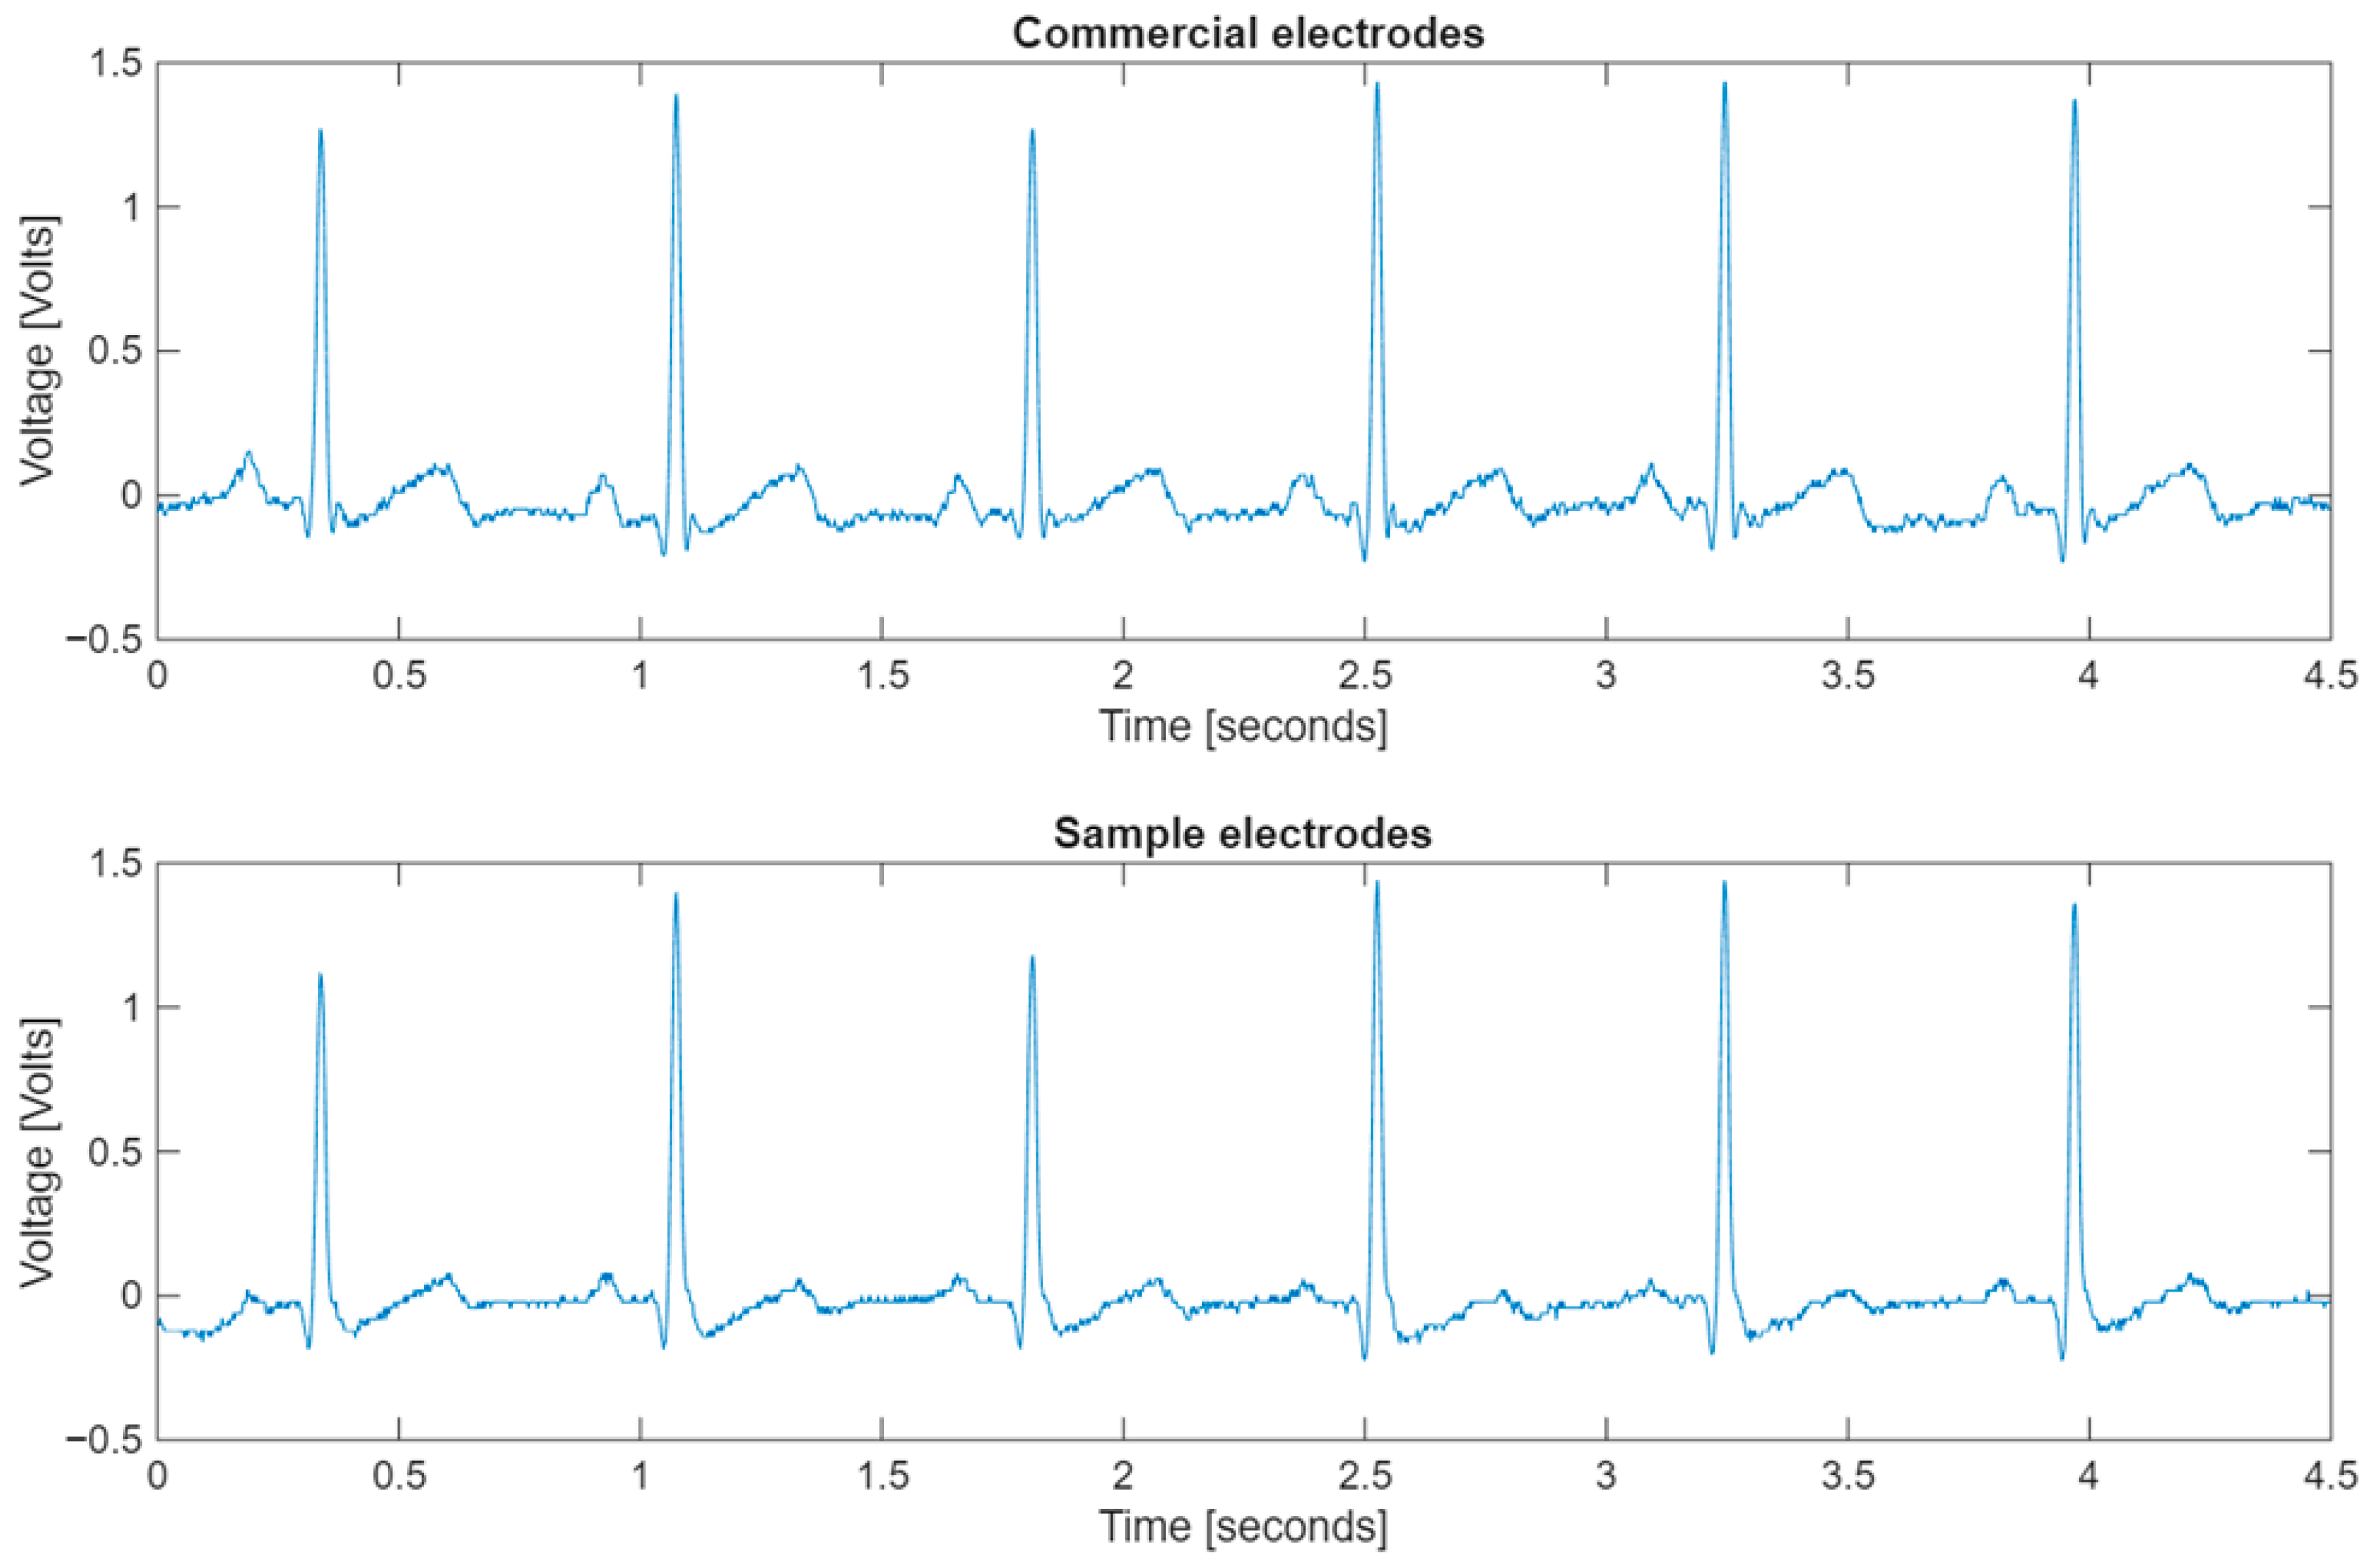
When comparing the signal obtained from the fabricated electrodes with that from the commercial electrodes, it can be observed that both signals show the complete morphology of the ECG signal. It is important to note that the commercial electrodes are fabricated using Ag/AgCl along with conductive gel, considered the standard for ECG measurement, while the fabricated electrodes did not use any conductive gel and were adhered to the skin using tape. The signals with both sets of electrodes were obtained simultaneously to ensure that the analysis was made for the exact same signal. Figure 8 shows a sample of these signals obtained using commercial electrodes and electrodes fabricated with PVA-xanthan/PPy-CuPc on PET. This example was chosen since it showed the best performance of all fabricated electrodes. The two signals are very similar in both amplitude and morphology. Thus, by visual inspection, it can be concluded that the fabricated electrodes can be used instead of the commercial ones. To ensure that the signals obtained from the fabricated electrodes were valid, the three SQIs described in the methodology were obtained and compared in Table 5. The SQI values from the fabricated electrodes should be like or better than those obtained by the commercial electrodes to consider them a viable option for ECG acquisition.
One of the main concerns of using the fabricated electrodes is the presence of noise in the ECG signal, which could limit the correct identification of the different ECG waves. kSQI is used as an indicator of noisy signals, where an ECG signal with low noise is expected to have a kSQI value larger than 5 [35,37]. As can be seen in Table 5, the value of kSQI in all cases is well above 5, confirming that the ECG signals have a low noise level. Since one of the main uses of the ECG signals is the detection of the QRS complex to measure heart rate and heart rate variability, using an SQI based on beat detection is necessary. bSQI is used for that purpose, testing the ability of two QRS detectors to detect the same number of beats. An ECG signal with good quality should have a bSQI value of 1 or as close to 1 as possible, indicating that all or most beats were detected by the two QRS detectors. As can be seen in Table 5, all signals achieved a bSQI value of 1, meaning there was a perfect QRS detection in all cases.
Finally, the spectral distribution of the ECG was calculated and analyzed using sSQI. Since the QRS complex contains approximately 99% of the energy of the ECG signal, a good indicator of quality is to compare the power distribution of the QRS complex as compared with the rest of the signal [37]. This SQI is also valuable since it allows for the detection of electrode motion, which is an expected problem with the fabricated electrodes. The values obtained for the fabricated electrodes range from 0.557 to 0.651, while the commercial electrodes had values between 0.521 and 0.596. All these values fall within the expected range for a resting heart rate, indicating that the signals have good quality. Based on the combined results and the fact that the values for the fabricated electrodes are very similar to those obtained with the commercial electrodes, it is safe to say that the different samples can be used to obtain ECG signals confidently for making a medical diagnosis, confirming what was determined by visual inspection of the ECG signals.
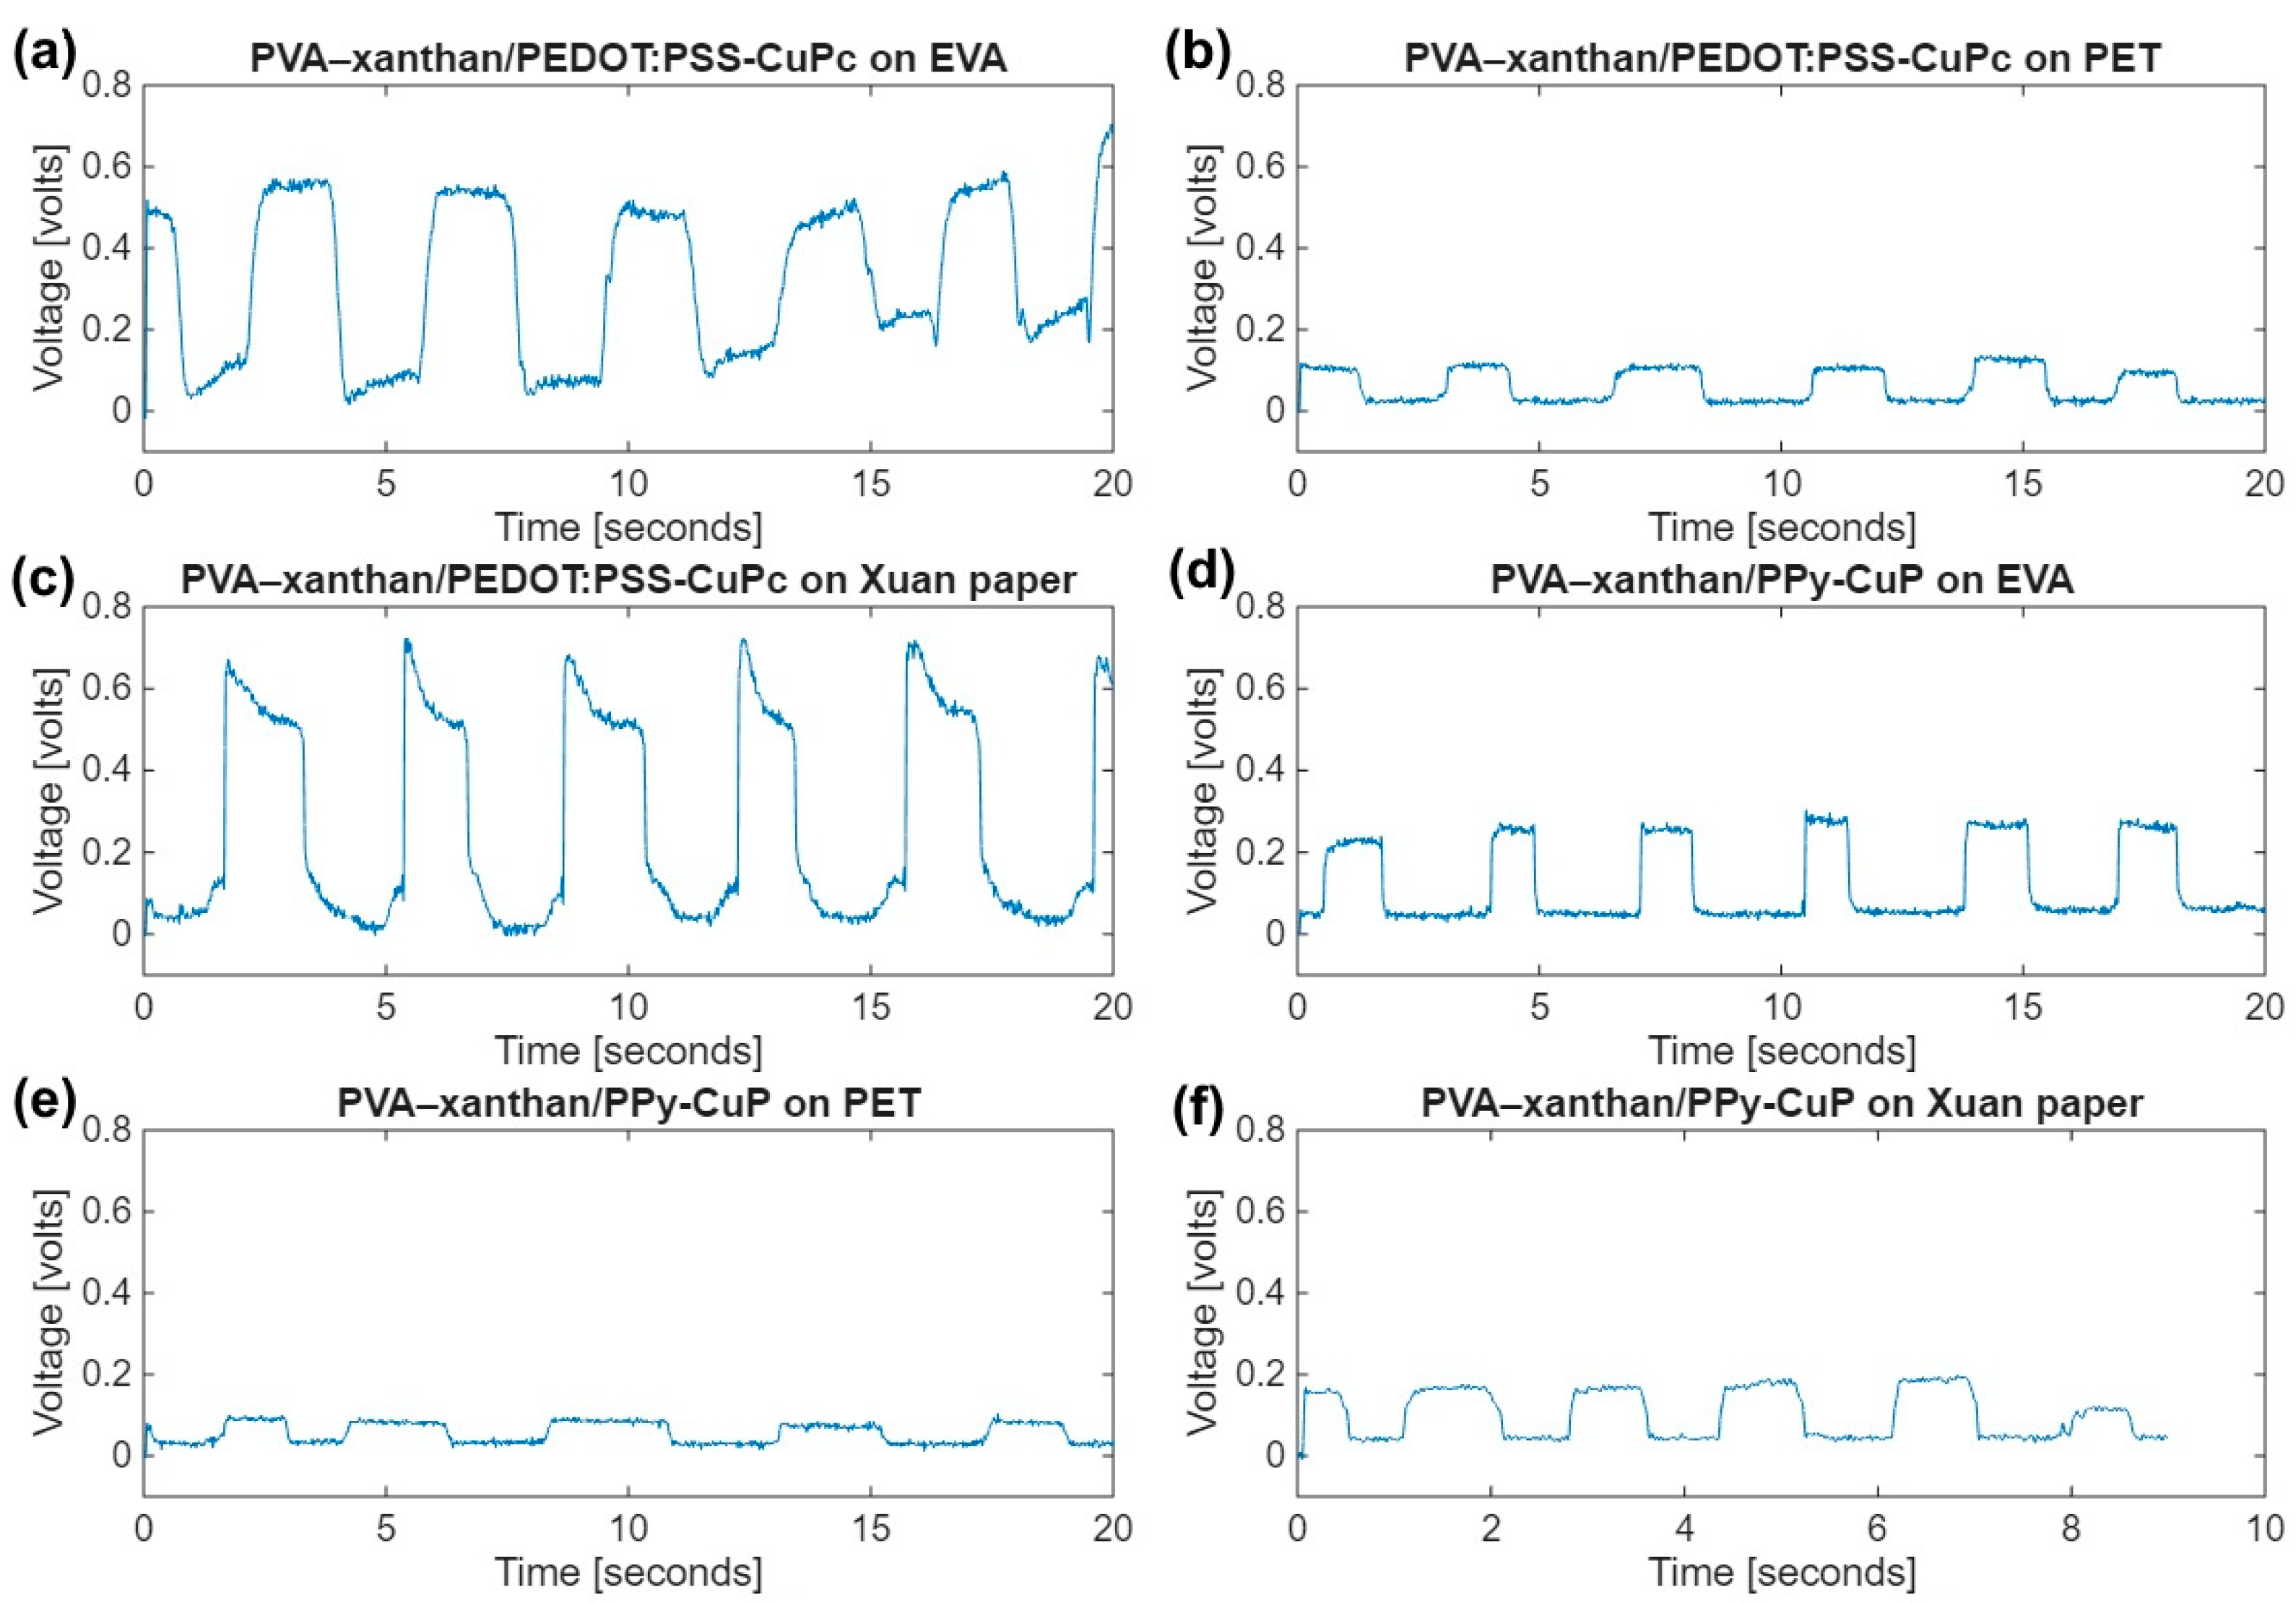
When testing the fabricated flexible strain sensors, voltage graphs were obtained showing how voltage changed in response to the deformation of the sensors. In all cases, the voltage increased when the sensor was flexed and decreased when it was extended. This behavior can be observed in Figure 9 for all 6 sensors. One of the main limitations that can present in these types of sensors is their high resistance (in the order of mega ohms), which results in very small voltage variations. This behavior can specifically be observed in the sensors deposited in PET, where the voltage variation is smaller than 0.1 V (Figure 9b,e). This small change can result in a measuring problem, as the voltage variation can go undetected by standard measuring equipment. Even though the sensors deposited in Xuan paper demonstrated to have a higher voltage variation (Figure 9c,f), these sensors presented another common issue of having small voltage variations: susceptibility to motion. This problem was mainly observed on the PEDOT:PSS-CuPc sample (Figure 9c), where motion is causing a peak when the sensor is flexed. To avoid this behavior, it is necessary to design a robust clamping mechanism that ensures the sensors stay in place and are only deformed by the movement that needs to be studied. In comparison, both sensors that used EVA as a substrate (Figure 9a,d) showed the biggest voltage variation because of the flexion and extension. This is an indicator that EVA is a more suitable substrate to be used in a flexible strain sensor, making it desirable to use these sensors for further testing since movement can be more easily measured.
Even though the different samples had different results, all of them demonstrated to have a piezoresistive nature, making them a viable option for use as strain sensors, highlighting the potential of the samples deposited in EVA, based on their improved performance. These results are consistent with those demonstrated by X. Hu et al. [53], where a graphene wearable sensor could detect the motion of body-related signals. Flexible strain sensors can prove very useful in medical applications, such as measuring the range of motion for different body joints. Additionally, the sensors can be customized to better adapt to the body anatomy, resulting in a more precise measurement focused on a specific part of the body.

4. Conclusions

Flexible conductive polymer composites (FCPCs) based on CuPc, embedded in PPy and PEDOT:PSS polymer matrices, were used to manufacture ECG electrodes and strain sensors on flexible substrates such PET, Xuan paper and EVA. The morphological and chemical characterization revealed significant differences between the composite films. SEM analysis showed a stark contrast between the smooth and continuous PEDOT:PSS coatings and the rough, globular, and porous structure of the PPy FCPC. The final topography was also strongly influenced by the underlying substrate. Furthermore, EDS analysis confirmed the successful and homogeneous incorporation of the CuPc into both polymer matrices. The definitive evidence was the strong spatial correlation between the N and Cu signals in the elemental maps, proving their shared molecular origin and successful integration. Regarding its mechanical behavior, the highest resistance, with the presence of both elastic and plastic zones in its stress–strain curves, was present in the FCPCs on PET. On the other hand, the Reflectance is below 15% and its optical band gap values are within normal ranges for organic semiconductors for the two FCPCs and could be used as photoelectrodes. All samples were able to detect the ECG signal with a similar quality to that of commercial electrodes, while the FCPCs that used EVA as a substrate got the best results working as flexible strain sensors.

Author Contributions

Conceptualization, M.E.S.V., J.A.H.M. and C.I.H.N.; Data curation, M.E.S.V., J.A.H.M., C.I.H.N., M.M.-A., S.F.G.H. and I.C.; Formal analysis, M.E.S.V., I.C. and M.M.-A.; Funding acquisition, M.E.S.V.; Investigation, M.E.S.V., C.I.H.N. and J.A.H.M.; Methodology, M.E.S.V., J.A.H.M., C.I.H.N., M.M.-A., S.F.G.H. and I.C.; Project administration, M.E.S.V.; Resources, M.E.S.V., M.M.-A. and I.C.; Software, M.E.S.V. and M.M.-A.; Supervision, M.E.S.V.; Validation, M.E.S.V., I.C., J.A.H.M., C.I.H.N., S.F.G.H. and M.M.-A.; Visualization, M.E.S.V. and C.I.H.N.; Writing—our knowledge original draft, M.E.S.V., J.A.H.M., S.F.G.H., I.C., C.I.H.N. and M.M.-A.; Writing—review & editing, M.E.S.V., J.A.H.M., C.I.H.N., S.F.G.H., I.C. and M.M.-A. All authors have read and agreed to the published version of the manuscript.

Funding

M.E.S.V. acknowledges financial support from the Anahuac México University, project number PI0000067.

Institutional Review Board Statement

Not applicable.

Data Availability Statement

Data are contained within the article.

Acknowledgments

The authors are grateful for the technical support of Héctor Daniel Nájera Cabrales. Selma Guerra acknowledges CONACyT scholarship No. 1008124.

Conflicts of Interest

The authors declare no conflicts of interest.

References

  1. Mijit, A.; Li, S.; Wang, Q.; Li, M.; Tai, Y. Silver Nanowire-Based Flexible Strain Sensor for Human Motion Detection. Sensors 2024, 24, 3329. [Google Scholar] [CrossRef]
  2. Nigusse, A.B.; Malengier, B.; Mengistie, D.A.; Tseghai, G.B.; Van Langenhove, L. Development of Washable Silver Printed Textile Electrodes for Long-Term ECG Monitoring. Sensors 2020, 20, 6233. [Google Scholar] [CrossRef]
  3. Le, K.; Servati, A.; Soltanian, S.; Servati, P.; Ko, F. Performance and Signal Quality Analysis of Electrocardiogram Textile Electrodes for Smart Apparel Applications. Front. Electron. 2019, 2, 685264. [Google Scholar] [CrossRef]
  4. Kolodziej, L.; Iwasińska-Kowalska, O.; Wróblewski, G.; Giżewski, T.; Jakubowska, M.; Lekawa-Raus, A. Hydrogels and Carbon Nanotubes: Composite Electrode Materials for Long-Term Electrocardiography Monitoring. J. Funct. Biomater. 2024, 15, 113. [Google Scholar] [CrossRef]
  5. Kumar, G.; Duggal, B.; Singh, J.P.; Shrivastava, Y. Efficacy of Various Dry Electrode-Based ECG Sensors: A Review. J. Biomed. Mater. Res. 2025, 113, e37845. [Google Scholar] [CrossRef]
  6. Vidhya, C.M.; Kumar, G.; Maithani, Y.; Duggal, B.; Singh, J.P. A performance evaluation of silver nanorods PDMS flexible dry electrodes for electrocardiogram monitoring. Sci. Rep. 2025, 15, 15799. [Google Scholar] [CrossRef]
  7. Maithani, Y.; Choudhuri, B.; Mehta, B.R.; Singh, J.P. Self-adhesive, stretchable, and dry silver nanorods embedded polydimethylsiloxane biopotential electrodes for electrocardiography. Sens. Actuators A Phys. 2021, 332, 113068. [Google Scholar] [CrossRef]
  8. Le, K.; Servati, A.; Servati, P.; Ko, F. Signal Quality Analysis of Electrocardiogram Textile Electrodes for Smart Apparel Applications. In Proceedings of the 2019 IEEE International Flexible Electronics Technology Conference (IFETC), Vancouver, BC, Canada, 11–14 August 2019; pp. 1–3. [Google Scholar] [CrossRef]
  9. Duan, L.; D’hooge, D.R.; Cardon, L. Recent Progress on Flexible and Stretchable Piezoresistive Strain Sensors: From Design to Application. Progress Mater. Sci. 2020, 114, 100617. [Google Scholar] [CrossRef]
  10. Han, F.; Li, M.; Ye, H.; Zhang, G. Materials, Electrical Performance, Mechanisms, Applications, and Manufacturing Approaches for Flexible Strain Sensors. Nanomaterials 2021, 11, 1220. [Google Scholar] [CrossRef]
  11. Ha, H.; Lee, J.; Kim, S. Sensing Mechanism and Application of Mechanical Strain Sensor: A Mini-Review. Facta Univ. Ser. Mech. Eng. 2023, 21, 751–772. [Google Scholar] [CrossRef]
  12. Wu, S.; Kim, D.; Tang, X.; King, M.W.; Zhu, Y. Encapsulated Stretchable Amphibious Strain Sensors. Mater. Horiz. 2024, 11, 5070–5080. [Google Scholar] [CrossRef]
  13. Hakim, M.; Alfarros, Z.; Herianto, H.; Muflikhun, M. High Sensitivity Flexible Strain Sensor for Motion Monitoring Based on MWCNT@MXene and Silicone Rubber. Sci. Rep. 2025, 15, 3741. [Google Scholar] [CrossRef]
  14. Shen, G. Recent advances of flexible sensors for biomedical applications. Progress Nat. Sci. Mater. Int. 2021, 31, 872–882. [Google Scholar] [CrossRef]
  15. Ma, R.; Chou, S.; Xie, Y.; Pei, Q. Morphological/nanostructural control toward intrinsically stretchable organic electronics. Chem. Soc. Rev. 2019, 48, 1741–1786. [Google Scholar] [CrossRef]
  16. Castro, H.; Correia, V.; Pereira, N.; Costab, P.; Oliveiraa, J.; Lanceros-Méndez, S. Printed Wheatstone bridge with embedded polymer based piezoresistive sensors for strain sensing applications. Addit. Manuf. 2018, 20, 119–125. [Google Scholar] [CrossRef]
  17. Díez-Pascual, A.; Rahdar, A. Graphene-Based Polymer Composites for Flexible Electronic Applications. Micromachines 2022, 13, 1123. [Google Scholar] [CrossRef]
  18. Tran, H.; Nguyen, T.H.; Vu, V. Fabrication of Zinc phthalocyanines: Characterisation and optical properties. Vietnam J. Sci. Technol. 2024, 66, 7–11. [Google Scholar] [CrossRef]
  19. Günsel, A.; Bilgiçli, A.T.; Pişkin, H.; Çaylak Delibaş, N.; Yarasir, M.N.; Gündüz, B. Synthesis, characterization, and optical and surface properties of (4-(trifluoromethylthio)phenoxy) copper(II) phthalocyanine. New J. Chem. 2018, 42, 6013–6022. [Google Scholar] [CrossRef]
  20. Evangelista, F.; Carravetta, V.; Stefani, G.; Jansik, B.; Alagia, M.; Stranges, S.; Ruocco, A. Electronic structure of copper phthalocyanine: An experimental and theoretical study of occupied and unoccupied levels. J. Chem. Phys. 2007, 126, 124709. [Google Scholar] [CrossRef]
  21. Hassan, A.; Gould, R. Structural Studies of Thermally Evaporated Thin Films of Copper Phthalocyanine. Phys. Status Solidi A 1992, 132, 91–101. [Google Scholar] [CrossRef]
  22. Christie, R.; Abel, A. Phthalocyanine pigments: General principles. Phys. Sci. Rev. 2021, 6, 671–677. [Google Scholar] [CrossRef]
  23. Elgazzar, E. Improvement the efficacy of Al/CuPc/n-Si/Al Schottky diode based on strong light absorption and high photocarriers response. Mater. Res. Express 2020, 7, 095102. [Google Scholar] [CrossRef]
  24. Demir, S.; Akbay, S.; Canımkurbey, B.; Yuksel, F. Novel Copper(II) Phthalocyanines as Semiconductor Layer in Organic Field Effect Transistors: Synthesis and Investigation of Electrical Properties. J. Mol. Struct. 2024, 1308, 137981. [Google Scholar] [CrossRef]
  25. Huseynova, G.; Hyun Kim, Y.; Lee, J.-H.; Lee, J. Rising advancements in the application of PEDOT:PSS as a prosperous transparent and flexible electrode material for solution-processed organic electronics. J. Inf. Disp. 2019, 21, 71–91. [Google Scholar] [CrossRef]
  26. Gueye, M.N.; Carella, A.; Faure-Vincent, J.; Demadrille, R.; Simonato, J.-P. Progress in understanding structure and transport properties of PEDOT-based materials: A critical review. Progress Mater. Sci. 2020, 108, 100616. [Google Scholar] [CrossRef]
  27. Zeng, M.; Wang, X.; Ma, R.; Zhu, W.; Li, Y.; Chen, Z.; Zhou, J.; Li, W.; Liu, T.; He, Z.; et al. Dopamine Semiquinone Radical Doped PEDOT:PSS: Enhanced Conductivity, Work Function and Performance in Organic Solar Cells. Adv. Energy Mater. 2020, 10, 2000743. [Google Scholar] [CrossRef]
  28. Lo, C.; Wu, Y.; Awuyah, E.; Meli, D.; Nguyen, D.M.; Wu, R.; Xu, B.; Strzalka, J.; Rivnay, J.; Martin, D.C.; et al. Influence of the molecular weight and size distribution of PSS on mixed ionic-electronic transport in PEDOT:PSS. Polym. Chem. 2022, 13, 2764–2775. [Google Scholar] [CrossRef]
  29. Mahmood, J.; Arsalani, N.; Naghash-Hamed, S.; Hanif, Z.; Geckeler, K. Preparation and characterization of hybrid polypyrrole nanoparticles as a conducting polymer with controllable size. Sci. Rep. 2024, 14, 11653. [Google Scholar] [CrossRef]
  30. Hao, L.; Dong, C.; Yu, D. Polypyrrole Derivatives: Preparation, Properties and Application. Polymers 2024, 16, 2233. [Google Scholar] [CrossRef]
  31. He, H.; Chen, Y.; Pu, A.; Wang, L.; Li, W.; Zhou, X.; Tang, C.Y.; Ban, K.; Yang, M.; Xu, L. Strong and high-conductivity hydrogels with all-polymer nanofibrous networks for applications as high-capacitance flexible electrodes. npj Flex. Electron. 2024, 8, 56. [Google Scholar] [CrossRef]
  32. Kaminski, W.; Rozsíval, V.; Jelínek, P. Theoretical study of electronic and transport properties of PPy–Pt(111) and PPy–C(111):H interfaces. J. Phys. Condens. Matter 2010, 22, 045003. [Google Scholar] [CrossRef]
  33. Lee, M.-H.; Teng, K.-H.; Liang, Y.-Y.; Ding, C.-F.; Chen, Y.-C. Flexible biodegradable wearables based on conductive leaf networks. Sustain. Mater. Technol. 2025, 43, e01263. [Google Scholar] [CrossRef]
  34. Teng, K.-H.; Lee, M.-H. PEDOT:PSS treated Xuan paper as a green electronics material for wearable dry electrocardiogram electrodes and flexible strain sensors. J. Environ. Chem. Eng. 2025, 13, 115716. [Google Scholar] [CrossRef]
  35. Rahman, S.; Karmakar, C.; Natgunanathan, I.; Yearwood, J.; Palaniswami, M. Robustness of electrocardiogram signal quality indices. J. R. Soc. Interface 2022, 19, 189. [Google Scholar] [CrossRef] [PubMed]
  36. Li, Q.; Mark, G.R.; Clifford, G.D. Robust heart rate estimation from multiple asynchronous noisy sources using signal quality indices and a Kalman filter. Physiol. Meas. 2008, 29, 15. [Google Scholar] [CrossRef]
  37. Behar, J.; Johnson, A.; Clifford, G.D. A Comparison of Single Channel Fetal ECG Extraction Methods. Ann. Biomed. Eng. 2014, 42, 1340–1353. [Google Scholar] [CrossRef] [PubMed]
  38. Johnson, A.E.; Behar, J.; Andreotti, F.; Clifford, G.D.; Oster, J. R-peak estimation using multimodal lead switching. In Proceedings of the Computing in Cardiology 2014, Cambridge, MA, USA, 7–10 September 2014; pp. 281–284. Available online: https://ieeexplore.ieee.org/abstract/document/7043034 (accessed on 28 July 2025).
  39. Zong, W.; Moody, G.B.; Jiang, D. A robust open-source algorithm to detect onset and duration of QRS complexes. In Proceedings of the Computers in Cardiology, 2003, Thessaloniki, Greece, 21–24 September 2003; pp. 737–740. [Google Scholar] [CrossRef]
  40. He, T.; Clifford, G.; Tarassenko, L. Application of independent component analysis in removing artefacts from the electrocardiogram. Neural Comput. Appl. 2006, 15, 105–116. [Google Scholar] [CrossRef]
  41. Murthy, V.K.; Grove, T.M.; Harvey, G.A.; Haywood, L.J. Clinical Usefulness of ECG Frequency Spectrum Analysis. In Proceedings of the Second Annual Symposium on Computer Application in Medical Care; Washington, DC, USA, 5–9 November 1978, pp. 610–612. Available online: https://pmc.ncbi.nlm.nih.gov/articles/PMC2231746/ (accessed on 5 August 2025).
  42. Cosme, I.; Carrillo-Sendejas, J.C.; Guerra-Hernandez, S.F.; Sánchez Vergara, M.E.; Netzahualcoyotl, C.; Moreno, M. Xanthan gum as a green, non-toxic, surfactant-free modifier for enhanced deposition of PEDOT: PSS in crystalline silicon hybrid solar cells. Surf. Interfaces 2025, 72, 107232. [Google Scholar] [CrossRef]
  43. Liu, X.; Miao, J.; Fan, Q.; Zhang, W.; Zuo, X.; Tian, M.; Zhu, S.; Zhang, X.; Qu, L. Recent Progress on Smart Fiber and Textile Based Wearable Strain Sensors: Materials, Fabrications and Applications. Adv. Fiber Mater. 2022, 4, 361–389. [Google Scholar] [CrossRef]
  44. Chen, Y.; Yuan, X.; Li, C.; Ruan, R.; You, H. Self-Healing and Self-Adhesive Substrate-Free Tattoo Electrode. Materials 2023, 16, 3499. [Google Scholar] [CrossRef]
  45. Zhang, L.; Senthil Kumar, K.; He, H.; Cai, C.J.; He, X.; Gao, H.; Yue, S.; Li, C.; Seet, R.C.-S.; Ren, H.; et al. Fully organic compliant dry electrodes self-adhesive to skin for long-term motion-robust epidermal biopotential monitoring. Nat. Commun. 2020, 11, 4683. [Google Scholar] [CrossRef]
  46. Zhou, K.; Dai, K.; Liu, C.; Shen, C. Flexible conductive polymer composites for smart wearable strain sensors. Smart Mat. 2020, 1, e1010. [Google Scholar] [CrossRef]
  47. Wang, S.; Xiao, P.; Liang, Y.; Zhang, J.; Huang, Y.; Wu, S.; Kuo, S.-W.; Ten, C. Network cracks-based wearable strain sensors for subtle and large strain detection of human motions. J. Mater. Chem. C 2018, 6, 5140–5147. [Google Scholar] [CrossRef]
  48. Dong, L.-Y.; Zhu, I.-J. Fire-Resistant Inorganic Analogous Xuan Paper with Thousands of Years’ Super-Durability. ACS Sustain. Chem. Eng. 2018, 6, 17239–17251. [Google Scholar] [CrossRef]
  49. Dong, L.-Y.; Zhu, Y.-J.; Wu, J.; Yu, H.-P. Comparison of Aging Performances and Mechanisms: Super-Durable Fire-Resistant “Xuan Paper” Versus Chinese Traditional Xuan Paper. Molecules 2025, 30, 263. [Google Scholar] [CrossRef]
  50. Li, J.; Shi, M.; Li, Y.; Fu, P. Research on Strengthening Fragile Paper with Polyvinylamine. Polymers 2024, 16, 619. [Google Scholar] [CrossRef] [PubMed]
  51. Kang, T.W.; Lee, J.; Kwon, Y.; Lee, Y.J.; Yeo, W. Recent Progress in the Development of Flexible Wearable Electrodes for Electrocardiogram Monitoring During Exercise. Adv. NanoBiomed Res. 2024, 4, 2300169. [Google Scholar] [CrossRef]
  52. Liu, Y.; Yi, M.; Chen, T.; Mu, X.; Sun, Q.; Zhou, J. Advances in graphene-based flexible wearable piezoresistive strain sensors. J. Mater. Sci: Mater. Electron. 2025, 36, 1211. [Google Scholar] [CrossRef]
  53. Hu, X.; Huang, T.; Liu, Z.; Wang, G.; Chen, D.; Guo, Q.; Yang, S.; Jin, Z.; Lee, J.-M.; Ding, G. Conductive graphene-based e-textiles for highly sensitive, breathable, and water-resistant multimodal gesture-distinguishable sensors. J. Mater. Chem. A 2020, 8, 14778–14787. [Google Scholar] [CrossRef]
  54. Cranston, R.; Lessard, B. Metal phthalocyanines: Thin-film formation, microstructure, and physical properties. RSC Adv. 2021, 11, 21716–21737. [Google Scholar] [CrossRef]
  55. López, R.; Gómez, R. Band-gap energy estimation from diffuse reflectance measurements on sol–gel and commercial TiO2: A comparative study. J. Sol-Gel Sci. Technol. 2012, 61, 1–7. [Google Scholar] [CrossRef]
  56. Kubelka, P.; Munk, F. An Article on Optics of Paint Layers. Fuer Tekn. Phys. 1931, 12, 593–609. Available online: https://www.graphics.cornell.edu/~westin/pubs/kubelka.pdf (accessed on 29 July 2025).
  57. Kubelka, P. New Contributions to the Optics of Intensely Light-Scattering Materials. Part I. J. Opt. Soc. Am. 1948, 38, 448–457. [Google Scholar] [CrossRef] [PubMed]
  58. Tauc, J.; Grigorovici, R.; Vancu, A. Optical Properties and Electronic Structure of Amorphous Germanium. Phys. Stat. Sol. 1966, 15, 627–637. [Google Scholar] [CrossRef]
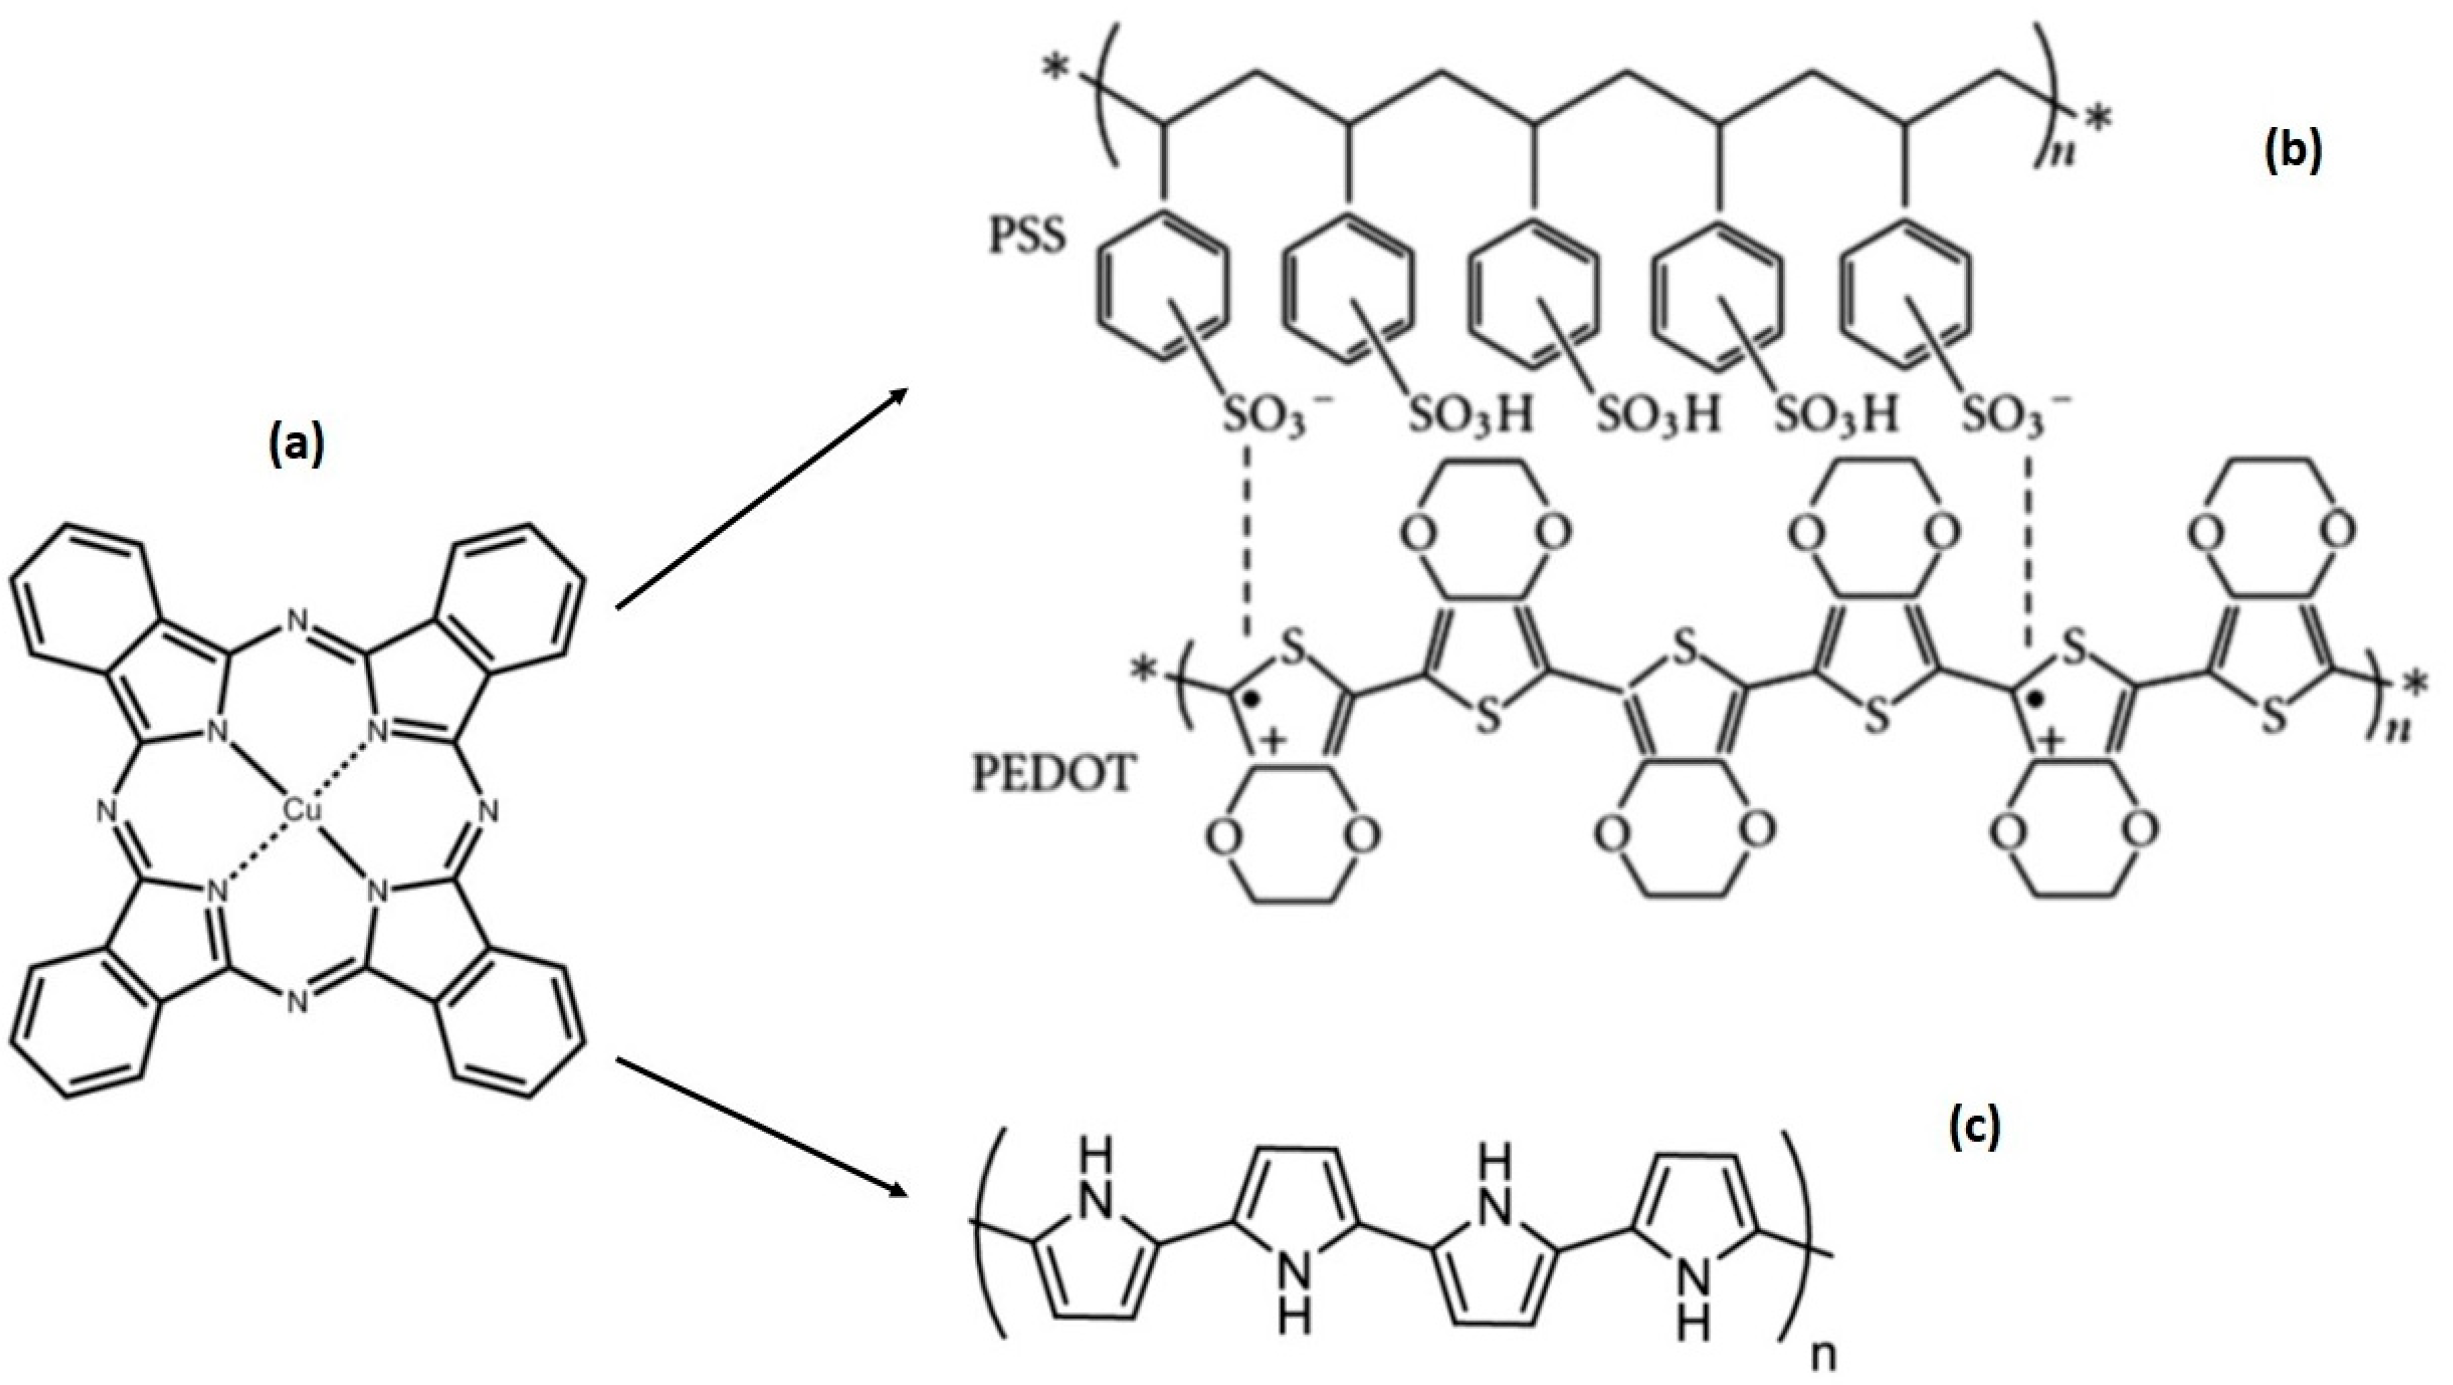
Figure 1. Molecular structure of (a) copper (II) phthalocyanine, (b) PEDOT:PSS and (c) PPy. * indicates that the chain extends with similar monomers on both sides.
Jcs 09 00512 g001
Figure 2. Schematic of the fabrication process of ECG electrodes and flexible strain sensors.
Jcs 09 00512 g002
Figure 3. Comparative analysis by SEM of the morphology of the PPy composite deposited on three different substrates (columns). The rows show the surface at progressive magnifications, with reference scale bars of 20 µm, 5 µm, and 2 µm.
Jcs 09 00512 g003
Figure 4. Comparative analysis by SEM of the morphology of the PEDOT:PSS composite, deposited on three different substrates (columns). The rows show the surface at progressive magnifications, with reference scale bars of 20 µm, 5 µm, and 2 µm.
Jcs 09 00512 g004
Figure 5. EDS elemental mapping of (a) PVA-xanthan/PPy-CuPc on PET and (b) PVA-xanthan/PEDOT:PSS-CuPc on Xuan paper.
Jcs 09 00512 g05aJcs 09 00512 g05b
Figure 6. Stress–strain curve (σ-ε) for PVA-xanthan/PPy-CuPc on (a) EVA, (b) PET, (c) Xuan paper, and PVA-xanthan/PEDOT:PSS-CuPc FCPCs on (d) EVA and (e) PET.
Jcs 09 00512 g006
Figure 7. Reflectance spectra for (a) PVA-xanthan/PPy-CuPc and (b) PVA-xanthan/PEDOT:PSS-CuPc FCPCs on the different substrates.
Jcs 09 00512 g007
Figure 8. ECG signal obtained simultaneously with commercial electrodes (above) and with electrodes fabricated using PVA-xanthan/PPy-CuPc on PET (below). The morphology and amplitude of the ECG signal are similar for both graphs.
Jcs 09 00512 g008
Figure 9. Voltage graphs showing flexion and extension for six different samples. Flexion is shown as an upwards movement, while extension is represented by returning to the baseline. The six different samples are as follows: (a) PVA–xanthan/PEDOT:PSS-CuPc on EVA, (b) PVA–xanthan/PEDOT:PSS-CuPc on PET, (c) PVA–xanthan/PEDOT:PSS-CuPc on Xuan paper, (d) PVA–xanthan/PPy-CuPc on EVA, (e) PVA–xanthan/PPy-CuPc on PET and (f) PVA–xanthan/PPy-CuPc on Xuan paper.
Jcs 09 00512 g009
Table 1. Thicknesses of the FCPCs on the different substrates, and for each individual substrate without the FCPCs.
SampleThickness (mm)
EVA2.00
PET0.64
Xuan paper0.12
PVA-xanthan/PPy-CuPc on EVA0.12
PVA-xanthan/PPy-CuPc on PET0.23
PVA-xanthan/PPy-CuPc on Xuan paper0.049
PVA-xanthan/PEDOT:PSS-CuPc on EVA0.31
PVA-xanthan/PEDOT:PSS-CuPc on PET0.24
PVA-xanthan/PEDOT:PSS-CuPc on Xuan paper0.053
Table 2. Elemental Composition Comparison by EDS (Mass %).
ElementPVA–Xanthan/PPy-CuPcPVA-Xanthan/PEDOT:PSS-CuPc
EVAPETXuan PaperEVAPETXuan Paper
C62.92%64.69%71.40%66.48%72.69%62.90%
N2.27%3.15%0.58%0.81%0.33%0.83%
O32.65%30.45%27.84%32.70%26.71%36.27%
Cu0.28%1.70%0.18%-0.27%-
Na1.88%-----
Table 3. Mechanical parameters for the two FCPCs in three different substrates, along with the standalone substrates.
SampleYoung’s Modulus (KPa)Limit of Proportionality (KPa)Rupture Strength (KPa)Strain Range (%)
EVA917403206.6
PET331,982779212,3442.4
Xuan paper648,8495844310.02
PVA-xanthan/PPy-CuPc on EVA796463209.9
PVA-xanthan/PPy-CuPc on PET310,744624010,40042
PVA-xanthan/PPy-CuPc on Xuan paper28,8324464471.5
PVA-xanthan/PEDOT:PSS-CuPc on EVA640442908.0
PVA-xanthan/PEDOT:PSS-CuPc on PET159,6484074930034
PVA-xanthan/PEDOT:PSS-CuPc on Xuan paper----
Table 4. Optical Band Gap for FCPCs.
SampleOptical Band Gap (eV)
PVA-xanthan/PPy-CuPc on EVA3.4
PVA-xanthan/PPy-CuPc on PET3.4
PVA-xanthan/PPy-CuPc on Xuan paper3.1
PVA-xanthan/PEDOT:PSS-CuPc on EVA3.2
PVA-xanthan/PEDOT:PSS-CuPc on PET3.0
PVA-xanthan/PEDOT:PSS-CuPc on Xuan paper3.2
Table 5. Signal quality indices comparing the simultaneous signals obtained from the commercial electrodes and the fabricated electrodes for each sample. All commercial electrodes are made with Ag/AgCl and conductive gel.
Commercial ElectrodeElectrode from Sample
kSQIbSQIsSQIkSQIbSQIsSQI
PVA-xanthan/PPy-CuPc on EVA27.02310.53923.42510.653
PVA-xanthan/PPy-CuPc on PET30.41110.52132.20210.557
PVA-xanthan/PPy-CuPc on Xuan paper26.72210.57711.09910.629
PVA-xanthan/PEDOT:PSS-
CuPc on EVA
9.06310.57626.54510. 651
PVA-xanthan/PEDOT:PSS-
CuPc on PET
27.32910.56422.42610.638
PVA-xanthan/PEDOT:PSS-
CuPc on Xuan paper
30.39910.59628.29610.639
Disclaimer/Publisher’s Note: The statements, opinions and data contained in all publications are solely those of the individual author(s) and contributor(s) and not of MDPI and/or the editor(s). MDPI and/or the editor(s) disclaim responsibility for any injury to people or property resulting from any ideas, methods, instructions or products referred to in the content.