Article

Statistical and Artificial Neural Network Coupled Technique for Prediction of Tribo-Performance in Amine-Cured Bio-Based Epoxy/MMT Nanocomposites

1
Department of Mechanical and Industrial Engineering, Manipal Institute of Technology, Manipal Academy of Higher Education, Manipal 576104, Karnataka, India
2
Department of Chemical Engineering, Manipal Institute of Technology, Manipal Academy of Higher Education, Manipal 576104, Karnataka, India
*
Authors to whom correspondence should be addressed.
J. Compos. Sci. 2023, 7(9), 372; https://doi.org/10.3390/jcs7090372
Submission received: 3 June 2023 / Revised: 21 June 2023 / Accepted: 14 July 2023 / Published: 6 September 2023
(This article belongs to the Special Issue Advanced Polymeric Composites and Hybrid Materials)

Abstract

:
This study explores the effects of four independent variables—the nanoclay weight percentage, sliding velocity, load, and sliding distance—on the wear rate and frictional force of nanoclay-filled FormuLITETM amine-cured bio-based epoxy composites. An experimental design based on the Taguchi method revealed diverging optimal conditions for minimizing the wear and frictional force. These observations were further validated using a Back-propagation Artificial Neural Network (BPANN) model, demonstrating its proficiency in predicting complex system behavior. Material characterization, conducted through Scanning Electron Microscopy (SEM) and Energy-dispersive X-ray Spectroscopy (EDS), illustrated the homogeneous distribution of the nanoclay within the FormuliteTM matrix, which is crucial for enhancing the load transfer and stress distribution. Atomic Force Microscopy (AFM) analysis indicated that the incorporation of nanoclay increases the surface roughness and peak height, which are important determinants of the material performance. However, an increase in the nanoclay percentage decreased these attributes, suggesting an interaction saturation point. Due to their augmented mechanical properties, the present study underscores the potential of amine-cured bio-based epoxy systems in diverse applications, such as automotive, aerospace, and biomedical engineering.

1. Introduction

Composite material is the assembly of two or more materials, typically classified as reinforcement and matrix components, with the final assembly possessing the preferable properties of each constituent material. Based on the matrix materials used, these composites are classified as polymer matrix composites (PMC), metal matrix composites (MMC), and ceramic matrix composites (CMC) [1]. In particular, PMCs are utilized as a material for structural components in almost every engineering field. The PMC matrix materials can be classified as thermoplastic or thermoset-based resin systems. The selection of an appropriate matrix system for the PMC based on the intended application is a crucial task as the matrix directly influences the ultimate property of the composite [2]. Although the composite’s longitudinal tensile property depends on the reinforcement used, the composite’s transverse tensile property, shear strength, compressive strength, heat resistance, and environment depend on the matrix [2,3]. The most commonly used thermoset-based resins are epoxy, ethylene-co-vinyl acetate (EVA), polyester, vinyl-acetate, phenolic, unsaturated polyester, unsaturated and accelerated orthophthalic polyester, unsaturated isophthalic polyester, and phenol-formaldehyde. The most commonly used thermoplastics are natural rubber, high-density polyethylene (HDPE), polystyrene, acrylonitrile butadiene rubber, poly methyl methacrylate, polyvinyl chloride, low-density polyethylene (LDPE), and polypropylene (PP) [4,5]. Epoxy resins are one of the most versatile thermoset classes and have many applications [6]. These are a group of cross-linkable materials that all contain the epoxy or oxirane functional group (1) [7]. Epoxy resins may be cross-linked with themselves or a wide variety of co-reactants, such as amines, acids, anhydrides, phenols, alcohols, and thiols. These co-reactants are commonly known as hardeners. Epoxy resin-to-hardener ratios can be 1:1 or 4:1 [8].
Epoxy resins, when used in composites, offer superior mechanical properties, exceptionally low contraction after curing, superior fiber-matrix adhesion, and moisture resistance compared to polyester or vinyl ester resins [9]. Despite several advantages, concerns over synthetic epoxy resins’ negative environmental and health impacts have arisen. Specifically, their production releases greenhouse gases and other pollutants, contributing to environmental degradation [10,11,12,13]. Moreover, these resins’ production, use, and disposal emit volatile organic compounds (VOCs) can cause respiratory problems and eye irritation. Handling them also necessitates protective equipment, adding to worker inconvenience [14,15].
In response to these issues, there is growing interest in sustainable alternatives, such as bio-based resins [16,17,18]. These resins are derived from renewable sources like plants and biomass. Thus, they have a lower environmental impact, are biodegradable, and emit fewer VOCs. They are considered safer to handle due to the absence of toxic chemicals [19,20,21,22]. Bio-based resins can be classified into several categories, based on their source and synthesis method. For instance, some are derived from plant oils such as soybean, castor, and linseed oil [23], while others come from agricultural feedstocks, lignocellulosic biomass (starch and cellulose), fatty acids, and organic waste [24]. These bio-based resins are increasingly used in various applications that are traditionally occupied by synthetic resins. In the construction industry, they are used in making environment-friendly building blocks and wall coatings [25]; in the automotive sector, they are used to improve environmental performance [26,27]; in the packaging sector, they are utilized to promote eco-friendly packaging while maintaining the durability and product shelf life [28]; and in the electronics industry, they are used in encapsulants and circuit board coatings [29]. However, their use faces challenges; namely, they have a higher cost than synthetic resins due to their more expensive raw materials and processing. The limited availability of some bio-based materials can also restrict production. Despite these drawbacks, the benefits of bio-based resins, including their lower environmental impact and biodegradability, make them a promising alternative to synthetic resins. As the demand for sustainable materials increases, their usage will likely become more prevalent across various industrial sectors. The FormuliteTM series of bio-based epoxies is one such bio-based polymer that several researchers have explored in recent times for its applicability in various engineering sectors. It is derived from natural phenolic materials that are obtained by distilling Cashew nutshell liquids (CNSL) [30,31,32,33,34]. The mechanical strength and water absorption tests conducted on the FormuliteTM bio-based epoxy variants showed that they—and particularly the one comprising a combination of FormuliteTM 2501A + FormuliteTM 2401B—proved to exhibit properties nearing the traditionally used LY556/HY951 synthetic epoxies [35].
In addition to using bio-based resins in the composites, nanotechnology has also helped to enhance the material’s quality in processed nanofillers [36]. Nanoclays (NC) are the most researched and commercialized nanofillers, and are based on montmorillonite (MMT) clay, a naturally abundant smectite clay material derived from bentonite ore [37]. They are layered silicates with a typical single-layer thickness of 0.7 nm and a double-layer thickness of 1 nm. Surfactants, if used, can enhance the interlayer’s plasticity and swelling capacity [38]. It has a high surface area to volume ratio and high chemical reactivity, which facilitates the pozzolanic reaction [39]. NC have recently been introduced into PMC as an environmentally benign material with inexpensive chemical components. In this discipline, the synthesis, characterization, stability, and surface properties of polymer/nanoclays and their fabrication are investigated to develop novel materials. In polymer/nanoclay composites, the final characteristics are modified rather than the bulk polymer due to particle reinforcing and the cross-linking effect, which restricts polymer chain movement. As a result, the desirable characteristics, such as the mechanical properties, reduced gas permeability, and flame resistance are attained. Due to their high aspect ratio, nanoclays are ideal for reinforcement, but they must be well dispersed for optimal performance [40].
To date, FormuliteTM series bio-based epoxies have been investigated for their mechanical, structural, and thermal properties in their available form or as a matrix material in composites, but no study to date has been recorded on the friction and wear behavior of this bio-based resin. Also, the effect of nanoclay addition to the FormuliteTM resins has not been investigated. Thus, the present study aims at investigating the wear properties of one of the FormuliteTM epoxy resins with 34% bio-content, possessing FormuliteTM 2501A + FormuliteTM 2401B as its components and with the addition of nanoclays at different weight percentages in it. The NC-filled FormuliteTM bio-based epoxy specimens were prepared in the laboratory, and the wear experiments on the specimen were conducted as per the suitable design of experiments and validated using the artificial neural network to accomplish the objective of the present study.

2. Methodology

2.1. Sample Preparation

The FormuliteTM 2501A and FormuliteTM 2401B amine-cured epoxy systems were procured from Cardolite Specialty Chemicals India LLP, Mangalore, Karnataka, India. Part A of the epoxy system was mixed with montmorillonite nanoclay (NC) in specific weight percentages (wt.%) of 1, 2, and 3%. The mixture was placed in a homogenizer and agitated at a speed ranging between 1000 and 5000 rpm at room temperature for 10 min. Subsequently, the mixture was transferred to a desiccator with a hot bath maintained at the temperature of 80 °C for 30 min to remove the air bubbles. The hardener, designated as Part B, was then added to the mixture in a ratio specified by the company. This mixture was magnetically stirred for 10 min to ensure homogeneous NC distribution within the epoxy. The resulting mixtures were poured into molds to create rectangular sheets of nanoclay-filled FormuLITETM amine-cured bio-based epoxy composites. Figure 1 illustrates the stages involved in the processing of nanoclay-filled FormuLITETM.

2.2. Wear Test

Sliding wear tests were conducted using pin-on-disc apparatus. Rectangular pins measuring 50 × 6 × 6 mm were cut from the fabricated nanoclay-filled FormuLITETM amine-cured bio-based epoxy composites sheets. The sample pins were abraded with P-1200 grade abrasive paper to assure uniform roughness. Key parameters, such as test duration, applied load, sliding velocity, and sliding distance, were predetermined using a pilot study before testing. The nanoclay-filled FormuLITETM amine-cured bio-based epoxy composites specimens were then dried in an oven at 40 °C for 24 h.
Further, the sample pins were rubbed again with P-1200 grade abrasive paper to ensure uniform roughness. All surfaces involved in the testing, including those of the sample and the disc, were cleaned with acetone before commencing the test. The initial weight of the pin was recorded using a digital electronic balance with a count of at least 0.0001 g. After mounting the specimen pin in the holder, a normal load was applied to the pin through a pivoting loading lever, and the tests were conducted as per the predetermined parameters.
After the test, the pin was reweighed using the same balance, and the weight loss was determined by calculating the difference. To ensure the repeatability of the test data, a minimum of three trials were conducted. The specific wear rate ( K ) was calculated using Equation (1):
K = W ρ L D
Here, W represents the weight loss (in g), ρ denotes the density (in g/cm³), L signifies the load (in N), and D indicates the sliding distance (in m).

2.3. Design of Experiments

Design of Experiment (DOE) is a potent statistical technique that plays a crucial role in studying the simultaneous effects of multiple variables. It consists of a series of sequential actions designed to enhance our comprehension of the process performance. Each designed experiment necessitates testing numerous combinations of factors and levels to observe the results of varying test conditions. Herein, we utilize the Taguchi method, which employs specific orthogonal arrays to assign factors and determine these test combinations. The phases of the DOE procedure are planning, execution, and analysis. Determining the appropriate combination of factors and levels to yield the desired information is crucial in this process. When analyzing experimental data, a signal-to-noise ratio is utilized to identify the optimal process designs. These techniques are predominantly geared toward improving the design of manufacturing processes. The present study used the orthogonal method for four factors at three levels to elaborate the experiment plan. The factors to be studied and the assignment of the corresponding levels are indicated in Table 1. The parameters were analyzed utilizing the ANOVA technique. This methodology helped in ranking various parameters and determining the significance of their influence on a particular output response and the interactions between factors.
The structure of the discussed orthogonal arrays is defined in the Taguchi table, which serves as a guiding reference for the experiment (refer to Table 2 for a related reference).

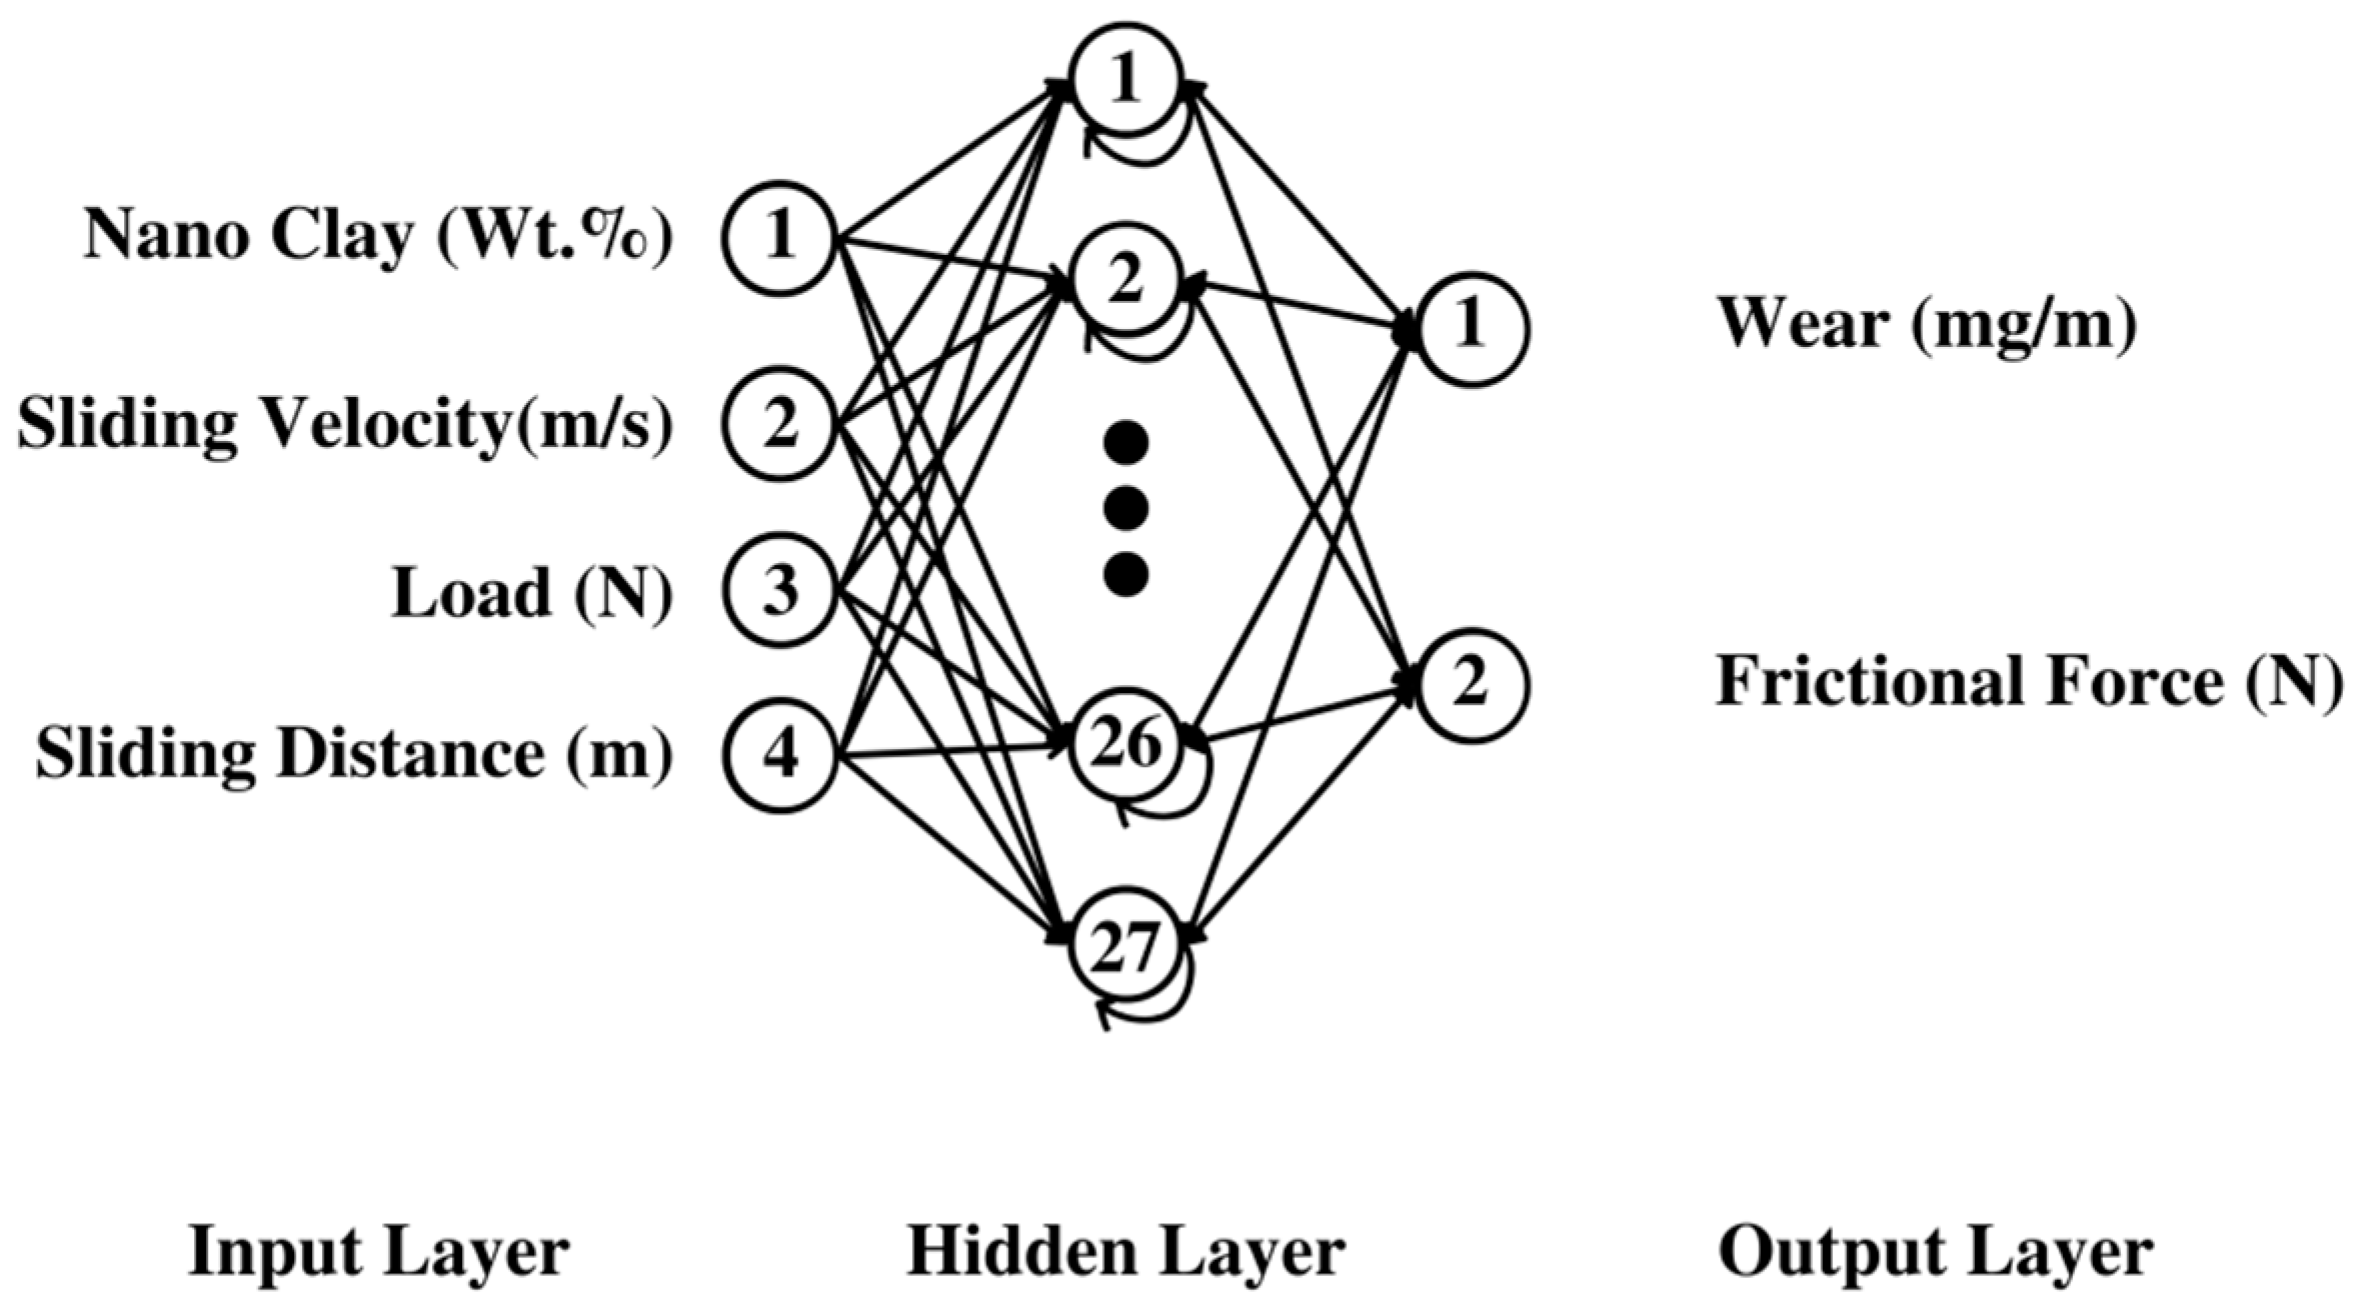
2.4. Back-Propagation Artificial Neural Network Analysis

The back-propagation artificial neural network (BPANN) is a multilayered feedforward model widely adopted among various neural network configurations. The BPANN algorithm used here is based on the standard back-propagation learning algorithm, where the aim is to minimize the error between the network’s output and the target values. This algorithm involves a forward pass, where the input data traverse through the network and generate an output, followed by a backward pass, where the error between the predicted and actual output is propagated back to adjust the weights of the network connections. A typical BPANN comprises three layers: an input layer, a hidden layer, and an output layer, each populated with various neurons. Neurons within the same layer have no signal transmission process, as they are not interconnected. Conversely, neurons in distinct layers are fully connected, implying each neuron in one layer is interconnected to every neuron in the adjacent layer. The network training is achieved by adjusting the weights in accordance with a predefined threshold through a self-learning process. In the present work, the BPANN was developed with four input parameters, each of which were defined as follows:
  • Nanoclay (wt.%): Nanoclay was integrated within the composite in varying weight percentages to study its influence on the wear and frictional properties of the composite. The chosen weight percentages ranged between 1% and 3%.
  • Sliding Velocity (m/s): The sliding velocity refers to the relative speed at which the wear test sample moves against the counterface under controlled conditions. The sliding velocities selected for the study were 1.0, 1.5, and 2.0 m/s.
  • Load (N): This parameter represents the normal load applied on the sample during the wear testing process. The values of the load applied in this study were 10, 20, and 30 Newton.
  • Sliding Distance (m): The sliding distance corresponds to the total distance covered by the sample under the applied load and specific velocity during the wear test. For this study, the distances were 500, 750, and 1000 m.
The BPANN aimed to predict two output parameters: Wear Rate (mg/min) and Frictional Force (N). The training involved a single hidden layer of 27 neurons using normalized input values. The network configuration was structured as 4-27-2, encompassing 4 input neurons, 27 hidden neurons, and 2 output neurons. Nine patterns were utilized for both training and testing. The logarithmic sigmoid (logsig) function served as the transfer function. The training concluded after 8000 epochs, reaching a sum of squared error (SSE) of 0.0008. The learning factor (η) and momentum factor (α) were set at 0.6 and 1, respectively. The configuration of our neural network is depicted in Figure 2.

2.5. Characterization Studies

The characterization of the nanoclay-filled FormuLITETM amine-cured bio-based epoxy composites was carried out through scanning electron microscopy (SEM), energy-dispersive X-ray spectroscopy (EDS), and atomic force microscopy (AFM) to assess the nanoclay dispersion, elemental composition, and surface topography of the nanoclay-filled FormuLITETM amine-cured bio-based epoxy composites. The SEM analysis was performed to understand the nanoclay dispersion and its effects on the nanoclay-filled FormuLITETM amine-cured bio-based epoxy composites’ structure and properties; EDS analysis was conducted to determine the nanoclay-filled FormuLITETM amine-cured bio-based epoxy composites’ elemental (carbon and silicon) composition, and AFM, a high-resolution imaging technique, was employed to analyze the surface morphology and topography of the nanoclay-filled FormuLITETM amine-cured bio-based epoxy composites. SEM and EDS analysis were carried out using an EVO MA18 scanning electron microscope with Oxford EDS and with Minimum 1× and maximum 100,000× magnification capability, and the AFM was carried out using an Innova SPM Atomic Force Microscope with a scanning ability of 100.

3. Results and Discussions

As shown in Table 2, the selected array was the L9 (34), with nine rows corresponding to the number of tests (eight degrees of freedom) and four columns at three levels. Each of these columns (labeled A, B, C, D) represent the four parameters we selected for this study: Nanoclay (wt.%), Sliding Velocity (m/s), Load (N), and Sliding Distance (m), respectively. The values in these columns indicate the respective levels at which each test was conducted. Following this, the “Wear (mg/m)” and “Frictional Force (N)” columns provide the experimental results for each combination of parameters.

3.1. Statistical Analysis of Parameters Affecting Wear

In the conducted experiment, the wear of the material was measured under varying conditions of nanoclay weight percentage (A), sliding velocity (B), load (C), and sliding distance (D). The main effect plots, depicted in Figure 3, for the signal-to-noise ratios (S/N ratios) indicate that the highest S/N ratios were observed at the third level of nanoclay (A3), the first level of sliding velocity (B1), the third level of load (C3), and the first level of sliding distance (D1) when following the “smaller is better” criterion.
The analysis of variance (ANOVA) results, shown in Table 3, revealed that nanoclay weight percentage (A) was the most significant factor affecting the wear as it contributed 90.46% to the total variability, with a high F-value of 750 and a p-value of 0.000, which indicates statistical significance.
Sliding velocity (B) contributed 7.93% to the total variability and showed statistical significance with a p-value of 0.001. Sliding distance (D) accounted for 1.13% of the variability and was significant at 0.05, with a p-value of 0.037. In contrast, the load (C) did not significantly affect the wear, as it contributed 0% to the total variability and had a p-value of 1. The regression equation obtained for the wear is given in Equation (2).
W e a r = 0.007728 0.002083   A + 0.001233   B + 0.000000   C + 0.000001   D
The regression model developed in this study demonstrated a high degree of fit to the experimental data, as indicated by the R-squared value of 99.52%. The adjusted R-squared value of 99.04% and the predicted R-squared value of 95.88% further support the model’s reliability. The adjusted R-squared considers the number of predictors in the model, giving a more accurate measure of the model’s performance. The predicted R-squared shows how well the model will predict new observations. These high values indicate the model’s robustness in predicting wear under various conditions. However, the complex nature of wear behavior, possibly involving interactions between factors, requires further investigation. Despite the model’s strong predictive ability, these unexplored interactions might be critical to fully understanding and optimizing the wear behavior of the nanoclay-filled FormuLITETM amine-cured bio-based epoxy composites, and can thus be considered as a future scope of the presented work.
The experiment results provide critical insights into the wear behavior of nanoclay-filled FormuLITETM amine-cured bio-based epoxy composites under different operating conditions. The factors considered, including nanoclay weight percentage (A), sliding velocity (B), load (C), and sliding distance (D), were found to influence the wear rate of the nanoclay-filled FormuLITETM amine-cured bio-based epoxy composites to varying extents. Nanoclay weight percentage (A) emerged as the most significant factor influencing the wear. This is likely due to its direct effect on the nanoclay-filled FormuLITETM amine-cured bio-based epoxy composites’ atomic structure. As the nanoclay weight percentage increases, the dispersion of the nanoclay particles within the matrix improves, which in turn increases the hardness and stiffness of the nanoclay-filled FormuLITETM amine-cured bio-based epoxy composites, leading to decreased wear. This trend was corroborated by the negative coefficient of factor A in the regression equation. The sliding velocity (B) and load (C) dictate the macro-level wear behavior. Higher sliding velocities can intensify the wear conditions, leading to increased wear rates. This is evidenced by the positive coefficient of factor B in the regression equation. Similarly, the increased load can cause macroscopic plastic deformation, increasing the wear rates. Despite its substantial influence, this factor was found to have a lower impact on the wear than the others.

3.2. Statistical Analysis of Parameters Affecting Frictional Force

In the context of the frictional force exerted during the pin-on-disc testing of nanoclay-filled FormuLITETM amine-cured bio-based epoxy composites, the primary factors that were considered again include the nanoclay weight percentage (A), sliding velocity (B), load (C), and sliding distance (D). Each of these parameters was found to impact the frictional force differently. Based on the main effect plots, illustrated in Figure 4, for the signal-to-noise ratios (S/N ratios), when adhering to the “smaller is better” criterion, the highest S/N ratios were observed at the first level of nanoclay (A1), the second level of sliding velocity (B2), the first level of load (C1), and the first level of sliding distance (D1).
The most significant factor affecting the frictional force was the nanoclay weight percentage (A). As seen from the ANOVA results in Table 4, this factor contributed to approximately 93.99% of the total variation. The reason for this can be traced back to the microstructure of the nanoclay-filled FormuLITETM amine-cured bio-based epoxy composites. An increase in the nanoclay weight percentage improves the hardness and stiffness of the nanoclay-filled FormuLITETM amine-cured bio-based epoxy composites, leading to higher frictional forces. The positive coefficient of factor A in the regression equation further substantiates this observation. The load (C) also significantly contributed to 4.59% of the total variation in the frictional force. A greater load can intensify the contact stress, which can, in turn, elevate the frictional force.
Interestingly, the sliding velocity (B) and sliding distance (D) were found to have a relatively smaller impact on the frictional force, contributing to 0.00% and 0.15% of the total variation, respectively. The nanoclay-filled FormuLITETM amine-cured bio-based epoxy composites exhibited the highest frictional force at 1 wt.% nanoclay, 2 m/s sliding velocity, 30 N load, and 1000 m sliding distance. This can be ascribed to the high load and sliding velocity, which tend to increase the frictional force. On the contrary, the lowest frictional force was observed at 3 wt.% nanoclay, 1 m/s sliding velocity, 10 N load, and 500 m sliding distance, which can be attributed to the relatively lower load and sliding velocity.
In this study, a regression model was developed, given in Equation (3), to predict the frictional force under different conditions. The R-squared value of 98.73%, adjusted R-squared value of 97.46%, and predicted R-squared value of 95.86% indicate that the model offers an excellent fit to the experimental data.
F r i c t i o n a l   f o r c e = 12.74 + 7.555 A 0.027 B + 0.1670 C + 0.00119 D
The high R-squared values confirm that the model explains most of the variability in the response variable. The adjusted R-squared value considers the number of predictors in the model and offers a more realistic measure of the model’s performance. The predicted R-squared value estimates how well the model is likely to predict new observations. The model demonstrates robustness in predicting the frictional force based on the factors considered. However, friction is a complex phenomenon and can also be influenced by other factors not included in the model, such as the material properties and environmental conditions. Future studies could consider these additional factors to enhance the understanding of the frictional behavior of the nanoclay-filled FormuLITETM amine-cured bio-based epoxy composites.

3.3. BPANN Validation

Table 5 provides the data concerning the observations of the output response for the present study, and Table 6 provides the results of the BPANN validation, along with the experimental data for the 27 planned trials.
During the BPANN training process, we started with randomly initialized weights and biases. In the 8000 epochs, the inputs to the network ranged from the minimum to the maximum of each input parameter, normalized to fit within the range of 0 and 1. For example, the nanoclay weight percentage ranged between 1% and 3%, which was normalized to between 0 and 1 for the network training.
The BPANN model accurately predicted the wear rate and frictional force based on the given input parameters, as evidenced by the low sum of squared error (SSE) obtained after 8000 epochs of training. The experimental data and predicted results showcase the model’s robustness and capability to predict the wear and frictional force across varying conditions accurately. For instance, the predicted wear for 1 wt.% nanoclay, 1 m/s sliding velocity, 10 N load, and 500 m sliding distance was 0.0071 mg/min, and the frictional force was 23.25 N, which aligns closely with the experimental values of 0.0062 mg/min for wear and 22.99 N for frictional force. However, further optimization of the model is still possible.
Enhancements to the model’s predictive capability could be achieved by tuning the number of hidden layers and neurons, the transfer function, and the learning and momentum factors. This study highlights the efficacy of BPANN in predicting wear and frictional force under various conditions. Future studies could explore the versatility and applicability of this model by testing it with different materials and under different environmental conditions.

3.4. Characterization Results

Scanning Electron Microscopy (SEM) and Energy-Dispersive X-ray Spectroscopy (EDS) analyses were performed on the nanoclay-filled FormuLITETM amine-cured bio-based epoxy composite samples to study the dispersion and integration of nanoclay within the matrix and its implications on the overall properties of the composite material. The SEM analysis provided high-resolution images of the samples, revealing a uniform dispersion of the nanoclay within the FormuliteTM matrix (Figure 5). The even distribution indicates successful mixing during fabrication, which is crucial for the mechanical and physical properties of the composites. This uniform dispersion is advantageous as it promotes optimal load transfer and stress distribution within the composite, enhancing the mechanical properties.
The EDS analysis (Figure 6) further confirmed the even distribution of the nanoclay within the FormuliteTM matrix. The results indicated a uniform dispersion of silicon, the primary elements found in nanoclay, suggesting its successful incorporation into the matrix. The uniform dispersion not only verifies the SEM observations, but also further substantiates the role of the nanoclay in enhancing the mechanical properties of the nanoclay-filled FormuLITETM amine-cured bio-based epoxy composites.
Subsequently, Atomic Force Microscopy (AFM) was used to examine the surface morphology and topography of the composite material at the nanoscale level. The AFM results (Figure 7, Figure 8 and Figure 9) revealed that including nanoclay in the FormuliteTM resins increased the surface roughness and peak height. Interestingly, the highest peak height for the composite with 1% nanoclay was 842.5 nm. The average peak heights for the composites with 1%, 2%, and 3% nanoclay ranged between 647 nm and 1 µm, 257.8 and 436.6 nm, and 553.7 and 765.5 nm, respectively.
The observed increase in the surface roughness and peak height is attributed to the interaction between the nanoclay particles and the FormuliteTM matrix, forming surface protrusions and valleys. Interestingly, as the nanoclay percentage increased, the surface roughness and peak height decreased, possibly due to the saturation of the interaction between the nanoclay particles and the FormuLITETM matrix. In conclusion, the combination of SEM, EDS, and AFM provided critical insights into the uniform dispersion of nanoclay within the matrix and the changes in the surface topography due to nanoclay inclusion. The findings from these analyses align with the results obtained from the statistical and BPANN predictions, providing a holistic understanding of the role of nanoclay in influencing the wear and frictional properties of the FormuliteTM resins. This comprehensive characterization further underlines the promise of nanoclay-filled FormuLITETM amine-cured bio-based epoxy composites for various applications, including automotive, aerospace, and biomedical engineering, by enhancing its strength, stiffness, and toughness.

4. Conclusions

Based on the experimentation and statistical optimization, the following conclusions can be drawn.
  • This research systematically investigated the influence of four parameters—nanoclay (wt.%), sliding velocity (m/s), load (n), and sliding distance (m)—on both the wear rate (mg/min) and Frictional Force (N) in nanoclay-filled FormuLITETM amine-cured bio-based epoxy composites.
  • According to the Taguchi experimental design, the optimal conditions for minimal wear were found to be the third level of nanoclay (A3), the first level of sliding velocity (B1), the third level of load (C3), and the first level of sliding distance (D1). In contrast, for minimizing the frictional force, the highest signal-to-noise ratios were found at the first level of nanoclay (A1), the second level of sliding velocity (B2), the first level of load (C1), and the first level of sliding distance (D1).
  • The predictions from the Back-propagation Artificial Neural Network (BPANN) model were closely aligned with the experimental results, demonstrating the efficacy of this model in predicting the behavior of such intricate systems.
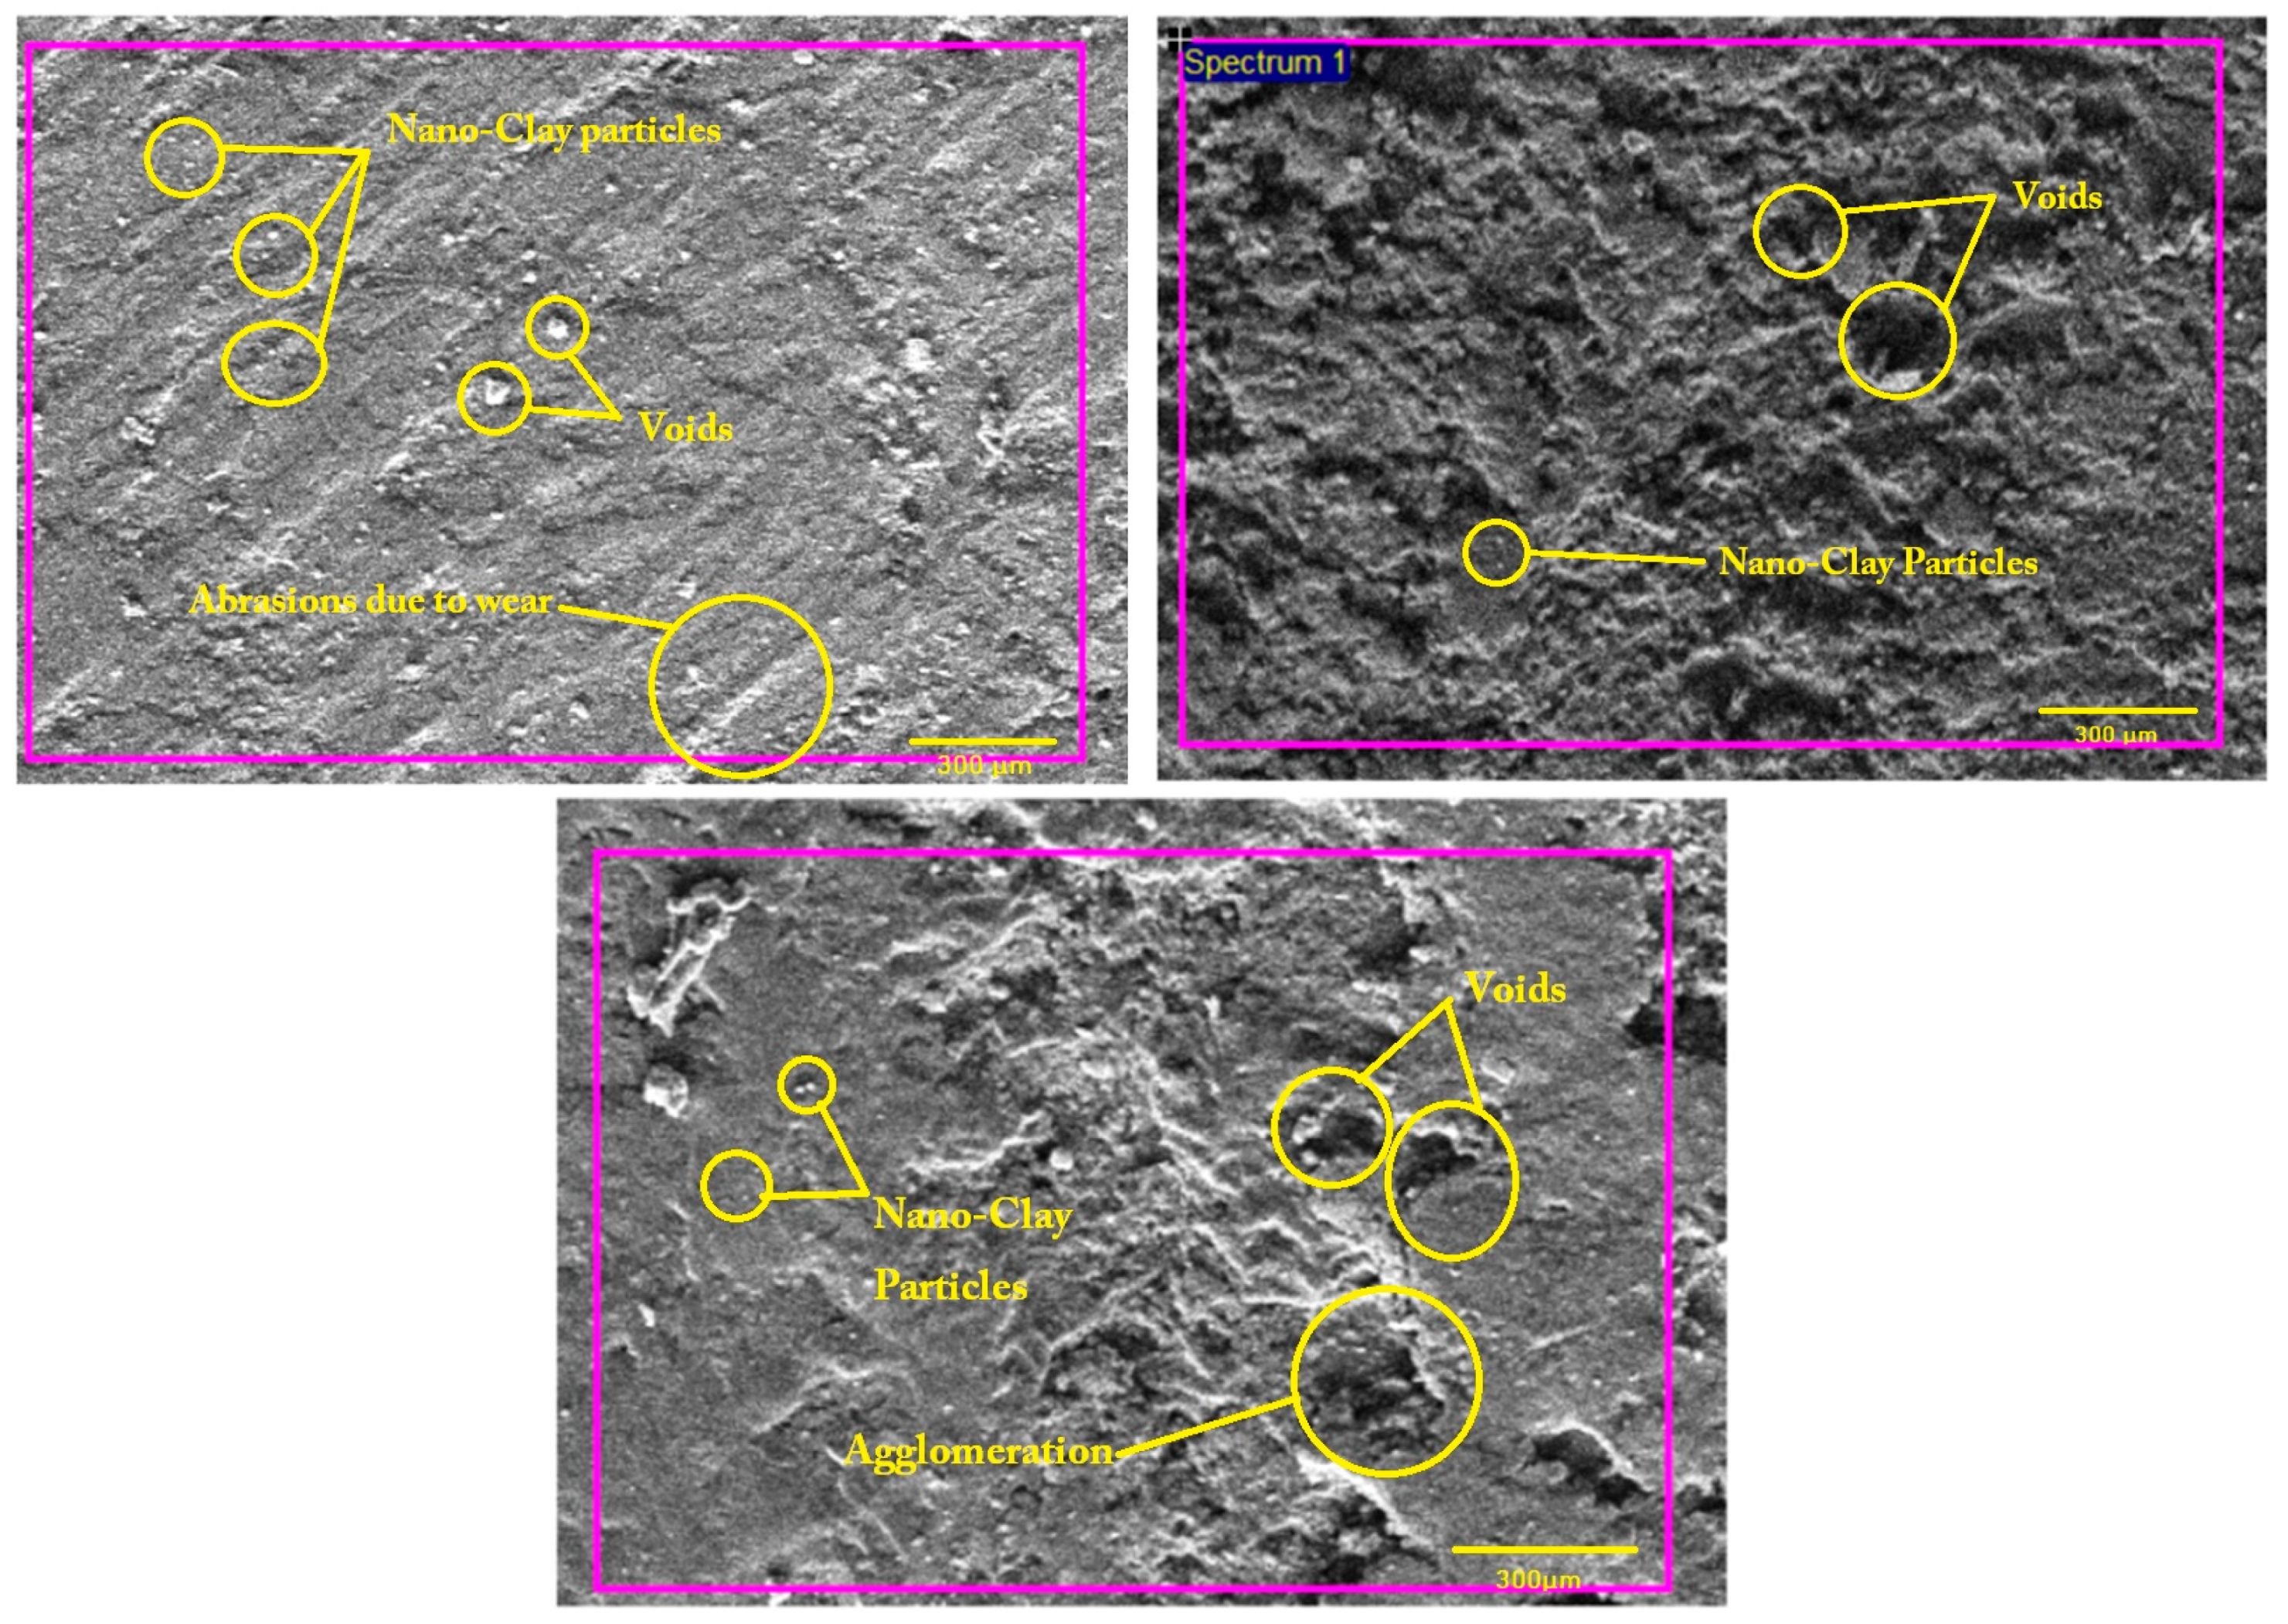
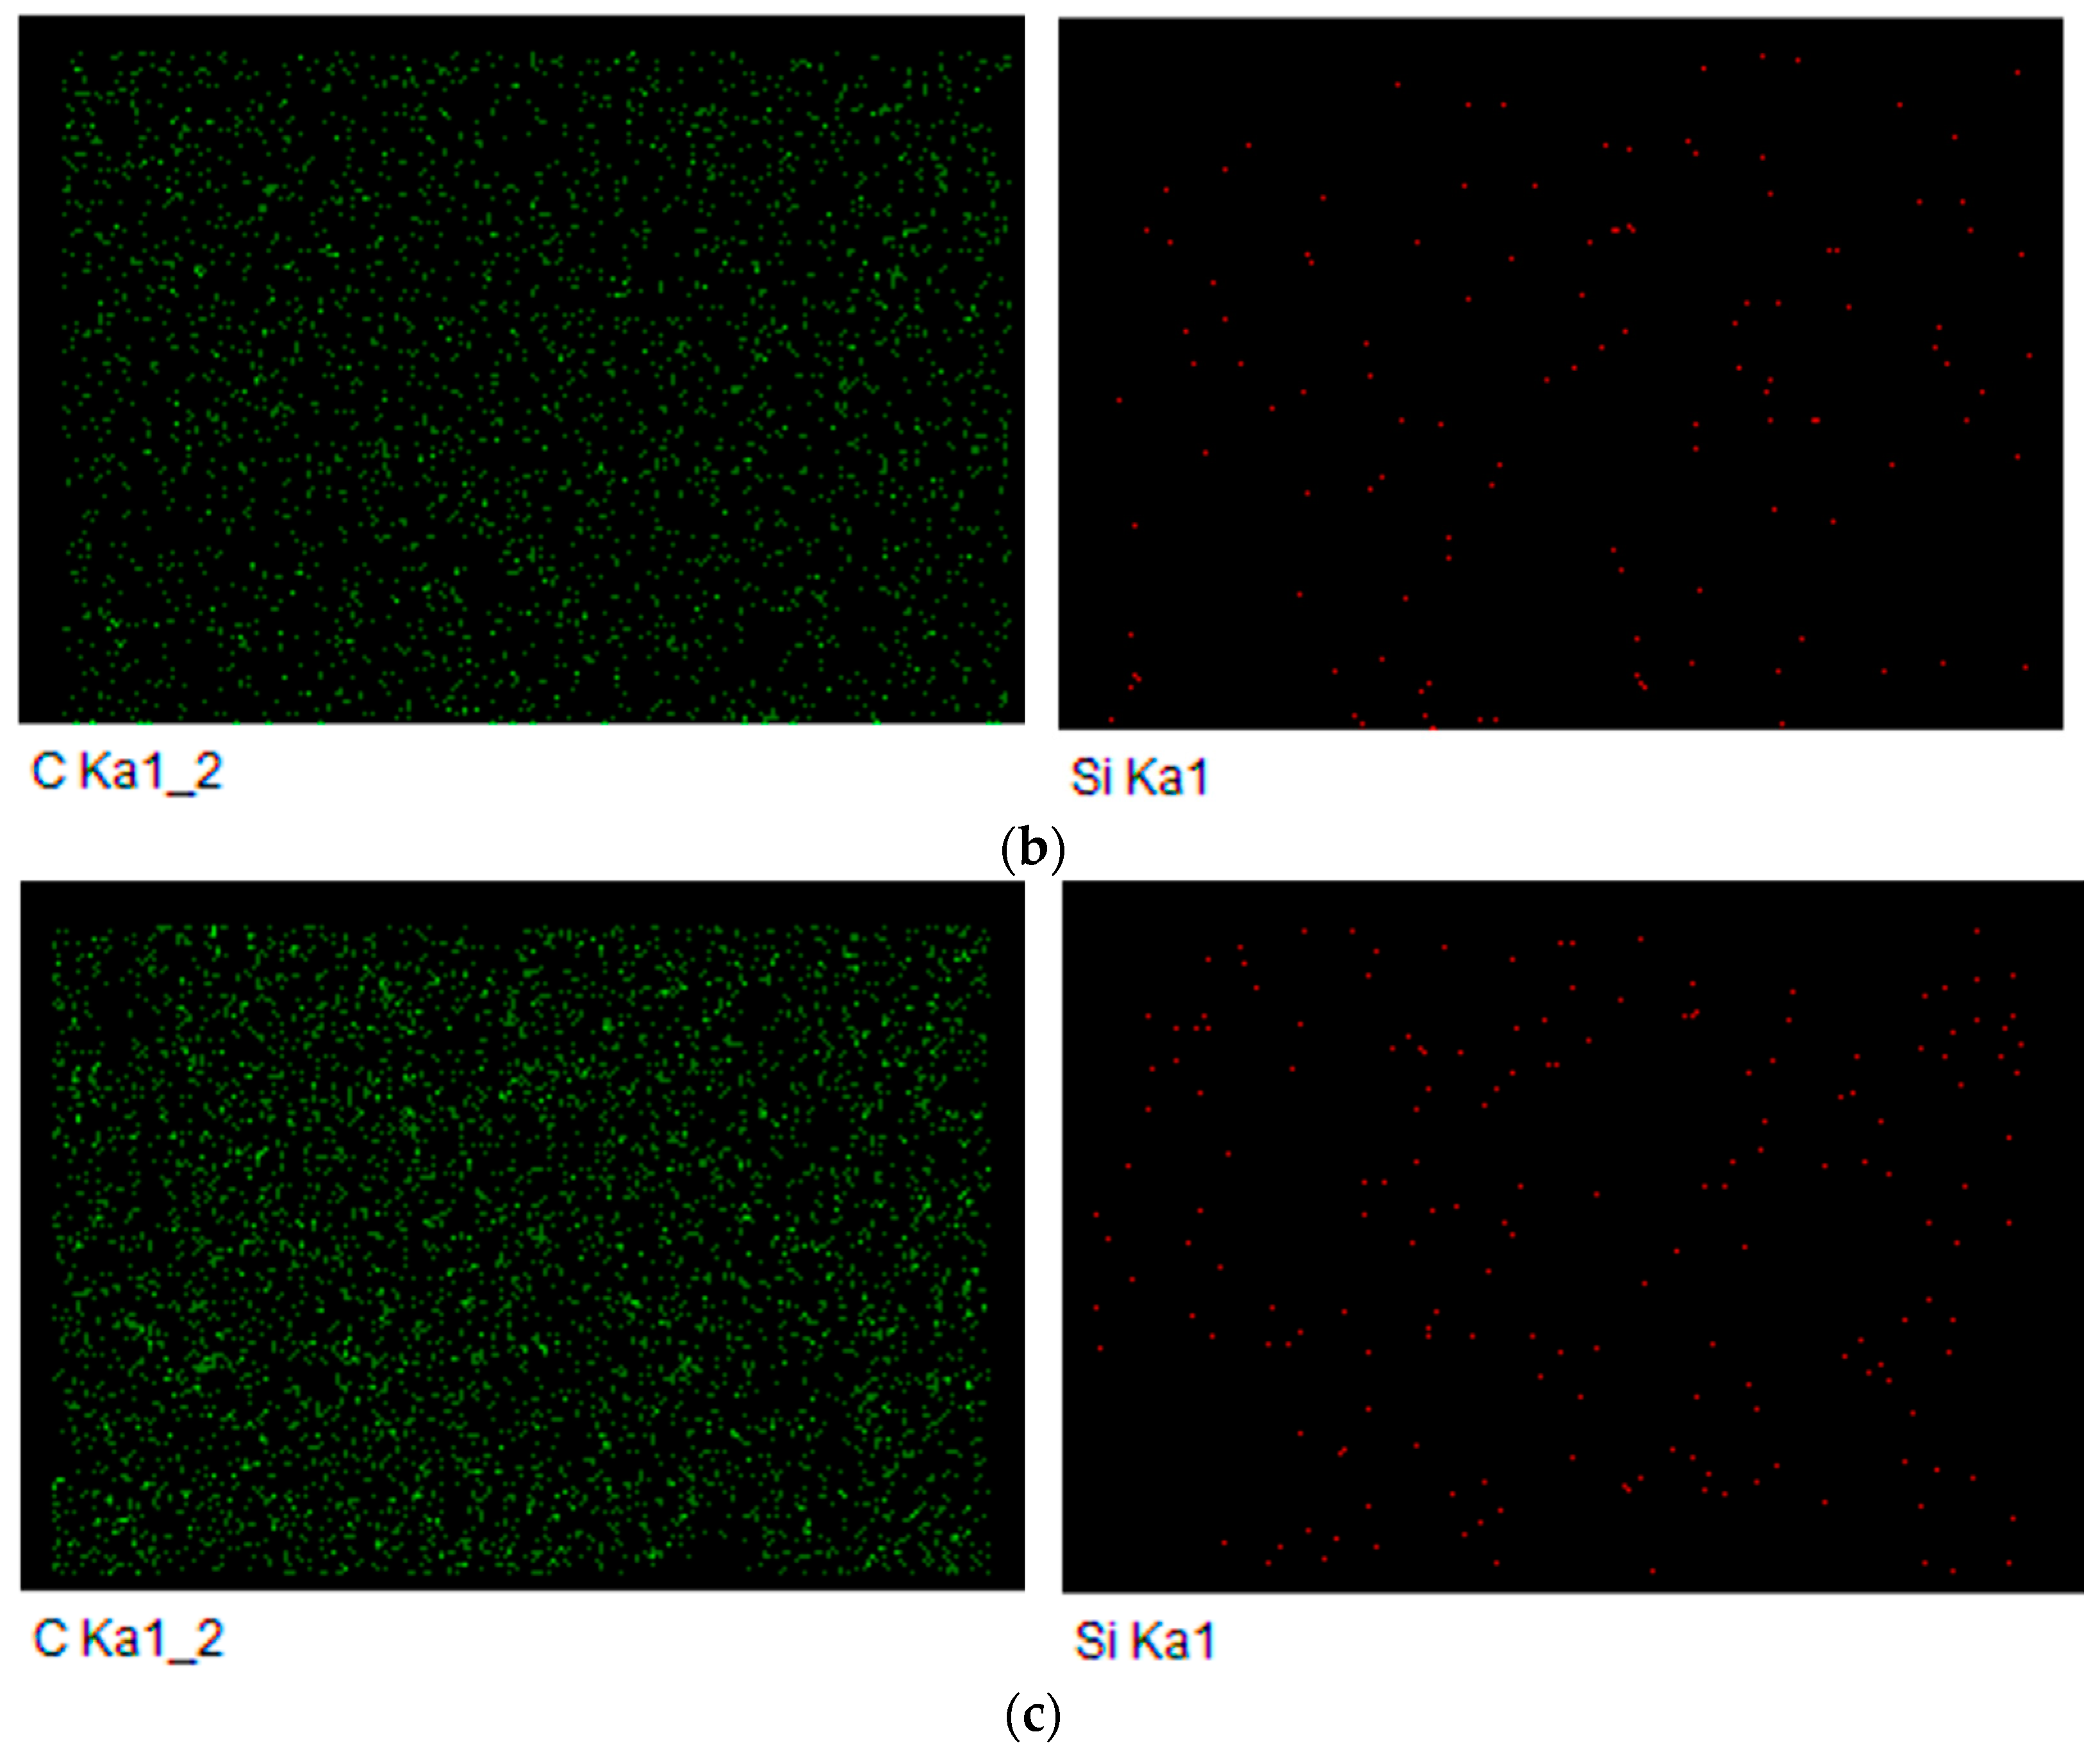
  • The SEM and EDS analyses provided valuable insights into the uniform dispersion of the nanoclay within the FormuLITETM matrix. This homogeneous distribution plays a significant role in improving the mechanical properties of the material by enhancing the load transfer and stress distribution.
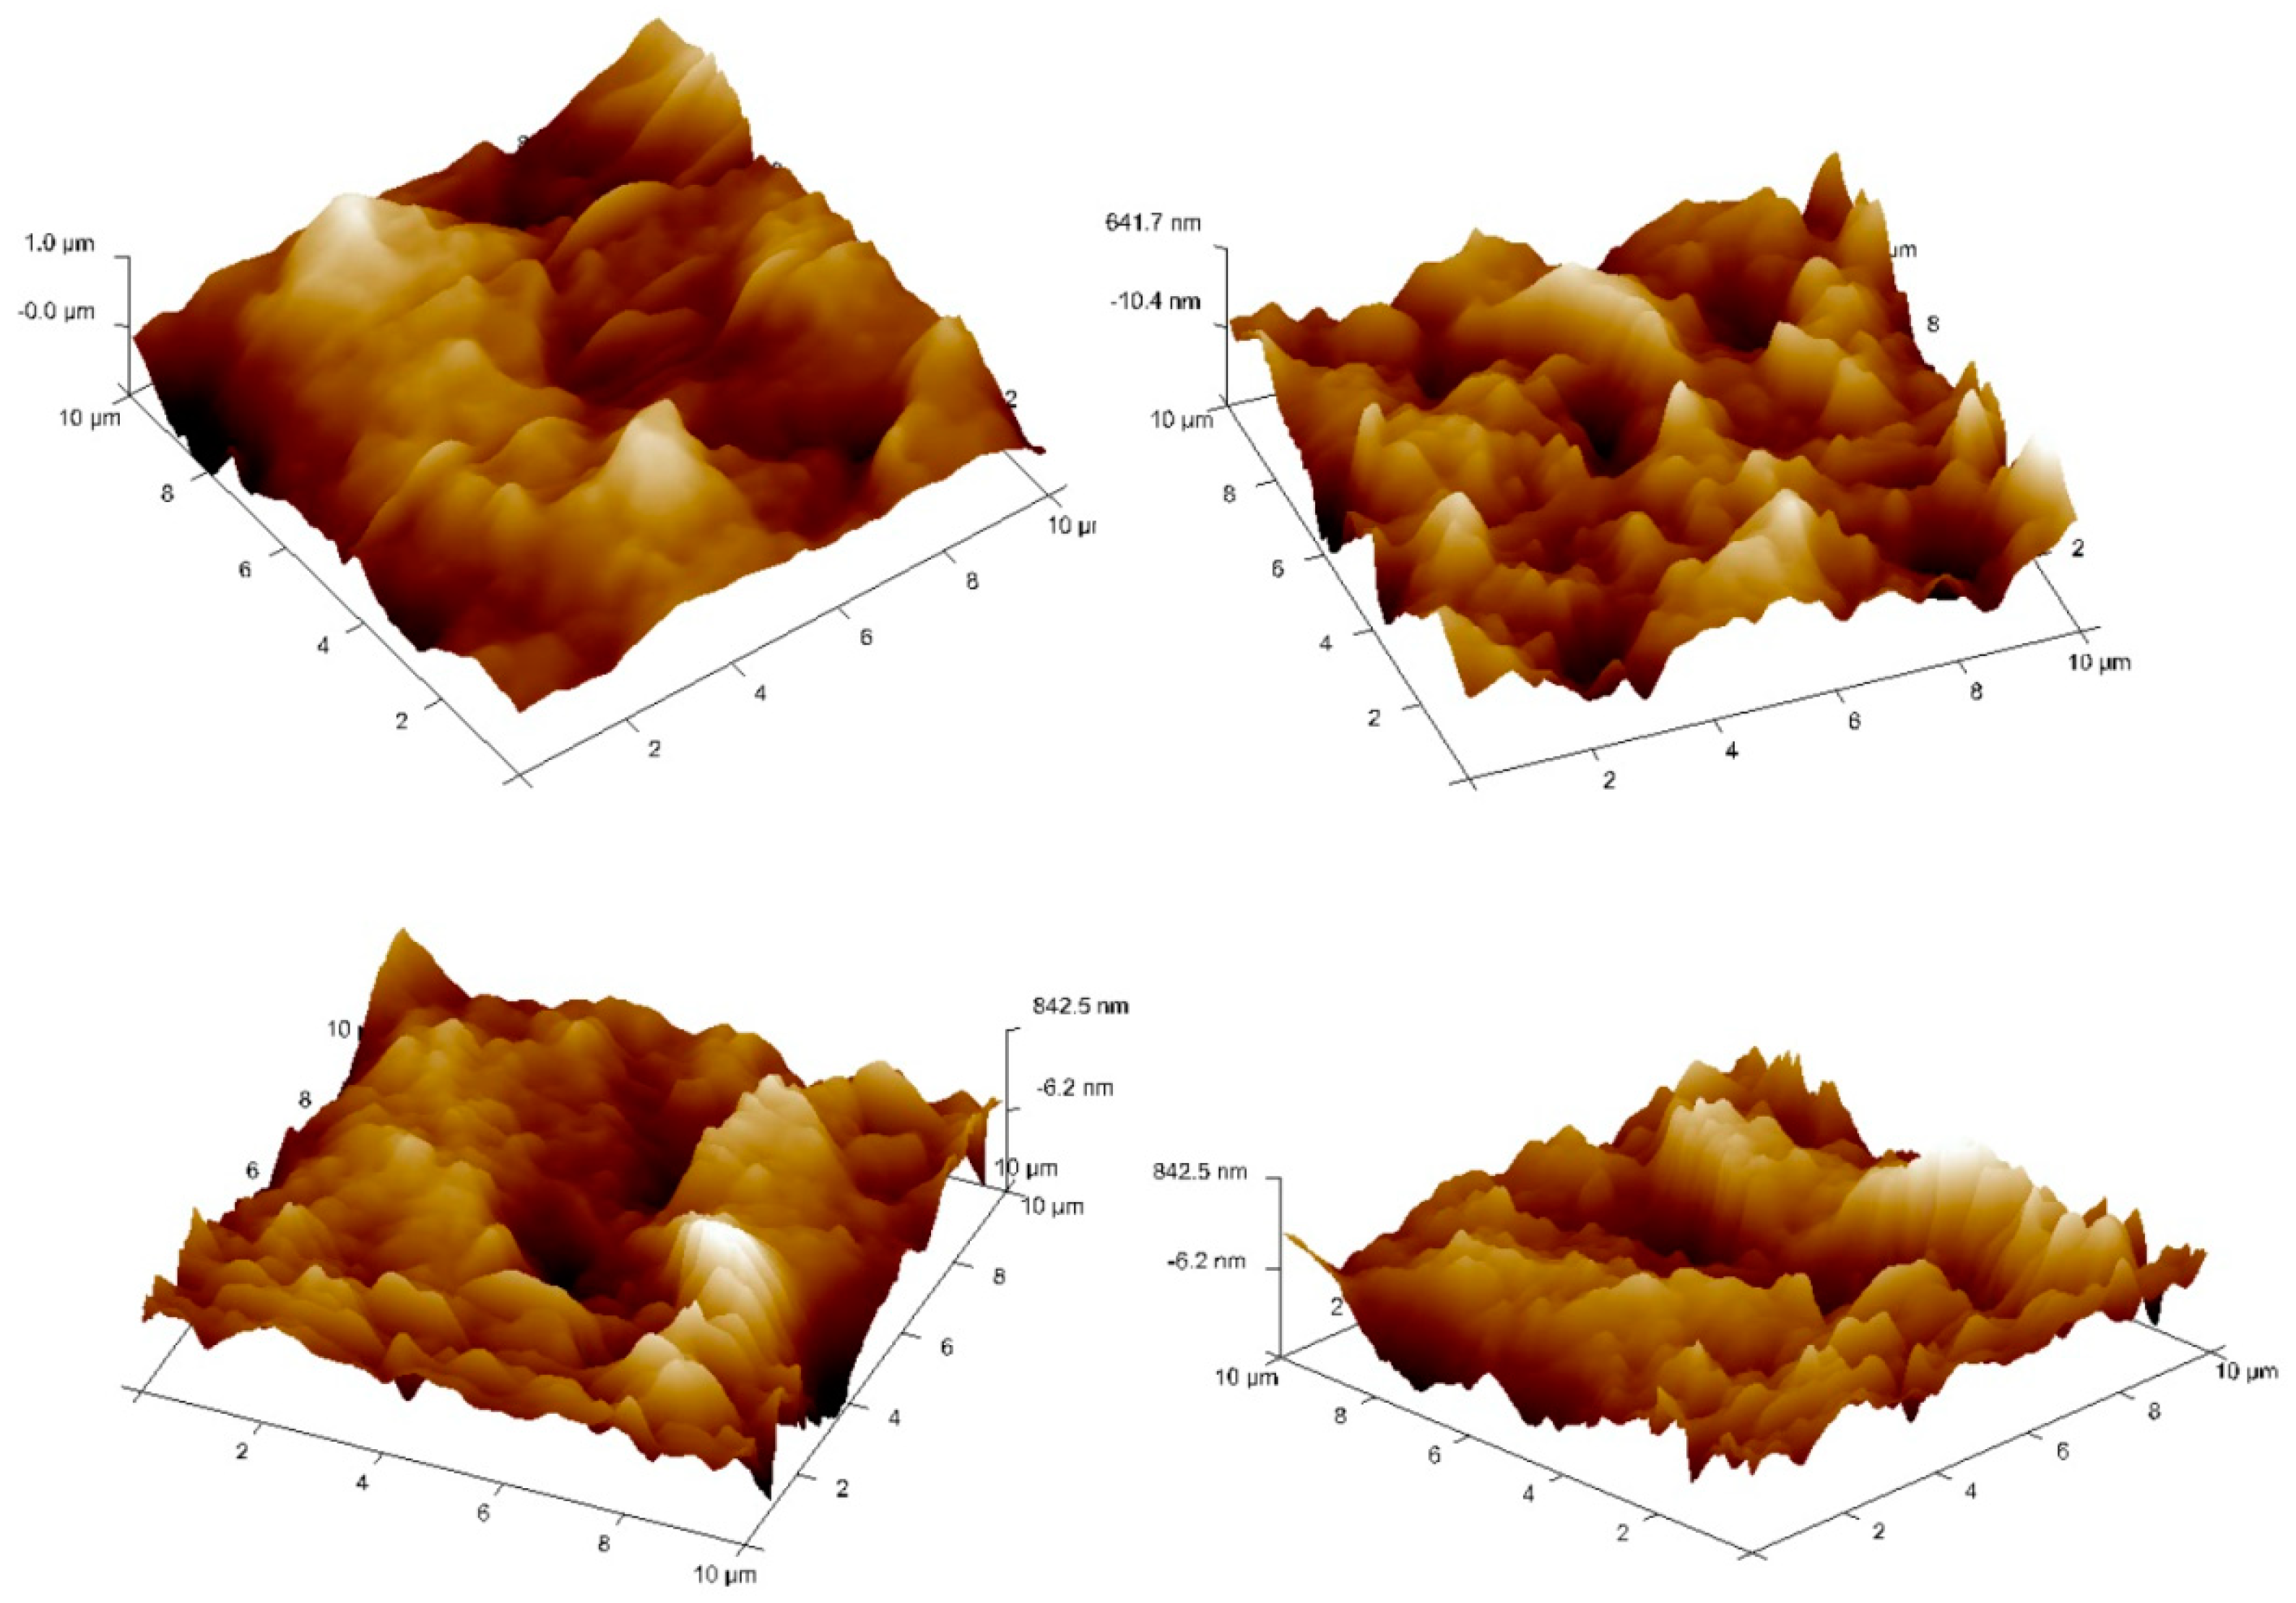
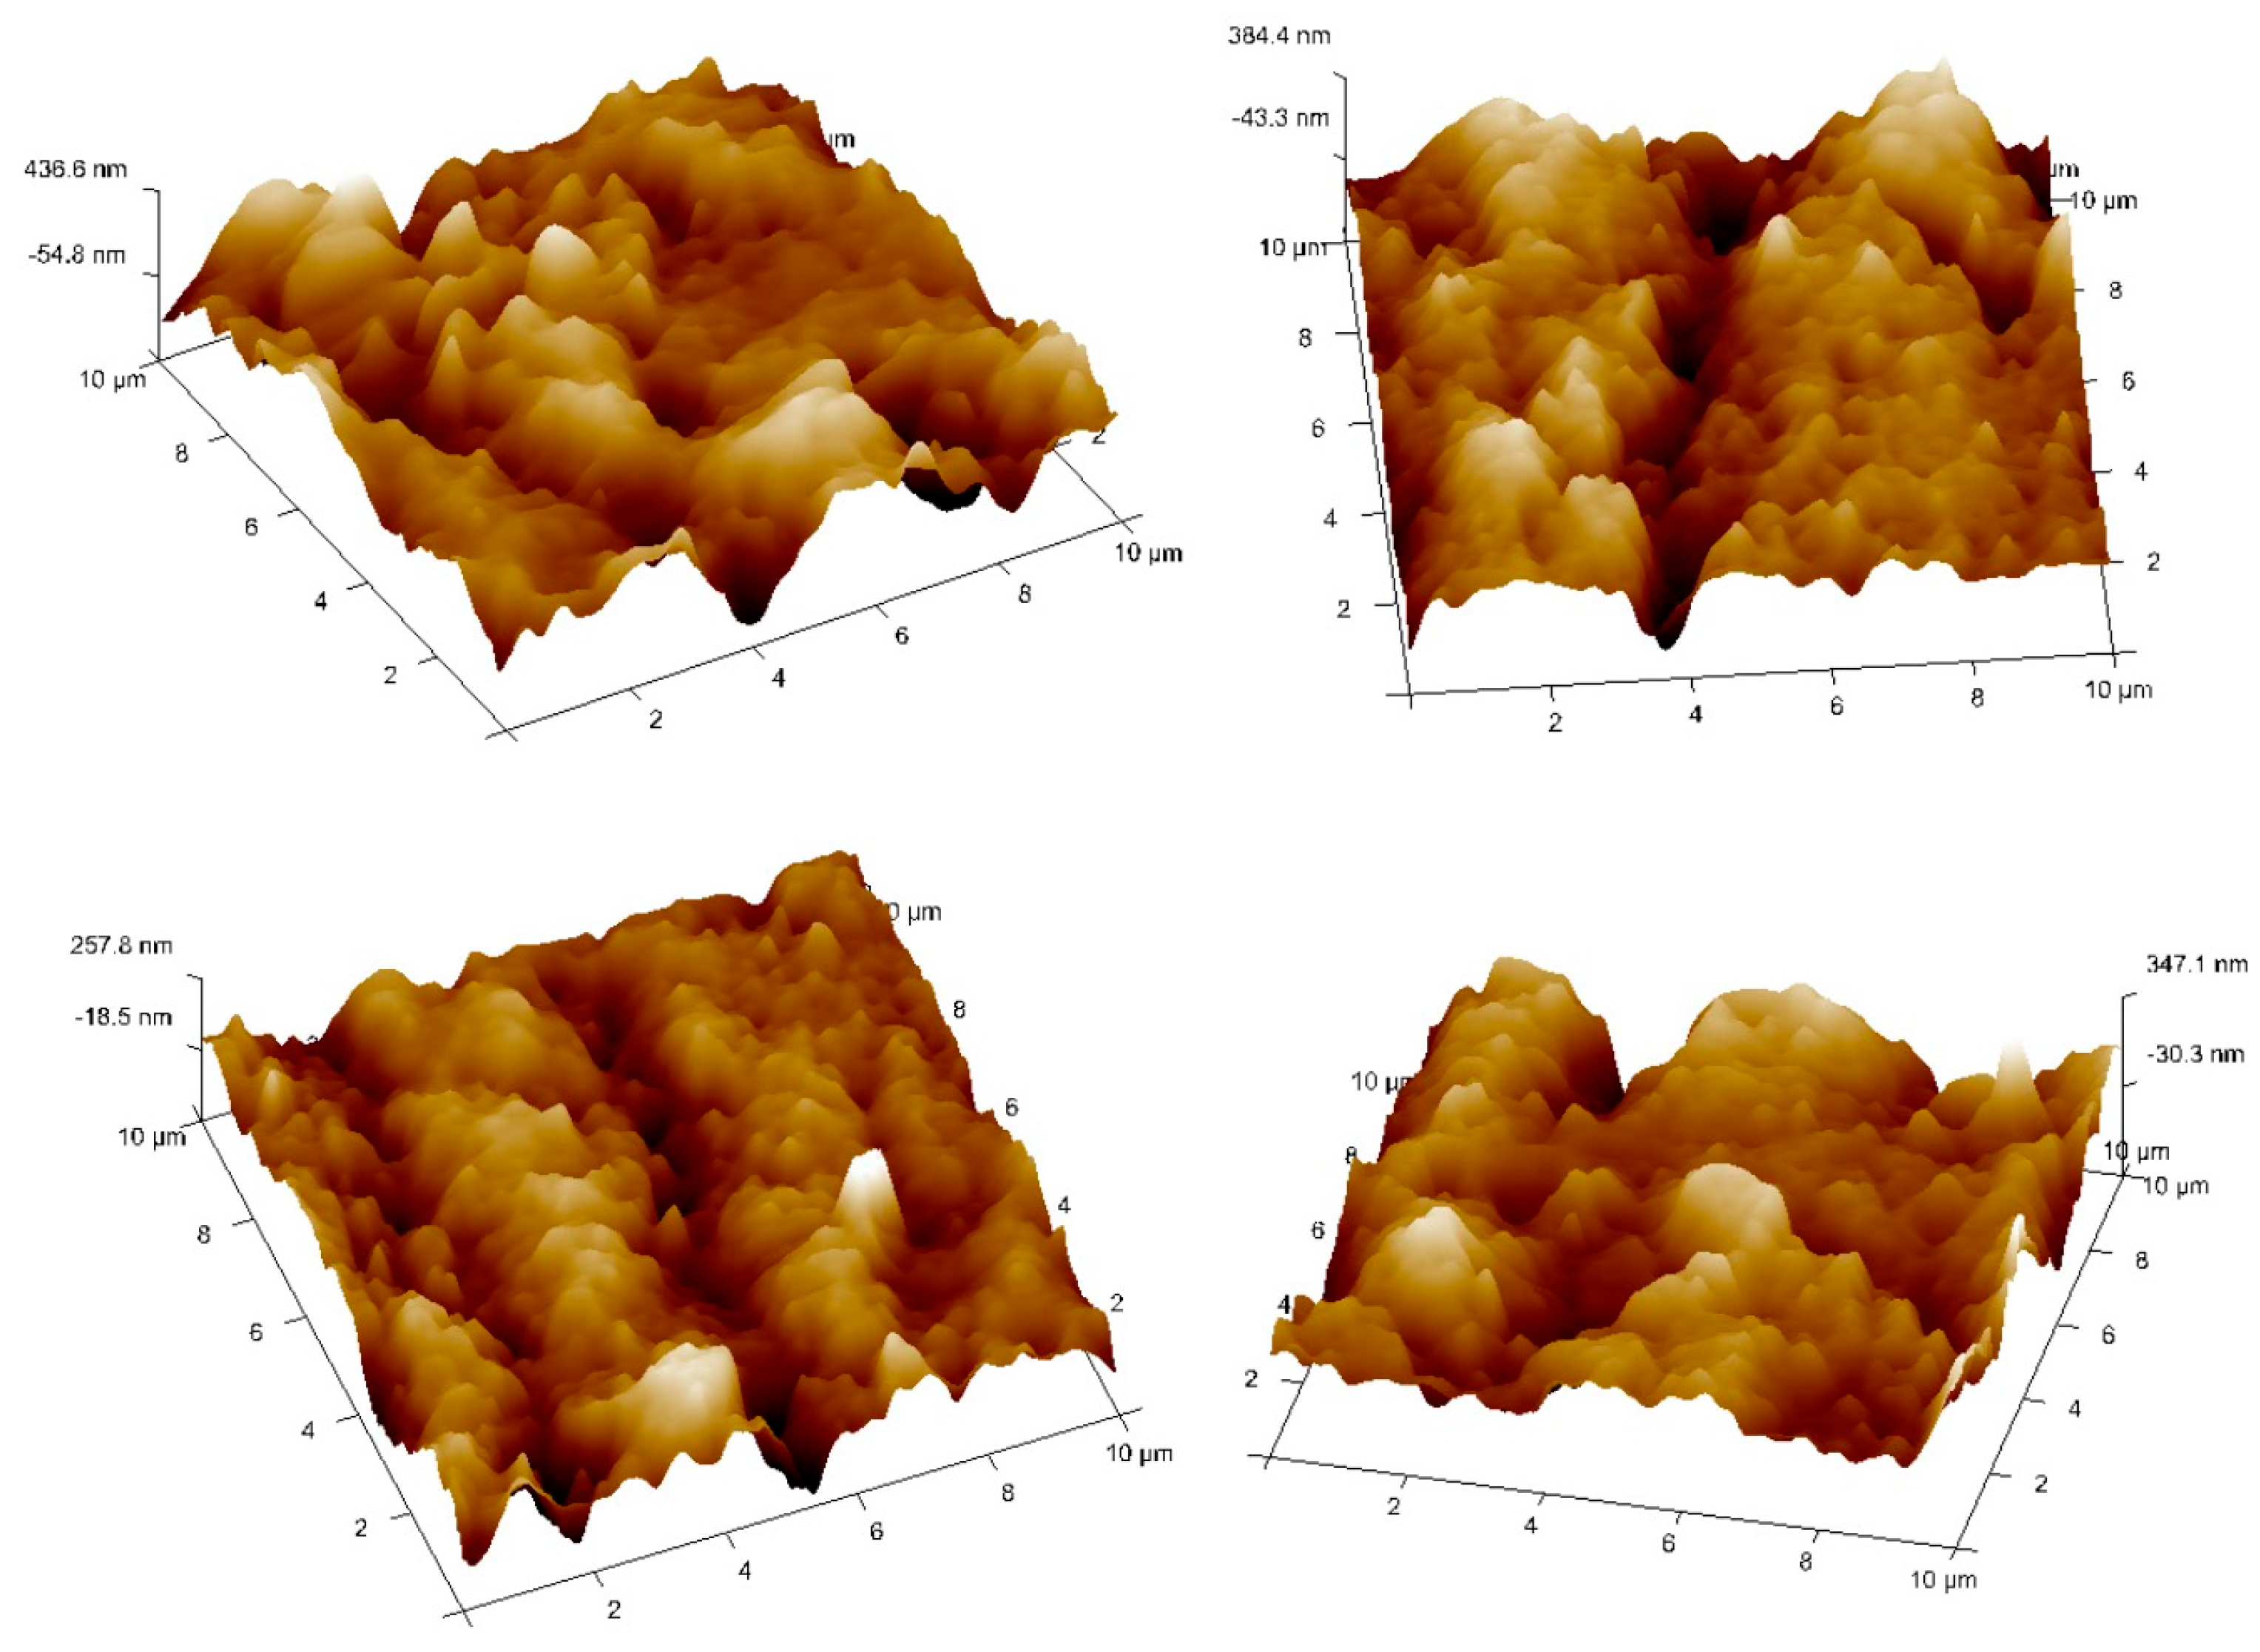
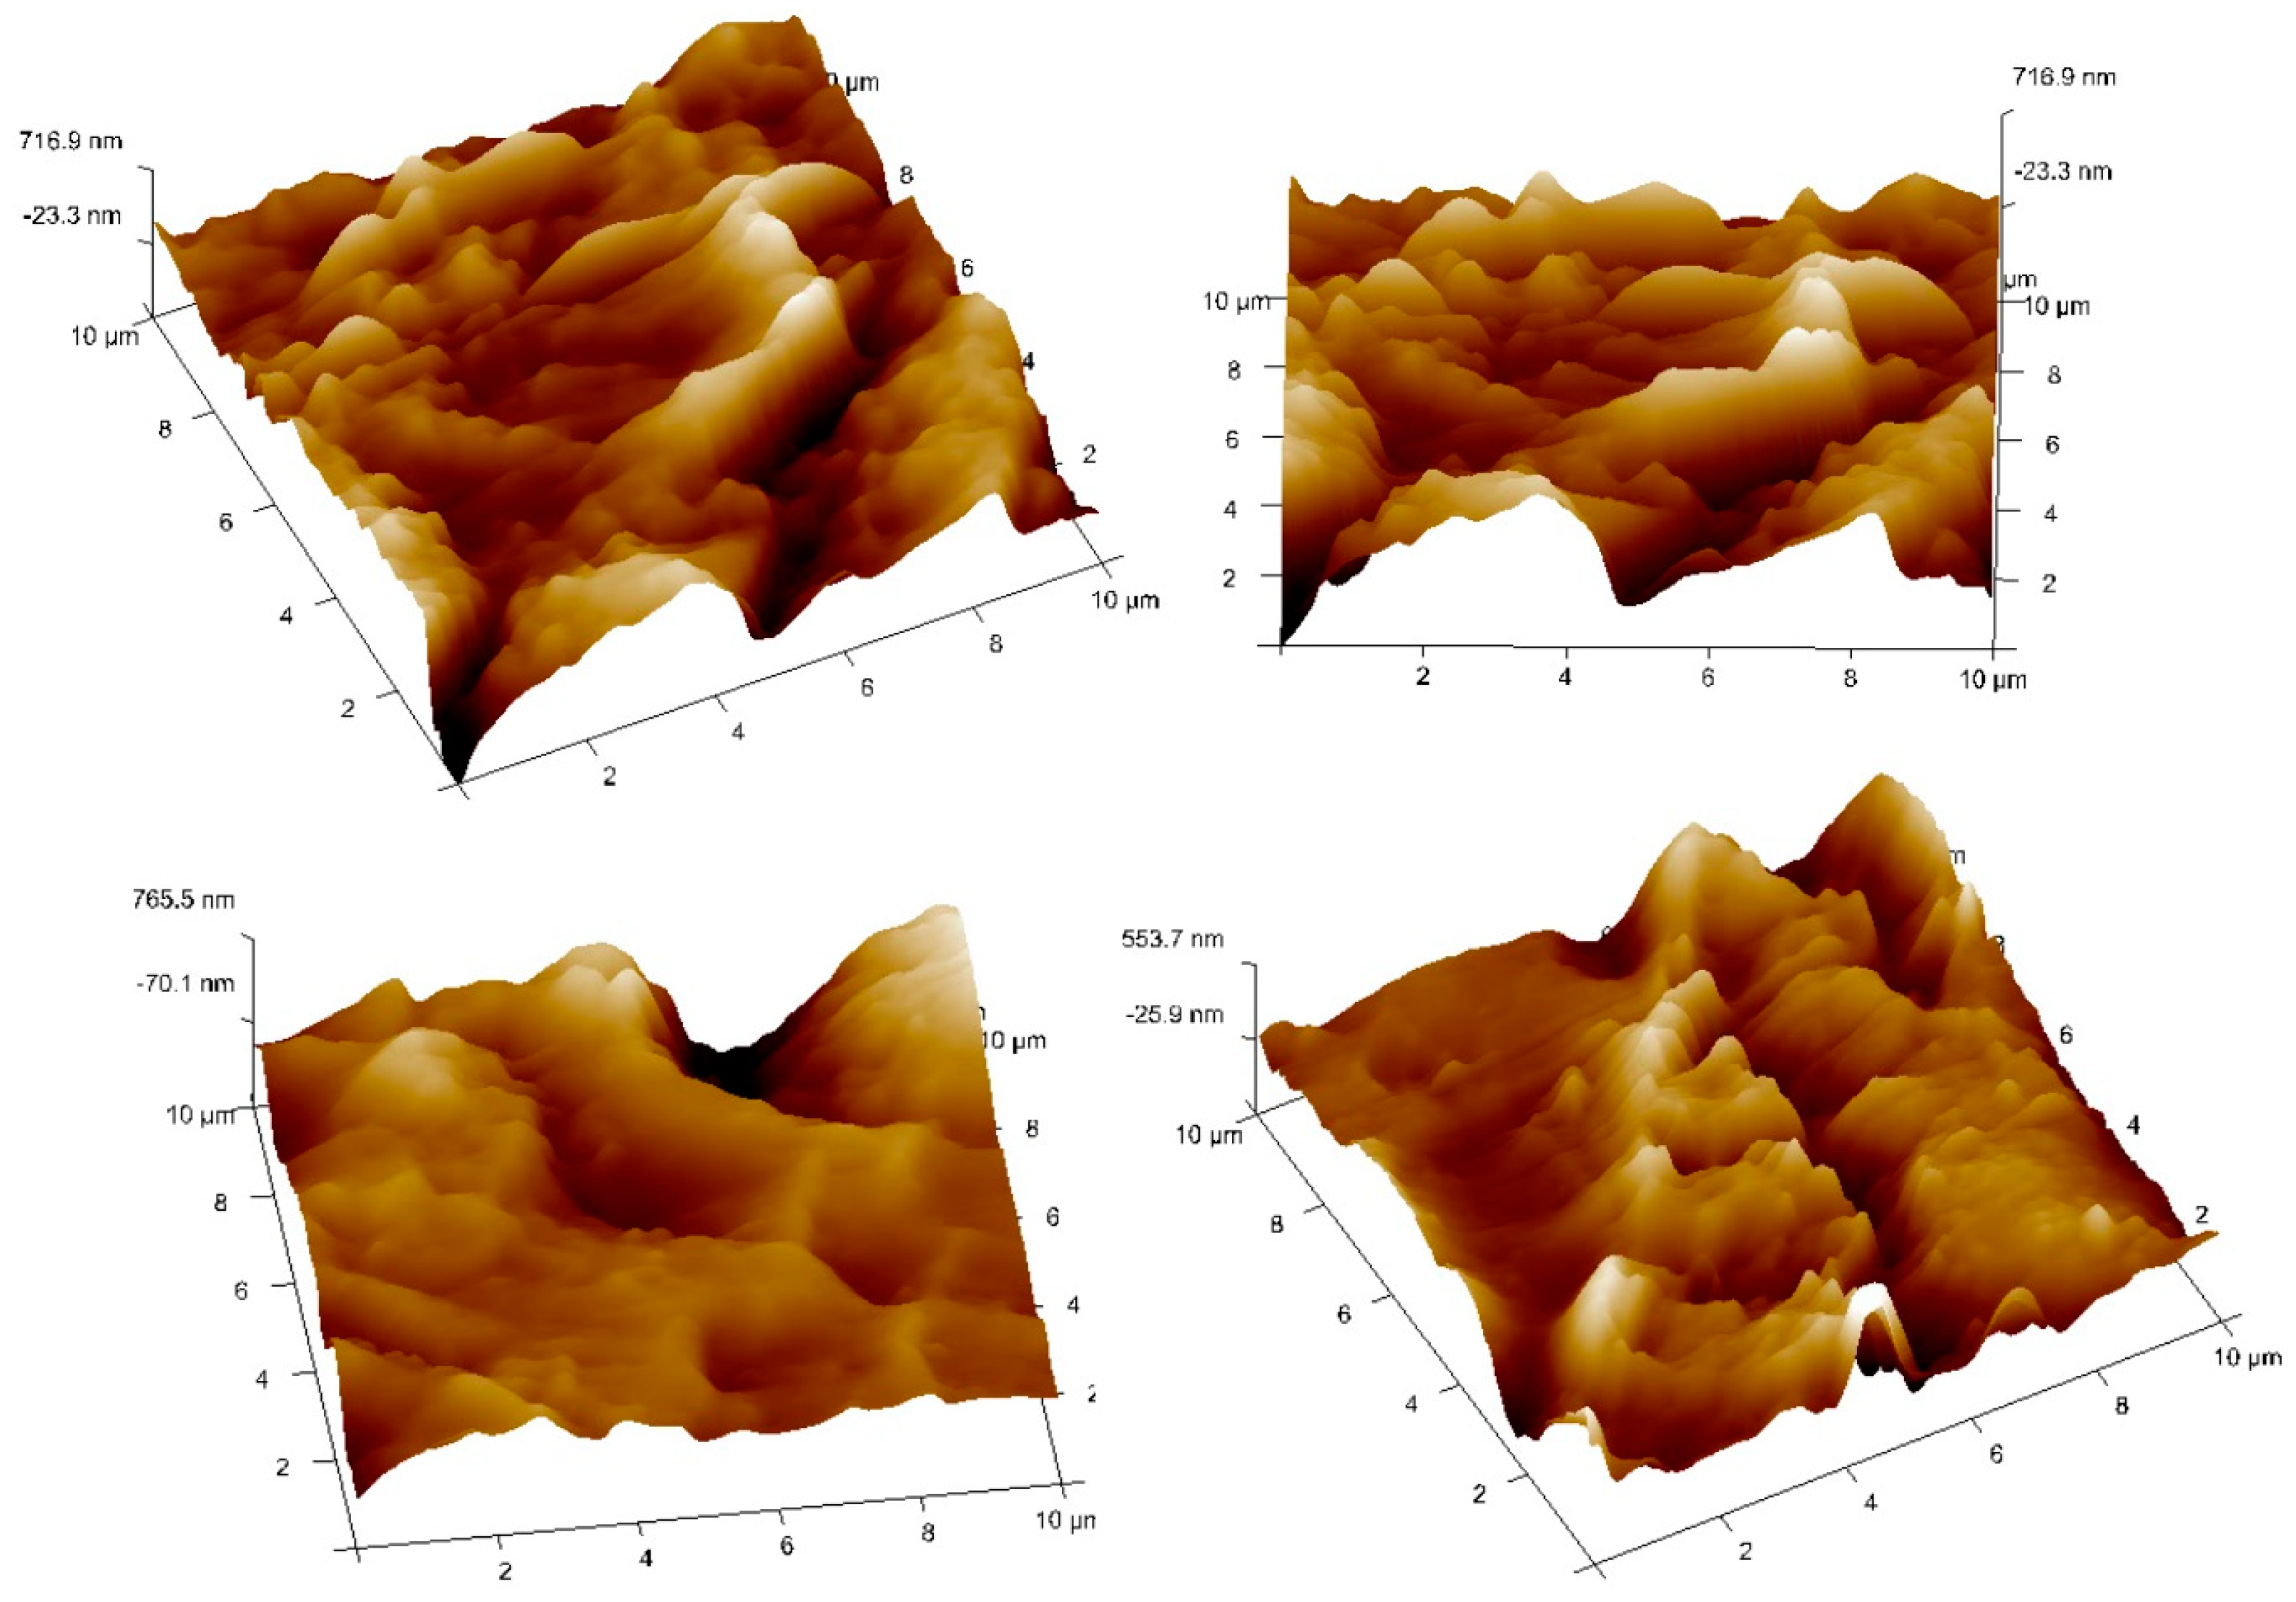
  • The AFM results revealed that the addition of nanoclay contributes to an increase in the surface roughness and peak height, both of which are critical factors in determining the material’s overall performance.
  • Interestingly, as the percentage of nanoclay increased, a decrease in the surface roughness and peak height was observed, indicating a possible saturation point in the interaction between the nanoclay particles and the FormuLITETM matrix.
  • The obtained results elucidate the potential of nanoclay-filled FormuLITETM amine-cured bio-based epoxy composites for diverse applications, such as in the automotive, aerospace, and biomedical engineering sectors, given their enhanced mechanical properties.
  • Further studies are suggested for more in-depth explorations of the potential modifications and a wider array of applications for nanoclay-filled FormuLITETM amine-cured bio-based epoxy composites.

Author Contributions

Conceptualization, N.N., B.S. and R.S.; Data curation, P.R.P. and A.L.H.; Formal analysis, N.N., R.B., R.S. and A.L.H.; Methodology, N.N., R.B., P.R.P. and A.L.H.; Resources, B.S. and P.R.P.; Software, R.B. and A.L.H.; Supervision, B.S. and R.S.; Writing—original draft, N.N.; Writing—review and editing, N.N., R.B., B.S. and R.S. All authors have read and agreed to the published version of the manuscript.

Funding

This research received no external funding.

Data Availability Statement

Not applicable.

Acknowledgments

The authors acknowledge Cardolite Specialty Chemicals India LLP, India, for providing the FormuLITETM amine-cured epoxy systems for experimentation in this study.

Conflicts of Interest

The authors declare no conflict of interest.

References

  1. Hsissou, R.; Seghiri, R.; Benzekri, Z.; Hilali, M.; Rafik, M.; Elharfi, A. Polymer composite materials: A comprehensive review. Compos. Struct. 2021, 262, 113640. [Google Scholar] [CrossRef]
  2. Mahesh, V.; Joladarashi, S.; Kulkarni, S.M. A comprehensive review on material selection for polymer matrix composites subjected to impact load. Def. Technol. 2021, 17, 257–277. [Google Scholar] [CrossRef]
  3. Wang, R.-M.; Zheng, S.-R.; Zheng, Y.-P. Matrix materials. In Polymer Matrix Composites and Technology; Elsevier: Amsterdam, The Netherlands, 2011; pp. 101–548. [Google Scholar] [CrossRef]
  4. Chang, I.Y.; Lees, J.K. Recent Development in Thermoplastic Composites: A Review of Matrix Systems and Processing Methods. J. Thermoplast. Compos. Mater. 1988, 1, 277–296. [Google Scholar] [CrossRef]
  5. Grove, S. Polymeric materials and processing—Plastics, elastomers and composites. Compos. Manuf. 1995, 6, 59. [Google Scholar] [CrossRef]
  6. Gibson, G. Epoxy Resins. In Brydson’s Plastics Materials, 7th ed.; Elsevier: Amsterdam, The Netherlands, 2017; pp. 773–797. [Google Scholar] [CrossRef]
  7. Moeckel, J. Epoxy Resins. In Kunststoffe, German Plastics, 80; Elsevier: Amsterdam, The Netherlands, 1990; pp. 59–70. [Google Scholar] [CrossRef]
  8. Greene, J.P. Thermoset Polymers. Automotive Plastics and Composites; Elsevier: Amsterdam, The Netherlands, 2021; pp. 175–190. [Google Scholar] [CrossRef]
  9. Komus, A.; Beley, N. Composite applications for ground transportation. In Comprehensive Composite Materials II; Elsevier: Amsterdam, The Netherlands, 2017; pp. 420–438. [Google Scholar] [CrossRef]
  10. Rad, E.R.; Vahabi, H.; de Anda, A.R.; Saeb, M.R.; Thomas, S. Bio-epoxy resins with inherent flame retardancy. Prog. Org. Coat. 2019, 135, 608–612. [Google Scholar] [CrossRef]
  11. Subie, A.; Mouritz, A.; Troynikov, O. Sustainable design and environmental impact of materials in sports products. Sports Technol. 2009, 2, 67–79. [Google Scholar] [CrossRef]
  12. Beck, A.J.; Hodzic, A.; Soutis, C.; Wilson, C.W. Influence of implementation of composite materials in civil aircraft industry on reduction of environmental pollution and greenhouse effect. IOP Conf. Ser. Mater. Sci. Eng. 2011, 26, 012015. [Google Scholar] [CrossRef]
  13. Rwawiire, S.; Tomkova, B.; Militky, J.; Jabbar, A.; Kale, B.M. Development of a biocomposite based on green epoxy polymer and natural cellulose fabric (bark cloth) for automotive instrument panel applications. Compos. Part B Eng. 2015, 81, 149–157. [Google Scholar] [CrossRef]
  14. Ma, Y.; Fu, S.; Gao, S.; Zhang, S.; Che, X.; Wang, Q.; Jiao, Z. Update on volatile organic compound (VOC) source profiles and ozone formation potential in synthetic resins industry in China. Environ. Pollut. 2021, 291, 118253. [Google Scholar] [CrossRef]
  15. Belote, S.N.; Blount, W.W. Optimizing High-Solids Polyester Resins for Low Voc Emission. Proc. Water-Borne High.-Solids Coat. Symp. 1981, 1, 33–50. [Google Scholar]
  16. Ramon, E.; Sguazzo, C.; Moreira, P.M.G.P. A review of recent research on bio-based epoxy systems for engineering applications and potentialities in the aviation sector. Aerospace 2018, 5, 110. [Google Scholar] [CrossRef]
  17. Baroncini, E.A.; Yadav, S.K.; Palmese, G.R.; Stanzione, J.F. Recent advances in bio-based epoxy resins and bio-based epoxy curing agents. J. Appl. Polym. Sci. 2016, 133, 44103. [Google Scholar] [CrossRef]
  18. Naik, N.; Sooriyaperakasam, N.; Abeykoon, Y.K.; Wijayarathna, Y.S.; Pranesh, G.; Roy, S.; Negi, R.; Aakif, B.K.; Kulatunga, A.; Kandasamy, J. Sustainable Green Composites: A Review of Mechanical Characterization, Morphological Studies, Chemical Treatments, and their Processing Methods. J. Comput. Mech. Manag. 2022, 1, 66–81. [Google Scholar] [CrossRef]
  19. Mauck, J.R.; Yadav, S.K.; Sadler, J.M.; La Scala, J.J.; Palmese, G.R.; Schmalbach, K.M.; Stanzione, J.F. Preparation and Characterization of Highly Bio-Based Epoxy Amine Thermosets Derived from Lignocellulosics. Macromol. Chem. Phys. 2017, 218, 1700013. [Google Scholar] [CrossRef]
  20. Isikgor, F.H.; Becer, C.R. Lignocellulosic biomass: A sustainable platform for the production of bio-based chemicals and polymers. Polym. Chem. 2015, 6, 4497–4559. [Google Scholar] [CrossRef]
  21. Zia, K.M.; Noreen, A.; Zuber, M.; Tabasum, S.; Mujahid, M. Recent developments and future prospects on bio-based polyesters derived from renewable resources: A review. Int. J. Biol. Macromol. 2016, 82, 1028–1040. [Google Scholar] [CrossRef]
  22. Ng, F.; Couture, G.; Philippe, C.; Boutevin, B.; Caillol, S. Bio-based aromatic epoxy monomers for thermoset materials. Molecules 2017, 22, 149. [Google Scholar] [CrossRef]
  23. Garrison, T.F.; Murawski, A.; Quirino, R.L. Bio-based polymers with potential for biodegradability. Polymers 2016, 8, 262. [Google Scholar] [CrossRef]
  24. Babu, R.P.; O’Connor, K.; Seeram, R. Current progress on bio-based polymers and their future trends. Prog. Biomater. 2013, 2, 8. [Google Scholar] [CrossRef]
  25. Siracusa, V.; Blanco, I. Bio-Polyethylene (Bio-PE), Bio-Polypropylene (Bio-PP) and Bio-Poly(ethylene terephthalate) (Bio-PET): Recent Developments in Bio-Based Polymers Analogous to Petroleum-Derived Ones for Packaging and Engineering Applications. Polymers 2020, 12, 1641. [Google Scholar] [CrossRef]
  26. Prasanth, S.M.; Kumar, P.S.; Harish, S.; Rishikesh, M.; Nanda, S.; Vo, D.V.N. Application of biomass derived products in mid-size automotive industries: A review. Chemosphere 2021, 280, 130723. [Google Scholar] [CrossRef] [PubMed]
  27. Stagner, J.A.; Tseng, S.; Tam, E.K.L. Bio-Based Polymers and End-of-Life Vehicles. J. Polym. Environ. 2012, 20, 1046–1051. [Google Scholar] [CrossRef]
  28. Ruban, S. Biobased Packaging—Application in Meat Industry. Vet. World 2009, 2, 79. [Google Scholar] [CrossRef]
  29. Luoma, E.; Välimäki, M.; Ollila, J.; Heikkinen, K.; Immonen, K. Bio-Based Polymeric Substrates for Printed Hybrid Electronics. Polymers 2022, 14, 1863. [Google Scholar] [CrossRef] [PubMed]
  30. Mu, M.; Vaughan, A. Dielectric behaviours of bio-derived epoxy resins from cashew nutshell liquid. High Volt. 2021, 6, 255–263. [Google Scholar] [CrossRef]
  31. Corigliano, P.; Crupi, V.; Bertagna, S.; Marinò, A. Bio-based adhesives for wooden boatbuilding. J. Mar. Sci. Eng. 2021, 9, 28. [Google Scholar] [CrossRef]
  32. Terry, J.S.; Taylor, A.C. The properties and suitability of commercial bio-based epoxies for use in fiber-reinforced composites. J. Appl. Polym. Sci. 2021, 138, 50417. [Google Scholar] [CrossRef]
  33. Kumar, S.; Saha, A. Utilization of coconut shell biomass residue to develop sustainable biocomposites and characterize the physical, mechanical, thermal, and water absorption properties. Biomass Conv. Bioref. 2022, 12, 1–17. [Google Scholar] [CrossRef]
  34. Kumar, S.; Bhowmik, S.; Mahakur, V.K. Thermo-mechanical and degradation properties of naturally derived biocomposites for prosthesis applications: Analysis of the interface pressure and stress distribution on the developed socket. Proc. Proc. Inst. Mech. Eng. Part E J. Process. Mech. Eng. 2022. [Google Scholar] [CrossRef]
  35. Naik, N.; Shivamurthy, B.; Thimmappa, B.H.S.; Guo, Z.; Bhat, R. Bio-Based Epoxies: Mechanical Characterization and Their Applicability in the Development of Eco-Friendly Composites. J. Compos. Sci. 2022, 6, 294. [Google Scholar] [CrossRef]
  36. Aisyah, H.A.; Padzil, F.N.M.; Juliana, A.H.; Zainudin, E.S. Nanofillers: From laboratory to industry. In Synthetic and Natural Nanofillers in Polymer Composites; Elsevier: Amsterdam, The Netherlands, 2023; pp. 417–425. [Google Scholar] [CrossRef]
  37. Tolinski, M. Overview of Fillers and Fibers. In Additives for Polyolefins; Elsevier: Amsterdam, The Netherlands, 2009; pp. 93–119. [Google Scholar] [CrossRef]
  38. Kausar, A. Flame retardant potential of clay nanoparticles. In Clay Nanoparticles: Properties and Applications; Elsevier: Amsterdam, The Netherlands, 2020; pp. 169–184. [Google Scholar] [CrossRef]
  39. Farzadnia, N.; Shi, C. Use of nanomaterials in geopolymers. In Nanotechnology for Civil Infrastructure; Elsevier: Amsterdam, The Netherlands, 2023; pp. 161–190. [Google Scholar] [CrossRef]
  40. Zaferani, S.H. Introduction of polymer-based nanocomposites. In Polymer-Based Nanocomposites for Energy and Environmental Applications; Elsevier: Amsterdam, The Netherlands, 2018; pp. 1–25. [Google Scholar] [CrossRef]
Figure 1. Processing of nanoclay filled amine-cured bio-based epoxy composites.
Jcs 07 00372 g001
Figure 2. The configuration of back propagation artificial neural network.
Jcs 07 00372 g002
Figure 3. Main effect plots for S/N ratios for wear versus (A) Nanoclay (wt.%); (B) Sliding velocity; (C) Load; (D) Sliding distance.
Jcs 07 00372 g003
Figure 4. Main effect plots for S/N ratios for friction force versus (A) Nanoclay (wt.%); (B) Sliding velocity; (C) Load; (D) Sliding distance.
Jcs 07 00372 g004
Figure 5. SEM image of nanoclay-filled FormuLITETM amine-cured bio-based epoxy composites with (top left) 1 wt.% Nanoclay (top rigth) 2 wt.% Nanoclay (bottom) 3 wt.% Nanoclay.
Jcs 07 00372 g005
Figure 6. EDS analysis {Carbon and Silicon dispersion} (a) 1 wt.% Nanoclay (b) 2 wt.% Nanoclay (c) 3 wt.% Nanoclay.
Jcs 07 00372 g006aJcs 07 00372 g006b
Figure 7. AFM 3D surface representation of nanoclay-filled FormuLITETM amine-cured bio-based epoxy composites with 1 wt% nanoclay with constant sliding velocity (2 m/s), load (10 N) and sliding distance (1000 m).
Jcs 07 00372 g007
Figure 8. AFM 3D surface representation of nanoclay-filled FormuLITETM amine-cured bio-based epoxy composites with 1 wt% nanoclay with constant sliding velocity (2 m/s), load (10 N) and sliding distance (1000 m).
Jcs 07 00372 g008
Figure 9. AFM 3D surface representation of nanoclay-filled FormuLITETM amine-cured bio-based epoxy composites with 1 wt% nanoclay with constant Sliding Velocity (2 m/s), Load (10 N) and Sliding Distance (1000 m).
Jcs 07 00372 g009
Table 1. Factors and levels used in the experimentation.
Control FactorsLevels
123
Nanoclay (wt.%) 123
Sliding velocity (m/s)1.01.52.0
Load (N)102030
Sliding distance (m)5007501000
Table 2. Experimental Wear (mg/m) and Frictional Force (N) results.
SchemeABCDWear
(mg/m)
Frictional Force
(N)
111105000.007222.53
211.5207500.008423.22
3123010000.008926.44
4212010000.005732.98
521.5305000.005934.3
622107500.006931.45
731307500.003541.08
831.51010000.004237.82
932205000.004338.62
Table 3. Analysis of variance for wear (mg/m).
SourceDFSeq SSContributionAdj SSAdj MSF-Valuep-Value
Regression40.00002999.52%0.0000290.000007206.280.000
A10.00002690.46%0.0000260.000026750.000.000
B10.0000027.93%0.0000020.00000265.710.001
C10.0000000.00%0.0000000.0000000.001.000
D10.0000001.13%0.0000000.0000009.410.037
Error40.0000000.48%0.0000000.000000
Total80.000029100.00%
Table 4. Analysis of Variance for Frictional Force (N).
SourceDFSeq SSContributionAdj SSAdj MSF-Valuep-Value
Regression4359.73798.73%359.73789.93477.850.000
A1342.46893.99%342.468342.468296.450.000
B10.0010.00%0.0010.0010.000.977
C116.7334.59%16.73316.73314.490.019
D10.5340.15%0.5340.5340.460.534
Error44.6211.27%4.6211.155
Total8364.357100.00%
Table 5. Observations of the output response.
ItineraryDescription
Sum of squared error0.0008
Number of epochs8000
Learning factor (η)0.6
Momentum factor (α)1
Table 6. BPANN validation with the experimental data for the 27 planned trials.
Sl. NoABCDWear (mg/m)
Experimental
Frictional Force (N)
Experimental
Wear (mg/m) BPANNFrictional Force (N) BPANN
111105000.006222.990.007123.25
211107500.006923.170.007222.11
3111010000.007423.340.007924.61
411.5205000.008124.350.008124.31
511.5207500.008624.800.008324.88
611.52010000.008825.250.008424.46
712305000.007926.070.008927.11
812307500.008426.800.008827.89
9123010000.008827.520.008528.55
1021205000.004931.910.004927.01
1121207500.005632.560.005533.22
12212010000.005833.210.005634.12
1321.5305000.005933.770.005934.00
1421.5307500.005834.700.006135.22
1521.53010000.006635.620.006634.10
1622105000.006631.400.006231.85
1722107500.007131.850.007032.22
18221010000.007932.300.007331.00
1931305000.003439.870.003340.10
2031307500.003440.990.003141.22
21313010000.003342.120.003843.06
2231.5105000.003937.970.003938.49
2331.5107500.004138.620.004236.00
2431.51010000.004639.270.004440.22
2532205000.004638.280.004138.22
2632207500.004339.200.004440.87
27322010000.004340.130.004440.23
Disclaimer/Publisher’s Note: The statements, opinions and data contained in all publications are solely those of the individual author(s) and contributor(s) and not of MDPI and/or the editor(s). MDPI and/or the editor(s) disclaim responsibility for any injury to people or property resulting from any ideas, methods, instructions or products referred to in the content.

