Article

The Influence of Strontium Oxide on the Physio-Mechanical Properties of Biomedical-Grade Titanium in Ti-SrO Composites

by
Soodad A. Muhammed
1,*,
Aseel Mohammed Al-Khafaji
2 and
Haydar H. J. Jamal Al-Deen
3
1
Department of Prosthodontics, College of Dentistry, University of Kufa, Al Najaf 54001, Iraq
2
Department of Prosthodontics, College of Dentistry, University of Baghdad, Baghdad 10047, Iraq
3
Department of Metallurgical Engineering, Materials Engineering Faculty, University of Babylon, Hillah 51001, Iraq
*
Author to whom correspondence should be addressed.
J. Compos. Sci. 2023, 7(11), 449; https://doi.org/10.3390/jcs7110449
Submission received: 15 September 2023 / Revised: 27 September 2023 / Accepted: 8 October 2023 / Published: 30 October 2023
(This article belongs to the Section Biocomposites)

Abstract

:
Dental implants can be made of various materials, and amongst them, titanium and titanium alloy were the materials of choice for dental implants for many years because of their biocompatibility. The two alloys have a high level of biocompatibility, a lower modulus of elasticity, and better corrosion resistance than other alloys. Thus, they are frequently utilized in biomedical applications and mostly replace stiff fabrics. The latest advances in a new strontium oxide–cp titanium composite alloy are the main topic of this research. With regard to biomedical applications, additions of strontium oxide were synthesized at three distinct weight percentages (2%, 4%, and 6% by wt%). Powder metallurgy was used to create the alloys, which were then sintered by heating the samples. The effects of adding strontium oxide were analyzed by utilizing measurements of the Brinell hardness, X-ray diffraction, porosity, diametral tensile strength, roughness, and wettability of the finished surfaces. The results show that adding more strontium oxide (gradually increasing the ratio from 2% SrO to a 6% addition) raised the roughness and porosity. However, the microhardness and diametral tensile strength were enhanced with an increase in the volume fraction of strontium oxide particles. In conclusion, the alloy that contained 6 wt% strontium oxide microparticles had reasonably high mechanical properties and might be regarded as suitable for use in dental and medical applications due to its high wettability or, in other words, its low contact angle. The Brinell testing results for the diametral tensile strength, microhardness, and porosity of the generated strontium oxide–cp titanium composite alloy demonstrate its high potential for usage as a biomaterial, particularly in dental applications.

1. Introduction

Titanium is an indispensable element for high-performance components because of its remarkable combination of physical and mechanical properties and distinctive properties. Among structural metals, titanium has the best ratio of mechanical properties with respect to its density, excellent corrosion resistance, and good biocompatibility [1]. However, the embedded materials must be solid and sufficiently resilient to survive the physiological loads applied and must operate for a much longer duration [2]. Titanium is relatively unchanged when it is inserted into the human body as an implant because of its high corrosion resistance, and this property makes titanium biologically inert. Thus, titanium cannot osseointegrate with human bone cells [3]. Positive modulation of biological processes is limited, given that osteoinduction (the induction of bone apposition) cannot be accomplished [4]. Although titanium has a high content in the Earth’s crust, it is more expensive and is a rare material compared with other technological materials in the medical field. The unfortunate and unavoidable high cost of Ti is exacerbated in nearly every step of manufacturing from mineral to products [5]. The usual metallurgical procedures are inefficient when dealing with Ti, which is extremely reactive at high temperatures [6], and difficult and poor machining causes significant material loss. For such reasons, powder metallurgy (PM), as a processing route, is considered one of the most suitable fabrication methods and a practical means of producing complex Ti parts directly at a low cost. The PM method has enhanced chemical and microstructural homogeneity in addition to the ability to create different composite structures [7]. Implant-related parameters, including the chemical composition and implant design, implant surface topography, material, form, diameter, length, implant surface treatments, and coatings, all contribute to osseointegration [8]. According to the literature, utilizing inorganic antibacterial compounds outperforms using organic antibacterial materials in terms of toxicity, specificity of action, and durability [9].
Numerous studies have shown that modifying surfaces with inorganic metal elements such as zinc (Zn), magnesium (Mg), and strontium (Sr) can hasten osseointegration and encourage the formation of new bones [10]. As a result, ceramic oxides or metallic dispersions are used as reinforcing agents [11]. Sr is thought to have multiple action mechanisms. One strontium compound, Sr ranelate, is a combination of sodium ranelate and strontium chloride (SrCl2·6H2O). Numerous works have demonstrated that Sr can stimulate the calcium-sensing receptor (Ca SR) found in the membrane of osteoclasts and osteoblasts, which proposes that it plays an important role in the anabolic effects of Sr on osteoblast cells. Sr is an intriguing candidate for a surface coating because of its mentioned features, given that it can combine the mechanical characteristics of a Ti-based implant with a relatively rough surface [12]. Sr oxide influences bone production and resorption by promoting osteoblast survival and differentiation. Preosteoclast differentiation was also observed to be decreased concurrently by SrO [13]. SrO is an intriguing choice for a surface coating because of its mentioned features, considering that it can combine the mechanical capabilities of Ti-based implants with a surface that is only moderately rough with the benefits of Sr for the repair of bones. Sr can inhibit the osteoclast differentiation of preosteoclast cells and promote the expression of outcome cells and protein secretion to stimulate bone repair [14]. Also, these compounds have a high hardness and are highly coherent to the base, improving the physical and mechanical properties of base alloys [15].
Porous materials have been used to additionally lower the elastic modulus of Ti-based alloys. The elastic modulus is a quality that is difficult to change. In this study, focused elements could be added for the purpose of changing the elastic modulus; otherwise, the porosity in alloys that are utilized to make the final product determines the value of the elastic modulus [16]. Modern Ti alloys have an elasticity modulus that is three to four times higher than that of human bones, which may be uncomfortable for patients and increase the risk of implant failure. The reason for this is that the implant can withstand much mechanical stress, which weakens the bones and causes wear and reduced bone density. This condition is referred to as stress shielding [17]. Powder metallurgy (PM) is one method for achieving porosity at the surface of a component. This method can create implants with interconnected pores that encourage osseointegration by allowing the development of bones. A collection of methods known as PM is used to create, characterize, and consolidate metallic or ceramic powders through sintering and compacting [6]. Increasing the value of the micro surface roughness is an advantage of PM composite materials. Depending on completed wettability and mechanical tests, bioactive composite alloys could be utilized as materials to create biomedical implants with enhanced osseointegration potential and mechanical compatibility for demanding load-bearing applications [18]. The biocompatibility, implant characteristics, and corrosion resistance of dental implants have all been demonstrated to be improved by the addition of SrO to Ti [19].
A novel type of biomedical ceramic–metal composite, which is known as a bioactive composite metal, is the subject of this study, and it is made possible by such factors. It is made using an efficient PM method. The hybrid structure of the composite alloy consists of a biodegradable strontium oxide component, ceramic elements in Ti, and a bioinert Ti matrix, which is permanent following implantation and offers implant mechanical performance. In terms of tensile property application, dental implants, which are frequently subjected to demanding tensile loading, should be directly compared with cp Ti alloy. This study offers the idea of a Sr oxide–cp titanium composite alloy in which testing is conducted to evaluate the microstructure and mechanical properties in a fabricated condition. This paper focuses on the recent developments of bioactive composite Ti-based alloys for future biomedical applications. The present aims of this work are to develop a Ti-SrO composite and investigate its properties, such as the microstructure and physio-mechanical properties.

2. Materials and Methods

2.1. Particle Size Measurements

Powders of CP titanium and strontium oxide were used in this study, and the CP titanium (SHAANXI JIADE Ltd., Co. Shaanxi, China; particle size range: 33.03–52.81 μm) and strontium oxide powder (Mo-Sci, HyPoint North, Rolla, MO, USA; particle size range: 3.129–4.718 μm) were measured using a particle size analyzer (Bettersize) to determine the particle size of the starting materials, as shown in Figure 1.

2.2. Preparation of Control and Experimental Samples

The groups of the prepared specimens were split into four main groups (Groups A, B, C, and D).

2.2.1. Mixing and Ball Milling

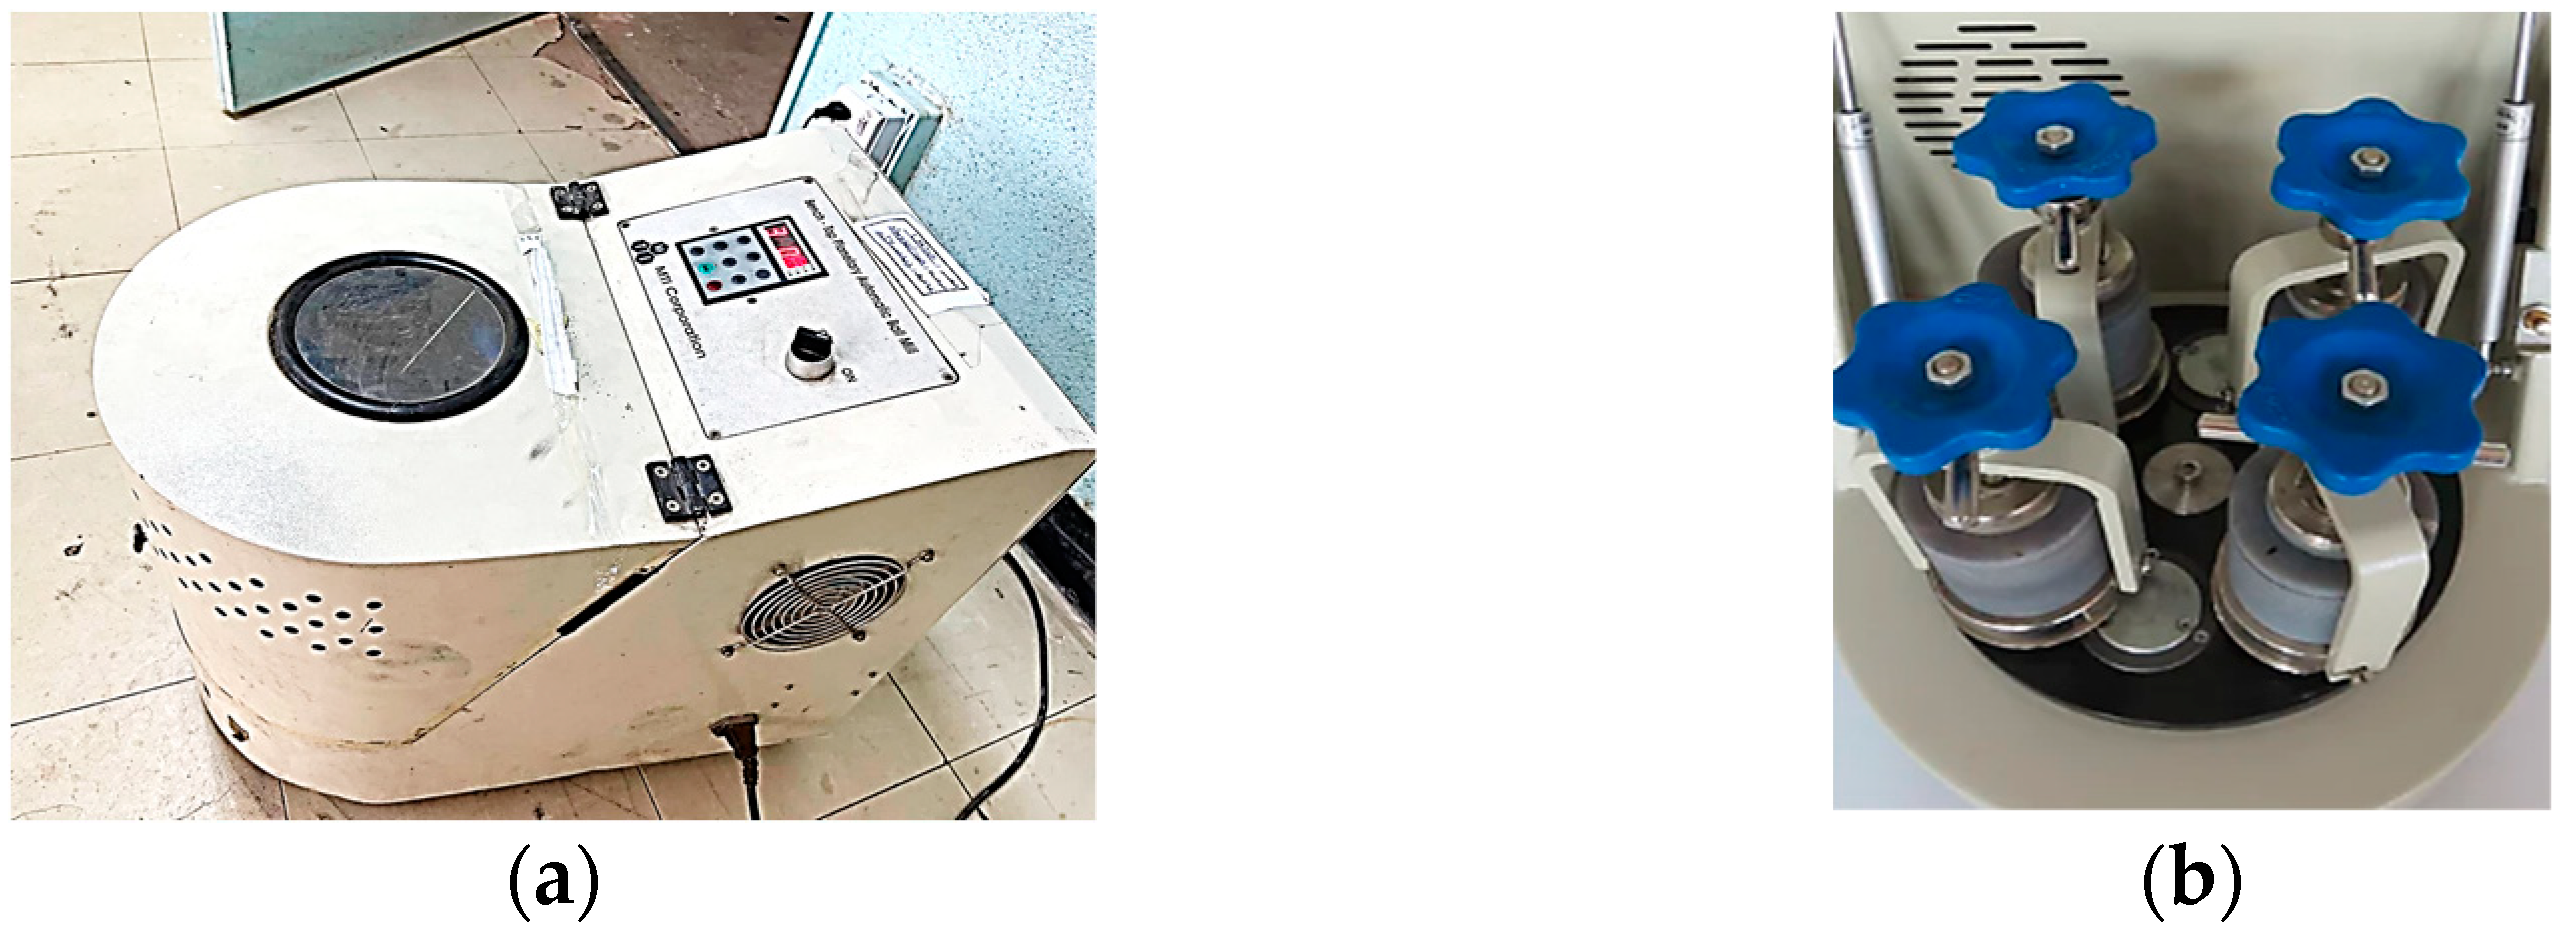
A sensitive, accurate, USA-made OHAUS 250 g electronic balance was used. A vacuum dry box (DZF-6020 GERMANY, 168, Zhaogang Road, Xiamen City, China) was utilized for drying 50 g of pure titanium powder at 125 °C for 30 min, and the weight was measured after drying with 0.1 mg accuracy. The strontium oxide powder was also dried at 125 °C by using a vacuum dry box for 30 min and then added to the dried titanium powder [20]. Chromium steel balls 10 mm in diameter were obtained by utilizing a rotating ball mill with an AISI 304SS container, as shown in Figure 2a,b. The mix charge and balls were added to the container at a weight ratio of 1:10, the charge was milled at 145 rpm, and the mixture was blended for 5 h. The percentages of addition of the strontium oxide powder to the titanium were 2%, 4%, 6%, 8%, and 10%, as shown in Table 1. All blending cycles were performed at room temperature and under controlled conditions.

2.2.2. Cold Compaction

Cold compaction was conducted in a uniaxial manner by using a calculated hydraulic press (Carver, Lake Park, MO, USA). Samples with a diameter of 12 mm were created using a pressing mold. Table 1 displays the percentages of the utilized alloying elements. Different compaction pressures (500, 550, 600, 650, 700, 750, 800, and 850 MPa) with a periodic time of 4 min were used to determine the optimum pressure giving the lowest green porosity and the highest green density. The 800 MPa applied pressure was determined to be the best according to Table 2 and Figure 3. The percentages of 8% and 10% addition of strontium oxide failed under a pressure of 800 MPa (cracks). Therefore, these percentages were excluded from the study. The samples after compaction are shown in Figure 4.
Figure 3 depicts that the green density increased as the pressure rose, which was due to a decrease in pores as the compacting pressure increased. The rearrangement of the powder will occur when pressure is applied, resulting in localized deformation. An increase in pressure leads to the removal of gaps or spaces between the particles and the formation of new contacts, and eventually, a homogeneous deformation of the highly condensed sample occurs.

2.2.3. Sintering

The samples were sintered in an argon environment in an electric resistance programmable vacuum furnace (China). The samples were heated to a sintering temperature of 500 ± 3 °C and held for 2 h at this temperature to minimize the thermal shock of the samples. Then, the temperature was raised to 1000 ± 3 °C and held for 2 h to complete the sintering processes. The rate of heating was set at 3 °C/min. When the process was completed, the furnace was turned off, and the samples were allowed to slowly cool inside while being continuously surrounded by an argon gas stream at a pressure of 5 mbar [20]. A digital thermometer (model DT-830C, Aswar, China) with a measurement range from −20 °C to 1370 ± 3 °C was utilized to calibrate the sintering temperature. The samples after sintering are shown in Figure 5.

2.2.4. Grinding and Polishing

On a grinding machine (type: Mekton, UK), the samples of manufactured sintered compacts were wet ground with silicon carbide emery papers of 400, 800, 1500, 2000, and 3000 µm grit. Thereafter, a constant period of time equal to 15 min was fixed for the overall grinding period for every sample’s surface preparation for necessary tests and examinations. They were then washed in distilled water and dried for 30 min in an electric vacuum oven at 125 °C. Next, the samples were organized into categories for subsequent examinations and tests [21]. The samples after sintering are shown in Figure 6.

2.3. Chemical Compositions of the Powders

Analysis of the chemical composition of the titanium powder (wt.% analysis) revealed that the purity of the cp titanium was 99.971, whereas trace metal analysis determined that the SrO had a purity of 99.9%.

2.4. Analysis of Variance

ANOVA can be defined as a statistical technique for identifying differences between experimental groups. ANOVA is appropriate in the case where multiple experimental groups are present within at least one independent (categorical) variable. ANOVA is a computer technique that examines the relative contribution of the change in each parameter to the overall response variation in an experiment [22]. The Games–Howell multiple comparison test compared each of the two groups at the same time, where p ≤ 0.01 indicates a significant difference between each of the two groups [23].

3. Results

3.1. X-ray Diffraction (XRD)

An X-ray diffractometer was employed (Hitachi S4700 EDAX ApolloX Genesiss software, Chiyoda City, Tokyo) to determine the structure and identify the phases of each sample.
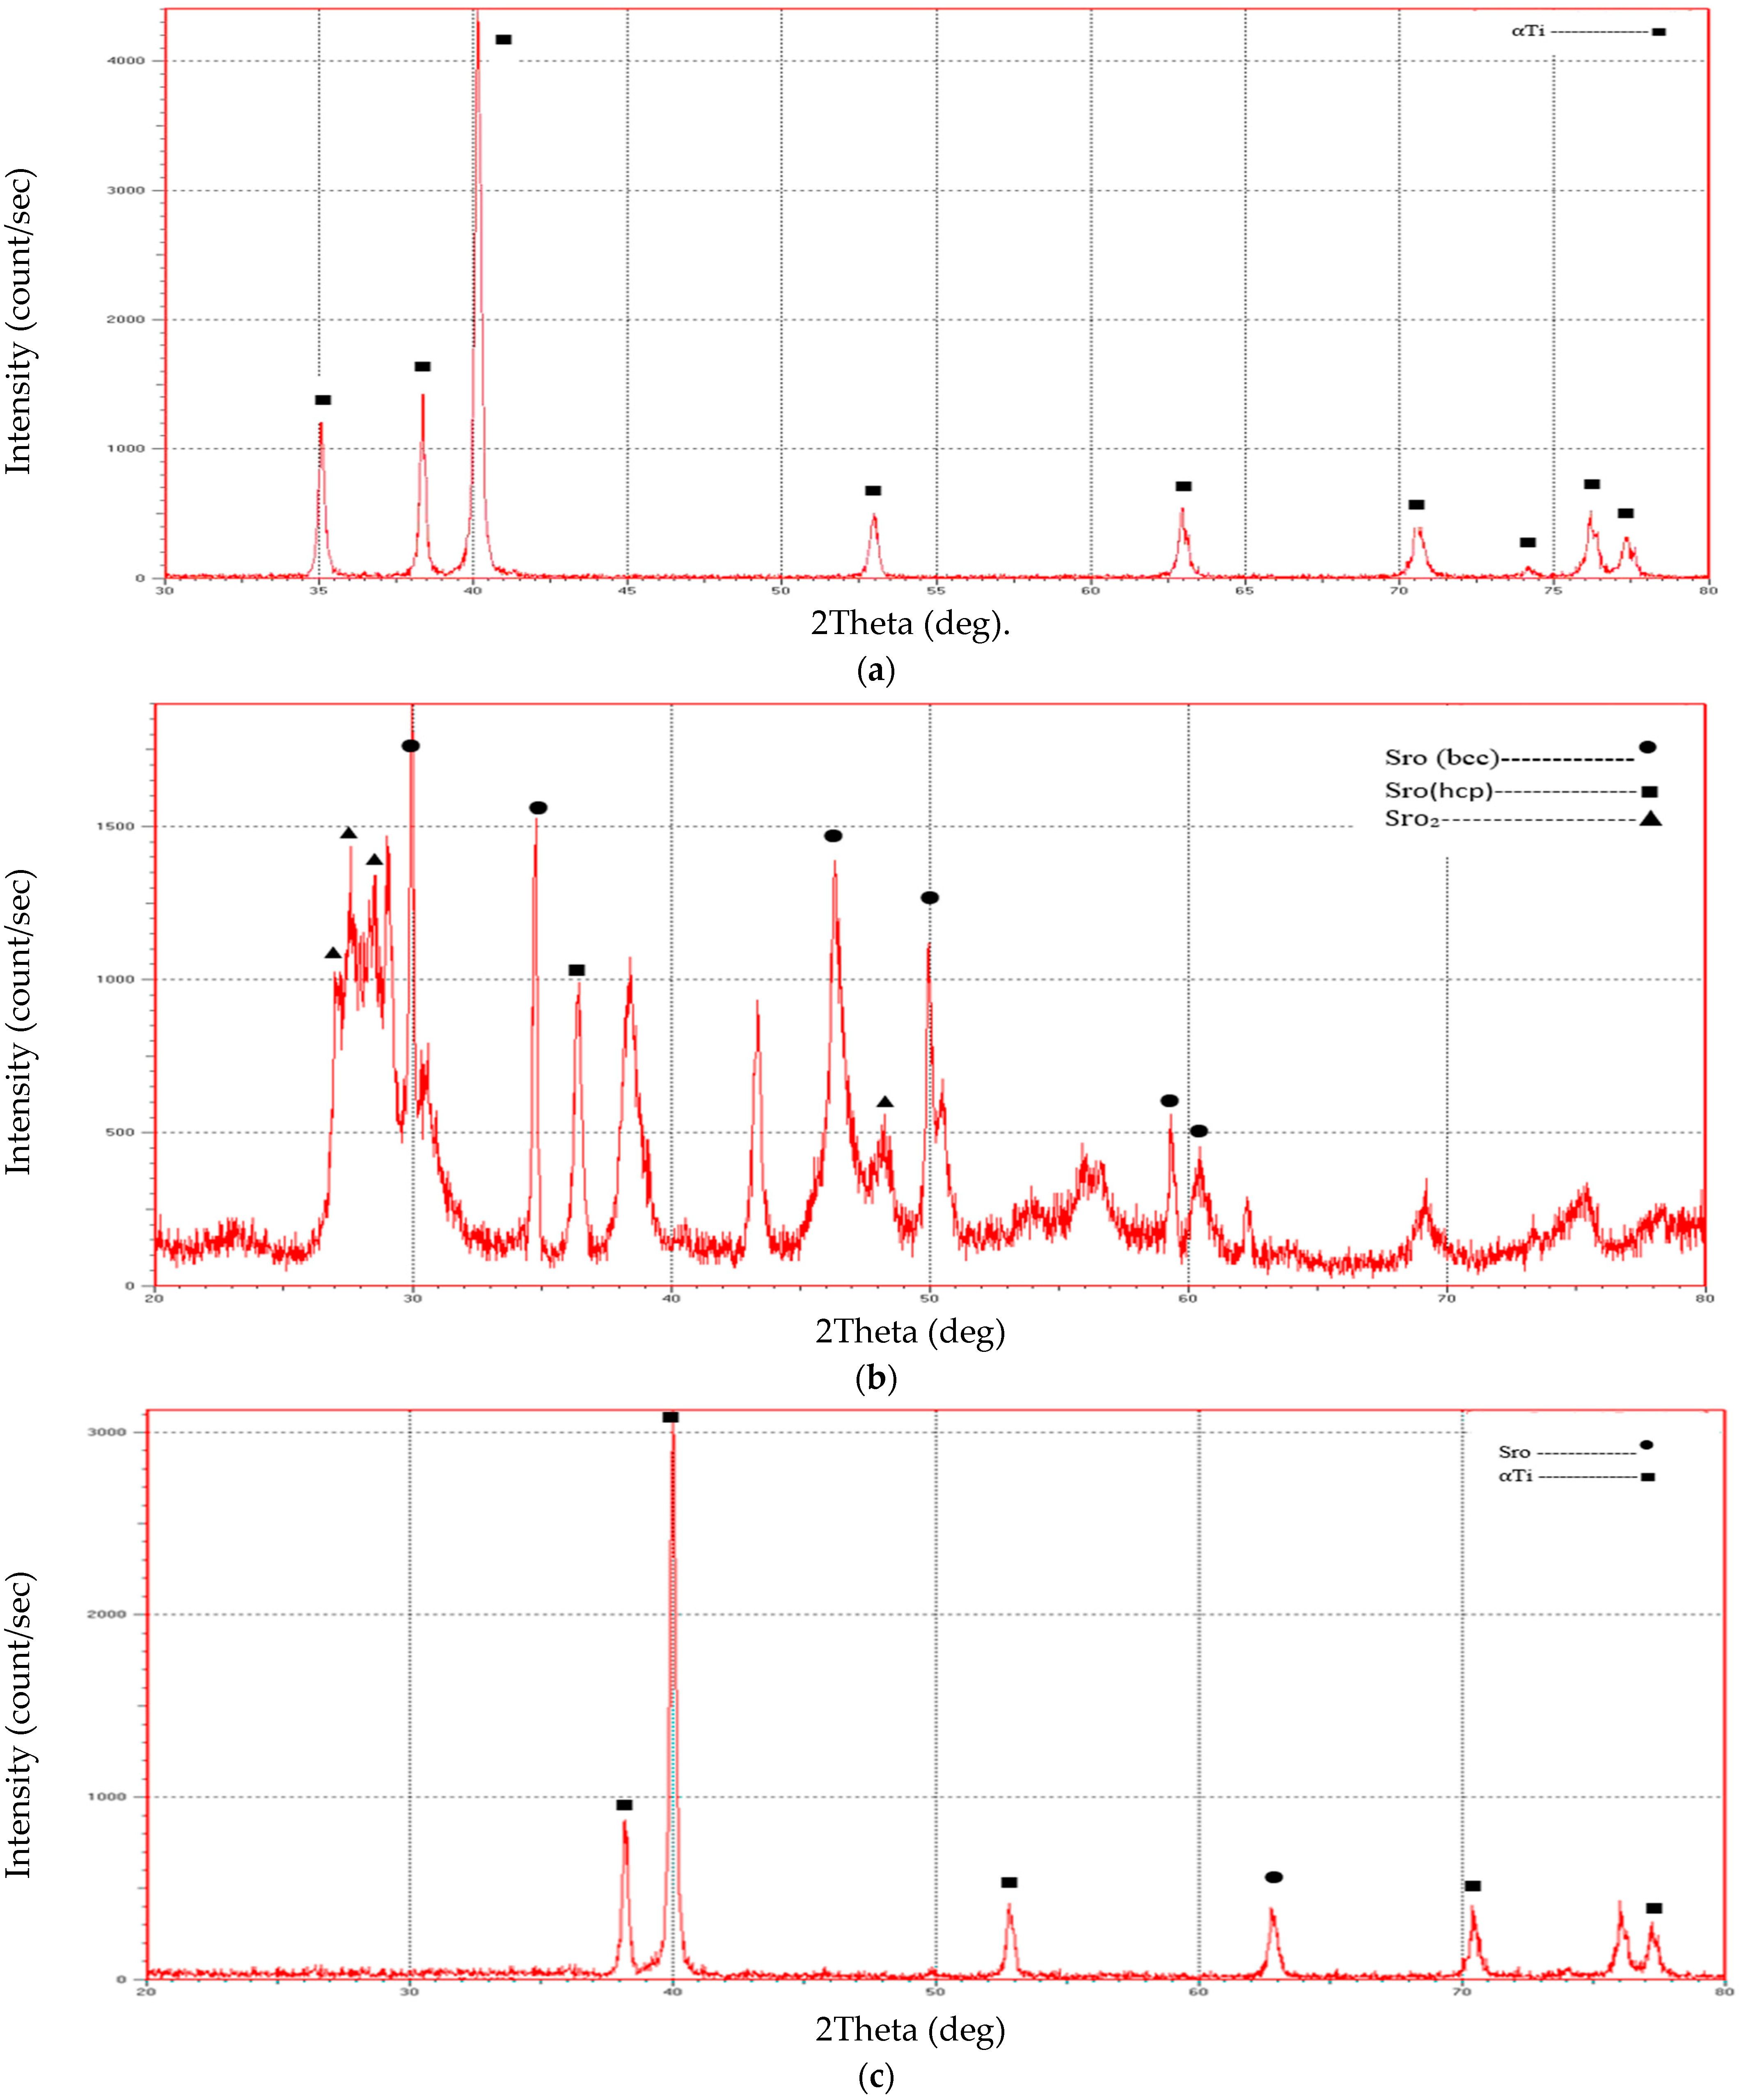
Figure 7a displays the X-ray diffraction (XRD) results for the cp Ti composites without adding SrO. Here, ⍺-Ti phases developed in the Ti composites structure that had been sintered at 1000 ± 3 °C under argon gas, which was indexed by standard cards (JCPDS-ICDD 44–1288 and 29–1360(Ti) card number: 44.1294; JCPDS-ICDD 44–1288 and 29–1360(SrO) card number: 06.0520) that were represented by JCPDS-ICDD 44–1288 and 29. The XRD results for the strontium oxides (SrO(hcp), SrO (bcc), and SrO2) are shown in Figure 7b. Following the sintering process at 1000 ± 3 °C with argon gas, Figure 7c–e shows the XRD patterns for the cp Ti-SrO alloys at various percentages (2%, 4%, and 6% by wt%). The peak position of the sintered composite with the 2% SrO addition was between 60° and 70°, and SrO appeared in the diffraction patterns. Therefore, this result is consistent with earlier findings [24,25]. The diffraction patterns and peak positions with the 4% SrO addition between 30° and 40° show that the sintered composite contained extra SrO. Along with 60° to 70°, the diffraction patterns and peak positions show that the sintered composite had more SrO than usual. As shown in Figure 7e, the maximum SrO peaks were observed at their maximum values in the sintered composite diffraction patterns and peak positions with a 6% SrO addition between 30° and 40°, 60° and 70°, and 70° and 80°. This finding indicates that as the SrO percentages increased, the proportion of SrO rose in the composite and reached its maximum. Only the ⍺-Ti phases were formed in the Ti composite and Ti-SrO composite structures at different percentages (2%, 4%, and 6% by wt%), and phase transformation was not observed in the base alloy.

3.2. True Porosity

The porosity was measured with the use of the Archimedes principle and by weighing the specimens with an electronic balance under various conditions. First, the dry specimens were weighed after drying in a vacuum dryer at 125 °C and under a vacuum for 10−4 Tor for 30 min and then cooled at the ambient temperature. Next, the specimens were weighed after being submerged in the oil for 30 min, and the pressure on the submerged specimens was reduced using a suitable vacuum pump. Finally, the specimens were weighed when they were suspended by wire in water. For the sintered samples, the porosity could be calculated in accordance with ASTM B-327.
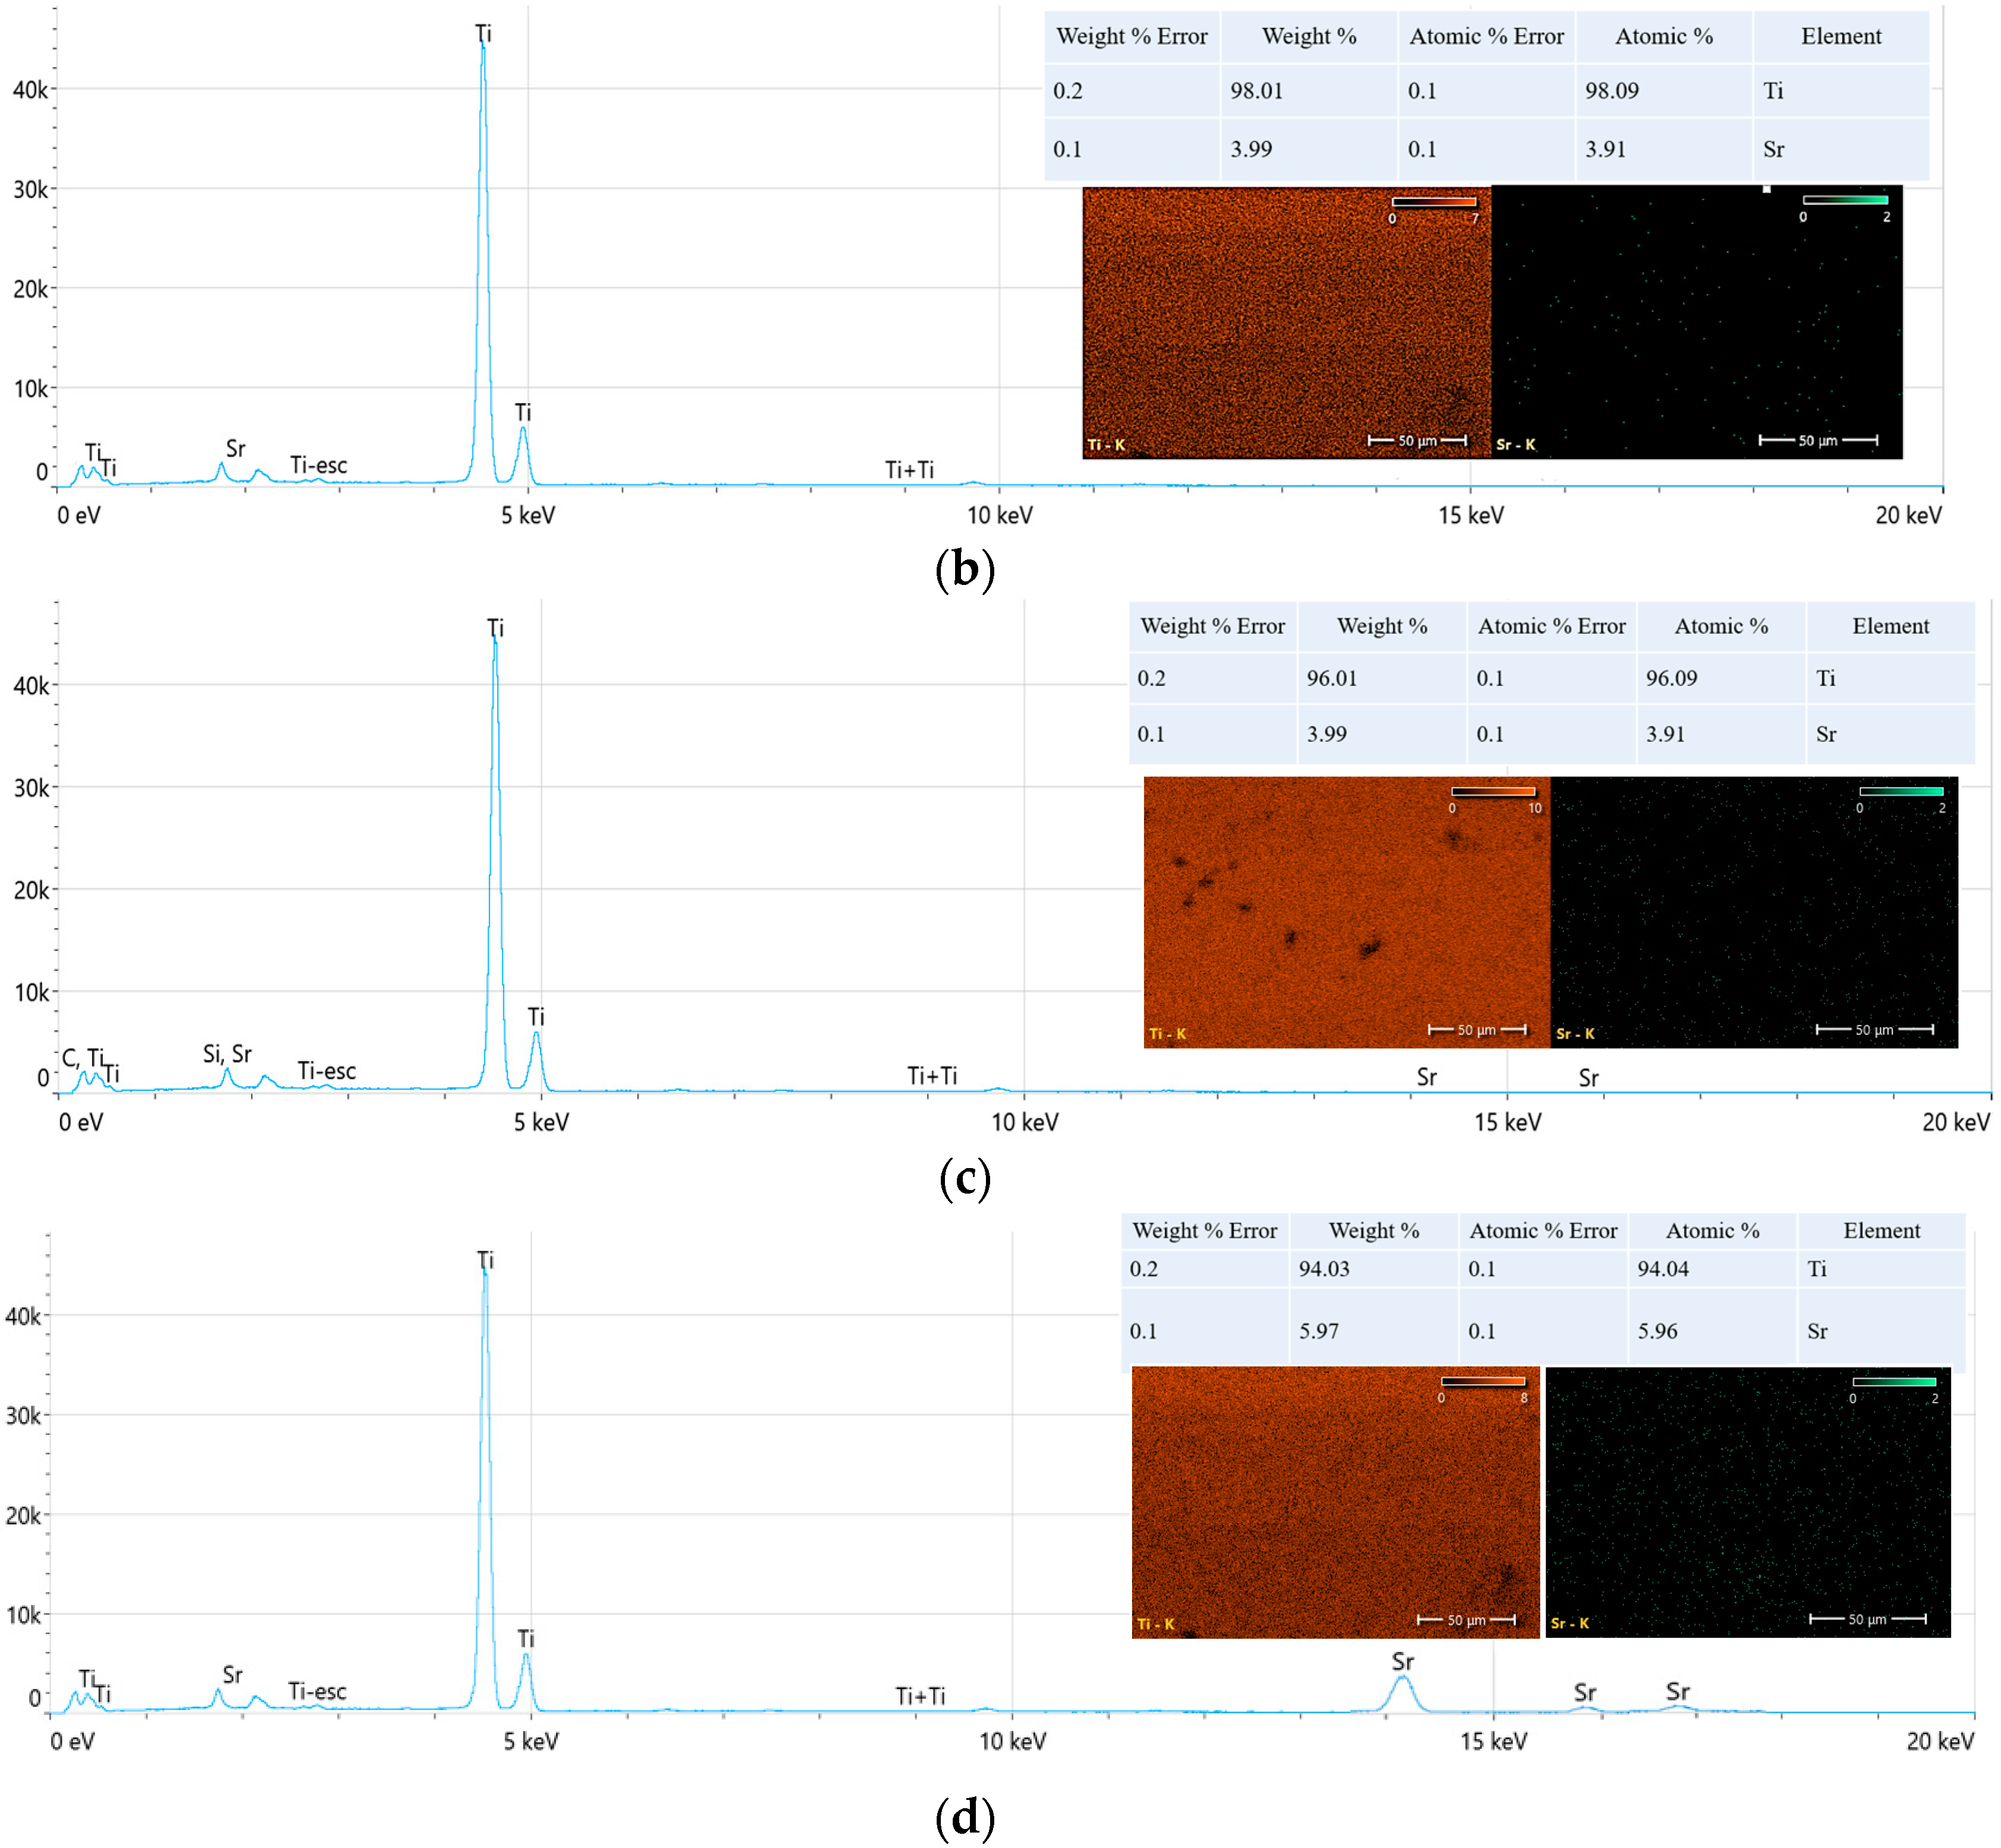
Following the sintering process, the true porosity and density of all used alloys were measured. The porosity increased when the concentration of SrO rose (Table 3, Table 4 and Table 5), as shown in Figure 8. The EDX mapping and chemical determination of the specimens are shown in Figure 9, which shows the EDX for the Ti composite and Ti–2%SrO, Ti–4%SrO, and Ti–6%SrO alloys. The Ti peak was more pronounced than the SrO peak, as expected in the EDX phases. The microstructure and quantification of microstructural data were determined with scanning electron microscopy and energy dispersive X-ray spectroscopy (EDX) for the percentage of specimens sorted by weight, as shown in Figure 8 and Figure 9.
Table 6, Table 7 and Table 8 show that the density of the cp Ti-SrO alloys had a gradual decrease according to the gradual rise in the concentration of SrO.

3.3. Hardness

The Brinell hardness measuring equipment (Digitals Micro Brinell Hardness Tester UH 250, BUEHLER, Germany) in accordance with ASTM (E10-15) employed a load of 62.5 KP for 10 s [19]. The measurement of hardness was performed by taking the average of three readings for each sample.
In this work, the Brinell microhardness of the composite alloys made from cp Ti composite and Ti-SrO specimens was determined. The relationship between the concentration of SrO and the hardness ratings for the cp Ti and Ti-SrO alloys could be observed. The descriptive statistics and ANOVA data analysis are detailed in Table 9 and Table 10, respectively. The multiple comparison test (Games–Howell) was used to compare each pair of groups at the same time, as shown in Table 11. The table demonstrates a highly significant difference (p ≤ 0.01) between each pair of groups.

3.4. Diametral Tensility (Diametral Compression Test)

A computer-controlled electronic universal testing machine (WDW-200 KN) was used to measure the tensile strength of the diamond. A universal testing device with a loading rate of 0.2 mm/min was employed in accordance with ASTM (D695-85). All prepared specimens underwent a microtest with the use of a UMT2 tribometer at room temperature (ball on disk) to assess their tribological characteristics.
In this study, the diametral tensile strength of the SrO-based composites increased as alloying elements were added to the Ti-based alloy. The diametral tensile strength of the Ti-SrO composite increased with the rise in strontium oxide content at ratios of 2%, 4%, and 6% by wt%, and the Ti-SrO composite alloys showed the highest mean value with the addition of 6% strontium oxides, as shown in Table 12 and Table 13. The multiple comparison test (Games–Howell) for comparing each pair of groups in the same period is shown in Table 14. The table shows that a highly significant difference existed between each pair of groups (p ≤ 0.01).

3.5. Microroughness

The microroughness regarding the surface of the prepared alloys was tested using a roughness tester (SN: K00113061718 Version V1). The surface topography was disclosed by scanning the surfaces of the sample with respect to the tip and recording the height of the probe that corresponded to a constant probe–sample interaction. Each addition group was used to calculate the porosity and density of the consolidated specimens.
A roughness tester (SN: K00113061718 Roughness Tester Version V1) was used to test the microroughness of the surface of the prepared alloys. This tester applies to a production site and can be used to measure the surface roughness of various machinery processed parts. This tester can evaluate surface textures with various parameters in accordance with various national standards. The measurement results are displayed digitally and graphically on the OLED. When measuring the roughness of the part surface, the pickup is placed on the surface of the part, and then, the surface is traced at a constant rate. As shown in Table 15 and Table 16, the measured surface roughness for the cp Ti and Ti-SrO alloys may be regarded as a function of the strontium oxide content.

3.6. Wettability Test (Contact Angle Test)

On a contact angle goniometer (a device that is typically referred to as a contact angle goniometer or tensiometer, which has been utilized for measuring the static contact angle), water contact angle measurements were made with the use of the sessile drop method. Figure 6 shows the grouping of the prepared specimens.
A contact angle goniometer was used to perform water contact angle measurements through the sessile drop method on a contact angle goniometer or tensiometer (an instrument generally called a contact angle goniometer or tensiometer, which is used to measure the static contact angle) at room temperature. A total of the measurements was conducted and averaged for each specimen and then compared with the samples of cp Ti composite as a control (Group A). Water contact angle images were collected for all study groups. The control Group A showed a higher water contact angle of 86.492°, while group B showed a decrease in the water contact angle of 72.485°, followed by group C (60.997°) and group D with the lowest water contact angle of 50.284° (Figure 10). The descriptive statistics, ANOVA, and multiple comparison test (Games–Howell) data analysis are detailed in Table 17, Table 18, Table 19 and Table 20.

4. Discussion

4.1. True Porosity

The porosity of the sintered Ti-SrO alloys was shown to be affected by the addition of SrO, and the porosity values of the samples after sintering clearly increased. The reason for this is that when the sintering temperature increased, the total volume percentage of the residual porosity decreased. Despite the presence of some very large, elongated pores, most of the generated pores were spherical, as shown in Figure 8. As the processing temperature rose, the average pore size grew. Given that the interparticle boundaries had vanished by the time the second stage of sintering (cooling period) began, the pores tended to coalesce, which decreased their percentages but increased the remaining pore size. This phenomenon resulted in the presence of irregular pores and an increase in pore size. Although the residual porosity of the sintered Ti-SrO composite may adversely affect its mechanical response, such pores are actually advantageous for osteoconduction [26]. The size differences created a gap between the raw powders, and consequently, more pores were created. The increase in the porosity of the prepared composite alloy resulted in the increase in the surface area and therefore more wettability in the prepared composite alloy. Furthermore, a porous implant surface should enable more cells to attach compared with an equable surface.
The density of the cp Ti-SrO alloys had a gradual decrease according to the gradual rise in the concentration of SrO. The decrease in the density of the sintered alloys occurred due to presence of irregular pores, which could lead to disintegration and porosity formation [26]. The decrease in the density of the sintered alloys recommended if not affected the mechanical behavior of the resulted composite alloys. Also, the decrease in the density made the physiomechanical properties of the alloys close to those of bone.

4.2. Hardness

The hardness values of the sintered Ti-SrO alloys after sintering clearly increased. The content of SrO rose as a result of hardening the fine solution and strengthening the solid solution. This result is consistent with the earlier findings of Ho et al. [27]. Given that the Brinell hardness is dependent on the ball, the hardness rose with the increase in porosity, which depended on the measurement technique. The effect of the porosity was minimal because the size of the ball exceeded that of the pores. Ti binary alloys as dental biomaterials were the subject of the research of Wang et al. on their development and qualities. The results showed that the hardness was increased as a result of the dispersion strengthening theory of alloying SrO to produce dispersion-strengthened composites [27]. DS refers to a method of strengthening an alloy by adding highly stable substances (called dispersants) to an alloy and distributing these substances evenly throughout the alloy. If the SrO particles are evenly distributed, then the resulting composites have isotropic properties [28]. The other reason for the increase in hardness can be attributed to the additive material being ceramic, which has a higher hardness value than metal. This feature consequently makes the titanium composite alloy harder than the pure titanium alloy.

4.3. Diametral Tensility (Diametral Compression Test)

The addition of strontium oxide elements in the cp Ti composite showed the highest ultimate compressive strength because the dispersion of Sr as an alloying element in the Ti matrix gave a dispersion-strengthening effect. The reason for this is that deformation dislocation movement is obstructed by the stressed matrix, which increases the compressive strength and diametral tensile strength of the composites [29]. The increase in the compressive quality of the Ti-SrO composite alloy can be credited to the ceramic material having a higher resistance to compressive forces than metal. This feature subsequently makes the titanium composite more resistant than the pure titanium alloy.

4.4. Microroughness

The microroughness of the Ti-SrO composite alloy increased with the rise in strontium oxide content at ratios of 2%, 4%, and 6% by wt%. The multiple comparison test (Games–Howell) for comparing each pair of groups in the same period is shown in Table 18. Crespi et al. showed that the surface topography and roughness positively influenced the healing process by promoting favorable cellular responses and cell surface interactions [30]. After the modification of the cp Ti alloy to the SrO–Ti composite alloy, the average surface roughness of Group D was significantly increased compared with that of Group A, which implies that the SrO structuring had a positive outcome on changing the structure of the cp Ti alloy. This study agrees with the work of Al-Khafaji and Hamad, in which the roughness increased significantly in Group D, which was approximately 35 times that in Group A. This result was due to the particle size of the SrO powder (3 µm), which was helpful for bone tissue bonding [31]. This finding is also in agreement with those of Rong et al. and Eom et al., who observed that the surface roughness was significantly increased when modified by materials with nano- or microparticles [30,32].

4.5. Wettability Test (Contact Angle Test)

The results show a decrease in the water contact angle. The decrease in the contact angle in Group D is attributed to surface composition alteration and the degree of roughness due to surface structuring that enhanced cell attachment on the surface. These results are confirmed by the findings of Majumdar et al. [33]. Numerous previous studies have claimed that the highest surface roughness displays the lowest water titanium contact angle, and subsequently, more osteoblasts adhere to and proliferate on the titanium surface [34]. In addition, it may be attributed to the titanium dioxides displayed on the surfaces of the titanium alloy being more hydrophobic than the strontium oxides. As a result, the Ti-SrO composite alloy has a lower contact point estimation than the pure titanium alloy.
The release of strontium from the modified implant surface with a Ti-Sr-O coating was assessed by Offermanns et al. in 2018 by executing washout series at pH 7.4 in phosphate-buffered saline (PBS). The majority of the strontium was evidently liberated within the first two weeks. Nonetheless, the release seemed to be sustained over every stage of the trial, albeit at a slower rate [35].
Riedel et al. in 2016 aimed to discover a relationship between the strontium content of a bone specimen and the treatment duration. They identified an increasing amount of strontium-containing regions as the period of strontium treatment increased. Strontium accumulates unevenly in bone and is primarily deposited in newly derived bone packets upon medication delivery [36].
The generation of a microscale Ti-SrO composite with a high porosity and compressive quality and a low contact point makes it exceptionally appropriate for future use in dental and orthopedic inserts. The restrictions in reality are the cost and trouble within the preparation procedure, particularly with increasing SrO. This consideration requires in vivo implantation to survey their impacts on natural tissues, particularly bone remodeling cascades.

5. Conclusions

A novel and highly promising Ti composite alloy (Ti-SrO alloy) was prepared in this study using the PM approach. Prepared samples of Ti-SrO composite had additions of 2%, 4%, and 6% by wt%. Chemical studies, measurements of the porosity and density, and measurements of the microhardness, XRD, roughness, dimensional tensile strength, and contact angle were used to describe them. According to the XRD measurements, increasing the SrO percentages caused the fraction of SrO in the composite to climb to its maximum. Only the ⍺-Ti phases were formed in the structure of the Ti alloy and Ti-SrO alloys at different percentages (2%, 4%, and 6% by wt%), and phase transformation was not observed in the base alloy. Increases in the porosity, Brinell hardness, and diametral tensile strength were observed compared with those of the cp Ti alloys.
Only the contact angle measurements decreased with the increase in SrO additive materials from 2%, 4%, and 6% by wt%. The Ti-SrO composite was found to have the greatest potential for biomedical applications. By using surgical implants made of Ti-SrO alloy, the stress shielding phenomenon will essentially be eliminated, which makes such alloys more comfortable for patients. A model will be created and applied to the body of the organism, namely the leg region, to identify the concentration of stresses and the weaknesses of alloys. Such new biomedical alloys will make excellent conducting biocomposite replacements for orthopedic and dental implants because of their intriguing properties. However, the body of research to date has still focused on the characterization of the Ti-SrO alloys and only some of their physio-mechanical properties. Therefore, further biological studies are necessary to evaluate the potential of Ti-SrO alloys to optimize their use for biomedical applications.

Author Contributions

Conceptualization S.A.M. and A.M.A.-K.; methodology, H.H.J.J.A.-D.; conceptualization, S.A.M. and A.M.A.-K.; methodology, H.H.J.J.A.-D.; calculation, S.A.M.; investigation, S.A.M.; resources, S.A.M.; writing—original draft preparation, S.A.M.; writing—review and editing, S.A.M., A.M.A.-K. and H.H.J.J.A.-D. All authors have read and agreed to the published version of the manuscript.

Funding

This research received no external funding.

Data Availability Statement

Data will be made available upon request.

Conflicts of Interest

The authors declare no conflict of interest.

References

  1. Pascu, C.I.; Gheorghe, Ş.; Rotaru, A.; Nicolicescu, C.; Cioateră, N.; Roșca, A.S.; Sârbu, D.; Rotaru, P. Ti-based composite materials with enhanced thermal and mechanical properties. Ceram. Int. 2020, 46, 29358–29372. [Google Scholar] [CrossRef]
  2. Al-Murshdy, J.M.; Al-Deen, H.H.; Hussein, S.R. Investigation of the effect of indium addition on the mechanical and electrochemical properties of the Ti–15Mo biomedical alloy. J. Bio-Tribo-Corros. 2021, 7, 148. [Google Scholar] [CrossRef]
  3. Kurup, A.; Dhatrak, P.; Khasnis, N. Surface modification techniques of titanium and titanium alloys for biomedical dental applications: A review. Mater. Today Proc. 2021, 39, 84–90. [Google Scholar] [CrossRef]
  4. Safi, I.N.; Hussein, B.M.; Al Shammari, A.M.; Tawfiq, T.A. Implementation and characterization of coating pure titanium dental implant with sintered β-TCP by using Nd: YAG laser. Saudi Dent. J. 2019, 31, 242–250. [Google Scholar] [CrossRef] [PubMed]
  5. Fang, Z.Z.; Paramore, J.D.; Sun, P.; Chandran, K.R.; Zhang, Y.; Xia, Y.; Cao, F.; Koopman, M.; Free, M. Powder metallurgy of titanium–past, present, and future. Int. Mater. Rev. 2018, 63, 407–459. [Google Scholar] [CrossRef]
  6. Ronald, G. Iacocca, Powder Metal Technologies and Applications, 9th ed.; ASTM Metals Handbook; ASM International: Almere, The Netherlands, 1984; Volume 7, pp. 541–670. [Google Scholar]
  7. Hayat, M.D.; Singh, H.; He, Z.; Cao, P. Titanium metal matrix composites: An overview. Compos. Part A Appl. Sci. Manuf. 2019, 121, 418–438. [Google Scholar] [CrossRef]
  8. James, L. Osseointegration: Its Mechanism and Recent Updates. J. Dent. Res. Pract. 2022, 4, 001. [Google Scholar]
  9. Turky, R.N.; Jassim, R.K. The Electrophoretic Deposition of Nano Al2O3 and AgNO3 on CpTi Dental Implant (An in vitro and in vivo study). J. Baghdad Coll. Dent. 2016, 28, 41–47. [Google Scholar] [CrossRef]
  10. Liang, Y.; Li, H.; Xu, J.; Li, X.I.; Li, X.; Yan, Y.; Qi, M.; Hu, M. Strontium coating by electrochemical deposition improves implant osseointegration in osteopenic models. Exp. Ther. Med. 2015, 9, 172–176. [Google Scholar] [CrossRef] [PubMed]
  11. Kashan, J.S.; Hamdan, W.K.; Fakhri, B. Bone Defect Animal Model for Hybrid Polymer Matrix Nano Composite as Bone Substitute Biomaterials. Al-Khwarizmi Eng. J. 2018, 14, 149–155. [Google Scholar] [CrossRef]
  12. Marx, D.; Yazdi, A.R.; Papini, M.; Towler, M. A review of the latest insights into the mechanism of action of strontium in bone. Bone Rep. 2020, 12, 100273. [Google Scholar] [CrossRef] [PubMed]
  13. Zhong, N.Y.; Wang, L.P. Research progress in the osteogenetic mechanism of strontium. West China J. Stomatol. 2020, 38, 697–703. [Google Scholar]
  14. Niu, Y.; Du, T.; Liu, Y. Biomechanical characteristics and analysis approaches of bone and bone substitute materials. J. Funct. Biomater. 2023, 14, 212. [Google Scholar] [CrossRef] [PubMed]
  15. Mahdi, S.M.; Hikmat, N.G.; Taha, D.Y. Studying the Microstructure of Al-Ti Alloy Prepared by Powder Metallurgy using Three Different Percentages of Ti. J. Eng. 2020, 26, 132–139. [Google Scholar] [CrossRef]
  16. Xu, Z.; Wang, Y.; Xu, R.; Hu, Q.; Shi, D.; Lu, X. Research on microstructure and properties of Ti-15Mo-3Al alloy with high oxygen content. Mater. Res. Express 2020, 7, 116528. [Google Scholar] [CrossRef]
  17. Thompson, M.K.; Moroni, G.; Vaneker, T.; Fadel, G.; Campbell, R.I.; Gibson, I.; Bernard, A.; Schulz, J.; Graf, P.; Ahuja, B.; et al. Design for Additive Manufacturing: Trends, opportunities, considerations, and constraints. CIRP Ann. 2016, 65, 737–760. [Google Scholar] [CrossRef]
  18. Balog, M.; Snajdar, M.; Krizik, P.; Schauperl, Z.; Stanec, Z.; Catic, A. Titanium-magnesium composite for dental implants (BIACOM). In TMS 2017 146th Annual Meeting & Exhibition Supplemental Proceedings; Springer International Publishing: Berlin/Heidelberg, Germany, 2017; pp. 271–284. [Google Scholar]
  19. Ibrahim, M.K.; Saud, S.N.; Hamzah, E.; Nazim, E.M. Shape memory characteristics of microwave sintered porous Ti–30 at.% Ta alloy for biomedical applications. Proc. Inst. Mech. Eng. Part C J. Mech. Eng. Sci. 2020, 234, 1979–1989. [Google Scholar] [CrossRef]
  20. Ahmed Shanan, B.; Hubi Haleem, A.; HJJamal Al-Deen, H. Corrosion Behavior of Ni Cr Mo Dental Alloy Prepared by Powder Metallurgy with Different Zirconium addition. J. Nanostruct. 2023; in press. [Google Scholar]
  21. Haynes, W.M.; Lide, D.; Bruno, T.J. CRC Handbook of Chemistry and Physics: A Ready-Reference Book of Chemical and Physical Data, 95th ed.; CRC Press: Boca Raton, FL, USA, 2015. [Google Scholar]
  22. Bevans, R. One-way ANOVA: When and how to use it (with examples). Scribbr 2022, 22, 2022. [Google Scholar]
  23. Harrell, F.E., Jr. Glossary of Statistical Terms. Department of Biostatistics, Vanderbilt University School of Medicine. Available online: https://hbiostat.org/glossary/ (accessed on 28 December 2022).
  24. Romero-Resendiz, L.; Rossi, M.C.; Seguí-Esquembre, C.; Amigó-Borrás, V. Development of a porous Ti–35Nb–5In alloy with low elastic modulus for biomedical implants. J. Mater. Res. Technol. 2023, 22, 1151–1164. [Google Scholar] [CrossRef]
  25. Sutowo, C.; Supriadi, S.; Pramono, A.W.; Suharno, B. Microstructure, mechanical properties, and corrosion behavior of new βtype Ti–Mo–Nb based alloys by Mn addition for implant material. East.-Eur. J. Enterp. Technol. 2020, 1, 103. [Google Scholar]
  26. Hulka, I.; Florido-Suarez, N.R.; Mirza-Rosca, J.C.; Saceleanu, A. Mechanical Properties and Corrosion Behavior of Thermally Treated Ti-6Al-7Nb Dental Alloy. Materials 2022, 15, 3813. [Google Scholar] [CrossRef] [PubMed]
  27. Sheremetyev, V.; Derkach, M.; Churakova, A.; Komissarov, A.; Gunderov, D.; Raab, G.; Cheverikin, V.; Prokoshkin, S.; Brailovski, V. Microstructure, mechanical and superelastic properties of Ti-Zr-Nb alloy for biomedical application subjected to equal channel angular pressing and annealing. Metals 2022, 12, 1672. [Google Scholar] [CrossRef]
  28. Eini, E.; Yousefimanesh, H.; Ashtiani, A.H.; Saki-Malehi, A.; Olapour, A.; Rahim, F. Comparing success of immediate versus delay loading of implants in fresh sockets: A systematic review and meta-analysis. Oral Maxillofac. Surg. 2021, 26, 185–194. [Google Scholar] [CrossRef] [PubMed]
  29. Istrate, B.; Munteanu, C.; Antoniac, I.V.; Lupescu, Ș.C. Current research studies of Mg–Ca–Zn biodegradable alloys used as orthopedic implants. Crystals 2022, 12, 1468. [Google Scholar] [CrossRef]
  30. De Tullio, I.; Berardini, M.; Di Iorio, D.; Perfetti, F.; Perfetti, G. Comparative evaluation among laser-treated, machined, and sandblasted/acid-etched implant surfaces: An in vivo histologic analysis on sheep. Int. J. Implant. Dent. 2020, 6, 7. [Google Scholar] [CrossRef] [PubMed]
  31. Al-Khafaji, A.M.; Hamad, T.I. Surface Analysis of the PEKK Coating on the CP Ti Implant Using Laser Technique. Int. Med. J. 2021, 28, 29–32. [Google Scholar]
  32. Ajami, E.; Fu, C.; Wen, H.B.; Bassett, J.; Park, S.J.; Pollard, M. Early bone healing on hydroxyapatite-coated and chemically-modified hydrophilic implant surfaces in an ovine model. Int. J. Mol. Sci. 2021, 22, 9361. [Google Scholar] [CrossRef]
  33. Sirdeshmukh, N.; Dongre, G. Achieving controlled topography and wettability through laser surface texturing of Ti6Al4V for bioengineering applications. Results Eng. 2023, 17, 100898. [Google Scholar] [CrossRef]
  34. Al-Asadia, Z.; Al-Hasani, F. Effect of and Deposition on Biological Behavior of Ti-Base Alloys. Eng. Technol. J. 2021, 39, 573–585. [Google Scholar] [CrossRef]
  35. Offermanns, V.; Andersen, O.Z.; Riede, G.; Sillassen, M.; Jeppesen, C.S.; Almtoft, K.P.; Talasz, H.; Öhman-Mägi, C.; Lethaus, B.; Tolba, R.; et al. Effect of strontium surface-functionalized implants on early and late osseointegration: A histological, spectrometric and tomographic evaluation. Acta Biomater. 2018, 69, 385–394. [Google Scholar] [CrossRef] [PubMed]
  36. Riedel, C.; Zimmermann, E.A.; Zustin, J.; Niecke, M.; Amling, M.; Grynpas, M.; Busse, B. The incorporation of fluoride and strontium in hydroxyapatite affects the composition, structure, and mechanical properties of human cortical bone. J. Biomed. Mater. Res. A 2017, 105, 433–442. [Google Scholar] [CrossRef] [PubMed]
Figure 1. Particle size of (a) cp titanium and (b) strontium oxide.
Jcs 07 00449 g001
Figure 2. (a) Rotating bench-top automatic ball-milling machine used to blend the powders and (b) metal containers or jars in which the powders were placed.
Jcs 07 00449 g002
Figure 3. Pressure and green density relationship.
Jcs 07 00449 g003
Figure 4. Green compact samples after compaction.
Jcs 07 00449 g004
Figure 5. Samples after sintering.
Jcs 07 00449 g005
Figure 6. Samples after polishing.
Jcs 07 00449 g006
Figure 7. XRD pattern of the prepared alloys (a) cp Ti, (b) SrO, and SrO2 as well as (c) 2%, (d) 4%, and (e) 6% Ti-SrO alloy.
Jcs 07 00449 g007aJcs 07 00449 g007b
Figure 8. SEM and porosity values for (a) Group A, (b) Group B, (c) Group C, and (d) group D.
Jcs 07 00449 g008
Figure 9. EDX mapping chemical compositions for (a) Group A, (b) Group B, (c) Group C, and (d) Group D.
Jcs 07 00449 g009aJcs 07 00449 g009b
Figure 10. Contact angle values for (a) Group A, (b) Group B, (c) Group C, and (d) Group D.
Jcs 07 00449 g010
Table 1. Percentages (in weight) of alloying elements used in research study.
GroupsPure Ti %SrO %
Group A (Ti-SrO-0) 100%0%
Group B (Ti-SrO-2)98%2%
Group C (Ti-SrO-4)96%4%
Group D (Ti-SrO-6) 94%6%
Group E (Ti-SrO-8)92%8%
Group F (Ti-SrO-10) 90%10%
Table 2. Pressure and green density relationship.
DensityPressure (ton)Pressure (mpa)
3.6359500
3.6969.9550
3.75510.8600
3.77611.7650
3.81312.6700
3.81513.5750
3.82114.4800
3.81415.3850
Table 3. Descriptive statistics of porosity for all groups.
GroupsNMeanSDSEMinMax
A1016.1480.6600.20914.99917.1006
B1020.9960.0590.01920.92321.145
C1021.8330.5580.17620.94223.0034
D1024.3720.3530.11223.96925.0014
Table 4. ANOVA analysis of porosity of all groups.
GroupsSum of SquaresdfMean SquareF Testp Value
Intergroup354.9723118.324540.4400.000
Intragroup7.882360.219
Total362.85439
Table 5. Games–Hawell analysis of porosity of all groups.
GroupsMean DifferenceSEp Value95% CI
Upper BoundLower Bound
AB−4.8480.2100.000−5.501−4.196
C−5.6850.2730.000−6.460−4.910
D−8.2230.2370.000−8.913−7.534
BC−0.8370.1770.005−1.389−0.285
D−3.3750.1130.000−3.725−3.025
CD−2.5380.2090.000−3.139−1.937
Table 6. Descriptive statistics of density for all groups.
GroupsNMeanSDSEMinMax
A103.9170.00030.00013.9173.918
B103.8810.0030.0013.8763.885
C103.8360.0030.0013.8313.841
D103.7090.0030.0013.7033.714
Table 7. ANOVA analysis of density of all groups.
GroupsSum of SquaresdfMean SquareF Testp Value
Inter-Group0.24930.08310,838.7730.000
Intra-Group0.0003360.00001
Total0.24939
Table 8. Games-Hawell analysis of density of all groups.
GroupsMean DifferenceSEp Value95% CI
Upper BoundLower Bound
AB0.0360.0010.0000.0330.039
C0.0810.0010.0000.0780.084
D0.2090.0010.0000.2050.212
BC0.0450.0010.0000.0410.049
D0.1730.0010.0000.1690.177
CD0.1270.0010.0000.1230.131
Table 9. Descriptive statistics of Brinell microhardness t for all groups.
GroupsCountSumAverageVarianceMaxMin
Group A101824182.411.37778189178
Group B101942194.27.288889199190
Group C102048204.88.622222210201
Group D102206220.64.488889224218
Table 10. ANOVA analysis of Brinell microhardness of all groups.
Source of VariationSSdfMSFp Value
Between Groups789832632.667331.38460.000
Within Groups286367.944444
Total818439
Table 11. Games-Hawell analysis of Brinell microhardness of all groups.
GroupsMean DifferenceSEp Value95% CI
Upper BoundLower Bound
AB−11.81.2610.000−15.195−8.405
C−22.41.2610.000−25.795−19.005
D−38.21.2610.000−41.595−34.805
BC−10.61.2610.000−13.995−7.205
D−26.41.2610.000−29.795−23.005
CD−15.81.2610.000−19.195−12.405
Table 12. Descriptive statistics of diametral tensile strength for all groups.
GroupsCountSumAverageVarianceMaxMin
Group A10645.64964.56493.08296968.967 Mpa62.998
Group B101023.499102.34990.999751104.254 Mpa100.754
Group C101107.064110.70642.683536114.359 Mpa108.998
Group D101820.258182.02580.553737183.003 Mpa180.921
Table 13. ANOVA analysis of diametral tensile strength for all groups.
Source of VariationSSdfMSFp Value
Between Groups72,145.86324,048.6213,141.330.000
Within Groups65.87994361.829998
Total72,211.7439
Table 14. Games–Hawell analysis of diametral tensile strength of all groups.
GroupsMean DifferenceSEp Value95% CI
Upper BoundLower Bound
AB−38.3700.3170.000−39.357−37.382
C−46.7260.5180.000−48.344−45.109
D−118.0460.2360.000−118.781−117.311
BC−8.3570.6070.000−10.107−6.606
D−79.6760.3940.000−80.799−78.553
CD−71.3190.5690.000−72.997−69.641
Table 15. Descriptive statistics of microroughness for all groups.
GroupsCountSumAverageVarianceMaxMin
Group A108.970.897 um0.0008680.95 um0.86 um
Group B1012.661.266 um0.0070491.43 um1.12 um
Group C1016.131.613 um0.0023791.71 um1.55 um
Group D1019.221.922 um0.0016181.99 um1.87 um
Table 16. ANOVA analysis of microroughness content for all groups.
Source of VariationSSdfMSFp Value
Between Groups5.8641731.954723656.31450.000
Within Groups0.10722360.002978
Total5.9713939
Table 17. Games–Hawell analysis of microroughness of all groups.
GroupsMean DifferenceS.E.p Value95% CI
Upper BoundLower Bound
AB−0.3690.0240.000−0.435−0.303
C−0.7160.0240.000−0.782−0.650
D−1.0250.0240.000−1.091−0.959
BC−0.3470.0240.000−0.413−0.281
D−0.6560.0240.000−0.722−0.590
CD−0.3090.0240.000−0.375−0.243
Table 18. Descriptive statistics of contact angle values for all groups.
GroupsCountSumAverageVarianceMaxMinSD
Group A10864.94286.49423.89898589.09182.9831.974585
Group B10733.77573.37751.3844175.66771.9891.17661
Group C10612.35561.23550.52260562.63360.3390.722914
Group D10507.92450.79240.5119452.02150.1880.7155
Table 19. ANOVA analysis of contact angle values for all groups.
Source of VariationSSdfMSFp Value
Between Groups7128.10432376.0351504.310.000
Within Groups56.86146361.579485
Total7184.96539
Table 20. Games–Howell analysis of contact angle values of all groups.
GroupsMean DifferenceSEp Value95% CI
Upper BoundLower Bound
AB13.1170.7270.00011.01615.217
C25.2590.6650.00023.26827.249
D36.0210.6360.00034.06437.978
BC12.1420.4370.00010.88313.401
D22.9040.3910.00021.72524.083
CD10.7620.2580.00010.01011.515
Disclaimer/Publisher’s Note: The statements, opinions and data contained in all publications are solely those of the individual author(s) and contributor(s) and not of MDPI and/or the editor(s). MDPI and/or the editor(s) disclaim responsibility for any injury to people or property resulting from any ideas, methods, instructions or products referred to in the content.