Article

Preparation of a Novel Nanostructured Lead Titanate Composite Photocatalyst and Its Degradation of Organic Dyes under Visible Light

Department of Chemical and Materials Engineering, National Yunlin University of Science and Technology, 123 University Road, Section 3, Douliou 64002, Taiwan
*
Author to whom correspondence should be addressed.
J. Compos. Sci. 2023, 7(10), 434; https://doi.org/10.3390/jcs7100434
Submission received: 5 September 2023 / Revised: 27 September 2023 / Accepted: 6 October 2023 / Published: 13 October 2023
(This article belongs to the Section Nanocomposites)

Abstract

:
Photocatalytic dye degradation is an energy-saving, environmentally friendly and sustainable way of managing potentially toxic wastewater from the textile industry. PbTiO3 was prepared using a solid-state reaction method, and an optimal ratio of PbTiO3/TiO2/g-C3N4 photocatalyst was synthesized using the sol-gel method to test its ability to decompose organic dyes. Methylene blue (MB) was selected as a target dye to test the photocatalytic effects. SEM results showed that the synthesis of a PbTiO3/TiO2/g-C3N4 photocatalyst yielded a unique nano structure with many surface pores. UV-Vis analysis demonstrated that the novel composite photocatalyst had higher visible light absorption, and a reduced energy gap. Experimental results showed that of the samples tested, PTO/TO/CN 1.0 showed the best photocatalytic effect on the removal of MB. Under visible light, the removal rate of MB by PTO/TO/CN 1.0 was up to 98.79%. The novel PTO/TO/CN 1.0 photocatalyst exhibited relatively high MB adsorption and had a high photocatalytic ability.

1. Introduction

Rapid global growth and industrialization have drawn attention to issues associated with supporting an increasing population, such as water pollution. Water quality and availability have a significant impact on human health, but certain areas of human development are detrimental to the supply of potable drinking water, including synthetic dyes from the textile industry, used in printing and dyeing and leather and paint manufacturing. All of these industries continue to grow in size and scope, but the textile industry stands out as a major consumer of water and producer of colored wastewater, leading to significant water pollution [1,2,3]. In addition to this, the government response to recent global health events led to a massive increase in the demand for printed surgical masks, leading to even greater levels of water pollution [4].
Currently, the environmental risks associated with industrial wastewater discharge remain a highly pressing concern. Consequently, there is a global push to actively promote awareness of the recycling, purification, and reuse of industrial wastewater. Numerous types of dyes have been used for coloring products, but to meet color requirements, highly water-soluble and reactive organic dyes are used which leads to approximately 10–20% of the dye being washed out in the final product cleaning stages. This byproduct is not consumable by humans, is harmful to ecosystems, and in some cases is carcinogenic or mutagenic [4,5].
Approximately 80% of the dye wastewater generated by the textile industry dyeing process is discharged into the environment with no pretreatment. The impact from dye run-off is not only direct, but also absorbed by animals and plants, potentially causing indirect harm to human health. Methylene blue (MB) is a commonly used basic dye in cotton fabric production, and it is known to be harmful to the human body [6,7]. Various methods have been employed to remove MB from factory wastewater, but so far photocatalytic oxidation is the most cost-effective. This approach utilizes light absorption via a photocatalyst to initiate a photocatalytic reaction to induce dye degradation, which reduces the need to expend additional energy [8].
A photocatalyst is a catalyst capable of absorbing light energy and converting it into chemical energy to enable a catalytic reaction. When a photocatalyst absorbs light from the sun, or any other light source, electrons in the valence band absorb the light energy and transition to the conduction band. This transition results in the creation of electron–hole pairs because electrons tend to move to the surface of the photocatalyst while leaving behind holes in their original positions [9,10]. The separated electron–hole pairs can then subsequently migrate to the surface of the photocatalyst. On the surface, these separated electrons and holes undergo a redox reaction, and when adsorbed onto pollutants they initiate a degradation process, removing the pollutant [11].
Lead titanate (PbTiO3) perovskites possess several notable properties, including piezoelectricity, ferroelectricity, and giant magnetoresistance. As a material, they can be easily prepared using a simple and rapid solid-mixing method, and many researchers adopt this approach when exploring various PbTiO3 applications. PbTiO3 is commonly utilized as a P-type semiconductor in solar cells, but other transition metal oxides with Pb2+ ions also have the ability to absorb visible light due to their small energy gap and high conductivity, making them ideal for use in solar cells [6,12,13]. Due to the these properties, PbTiO3 is also well-suited for use as a tool to degrade organic pollutants via light catalysis [14,15,16]. For example, Shulan Wang et al. [17] have incorporated g-C3N4 into PbTiO3 using a hydrothermal method, and g-C3N4 can build a heterostructure and achieve effective charge separation, thereby enhancing the photocatalytic activity. However, the photocatalytic activity of PbTiO3 is hindered by mismatches in material functions [18,19].
Titanium dioxide (TiO2) nanomaterials can be applied in a variety of industrial fields, such as catalysis, separation, sensors, paints, and dye-sensitized solar cells (DSSCs) [20,21]. TiO2 exists in three crystal forms: anatase, rutile, and brookite. Among these, the anatase variety exhibits a small energy gap of 3.2 eV, and has a smaller grain size which can enhance dye loading [22,23]. The selective epitaxial growth of overlapping TiO2 on the cathode is a technique that reduces (or in some cases eliminates) the barrier of PbTiO3, decreasing the energy gap of the photocatalyst and enhancing visible light absorption [24].
Graphitized carbonitrides are synthesized through the polyaddition and polycondensation of precursors containing carbon and nitrogen atoms. g-C3N4 can be prepared easily via thermal polymerization. Initially, urea forms a melamine structure, and this structure then undergoes polymerization to create a stable polymer structure as the temperature increases. At a certain temperature, polyaddition and polycondensation reactions occur, resulting in sheet-like and graphite-like carbon nitride structures [25]. Also, as documented in the literature, graphitic carbonitrides synthesized from different precursors tend to show variations in surface charge and specific surface area, which in turn can affect their ability to adsorb organic dyes [26,27]. Of the possible synthesis approaches, the graphitized carbonitride synthesized from a urea precursor demonstrates the highest specific surface area and dye adsorption capacity [28]. Furthermore, Ya-Nan Li et al. [29] have successfully prepared porous g-C3N4/TiO2 with a multi-level heterostructure by introducing a g-C3N4 sheet-like surface structure during the synthesis of TiO2. It was found that the heterostructure in the sample accelerates the effective separation of photo-generated electrons and holes. This strategy presents a new approach to construct and develop novel and unusual semiconductor metal oxide structures on two-dimensional materials, exhibiting high photocatalytic activity for the degradation of organic pollutants.
P25, a commercially available photocatalyst, is primarily composed of titanium dioxide. Although widely used in the market, P25 requires ultraviolet light irradiation to demonstrate its best photocatalytic result. For this reason, it is impractical for most indoor applications. To further reduce this limitation, however, PbTiO3 and g-C3N4 may be mixed with TiO2 to enhance the photocatalytic activity under visible light and improve adsorption efficiency. The photocatalytic activity of a PbTiO3 and g-C3N4 mix may effectively decompose organic wastewater more effectively under visible light conditions.

2. Experimental Section

2.1. Materials

Ethanol was purchased from the Taiwan Sugar Corporation, Tainan, Taiwan. Titanium (IV) isopropoxide (TTIP, 98 wt %), sodium nitrate, and isopropyl alcohol (IPA) were obtained from Sigma-Aldrich Chemical Co., St. Louis, MO, USA. Acetic acid was bought from J.T. Baker Chemical, Phillipsburg, NJ, USA. Methylene blue (MB) was acquired from Fluka-Sigma-Aldrich, St. Louis, MO, USA. Titanium dioxide nanopowder (anatase rutile = 4:1; 21 nm, P25) was procured from UniRegion Bio-Tech, Taoyuan, Taiwan. Lead (II) oxide (PbO) extra pure was procured from Scharlau, Barcelona, Spain.

2.2. Testing Equipment

A UV-Visible Spectrophotometer (UV-Vis, V-630) was procured from JASCO Inc., Tokyo, Japan (wavelength range of 800–200 nm). The Field Emission Scanning Electron Microscope (FE-SEM, JSM-6701F) was procured from JEOL Ltd., Tokyo, Japan (Image magnification 2000, 5000, and 10,000 times). An X-ray Diffractometer (XRD, MiniFlex II) was procured from Rigaku, Tokyo, Japan (2θ range of 80°–10°). The Fourier Transform Infrared Spectroscopy system (FT-IR, Spectrum One and Auto magic) was acquired from Perkin Elmer, Waltham, MA, USA (wavenumber range of 4000–450 cm−1). The Specific Surface Area and Porosimetry Analyzer (BET, ASAP 2060) was obtained from Micromeritics, Norcross, GA, USA (analysis adsorptive: N2, equilibration interval: 10 s, pressure range of 760–10 mmHg).

2.3. Preparation of Lead Titanate Photocatalyst

To prepare the PbTiO3 optimally, a solid-state reaction was used. Initially, 1 g of PbO powder and 1 g of TiO2 (P25) powder were placed in a self-made ball mill. The powders were ground and mixed evenly by the collision of the balls within the ball mill. The resultant mixture was transferred to an alumina crucible. The alumina crucible containing the mixture was subjected to calcination. The heating rate during calcination was 10 °C/min−1. The crucible was heated to different temperatures, specifically 700 °C, 800 °C, 900 °C, and 1000 °C, and each temperature was maintained for 2 h. The product was split into four distinct samples according to their calcined temperatures, i.e., 700 °C PTO, 800 °C PTO, 900 °C PTO, and 1000 °C PTO, respectively, where “PTO” refers to their PbTiO3 constituent.

2.4. Preparation of Graphitic Carbon Nitride

Graphitic carbon nitride (g-C3N4) was prepared via thermal polymerization. First, 5 g urea powder was placed in an alumina crucible, and the crucible was covered with a lid. To prevent the leakage of urea gas, the entire crucible was again covered with a layer of aluminum foil. The crucible containing the urea powder was subjected to a controlled heating process, whereby the temperature was gradually increased in a calciner at a heating rate of 10 °C/min until 550 °C. Once 550 °C was obtained, that temperature was maintained for 4 h, until complete thermal polymerization of the urea had occurred. Post thermal treatment, the crucible was cooled to room temperature, resulting in the formation of graphitic carbon nitride.

2.5. Preparation of the PbTiO3/TiO2/g-C3N4 Photocatalyst

The PbTiO3/TiO2/g-C3N4 composite photocatalyst was synthesized using the sol-gel method. The degradation experiment showed that the photodegradation effect of PTO at 1000 °C was superior to other PTO samples. The synthesis process involved several steps; first, a clear solution was prepared by mixing 6 mL of titanium (IV) isopropoxide and 8 mL of acetic acid. The mixture was stirred for 15 min. Subsequently, 6 mL of acetic acid was added, and the mixture was stirred for 5 h. Then, 2 g, 1 g, 0.6 g, or 0.2 g of PbTiO3, together with 5 mL of distilled water, was added to the solution. The resulting mixture was stirred overnight. The solvent was removed with the mixture placed in a vacuum oven at 80 °C. The remaining powder was ground and transferred into an aluminum crucible. Following this, the powder was wrapped with aluminum foil. The crucible was placed into a segmented furnace, and the temperature was raised to 450 °C at a heating rate of 10 °C/min. The calcination process was carried out for 2 h. After cooling, the composite photocatalysts were obtained and their weight ratios of PbTiO3 to TiO2 were recorded as 1 PTO/TO, 0.5 PTO/TO, 0.3 PTO/TO, and 0.1 PTO/TO. The weight of TiO2 without PbTiO3 was 2 g.
Based on drop experiments, it was determined that the optimal weight ratio of g-C3N4 doping was 0.3 PTO/TO. To prepare this composite, 6 mL of titanium (IV) isopropoxide and 8 mL of acetic acid were mixed for 15 min to obtain a clear solution. Then, 2 g, 1 g, 0.6 g, or 0.2 g of g-C3N4 was gradually added to the 6 mL of acetic acid and stirred for 5 h. Subsequently, 5 mL of distilled water and 0.6 g of PbTiO3 were added, and the mixture was stirred overnight. The mixture was placed in a vacuum oven at 80 °C to remove the solvent. The obtained powder was poured into an aluminum crucible and wrapped in aluminum foil. The crucible was placed in a segmented furnace and heated to 450 °C at a heating rate of 10 °C/min. The composite photocatalysts were named PTO/TO/CN (2), PTO/TO/CN (1), PTO/TO/CN (0.6), and PTO/TO/CN (0.3), corresponding to different g-C3N4 weights added to the 0.3 PTO/TO composite photocatalyst.

2.6. Characterizations

2.6.1. Characterization of the Photocatalyst

Laboratory instruments were utilized to measure and identify the synthesized photocatalyst properties, according to the temperature at which they were synthesized, the differing PTO/TO weight ratios, and the PTO/TO/CN with various g-C3N4 weights. The surface topography was characterized using field emission scanning electron microscopy (FE-SEM), the crystalline structure and composition were confirmed using an X-ray diffractometer (XRD), and the d-spacing and grain size D were calculated using Bragg’s law and Scherrer’s formula. FT-IR identification of the sample functional groups was used to determine whether there was a new bond. UV-Vis was utilized to analyze the photocatalyst visible light absorption and calculate the energy gap. The specific surface area of the photocatalyst and nitrogen adsorption–desorption processes were analyzed using BET, to understand the adsorption capacity.

2.6.2. Dye Adsorption and Photocatalytic Degradation Experiments

In this experiment, methylene blue (MB) was used as a model dye to compare the adsorption and photocatalytic degradation of P25 (a commercially available photocatalyst), with TiO2, PbTiO3, and the photocatalysts with various ratios of PTO/TO, PTO/TO/CN. To use the photocatalyst, 0.01 g of photocatalyst powder was mixed with 10 mL of 10 ppm MB in a 20 mL sample bottle with a stirring magnet. The photocatalyst absorbed MB in the dark for 0.5 h, and then a T25 visible light tube was used to trigger photodegradation for 2.5–3 h, with readings being taken every 0.5 h. After the adsorption period in the dark, and photodegradation in visible light, the solutions were centrifuged at 7000 rpm for 7 min. Subsequently, the photocatalyst and clarified MB solutions were examined to determine any MB concentration changes in the resultant solution using UV-Vis.

3. Results and Discussion

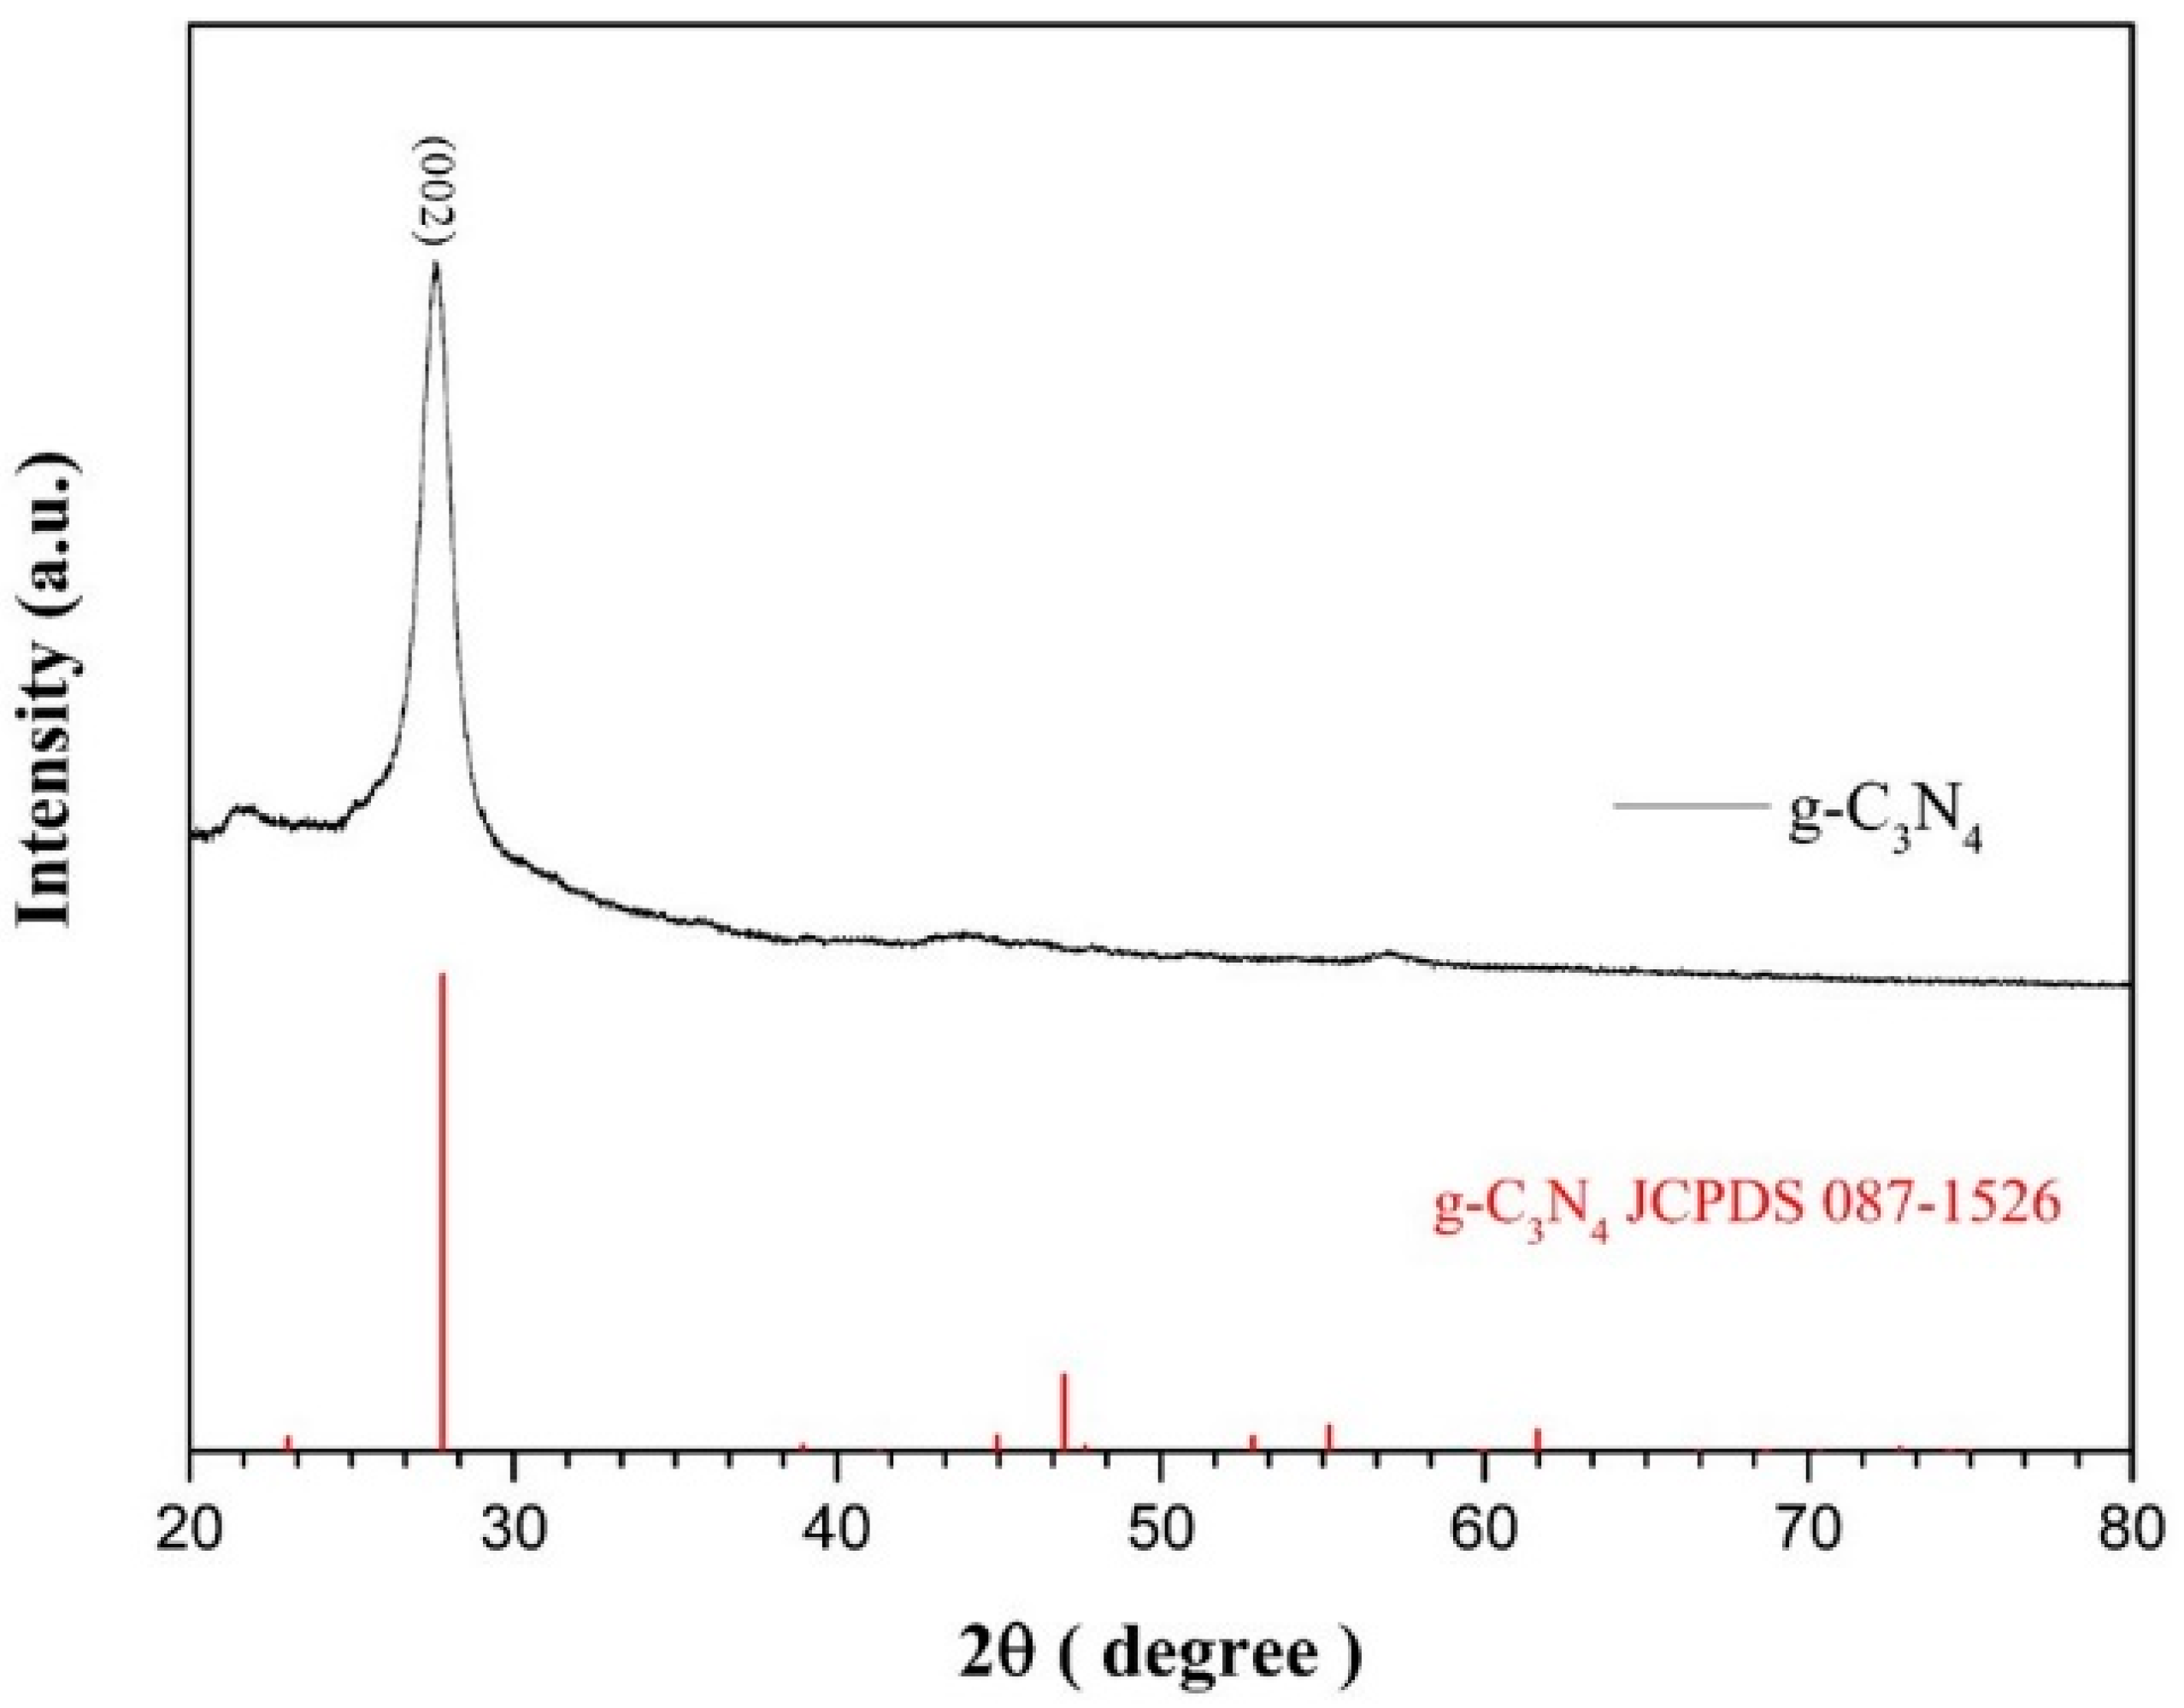
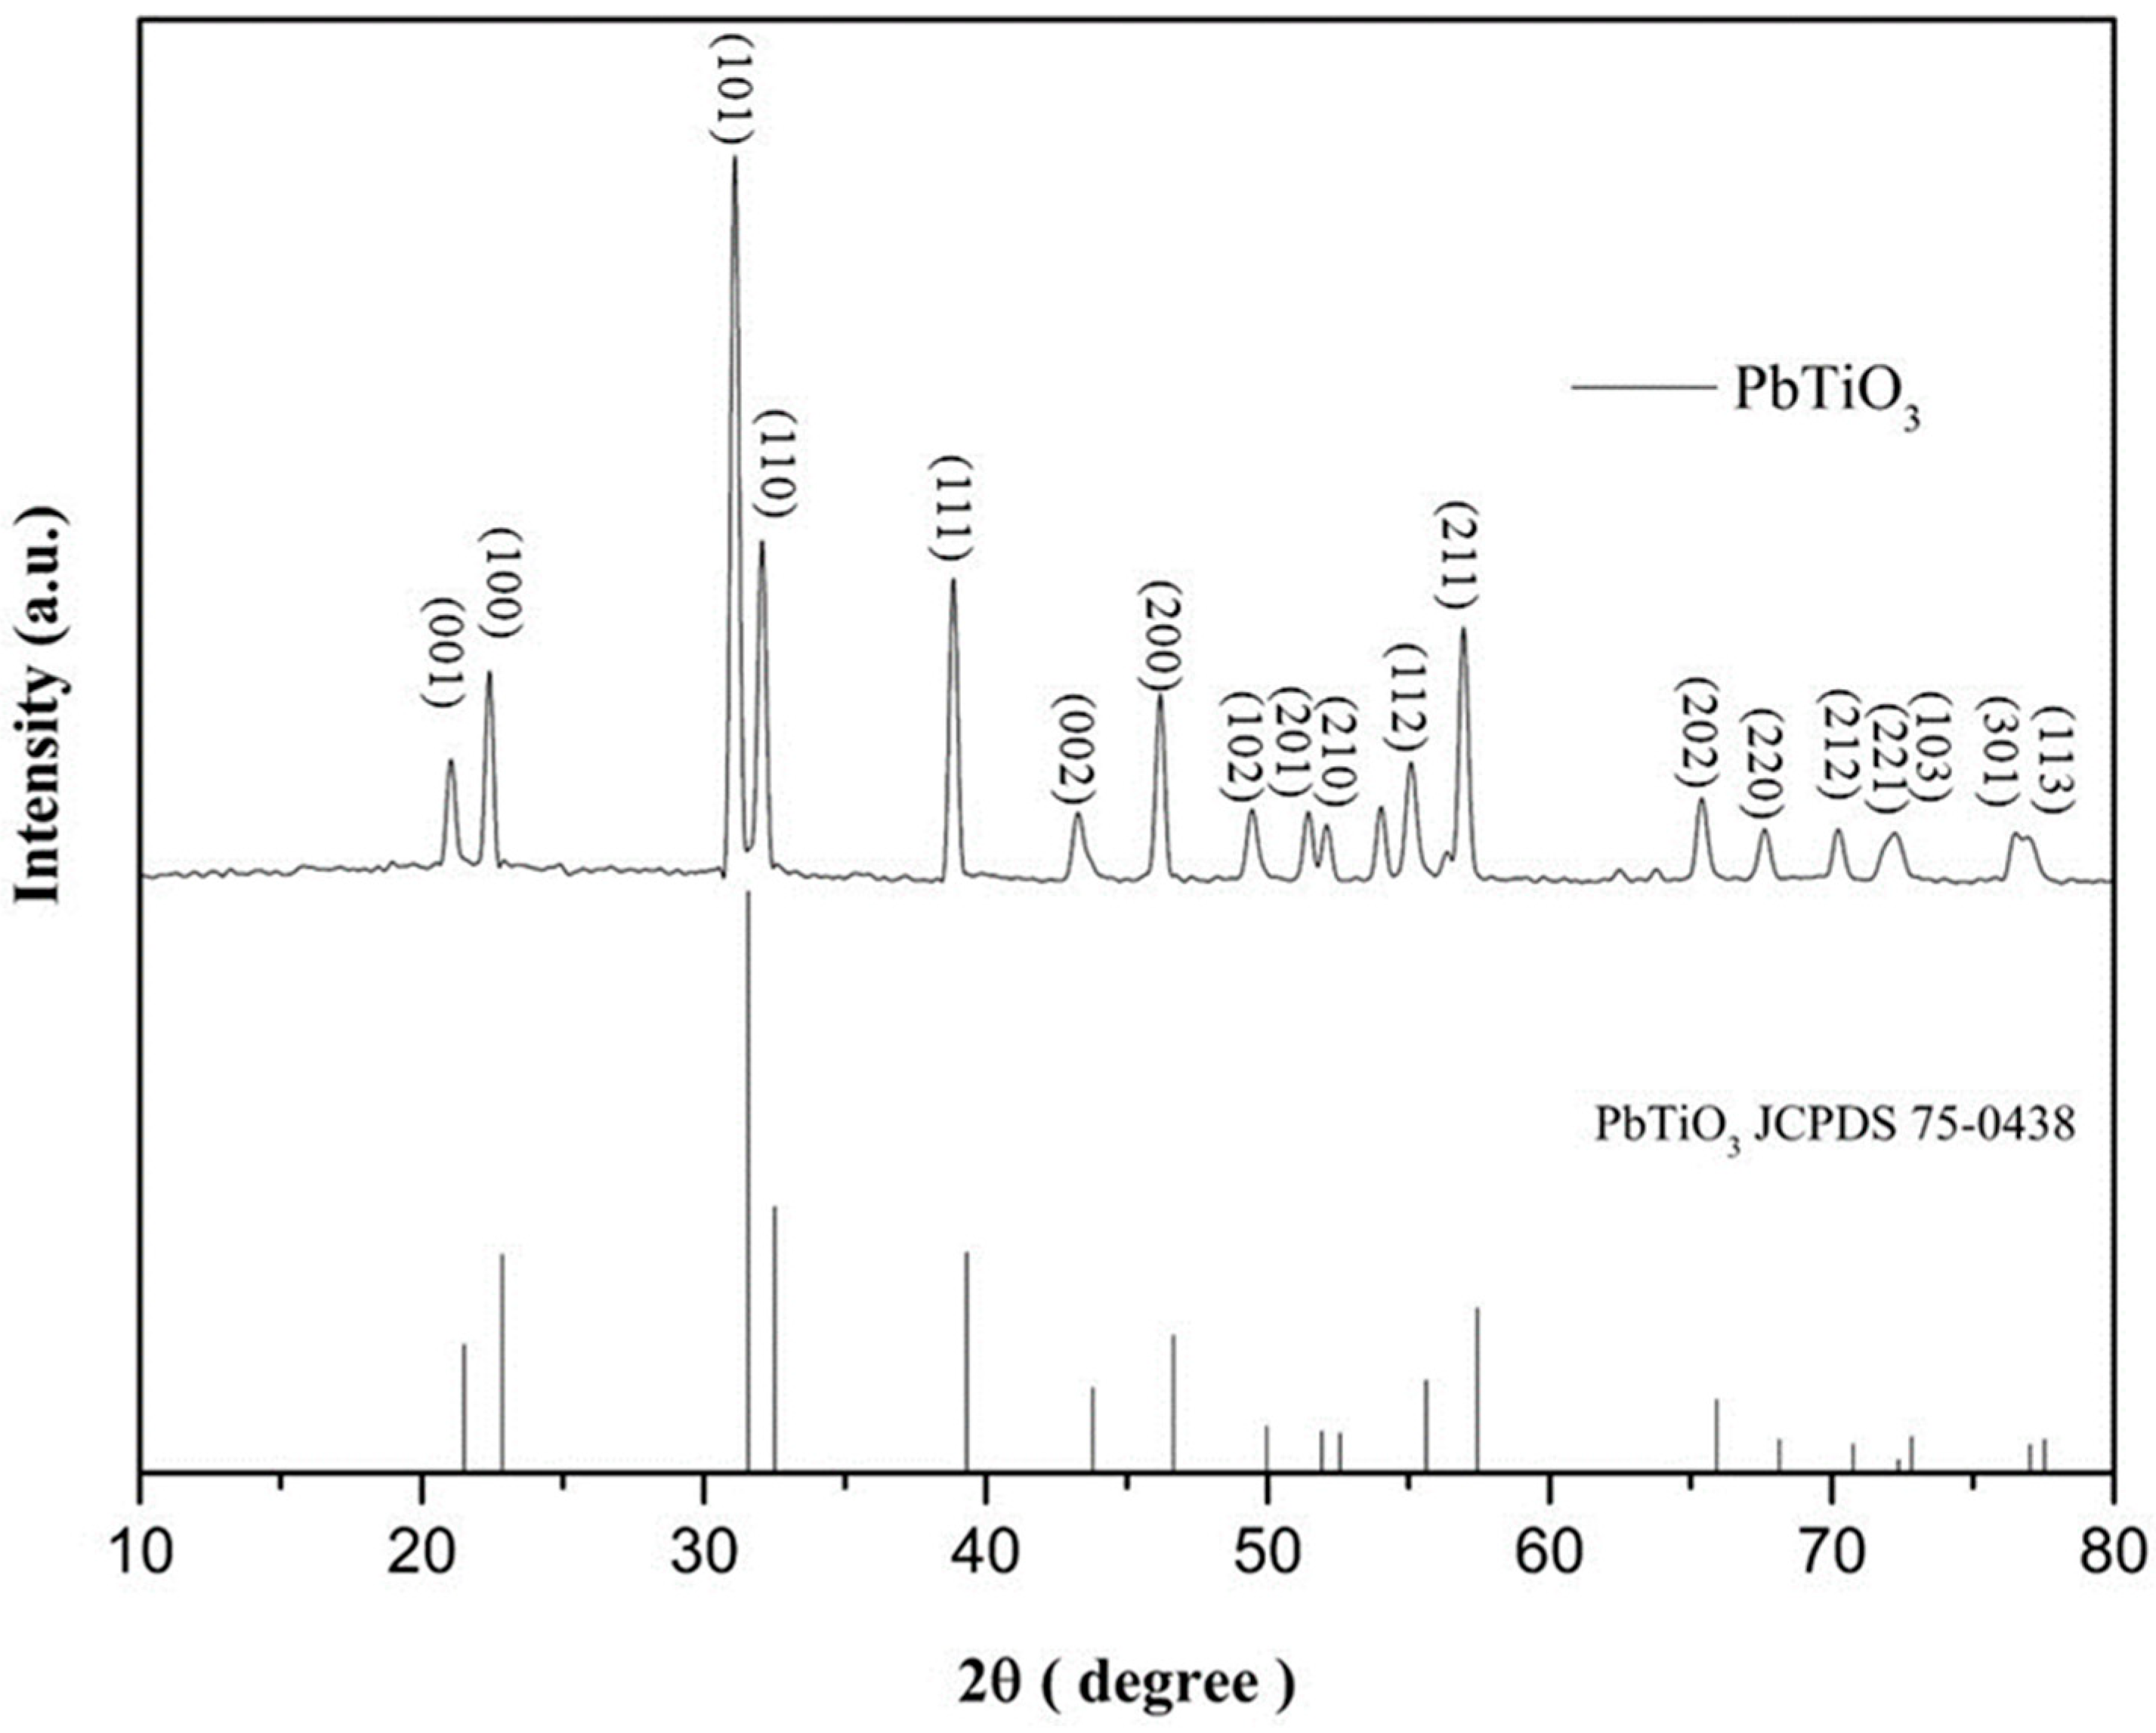
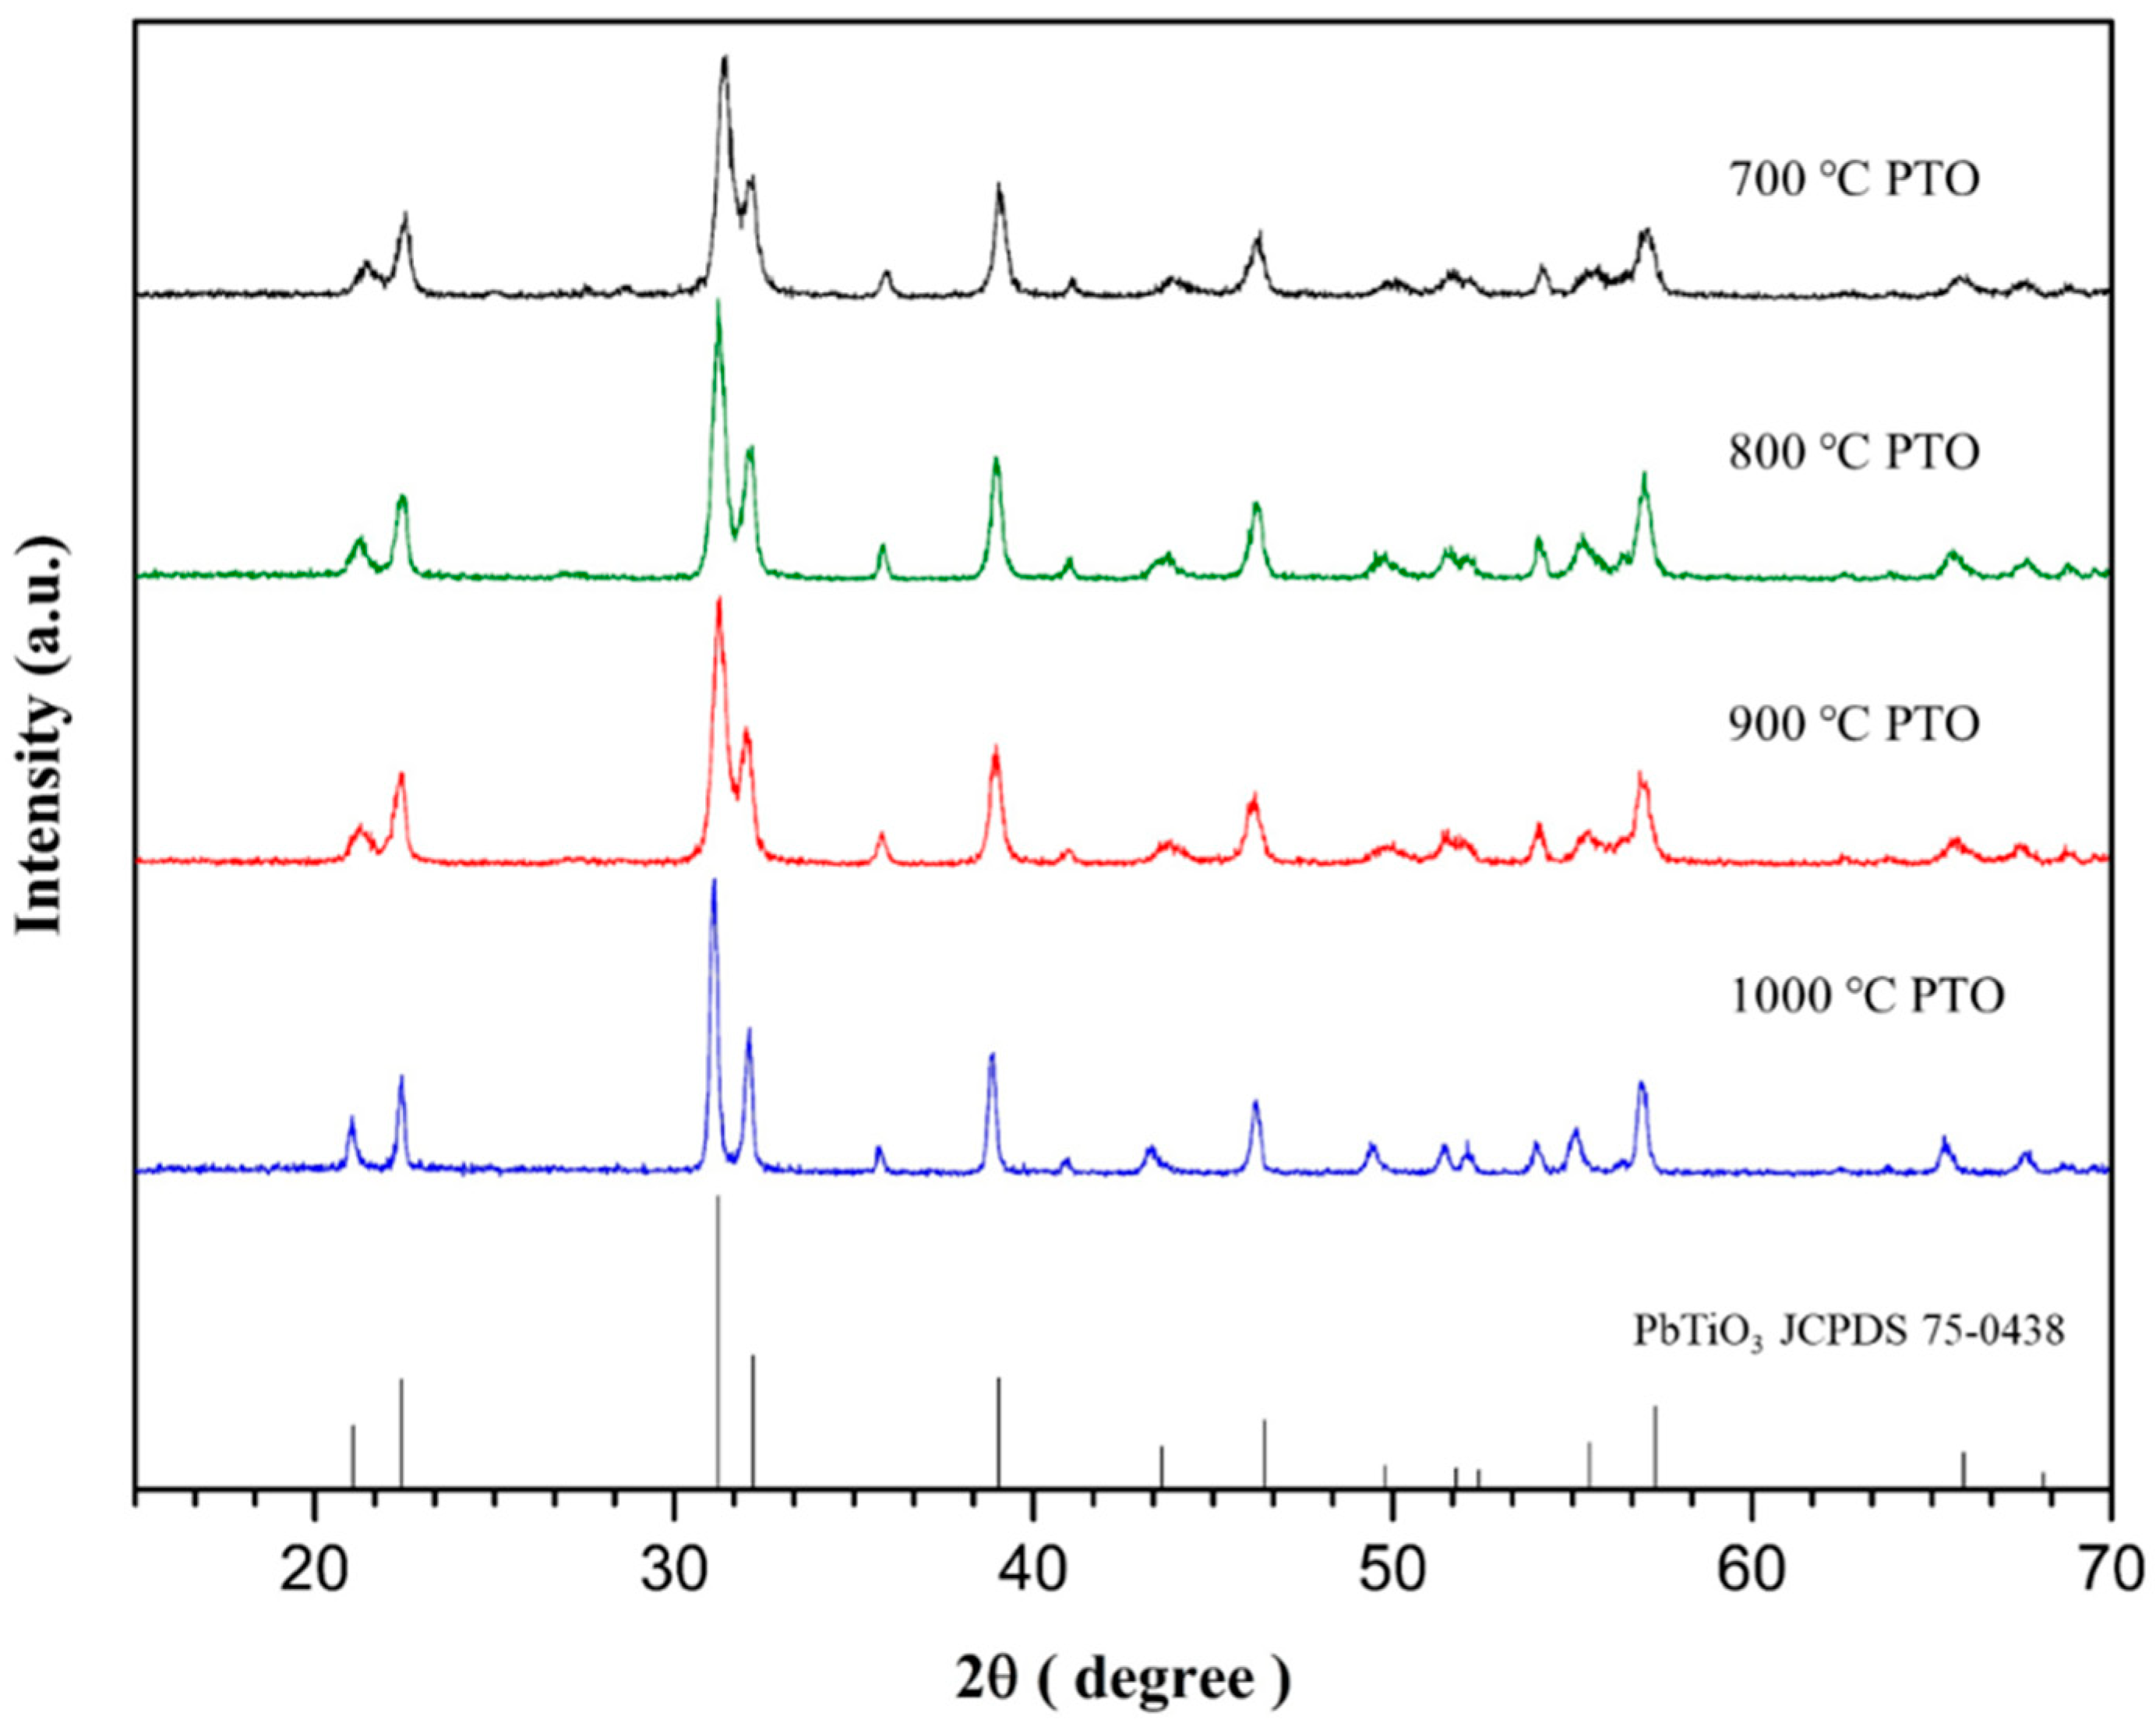
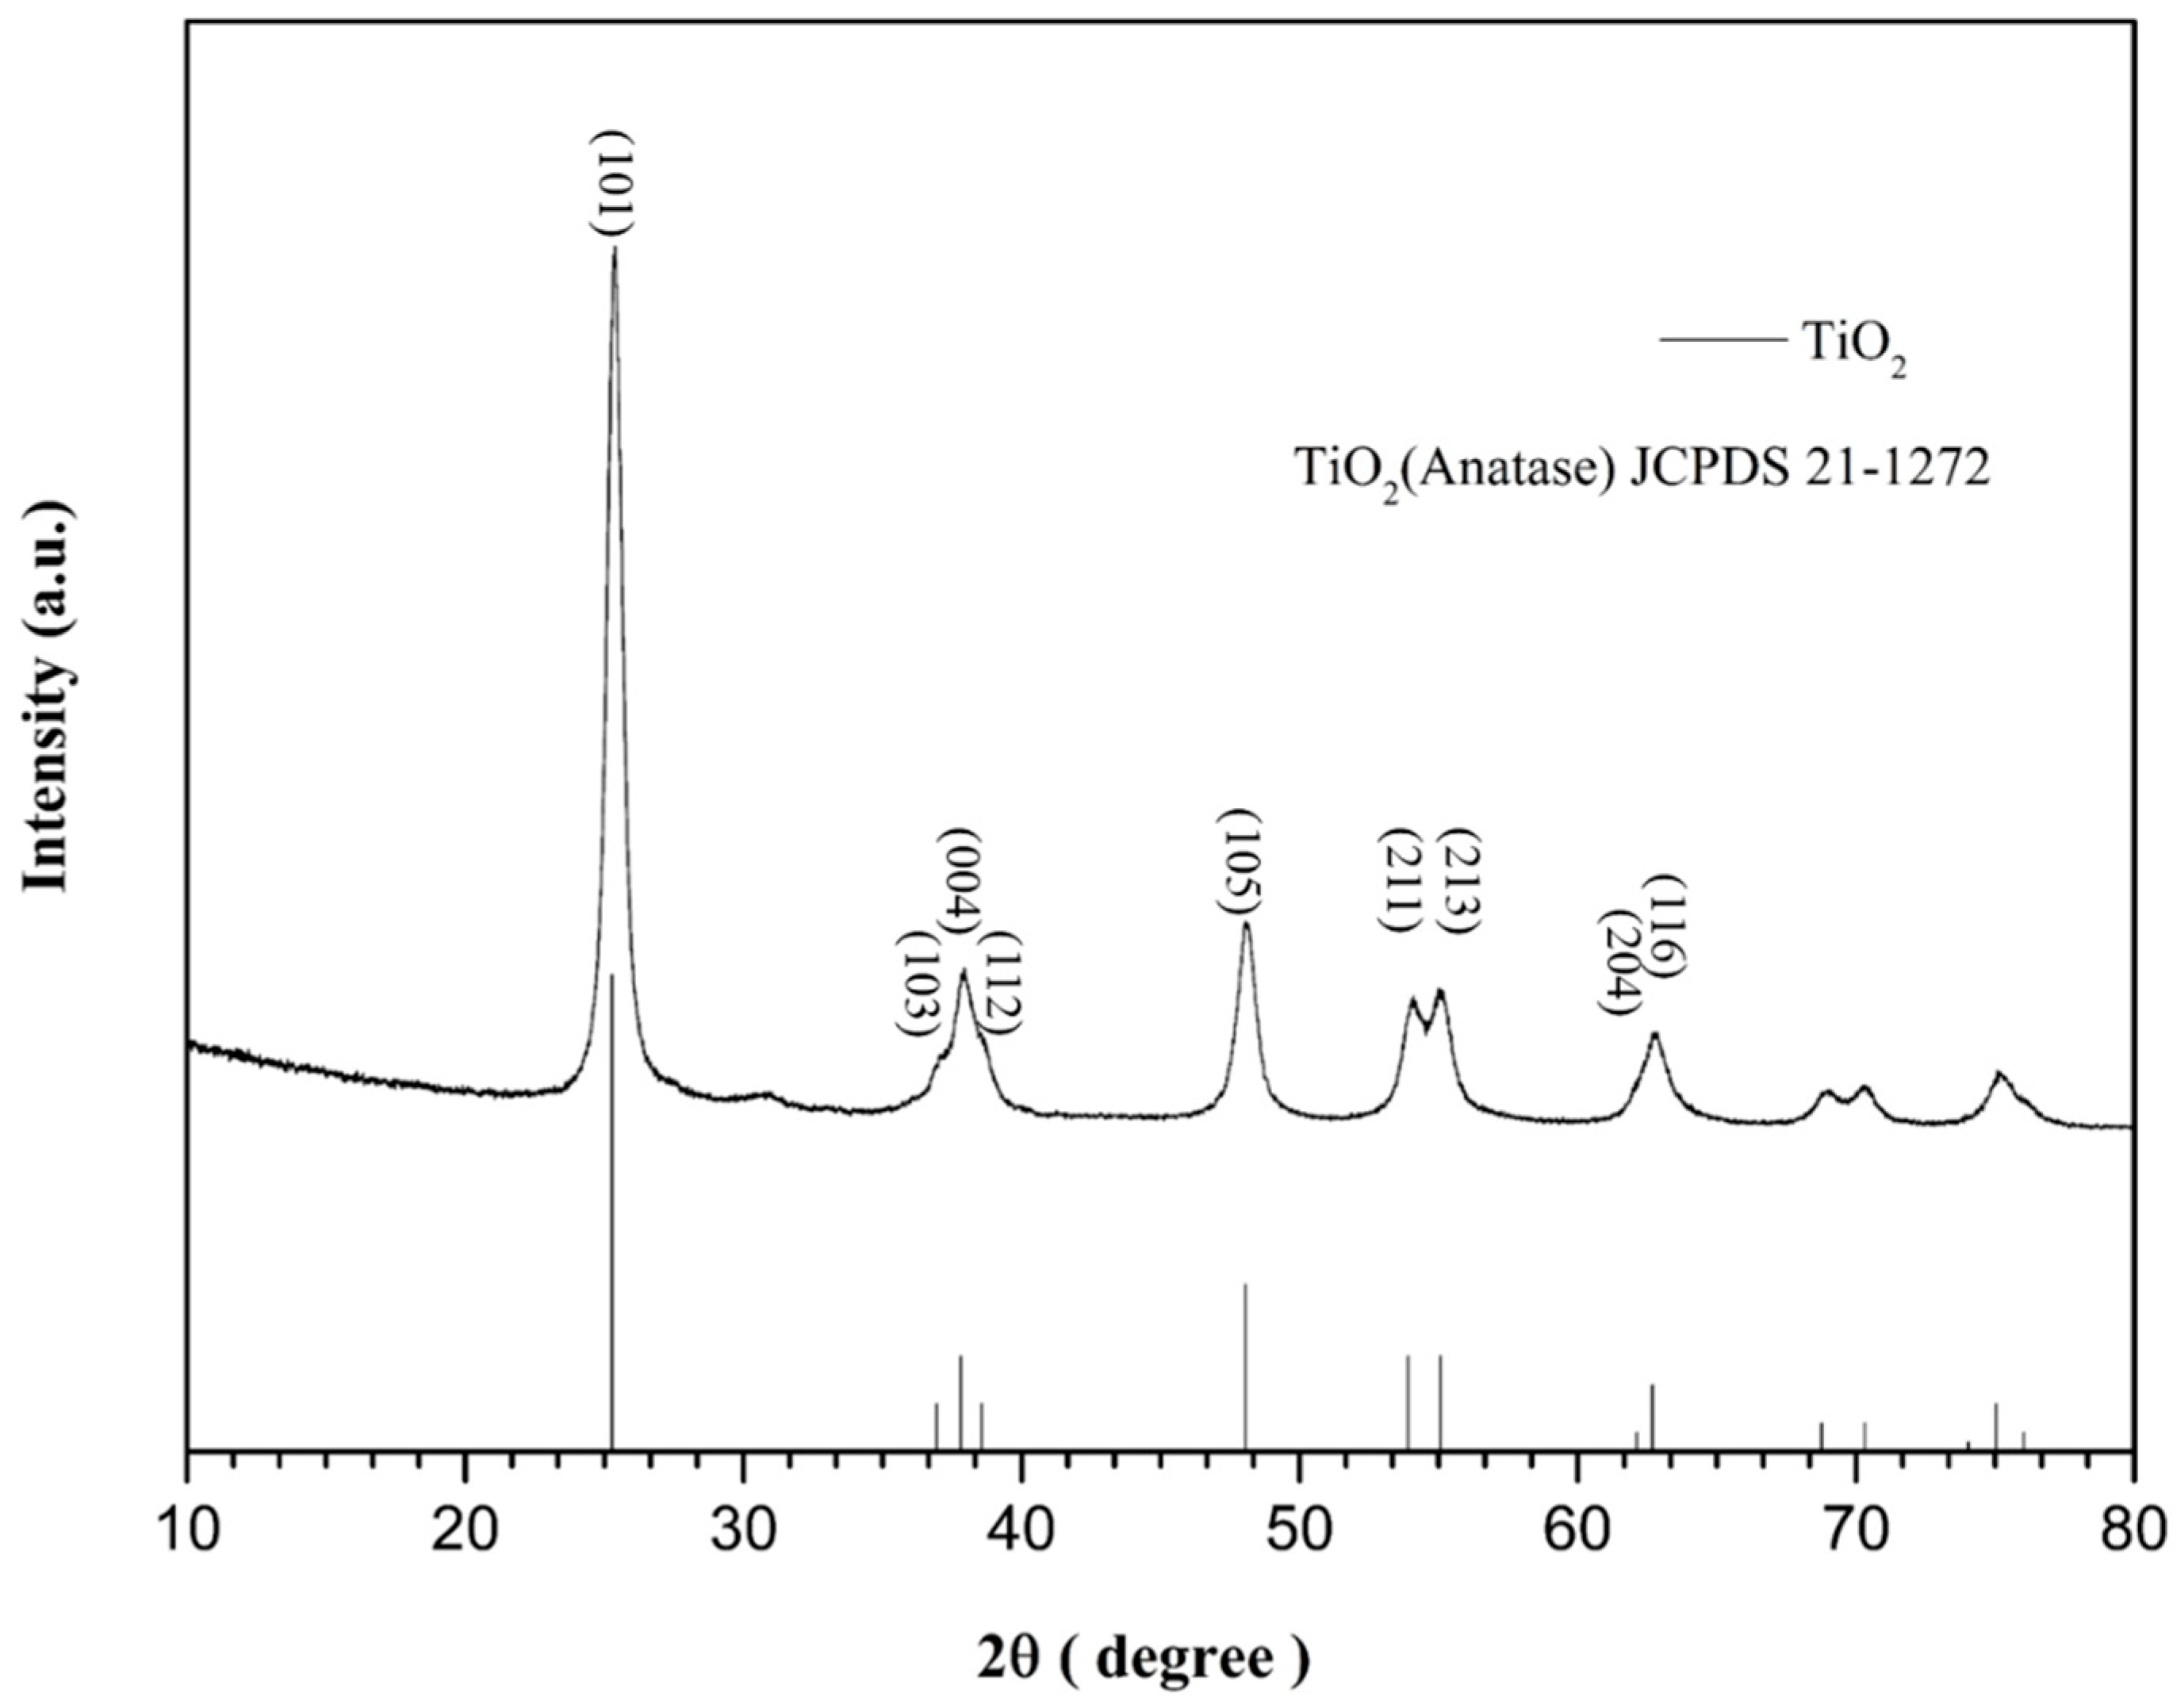
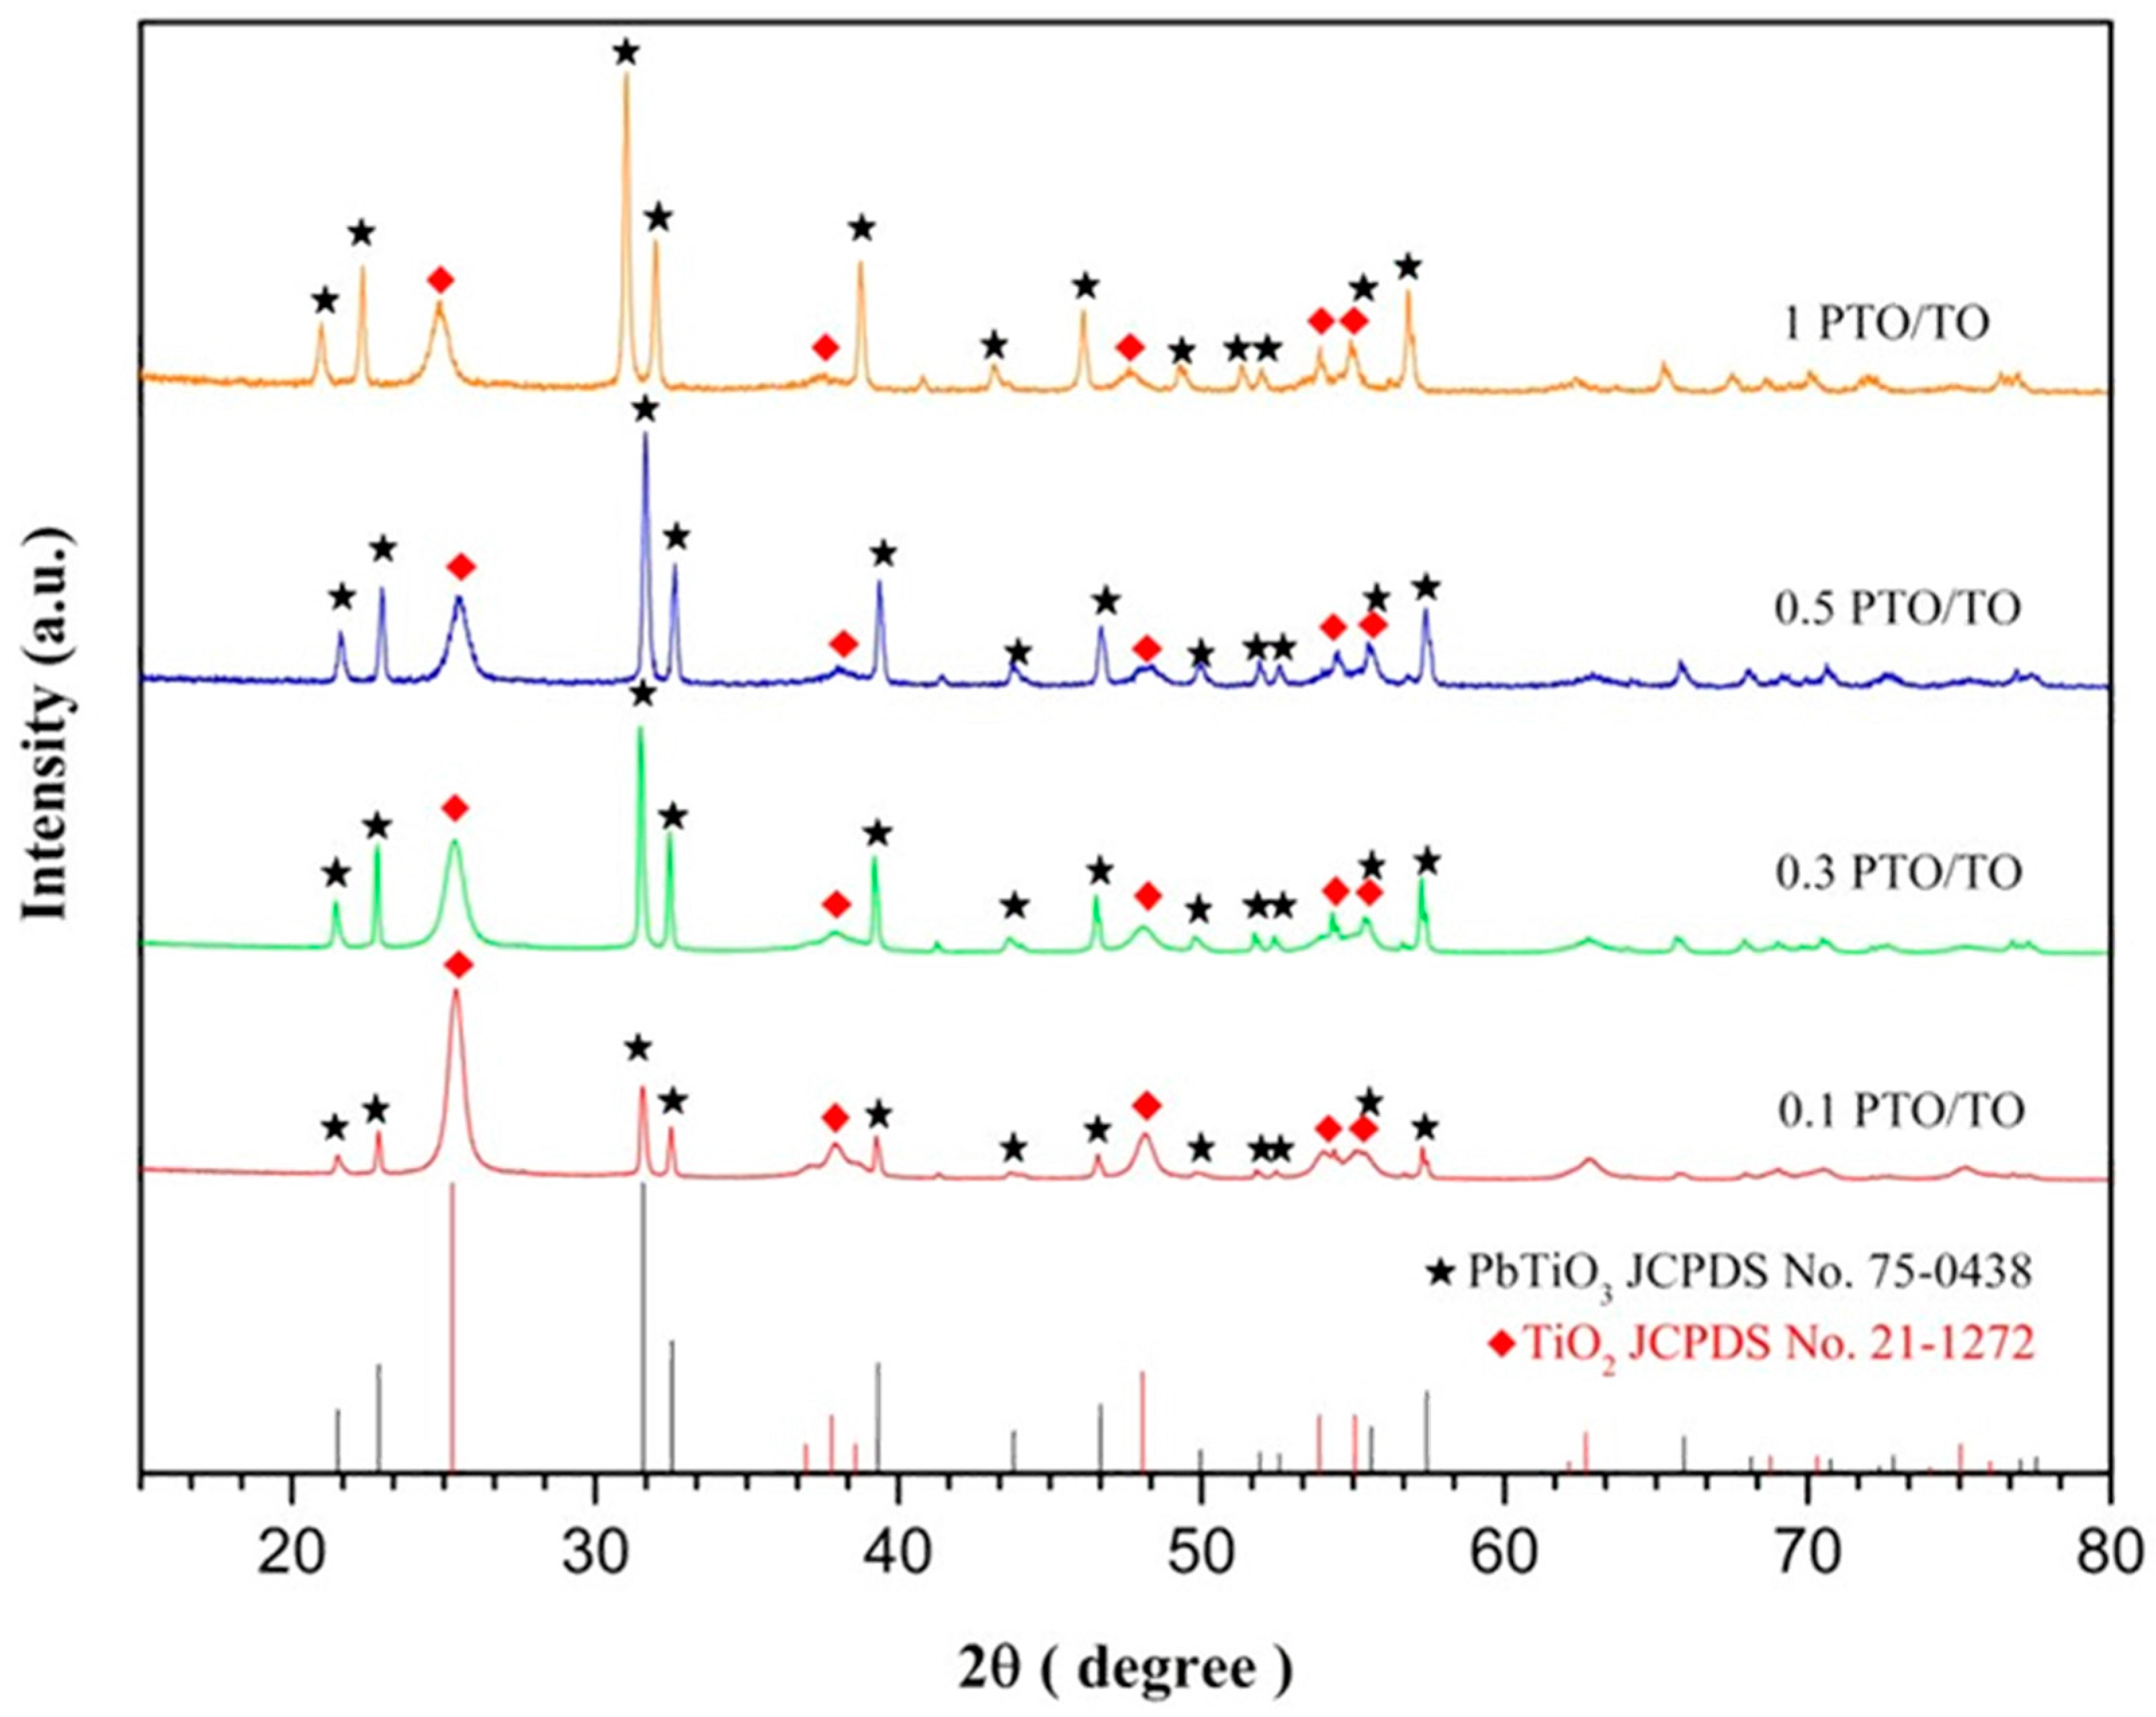
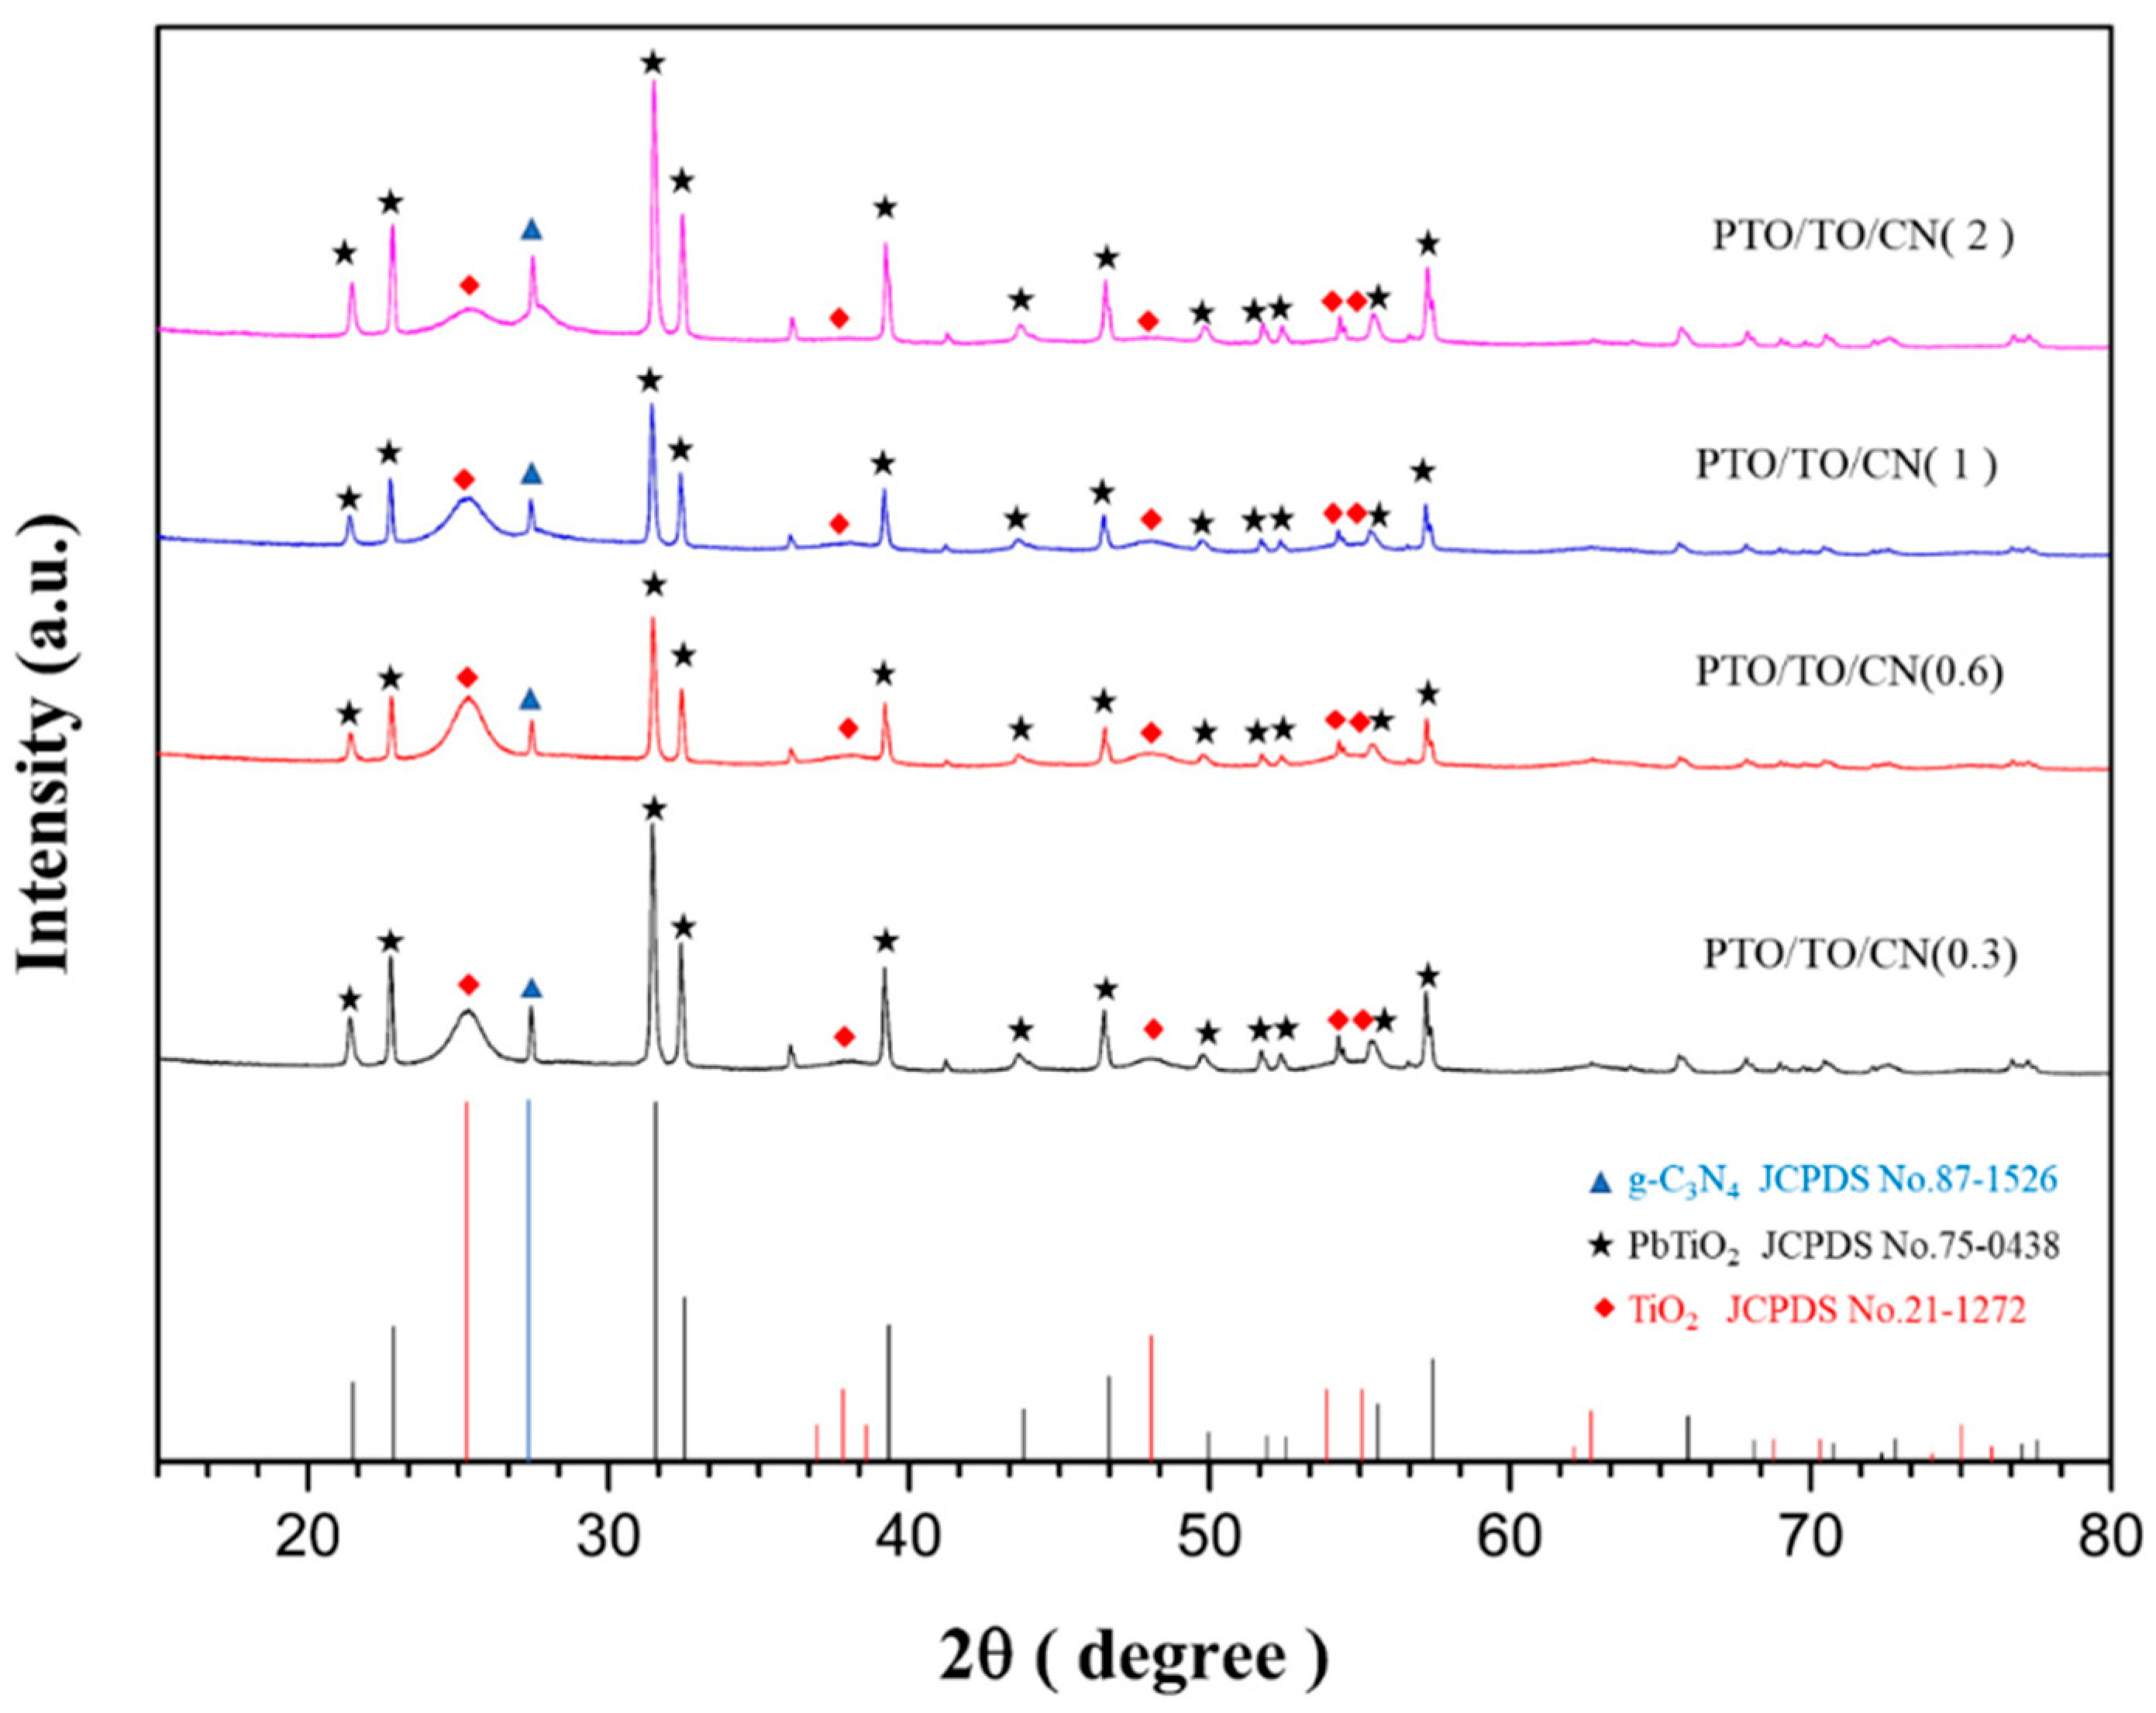
3.1. X-ray Diffractometer (XRD)

When preparing the PbTiO3, the solid mixing method was used followed by chemical sintering synthesis at different temperatures. The higher the temperature, the better the combination of PbO and TiO2. The XRD pattern shown in Figure 1 shows that the PbTiO3 was successfully synthesized, as the data related closely to the standard card JCPDS No.75-0438 [30]. A change in crystallization caused by temperature is also observable. In Figure 2, the peak appears narrower where the calcination temperature is higher, especially between 31.57° and 32.52°, suggesting that the PbTiO3 crystal may be larger when the temperature is higher.
In this study, the inter-planar d-spacing of the crystal was calculated using Bragg’s law, and the crystal grain size was calculated via the Scherrer equation. Bragg’s law in Equation (1) and the Scherrer equation in Equation (2) were adopted from the literature. In the equations, d is the inter-planar d-spacing, θ is the diffraction angle radian, λ is the wavelength of the X-rays, ΔW is the full-width at half-maximum, and D is the size of the crystal grain.
2 d   sin   θ =   n   λ
D   = ( 0.9 × λ ) / ( Δ W ×   cos   θ )
The calculations were first conducted for the PbTiO3 calcined at different temperatures, by the formula for crystals with an orientation (101). When the temperature was higher, the PbO and TiO2 combination formed larger particles and the sintering effect was the strongest, and the particles were the largest, at 1000 °C, as shown in Table 1.
The XRD diffraction peak area was used to calculate the relative crystallinity (Xc) of the pure (control) sample. Generally, the total area (Atotal) was obtained through the integration of the strongest diffraction peak being used as an indicator for the calculation made with the crystallinity, and the non-crystalline integral curve (Am) was deducted for comparison, and the crystallinity formula was calculated as shown below. It can be seen from Table 2 that as the calcination temperature increased, the crystallinity also increased.
Crystallinity = (Atotal − Am)/Atotal × 100%
Several authors in the literature have already shown that the addition of PbTiO3 to anatase TiO2 can effectively improve the photocatalytic activity [24]. This study used the sol-gel method to prepare the anatase TiO2. The XRD peaks of the TiO2 are shown in Figure 3, and the centers of the 2θ peaks were located at 25.281°, 36.947°, 37.801°, 38.576°, 48.049°, 53.890°, 55.060°, 62.690°, and 68.762°, respectively, which corresponded to the crystal orientations of (101), (103), (004), (112), (200), (105), (211), (213), (204), and (116). Compared to the standard card JCPDS No.21-127, this indicates that the anatase TiO2 was synthesized correctly [31].
Different weights of 1000 °C PTO were added to the TiO2 using the sol-gel method to obtain different ratios of PbTiO3/TiO2. The XRD peaks were examined to characterize the product. Comparing the study result with the two standard cards, TiO2 JCPDS No.21-127 and PbTiO3 JCPDS No.75-0438, as shown in Figure 4, it can be seen that the PbTiO3/TiO2 was successfully prepared [30,31]. Because various amounts of PbTiO3 will impact the TiO2 grain size, it was necessary to calculate the TiO2 grain sizes for the 2θ peak at 25°, representing crystal orientation (101). The TiO2 grain size of 0.3 PTO/TO was the smallest, as shown in Table 3. We speculate that when the weight ratio of PbTiO3 and TiO2 is 0.3:1, PbTiO3 may inhibit the growth of TiO2 grains, so the D value of 0.3 PTO/TO is the smallest.
g-C3N4 was successfully synthesized via polycondensation, as confirmed by comparing the XRD peaks with the standard card JCPDS No.98-1526, observing a characteristic peak at 26.5°, as shown in Figure 5 [32].
Different amounts of g-C3N4 were added to PbTiO3/TiO2 via the sol-gel method to synthesize a series of new PTO/TO/CN photocatalysts with different g-C3N4 weight ratios. Again, XRD peaks were obtained to characterize the product, and the results were compared with the standard JCPDS card, as shown in Figure 6. Adding different g-C3N4 weights could also affect the growth of the TiO2 grain. As before, the grain size of TiO2 was calculated for the 2θ peak at 25°, representing crystal orientation (101). The more g-C3N4 that was added, the smaller the TiO2 grain size was likely to be, as shown in Table 4.

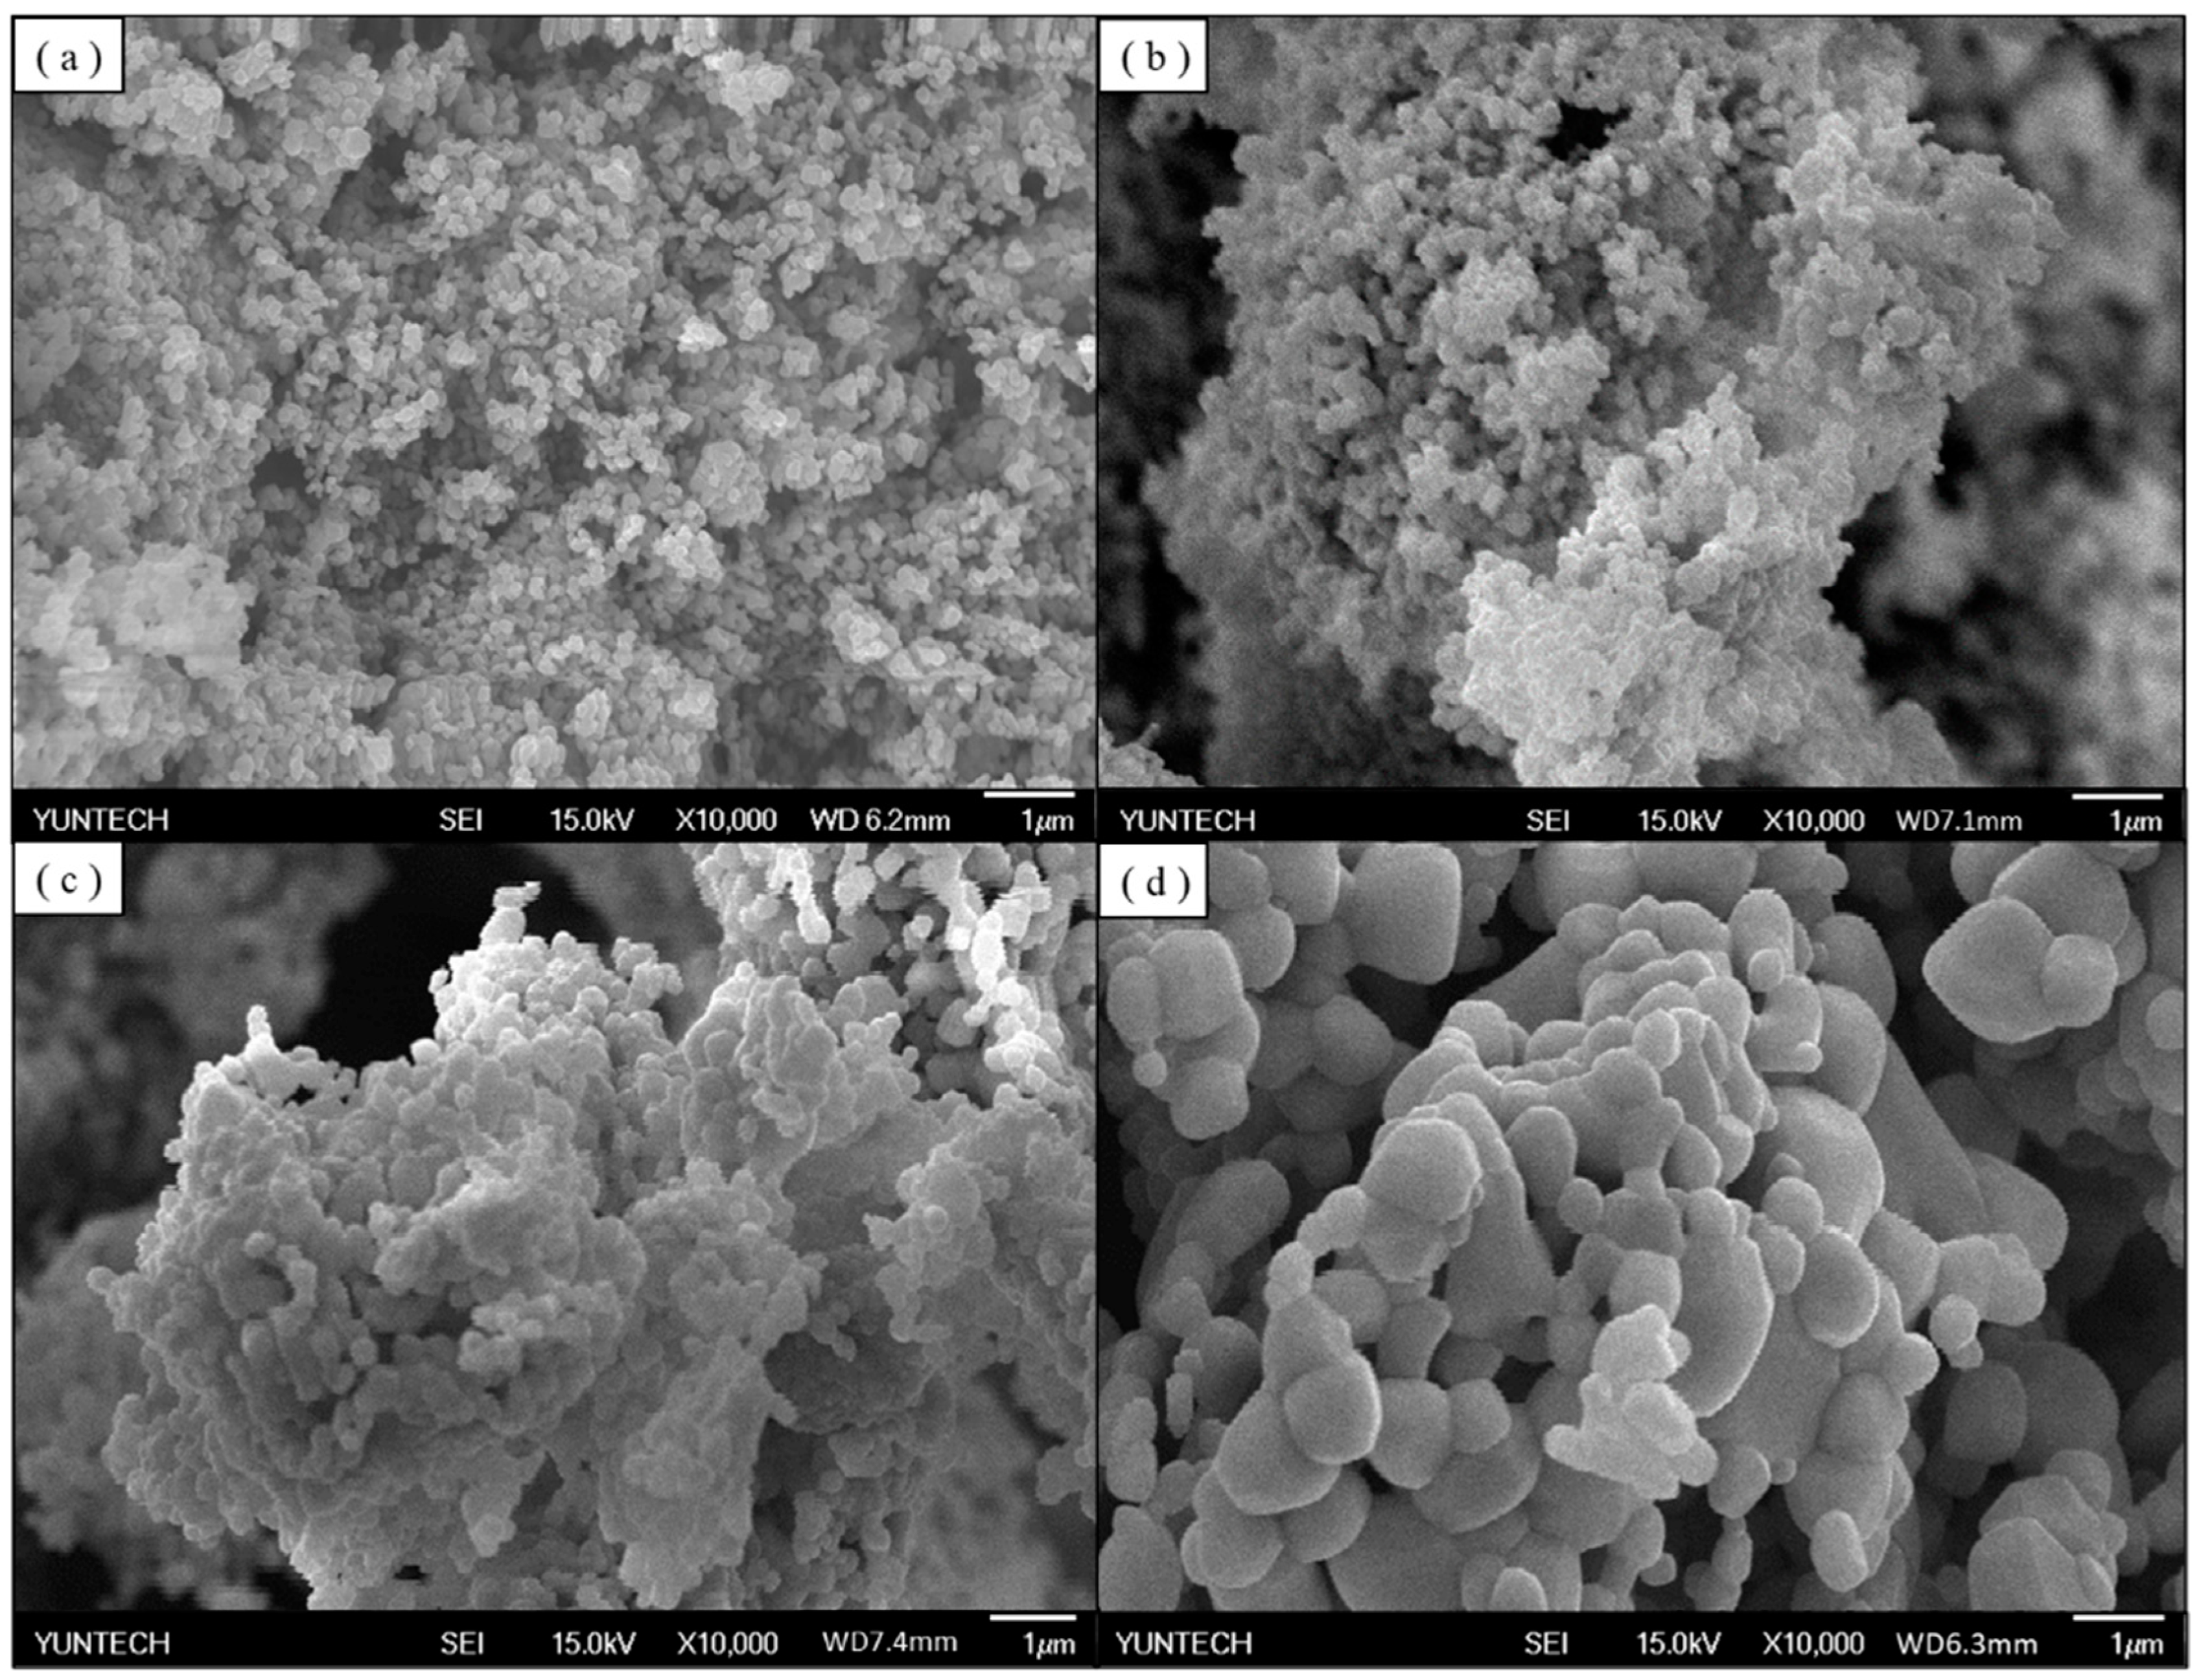
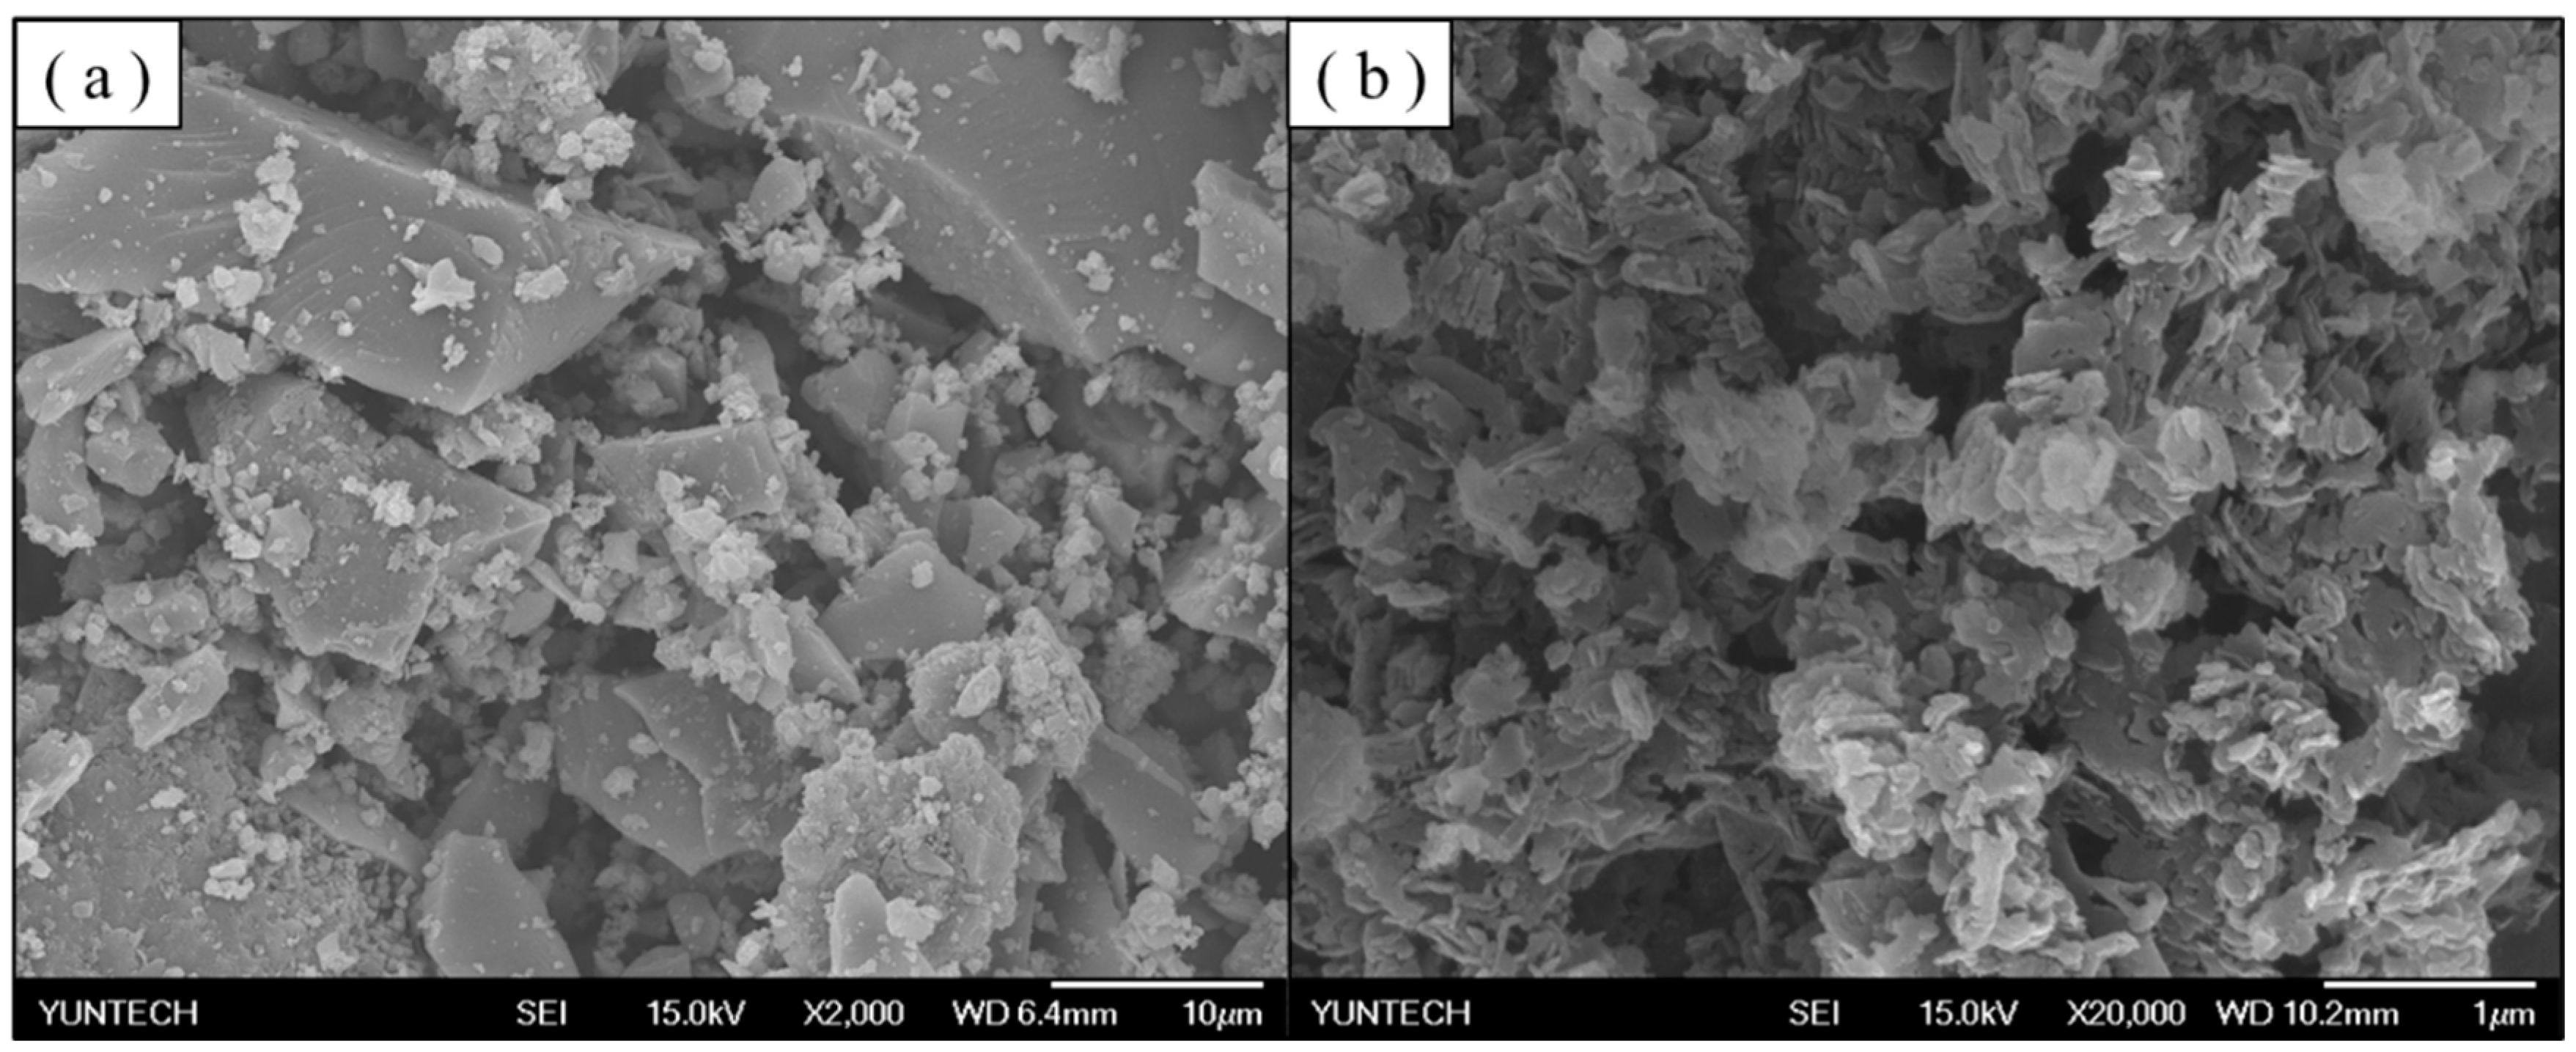
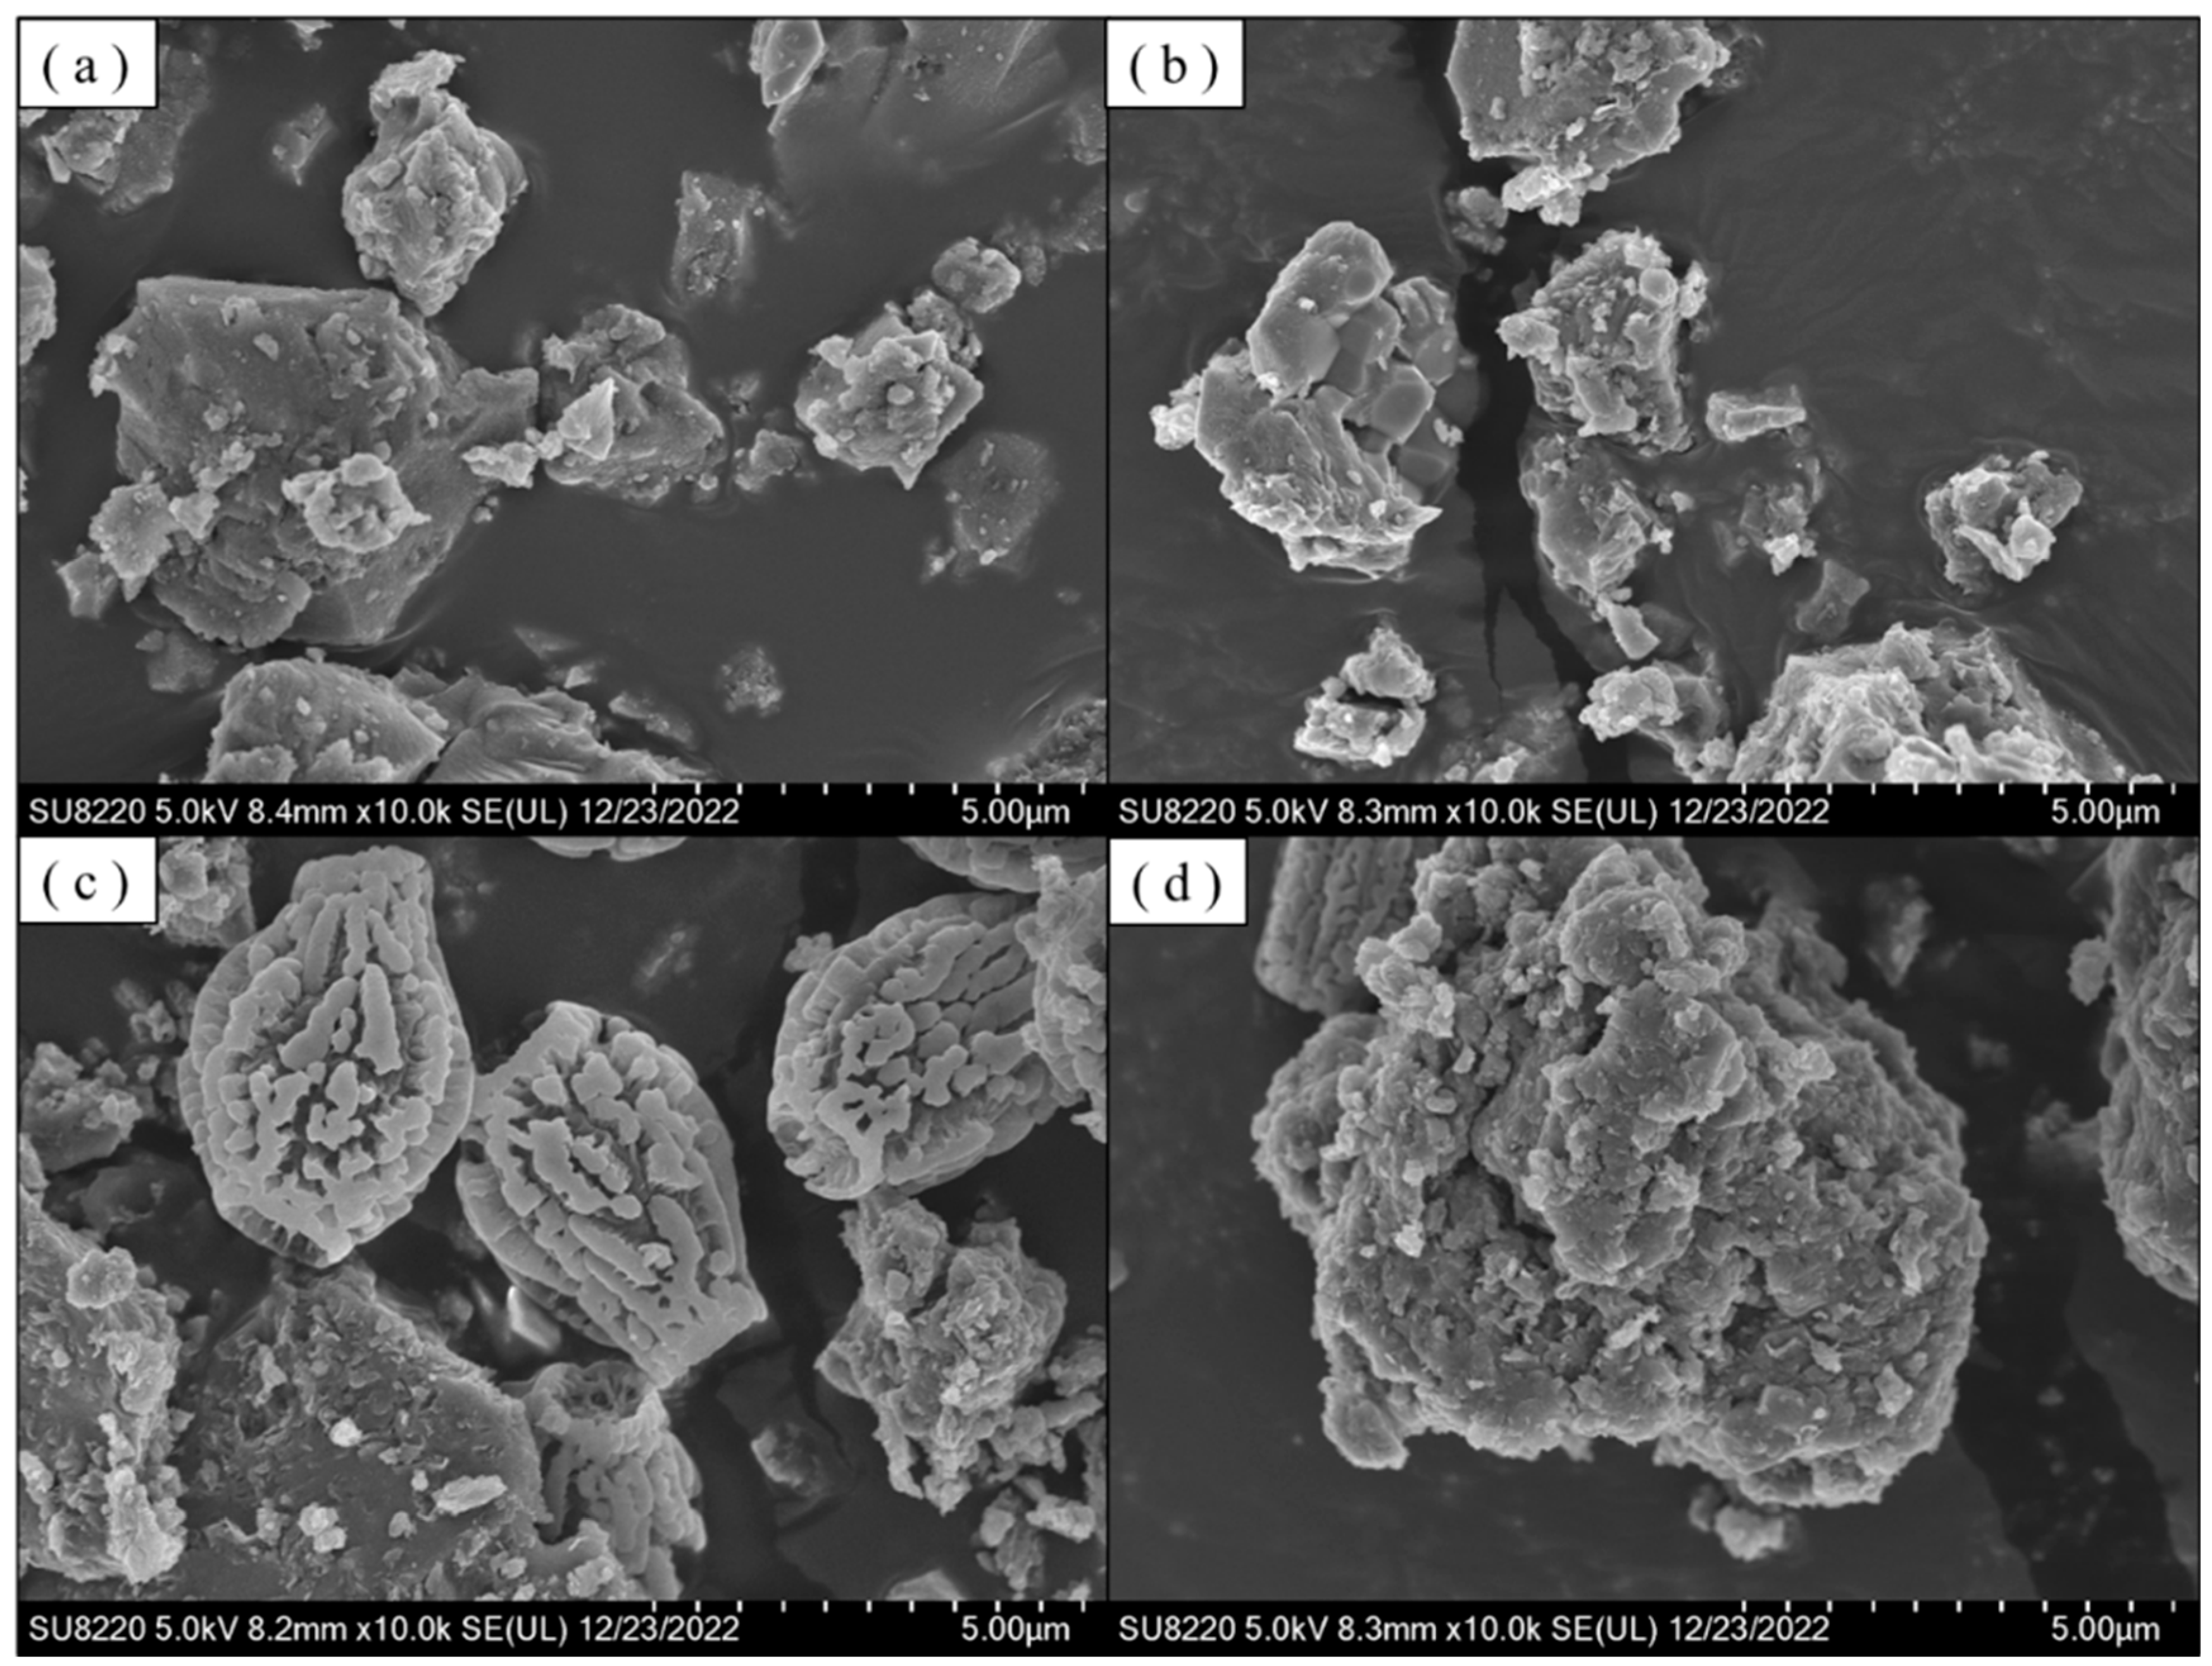
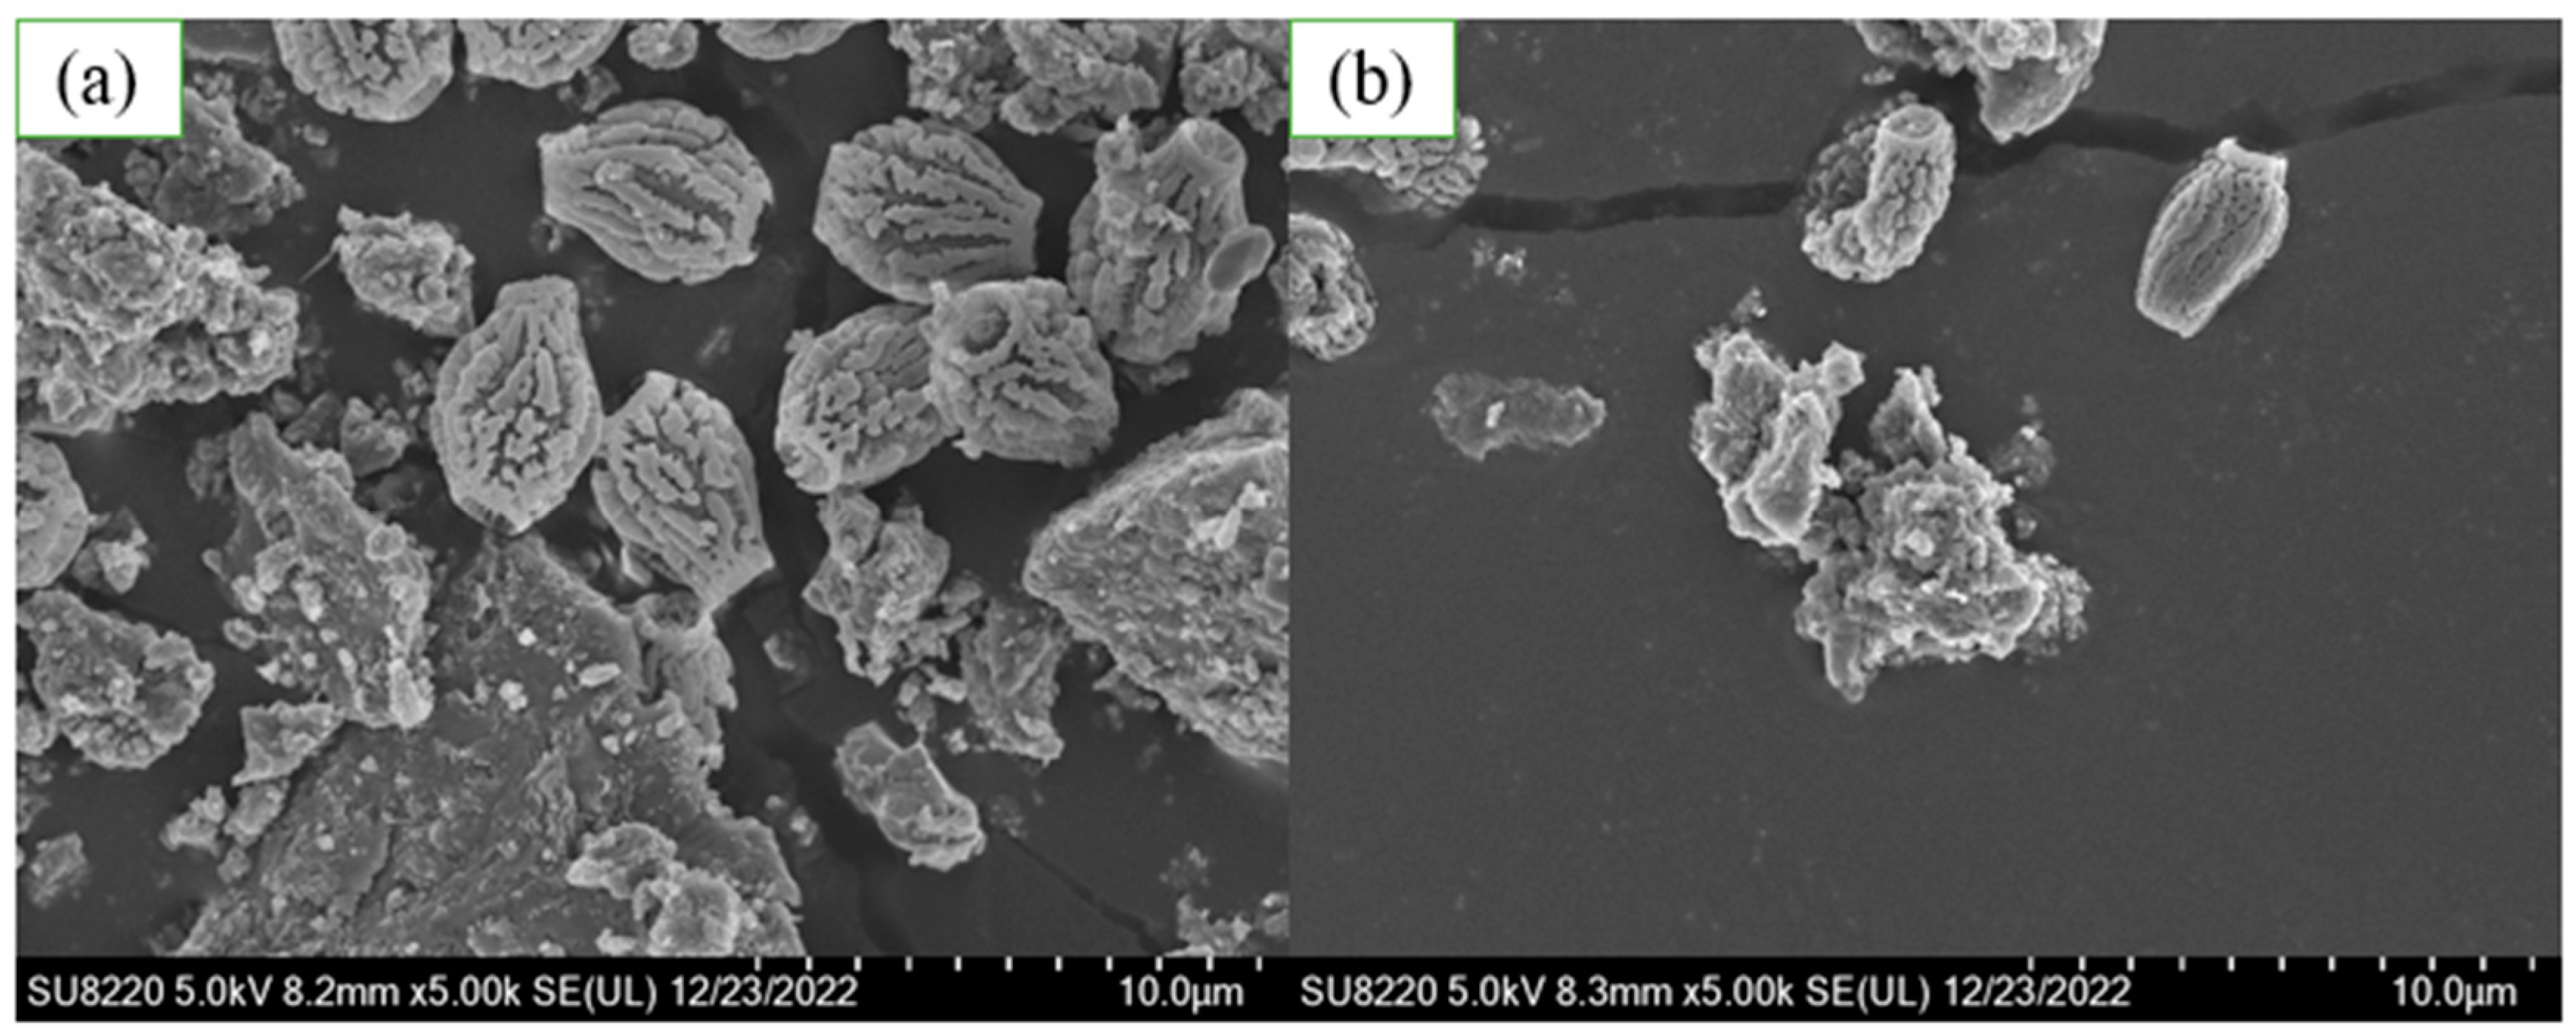
3.2. Field Emission Scanning Electron Microscopy (FE-SEM)

PbTiO3 was sintered at 700 °C, 800 °C, 900 °C, or 1000 °C for 2 h. The SEM images in Figure 7 show the surfaces of the PbTiO3 sintered samples at various temperatures under 1000× magnification. Figure 7a shows the small particles of the 700 °C PTO sample where the TiO2 and PbTiO3 had not completely combined and dispersed. For the higher temperature samples, as the temperature continued to increase, smaller particles began to agglomerate and combine, gradually forming spherical crystals. Figure 7d shows that the 1000 °C PTO sample was fully combined into large spherical crystals, which was consistent with the results observed in the XRD data. Figure 8a depicts the pure TiO2 synthesized using the sol-gel method. It was found that the particles had different sizes and were dispersed. Figure 8b shows the SEM images of g-C3N4 under 2000× magnification, where the formation resembles stacked sheets.
Figure 9a,b represent the SEM images of PTO/TO/CN (0.3) and PTO/TO/CN (0.6), respectively, where the crystals exhibit irregular agglomeration and a rough surface. Figure 9c shows the SEM image of PTO/TO/CN (1.0), where the crystals have a unique shape resembling a pear, and the surface displays numerous indentations and protrusions, forming patterns. We speculate that the addition of g-C3N4 disperses PTO/TO particles on the surface of g-C3N4, resulting in this peculiar structure. Figure 9d depicts the SEM image of PTO/TO/CN (2.0), which also exhibits the unique structure observed in PTO/TO/CN (1.0), but most of the crystals had agglomerated into large particles.
In order to further understand the morphology of these peculiar crystals, we observed samples of PTO/TO/CN (1.0) and PTO/TO/CN (2.0) at a magnification of 5000 times, as shown in Figure 10. Figure 10a shows the unique pear-shaped crystals in PTO/TO/CN (1.0). Although there are also some large particle aggregates, the number of unique crystals is larger and the sizes are more consistent. Figure 10b shows the situation in PTO/TO/CN (2.0). Compared to PTO/TO/CN (1.0), the surface indentations and patterns of the unique crystals in PTO/TO/CN (2.0) are less pronounced and appear to be filled, resulting in a deformed and less pear-shaped morphology. Additionally, PTO/TO/CN (2.0) has fewer unique crystals, and most of them have agglomerated into large particles.

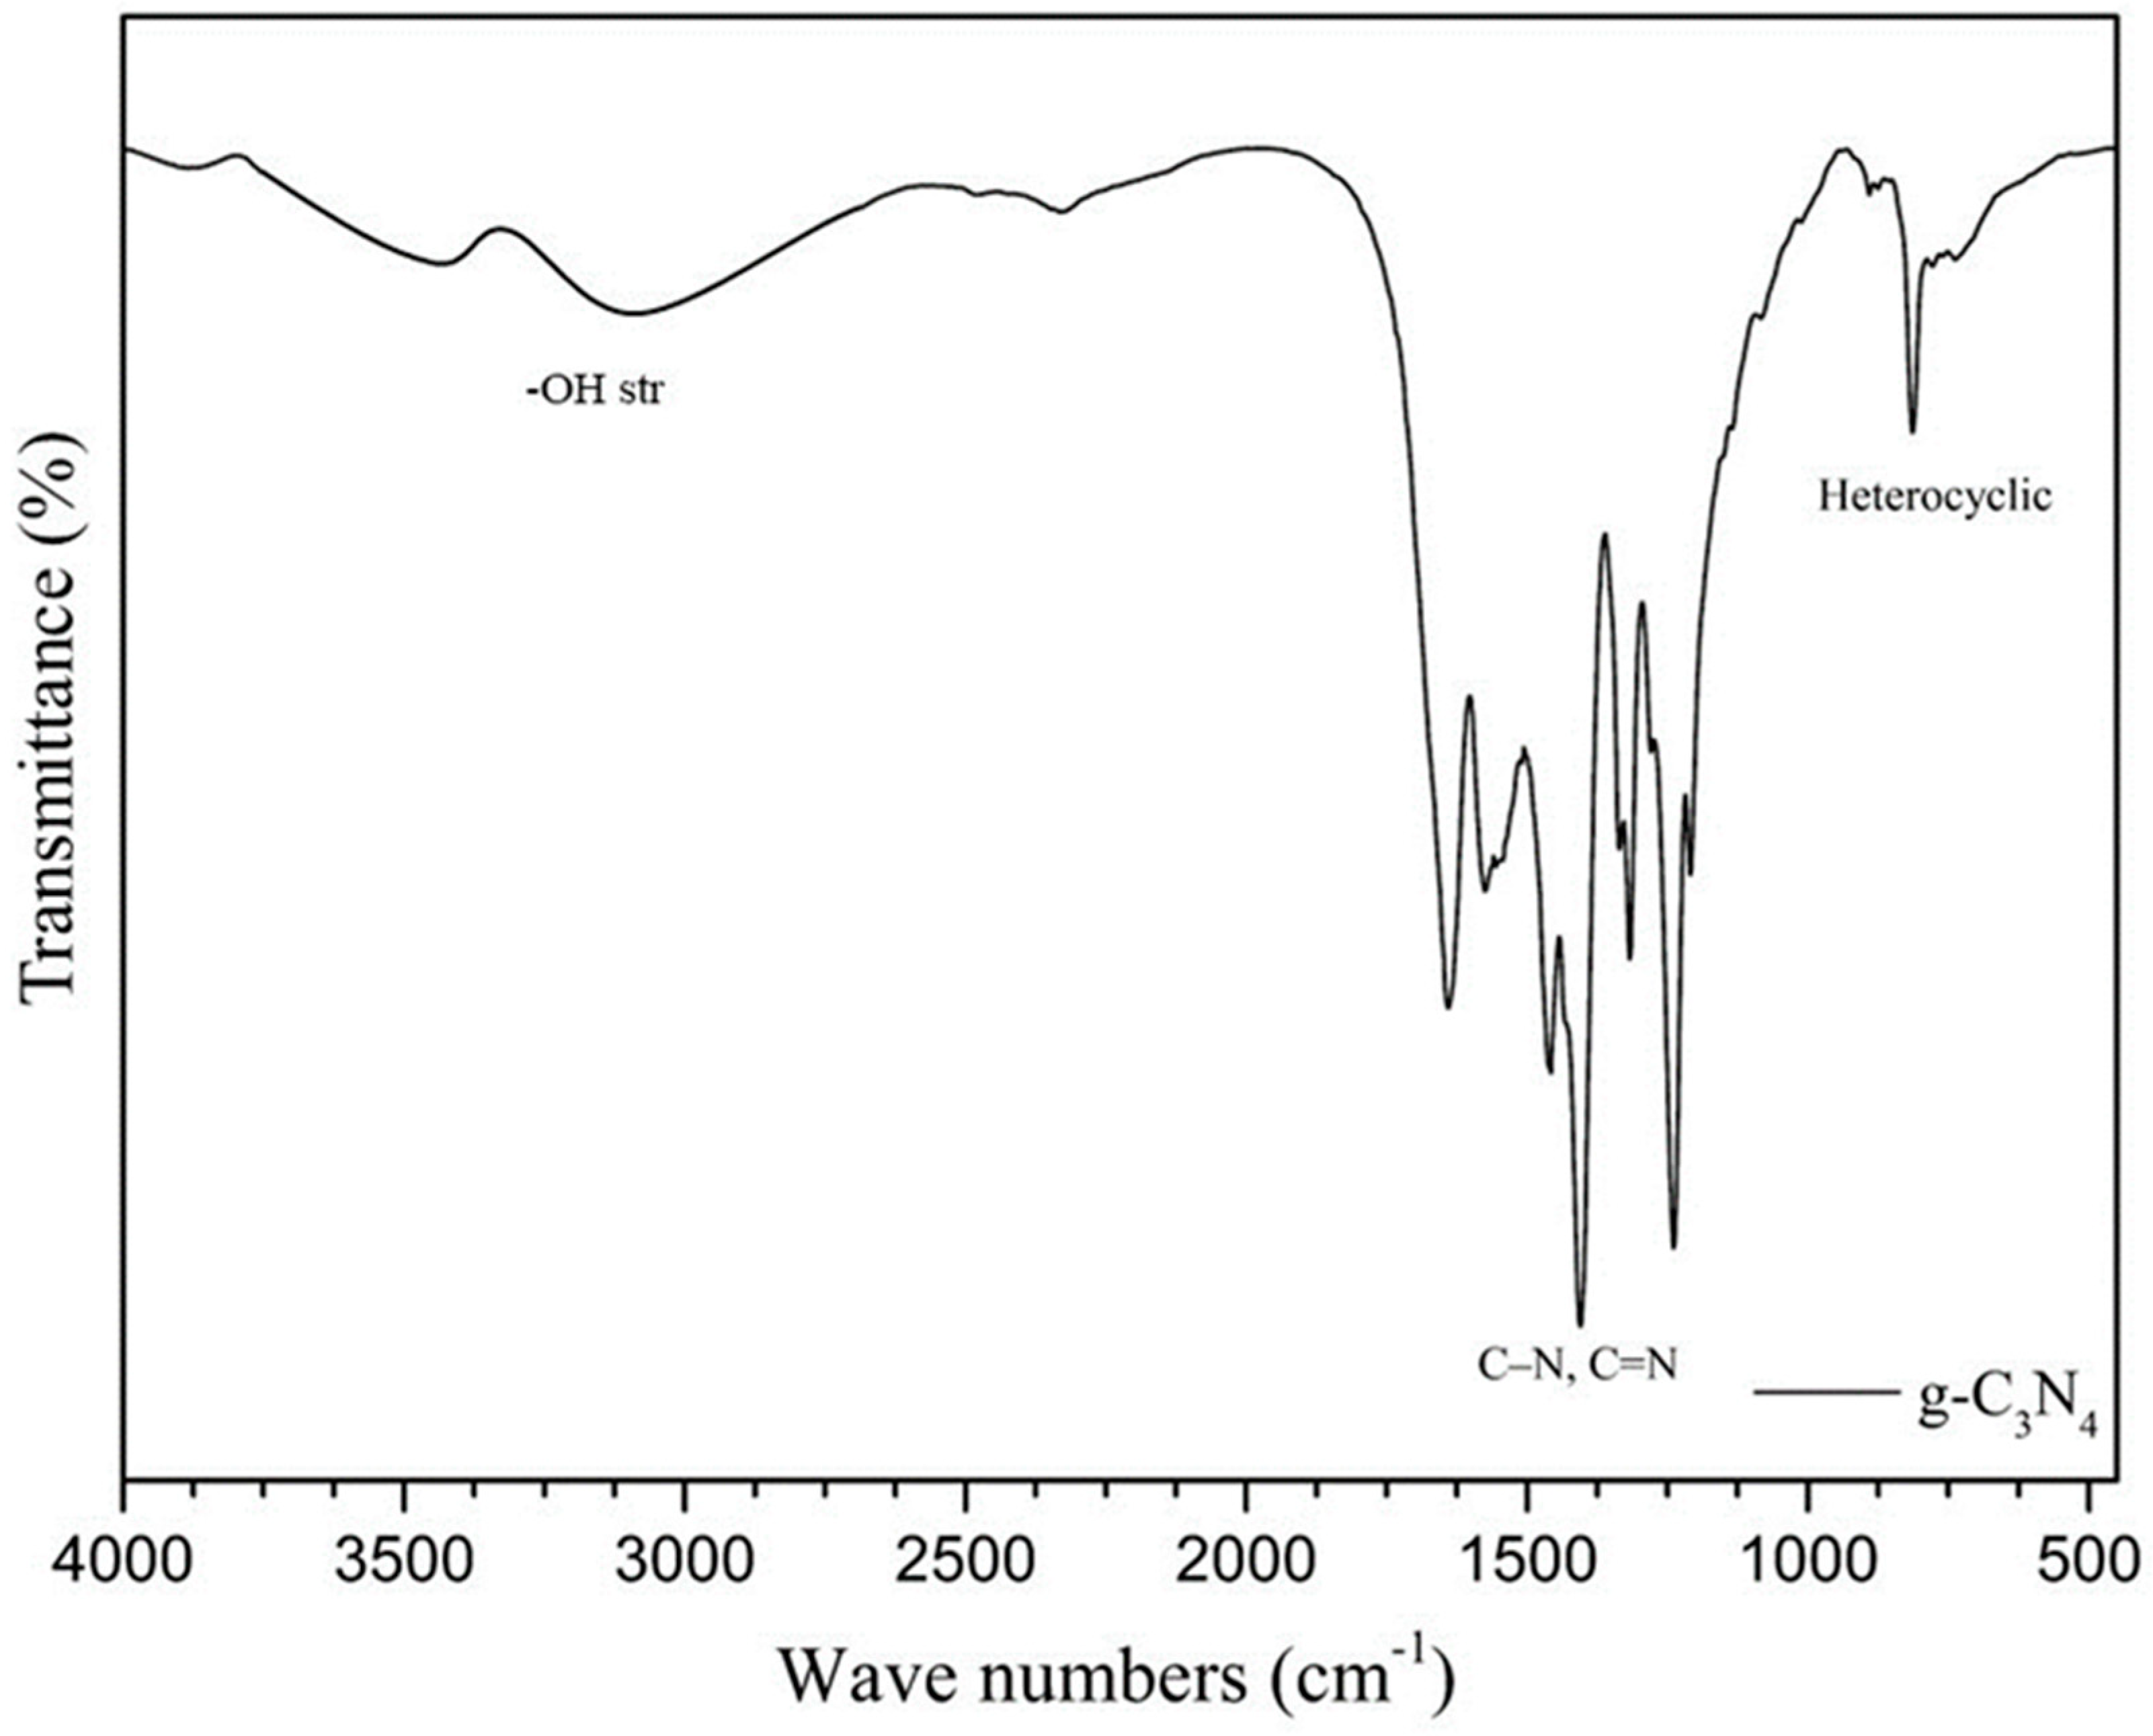
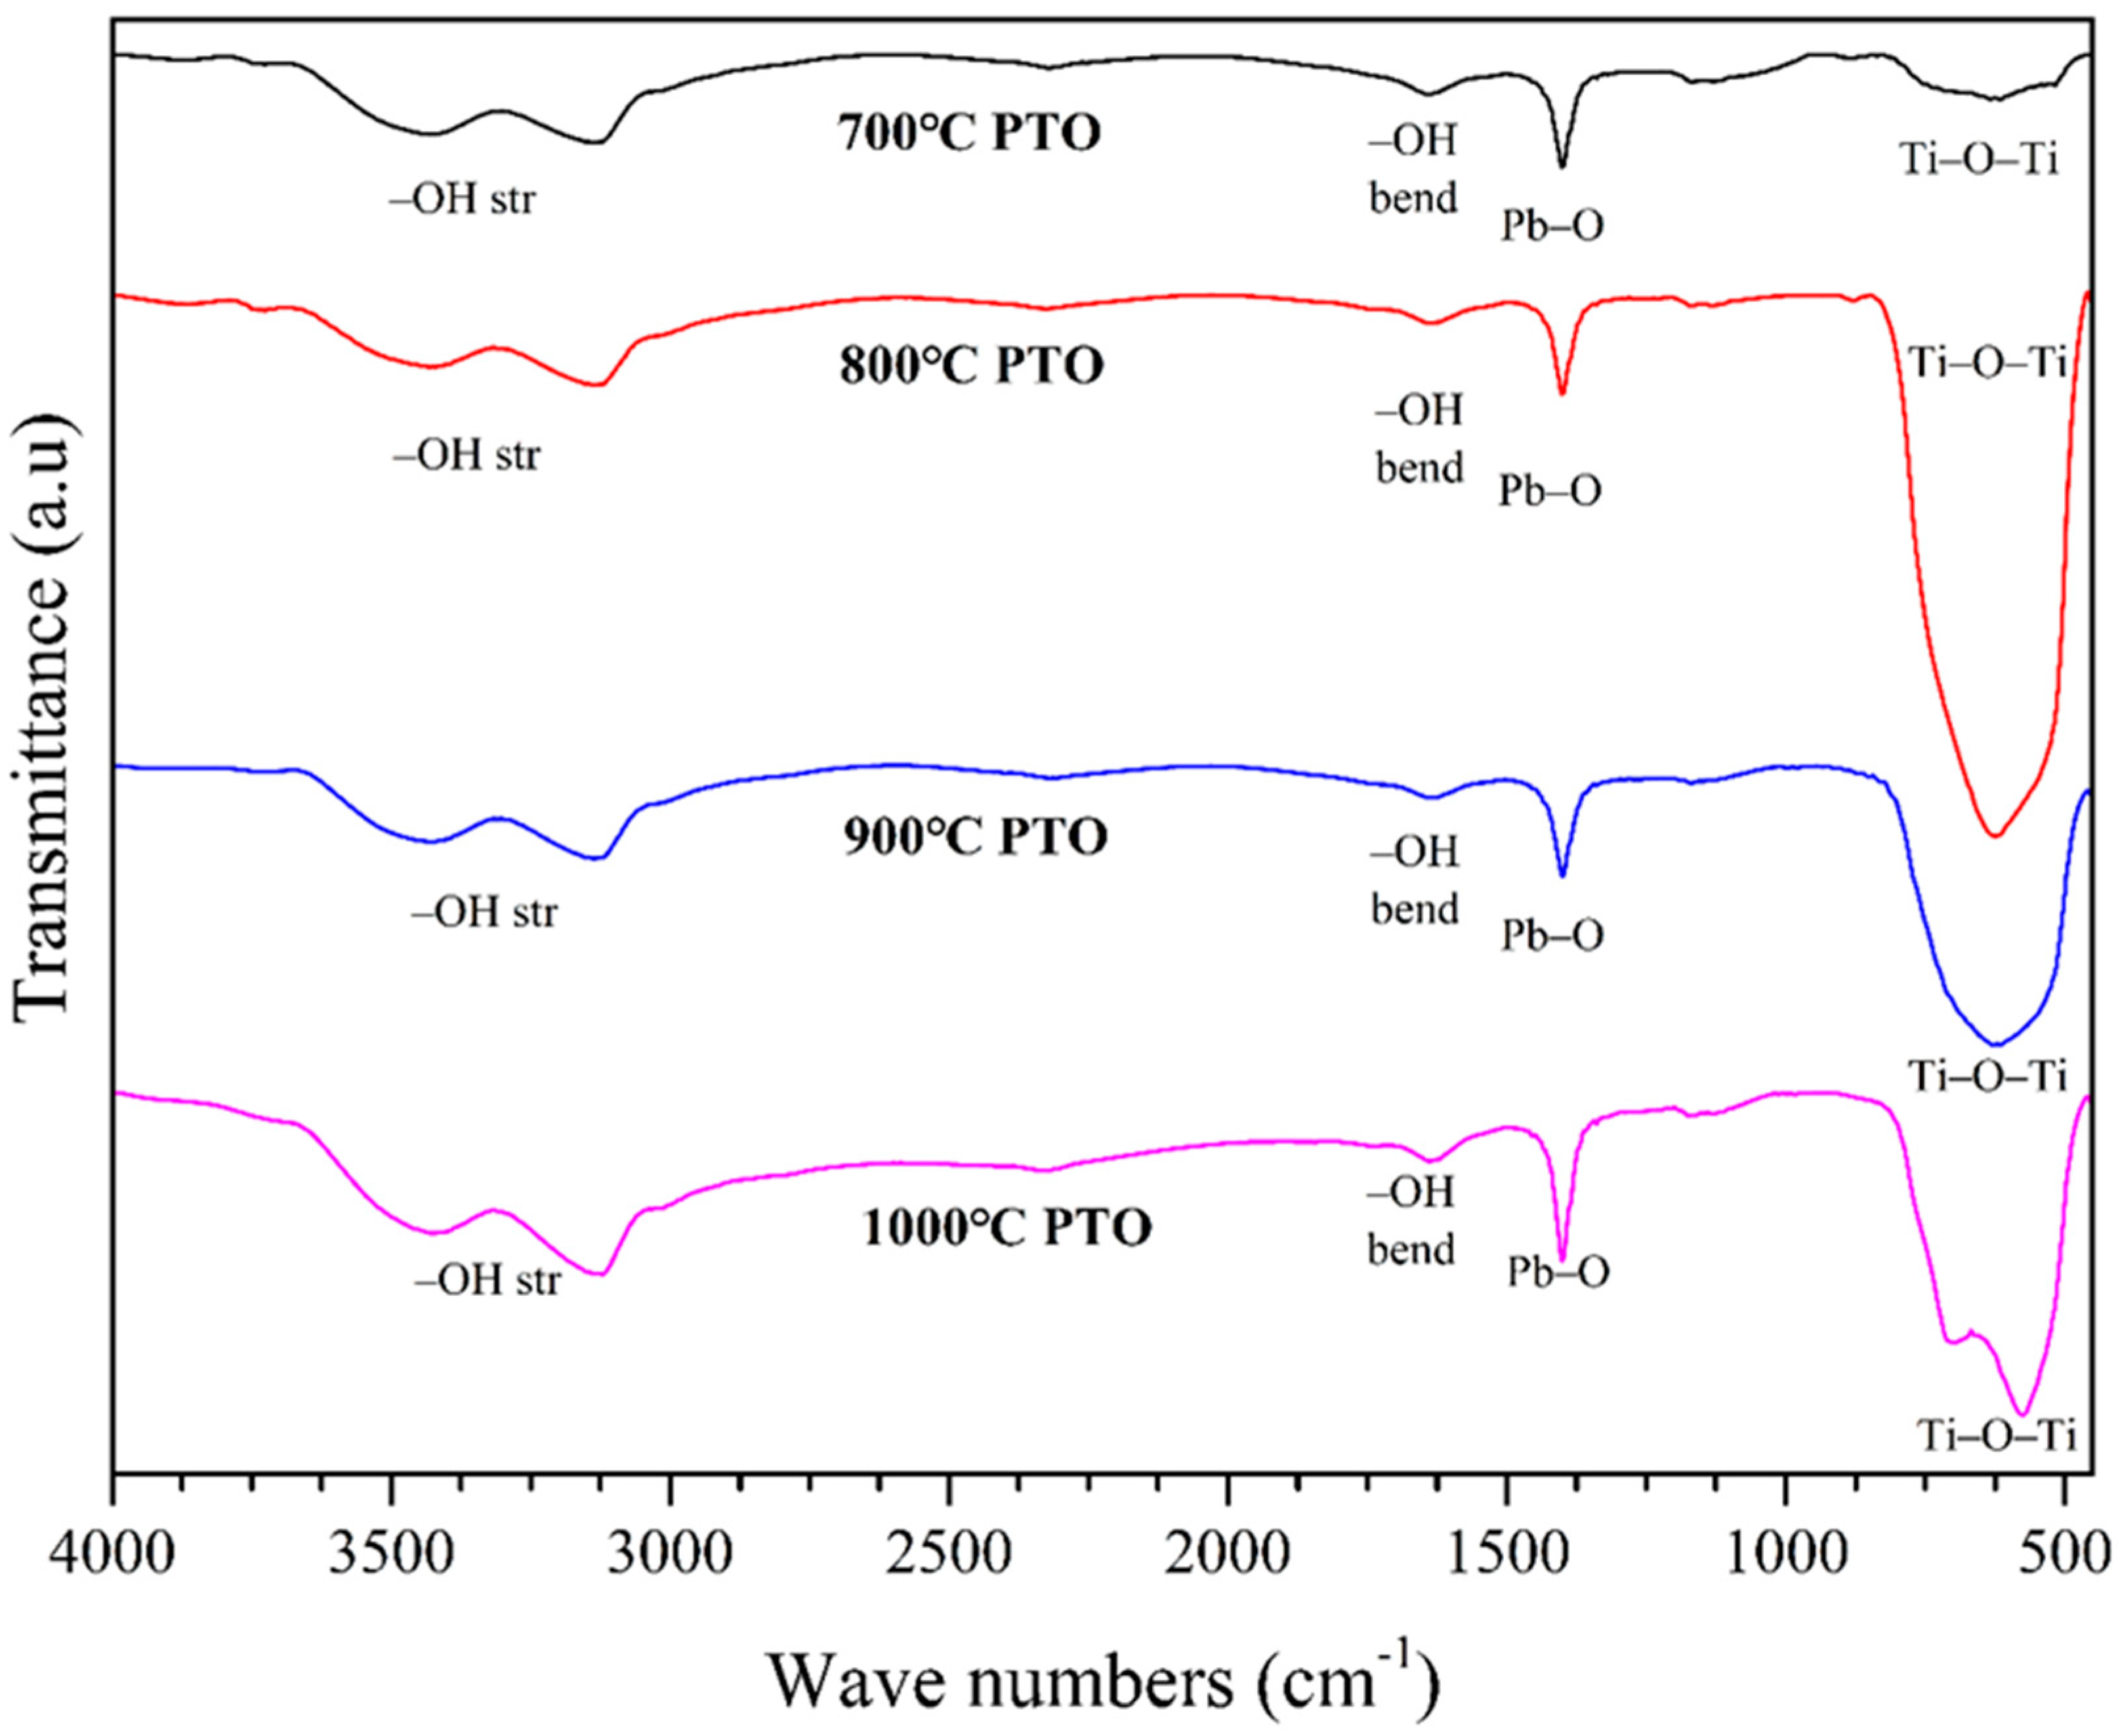
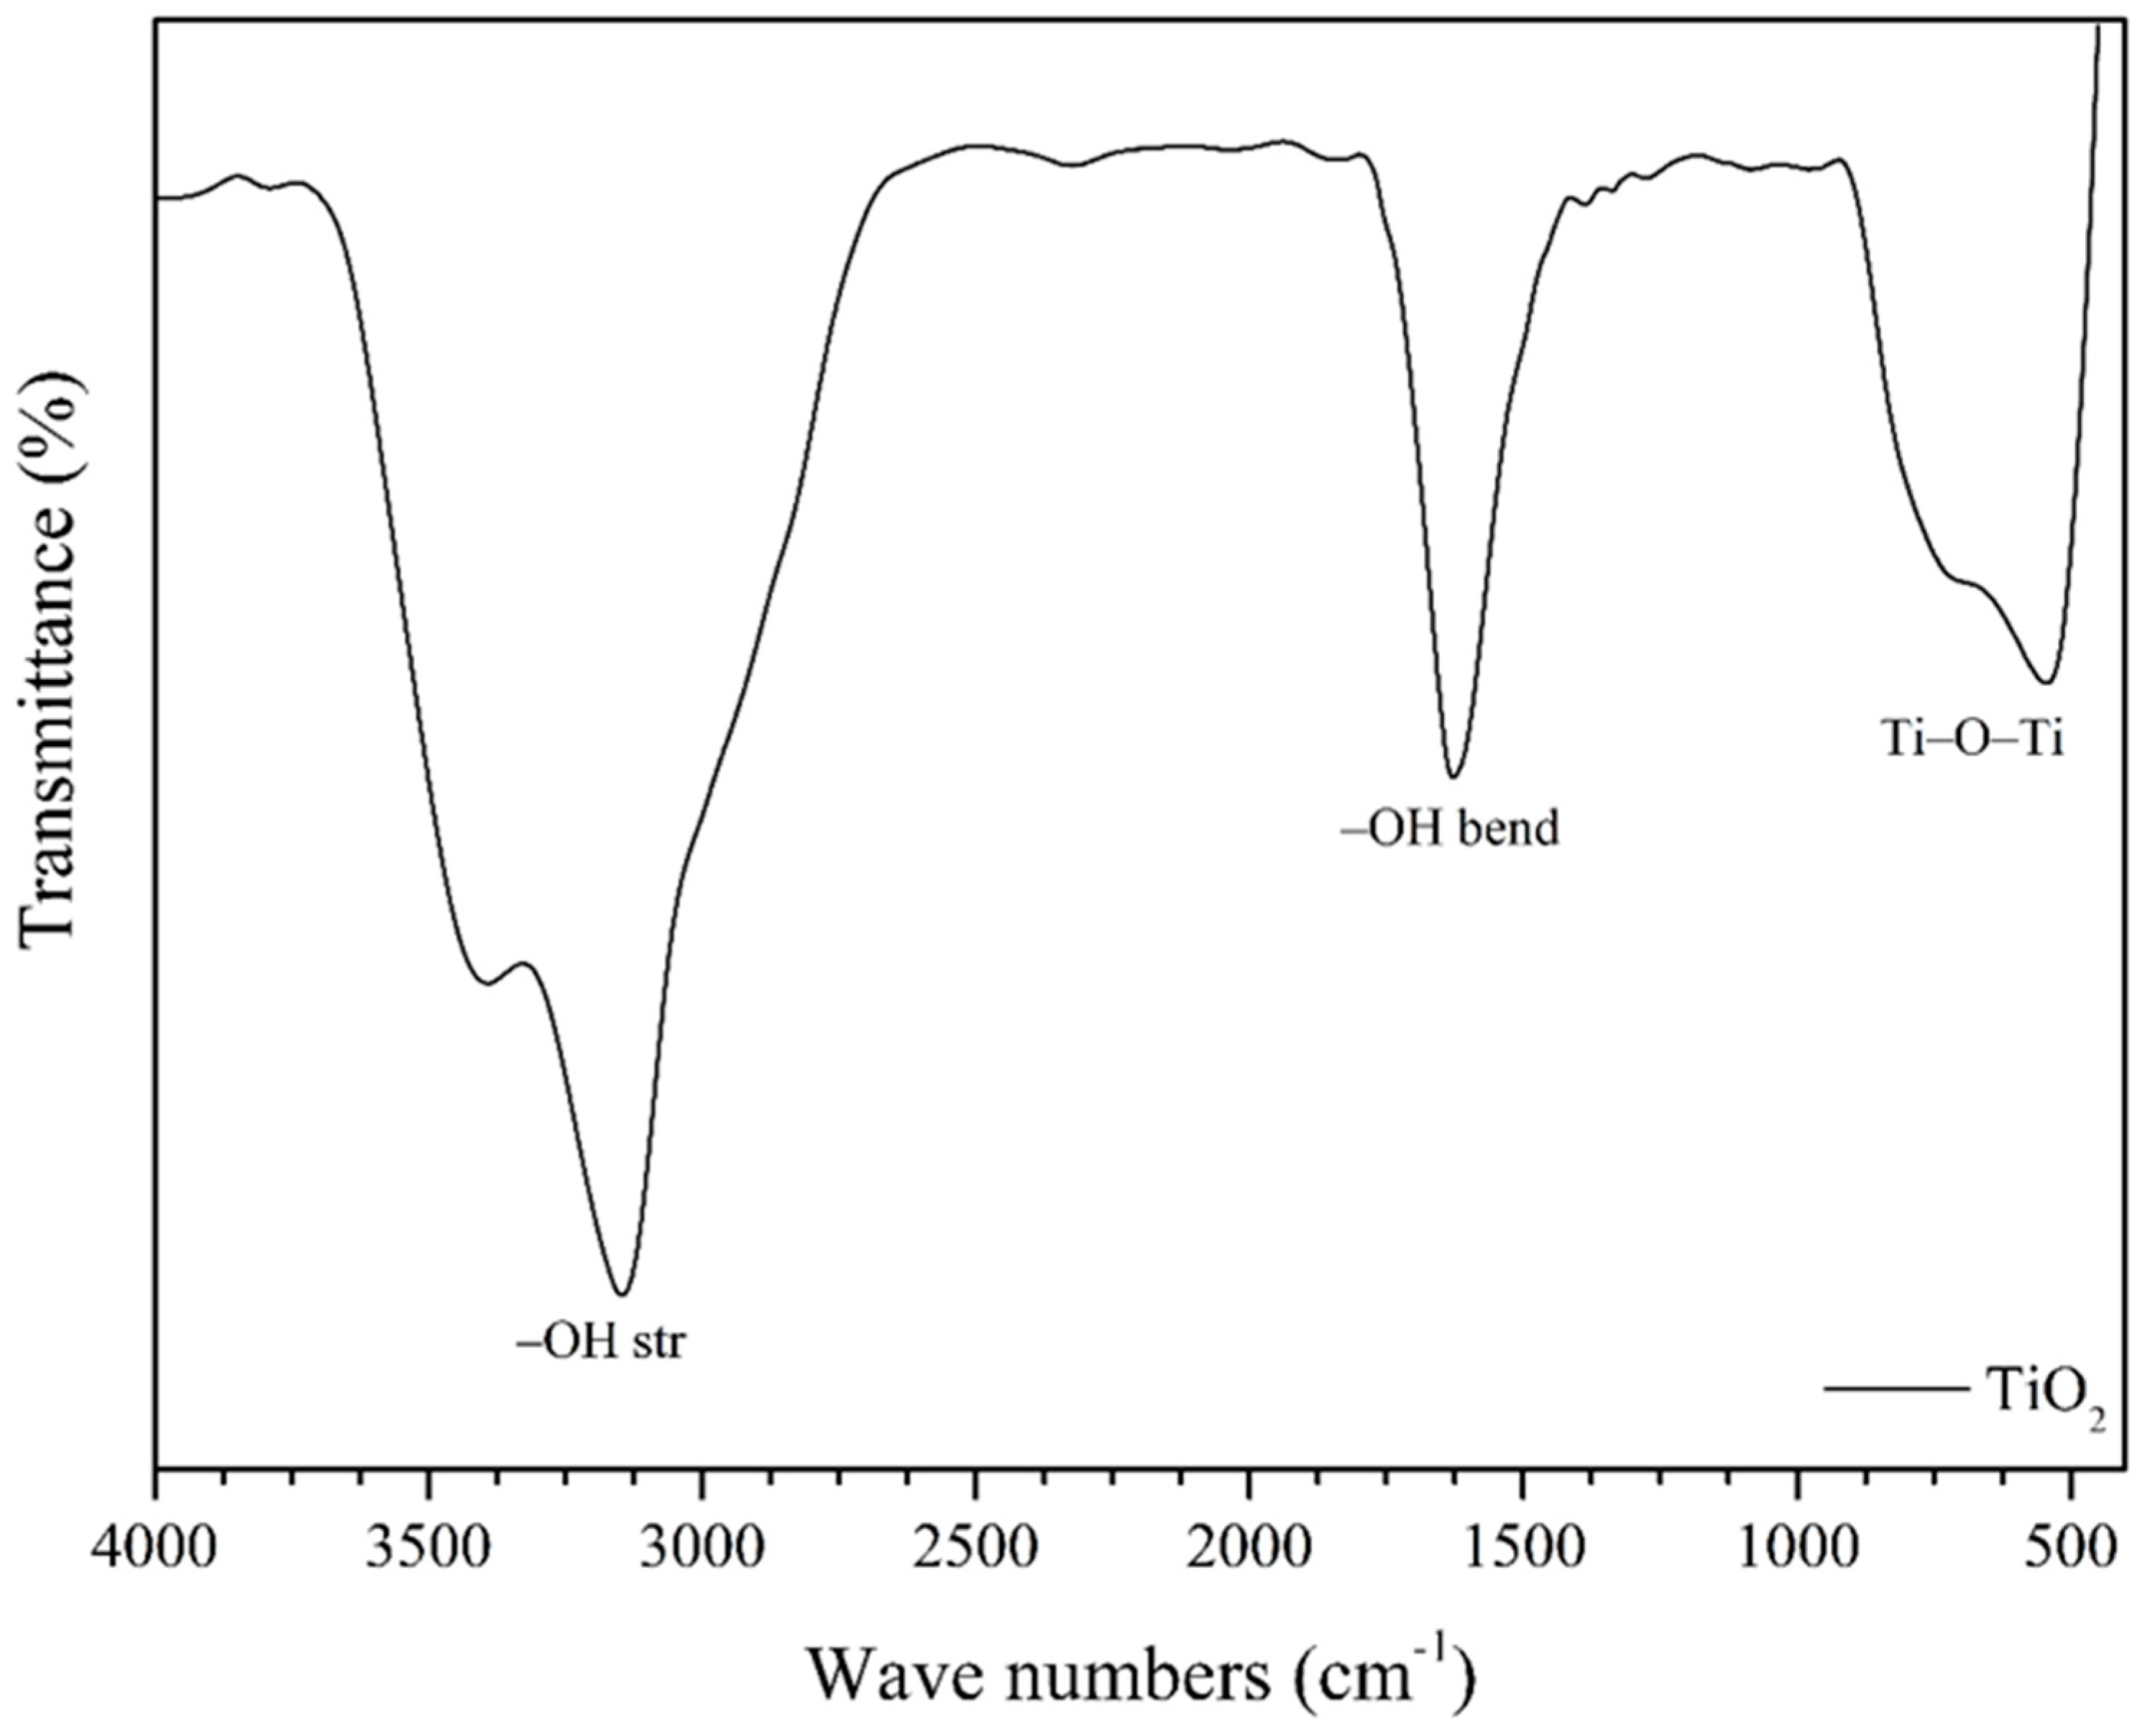
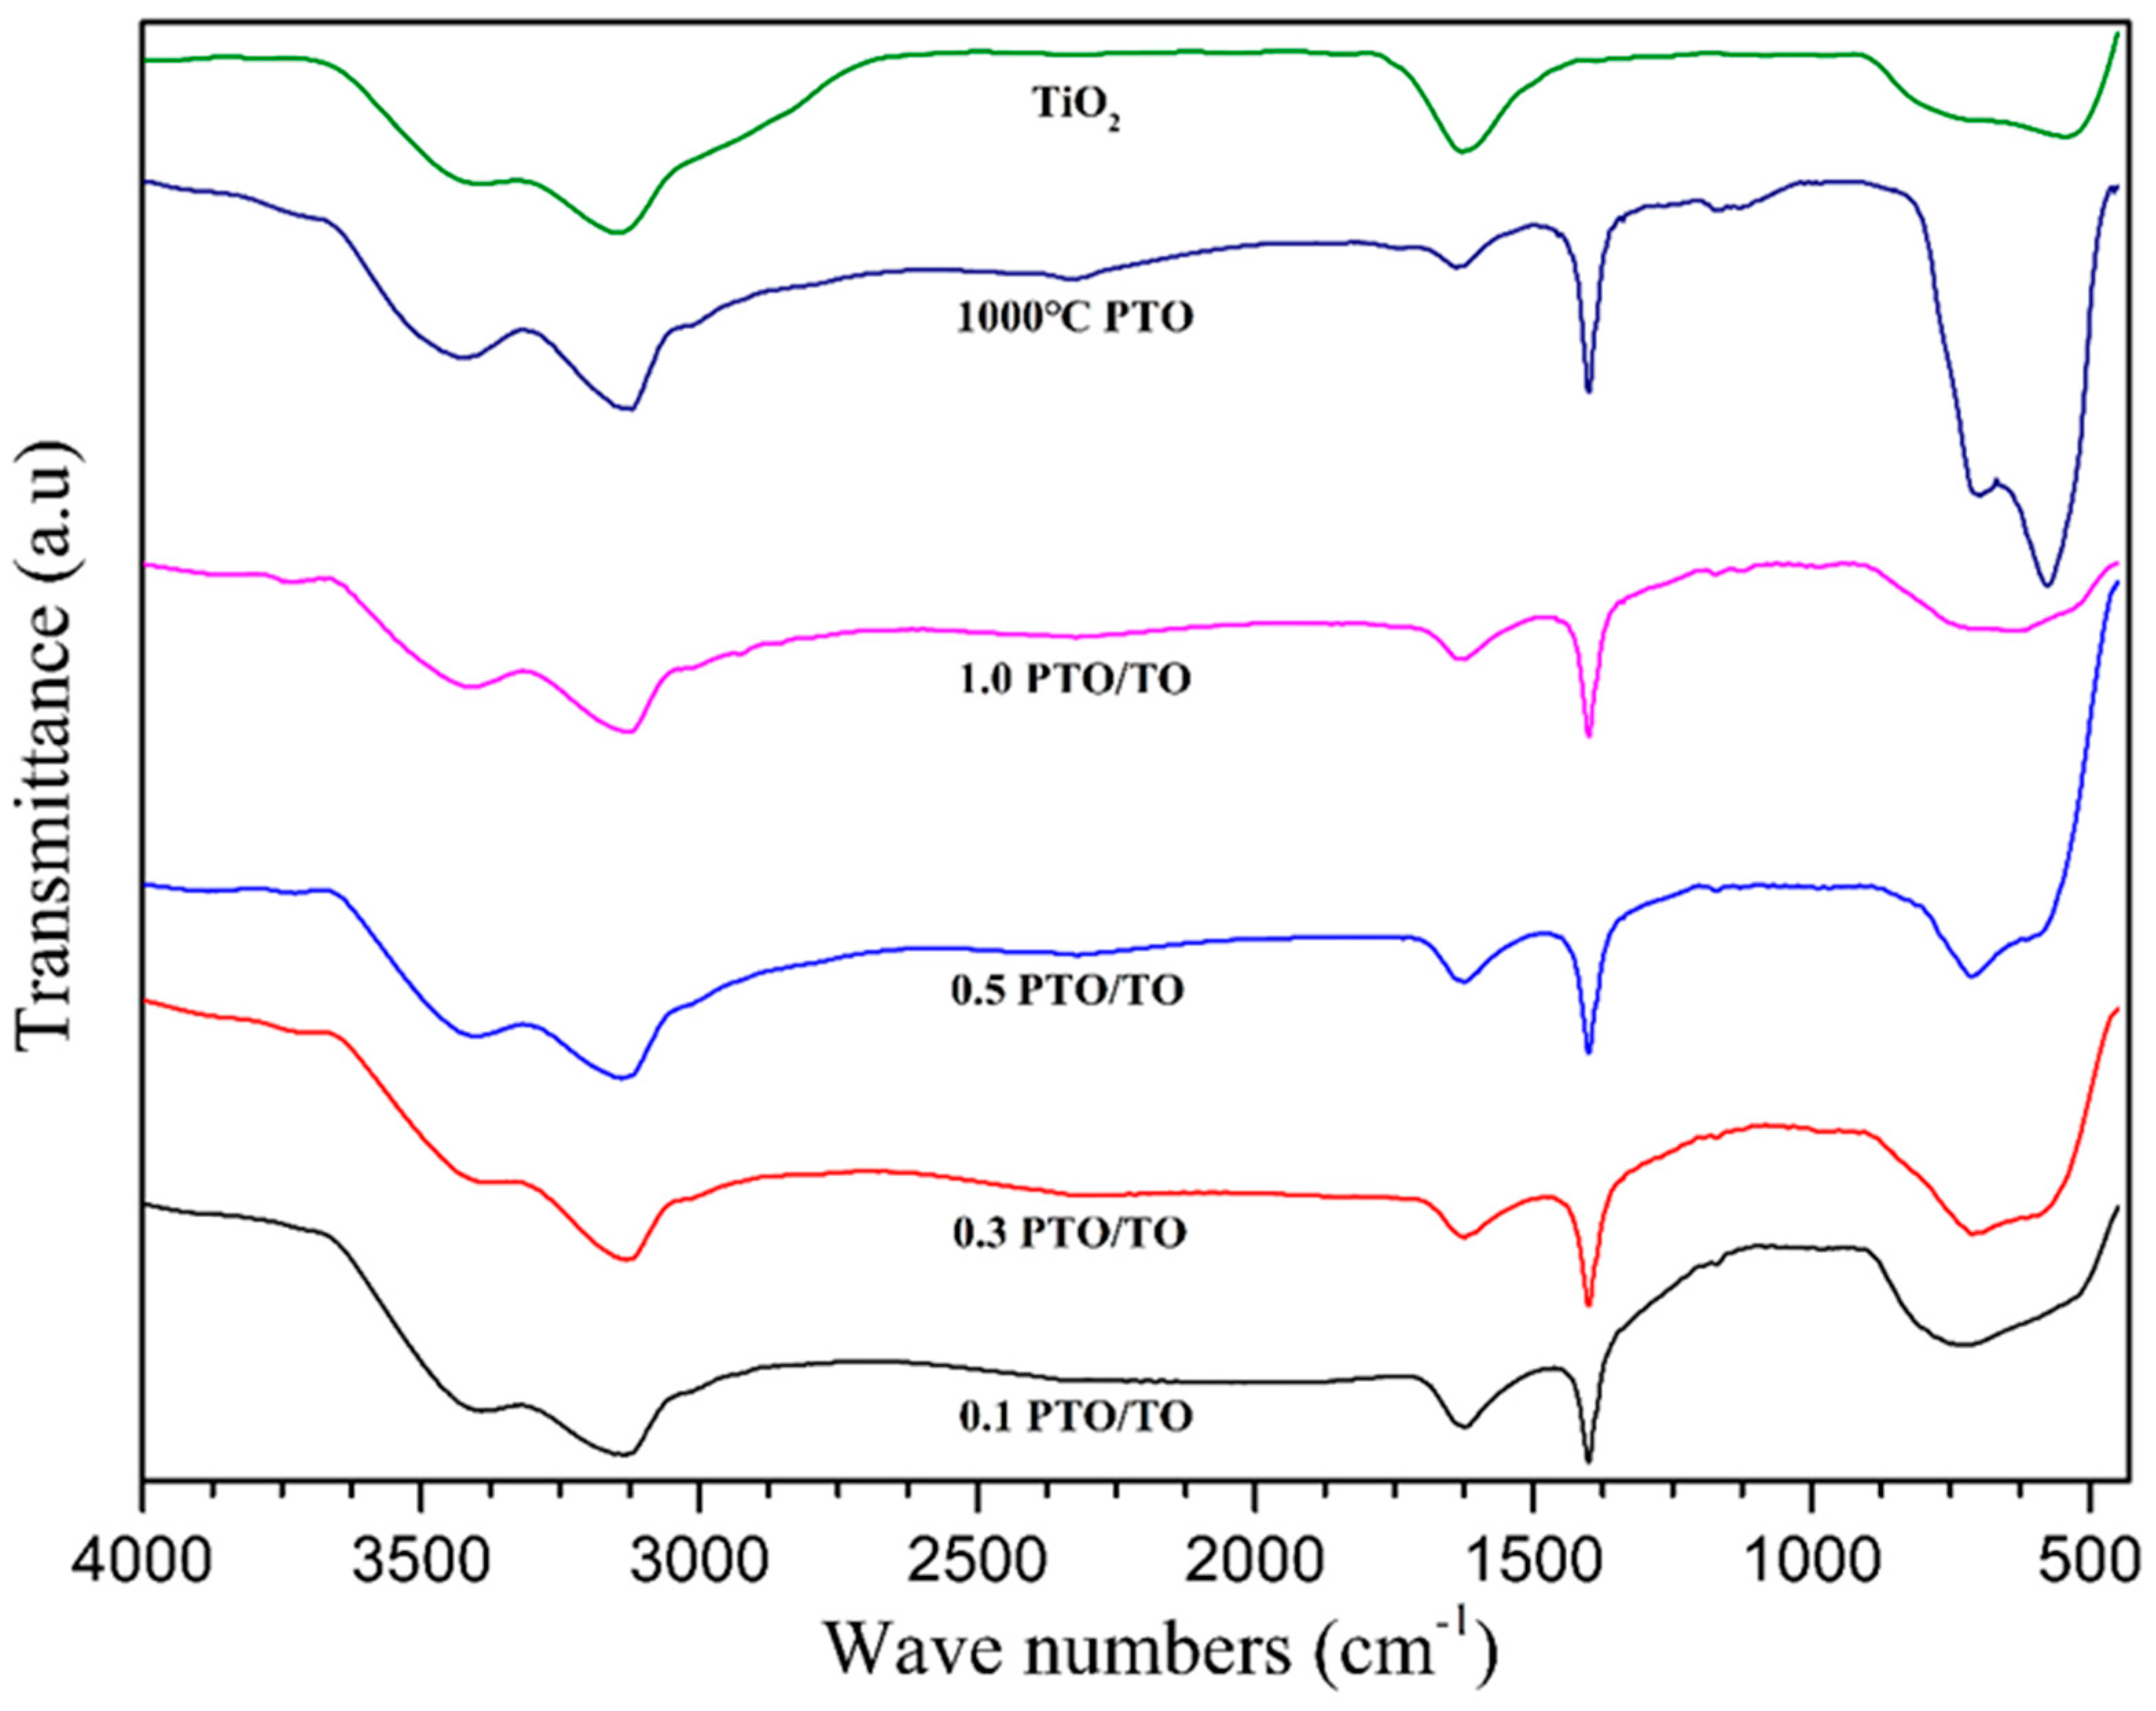
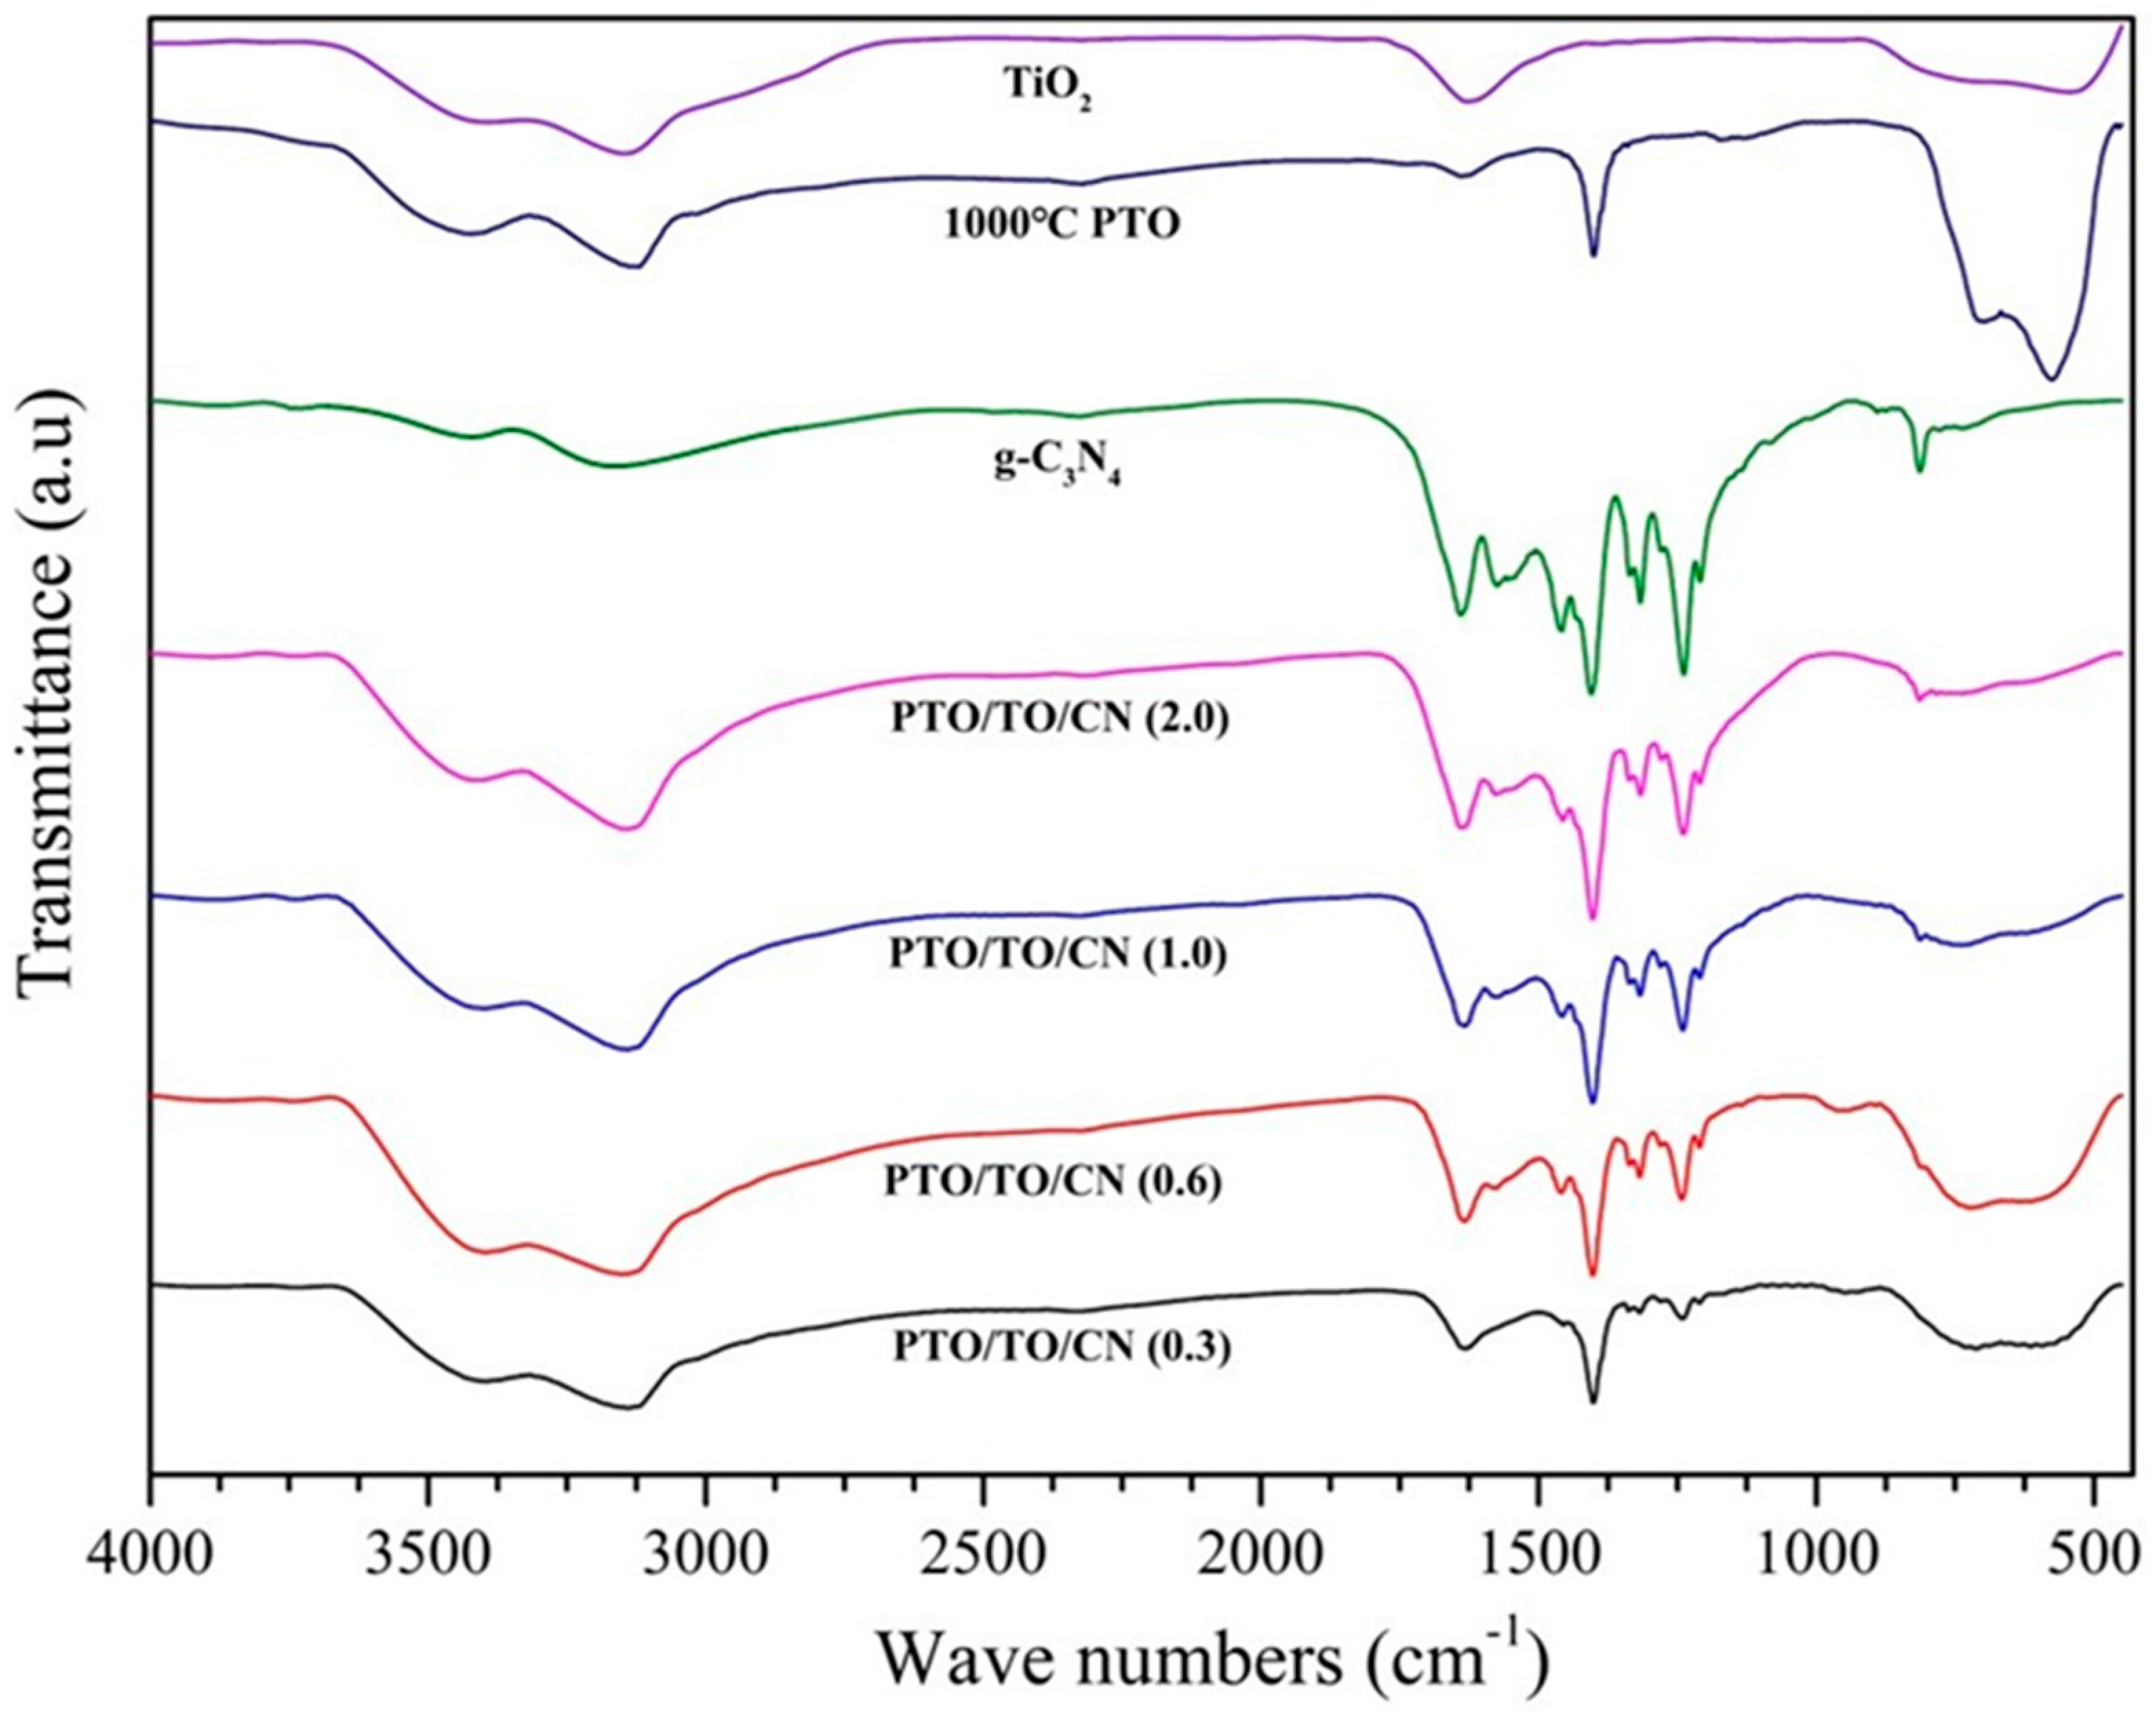
3.3. FTIR Measurement and Analysis

Figure 11 shows the FTIR spectra of the PbTiO3 sample. There are multiple shifts in the Ti–O–Ti stretching bands in the wavenumber range 631–570 cm−1, and there is also –OH bending visible in the wavenumber range 1647–1636 cm−1. The peaks corresponding to the Pb–O groups can be observed in the wavenumber range 1400–1397 cm−1. The broad peak in the wavenumber range of 3457–3117 cm−1 indicates the absorption of the –OH stretching vibration from the H2O molecules that adsorbed on the surface of the PbTiO3. Furthermore, in the 1000 °C sintered PTO sample, due to the formation of Pb–O–Ti bonds, a new peak formed at approximately 711 cm−1. The aforesaid indicates successful chemical bonding between the TiO2 and PbO, forming the Pb–O–Ti bond [33].
Figure 12 shows the FTIR spectrum of the TiO2, and the –OH stretching vibrations from the surface adsorbed water molecules are visible in the range 3400–3153 cm−1. The peaks at 585–523 cm−1 correspond to the Ti–O–Ti stretching vibrations, while the peak at 1630 cm−1 represents the Ti–O stretching and Ti–OH bending vibrations. The FTIR spectra in Figure 13 confirm the binding of the TiO2 and PbTiO3 in the PTO/TO composites for the 1000 °C PTO sample and its various PTO/TO ratios. The broad peak in the range 3562–3130 cm−1 indicates –OH stretching vibrations, and absorption peaks related to the Pb–O groups were observed in the range 1400–1397 cm−1. The peaks at 585–523 cm−1 represent the Ti–O–Ti stretching vibrations, and the peaks at 720–713 cm−1 indicate the presence of Pb–O–Ti bonds. These spectra can possibly confirm the presence of both PTO and TiO2 in the PTO/TO composites [33].
Figure 14 shows the FTIR spectra of the g-C3N4 sample, with peaks at 814 cm−1 (representing the bending vibration of the heterocyclic structure) and 1238–1640 cm−1 (showing the stretching vibrations of C=N or C–N bonds in the CN heterocycles). The region between 3000 and 3700 cm−1 represents the N–H bond stretching vibrations, and the broad peak between 3400 and 3600 cm−1 indicates the –OH vibrations from adsorbed water [34].
Figure 15 shows the FTIR spectra as it relates to TiO2, 1000 °C PTO, g-C3N4, and different PTO/TO/CN ratios. It confirms the binding of g-C3N4 and PTO/TO in the composites. The broad peak in the range of 3562–3130 cm−1 shows the –OH stretching vibrations, and all the observed spectra exhibit an absorption band in the range 550–800 cm−1, relating to the presence of TiO2 in all the PTO/TO/CN composites. The raised broad peak in the range 720–713 cm−1 indicates Pb–O–Ti bond absorption. The FTIR spectra relating to g-C3N4 are present in the fingerprint region 1200–1640 cm−1, confirming its presence in all PTO/TO/CN composites. The intensity of the peak at 814 cm−1 corresponds to the heterocyclic structure, and increases with higher amounts of g-C3N4 doping. Therefore, based on the observed spectra, it can be inferred that the PTO/TO/CN composites contain TiO2, PTO, and g-C3N4.

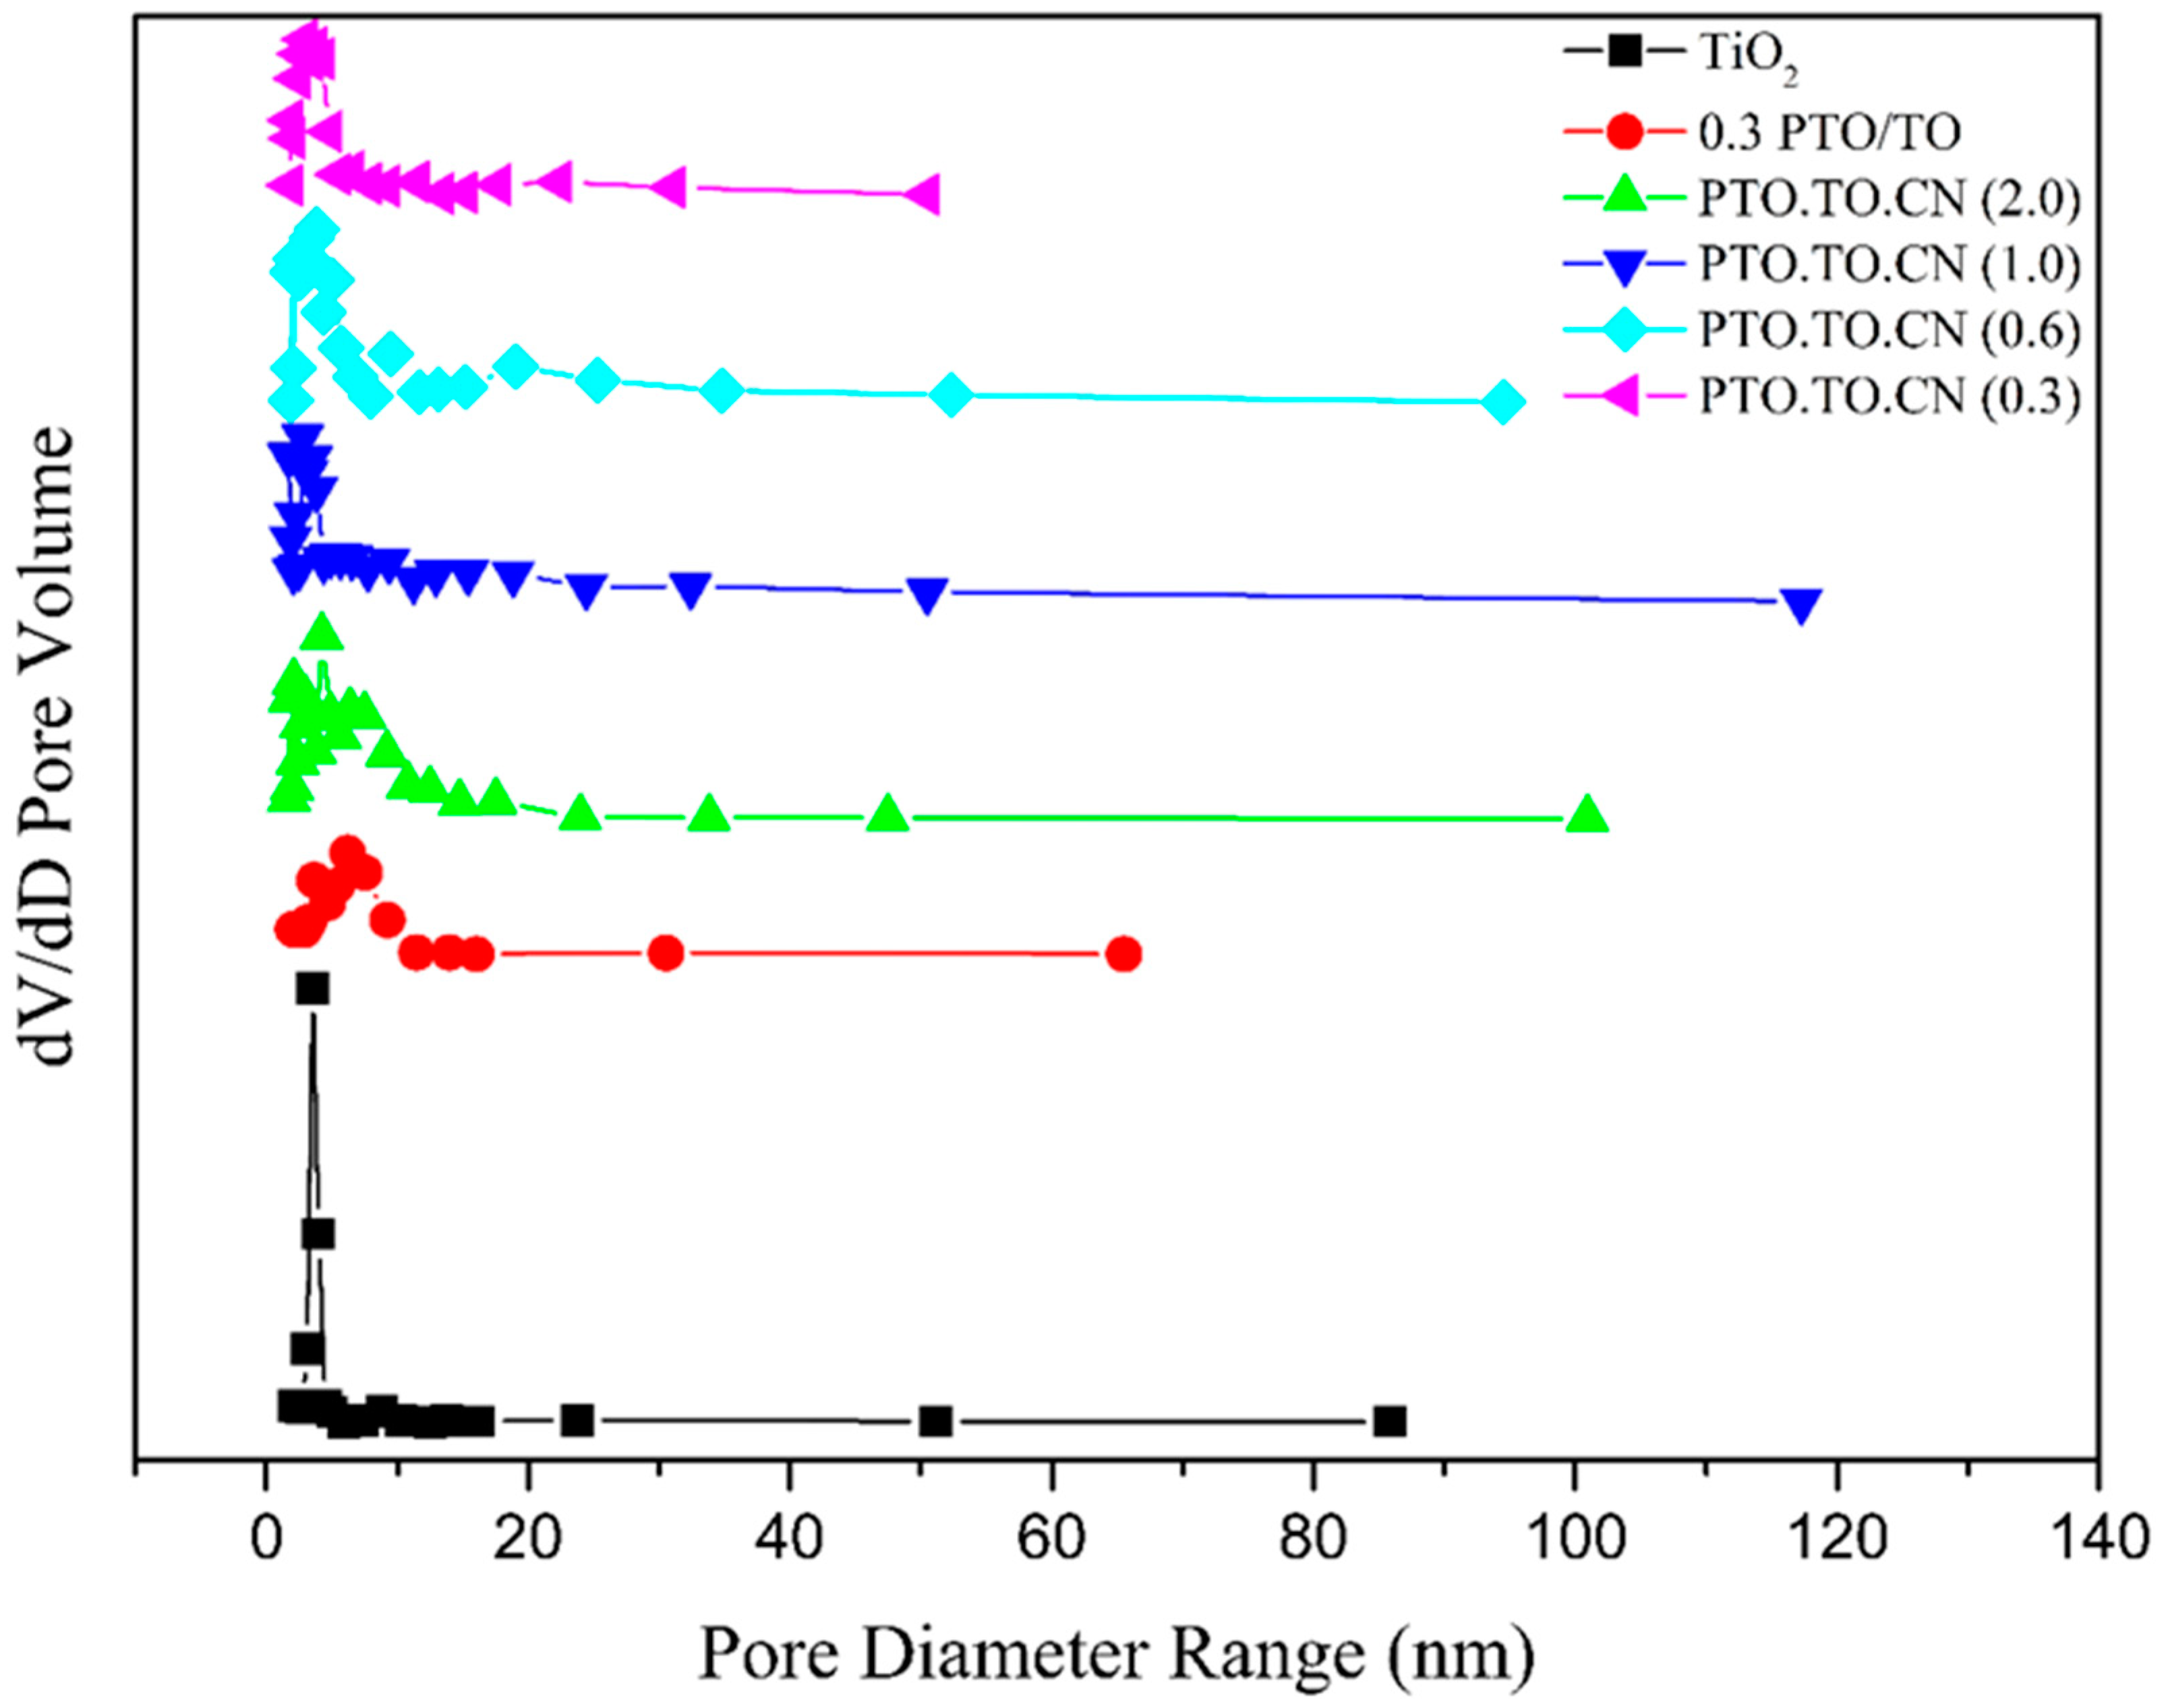
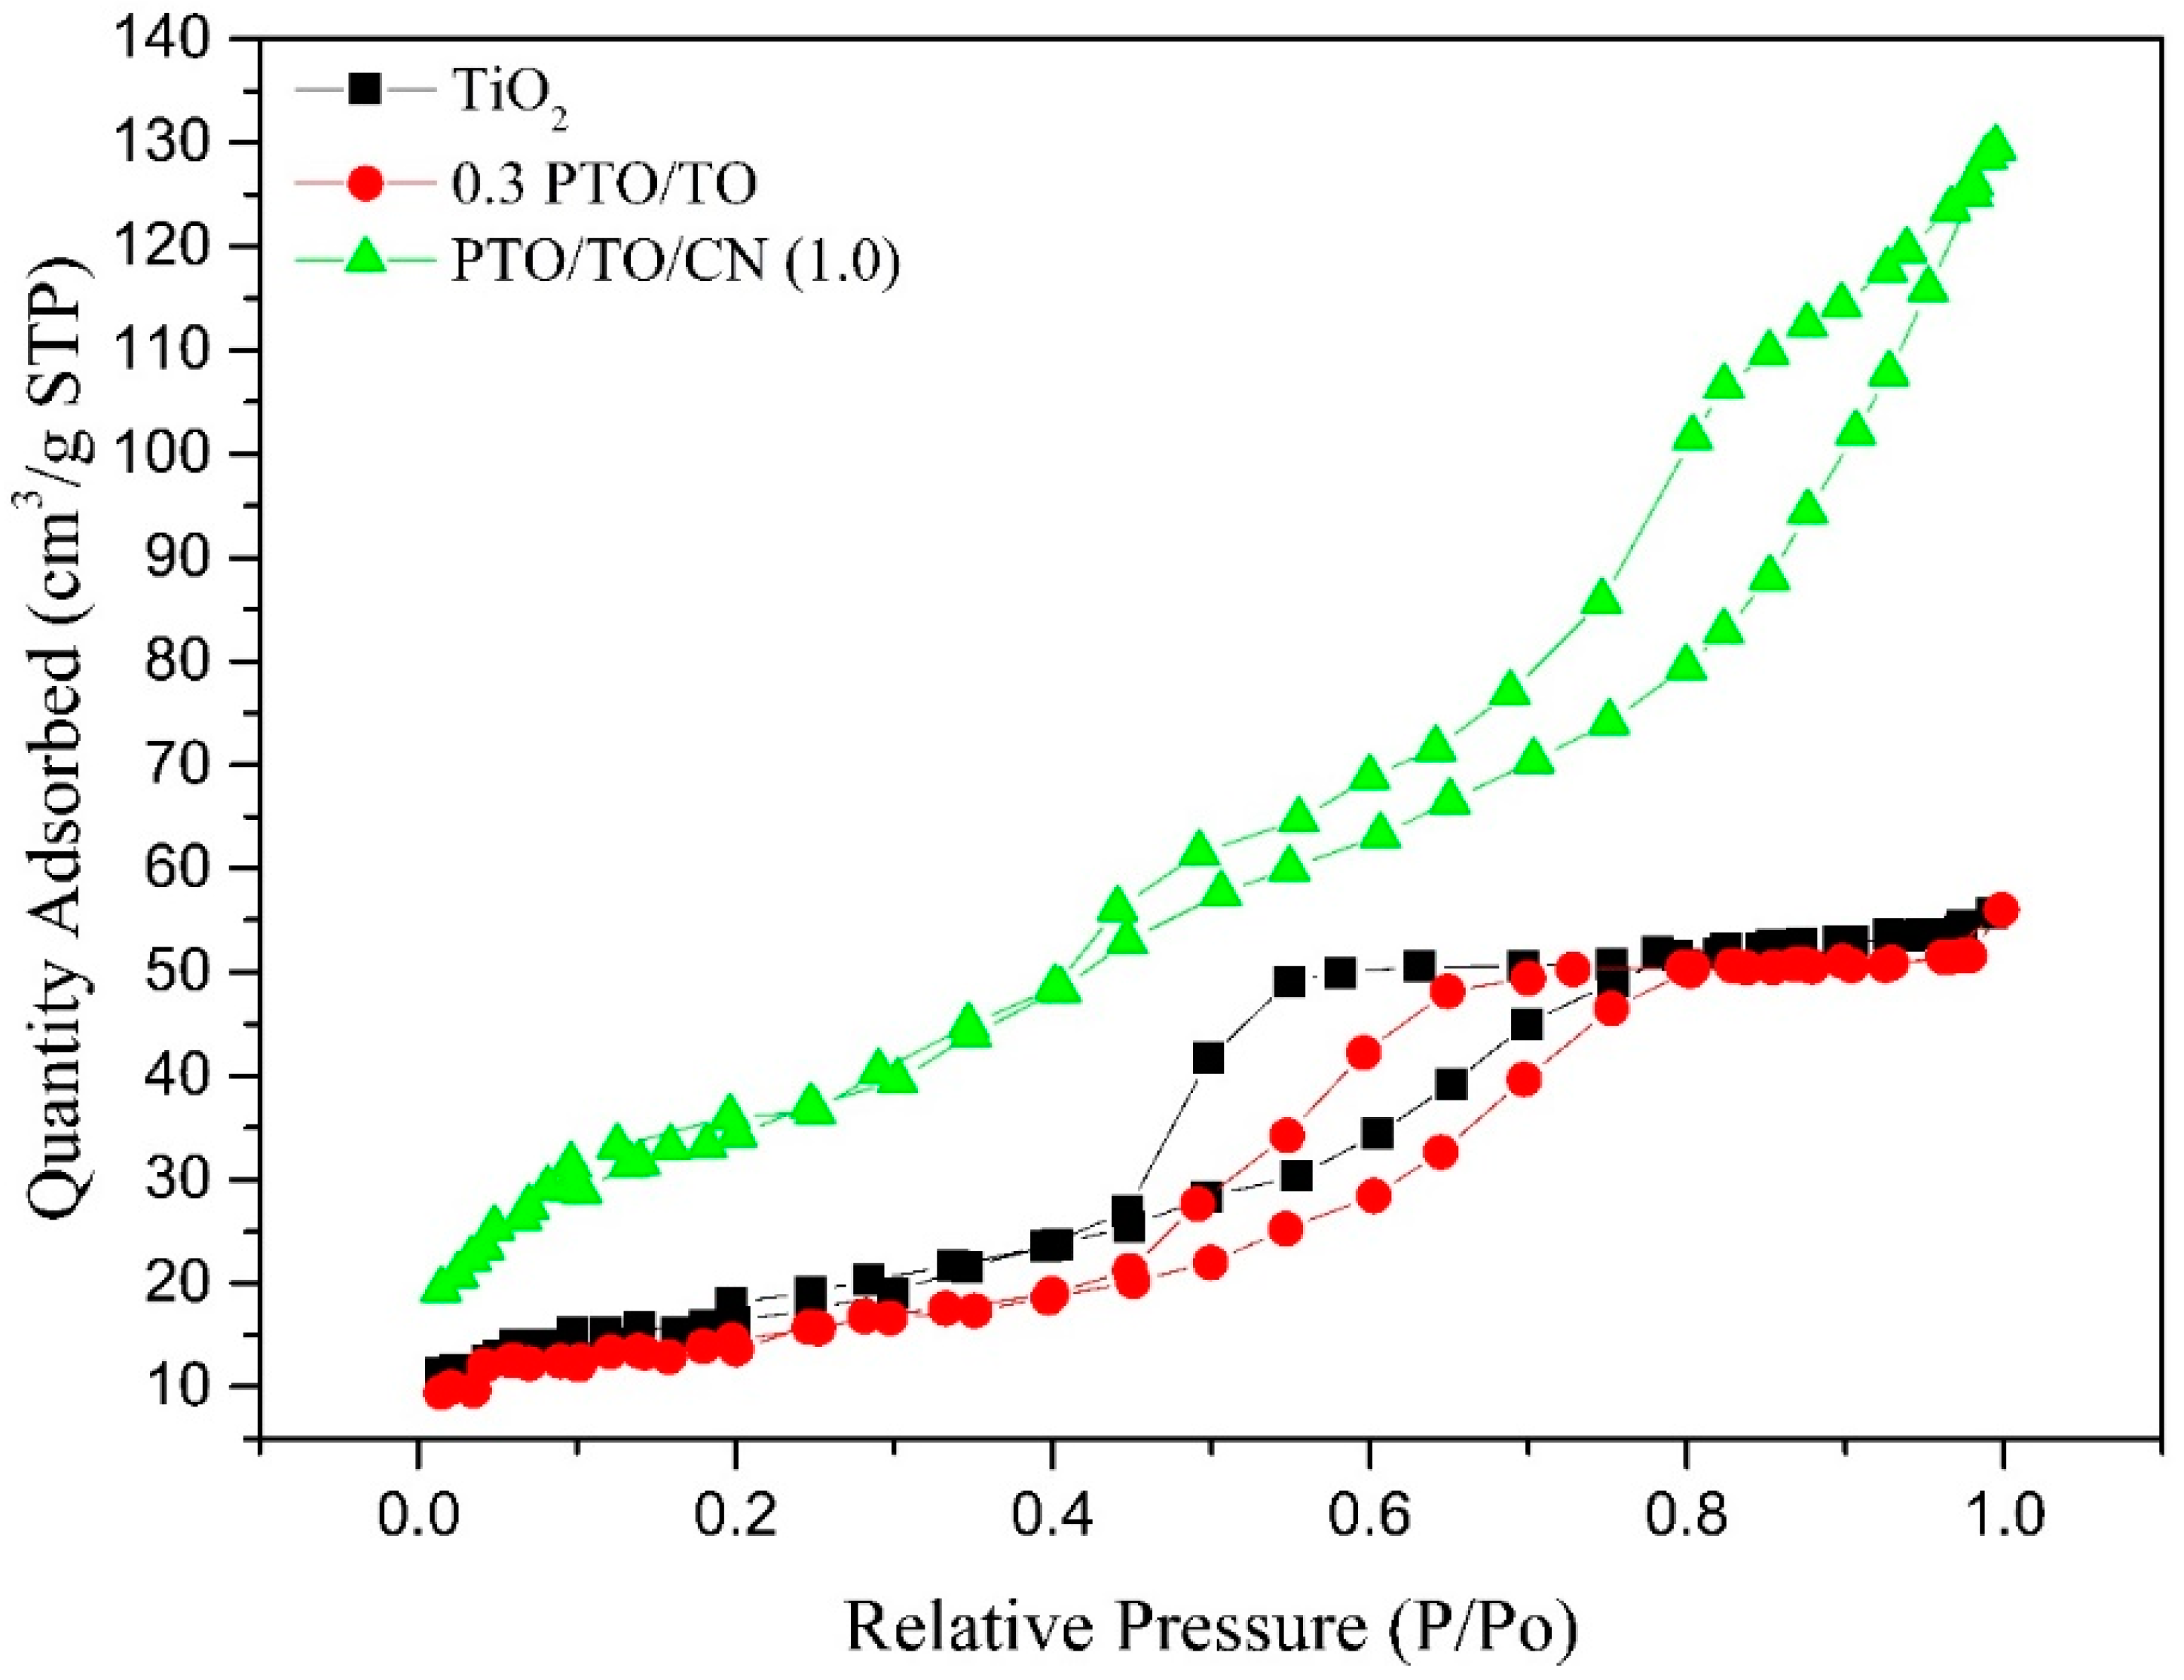
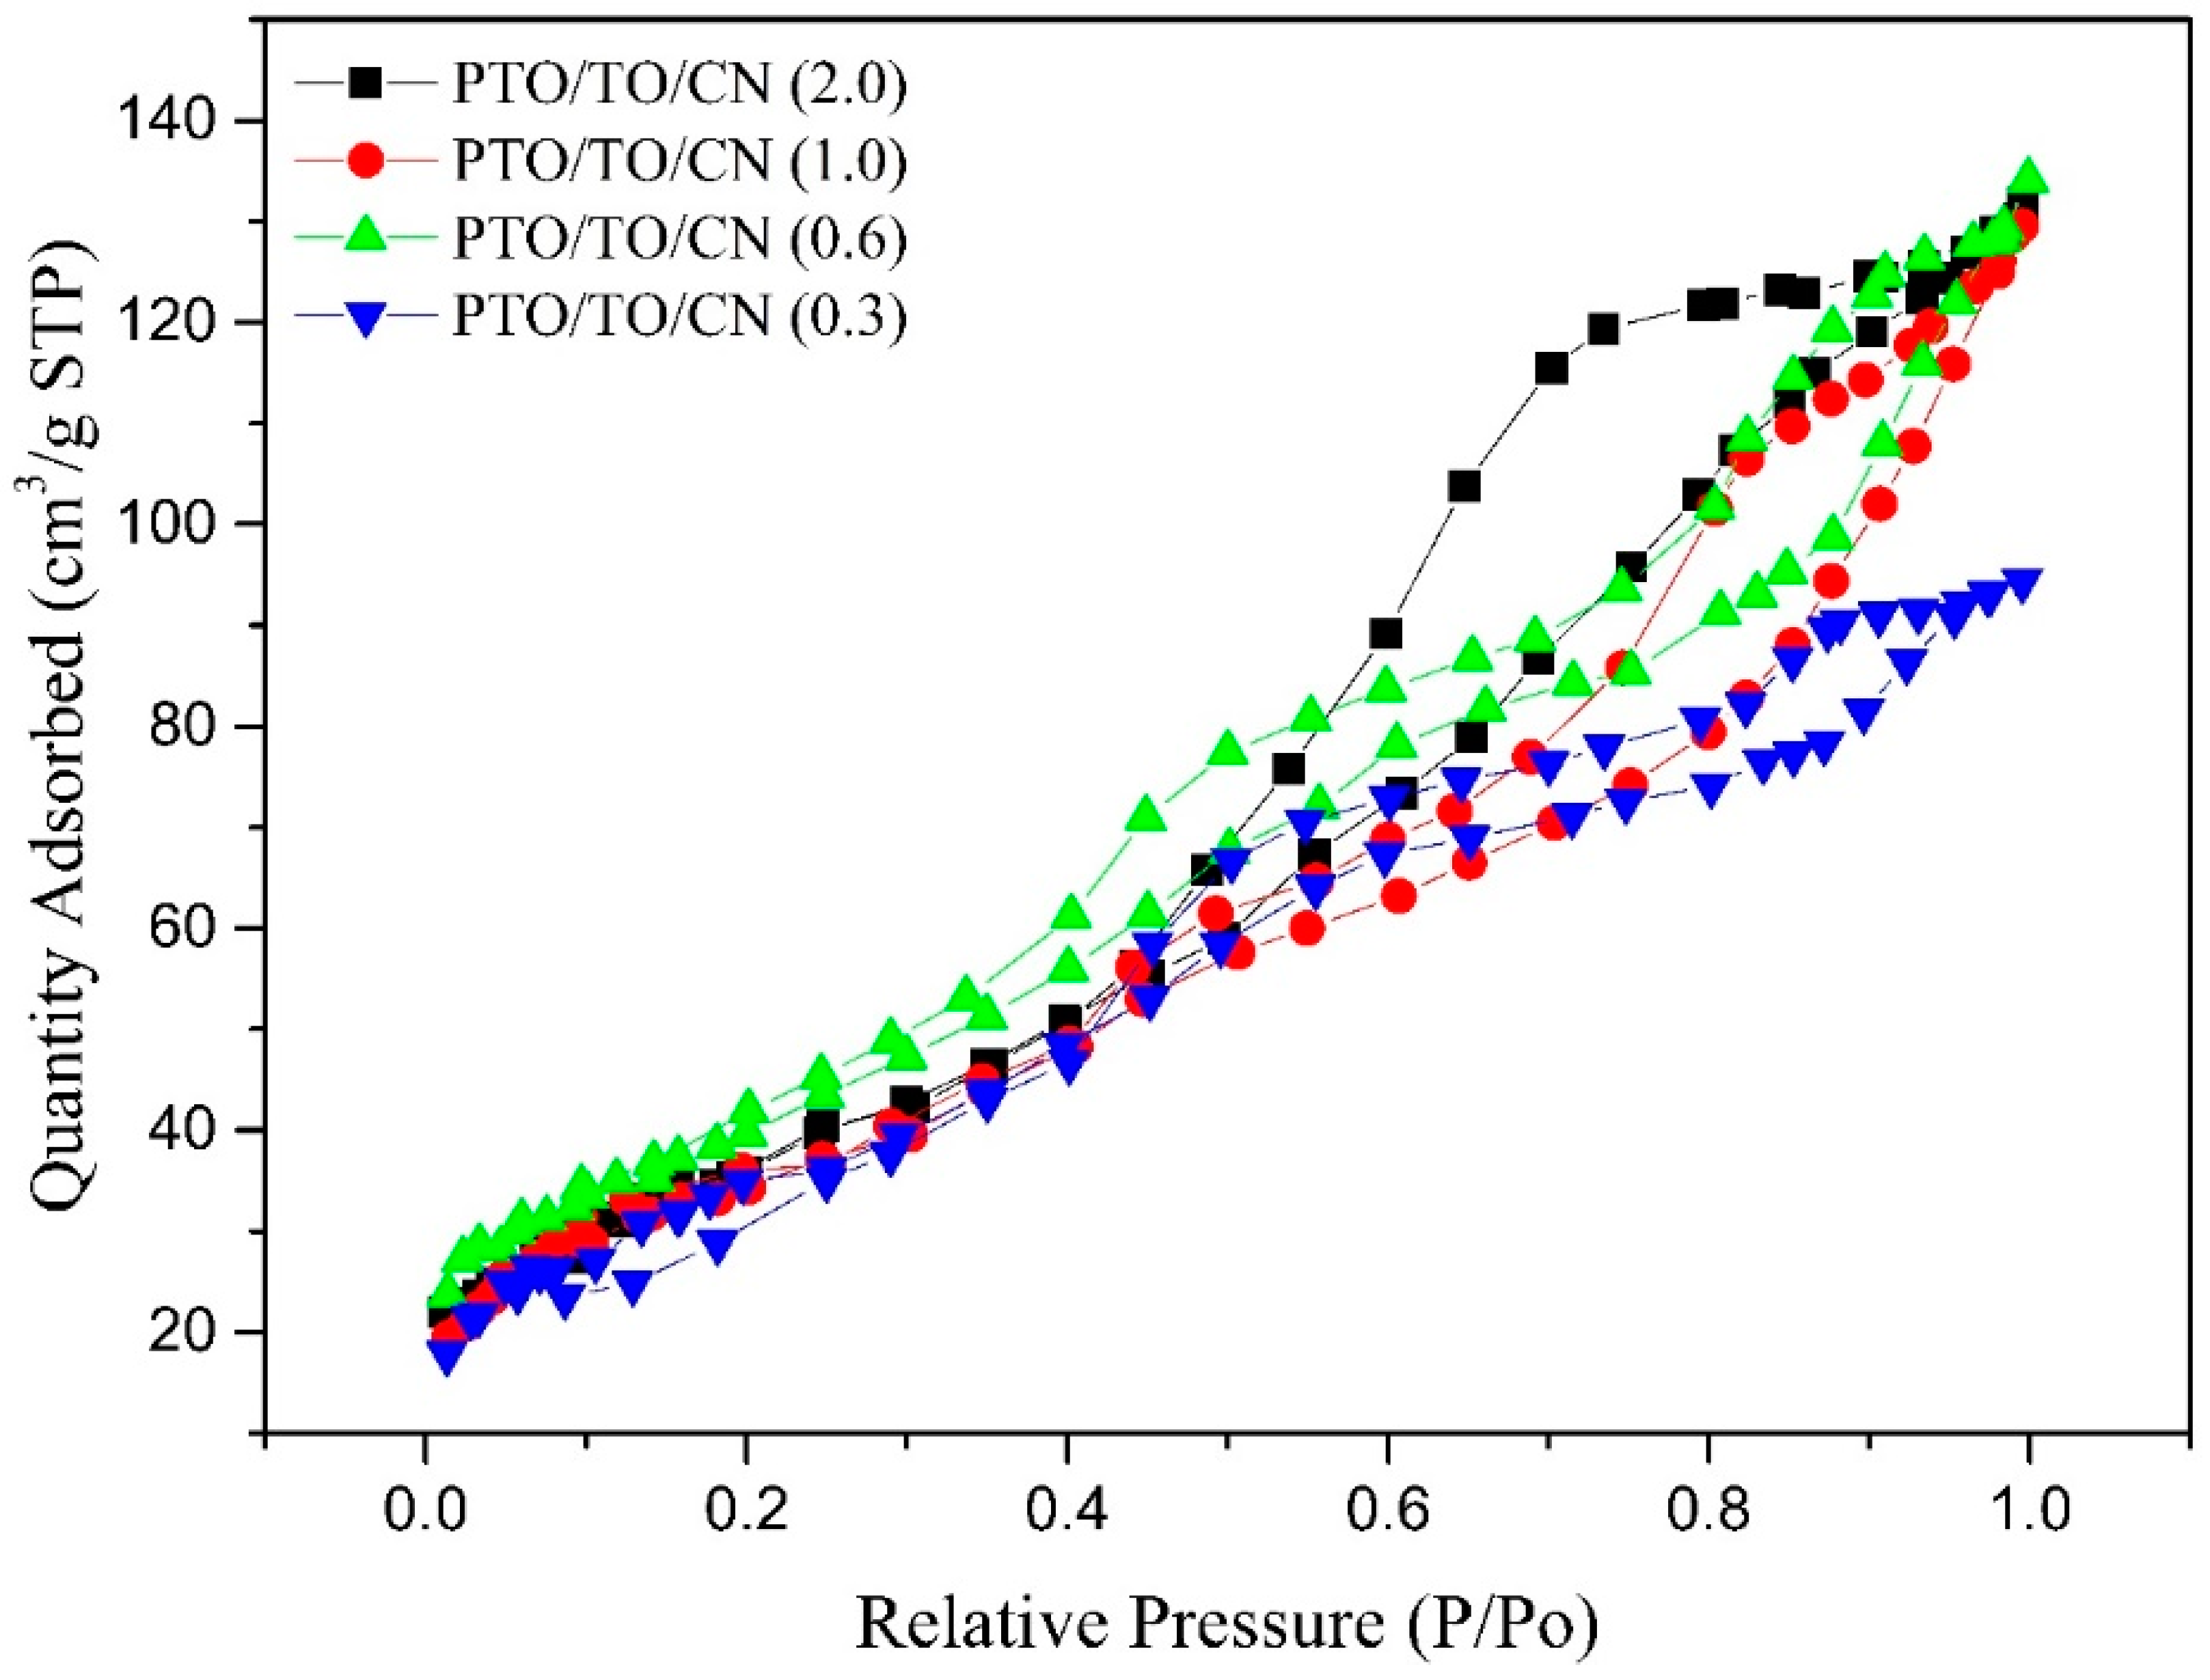
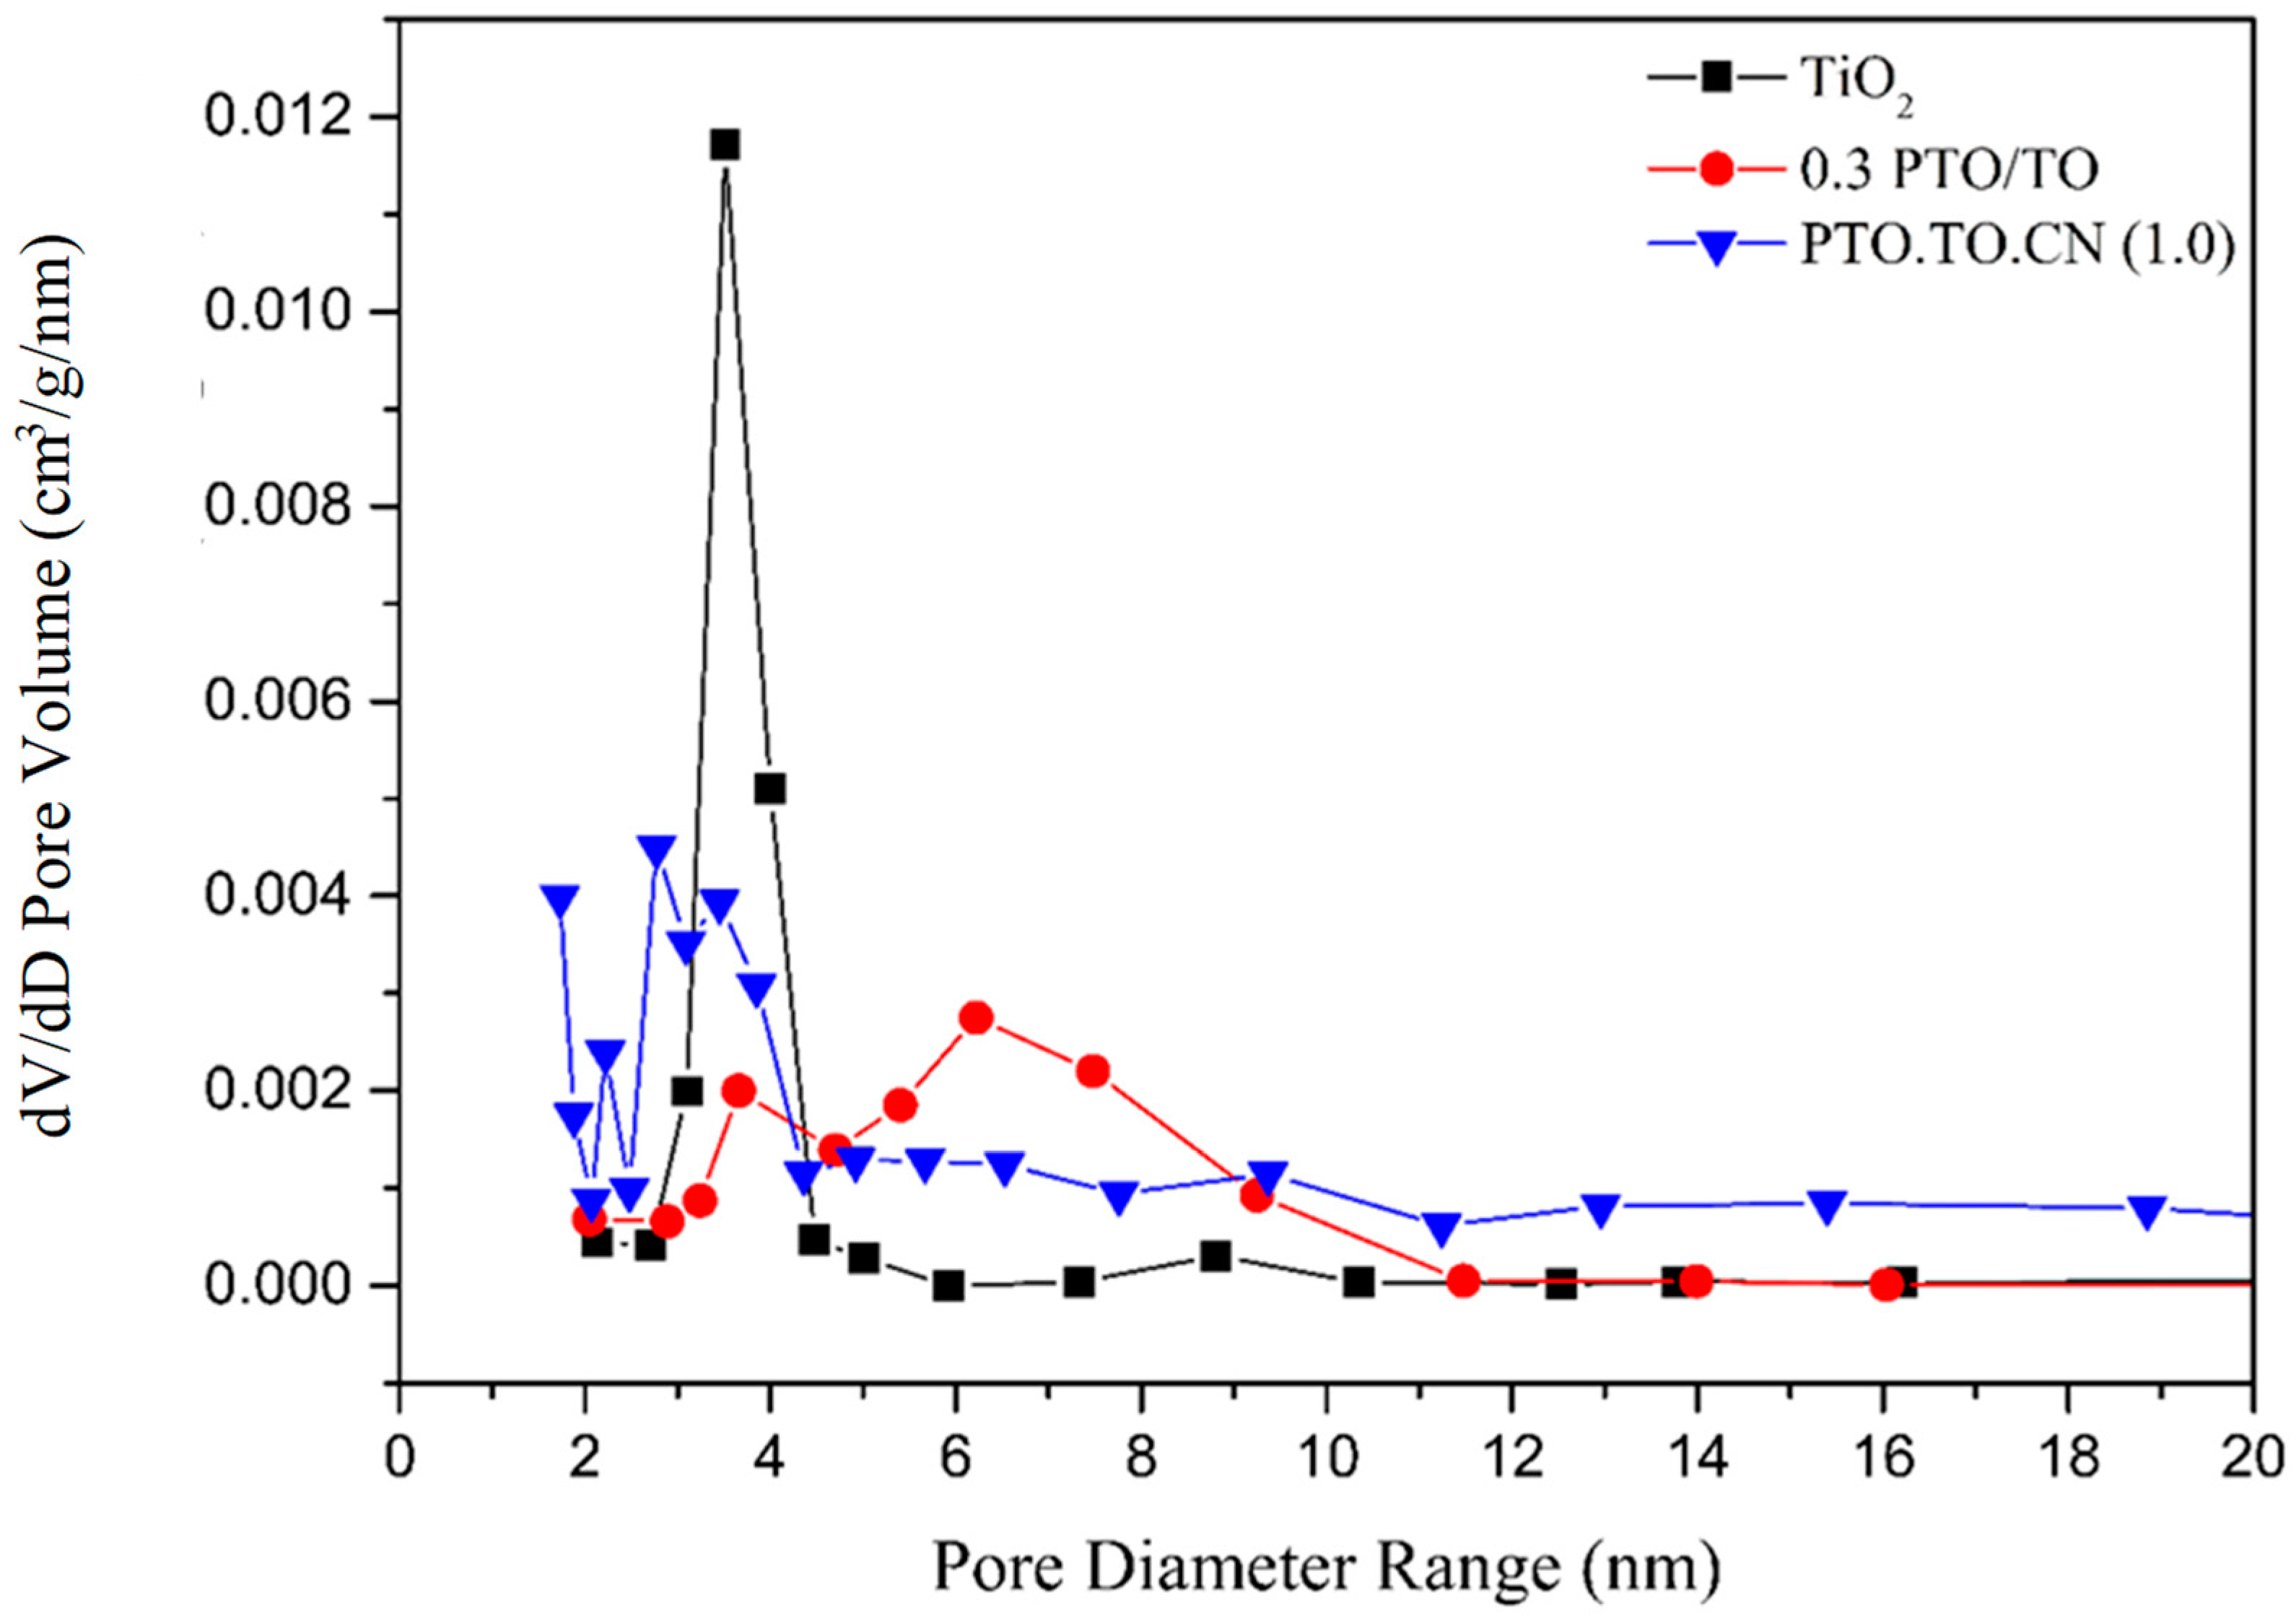
3.4. Measurement and Analysis of BET

To better assess the adsorption capacity of different photocatalysts, N2 adsorption–desorption tests were conducted using the BET method to measure particle size range and specific surface area. Among the photocatalysts tested, PTO/TO/CN (1.0) exhibited the highest visible light photocatalytic efficiency.
Figure 16 illustrates the isothermal adsorption–desorption curves of TiO2, 0.3 PTO/TO, and PTO/TO/CN (1.0). It can be observed that the adsorption–desorption isotherms of PTO/TO were higher than those of TiO2, indicating a superior dispersion of TiO2 particles and an increased specific surface area, due to the addition of PbTiO3. This also enhanced the N2 adsorption capacity of PTO/TO. The adsorption–desorption isotherms of PTO/TO/CN (1.0) were higher than those of 0.3 PTO/TO across all pressure ranges. The addition of g-C3N4 facilitated the dispersion of PTO/TO particles on the surface of the g-C3N4, and the porous nature of the g-C3N4 allowed for the growth of PTO/TO microcrystals within its micropores, enabling N2 adsorption. Additionally, the presence of g-C3N4 promoted the formation of mesoporous structures, further enhancing N2 adsorption. The mesoporous structure between g-C3N4 also facilitated N2 adsorption.
Figure 17 illustrates the isothermal adsorption–desorption curves of PTO/TO/CN (0.3), PTO/TO/CN (0.6), PTO/TO/CN (1.0), and PTO/TO/CN (2.0). As the amount of g-C3N4 increased, the curves gradually rose in the medium and high-pressure ranges, with PTO/TO/CN (2.0) exhibiting the highest curve. This can be attributed to the porous nature of g-C3N4, allowing for the growth of PTO/TO microcrystals within its micropores.
Figure 18 illustrates the pore size distribution curves of TiO2, 0.3 PTO/TO, and PTO/TO/CN (1.0). TiO2 exhibited a pore size distribution between 2 and 10 nm, while 0.3 PTO/TO had a range of 3–11 nm. The doping of PbTiO3 affected the growth and aggregation behavior of nanoscale particles during the sol-gel process, resulting in both larger pore sizes and changes in the pore volume ratio and size distribution of TiO2.
PTO/TO/CN (1.0) exhibited a broader pore size distribution and had a greater number of micropores compared to the 0.3 PTO/TO. The addition of g-C3N4 promoted the formation of a special structure, with PTO/TO particles on the surface of the g-C3N4, leading to smaller PTO/TO particles and a smaller mesopore size. This also contributed to the larger specific surface area of PTO/TO/CN (1.0), compared to 0.3 PTO/TO. Figure 19 shows that PTO/TO/CN (1.0) had the largest pore size range of 1–120 nm. This is possibly due to the presence of special structured crystals with indentations.
Additionally, Table 5 presents a comparison of the specific surface areas made with each PTO/TO/CN sample. PTO/TO/CN (1.0) exhibited the highest specific surface area among the samples. This is likely due to the presence of special structured crystals with indentations, resulting in larger pore sizes and the widest pore size distribution.

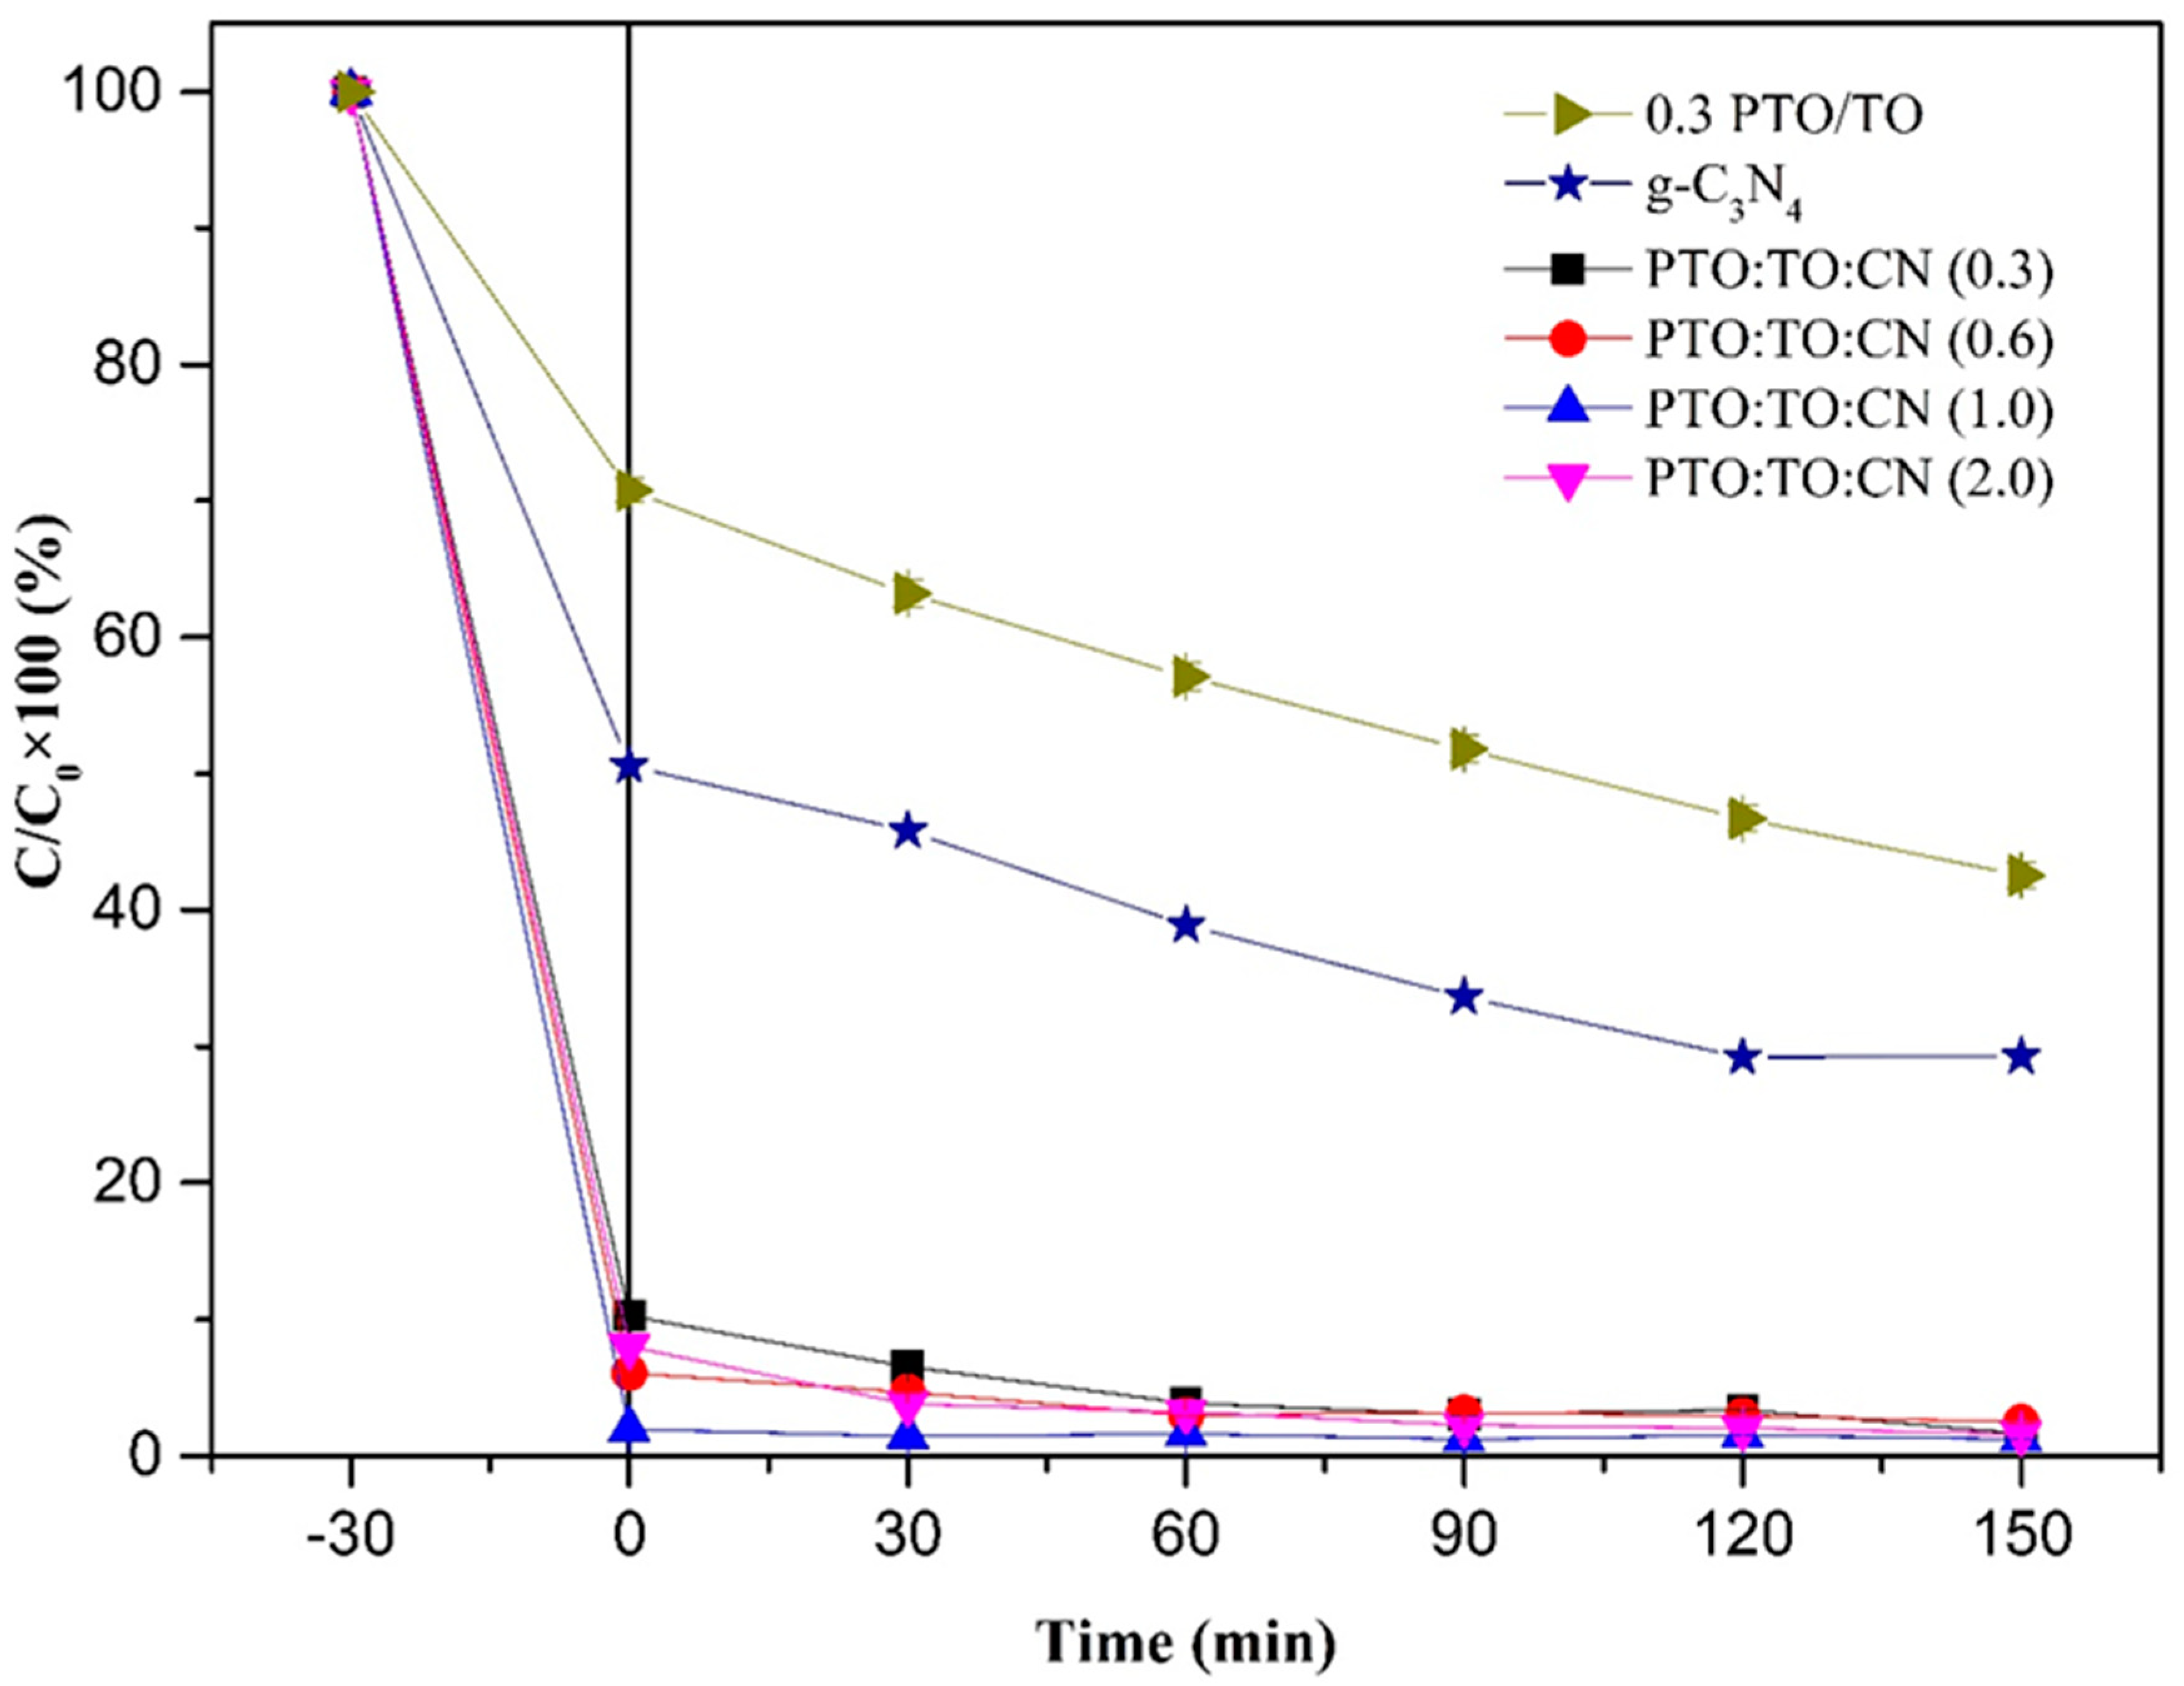
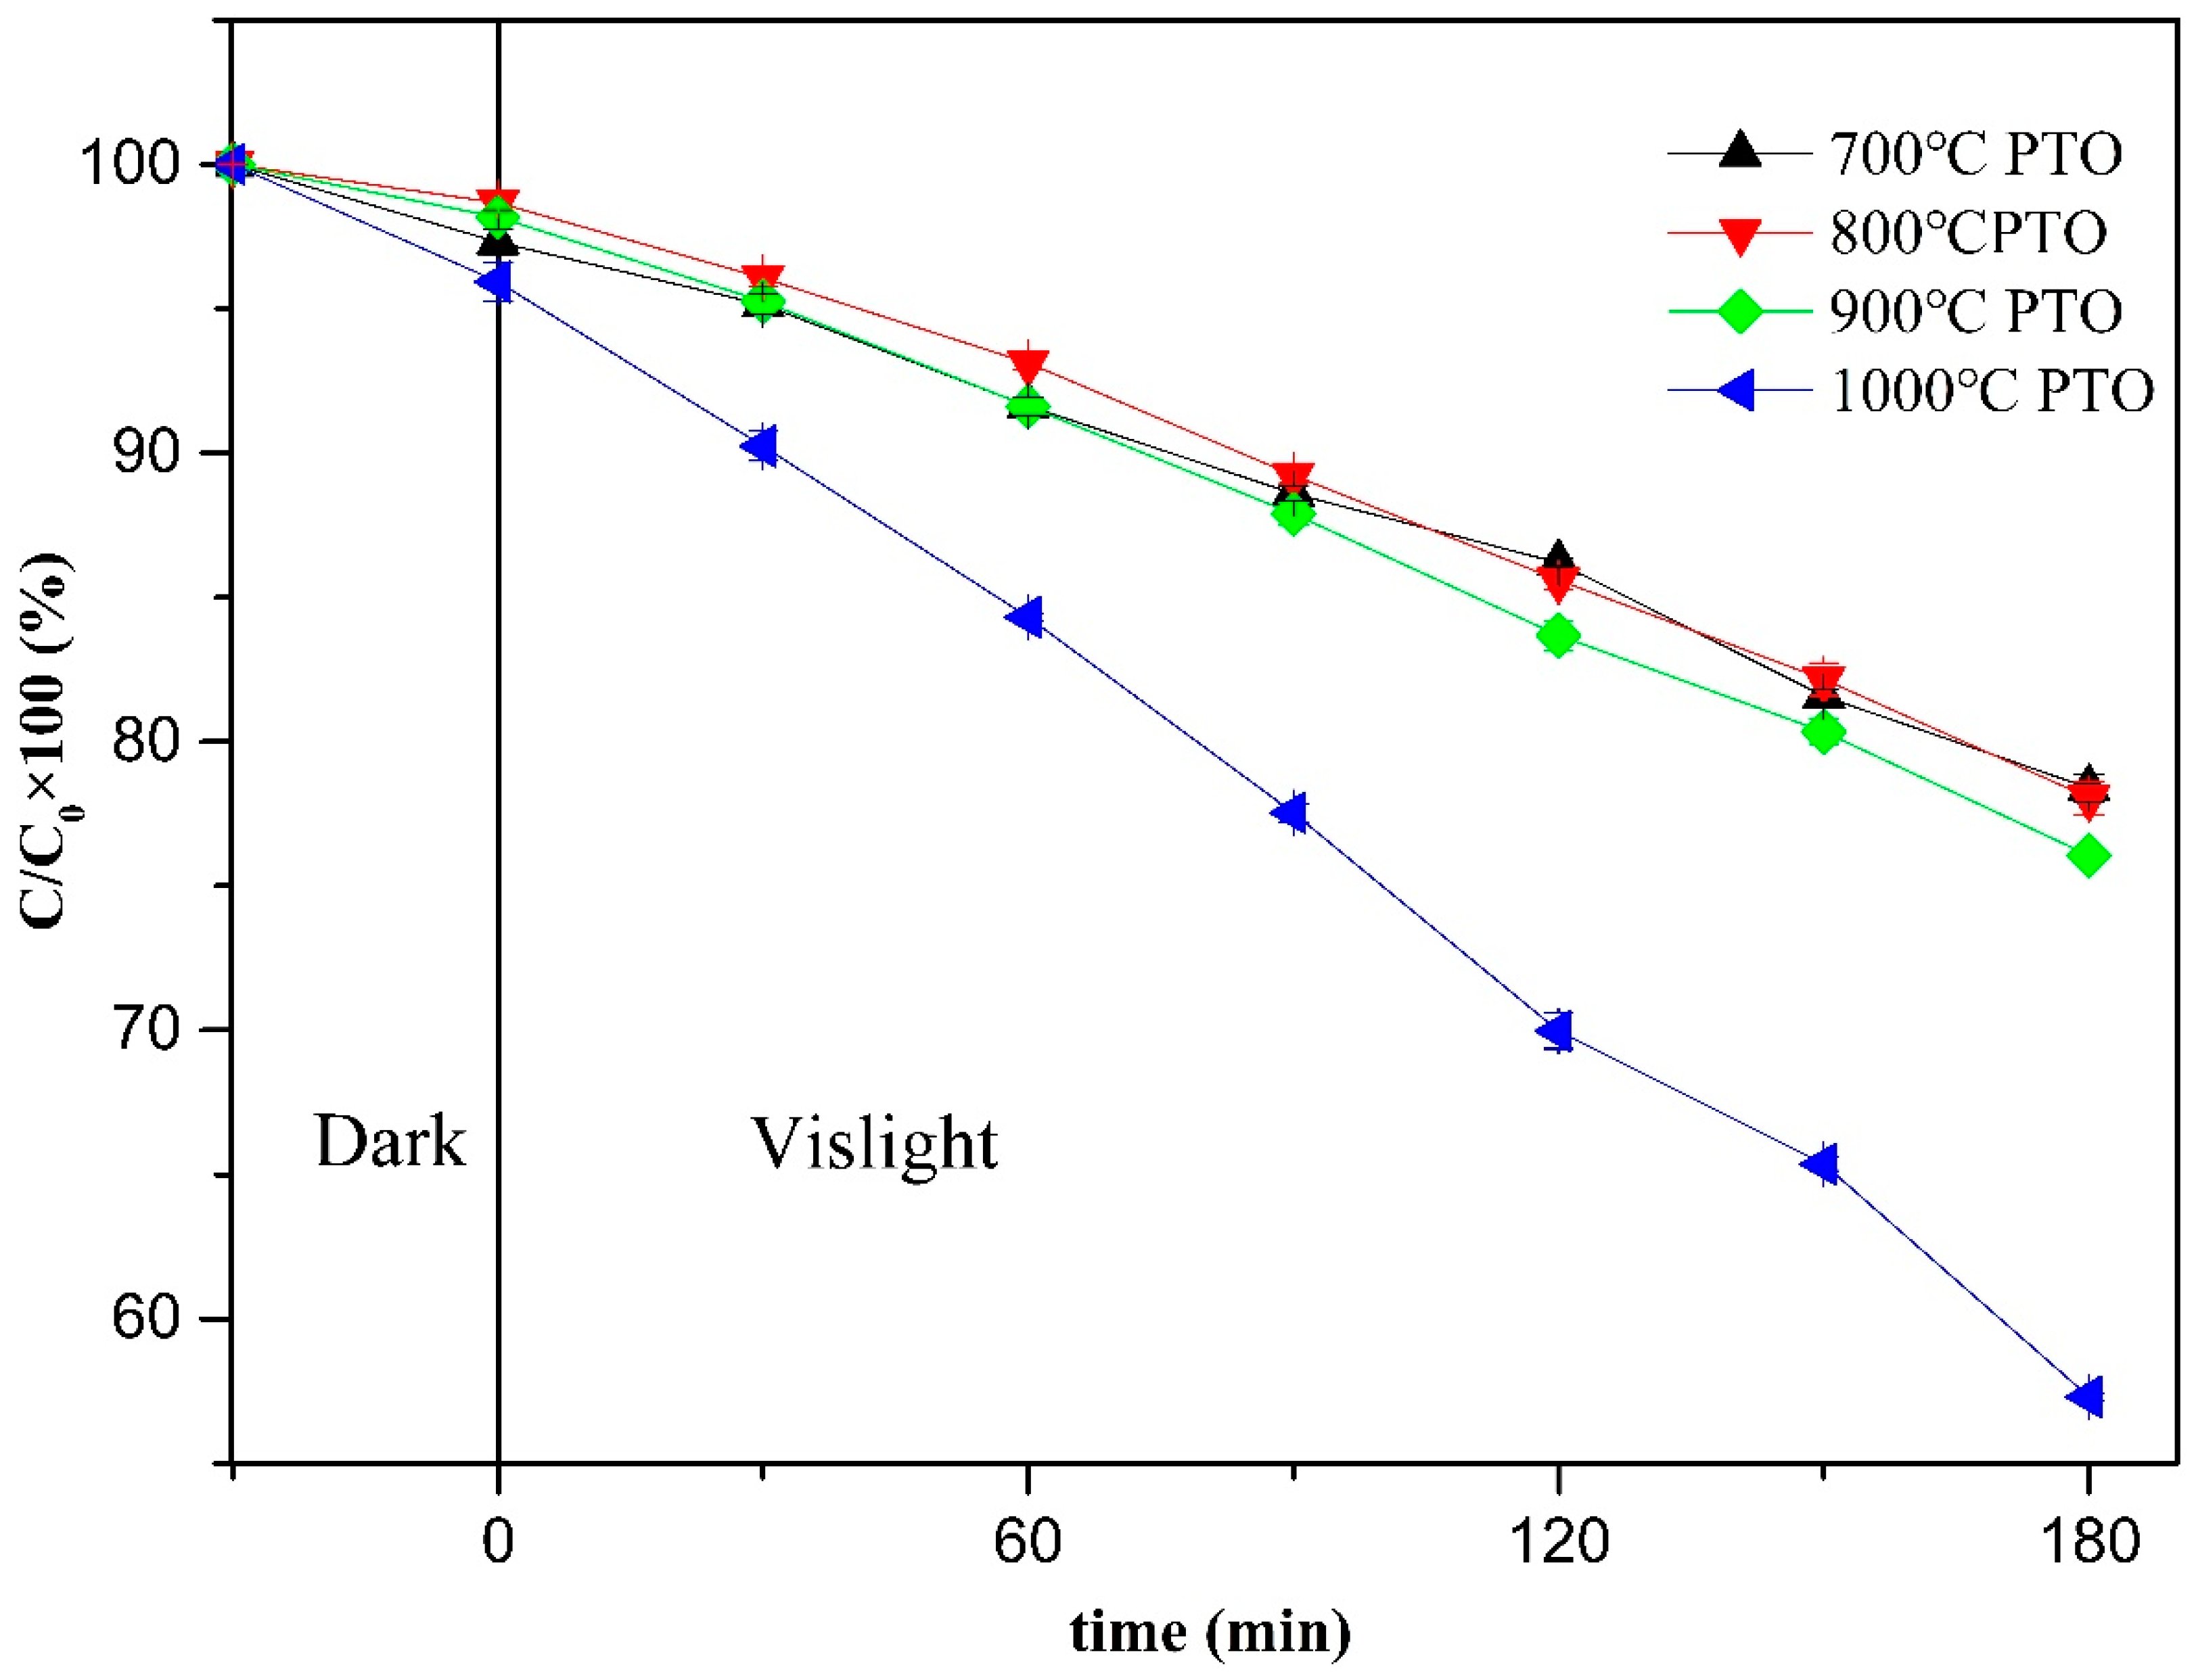
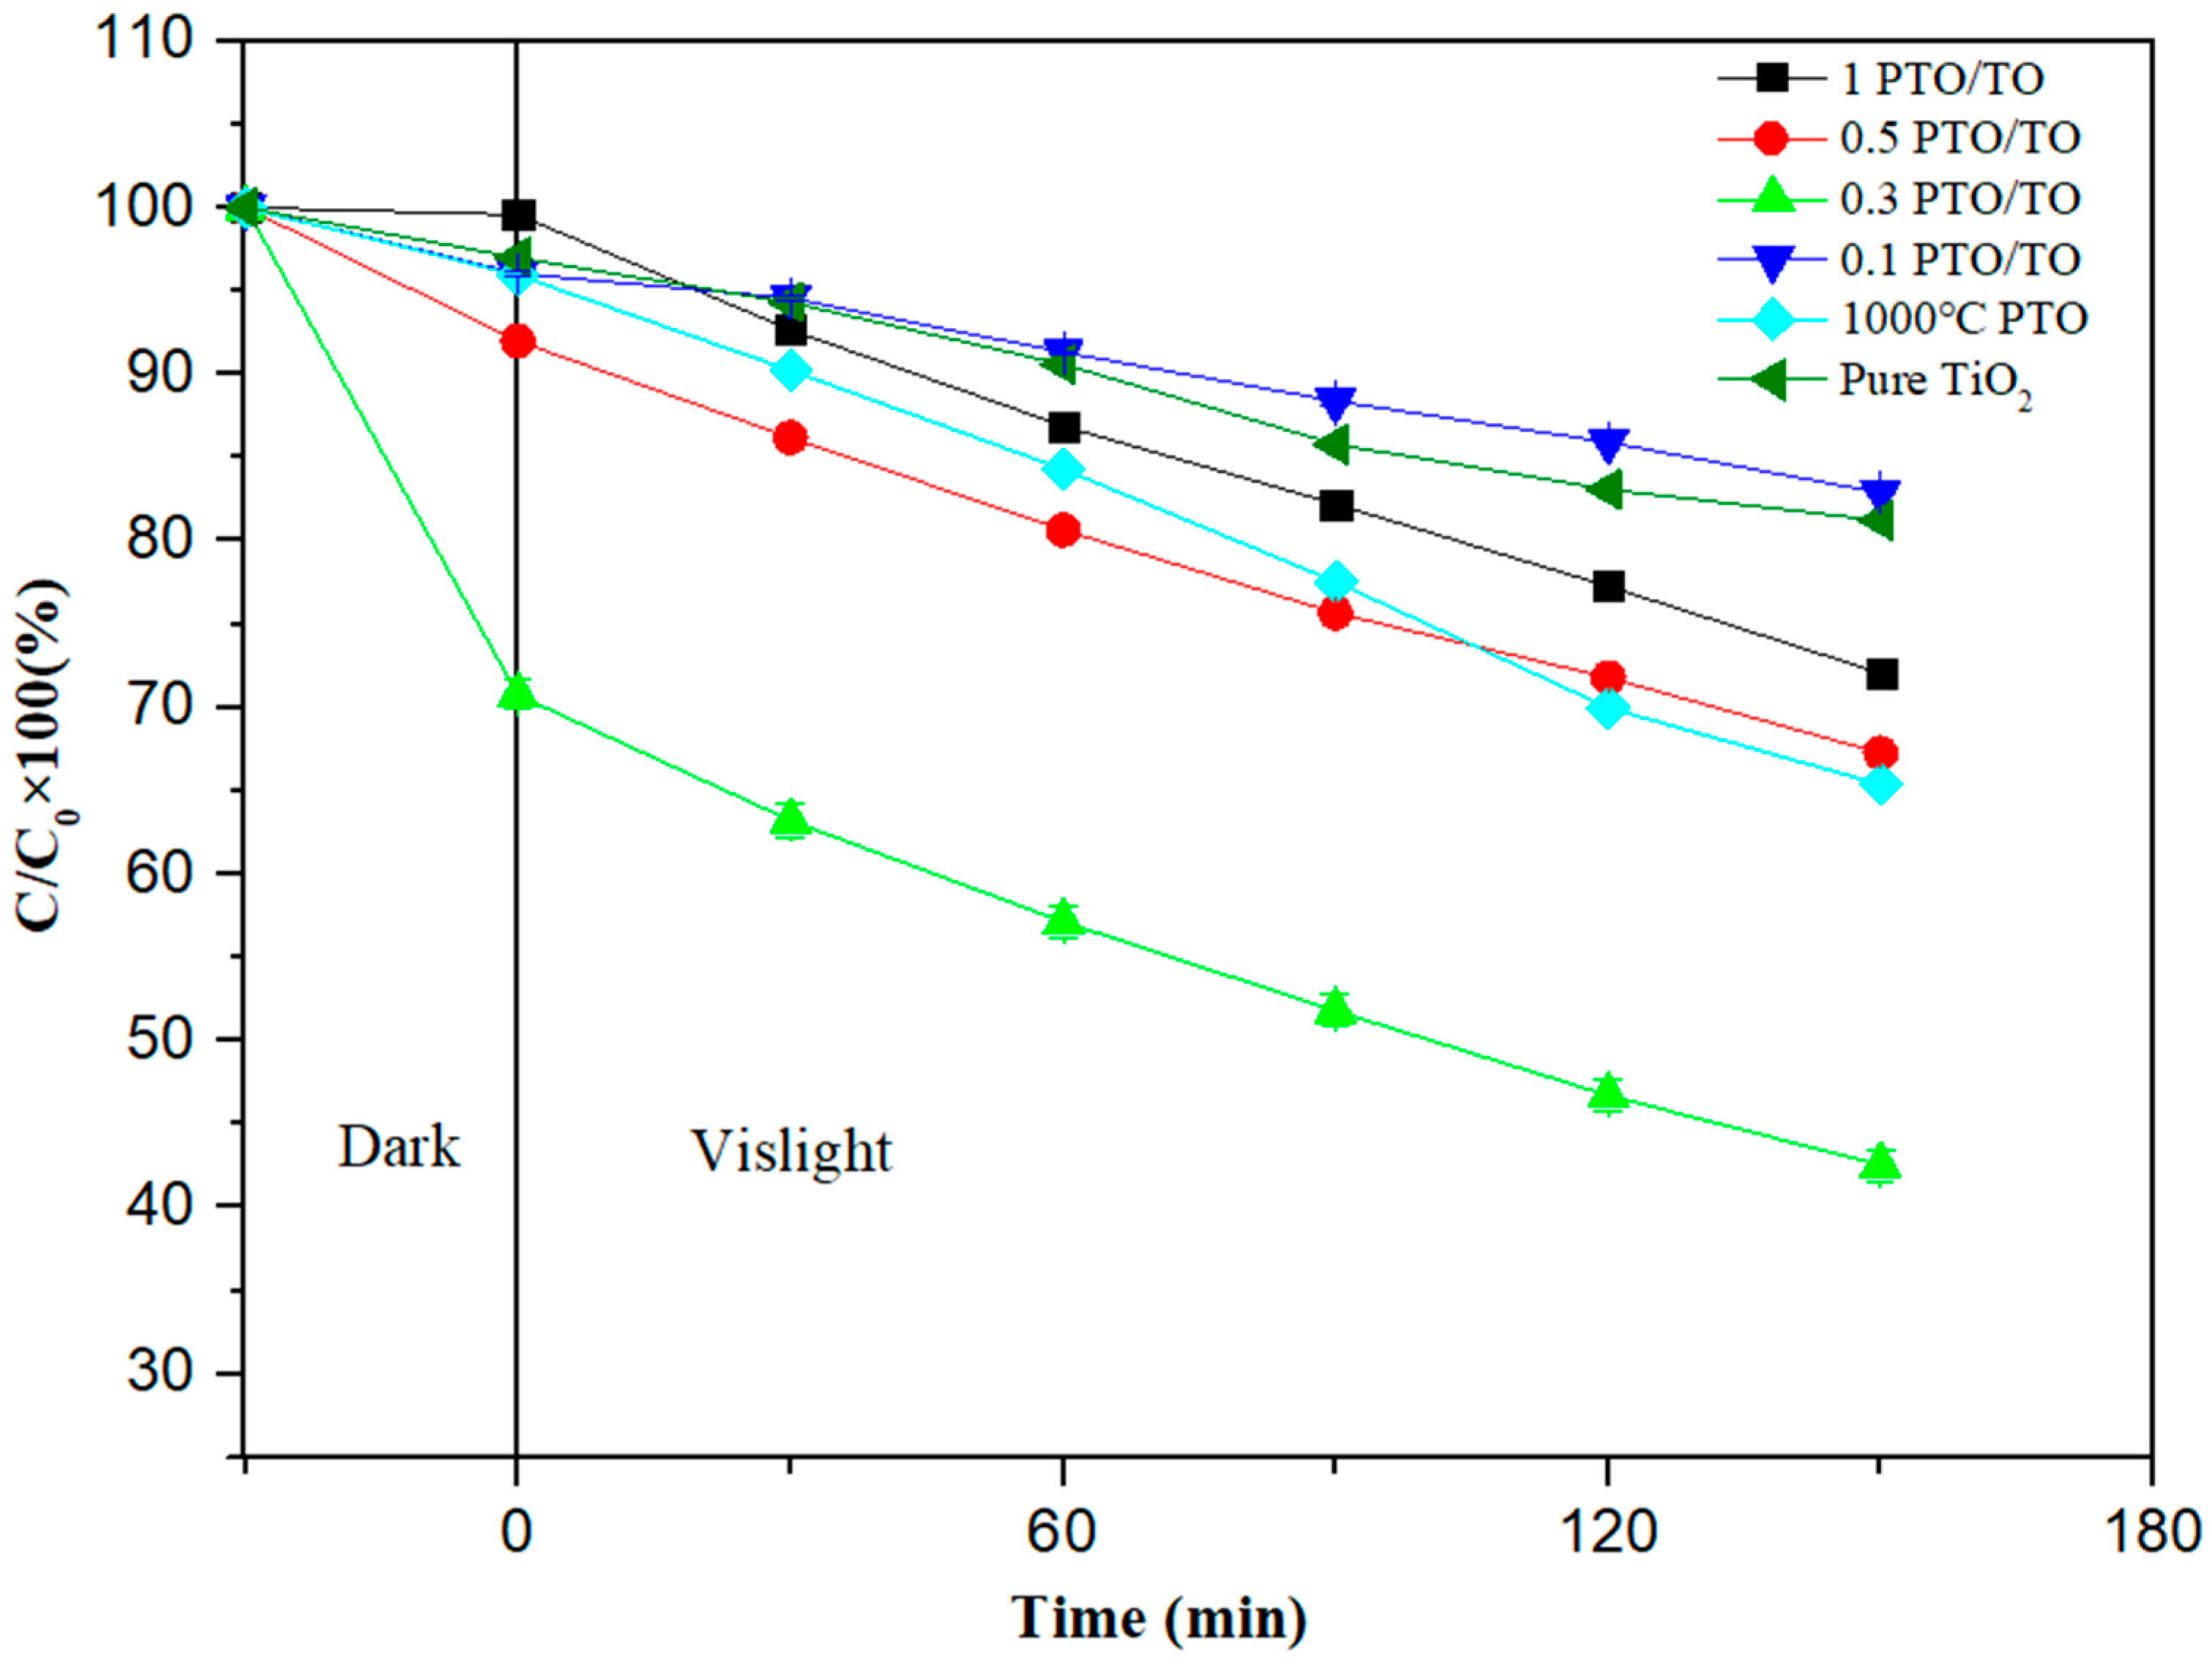
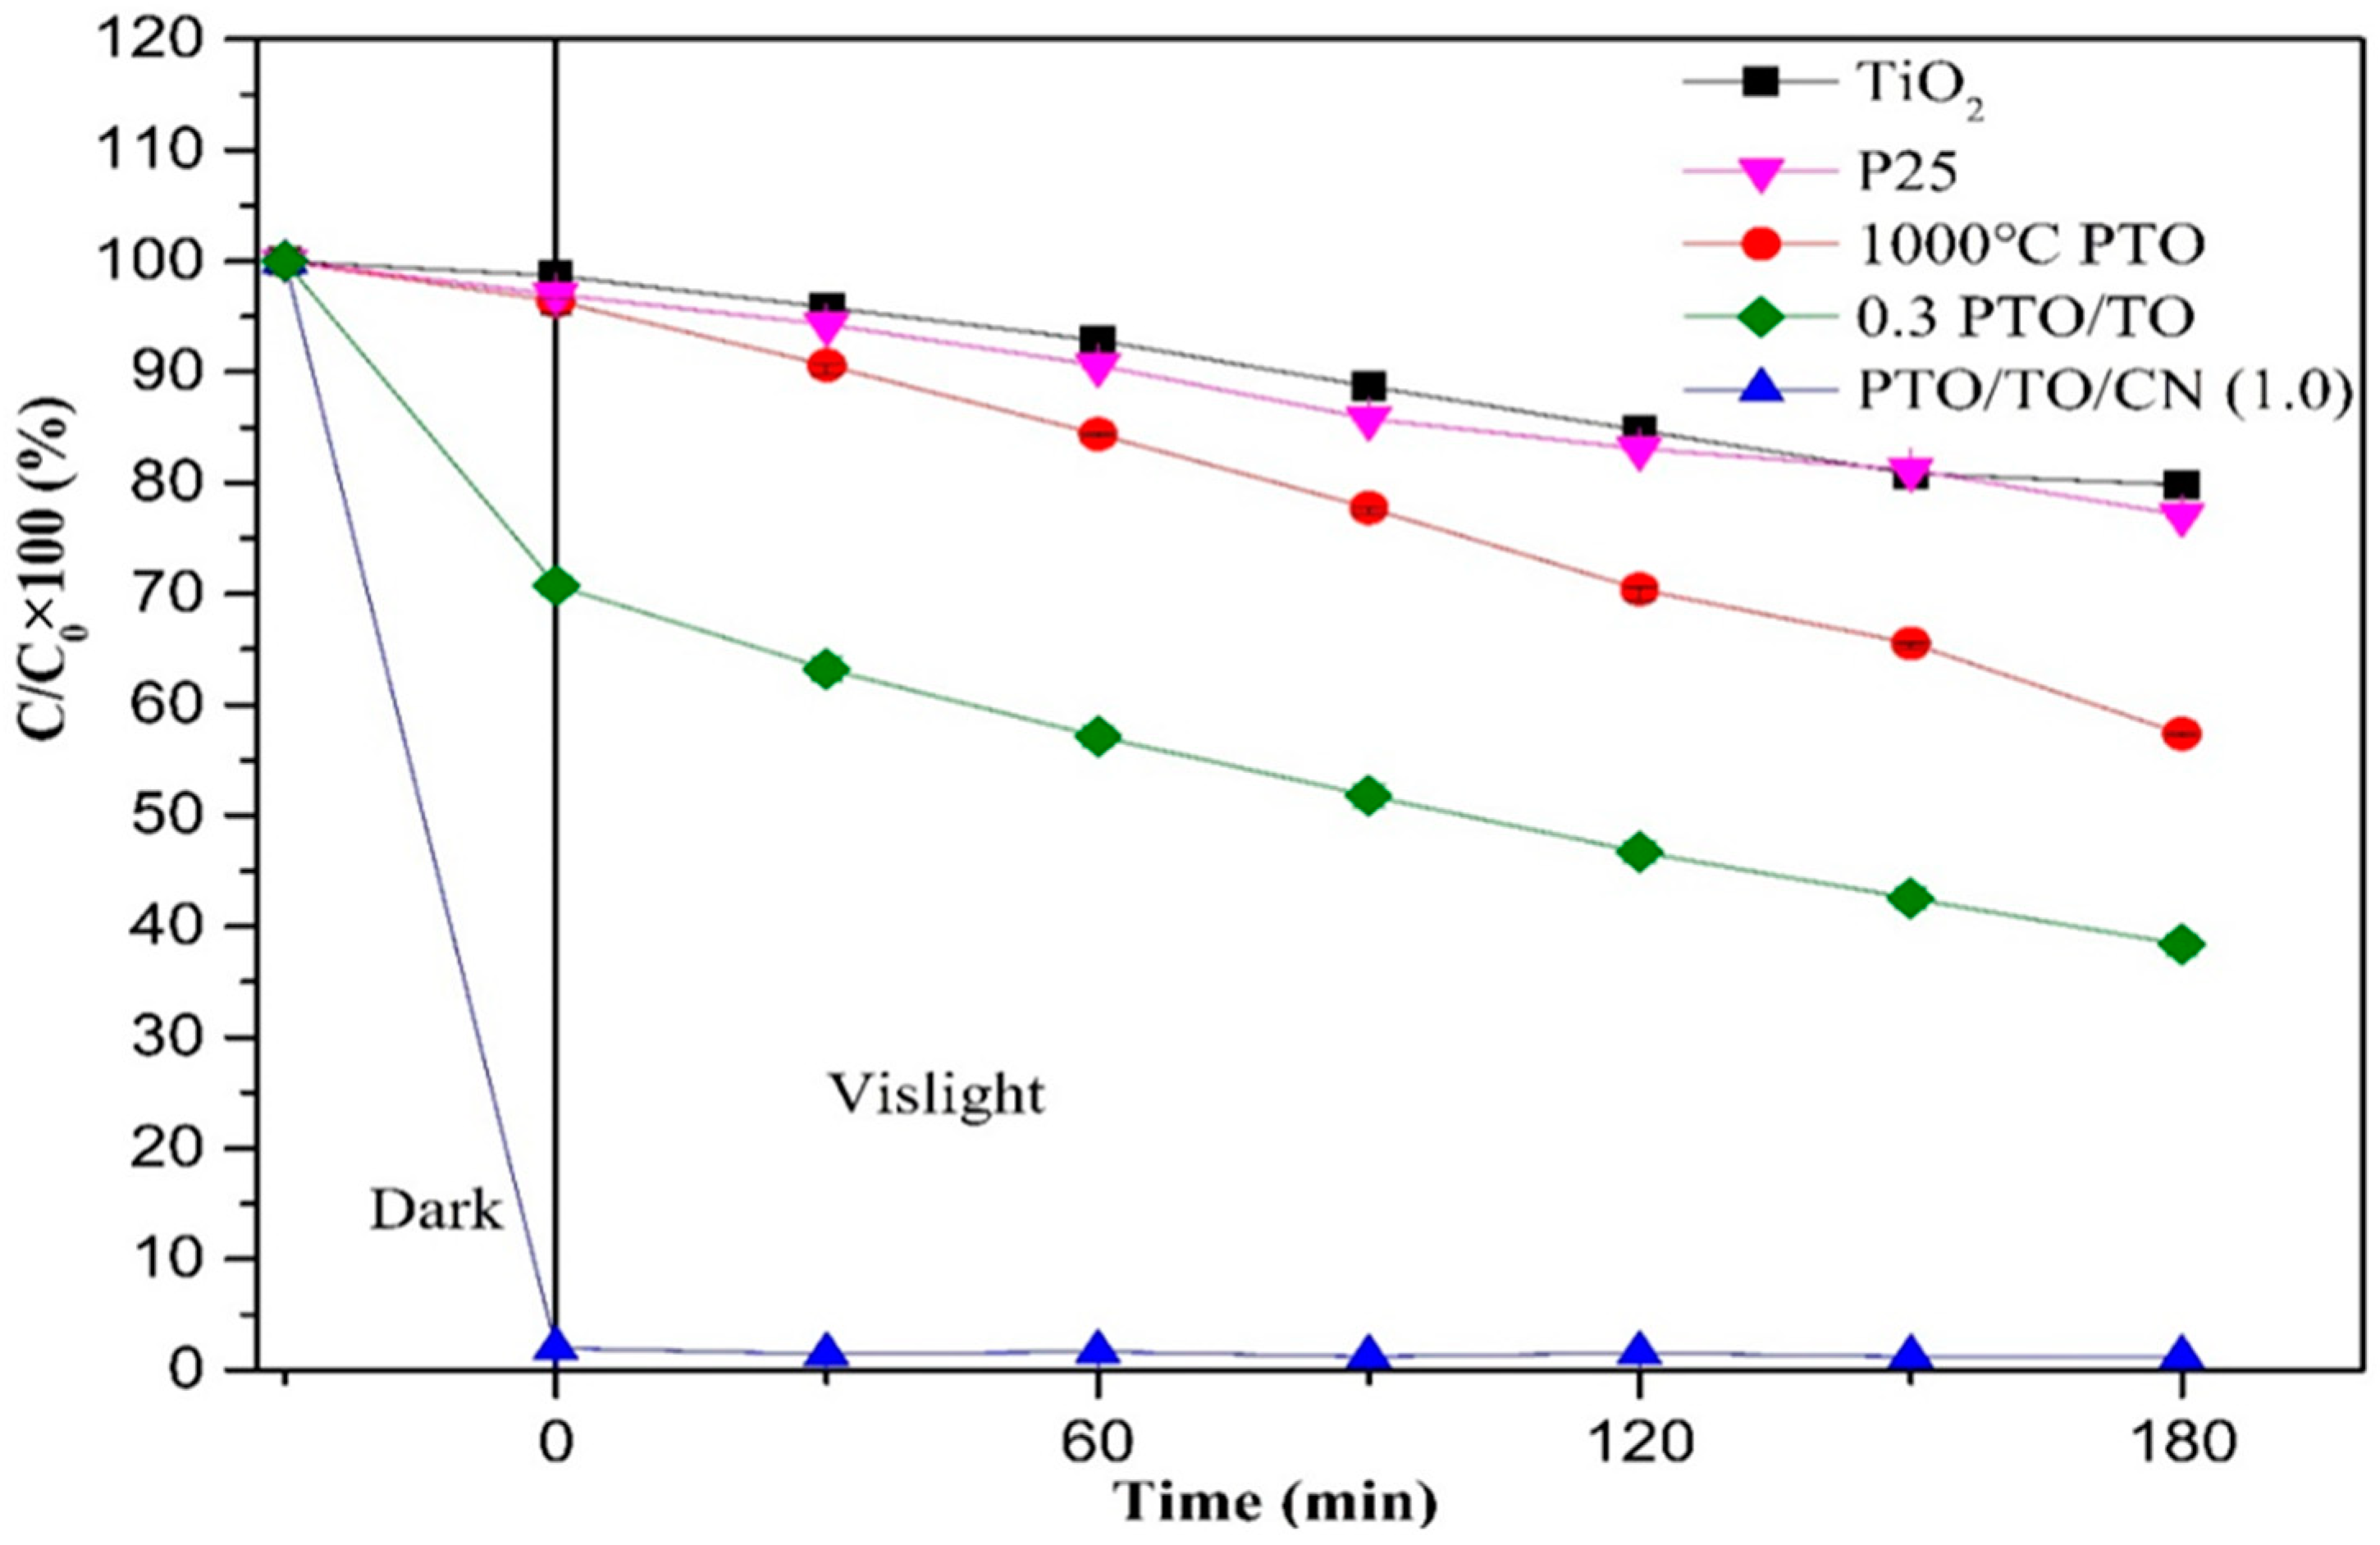
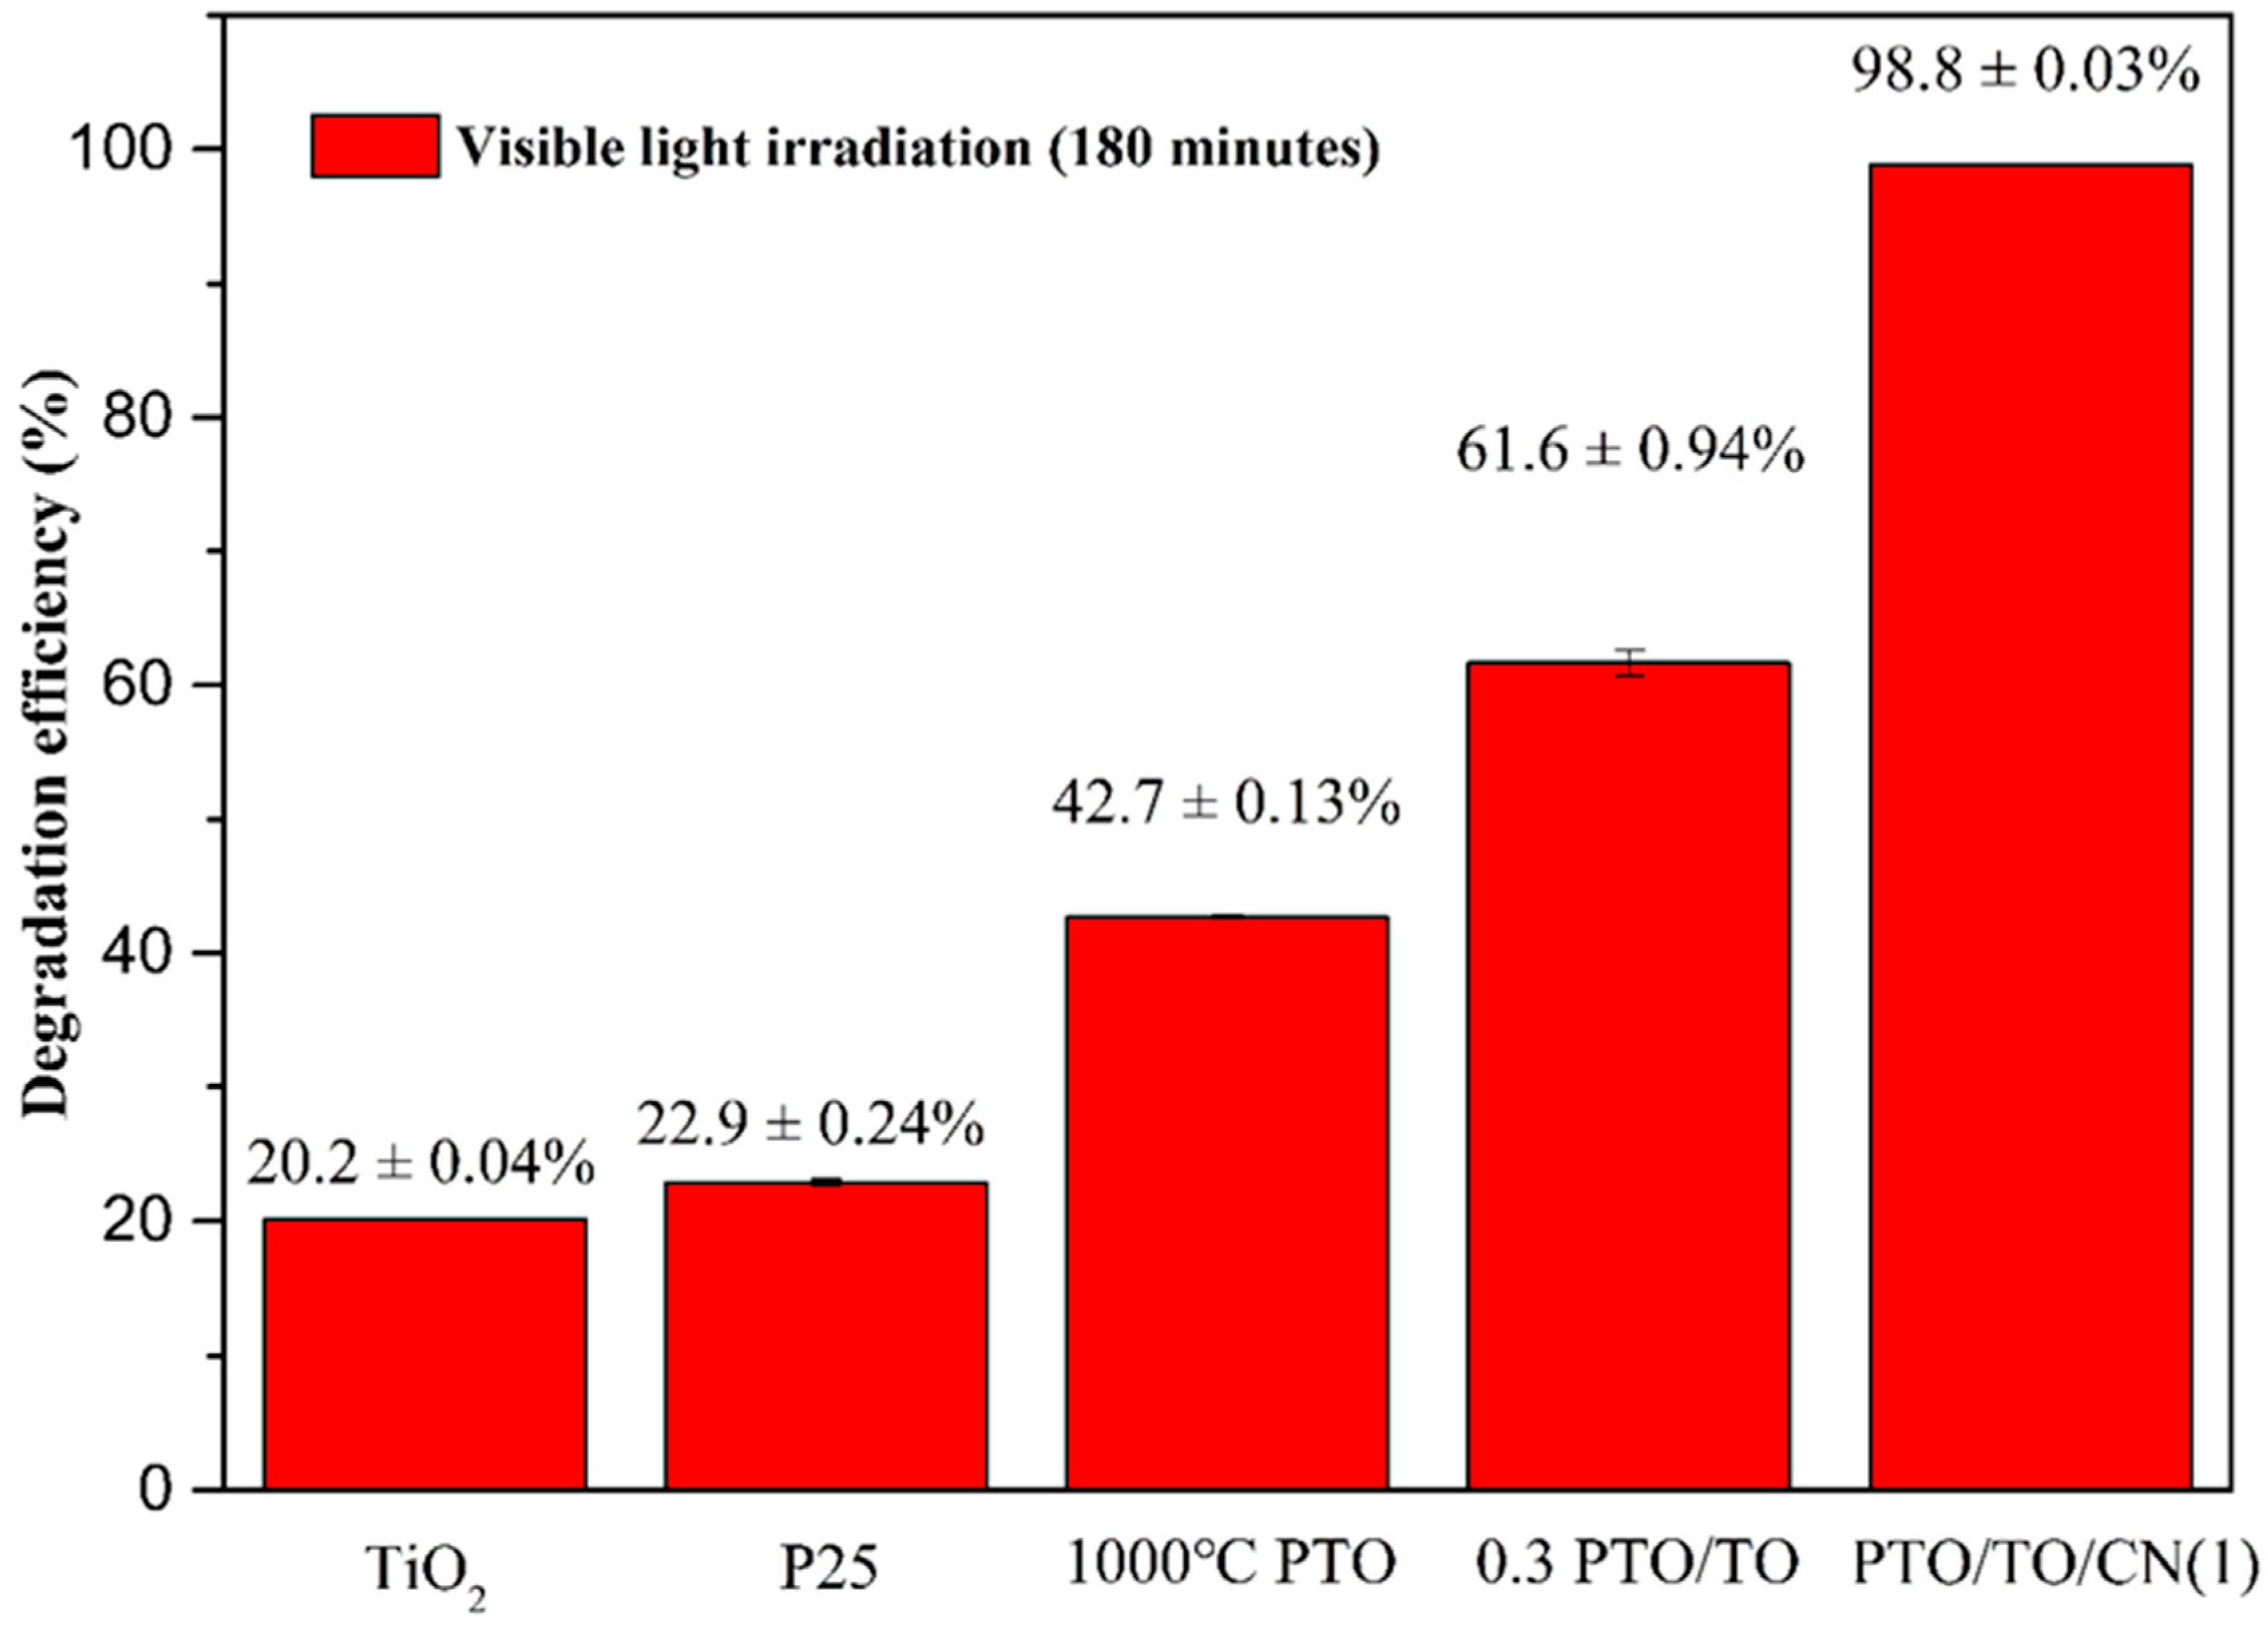
3.5. MB Removal via PTO/TO/CN Adsorption under Dark and Visible Light Photodegradation

A 0.01 g quantity of each photocatalyst was placed in 10 mL of 10 ppm MB solution. A 30 min dark adsorption period followed, and then the sample was exposed to 3 h of visible light (irradiation photodegradation). The MB concentration change was measured every 30 min during testing and the experimental data were converted to an efficiency rating using Formulas (3) to (5).
Cd is the concentration of the dark adsorption experiment, Cl is the concentration of the visible light irradiation photodegradation experiment, and C0 is the initial concentration of methylene blue. Ad is the dark adsorption efficiency, Al is the photodegradation efficiency, and At is the summed photocatalytic efficiency.
A d ( Dark   Adsorption   rate ) = C d C 0 × 100
A l ( Daylight   Photodegradation   rate ) = C l C 0 × 100 %
A t ( Total   Photocatalytic   rate ) = A d + A l
The residual rate of MB degradation due to PTO synthesized at different temperatures is shown in Figure 20. Under dark adsorption for 30 min, followed by visible light irradiation for 3 h, the MB residual ratios for 700 °C PTO, 800 °C PTO, 900 °C PTO, and 1000 °C PTO were 78.40 ± 0.46%, 78.06 ± 0.57%, 76.06 ± 0.25%, and 57.38 ± 0.13%, respectively. Among these samples, the lowest residual rate of 1000 °C PTO was 57.38 ± 0.13%, and its total removal rate was the highest, up to 42.62 ± 5.58%, making it the superior PTO for MB removal in this batch of samples.
Next, the residual rate of MB degradation by a composite photocatalyst PTO/TO with different ratios was examined. Figure 21 shows that, under dark adsorption for 30 min and visible light irradiation for 2.5 h, the MB residual ratios of 1 PTO/TO, 0.5 PTO/TO, 0.3 PTO/TO, and 0.1 PTO/TO were 72.06 ± 0.32%, 67.27 ± 0.57%, 42.53± 9.61%, and 82.88 ± 0.09%, respectively. Among these samples, the lowest residual rate of 0.3 PTO/TO was 42.53 ± 9.61%. Thus, the highest total removal rate of MB by PTO/TO was 57.47 ± 9.61%. It is concluded that adding PTO to TiO2 can increase the photocatalytic effect, but the addition should not be excessive.
Taking the optimal 0.3PTO/TO ratio, a new photocatalyst doped with different g-C3N4 weights was synthesized, creating PTO/TO/CN. The residual MB degradation rate is shown in Figure 22, where it can be seen that residual MB ratios for PTO/TO/CN (2), PTO/TO/CN (1), PTO/TO/CN (0.6), and PTO/TO/CN (0.3), under dark adsorption for 30 min and visible light irradiation for 2.5 h, were 1.66 ± 0.00%, 2.49 ± 0.00%, 1.21 ± 0.02%, and 1.62 ± 0.01%, respectively. The dark period adsorption effect appears notably improved, and the MB residual ratios reached 8.02 ± 0.008%, 1.97 ± 0.002%, 6.07 ± 0.001%, and 10.26 ± 0.006%, respectively.
Of the observed values, the lowest residual rate was provided by PTO/TO/CN (1), 1.21 ± 0.02%; this means that that total removal rate was 98.79%, removing almost all of the MB from the water sample. Therefore, this was considered the optimal PTO/TO/CN ratio in this part of the experiment for the removal of MB. The degradation experiment results were verified through SEM. PTO/TO/CN was able to adsorb MB using its pores, and then continued to decompose due to its photodegradation characteristics.
Finally, a comparison of P25 was made with various photocatalysts, as shown in Figure 23. This figure shows how residual rates of MB change during treatment with P25, TiO2, 1000 °C PTO, 0.3 PTO/TO, and PTO/TO/CN (1) under dark adsorption for 30 min, then visible light irradiation for 3 h, where the residuals were 77.10 ± 0.24%, 79.83 ± 0.52%, 57.29 ± 0.13%, 38.35 ± 9.38%, and 1.18 ± 0.03%, respectively.
The removal rate of MB after degradation under visible light for 3 h is shown in Figure 24. The degradation effect of TiO2 was equivalent to that of P25, but the addition of PTO improved the degradation effect under visible light. This is because the P-type semiconductor heterostructure was formed by coupling two components, and this generated a “built-in” electrical field at the junction interface; this enhanced charge separation and facilitated the reverse transfer of electrons and holes to different components. The value of the valance band (VB) also changed, from 2.91 eV to 0.27 eV, as shown in Figure 25.
This is because the CB edge potential of PbTiO3 (−2.23 eV vs. NHE) is more negative than that of TiO2 (−0.29 eV vs. NHE). The large potential difference between the CB edges of PbTiO3 and TiO2 promoted electron transfer from PbTiO3 to TiO2, enhancing the separation of photo-induced charge carriers and the corresponding photocatalytic activity. Both the CB edges of PbTiO3 and TiO2 were more negative than the oxidation-reduction potential of the O2/O2 couple (−0.046 eV vs. NHE), allowing the adsorbed O2 to react with the electrons on the CBs of PbTiO3 and TiO2 to generate superoxide radicals. On the other hand, the photo-generated positive holes remained in the VB of PbTiO3. Since the VB edge potential of PbTiO3 (+0.27 eV vs. NHE) was lower than the oxidation-reduction potentials of the ·OH/OH– couple (+1.99 eV vs. NHE) and the ·OH/H2O couple (+2.68 eV vs. NHE), the strong potential difference between the CB edges of PbTiO3 and TiO2 promoted electron transfer from PbTiO3 to TiO2, reacting with OH– or H2O to generate highly reactive hydroxyl radicals [35,36].
A UV-Vis spectrophotometer was used to test the absorbance of the materials. In this study, the absorption wavelengths of TiO2, 700 °C PTO, 800 °C PTO, 900 °C PTO, and 1000 °C PTO were examined, and wavelength measurements were taken in the range 200–800 nm. As shown in Figure 26a,b, Equation (7) was used to convert the absorption spectrum into a Tauc plot. The Tauc plot curve on the X-axis was extrapolated to obtain the energy gap values. In Equation (7), α is the absorption coefficient, h is Planck’s constant, v is the photon frequency, A is a constant, and Eg is the energy gap. In this study, because PpTiO3 and TiO2 are indirect band gaps, the value of n is 2.
α h v = A ( h v E g ) n
The calculated energy gaps of TiO2, 700 °C PTO, 800 °C PTO, 900 °C PTO, and 1000 °C PTO were recorded as 3.2 eV, 2.62 eV, 2.59 eV, 2.57 eV, and 2.51 eV, respectively. Figure 27a,b shows that as the synthesis temperature increased, the PTO energy gap became smaller, and the crystallinity improved the electronic transition. This was used to verify the results of the MB degradation experiments. The experimental results in the visible light wavelength range 390–800 nm showed that changes within that range yielded different results for PTO/TO photocatalysts with different weight ratios. The 0.3 PTO/TO exhibited the highest visible light absorption, as shown in Figure 28b. Converting the UV-Vis absorption of 1 PTO/TO, 0.5 PTO/TO, 0.3 PTO/TO, and 0.1 PTO/TO photocatalysts into Tauc diagrams, the energy gap values were 2.6 eV, 2.3 eV, 2.25 eV, and 2.46 eV, respectively. The photocatalyst with 0.3 PTO/TO had the lowest energy gap, and this was consistent with the prior degradation experiments.
Figure 29 shows that PTO/TO/CN (1) had the highest visible light absorption, and the converted energy gap value was 2.59 eV. This corresponded to the dye removal experiment, where the better the visible light absorption, the better the photocatalytic effect. Therefore, the absorbance influences the photocatalytic effect, and cannot be judged only by the smaller energy gap.

4. Conclusions

PbTiO3 was successfully synthesized using a self-made ball mill via the solid-state reaction method. The optimal calcination temperature was determined to be 1000 °C. The XRD and SEM results showed that the 1000 °C PTO sample exhibited the highest crystallinity, and also exhibited the highest MB removal rate under visible light, compared to other PbTiO3 samples. The XRD and SEM analysis demonstrated that PTO/TO/CN (1.0) had particles with special structures, and a smaller particle size than other combinations. The BET analysis of PTO/TO/CN (1.0) showed that it had the largest specific surface area, and this was attributed to the special structure of the small particles and surface irregularities, enabling it to adsorb a large amount of MB. Additionally, g-C3N4 exhibited a notable visible light response, further enhancing the visible light absorption of PTO/TO/CN (1.0). Experiments compared the widely used and commercially available P25 photocatalyst to the PTO/TO/CN (1.0) photocatalyst synthesized during this study. The PTO/TO/CN (1.0) sample exhibited significantly superior adsorption performance, even surpassing TiO2 in terms of visible light response. This study successfully developed a photocatalyst with high adsorption capacity, and the ability to degrade organic substances under visible light irradiation.

Author Contributions

Conceptualization, Y.-H.N.; methodology, Y.-L.L.; resources, Z.-J.S.; resources, M.-S.L.; writing—review and editing, T.-Y.H. All authors have read and agreed to the published version of the manuscript.

Funding

This research was funded by National Science and Technology Council, Taiwan: NSTC 112-2221-E-224-026-.

Data Availability Statement

Not applicable.

Conflicts of Interest

The authors declare no conflict of interest.

References

  1. Islam, T.; Repon, M.R.; Islam, T.; Sarwar, Z.; Rahman, M.M. Impact of textile dyes on health and ecosystem: A review of structure, causes, and potential solutions. Environ. Sci. Pollut. Res. 2023, 30, 9207–9242. [Google Scholar] [CrossRef] [PubMed]
  2. Kant, R. Textile dyeing industry an environmental hazard. Nat. Sci. 2012, 4, 22–26. [Google Scholar] [CrossRef]
  3. López-Serrano, M.J.; Velasco-Muñoz, J.F.; Aznar-Sánchez, J.A.; Román-Sánchez, I.M. Sustainable use of wastewater in agriculture: A bibliometric analysis of worldwide research. Sustainability 2020, 12, 8948. [Google Scholar] [CrossRef]
  4. Al-Mamun, M.R.; Kader, S.; Islam, M.S.; Khan, M.Z.H. Photocatalytic activity improvement and application of UV-TiO2 photocatalysis in textile wastewater treatment: A review. J. Environ. Chem. Eng. 2019, 7, 103248. [Google Scholar] [CrossRef]
  5. Gümüş, D.; Akbal, F. Photocatalytic degradation of textile dye and wastewater. Water Air Soil Pollut. 2011, 216, 117–124. [Google Scholar] [CrossRef]
  6. Lellis, B.; Fávaro-Polonio, C.Z.; Pamphile, J.A.; Polonio, J.C. Effects of textile dyes on health and the environment and bioremediation potential of living organisms. Biotechnol. Res. Innov. 2019, 3, 275–290. [Google Scholar] [CrossRef]
  7. Mathur, N.; Bhatnagar, P.; Nagar, P.; Bijarnia, M.K. Mutagenicity assessment of effluents from textile/dye industries of Sanganer, Jaipur (India): A case study. Ecotoxicol. Environ. Saf. 2005, 61, 105–113. [Google Scholar] [CrossRef]
  8. Divya, N.; Bansal, A.; Jana, A.K. Nano-photocatalysts in the treatment of colored wastewater—A Review. In Materials Science Forum; Trans Tech Publications: Stäfa, Switzerland, 2013; Volume 734, pp. 349–363. [Google Scholar]
  9. Santos-Sauceda, I.; Castillo-Ortega, M.; del Castillo-Castro, T.; Armenta-Villegas, L.; Ramírez-Bon, R. Electrospun cellulose acetate fibers for the photodecolorization of methylene blue solutions under natural sunlight. Polym. Bull. 2021, 78, 4419–4438. [Google Scholar] [CrossRef]
  10. Anpo, M. Utilization of TiO2 photocatalysts in green chemistry. Pure Appl. Chem. 2000, 72, 1265–1270. [Google Scholar] [CrossRef]
  11. Zhu, S.; Wang, D. Photocatalysis: Basic principles, diverse forms of implementations and emerging scientific opportunities. Adv. Energy Mater. 2017, 7, 1700841. [Google Scholar] [CrossRef]
  12. Haque, F.Z.; Nandanwar, R.; Singh, P.J.O. Evaluating photodegradation properties of anatase and rutile TiO2 nanoparticles for organic compounds. Optik 2017, 128, 191–200. [Google Scholar] [CrossRef]
  13. Zemaitis, M. Identifying Chromophore Binding Modes through Principle Component Analysis of FTIR Spectroscopy. Bachelor of Science Thesis, University of North Carolina, Chapel Hill, NC, USA, 2017. [Google Scholar]
  14. Xu, T.; Niu, P.; Wang, S.; Li, L. High visible light photocatalytic activities obtained by integrating g-C3N4 with ferroelectric PbTiO3. J. Mater. Sci. Technol. 2021, 74, 128–135. [Google Scholar] [CrossRef]
  15. Alhaddad, M.; Shawky, A.; Zaki, Z.I. Reduced graphene oxide-supported PbTiO3 nanospheres: Improved ceramic photocatalyst toward enriched photooxidation of thiophene by visible light. Mol. Catal. 2021, 499, 111301. [Google Scholar] [CrossRef]
  16. Kooshki, H.; Sobhani-Nasab, A.; Eghbali-Arani, M.; Ahmadi, F.; Ameri, V.; Rahimi-Nasrabadi, M. Eco-friendly synthesis of PbTiO3 nanoparticles and PbTiO3/carbon quantum dots binary nano-hybrids for enhanced photocatalytic performance under visible light. Sep. Purif. Technol. 2019, 211, 873–881. [Google Scholar] [CrossRef]
  17. Zuo, R.; Du, G.; Zhang, W.; Liu, L.; Liu, Y.; Mei, L.; Li, Z. Photocatalytic degradation of methylene blue using TiO2 impregnated diatomite. Adv. Mater. Sci. Eng. 2014, 2014, 170148. [Google Scholar] [CrossRef]
  18. Zhang, Z.; Yates, J.T., Jr. Band bending in semiconductors: Chemical and physical consequences at surfaces and interfaces. Chem. Rev. 2012, 112, 5520–5551. [Google Scholar] [CrossRef]
  19. Batzill, M. Fundamental aspects of surface engineering of transition metal oxide photocatalysts. Energy Environ. Sci. 2011, 4, 3275–3286. [Google Scholar] [CrossRef]
  20. Chen, X.; Mao, S.S. Titanium dioxide nanomaterials: Synthesis, properties, modifications, and applications. Chem. Rev. 2007, 107, 2891–2959. [Google Scholar] [CrossRef]
  21. Reghunath, S.; Pinheiro, D.; KR, S.D. A review of hierarchical nanostructures of TiO2: Advances and applications. Appl. Surf. Sci. Adv. 2021, 3, 100063. [Google Scholar] [CrossRef]
  22. Nakade, S.; Matsuda, M.; Kambe, S.; Saito, Y.; Kitamura, T.; Sakata, T.; Wada, Y.; Mori, H.; Yanagida, S. Dependence of TiO2 nanoparticle preparation methods and annealing temperature on the efficiency of dye-sensitized solar cells. J. Phys. Chem. B 2002, 106, 10004–10010. [Google Scholar] [CrossRef]
  23. Yousif, Q.A.; Haran, N.H. Ultrasound effects on titanium dioxide compact layer and its application of dye-sensitized solar cell. Optik 2022, 270, 169964. [Google Scholar] [CrossRef]
  24. Liu, G.; Ma, L.; Yin, L.-C.; Wan, G.; Zhu, H.; Zhen, C.; Yang, Y.; Liang, Y.; Tan, J.; Cheng, H.-M. Selective chemical epitaxial growth of TiO2 islands on ferroelectric PbTiO3 crystals to boost photocatalytic activity. Joule 2018, 2, 1095–1107. [Google Scholar] [CrossRef]
  25. Ong, W.-J.; Tan, L.-L.; Ng, Y.H.; Yong, S.-T.; Chai, S.-P. Graphitic carbon nitride (g-C3N4)-based photocatalysts for artificial photosynthesis and environmental remediation: Are we a step closer to achieving sustainability? Chem. Rev. 2016, 116, 7159–7329. [Google Scholar] [CrossRef] [PubMed]
  26. Zhang, Y.; Liu, J.; Wu, G.; Chen, W. Porous graphitic carbon nitride synthesized via direct polymerization of urea for efficient sunlight-driven photocatalytic hydrogen production. Nanoscale 2012, 4, 5300–5303. [Google Scholar] [CrossRef] [PubMed]
  27. Zhu, B.; Xia, P.; Ho, W.; Yu, J. Isoelectric point and adsorption activity of porous g-C3N4. Appl. Surf. Sci. 2015, 344, 188–195. [Google Scholar] [CrossRef]
  28. Nien, Y.-H.; Li, C.-K.; Lin, Y.-L. Preparation of ultrafine fibrous membranes containing graphitic carbon nitride composited photocatalyst and their degradation of methylene blue under visible light. J. Polym. Res. 2021, 28, 470. [Google Scholar] [CrossRef]
  29. Lata, S. Green chemistry based synthesis of silver nanoparticles from floral extract of Nelumbo nucifera. Mater. Today Proc. 2018, 5, 6227–6233. [Google Scholar]
  30. Sobhani-Nasab, A.; Rangraz-Jeddy, M.; Avanes, A.; Salavati-Niasari, M. Novel sol–gel method for synthesis of PbTiO3 and its light harvesting applications. J. Mater. Sci. Mater. Electron. 2015, 26, 9552–9560. [Google Scholar] [CrossRef]
  31. Ferreira, O.; Monteiro, O.; do Rego, A.B.; Ferraria, A.; Batista, M.; Santos, R.; Monteiro, S.; Freire, M.; Silva, E.R. Visible light-driven photodegradation of triclosan and antimicrobial activity against Legionella pneumophila with cobalt and nitrogen co-doped TiO2 anatase nanoparticles. J. Environ. Chem. Eng. 2021, 9, 106735. [Google Scholar] [CrossRef]
  32. Baladi, M.; Teymourinia, H.; Dawi, E.A.; Amiri, M.; Ramazani, A.; Salavati-Niasari, M. Electrochemical determination of imatinib mesylate using TbFeO3/g-C3N4 nanocomposite modified glassy carbon electrode. Arab. J. Chem. 2023, 16, 104963. [Google Scholar] [CrossRef]
  33. Purnawan, C.; Wibowo, A.H.; Wahyuningsih, S.; Hastuti, S.; Masykur, A.; Martini, T.; Setyaningrum, A.; Timur, W.P. Photodegradation of sodium dodecyl sulfate and sodium dodecylbenzene sulfonate with hydrothermally synthesized PbTiO3 catalyst. Groundw. Sustain. Dev. 2023, 21, 100909. [Google Scholar] [CrossRef]
  34. Sathishkumar, K.; Li, Y.; Alsalhi, M.S.; Muthukumar, B.; Gaurav, G.K.; Devanesan, S.; Rajasekar, A.; Manikandan, R. Enhanced biological nitrate removal by gC3N4/TiO2 composite and role of extracellular polymeric substances. Environ. Res. 2022, 207, 112158. [Google Scholar] [CrossRef] [PubMed]
  35. Saravanakumar, K.; Park, C.M. Rational design of a novel LaFeO3/g-C3N4/BiFeO3 double Z-scheme structure: Photocatalytic performance for antibiotic degradation and mechanistic insight. Chem. Eng. J. 2021, 423, 130076. [Google Scholar] [CrossRef]
  36. Xiao, G.; Xu, S.; Li, P.; Su, H. Visible-light-driven activity and synergistic mechanism of TiO2@ g-C3N4 heterostructured photocatalysts fabricated through a facile and green procedure for various toxic pollutants removal. Nanotechnology 2018, 29, 315601. [Google Scholar] [CrossRef] [PubMed]
Figure 1. Comparison of XRD peaks for the 1000 °C PTO vs. JCPDS card.
Jcs 07 00434 g001
Figure 2. XRD peaks for PbTiO3 sintered at different temperatures.
Jcs 07 00434 g002
Figure 3. Comparison of XRD peaks of anatase TiO2 vs. JCPDS card.
Jcs 07 00434 g003
Figure 4. Comparative XRD peaks for different ratios of PTO/TO vs. JCPDS card.
Jcs 07 00434 g004
Figure 5. The comparison of XRD peaks of g-C3N4 vs. JCPDS card.
Jcs 07 00434 g005
Figure 6. XRD peaks for different ratios of PTO/TO/CN vs. JCPDS card.
Jcs 07 00434 g006
Figure 7. SEM images of (a) 700 °C PTO, (b) 800 °C PTO, (c) 900 °C PTO, and (d) 1000 °C PTO at 10,000× magnification.
Jcs 07 00434 g007
Figure 8. SEM images of (a) TiO2 and (b) g-C3N4 at 2000× and 20,000× magnification, respectively.
Jcs 07 00434 g008
Figure 9. SEM images of (a) PTO/TO/CN (0.3), (b) PTO/TO/CN (0.6), (c) PTO/TO/CN (1), and (d) PTO/TO/CN (2) at 10,000× magnification.
Jcs 07 00434 g009
Figure 10. SEM images of (a) PTO/TO/CN (1) and (b) PTO/TO/CN (2) at 5000× magnification.
Jcs 07 00434 g010
Figure 11. FTIR spectra of PbTiO3 synthesized by sintering at different temperatures.
Jcs 07 00434 g011
Figure 12. TiO2 FTIR spectra.
Jcs 07 00434 g012
Figure 13. FTIR spectra of TiO2, 1000 °C PTO, and PTO/TO in various ratios.
Jcs 07 00434 g013
Figure 14. g-C3N4 FTIR spectra.
Jcs 07 00434 g014
Figure 15. FTIR spectra of TiO2, 1000 °C PTO, g-C3N4, and PTO/TO/CN in various ratios.
Jcs 07 00434 g015
Figure 16. N2 adsorption–desorption isotherms of TiO2, 0.3 PTO/TO, and PTO/TO/CN (1.0).
Jcs 07 00434 g016
Figure 17. PTO/TO/CN (0.3), PTO/TO/CN (0.6), PTO/TO/CN (1.0), and PTO/TO/CN (2.0) isotherm adsorption–desorption curves.
Jcs 07 00434 g017
Figure 18. Pore size distribution curves of TiO2, 0.3 PTO/TO, and PTO/TO/CN (1.0).
Jcs 07 00434 g018
Figure 19. Pore size range distribution curves of TiO2 and 0.3 PTO/TO for different weight ratios of PTO/TO/CN.
Jcs 07 00434 g019
Figure 20. Photodegradation efficiency diagram of PTO synthesized at different temperatures.
Jcs 07 00434 g020
Figure 21. Photodegradation efficiency of different PTO/TO ratios.
Jcs 07 00434 g021
Figure 22. Photodegradation efficiency of PTO/TO/CN doped with different g-C3N4 weights.
Jcs 07 00434 g022
Figure 23. MB degradation efficiency of TiO2, P25, 1000 °C PTO, 0.3 PTO/TO, and PTO/TO/CN (1) under 30 min of darkness and 3 h of visible light.
Jcs 07 00434 g023
Figure 24. MB removal rates of TiO2, P25, 1000 °C PTO, 0.3 PTO/TO, and PTO/TO/CN (1) under visible light for 3 h.
Jcs 07 00434 g024
Figure 25. Schematic diagram of energy-carrying electron transfer in the bandgap structure of the PTO/TO composites.
Jcs 07 00434 g025
Figure 26. (a) UV-Vis absorption spectrum of TiO2, and (b) TiO2 Tauc plot.
Jcs 07 00434 g026
Figure 27. (a) UV-Vis absorption spectrum PbTiO3 sintered at different temperatures, and (b) PbTiO3 Tauc plot.
Jcs 07 00434 g027
Figure 28. (a) UV-Vis absorption spectra for different PTO/TO ratios and (b) Tauc plots of different ratios of PTO/TO.
Jcs 07 00434 g028
Figure 29. (a) UV-Vis absorption spectra of different PTO/TO/CN ratios and (b) Tauc plots of different PTO/TO/CN ratios.
Jcs 07 00434 g029
Table 1. Grain characterization of PTO synthesized at different temperatures.
FWHM2θ (°)d-Spacing (nm)D (nm)
700 °C PTO0.503231.395340.284704416.399182
800 °C PTO0.4838731.262070.28588717.048748
900 °C PTO0.4542331.245620.286034418.160505
1000 °C PTO0.339531.103960.287304724.289255
Table 2. Integral area and crystallinity of PTO synthesized at different temperatures.
TotalAmXc (%)
700 °C977.8631339.709965.2600
800 °C970.1649313.065767.7307
900 °C926.7613197.159878.7259
1000 °C864.7150127.930885.2054
Table 3. Grain characterization of PTO/TO synthesized using different weight ratios.
FWHM2θ (°)d-Spacing (nm)D (nm)
TiO20.7257825.374020.35073411.219802
0.1 PTO/TO0.6384825.397770.35041112.754492
0.3 PTO/TO1.2910425.345980.3511156.3070546
0.5 PTO/TO0.7382725.349950.35106111.029465
1 PTO/TO0.7270525.364560.35086211.199995
Table 4. Grain characterization of PTO/TO/CN synthesized with different weight ratios.
FWHM2θ (°)d-Spacing (nm)D (nm)
0.3 PTO/TO1.2910425.345980.3511156.307054
PTO/TO/CN (0.3)1.3511625.30730.3516436.025964
PTO/TO/CN (0.6)1.0970525.329280.3513437.422080
PTO/TO/CN (1.0)1.5045125.317190.3515085.411861
PTO/TO/CN (2.0)2.2255525.348640.3510793.658737
Table 5. Sample specific surface area for different g-C3N4 weight ratios.
SampleSpecific Surface Areas (m2/g)
TiO257.6802
0.3 PTO/TO50.6191
PTO/TO/CN 2.0135.4243
PTO/TO/CN 1.0181.2409
PTO/TO/CN 0.3147.1653
PTO/TO/CN 0.6125.7055
Disclaimer/Publisher’s Note: The statements, opinions and data contained in all publications are solely those of the individual author(s) and contributor(s) and not of MDPI and/or the editor(s). MDPI and/or the editor(s) disclaim responsibility for any injury to people or property resulting from any ideas, methods, instructions or products referred to in the content.

