Article

Enhancing Stiffness, Toughness, and Creep in a 3D-Printed Bio-Based Photopolymer Using Ultra-Low Contents of Nanofibrillated Cellulose

1
Institute of Polymer Materials, Faculty of Materials Science and Applied Chemistry, Riga Technical University, P. Valdena 3/7, LV-1048 Riga, Latvia
2
Institute for Mechanics of Materials, University of Latvia, Jelgavas 3, LV-1004 Riga, Latvia
3
Institute of Materials and Surface Engineering, Faculty of Materials Science and Applied Chemistry, P. Valdena 3/7, LV-1048 Riga, Latvia
4
Department of Materials Research and Technology (MRT), Luxembourg Institute of Science and Technology (LIST), 5 Avenue des Hauts-Fourneaux, L-4362 Esch-sur-Alzette, Luxembourg
*
Authors to whom correspondence should be addressed.
J. Compos. Sci. 2023, 7(10), 435; https://doi.org/10.3390/jcs7100435
Submission received: 15 September 2023 / Revised: 11 October 2023 / Accepted: 12 October 2023 / Published: 13 October 2023
(This article belongs to the Section Biocomposites)

Abstract

:
UV-light-assisted additive manufacturing (AM) technologies require bio-based resins that can compete with commercial petroleum-based ones to enable a more sustainable future. This research proposes a significantly improved vegetable oil-based resin reinforced with nanofibrillated cellulose (NFC). The incorporation of ultra-low concentrations (0.1–0.5 wt%) of NFC produced disproportionate enhancements in mechanical performance. Noteworthy, a 2.3-fold increase in strain at the break and a 1.5-fold increase in impact strength were observed with only 0.1 wt% of NFC, while at 0.5 wt%, a 2.7-fold increase in tensile modulus and a 6.2-fold increase in toughness were measured. This is in spite of NFC agglomeration at even the lowest loadings, as observed via examination of fracture surfaces and dynamic mechanical analysis (DMA) Cole–Cole plot analysis. The addition of 0.1 wt% NFC also increased creep resistance by 32% and reduced residual strain by 34% following creep recovery. The Burgers model satisfactorily described the composites’ viscoelastic–viscoplastic behavior within the applied stress levels of 1–3 MPa. The successful development of novel NFC/bio-resin composites with enhanced mechanical performance and long-term stability highlights the potential of these composites to substitute petroleum-based resins in the context of AM resins.

1. Introduction

Additive manufacturing (AM) allows for the freedom of complicated structures that would otherwise be impossible. AM also started the 4th industrial revolution, making it an integral part of Industry 4.0 [1]. IDTechEx forecasts that the global market for 3D printing (a part of AM) materials will be worth USD 29.5 billion in 2032 [2]. AM market growth means a broader use of 3D printing, leading to an increased demand for sustainable feedstocks and a reduced amount of the potential waste and pollution [3]. While identifying bio-based feedstocks is important, there are equally important factors to consider, like the energy efficiency of the production process [4]. Hence, AM technologies like vat photopolymerization are advantageous in terms of energy consumption, but still lack the availability of a wide range of sustainable feedstocks [5,6].
AM started with vat photopolymerization that uses photocurable thermoset polymers [7], and even now, photocurable resins remain on the research priority list. This is due to the demand for lower energy consumption [4] and higher printing resolution (down to 2 µm) [8]. Acrylates and epoxides are the most common polymer classes used in photocuring [9]. Given their initial unsaturation, vegetable oils have proven to be viable options for bio-based AM resin synthesis [10,11]. Prof. Mija, A. et.al have devoted a lot of time to vegetable oil-based epoxides [12,13,14]. They have proved their recyclability and potential to create composites with flax fibers and spruce bark. Unfortunately, epoxides have limited options for 3D printing technologies, since their photocuring is mostly cationic and usually takes minutes rather than seconds, as with acrylates [15,16]. Additionally, bio-based photocurable resins are mainly limited in terms of mechanical performance in comparison to conventional petroleum resins [17]. Fiber reinforcement can improve mechanical characteristics, as randomly distributed discontinuous fibers allow for crack bridging, providing “ductility” beyond the initial fracture event [18]. Meanwhile, sustainability can be maintained using natural fibers like cellulose, which offers excellent mechanical performance and is readily available [18,19,20,21,22,23]. Fibers have to be sufficiently strong and well bonded to the matrix material to carry significant stresses over a relatively wide range of strains, in spite of visible crack formation and growth [24]. Different cellulose fibers are already widely used as fillers in various polymer composites, including photocurable resins [20,21,22,23]. Nanocellulose can be further classified as nanocrystals (NCCs) and nanofibers (NFCs) depending on the processing and production technologies; both are excellent reinforcements for polymers [25,26]. However, nanocellulose is highly hydrophilic, which degrades the reinforcing efficiency in many AM resins, which tend to be hydrophobic [22]. Nonetheless, progress has been made in the research and development of nanocellulose-reinforced photocurable AM resins [27,28,29]. Given the desire to maximize sustainability, the following literature review focuses on neat nanocellulose reinforcement.
For example, Palaganas et al. incorporated 0.3 wt% of the NCCs into a polyethylene glycol diacrylate (PEGDA) hydrogel resin and observed a 2-fold increase in tensile strength [27]. Meanwhile, Rosa et al. reported microcrystalline cellulose (MCC) and NCC incorporation into a blend of acrylated epoxidized soybean oil (AESO) and PEGDA [28]. The authors demonstrated the advantages of higher aspect ratio NCC nanoparticles, obtaining an increase in tensile strength from 4.5 to 7 MPa and a decrease in strain at the break from 25% to 8%. While these efforts show the potential of nanocellulose in photocurable resins for 3D printing, the use of neat NFCs in this context has received very little attention. The authors are aware of only one report, where Vidakis et al. studied NFCs (0.5 to 2.0 wt%) to reinforce medical-grade Formlabs Biomed Clear resin and reported a 2-fold increase in tensile strength [29]. However, this commercial resin was not bio-based, highlighting the need for more work along these lines.
Due to the highly hydrophilic nature of cellulose and the high aspect ratio of NFC, their tendency to agglomerate is much more pronounced than that of NCC [30]. Still, if agglomeration is overcome and adequate dispersion is achieved, the higher aspect ratios of NFCs promise more significant reinforcement [30,31]. In addition, the much higher aspect ratio of NFC ensures its ability to form a percolated filler network faster than NCC (~0.1 wt%) [32,33,34]. Furthermore, it can be argued that the production of NFC is more sustainable because it does not require treatment with strong acids or bases [26]. For these reasons, NFC represents a highly attractive option for the efficient reinforcement of bio-based photocurable resins and deserve further study around the percolation threshold, in particular due to the decreased tendency for agglomeration [29].
To the best of the authors’ knowledge, this report is the first to demonstrate the use of NFC as an effective reinforcement for bio-based UV-curable AM composite resins. Our study investigates the effects of NFC loading on reinforcement efficiency and dispersion levels via various techniques. In doing so, the primary aim is to assess NFC as a reinforcing filler for bio-based UV-curable AM resins at very low loading levels (0.1–1 wt%). This study presents NFC’s role in improving mechanical performance, accompanied by an in-depth investigation of the homogeneity, physical, and mechanical properties of these materials. NFC contents were chosen considering the approximate percolation threshold (0.1 wt%) and were determined by the effective load for the highest reinforcement efficiency of the resin. Tensile, flexural, and creep testing was supplemented with DMA Cole–Cole plot analysis, optical microscopy, and SEM analysis, considering crack propagation and agglomeration processes in the obtained biopolymer composites. The resulting findings clarify the feasibility of applying NFC reinforcement to bio-based UV-curable AM resins for enhanced long-term dimensional stability and strength.

2. Materials and Methods

2.1. Materials

All chemicals (Table 1) used for resin preparation were purchased from Merck KGaA (Darmstadt, Germany) and used as received. Nanocellulose used for composite resin preparation was made in-house from FILTRAK filter paper.

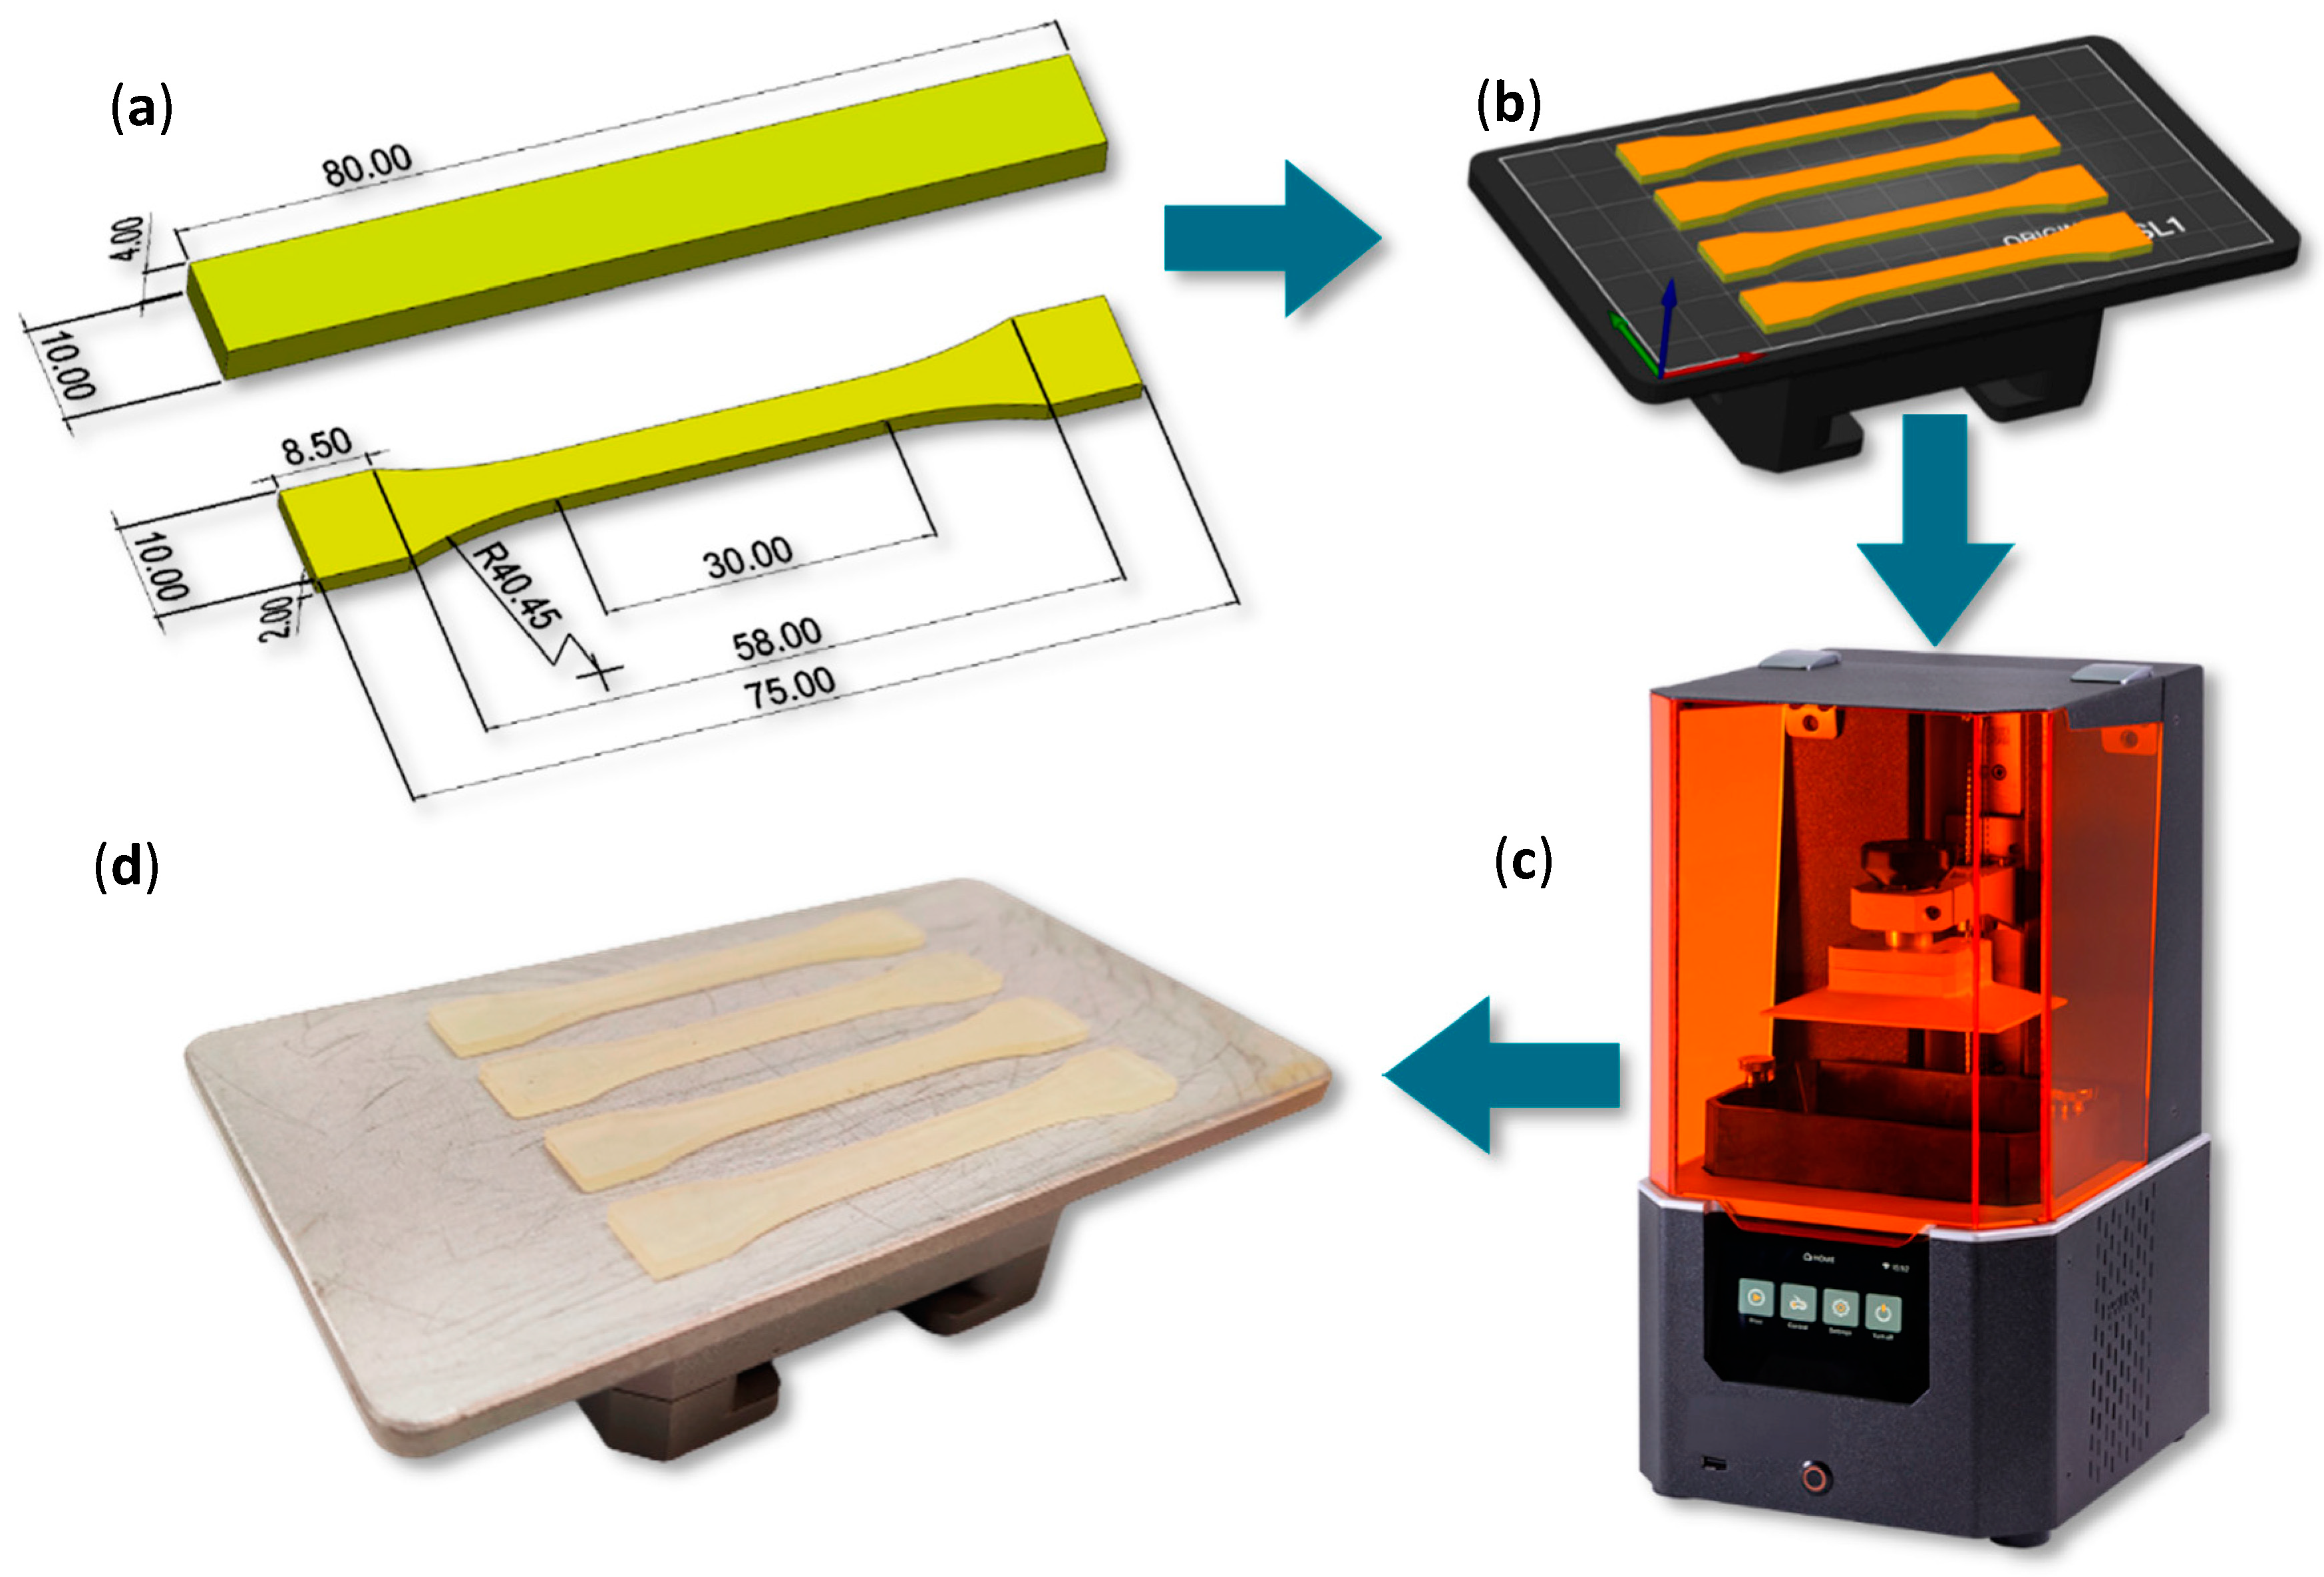
2.2. Resin Formulation and Cured Composite Preparation

To investigate the effects of nanofibrillated cellulose (NFC) on the mechanical performance of UV-curable AESO-based resins, 4 formulations with different NFC contents were prepared. First, the neat resin formulation (0% NFC) was prepared as described in our previous work [35]. This formulation is summarized in Table 2. Briefly, HDDA and TMPTA were loaded into a beaker covered in foil to prevent exposure to UV light. As the next step, AESO was added to the formulations, followed by TPO dissolved in the minimum quantity of acetone possible. Finally, the resulting composite resin was mixed for 20 min in the dark with a mechanical mixer to achieve homogenization and prevent curing.
For the preparation of the NFC, the filter paper was first shredded using a cutting mill (Retsch SM300, Haan, Germany). Then, two milling passes were performed at 1500 rpm, with sieve sizes of 2.00 mm for the first pass and 0.25 mm for the second pass. Next, the shredded cellulose was used to prepare a 1 wt% water (deionized 0.4 µS (Crystal 10, Adrona, Latvia)) suspension, continued with a high-shear fluid process (LM 20 Microfluidizer, Microfluidics, Westwood, MA, USA). Nanocellulose was produced following five cycles at 30,000 PSI in a 200 µm diameter z-shaped chamber. Next, NFC was subjected to three solvent exchange cycles to replace the water with acetone, each followed by 15 min of centrifugation at 5000 rpm. Finally, the prepared NFC/acetone suspension was stored in a sealed beaker in a refrigerator.
For composite resin formulations, 3 different mass contents of NFC, starting from the percolation threshold content of 0.1 wt% [35], were added to the neat AESO resin formulation. Following addition of the desired amount of NFC to the neat resin, the combination was mixed for 5 min at 6000 rpm in a high-shear mixer (L5M-A, Silversone, Chesham, UK). Such intensive mixing trapped some air inside the resin, which could cause failed prints and internal defects in subsequent steps. To remove the air, resins were placed in a vacuum chamber at room temperature with a negative pressure of 1000 mbar for 2 h. The degassed resins were then stored in the dark to allow for complete acetone evaporation. All resin formulations were named in accordance with the NFC loading as follows: 0%, 0.1%, 0.5%, and 1%.
The 3D-printed reinforced composites were prepared using masked stereolithography (MSLA) 3D printing technology. To print samples from the CAD models shown in Figure 1a, a PRUSA SL1 printer (Figure 1c) was used, with a 5.5′ LCD mask and a 25 W LED with a UV wavelength of 405 nm. Briefly, the 3D printing process consists of four steps. Firstly, the desired CAD model (Figure 1a) is created using CAD software. In the next step, prepared CAD models must be sliced into layers of a certain height (a layer thickness of 50 µm was chosen as a good compromise between printing time and resolution) (Figure 1b). Then, sliced models are transferred to a 3D printer (Figure 1c), and the desired 3D objects are produced (Figure 1d). Finally, following printing, any remaining resin is washed off, and the part is post-cured. All resins were subjected to an optimization process to achieve the optimal printing time without defects or failures. The single-layer UV-light irradiation time was increased in 1 s increments, starting at 3.5 s, until parts were printed with no defects. In this way, optimum layer printing times of 7.5 s for the neat resin formulation and 15 s for the composite resin formulations were found. The first 10 layers of each sample were printed at a constant time of 35 s to ensure adhesion to the printing platform. After printing, all parts were washed in isopropanol and post-cured in a Prusa Curing and Washing Machine (CW1) (Prusa, Prague, Czech Republic). It is equipped with four 52.8 W UV-LED strips with a wavelength of 405 nm. The washing and drying time was 5 min, while the post-curing time was maintained at 3 min.

2.3. Characterization

2.3.1. Scanning Electron Microscopy

Scanning electron microscopy (SEM) micrographs of fracture surfaces were taken using a SEM Hitachi Tabletop Microscope TM3000 (Hitachi, Tokyo, Japan), operated at an accelerating voltage of 5 kV and a magnification of 2500×. Samples were freeze-fractured using liquid nitrogen for cross-sectional analysis.

2.3.2. Optical Microscopy

A Leica 301-371.011 DMRBE optical microscope (Leica, Wetzlar, Germany) equipped with 20× and 10× magnification objectives and Leica application suite software was used to obtain images of the cross-section and fracture surface of the 3D-printed composites, respectively. The latter were obtained via freeze-fracture using liquid nitrogen.

2.3.3. Dynamic Mechanical Analysis

A dynamic mechanical analyzer Mettler DMA/SDTA861e (Mettler Toledo, Columbus, OH, USA) was used to record storage modulus and loss modulus as a function of temperature to obtain Cole–Cole plot of the 3D-printed specimens. The experiment was carried out in dual cantilever deformation mode (−70–100 °C), 3 °C/min heating rate, applied force of 10 N, 20 µm displacement, and 1 Hz frequency. Dynamic mechanical analysis (DMA) tests were performed on 3D-printed rectangular samples with dimensions of 80 × 10 × 4 mm3, according to the EN ISO-178 standard. Prior to testing, all specimens were stored in sealed plastic bags in a dark place; tests were performed after 2 days from the moment the specimens were printed.

2.3.4. Tensile Testing

Tensile tests were performed on 3D-printed dog-bone-shaped samples with dimensions of 30 × 5 × 2 mm3 in the central section, in accordance with the EN ISO 527-1BA standard. A Tinius Olsen 25ST universal testing machine (Tinius Olsen Inc., Horsham, PA, USA) was used, with testing speeds of 1 mm/min for tensile modulus and 5 mm/min for tensile strength measurements with 5 kN S-type load cell. Prepared specimens were stored in a sealed bag at room temperature in a dark place. Average strain at the break, tensile modulus, and tensile strength values were obtained from the testing of 5 specimens. All tensile tests are performed two days after the printing of the specimens in ambient conditions (approximately 22 °C, 40 RH).

2.3.5. Flexural Testing

Three-point flexural tests were performed on 3D-printed rectangular samples with dimensions of 80 × 10 × 4 mm3, according to the EN ISO-178 standard. A Tinius Olsen 25ST universal testing machine (Tinius Olsen Inc., Horsham, PA, USA) was used, with testing speeds of 1 mm/min for flexural modulus and 5 mm/min for flexural strength, with 25 kN S-type load cell. Prepared specimens were stored in a sealed bag at room temperature in a dark place. Average flexural strain at break, flexural modulus, and flexural strength values were obtained from the testing of 5 specimens. All flexural tests are performed two days after the printing of the specimens in ambient conditions (approximately 22 °C, 40 RH).

2.3.6. Charpy Impact Resistance Testing

Charpy impact resistance tests were conducted on a Zwick IPM-8 testing machine (Zwick Roel, Ulm, Germany) according to EN ISO 179-1, using unnotched 3D-printed rectangular specimens whose dimensions complied with the EN ISO-178 standard. As previously stated, all printed samples were kept in a dark place prior to testing. A 2 J impact hammer was used, and average impact strength values were obtained from the testing of 5 specimens. All Charpy impact resistance tests are performed two days after the printing of the specimens in ambient conditions (approximately 22 °C, 40 RH).

2.3.7. Creep

Tensile creep and creep-recovery tests were performed using a Zwick 2.5 kN universal testing machine (Zwick Roel, Ulm, Germany) at ambient humidity and 22 °C on 3D-printed dog-bone specimens with dimensions of 30 × 5 × 2 mm3 in the central section, according to the ISO 527-1BA standard. Creep stresses of 1, 2, and 3 MPa were selected for this study, corresponding to 23, 46, and 70% of the strength of the neat polymer. A constant stress was applied, after which the specimen was unloaded at a crosshead speed of 10 mm/min, which took up to 4 s. The creep period was 30 min, and the creep recovery time was 90 min. At each stress, three replicate specimens were tested. All creep-recovery tests are performed within 3 weeks after the printing of the specimens.

3. Results and Discussion

3.1. Morphology

The morphology of the printed specimens was investigated using optical microscopy of cross-sections and scanning electron microscopy of freeze-fracture surfaces of 3D-printed parts (Figure 2). All resins demonstrated excellent printing accuracy (as determined using sample surface analysis). However, despite the maintained constant layer thickness of 50 µm, increased NFC content led to decreased surface quality (see cross sections in Figure 2a with a 100 µm scale bar); this may be explained by NFC agglomeration. Smooth surfaces are observed for the 0% sample, while with increasing NFC content, fracture surfaces become rougher. In 10× optical microscopy images, black cracks are seen. According to the crack distribution, fibers agglomerate when the NFC content exceeds 0.1 wt%, leading to a consequent decrease in the overall homogeneity. Figure 2b shows the SEM microscopy images; while similar fracture patterns are observed in all cases, changes in surface roughness are observed. The 0.1% composite specimen’s fracture surface, while being similar to that of the 0% specimen, displays sharper fracture edges. Further increasing the NFC content introduces a combination of smooth regions and sharp-edged fracture paths, consistent with increasing the heterogeneity and indicative of significant changes in the morphology and fracture mechanism.
Figure 2c depicts the modified fracture mechanism with crack propagation in neat polymer matrices and reinforced composites for flexural and impact test specimens. When NFC reinforcement is encountered, crack deflection occurs [36,37]. This is confirmed by the visible cracks on the side of the rectangular samples after flexural testing, as shown in the optical microscopy image of the 1% composite sample (Figure 2d). Again, crack deflection is observed, as well as bifurcation in some instances. No such cracks were observed in the 0% and 0.1% samples. Nonetheless, black dashed lines (aligned with printing layers) show that these cracks develop perpendicular to the layers, not parallel to them, confirming a high level of interlayer adhesion.
The image shows that the neat resin is the most homogeneous specimen, followed by 0.1% NFC. In contrast, heterogeneity can be seen in the 0.5% and 1% NFC specimens, where cracks have separated smooth and rough black regions. NFC is known for its tendency to agglomerate [22,30], and increased loadings lead to a higher probability of agglomeration. Higher NFC loads also increase the resulting viscosity of the composite resins [35], limiting the effectiveness of further homogenization. This effect is more pronounced if there are limitations in compatibility between the particles and the polymer matrix [38]. As it is known that AESO exhibits hydrophobic properties [36], it is not surprising that the resulting heterogeneity and surface roughness increase upon the addition of increasing quantities of hydrophilic NFC. This heterogeneity with increasing NFC content is observed in Figure 2c, where the nanocellulose distribution in the polymer matrix is shown.
The dynamic mechanical analysis (DMA) Cole–Cole plot in Figure 2e also confirms the increasing heterogeneity with increased NFC content, in line with previous studies involving the use of such plots to assess structural changes in crosslinked polymer composites [39,40,41]. Here, the DMA data appear in the form of Cole–Cole plots instead, where a semi-arch shape indicates a homogeneous polymer system, while deviations from such a shape (curve shoulders, etc.) and shape irregularities indicate the presence of heterogeneities such as phase separation and filler aggregation [40,41,42]. The Cole–Cole plots for the 0% and 0.1% specimens in Figure 2e possess smooth semi-arc shapes, while at lower temperatures, the same plots for the 0.5% and 1% specimens show deviations from that shape (peak shoulders). This confirms the optical microscopy and SEM results, indicating that when the NFC content exceeds the percolation threshold of ~0.1 wt%, NFC tends to agglomerate in the resin, thereby creating a heterogeneous system.

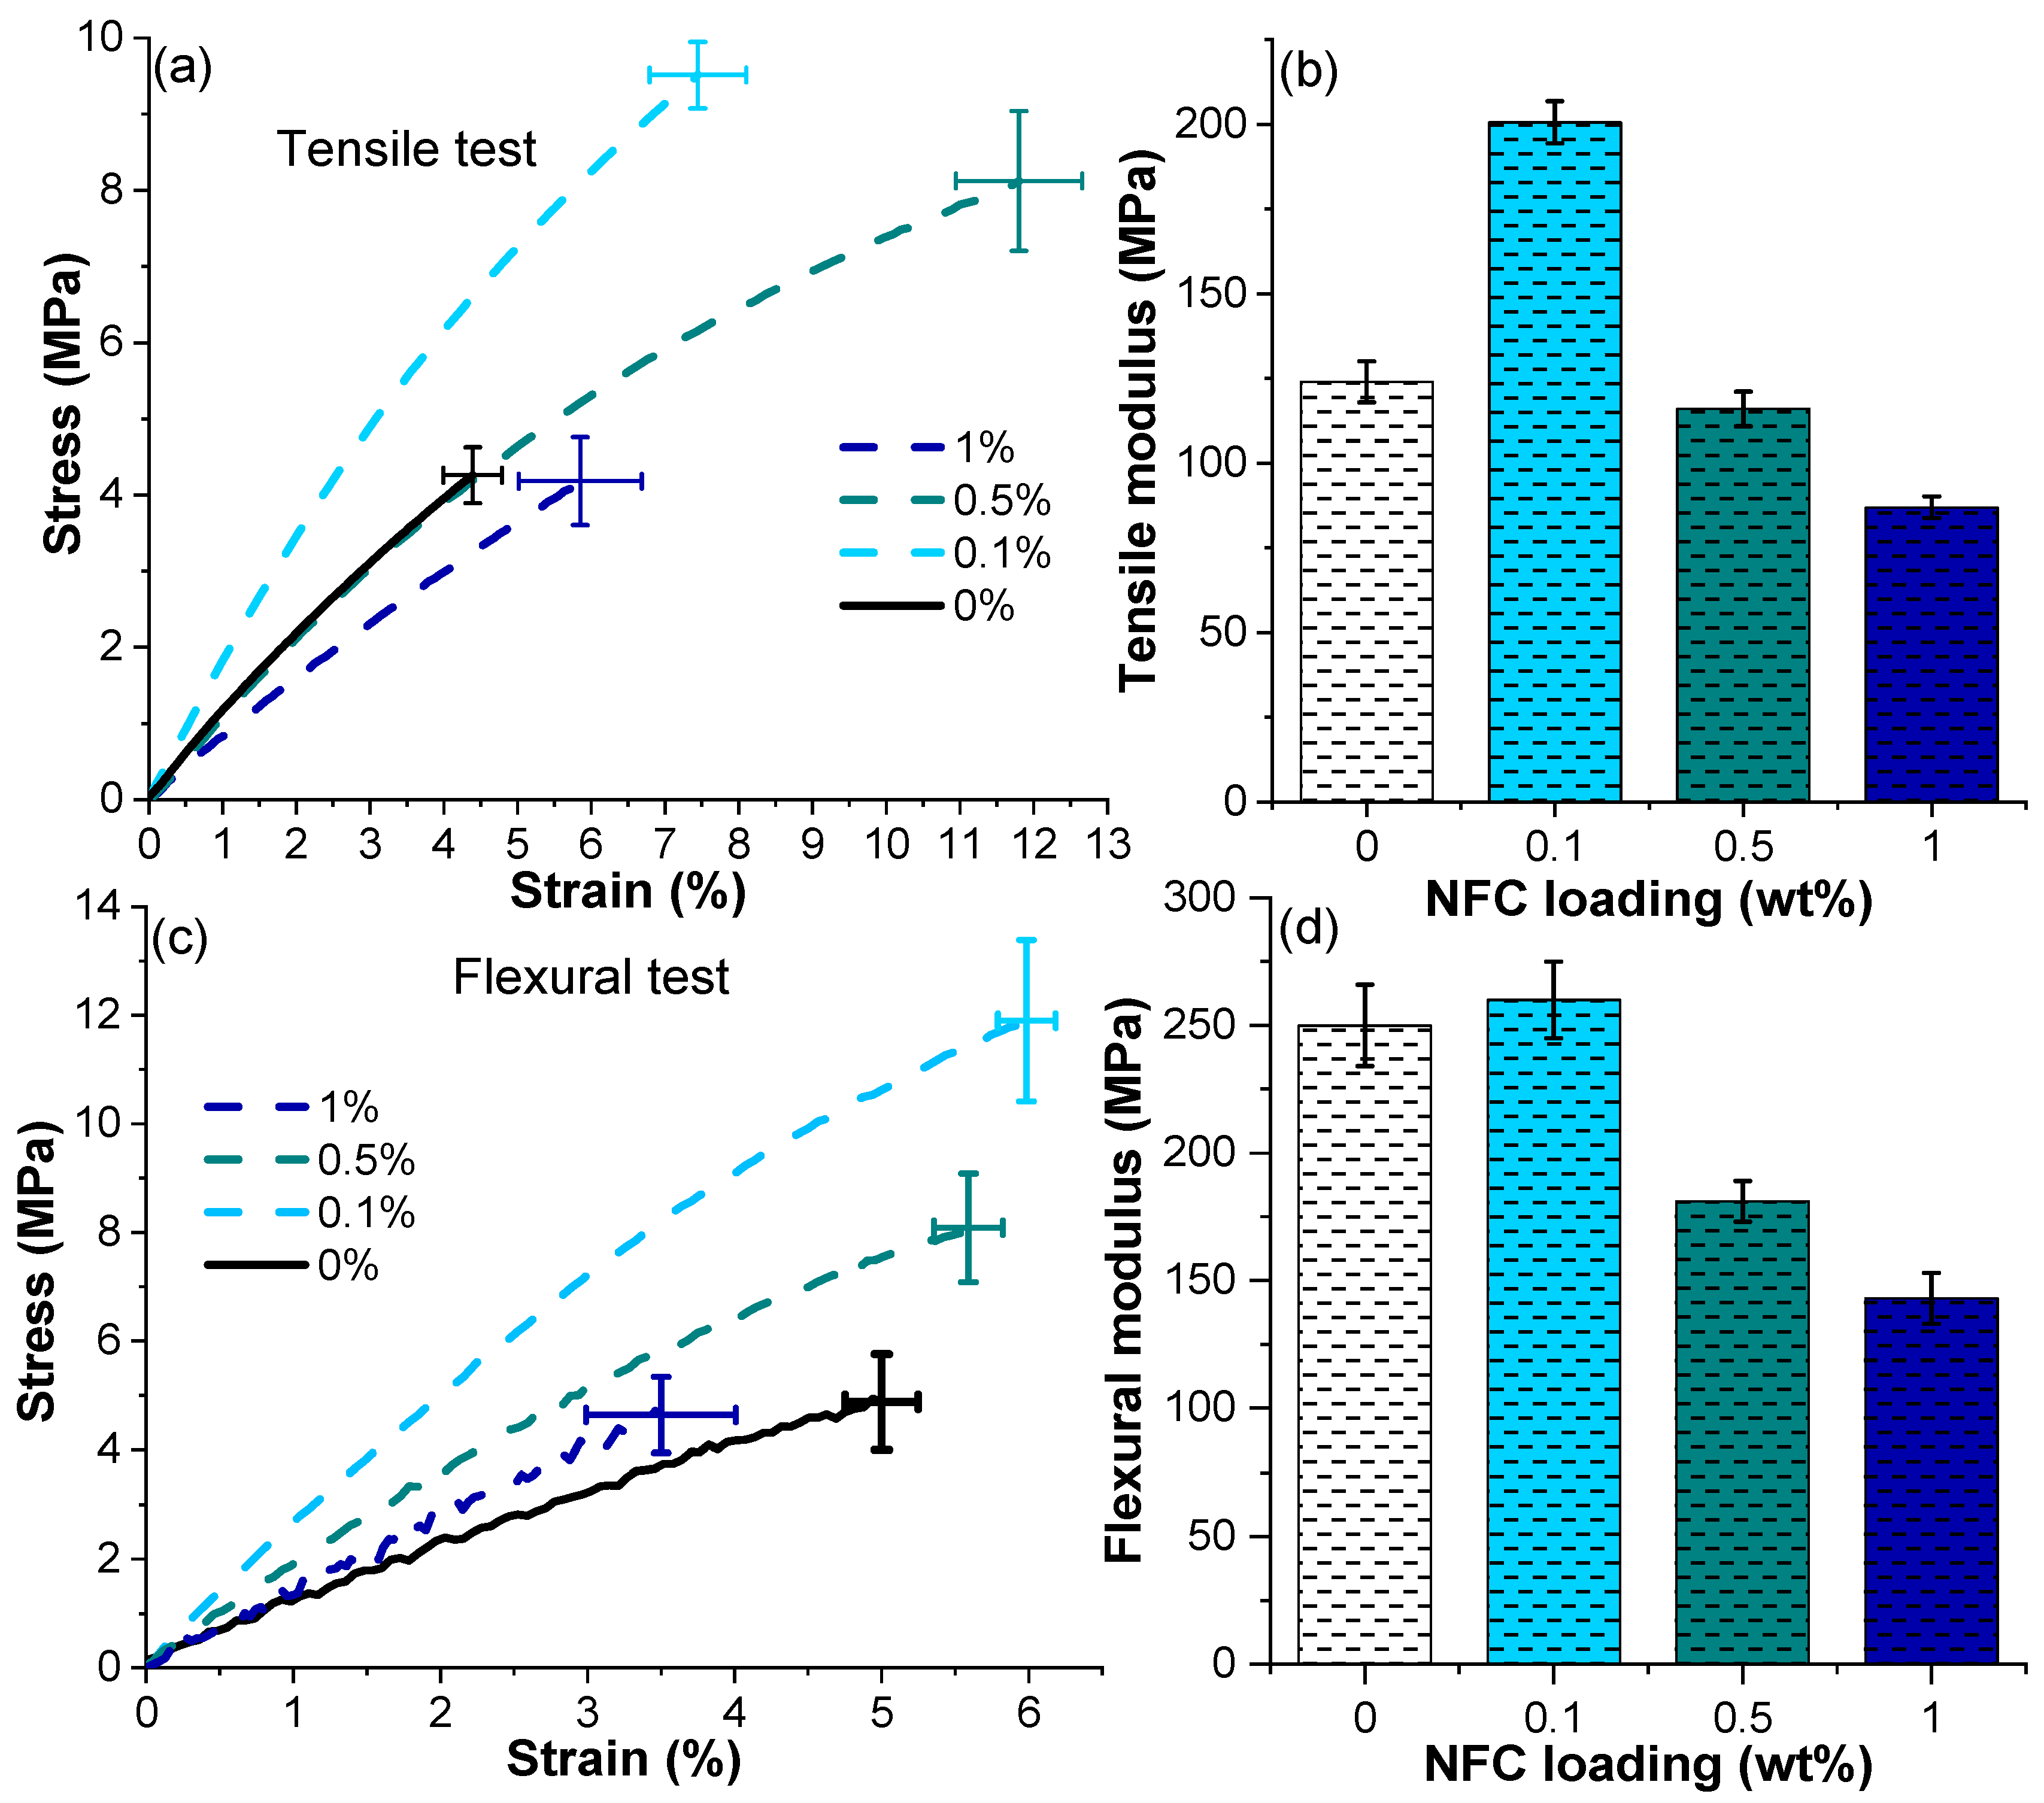
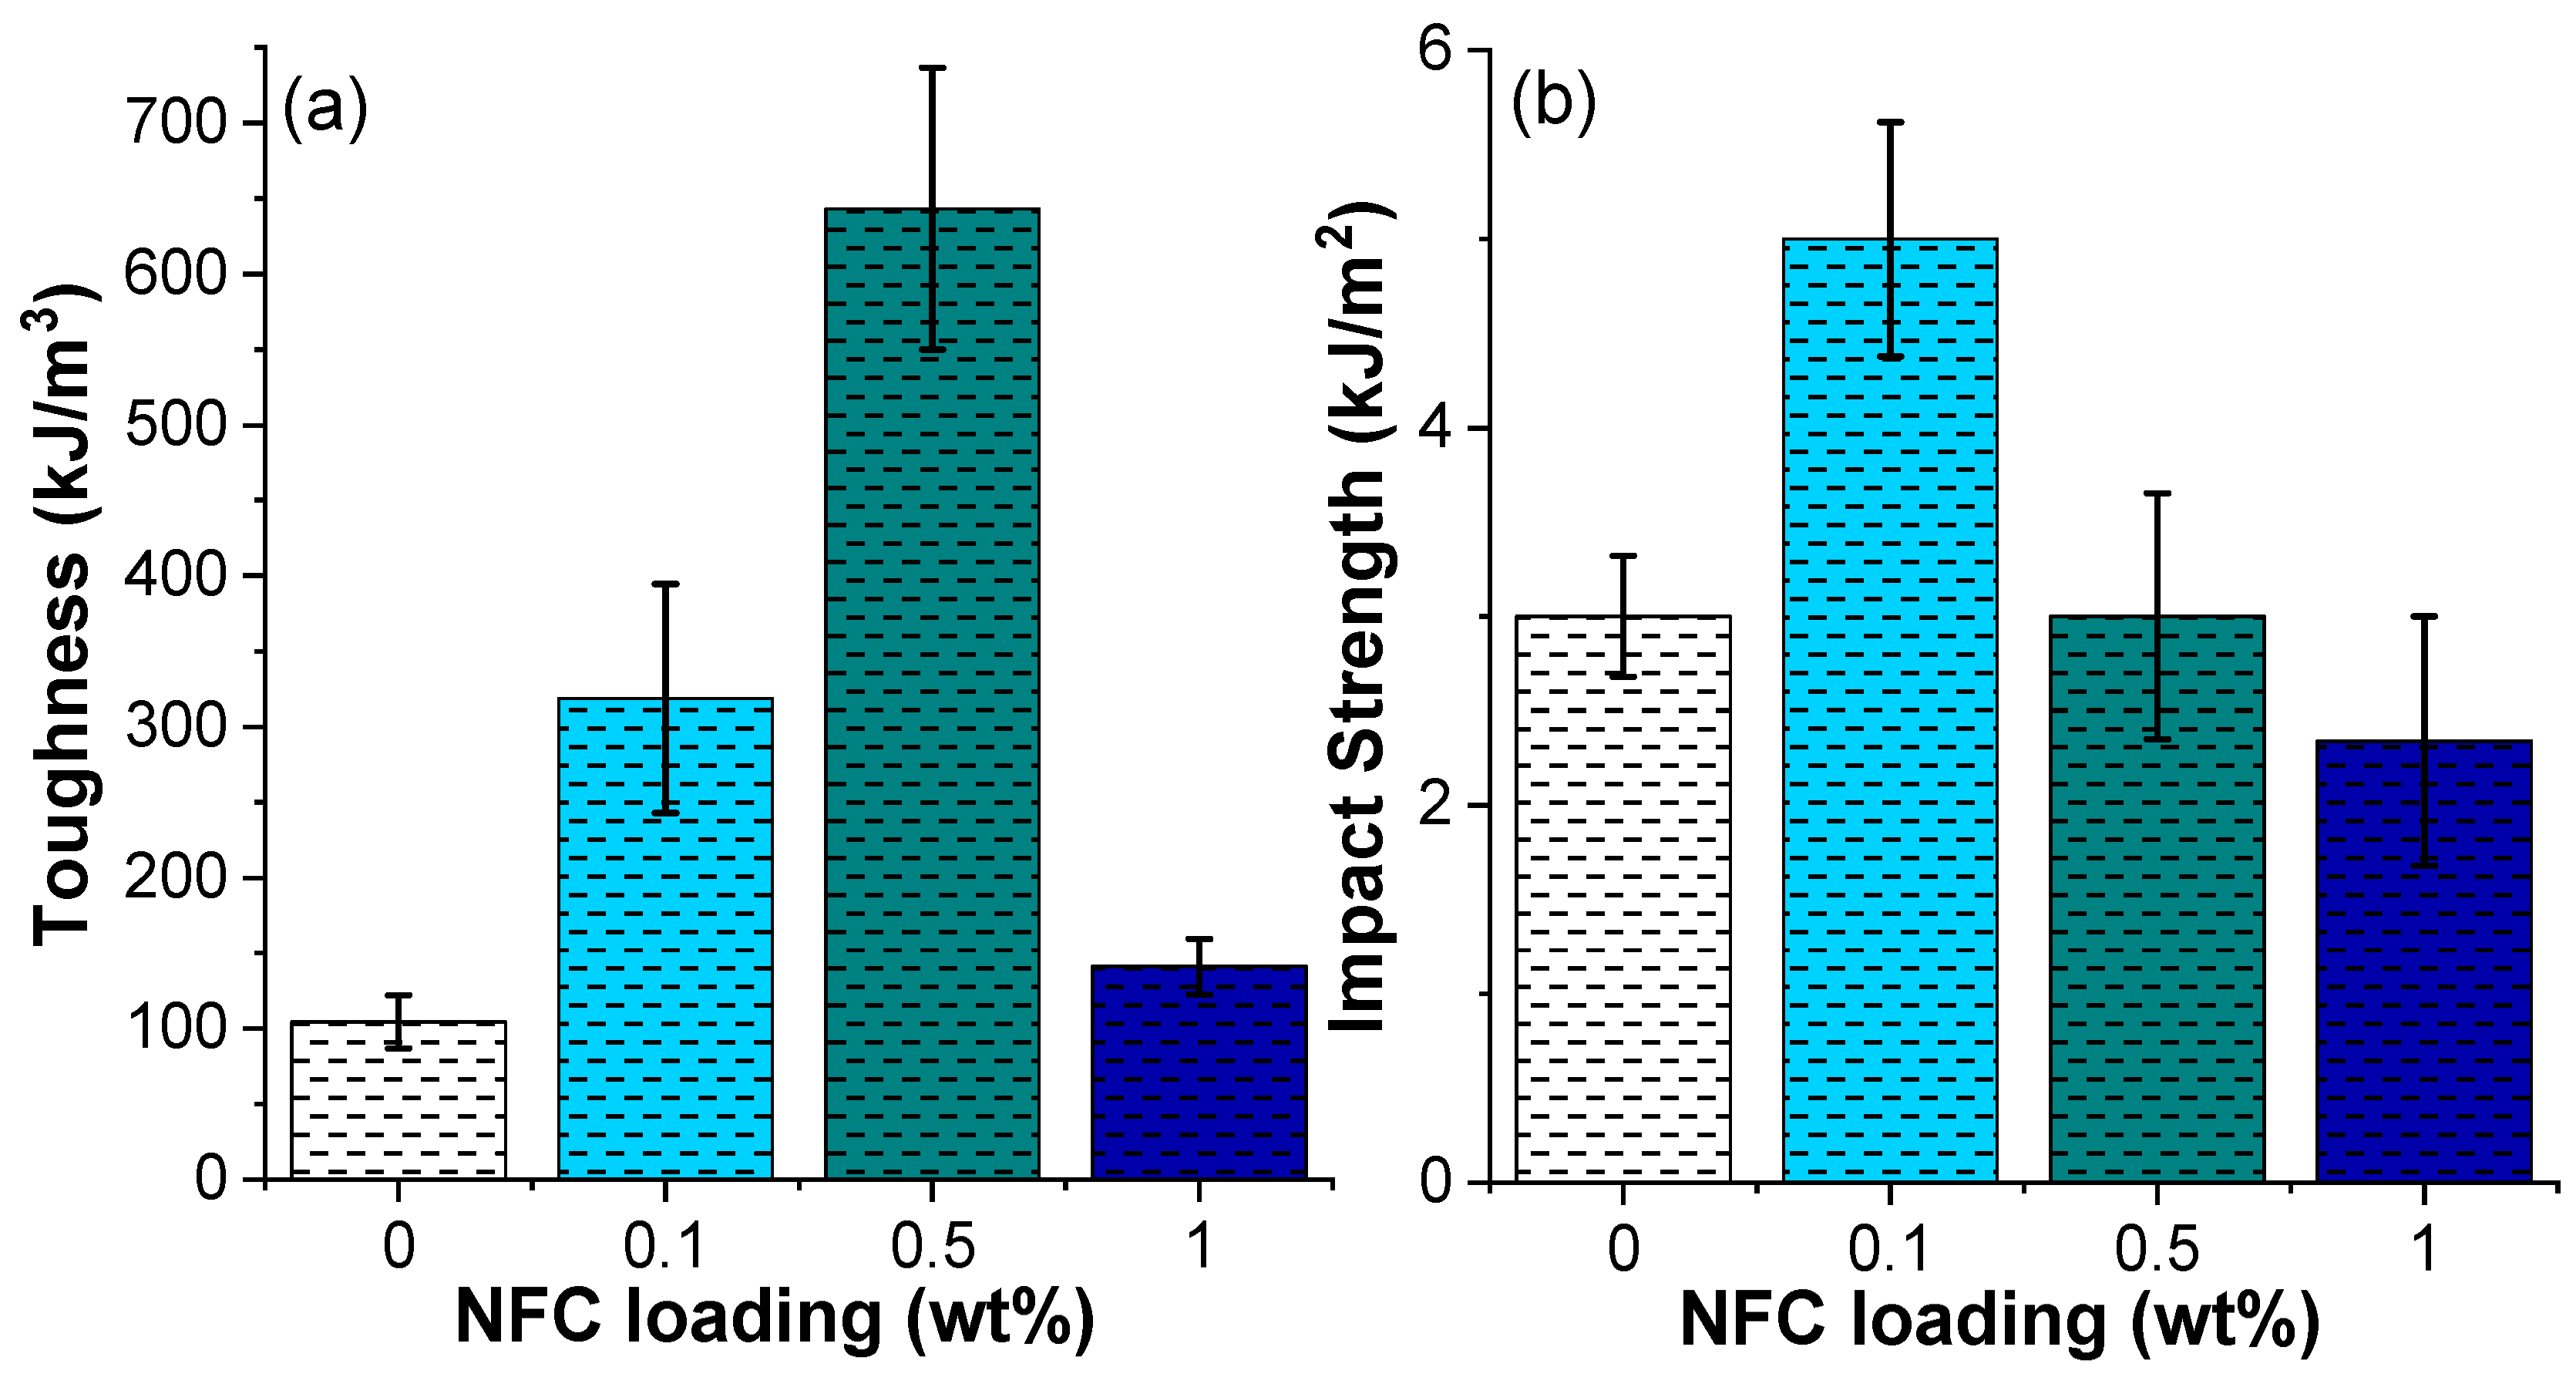
3.2. Mechanical Properties

The mechanical properties data show the largest increases in tensile and flexural stress, modulus, and flexural strain at 0.1% NFC content; higher NFC concentrations result in decreases (Figure 3). This further testifies to the structural heterogeneity of the 0.5% and 1% formulations. Particularly noteworthy here is the significant improvement in mechanical properties at the lowest NFC concentration. The addition of 0.1 wt% NFC resulted in 2.3-fold and 2.4-fold increases in tensile and flexural strength (Figure 3a,c, respectively). Tensile and flexural strains also show increases of 1.7-fold and 1.2-fold, as well as a 1.6-fold and 5% increase in tensile and flexural moduli (Figure 3b,d, respectively). These results demonstrate NFC’s exceptional potential as a reinforcing filler in bio-based UV-curable 3D printing resins.
The 0.5% NFC composite also showed significant enhancements in tensile and flexural strength and strain compared to the neat material. In fact, for the tension test, the 0.5% NFC sample showed the largest increase in strain at the break (2.7-fold) (vs. 0.1% NFC in the case of flexural testing). The increase in strain at the break can be attributed to the friction energy dissipation during deformation between flexible NFC and a rigid polymer matrix [43]. On the other hand, the decrease in tensile strength when moving from 0.1% NFC to 0.5% NFC attributes to the system’s increased heterogeneity, as revealed by the morphological analyses presented in Figure 2. Agglomeration of the hydrophilic NFC and weak adhesion with the polymer matrix may reduce the overall tensile strength [43,44]. The combination of these features leads to internal stress concentrations that result in points of failure in the material’s structure. At the same time, the tensile strain at the break for 0.5% is 1.5-fold higher than for 0.1% (Figure 3a). This could be due to the fiber entanglements and spatial network developed by the long and flexible NFC (known to increase the strain of polymer composites [45]). However, flexural strain at the break in the 0.5% composite shows a more limited (1.12-fold) increase compared to the neat resin, which is slightly lower than that observed for the 0.1% composite. An increase in NFC content to 1 wt% resulted in a decline in the composite mechanical performance. Tensile and flexural strengths are similar, while the modulus is reduced by 30% and 42%, compared to the neat resin, respectively. This could be explained with the increasing NFC tendency to agglomerate, with increasing content introducing more heterogeneity and changes to the materials structure and properties. However, the tensile strain at the break still shows a 1.3-fold increase (Figure 3a).
Material tensile toughness can be obtained by simply integrating the area below the stress–strain curve before fracture in tensile testing [46]. Figure 4a shows that introducing NFC reinforcement increases the sample’s ability to absorb energy per unit volume prior to fracture. This is evident from the toughness values, where the largest increase compared to the neat resin is observed at 0.5% NFC (6.2-fold). With 0.1% NFC, in contrast, a 3.1-fold increase is observed, and at 1% NFC, the increase is only 1.4-fold, which is related to the extreme heterogeneity of the sample.
The unnotched Charpy impact strength of the neat and NFC-reinforced composites are summarized in Figure 4b. Charpy impact strength follows a similar trend to that observed in the tensile test results. The lowest NFC content leads to a 1.5-fold increase in impact strength compared to the neat resin. In contrast, at higher loadings, the impact strength is similar to that of the neat resin, likely due to increased agglomeration and heterogeneity in the 0.5% and 1% NFC-reinforced composites. Such behavior is common for particle-filled polymer composites displaying insufficient filler dispersion in the polymer matrix [47]. The resulting stress concentrations in the composite can serve as points of failure at the instant of impact, lowering the overall stiffness [48].

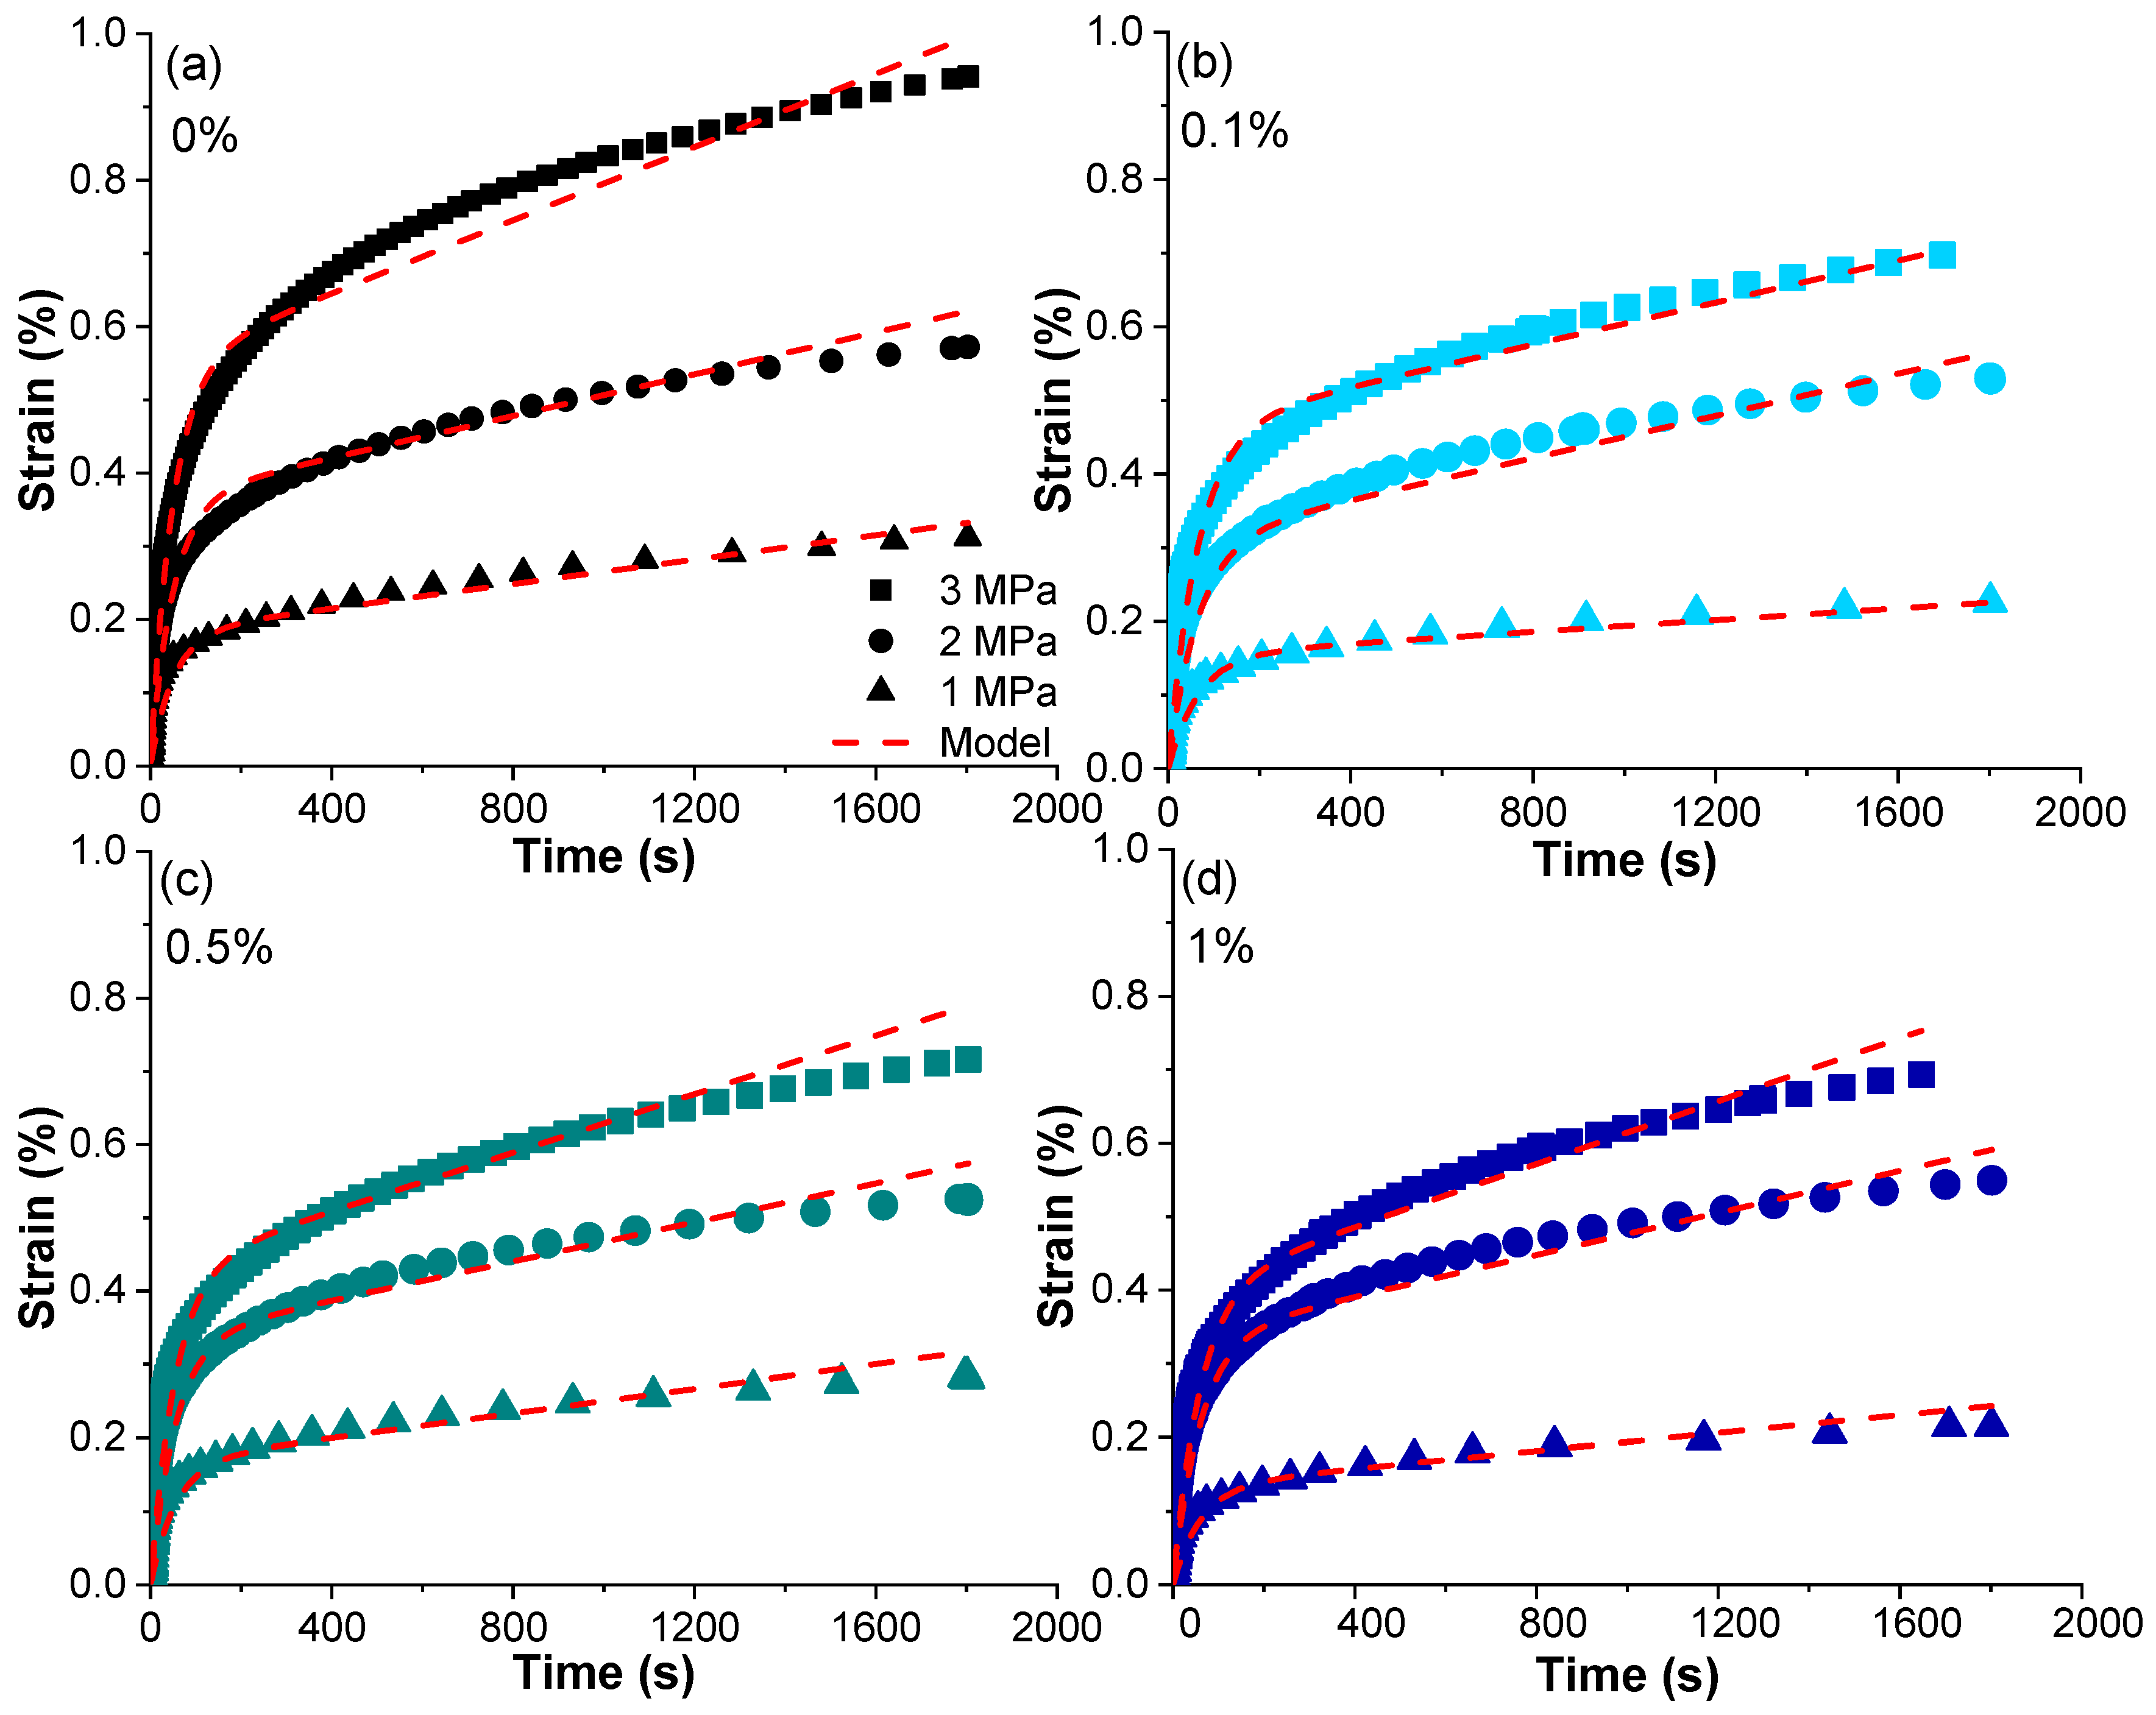
3.3. Creep and Creep-Recovery

Representative creep-recovery curves for the neat resin and 0.1% NFC-reinforced composite are shown in Figure 5a,b, while data for the 0.5% and 1% NFC compositions are shown in Figure S1a,b (Supplementary Materials). The composites exhibit viscoelastic–viscoplastic behavior: creep increases with the applied stress and time and is accompanied by permanent deformation following unloading. The creep (time-dependent) strain is relatively high and comparable to or greater than the elastic (instantaneous) strain by up to 1.3-fold. The residual (permanent) strains are low and are in the 0.05–0.1% range of the total strain.
The creep strain decreases as the NFC content increases (Figure 5c,d). The effect of 0.1 wt% NFC is quite significant: the total strain after 30 min of creep at 3 MPa decreased from 1.96% for the neat resin to 1.50% for the composite (a 23% reduction). Further increasing the NFC content to 1 wt% produces only a marginal additional reduction. For comparison, Li et al. reported a 33% reduction of creep in starch-based composites reinforced with 5 wt% NFC and the highest reduction of 69% for a 15 wt% composite [49]. Further increases in the NFC loading in the starch matrix did not show additional improvements in creep resistance due to inefficient filler dispersion. In the study of Gong et al. [50], adding up to 10 wt% NFC into a polyvinyl acetate (PVA) matrix resulted in a nearly 50% reduction of creep and residual strains. Cataldi et al. [51] investigated the creep behavior of poly(vinyl alcohol)/cellulose nanocrystal (CNC) composites for 3D printing and found that 10 wt% CNC composites experienced reductions in creep of up to 35%. Based on these results, it can be concluded that the produced NFC composites possess reasonably high creep resistance at much lower filler loads compared to other nanocellulose-filled composites. NFC acts as an efficient reinforcement, increasing their creep resistance and restricting the slippage, reorientation, and general mobility of polymer chains [22,23,49,50].
Non-monotonic changes in composite stiffness with increasing NFC content (Figure 3b) also appeared in the form of non-monotonic changes in elastic strains in creep tests. Thus, the creep strain (total strain minus elastic strain) provides more accurate information on the dimensional stability of composites with time. Figure 6a shows the creep strain with increasing NFC content. Independently of the applied stress, creep reduction due to NFC addition is in the range of 23–32%, with the most significant effect for the 0.1% NFC composite. Similar trends are observed for the residual strain (Figure 6b), where the reduction ranges between 17 and 34% when compared to the neat resin.
According to the literature data for various polymer systems, creep resistance increases with good dispersion of nanofillers and decreases with their agglomeration [21,49]. The decrease in the creep strain is mainly due to the reinforcement of the polymer and the immobilization of the chains in a large interface zone around the nanosized fillers, which slows down the relaxation processes. Agglomerates, whose contribution inevitably increases at high loadings, act as stress concentrators, creating local overstresses that affect the development of viscoplastic strains [52].
The magnitude of the residual strain varies in proportion to the maximum total strain measured in the creep test (Figure 7). For all NFC loadings and creep stresses, the data fit a common dependence (for simplicity, a linear trend of y = 0.088x − 0.01, with correlation coefficient (R2) of 0.879 is given). The residual strain increases with increasing stress, while NFC loading results in a decrease in the strain values and a shift down on the curve. The data suggest that the degree of irreversibility is determined by the total creep strain achieved during loading [52]. Similar linear and power-law relationships between the residual strain and total strain dependencies were also obtained for other polymer nanocomposites [53,54]. These empirical relationships enable one to predict residual strains at any stress and filler load by performing just a few creep-recovery control tests.
Burgers model quantitatively shows the relationship between the intrinsic properties of the prepared composites and their creep behavior. Burgers model is one of the most widely used micromechanical creep models describing the viscoelastic–viscoplastic behavior of polymers [55,56], including biobased [21,57] and NFC-reinforced polymers [49,50]. The main advantages of this model are its simplicity and mathematical tractability due to the small number of the involved fitting parameters. The model is a combination of Maxwell and Kelvin–Voigt elements connected in series. The total strain ɛ is given by the sum of three components:
ε = ε e l + ε v e + ε v p
where ɛel, ɛve, and ɛvp correspond to the elastic, viscoelastic, and viscoplastic strain components. The creep strain is the total strain minus the instantaneous elastic strain, i.e., εcr = ε − εel. According to Equation (1) and Burgers model formulation, the creep strain is given by relation [55,56]
ε c r ( t ) = σ E K 1 e x p t τ K + σ η M t
where EK is the elastic modulus of the Kelvin spring, τ K = ηK/EK is the retardation time of the Kelvin–Voigt element, and ηK and ηM are the viscosities of the Kelvin and Maxwell dashpots, respectively. Equation (2) was used to fit the experimental data by adjusting three independent parameters EK, τ K , and ηM. The Burgers model agrees satisfactorily with the experimental data with R2 values ranging from 92% to 98% (Figure 8). The fitting parameters are shown in Table 3.
EK and τ K are stress-independent parameters since the behavior of the materials was assumed to be linearly viscoelastic based on the linearity of their creep isochrones. Both Kelvin parameters increase by 16–20% in the case of the NFC-containing materials, manifesting the decreased mobility of polymer chains in the presence of the nanofiller. The parameter η M represents the viscous flow (contribution of the dashpot component in the model) and is related to irreversible deformation of the polymer, such as slipping and breaking of bridging segments, separation of junctions between NFCs and polymer chains, and pulling out of chain entanglements [49,50]. The magnitude of ηM also increases with the NFC content, although noticeable data scatter disturbs the expected trend. The highest ηM, i.e., the lowest contribution from the viscoplastic strain component in Equation (2), is obtained for the 0.1% composite sample, and correlates well with its lowest residual strain monitored in creep-recovery tests (Figure 6b). Non monotonous changes of the parameters of the creep model can be explained by counterbalancing effects from NFC: (i) decreased creep due to the reinforcement effect and retardation of relaxation properties and (ii) accelerated viscoplastic creep due to agglomerates. Clearly, the former effect dominates for the 0.1% composite, while higher loads are less effective in reducing creep.
Figure 8 shows that although the model did not provide a perfect fit, it still showed satisfactory agreement between the experimental and calculated data. Notably, some deviations between the model predictions and experimental creep curves became apparent at high stress levels, specifically at 3 MPa. This divergence may be attributed to the increased influence of nonlinear viscoelastic effects, necessitating the incorporation of stress-dependent parameters EK and τK. Furthermore, it is worth noting that the mechanisms of viscoplastic deformation can vary with increasing loads, especially in complex composite systems containing NFC fillers. This leads to more complex interactions between the filler and the polymer matrix than what the model accounts for. To reliably predict such behavior, additional creep-recovery tests at higher stresses and/or longer loading times are needed.
Thus, the Burger model provides a satisfactory fit to the experimental data within the considered range of stresses and loading times. However, to formulate more general conclusions, further tests at higher stress levels and loading times, as well as for compositions with a greater content of NFC, are needed.

4. Conclusions

The present study demonstrates the viability of nanofibrillated cellulose (NFC) as a reinforcing filler for UV-curable additive manufacturing (AM) of bio-based composite resins. Moreover, the importance of achieving a balance between agglomeration and filler network formation by utilizing filler loadings close to the percolation threshold is broadly discussed. In this context, the 0.1% NFC composite demonstrated the most significant improvements in the overall mechanical performance, including enhanced tensile modulus (1.6-fold), strength (2.3-fold and 2.4-fold), and break strain (1.7-fold and 1.2-fold) in both tension and flexure, increased toughness (3-fold), and impact strength (1.5-fold), and reduced creep (23%), and residual strains (34%). Concerning creep behavior in particular, the viscoelastic–viscoplastic behavior of composites is satisfactorily described by the Burgers model, and the model parameters are correlated with their internal structure. Consistent with these observations, optical microscopy, SEM imaging, and Cole–Cole plot analyses provide evidence that agglomeration occurred at 0.5 and 1 wt% NFC, with much greater homogeneity at ~0.1 wt% NFC.
All in all, this study shows that, by maintaining an ultra-low NFC content (near the estimated percolation threshold), NFC agglomeration can be minimized, and significant improvements in the mechanical performance of the bio-based UV-curable composite AM resin can be realized as a result. Our work indicates that carefully designed NFC composite resins for vat photopolymerization AM technologies represent a promising path for reaching sustainable alternatives to commercial petroleum-based resins.

Supplementary Materials

The following supporting information can be downloaded at: https://www.mdpi.com/article/10.3390/jcs7100435/s1, Figure S1: Creep-recovery curves of NFC-reinforced composite samples: 0.5% (a) and 1% (b) under various creep stresses, and all composites under 2 MPa (c).

Author Contributions

The manuscript was written through the contributions of all authors. Conceptualization, S.G.; methodology, S.G.; formal analysis, A.B., M.J. and O.S.; investigation, A.B., M.J., O.S. and L.G.; resources, S.G.; writing—original draft preparation, A.B. and M.J.; writing—review and editing, O.S. and D.F.S.; visualization, A.B.; supervision, S.G.; review and editing, S.G. All authors have read and agreed to the published version of the manuscript.

Funding

This research is funded by the M-era.net 2017 project “3D Printable Innovative Biobased Materials for Wood Mimics”, 3DPrintInn; Nr.1.1.1.5/ERANET/18/05. Anda Barkane acknowledges the European Social Fund within the Project No 8.2.2.0/20/I/008 «Strengthening of PhD students and academic personnel of Riga Technical University and BA School of Business and Finance in the strategic fields of specialization» of the Specific Objective 8.2.2 «To Strengthen Academic Staff of Higher Education Institutions in Strategic Specialization Areas» of the Operational Programme «Growth and Employment».

Data Availability Statement

Data will be made available on request.

Acknowledgments

The authors thank their parental institute for providing the necessary facilities to accomplish this work.

Conflicts of Interest

The authors declare no conflict of interest.

References

  1. Prashar, G.; Vasudev, H.; Bhuddhi, D. Additive manufacturing: Expanding 3D printing horizon in industry 4.0. Int. J. Interact. Des. Manuf. IJIDeM 2022, 1–15. [Google Scholar] [CrossRef]
  2. Dadhania, S. 3D Printing Materials Market 2022–2032; IDTechEx: Cambridge, UK, 2022. [Google Scholar]
  3. Rodriguez-Hernandez, A.G.; Chiodoni, A.; Bocchini, S.; Vazquez-Duhalt, R. 3D printer waste, a new source of nanoplastic pollutants. Environ. Pollut. 2020, 267, 115609. [Google Scholar] [CrossRef] [PubMed]
  4. Hopkins, N.; Jiang, L.; Brooks, H. Energy consumption of common desktop additive manufacturing technologies. Clean. Eng. Technol. 2021, 2, 100068. [Google Scholar] [CrossRef]
  5. Lawrence, W.H.; Bass, G.E.; Purcell, W.P.; Autian, J. Use of Mathematical Models in the Study of Structure-Toxicity Relationships of Dental Compounds: I. Esters of Acrylic and Methacrylic Acids. J. Dent. Res. 1972, 51, 526–535. [Google Scholar] [CrossRef] [PubMed]
  6. Voet, V.S.D.; Guit, J.; Loos, K. Sustainable Photopolymers in 3D Printing: A Review on Biobased, Biodegradable, and Recyclable Alternatives. Macromol. Rapid. Commun. 2021, 42, e2000475. [Google Scholar] [CrossRef]
  7. Hull, C.W. Apparatus for Production of Three-Dimensional Objects by Stereolithography. U.S. Patent 4575330A, 11 March 1986. [Google Scholar]
  8. Wang, R.; Shen, W.; Zhang, W.; Song, J.; Li, N.; Liu, M.; Zhang, G.; Xue, C.; Zhang, W. Design and implementation of a jellyfish otolith-inspired MEMS vector hydrophone for low-frequency detection. Microsyst. Nanoeng. 2021, 7, 1. [Google Scholar] [CrossRef]
  9. Taormina, G.; Sciancalepore, C.; Messori, M.; Bondioli, F. 3D printing processes for photocurable polymeric materials: Technologies, materials, and future trends. J. Appl. Biomater. Funct. Mater. 2018, 16, 151–160. [Google Scholar] [CrossRef]
  10. Briede, S.; Jurinovs, M.; Nechausov, S.; Platnieks, O.; Gaidukovs, S. State-of-the-art UV-assisted 3D printing via a rapid syringe-extrusion approach for photoactive vegetable oil acrylates produced in one-step synthesis. Mol. Syst. Des. Eng. 2022, 7, 1434–1448. [Google Scholar] [CrossRef]
  11. Barkane, A.; Platnieks, O.; Jurinovs, M.; Kasetaite, S.; Ostrauskaite, J.; Gaidukovs, S.; Habibi, Y. UV-Light Curing of 3D Printing Inks from Vegetable Oils for Stereolithography. Polymers 2021, 13, 1195. [Google Scholar] [CrossRef]
  12. Di Mauro, C.; Tran, T.-N.; Mija, A. One-Pot Terpolymerization Synthesis of High Carbon Biocontent Recyclable Epoxy Thermosets and Their Composites with Flax Woven Fibers. ACS Sustain. Chem. Eng. 2021, 9, 8526–8538. [Google Scholar] [CrossRef]
  13. Di Mauro, C.; Genua, A.; Mija, A. Fully bio-based reprocessable thermosetting resins based on epoxidized vegetable oils cured with itaconic acid. Ind. Crops Prod. 2022, 185, 115116. [Google Scholar] [CrossRef]
  14. Dinu, R.; Bejenari, I.; Volf, I.; Mija, A. Vegetable Oil-Based Resins Reinforced with Spruce Bark Powder and with Its Hydrochar Lignocellulosic Biomass. Appl. Sci. 2021, 11, 10649. [Google Scholar] [CrossRef]
  15. Barkane, A.; Platnieks, O.; Jurinovs, M.; Gaidukovs, S. Thermal stability of UV-cured vegetable oil epoxidized acrylate-based polymer system for 3D printing application. Polym. Degrad. Stab. 2020, 181, 109347–109357. [Google Scholar] [CrossRef]
  16. Gaidukovs, S.; Medvids, A.; Onufrijevs, P.; Grase, L. UV-light-induced curing of branched epoxy novolac resin for coatings. Express Polym. Lett. 2018, 12, 918–929. [Google Scholar] [CrossRef]
  17. Maines, E.M.; Porwal, M.K.; Ellison, C.J.; Reineke, T.M. Sustainable advances in SLA/DLP 3D printing materials and processes. Green Chem. 2021, 23, 6863–6897. [Google Scholar] [CrossRef]
  18. Liu, W.; Chen, T.; Fei, M.-E.; Qiu, R.; Yu, D.; Fu, T.; Qiu, J. Properties of natural fiber-reinforced biobased thermoset biocomposites: Effects of fiber type and resin composition. Compos. Part B Eng. 2019, 171, 87–95. [Google Scholar] [CrossRef]
  19. Kamarudin, S.H.; Mohd Basri, M.S.; Rayung, M.; Abu, F.; Ahmad, S.; Norizan, M.N.; Osman, S.; Sarifuddin, N.; Desa, M.; Abdullah, U.H.; et al. A Review on Natural Fiber Reinforced Polymer Composites (NFRPC) for Sustainable Industrial Applications. Polymers 2022, 14, 3698. [Google Scholar] [CrossRef]
  20. Piras, C.C.; Fernandez-Prieto, S.; De Borggraeve, W.M. Nanocellulosic materials as bioinks for 3D bioprinting. Biomater. Sci. 2017, 5, 1988–1992. [Google Scholar] [CrossRef]
  21. Glaskova-Kuzmina, T.; Starkova, O.; Gaidukovs, S.; Platnieks, O.; Gaidukova, G. Durability of Biodegradable Polymer Nanocomposites. Polymers 2021, 13, 3375. [Google Scholar] [CrossRef]
  22. Barkane, A.; Kampe, E.; Platnieks, O.; Gaidukovs, S. Cellulose Nanocrystals vs. Cellulose Nanofibers: A Comparative Study of Reinforcing Effects in UV-Cured Vegetable Oil Nanocomposites. Nanomaterials 2021, 11, 1791. [Google Scholar] [CrossRef]
  23. Starkova, O.; Platnieks, O.; Sabalina, A.; Gaidukovs, S. Hydrothermal Ageing Effect on Reinforcement Efficiency of Nanofibrillated Cellulose/Biobased Poly(butylene succinate) Composites. Polymers 2022, 14, 221. [Google Scholar] [CrossRef] [PubMed]
  24. Lusis, V.; Kononova, O.; Macanovskis, A.; Stonys, R.; Lasenko, I.; Krasnikovs, A. Experimental Investigation and Modelling of the Layered Concrete with Different Concentration of Short Fibers in the Layers. Fibers 2021, 9, 76. [Google Scholar] [CrossRef]
  25. Lee, K.-Y.; Aitomäki, Y.; Berglund, L.A.; Oksman, K.; Bismarck, A. On the use of nanocellulose as reinforcement in polymer matrix composites. Compos. Sci. Technol. 2014, 105, 15–27. [Google Scholar] [CrossRef]
  26. Giri, J.; Adhikari, R. A Brief review on extraction of nanocellulose and its application. Bibechana 2012, 9, 81–87. [Google Scholar] [CrossRef]
  27. Palaganas, N.B.; Mangadlao, J.D.; de Leon, A.C.C.; Palaganas, J.O.; Pangilinan, K.D.; Lee, Y.J.; Advincula, R.C. 3D Printing of Photocurable Cellulose Nanocrystal Composite for Fabrication of Complex Architectures via Stereolithography. ACS Appl. Mater. Interfaces 2017, 9, 34314–34324. [Google Scholar] [CrossRef]
  28. Palucci Rosa, R.; Rosace, G.; Arrigo, R.; Malucelli, G. Preparation and Characterization of 3D-Printed Biobased Composites Containing Micro- or Nanocrystalline Cellulose. Polymers 2022, 14, 1886. [Google Scholar] [CrossRef] [PubMed]
  29. Vidakis, N.; Petousis, M.; Michailidis, N.; Kechagias, J.D.; Mountakis, N.; Argyros, A.; Boura, O.; Grammatikos, S. High-performance medical-grade resin radically reinforced with cellulose nanofibers for 3D printing. J. Mech. Behav. Biomed. Mater. 2022, 134, 105408. [Google Scholar] [CrossRef]
  30. Xu, X.; Liu, F.; Jiang, L.; Zhu, J.Y.; Haagenson, D.; Wiesenborn, D.P. Cellulose Nanocrystals vs. Cellulose Nanofibrils: A Comparative Study on Their Microstructures and Effects as Polymer Reinforcing Agents. ACS Appl. Mater. Interfaces 2013, 5, 2999–3009. [Google Scholar] [CrossRef]
  31. Hakimi, N.M.F.; Lee, S.H.; Lum, W.C.; Mohamad, S.F.; Osman Al Edrus, S.S.; Park, B.D.; Azmi, A. Surface Modified Nanocellulose and Its Reinforcement in Natural Rubber Matrix Nanocomposites: A Review. Polymers 2021, 13, 3241. [Google Scholar] [CrossRef]
  32. Lasenko, I.; Grauda, D.; Butkauskas, D.; Sanchaniya, J.V.; Viluma-Gudmona, A.; Lusis, V. Testing the Physical and Mechanical Properties of Polyacrylonitrile Nanofibers Reinforced with Succinite and Silicon Dioxide Nanoparticles. Textiles 2022, 2, 162–173. [Google Scholar] [CrossRef]
  33. Zwawi, M. A Review on Natural Fiber Bio-Composites, Surface Modifications and Applications. Molecules 2021, 26, 404. [Google Scholar] [CrossRef] [PubMed]
  34. Redondo, A.; Mortensen, N.; Djeghdi, K.; Jang, D.; Ortuso, R.D.; Weder, C.; Korley, L.T.J.; Steiner, U.; Gunkel, I. Comparing Percolation and Alignment of Cellulose Nanocrystals for the Reinforcement of Polyurethane Nanocomposites. ACS Appl. Mater. Interfaces 2022, 14, 7270–7282. [Google Scholar] [CrossRef] [PubMed]
  35. Barkane, A.; Jurinovs, M.; Briede, S.; Platnieks, O.; Onufrijevs, P.; Zelca, Z.; Gaidukovs, S. Biobased Resin for Sustainable Stereolithography: 3D Printed Vegetable Oil Acrylate Reinforced with Ultra-Low Content of Nanocellulose for Fossil Resin Substitution. 3D Print. Addit. Manuf. 2022, 10, 1–16. [Google Scholar] [CrossRef]
  36. Meng, L.; Li, S.; Yang, W.; Simons, R.; Yu, L.; Liu, H.; Chen, L. Improvement of Interfacial Interaction between Hydrophilic Starch Film and Hydrophobic Biodegradable Coating. ACS Sustain. Chem. Eng. 2019, 7, 9506–9514. [Google Scholar] [CrossRef]
  37. Lamm, M.E.; Wang, L.; Kishore, V.; Tekinalp, H.; Kunc, V.; Wang, J.; Gardner, D.J.; Ozcan, S. Material Extrusion Additive Manufacturing of Wood and Lignocellulosic Filled Composites. Polymers 2020, 12, 2115. [Google Scholar] [CrossRef]
  38. Mohan, D.; Sajab, M.S.; Kaco, H.; Bakarudin, S.B.; Noor, A.M. 3D Printing of UV-Curable Polyurethane Incorporated with Surface-Grafted Nanocellulose. Nanomaterials 2019, 9, 1726. [Google Scholar] [CrossRef]
  39. Jyoti, J.; Singh, B.P.; Arya, A.K.; Dhakate, S.R. Dynamic mechanical properties of multiwall carbon nanotube reinforced ABS composites and their correlation with entanglement density, adhesion, reinforcement and C factor. RSC Adv. 2016, 6, 3997–4006. [Google Scholar] [CrossRef]
  40. Jesuarockiam, N.; Jawaid, M.; Zainudin, E.S.; Thariq Hameed Sultan, M.; Yahaya, R. Enhanced Thermal and Dynamic Mechanical Properties of Synthetic/Natural Hybrid Composites with Graphene Nanoplateletes. Polymers 2019, 11, 1085. [Google Scholar] [CrossRef]
  41. Maalihan, R.D.; Chen, Q.; Tamura, H.; Sta. Agueda, J.R.H.; Pajarito, B.B.; Caldona, E.B.; Advincula, R.C. Mechanically and Thermally Enhanced 3D-Printed Photocurable Polymer Nanocomposites Containing Functionalized Chitin Nanowhiskers by Stereolithography. ACS Appl. Polym. Mater. 2022, 4, 2513–2526. [Google Scholar] [CrossRef]
  42. Balakrishnan, P.; Geethamma, V.G.; Gopi, S.; Thomas, M.G.; Kunaver, M.; Huskic, M.; Kalarikkal, N.; Volova, T.; Rouxel, D.; Thomas, S. Thermal, biodegradation and theoretical perspectives on nanoscale confinement in starch/cellulose nanocomposite modified via green crosslinker. Int. J. Biol. Macromol. 2019, 134, 781–790. [Google Scholar] [CrossRef]
  43. Tian, Y.; Kim, W.; Kiziltas, A.; Mielewski, D.; Argento, A. Effects of interfacial dynamics on the damping of biocomposites. Sci. Rep. 2022, 12, 20042. [Google Scholar] [CrossRef] [PubMed]
  44. Ferreira, F.; Pinheiro, I.; de Souza, S.; Mei, L.; Lona, L. Polymer Composites Reinforced with Natural Fibers and Nanocellulose in the Automotive Industry: A Short Review. J. Compos. Sci. 2019, 3, 51. [Google Scholar] [CrossRef]
  45. Nair, S.; Dartiailh, C.; Levin, D.; Yan, N. Highly Toughened and Transparent Biobased Epoxy Composites Reinforced with Cellulose Nanofibrils. Polymers 2019, 11, 612. [Google Scholar] [CrossRef] [PubMed]
  46. Kovačič, S.; Žagar, E.; Slugovc, C. Strength versus toughness of emulsion templated Poly(Dicyclopentadiene) foams. Polymer 2019, 169, 58–65. [Google Scholar] [CrossRef]
  47. Salasinska, K.; Barczewski, M.; Górny, R.; Kloziński, A. Evaluation of highly filled epoxy composites modified with walnut shell waste filler. Polym. Bull. 2017, 75, 2511–2528. [Google Scholar] [CrossRef]
  48. Nascimento, L.F.C.; Monteiro, S.N.; Louro, L.H.L.; da Luz, F.S.; dos Santos, J.L.; Braga, F.d.O.; Marçal, R.L.S.B. Charpy impact test of epoxy composites reinforced with untreated and mercerized mallow fibers. J. Mater. Res. Technol. 2018, 7, 520–527. [Google Scholar] [CrossRef]
  49. Li, M.; Li, D.; Wang, L.J.; Adhikari, B. Creep behavior of starch-based nanocomposite films with cellulose nanofibrils. Carbohydr. Polym. 2015, 117, 957–963. [Google Scholar] [CrossRef]
  50. Gong, G.; Pyo, J.; Mathew, A.P.; Oksman, K. Tensile behavior, morphology and viscoelastic analysis of cellulose nanofiber-reinforced (CNF) polyvinyl acetate (PVAc). Compos. Part A Appl. Sci. Manuf. 2011, 42, 1275–1282. [Google Scholar] [CrossRef]
  51. Cataldi, A.; Rigotti, D.; Nguyen, V.D.H.; Pegoretti, A. Polyvinyl alcohol reinforced with crystalline nanocellulose for 3D printing application. Mater. Today Commun. 2018, 15, 236–244. [Google Scholar] [CrossRef]
  52. Starkova, O.; Aniskevich, K.; Sevcenko, J.; Bulderberga, O.; Aniskevich, A. Relationship between the residual and total strain from creep-recovery tests of polypropylene/multiwall carbon nanotube composites. J. Appl. Polym. Sci. 2020, 138, 49957. [Google Scholar] [CrossRef]
  53. Al-Maqdasi, Z.; Pupure, L.; Emami, N.; Joffe, R. Time-dependent properties of high-density polyethylene with wood/graphene nanoplatelets reinforcement. Polym. Compos. 2022, 44, 465–479. [Google Scholar] [CrossRef]
  54. Onoji, S.E.; Iyuke, S.E.; Igbafe, A.I. Hevea brasiliensis (Rubber Seed) Oil: Extraction, Characterization, and Kinetics of Thermo-oxidative Degradation Using Classical Chemical Methods. Energy Fuels 2016, 30, 10555–10567. [Google Scholar] [CrossRef]
  55. Wang, X.; Pan, Y.; Qin, Y.; Voigt, M.; Liu, X.; Zheng, G.; Chen, Q.; Schubert, D.W.; Liu, C.; Shen, C. Creep and recovery behavior of injection-molded isotactic polypropylene with controllable skin-core structure. Polym. Test. 2018, 69, 478–484. [Google Scholar] [CrossRef]
  56. Seyhan, A.T.; Tuna, A.; Durukan, O.; Göncü, Y.; Turan, S.; Ay, N. Creep and recovery behaviors of chemically induced grafted low density polyethylene films containing silanized hexagonal boron nitride nanosheets. Mater. Express 2018, 8, 55–67. [Google Scholar] [CrossRef]
  57. Nanni, A.; Messori, M. Thermo-mechanical properties and creep modelling of wine lees filled Polyamide 11 (PA11) and Polybutylene succinate (PBS) bio-composites. Compos. Sci. Technol. 2020, 188, 107974. [Google Scholar] [CrossRef]
Figure 1. Detailed 3D printing process scheme starting with CAD models of 3D-printed ISO 178 (above) rectangular bars and ISO 527-1BA (below) dog bone specimens (a), continued with the slicing of CAD models (b), 3D printing (c) and an example of some of the resulting 3D-printed specimens (d).
Jcs 07 00435 g001
Figure 2. Morphology: optical microscope images of cross-sections (insets, 20× magnification) and freeze-fracture surfaces (10× magnification) (a), SEM micrographs of freeze-fracture surfaces (2500× magnification) (b), schematic of possible NFC distribution (c), illustrations and optical microscope images of crack propagation following tensile testing (20× magnification, tensile test direction indicated with the arrows) (d), and DMA Cole–Cole plots (e) of 3D-printed neat (0%) and NFC-reinforced composite specimens.
Jcs 07 00435 g002
Figure 3. Tensile test results for neat and NFC-reinforced formulations: stress vs. strain (a), tensile modulus (b); flexural tests results: stress vs. strain (c), flexural modulus (d).
Jcs 07 00435 g003
Figure 4. Toughness (a) and Charpy impact resistance (b) of neat and NFC-reinforced samples.
Jcs 07 00435 g004
Figure 5. Creep-recovery curves of NFC-reinforced composite samples: 0% (a) and 0.1% (b) under various creep stresses, and all composites under 1 MPa (c) and 3 MPa (d).
Jcs 07 00435 g005
Figure 6. Creep strain (a) and residual strain (b) as functions of NFC content under different stresses.
Jcs 07 00435 g006
Figure 7. Residual strain as a function of total strain for all compositions tested under different creep stresses.
Jcs 07 00435 g007
Figure 8. Creep strain curves of 3D-printed 0% (a), 0.1% (b), 0.5% (c), and 1% (d) NFC-reinforced samples; experimental data for different stresses: 1 MPa, 2 MPa, 3 MPa, and approximations (dashed line) using Equation (2).
Jcs 07 00435 g008
Table 1. Used materials for resin formulation.
NameSpecificationRole
Acrylated epoxidized soybean oil (AESO)Contains 4000 ppm monomethyl ether hydroquinone as an inhibitorMatrix resin
Trimethylolpropane triacrylate (TMPTA)Contains 600 ppm monomethyl ether hydroquinone as an inhibitor, purity of >70.0%Reactive diluent
1,6-hexanediol diacrylate (HDDA)Purity of 77.5%Reactive diluent
Diphenyl(2,4,6-trimethyl benzoyl)phosphine oxide (TPO)Purity of 97.0%Photoinitiator
Nanofibrillated cellulose (NFC)Obtained from FILTRAK filter paperReinforcing filler
Table 2. Formulation of neat AESO-based resin (0% NFC).
NameMass Loading, %
AESO65
HDDA30
TMPTA5
TPO3
Table 3. Parameters of the creep model.
MaterialStressEK, MPa τ K , s ηM, 10−6 MPa·s−1
0%1550 ± 5050 ± 51.2 ± 0.1
21.4 ± 0.2
31.2 ± 0.1
0.1%1650 ± 5060 ± 52.5 ± 0.1
22.0 ± 0.5
32.1 ± 0.3
0.5%1600 ± 5055 ± 51.3 ± 0.2
21.5 ± 0.1
31.5 ± 0.1
1%1700 ± 5060 ± 51.5 ± 0.1
21.4 ± 0.2
31.4 ± 0.2
Disclaimer/Publisher’s Note: The statements, opinions and data contained in all publications are solely those of the individual author(s) and contributor(s) and not of MDPI and/or the editor(s). MDPI and/or the editor(s) disclaim responsibility for any injury to people or property resulting from any ideas, methods, instructions or products referred to in the content.

