Article

Mechanical Homogenization of Transversely Isotropic CNT/GNP Reinforced Biocomposite for Wind Turbine Blades: Numerical and Analytical Study

1
LPMAT Laboratory, Faculty of Sciences Aïn Chock, Hassan II University, BP 5366 Maarif, Casablanca 20100, Morocco
2
REMTEX Laboratory, Higher School of Textile and Clothing Industries (ESITH), Casablanca 20000, Morocco
3
IRDL Laboratory, ENSTA Bretagne UMR-CNRS 6027, 29200 Brest, France
4
UNIHAVRE, CNRS, LOMC, Normandie Univ, 76600 Le Havre, France
5
Laboratoire Nanotechnologies et Nanosystèmes, LN2, CNRS, Université de Sherbrooke, 3IT (Institut Interdisciplinaire d’Innovation Technologique), Sherbrooke, QC J1H 5N4, Canada
*
Author to whom correspondence should be addressed.
J. Compos. Sci. 2023, 7(1), 29; https://doi.org/10.3390/jcs7010029
Submission received: 8 November 2022 / Revised: 10 December 2022 / Accepted: 6 January 2023 / Published: 10 January 2023
(This article belongs to the Special Issue Lightweight Composites Materials: Sustainability and Applications)

Abstract

:
One of the biggest problems facing the use of carbon nanotubes in reinforced composites is agglomeration within the matrix phase. This phenomenon—caused by Van der Waals forces—leads to dispersion problems and weakens the properties of the composites. This research presents a multi-stage homogenization approach used to investigate the influence of the aspect ratio, volume fraction, and agglomeration of the nanofillers on the effective mechanical properties of a polymer biocomposite containing randomly dispersed carbon nanotubes and graphene nanoplatelets. The first stage consisted in evaluating the properties of the reinforced polymers by the CNT/GNP. The second step consisted in combining the reinforced polymers with different natural and synthetic unidirectionally oriented fibers. It was found that agglomeration has a huge influence on the mechanical properties of the composite. The novelty of this work consisted of the consideration of the parameters influencing the elastic properties using different micromechanics approaches and numerical techniques.

1. Introduction

Several factors are considered while selecting materials for wind energy turbines, mainly stiffness and density. High rigidity prevents blades from bending, and low density allows for lighter blades, which mean higher turbine efficiency [1,2,3,4]. Traditionally, turbines were made from metal, although these could not resist the permanent stress cycles. Fiber-reinforced composites (FRC) presented a decent replacement for metallic blades, with glass and carbon fibers being the most commonly used fibers in the industry because of their superior properties; however, their unrecyclable nature and price (about $10.0 per lb. for carbon fibers) [5,6] are the biggest inconveniences that need to be overcome. Biocomposites, which consist of natural fibers such as flax, sisal or alfa immersed in a polymer, offer the best solution to the waste and price issue as they can behave in a mechanically similar way to synthetic fibers [7]. As they are a combination of two materials or more, biocomposites are considered to be heterogeneous materials, therefore their effective properties need to be evaluated for a more comprehensive understanding of these materials.
Recently, nanofillers have made considerable advances in the fiber-reinforced composites industry because of their ability to significantly improve mechanical, electrical, and thermal properties [8,9,10]. Since their discovery by Iijima [11], CNT’s exceptional structure and physical properties, which include their remarkable conductivity, have attracted enormous interest in scientific research [7,12]. For practical applications, it is necessary to establish structure–property relationships for a reliable design of these materials, which has inspired several research works to evaluate physical properties of CNT-reinforced composites, such as the study Thostenson et al. [13] which investigated the influence of an MWCNT-reinforced polystyrene composite and found that the mechanical properties were significantly improved. Bonnet et al. [14] studied thermal properties of single-walled carbon nanotube (SWNT)/polymethyl methacrylate composite thick films. The composite’s thermal conductivity was improved by 55% and its electrical conductivity was increased by orders of magnitude with the addition of 7% SWNT to the polymer matrix. Fidelus et al. [15] examined the thermo-mechanical properties of epoxy-based nanocomposites based on low weight fractions (from 0.01 to 0.5 wt.%) of randomly oriented single- and multi-walled carbon nanotubes and observed important improvements in the elastic modulus and tensile strength. On the other hand, graphene nanoplatelets (GNP), which are composed of several 2D layers of graphene, can provide better mechanical properties than CNTs [16,17]. In Rafiee et al.’s investigation [18], the mechanical characteristics of epoxy nanocomposites containing single-walled carbon nanotubes, multi-walled carbon nanotubes, and graphene platelets were compared. Young’s modulus, ultimate tensile strength, fracture toughness, fracture energy, and the material’s resistance to fatigue crack propagation were the mechanical parameters that were measured. The findings showed that carbon nanotube additives drastically underperform graphene platelets in terms of performance. In Gao’s [17] study, a micromechanical model was proposed to predict the thermomechanical properties of graphene reinforced metal matrix. Results of the study showed that the yield strength of the nanocomposites can be dramatically enhanced by adding a small volume percent of GNP, for example, an increment of 92.0% by 0.7 v% GNP/Al2024, 128.0% by 1.5 v% GNP/Al and 78% by 2.5 v% GNP/Cu, respectively.
However, the main challenge facing the use of CNTs and GNPs is their poor dispersion, which leads to the formation of agglomerated regions due to the high length-to-diameter ratio and the small elastic modulus in the radial direction of the nanofillers that generate van der Waals attractive forces the main cause of this phenomenon. Several research investigated the effect of the agglomeration of nanofillers. Narh et al. [19] studied the effect of agglomerated and de-agglomerated MWCNT on the thermal and mechanical characteristics of polyethylene oxide and found that nanocomposites containing deagglomerated nanotubes appear to show marginal improvement in toughness over those containing agglomerated MWCNTs. Alian et al. [20] proposed a multi-scale model based on molecular dynamics and micromechanical models to determine the effect of waviness and agglomeration of CNTs on the bulk elastic properties of epoxy composites and found that both limited their reinforcement effect. Daghigh et al. [21] investigated the nonlocal bending and buckling behaviors of agglomerated CNTRC nanoplates numerically and concluded that the elastic properties of the nanoplates are extremely affected by any type of agglomeration of CNTs, and also that ignoring clustering in the numerical model can lead to significant errors. Shi et al. [22] examined the effect of the agglomeration and found that clustering significantly reduces the stiffening effects of CNTs by 80% in the most severe cases. In Ji’s study [23], GNP agglomerations were investigated theoretically and it was shown that any type of agglomeration damages the stiffening effect. Maghsoudlou et al. [9] studied the elastic modulus of single-walled carbon nanotubes/epoxy composites computationally and experimentally and found that Young’s modulus increased while increasing the SWCNT weight fraction until 0.3 wt% and dropped sharply. This was explained by the agglomeration effect on the nanofillers. García-Macias et al. [8] presented a comparison of mean-field homogenization approaches for randomly and aligned oriented CNT-reinforced polymers and found that agglomeration caused detrimental effects for the mechanical properties, and more severely for the aligned CNTs. From this short review, the importance of, and the need for, considering the agglomeration effect in the modelling of CNT/GNP-reinforced composites can be concluded. For this purpose, we proposed a two-stage homogenization procedure (Figure 1) considering the agglomeration of the nanofillers. First, we evaluated the mechanical properties of the reinforced polymer by CNTs and GNPs using the Mori–Tanaka analytical approach and the numerical study was conducted using Digimat MF and FE. The obtained results were used in a second homogenization using Chamis’s, Hashin–Rosen and Halpin–Tsai approaches for isotropic alfa and glass fibers. For transversely isotropic carbon fibers, we used Hahn’s and Halpin–Tsai approaches. Results were compared with the numerical results calculated using Digimat.

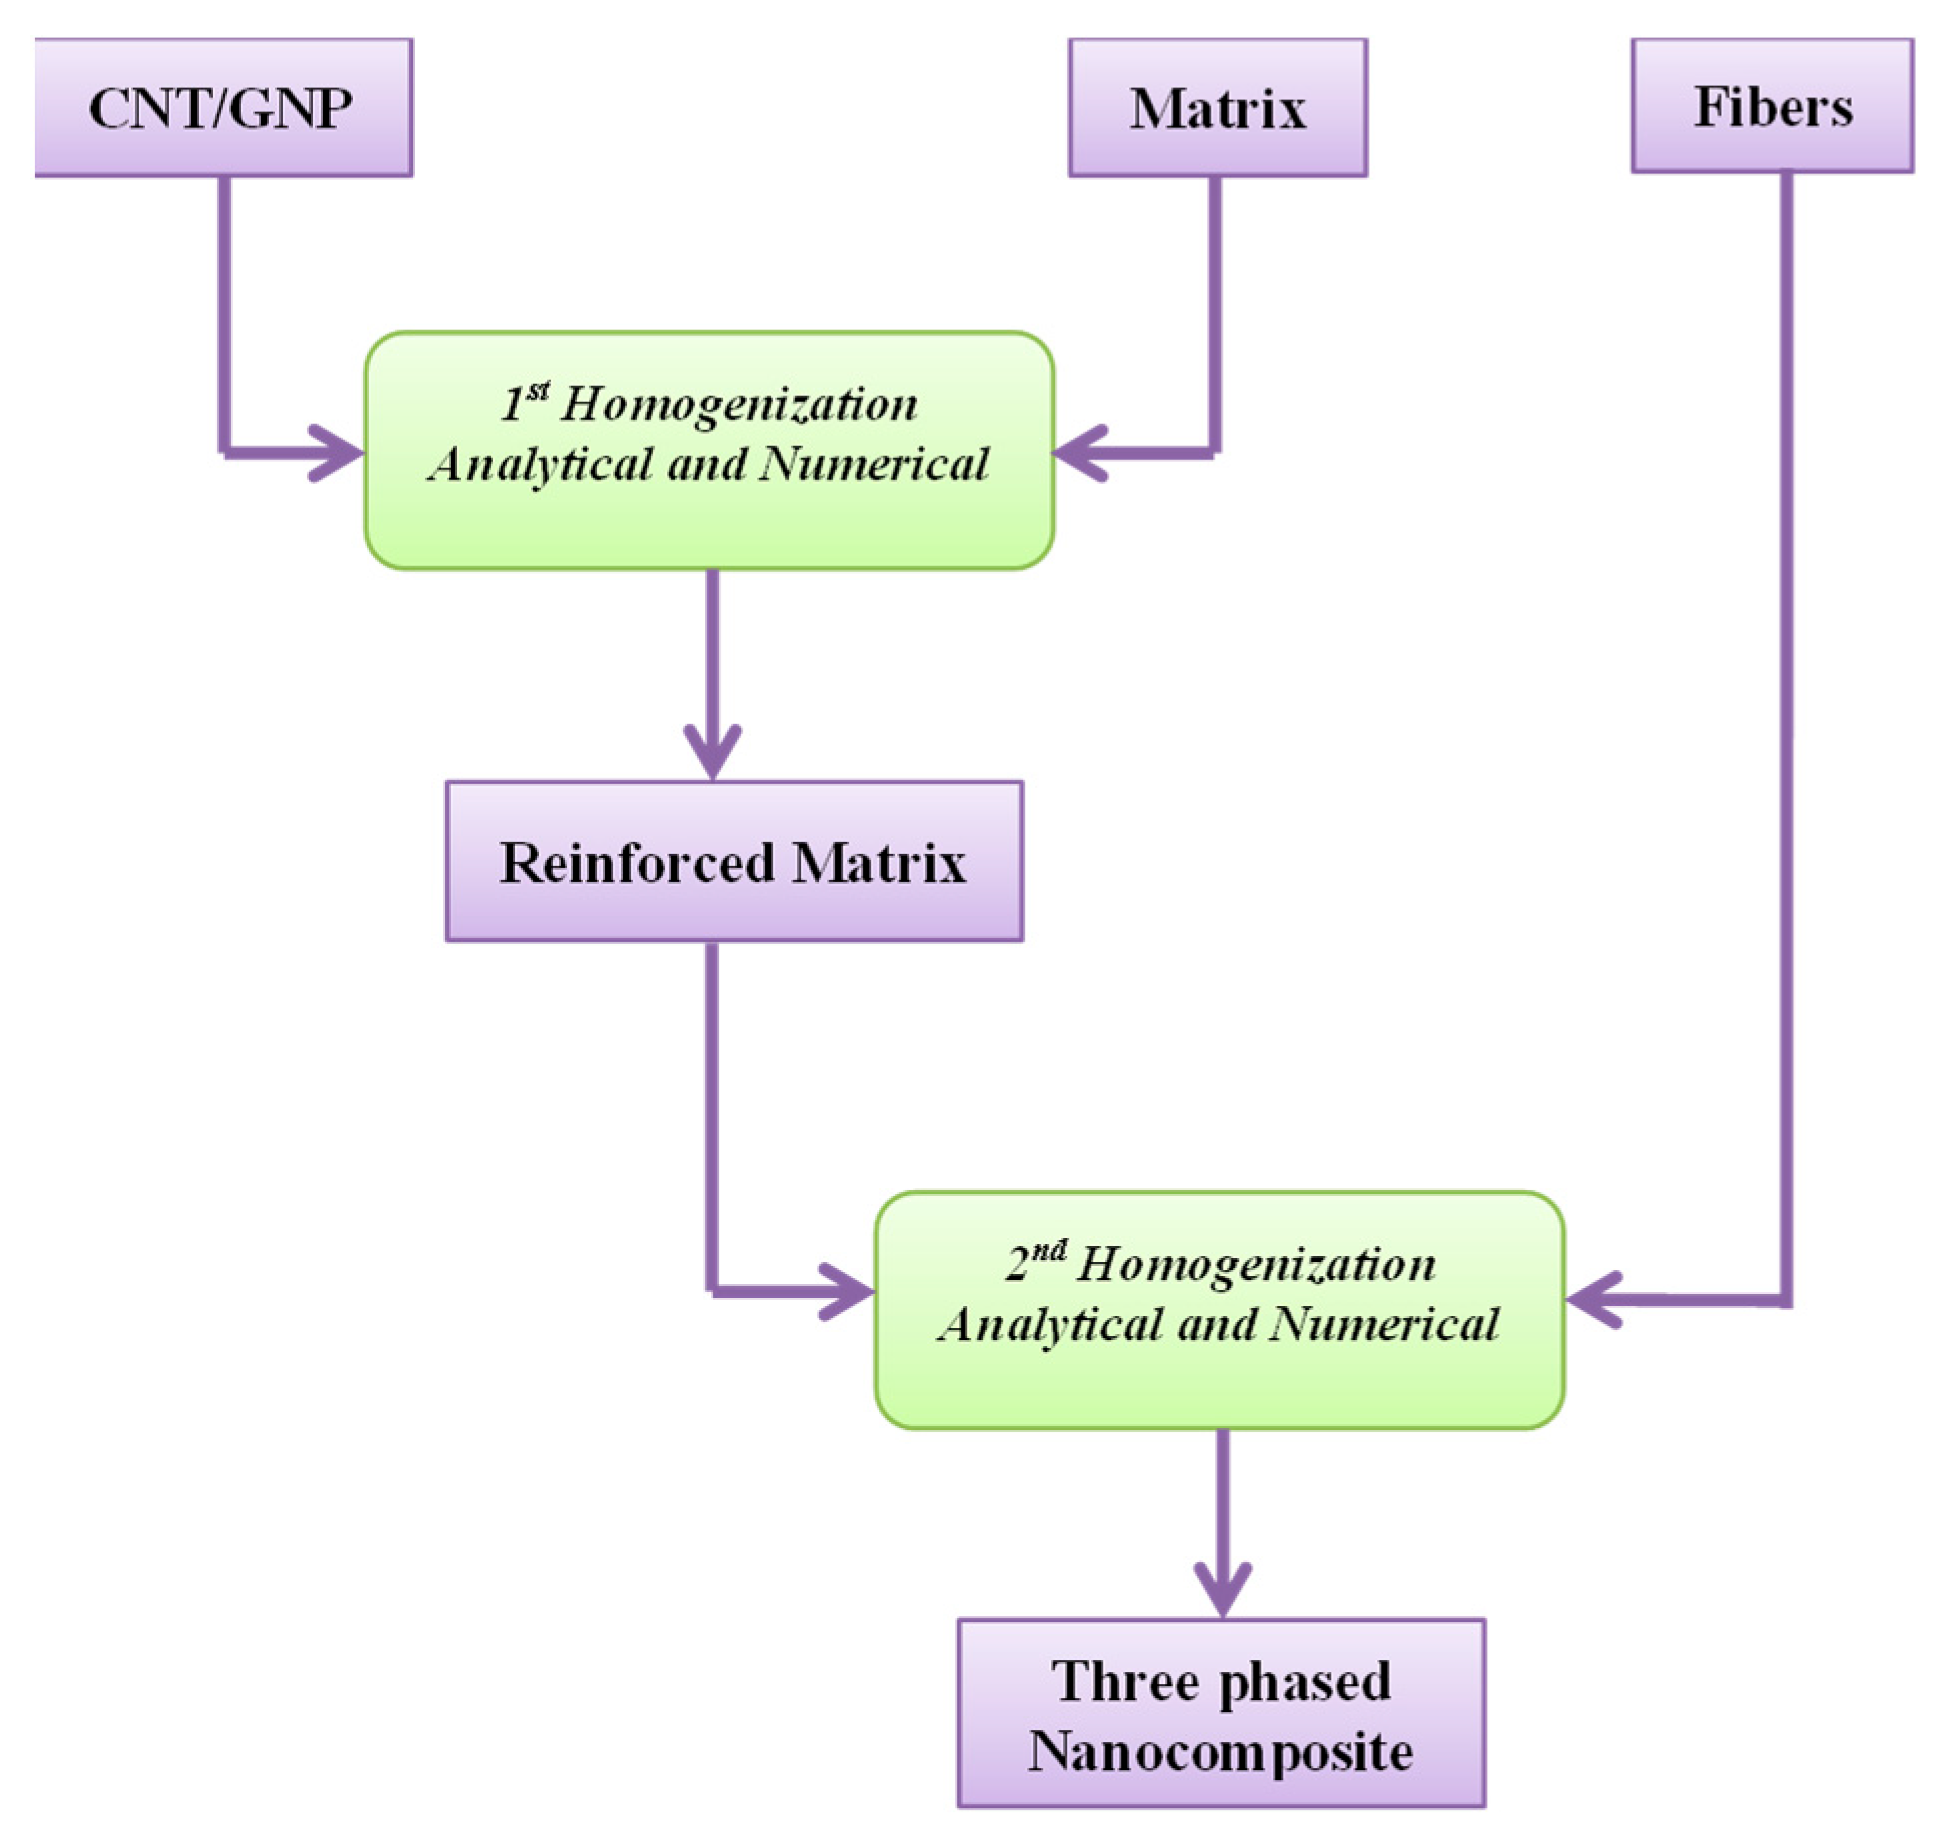
2. First Homogenization

2.1. Mathematical Model

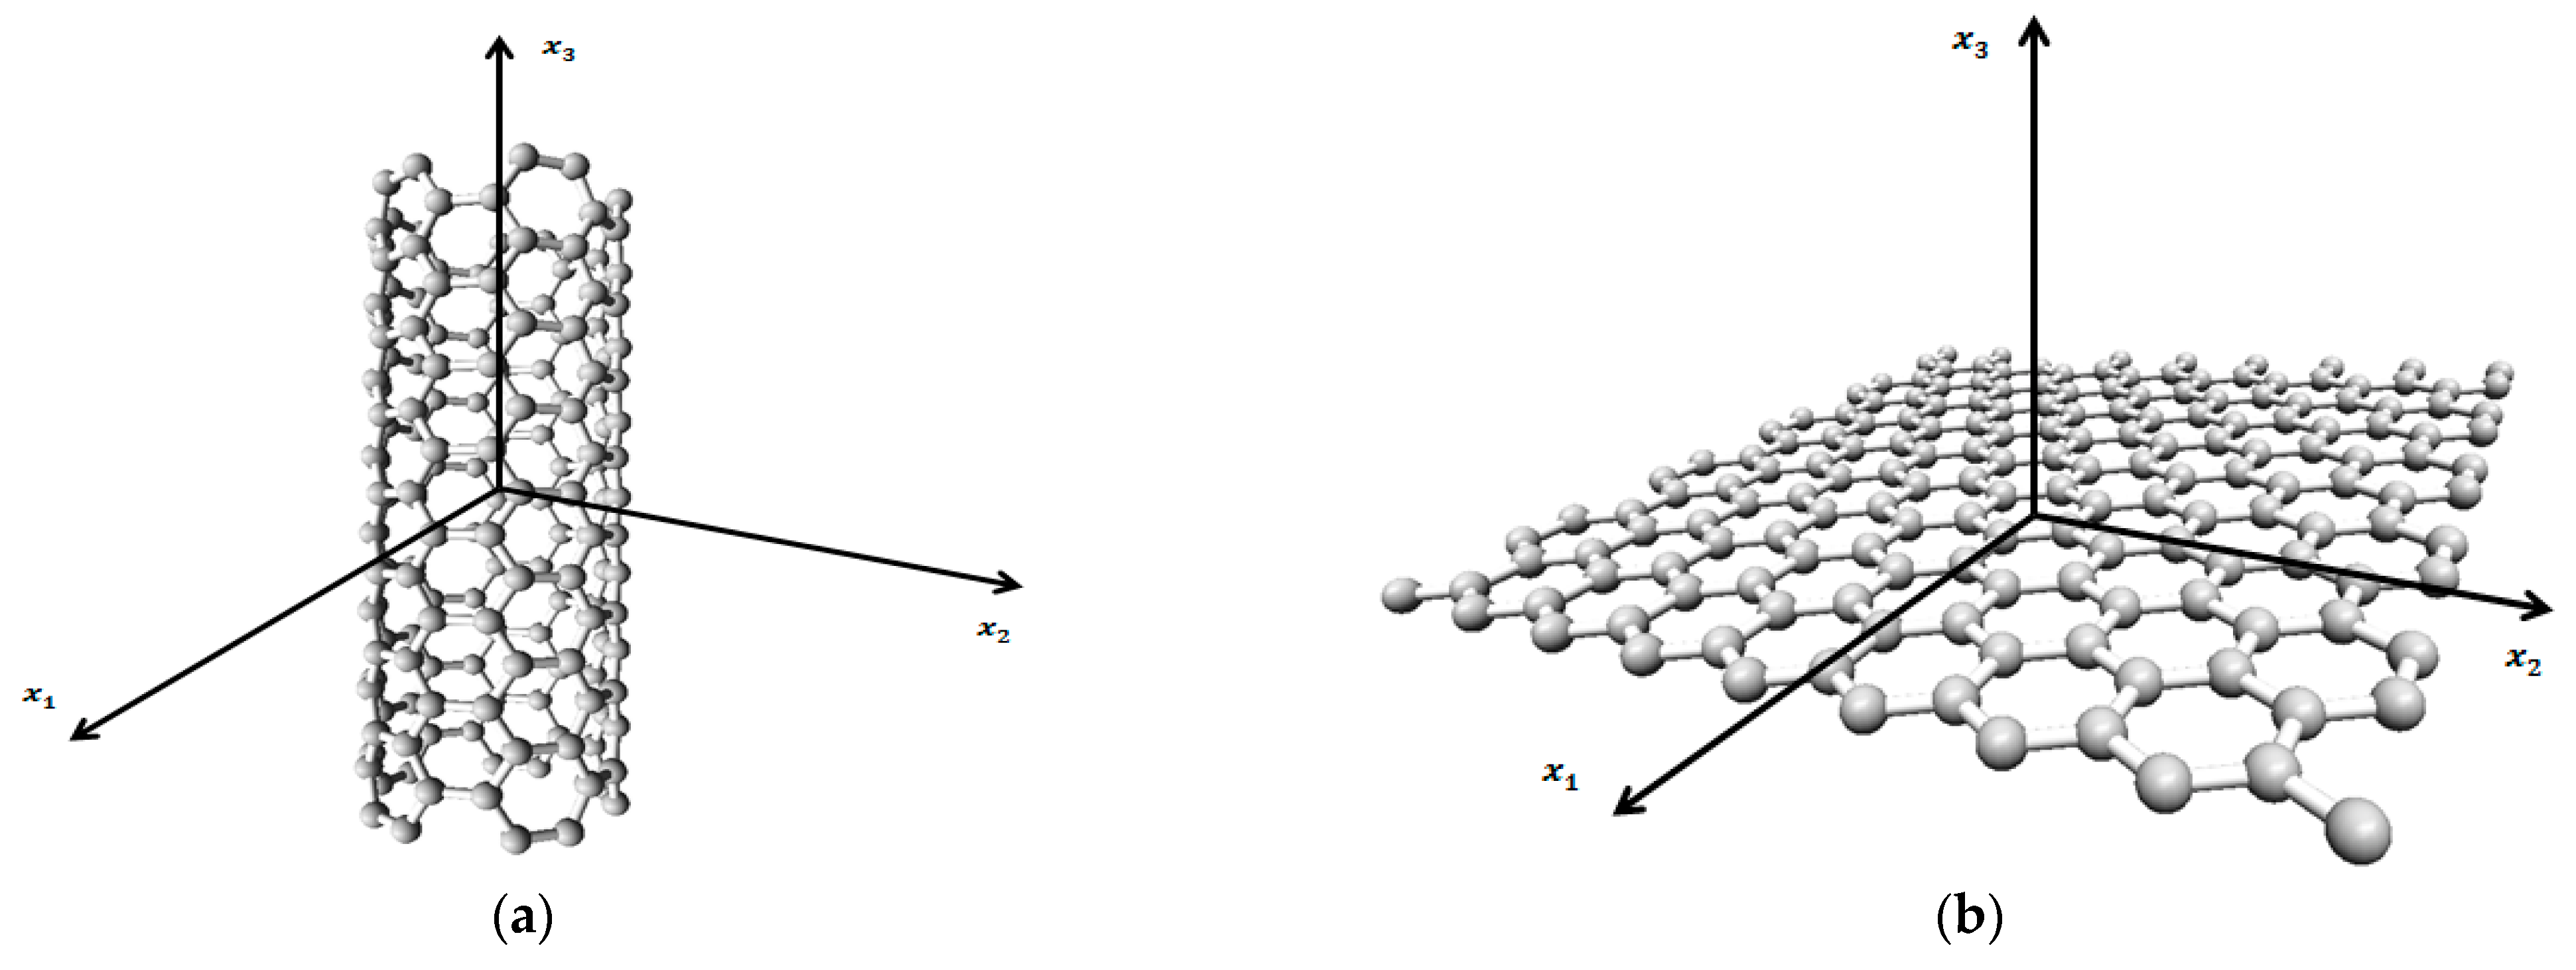
2.1.1. CNT Inclusion

CNTs can be employed as a nanofiller to enhance the mechanical properties of a polymeric matrix. For this purpose, the matrix is supposed as isotropic and characterized by the Young’s modulus E m   and the Poisson’s ratio ν m . The CNT inclusion is considered as transversely straight with an infinite aspect ratio. In this work, the Eshelby–Mori–Tanaka homogenization scheme (Figure 1) was used to determine the elastic properties of the CNT-reinforced matrix [1,24,25]. For a CNT embedded in the composite, it is related to a local coordinate system (O, x1, x2, x3), where the x3-axis lies along its longitudinal direction and the (x1, x2) plane coincides with its transversely isotropic plane. The carbon nanotube CNT is considered as a rolled graphene sheet and is only strong in its length direction as seen in Figure 2a. Comparably, a single-layered graphene sheet GNP is strong along all its in-plane directions, as seen in Figure 2b, and offers a large surface/volume ratio [26]. When the nanofillers are perfectly randomly distributed in the matrix, the overall elastic property of the reinforced composite is isotropic as an average effect of orientation.
It should be noted that the superscript (*) is employed to identify the property related to the reinforced matrix. The bulk K m *   and shear modulus G m * of the reinforced composite can be given by Equations (1) and (2).
K m * = K m + V r   δ r 3 K m α r 3   V m + V r α r
G m * = G m + V r   η r 2 G m β r 2   V m + V r β r
where
α r = 3   K m + G m + k r l r   3   G m + k r
β r = 1 5 4 G m + 2 k r + l r   3 G m + k r + 4 G m   G m + p r + 2 G m 3 K m + G m + 2 G m 3 K m + 7 G m G m 3 K m + G m + m r 3 K m + 7 G m
δ r = 1 3 n r + 2 l r + 2 k r + l r 3 K m + 2 G m l r G m + k r
η r = 1 5 2 3 n r l r + 8 G m p r G m + p r + 2 k r l r 2 G m + l r 3 G m + k r + 8 m r G m 3 K m + 4 G m 3 K m m r + G m + G m 7 m r + G m
It should be pointed out that K m and G m specify the bulk and the shear moduli of isotropic matrix, which can be evaluated from Equations (7) and (8).
K m = E m 3 1 2 ν m
G m = E m 2 1 + ν m
The reinforced matrix is evidently isotropic. Therefore, the Young’s modulus E m * and the Poisson’s ratio ν m * are required to define its properties. They can be computed in Equations (9) and (10).
E m * = 9 K m * G m * 3 K m * + G m *
ν m * = 9 K m * 2 G m * 6 K m * + 2 G m *
Finally, the density ρ m * of the reinforced matrix can be defined by using the rule of mixture as
ρ m * = ρ r ρ m V r + V m  

2.1.2. GNP Inclusion

For the case of the nanoplatelet-reinforced composites, the expressions for effective bulk modulus and shear modulus are in Equations (12) and (13).
K m * = K m + V r   δ r 3 K m α r   3 c m + V r α r
G m * = G m + V r   η r 2 G m β r   2 c m + V r β r
where
α r = 3 k m + 2 n r 2 l r   3 n r
β r = 4 G m + 7 n r + 2 l r   15 n r + 2 G m   5 p r
δ r = 3 k m n r + 2 l r + 4 k r n r l r 2   3 n r
η r = 2 15 k r + 6 m r + 6 G m l r 2 + 2 G m l r   n r
Then, the Young’s modulus E m *   and the Poisson’s ratio ν m *   for the GNP-reinforced matrix can be defined from Equations (9) and (10).

2.2. Numerical Model
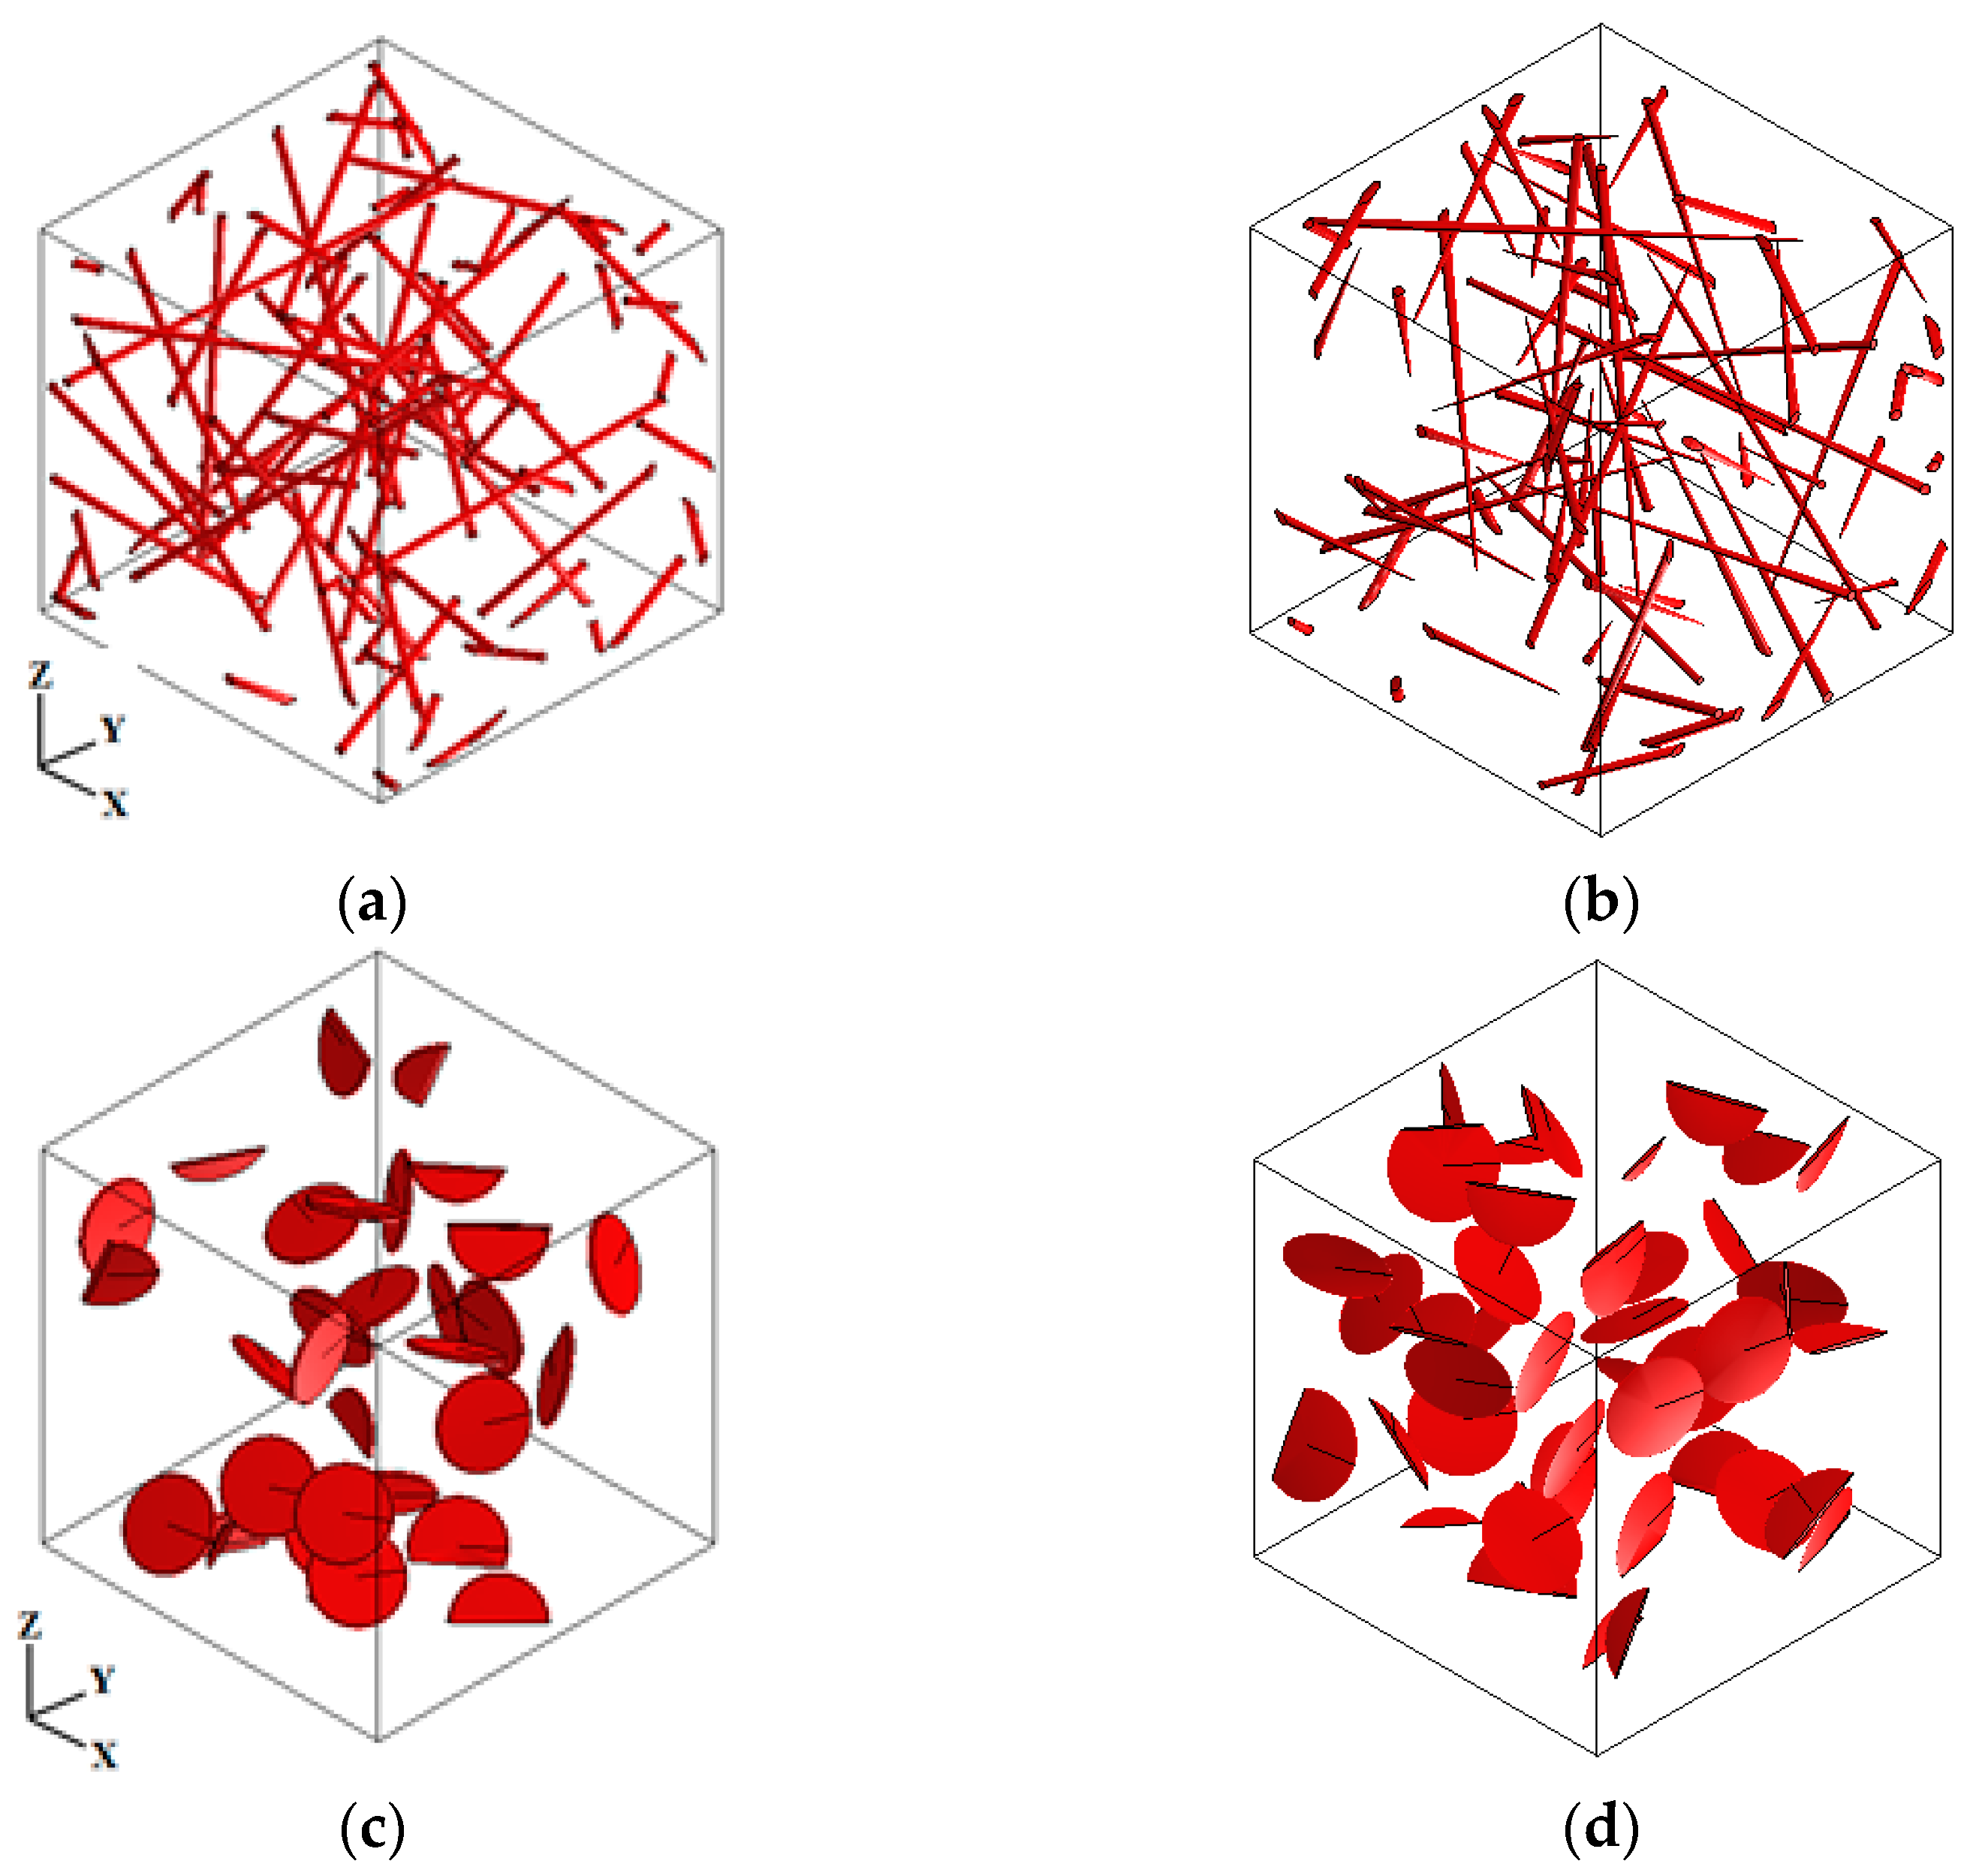
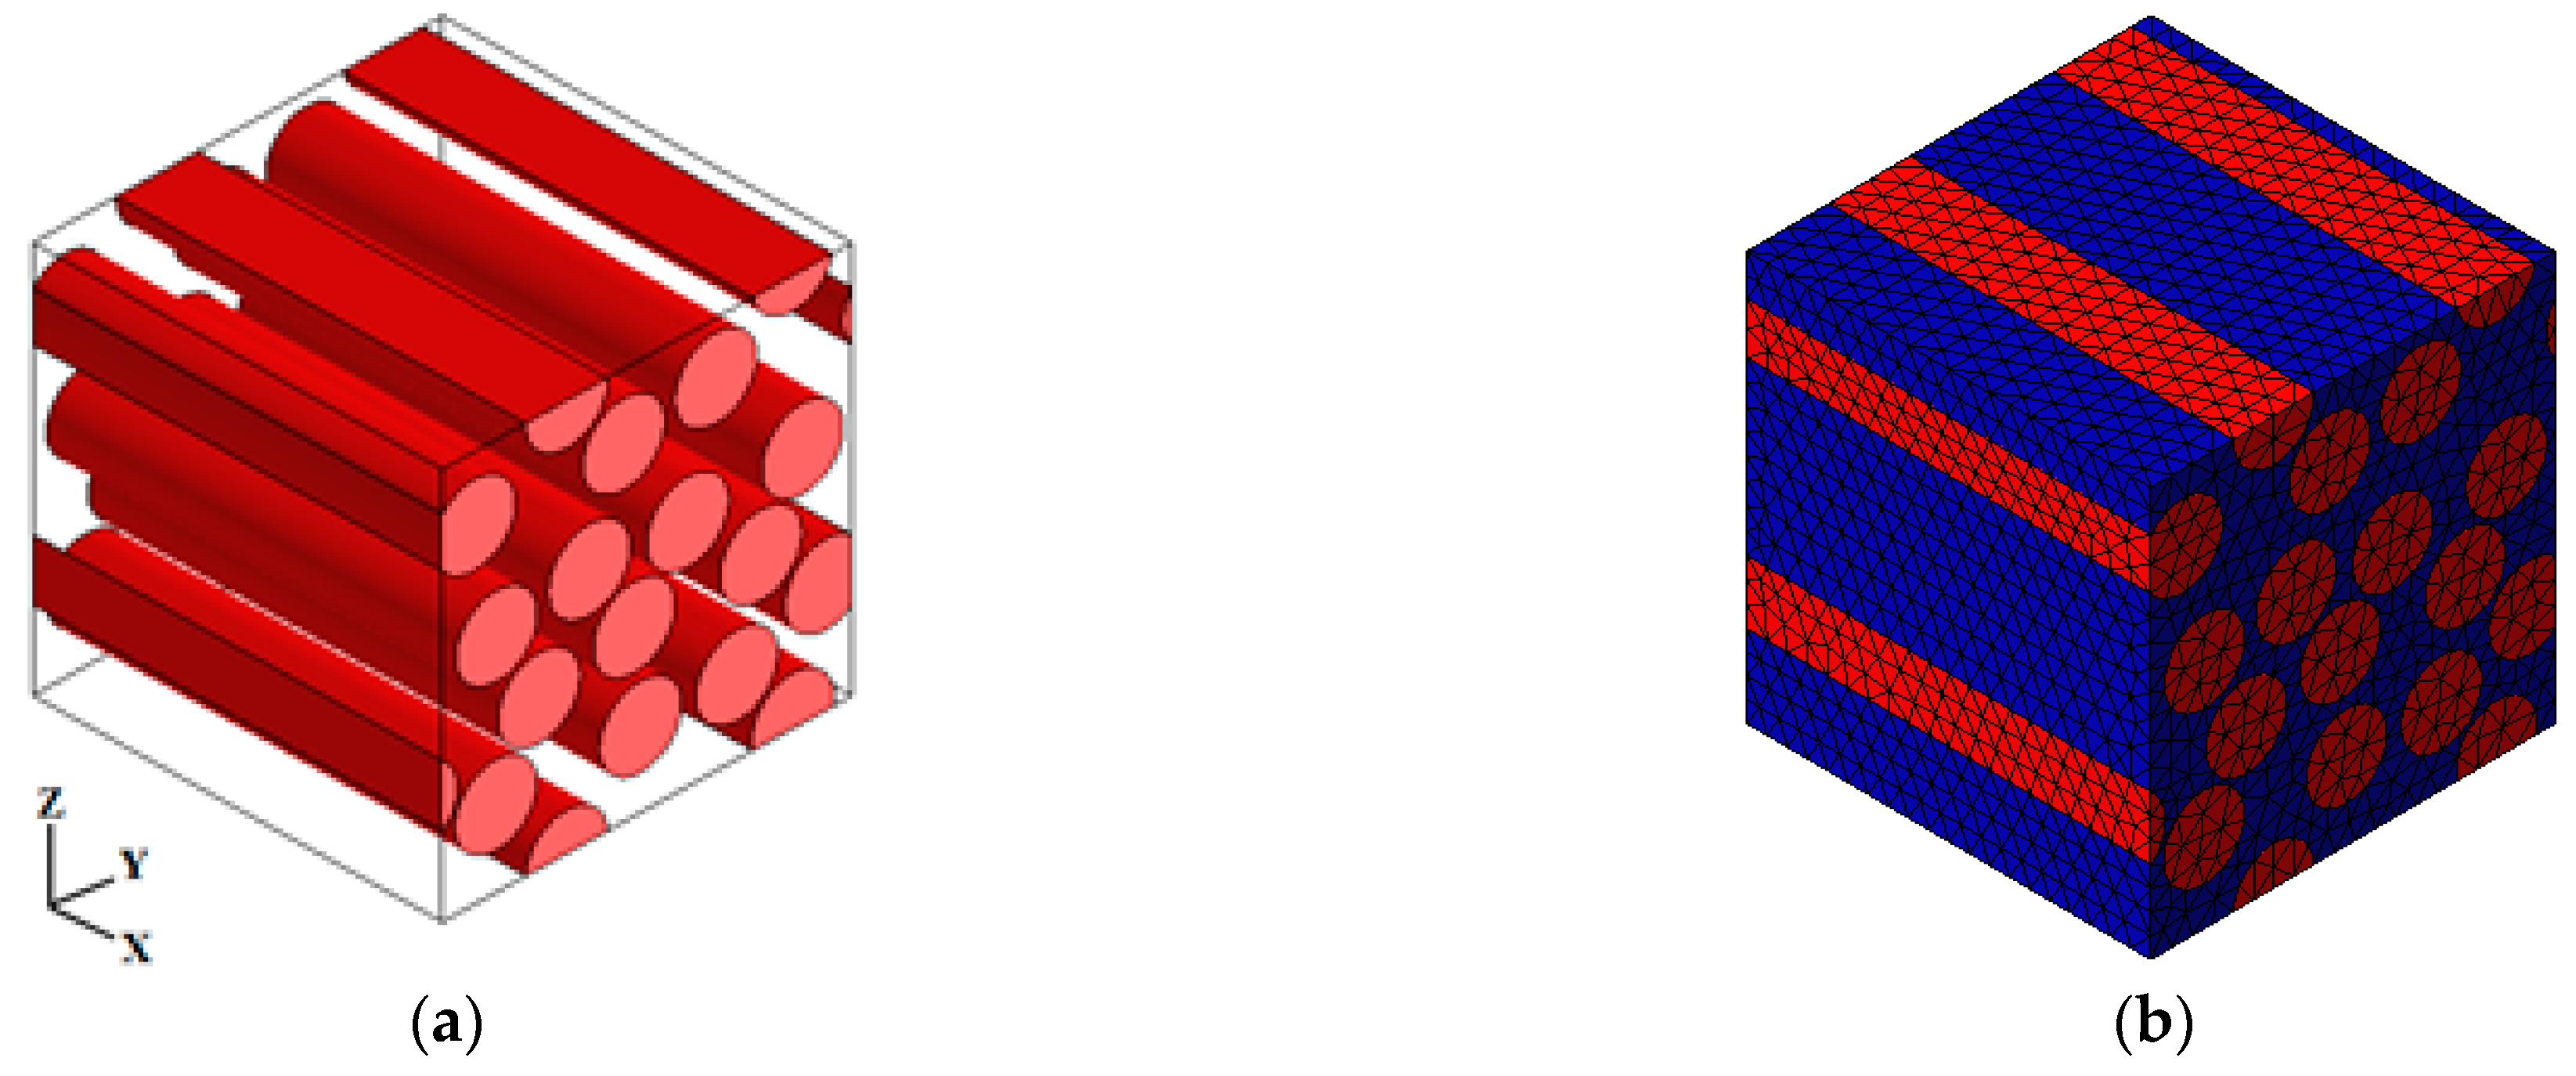
2.2.1. RVE Geometry

In this research, an RVE method was used to predict the overall properties of the reinforced polymers. The different microstructures were created using Digimat FE.; Digimat is a commercial code from e-Xstream Engineering that includes a number of micromechanics tools for both homogenization and dehomogenization. In our study, Digimat MF (semi-analytical approach) and Digimat FE (numerical approach) were used.
For the smooth running of the calculation, some assumptions are made:
-
The CNT inclusions are considered to have an ellipsoidal (prolate) shape. GNP inclusions are considered as disc-shaped spheroidal inclusions with aligned and random orientations.
-
The phases are considered as perfectly bounded.
The dimension of the representative volume element (RVE) is considered as (1, 1, 1) units, as seen in Figure 3, and for each one, a uniaxial loading strain test was performed to evaluate the elastic properties using the Mori–Tanaka homogenization scheme (Figure 1).

2.2.2. Materials Properties

The elastic parameters of CNT and GNP are taken from [27] and written in terms of Hill’s elastic moduli in Table 1.
Analogously, the engineering constants E 11 r ,   E 22 r ,   E 33 r , ν 12 r , ν 13 r ,   ν 23 r ,   G 12 r , G 13 r , G 23 r   are employed to define the elastic behavior of the equivalent continuum model from Equations (18)–(23). Then, the five transversely isotropic constants are calculated in Table 2.
E 11 r = 4 m r   k r n r l r 2 k r n r l r 2 + m r n r
E 33 r = E 22 r = n r l r 2 k r
ν 13 r = ν 12 r = l r 2 k r
ν 23 r = n r   k r m r l r 2 n r   k r + m r l r 2
G 13 r = G 12 r = p r
G 23 r = m r
The remaining engineering constants must be found through the following relations in Equation (23).
ν i j r E i r = ν j i r E j r ,   G i j r = G j i r   for   i ,   j = 1 ,   2 ,   3
The mechanical properties of polypropylene PP and unsaturated polyester UP polymers are described in Table 3 [1].
The mechanical properties used in Digimat MF are depicted in Table 4, by using 103 and 10−4 as aspect ratios for CNT and GNP, respectively.

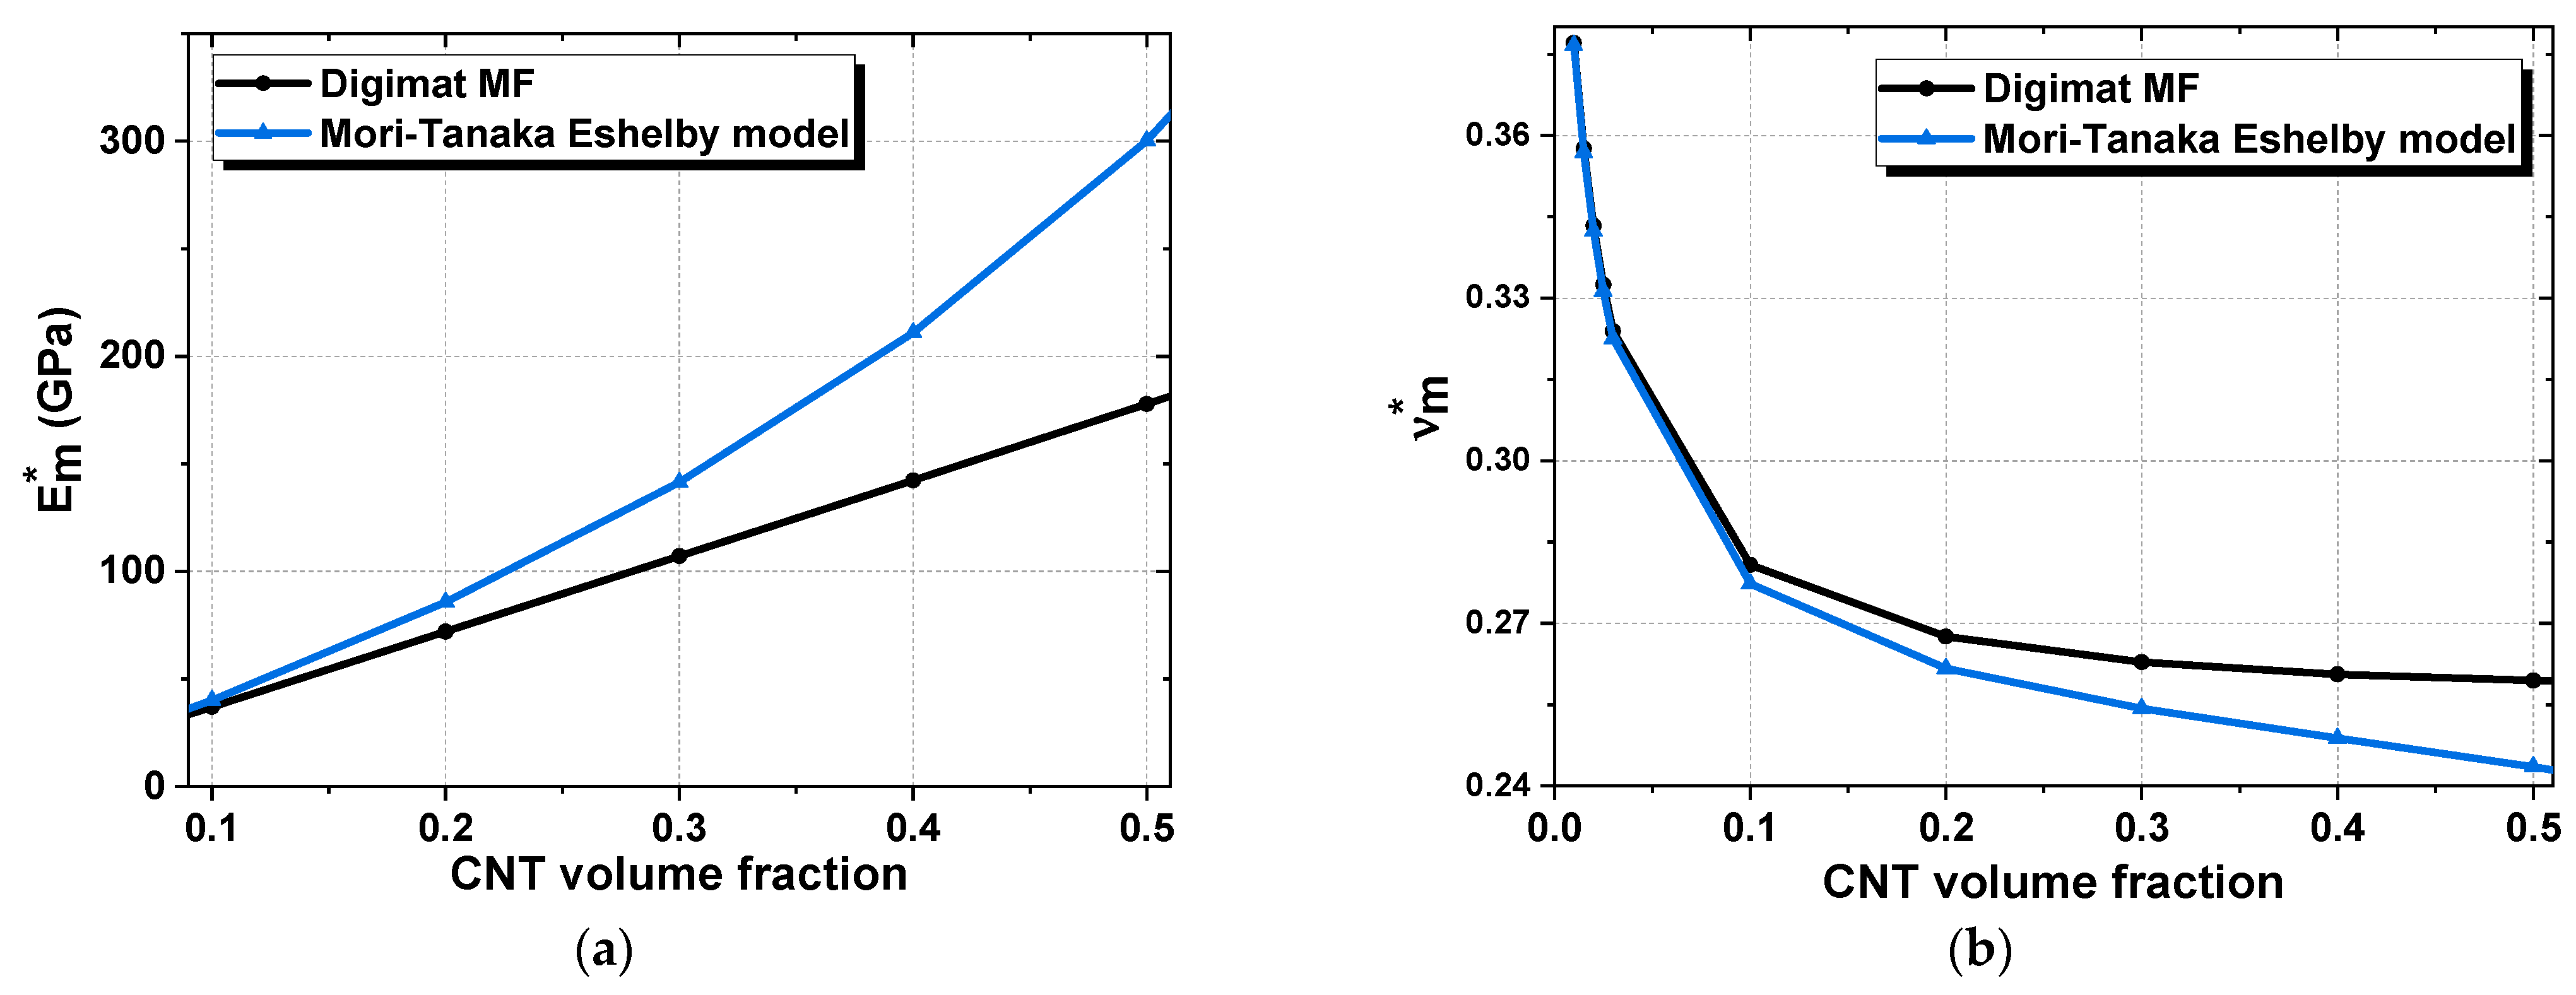
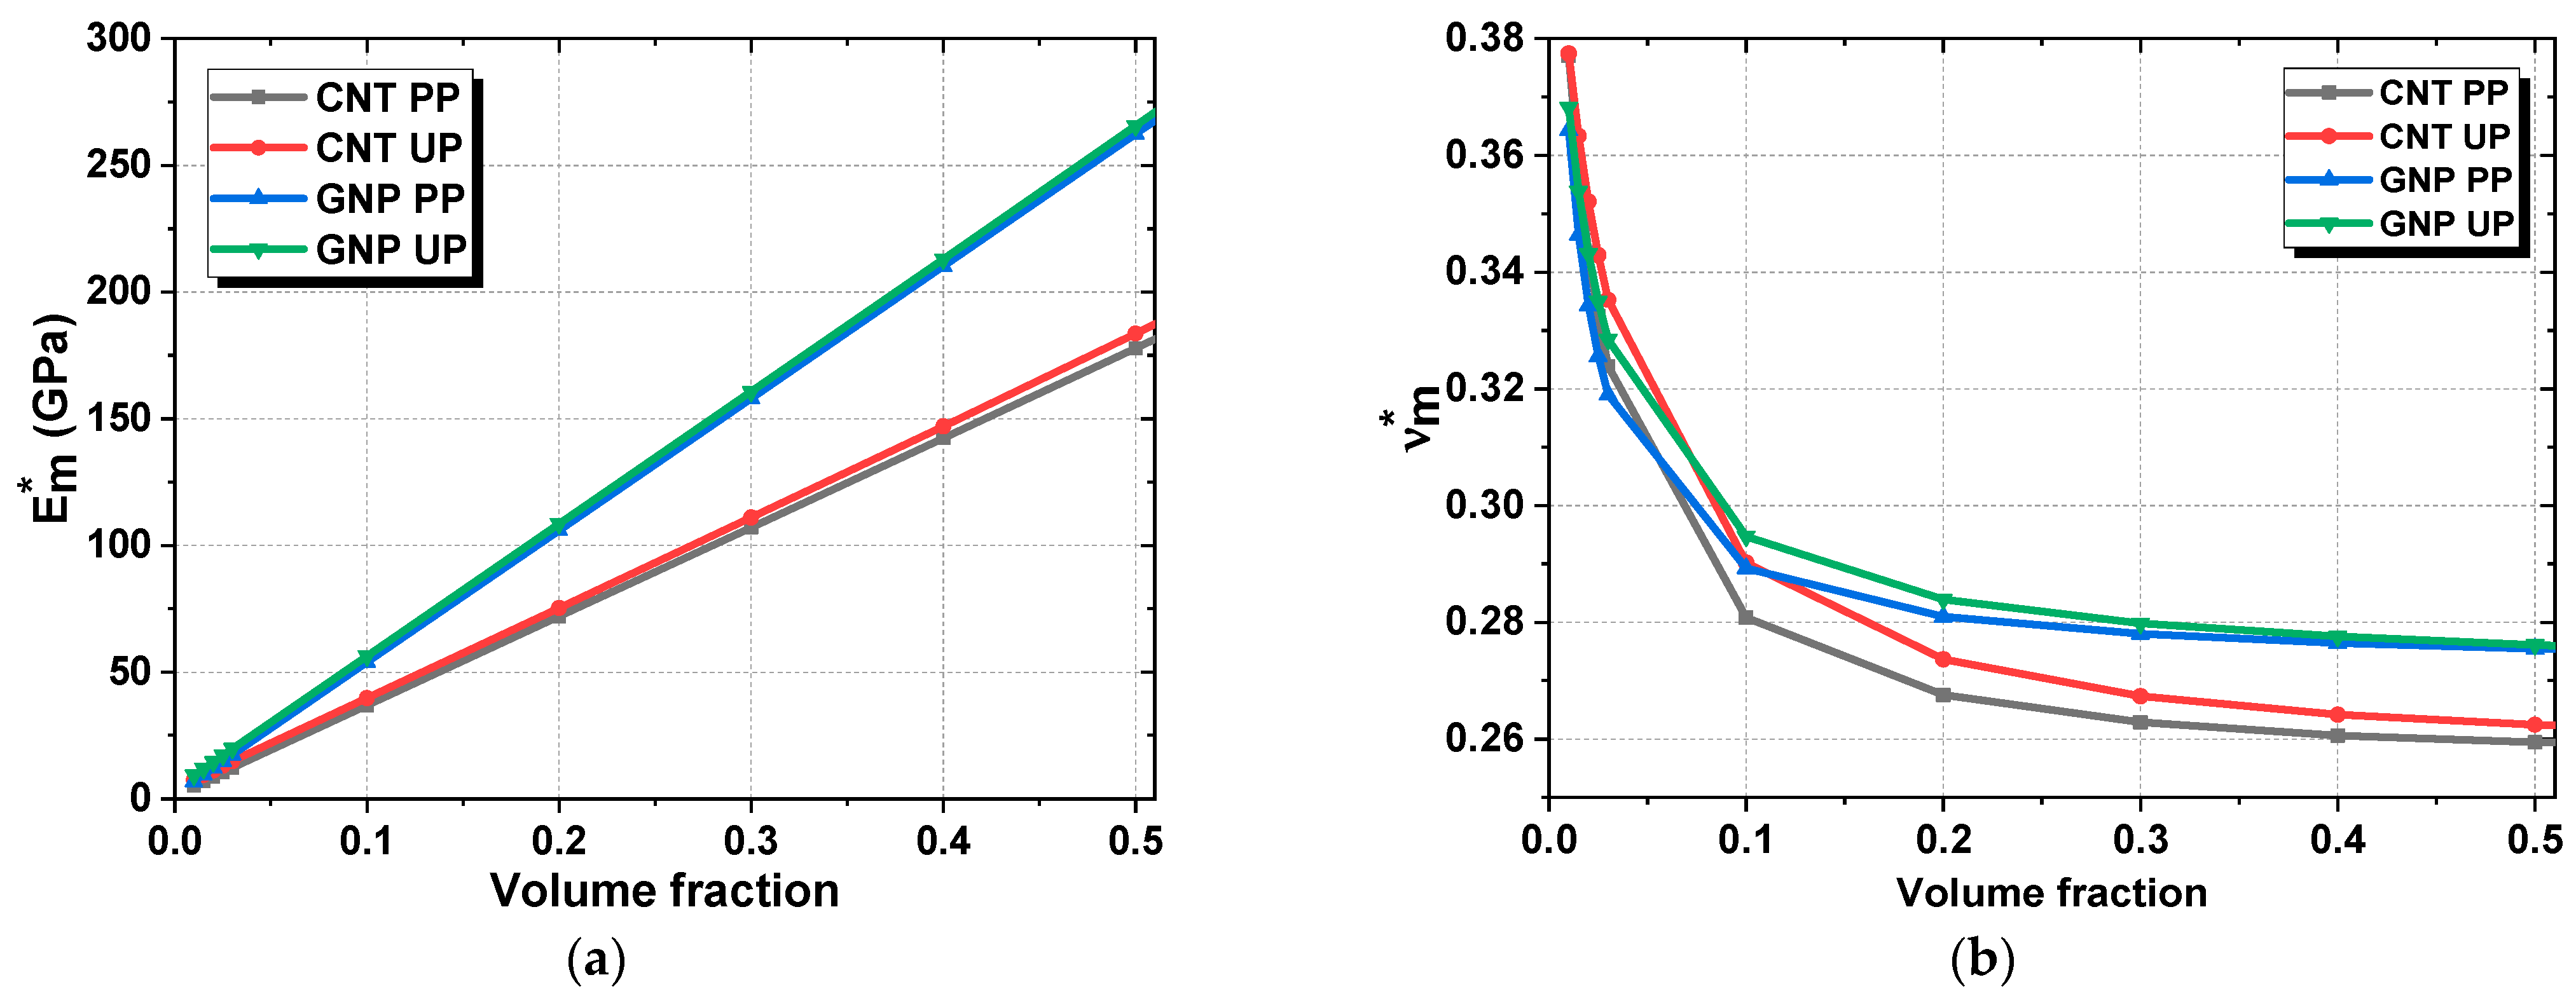
2.3. First Homogenization Results

The elastic moduli result of ( E m * , ν m * ) with Digimat MF and the Mori-Tanaka-Eshelby model were validated for CNT embedded in a PP polymer matrix in Figure 4a,b, to know the viability of the numerical model. Then, by just using the numerical results of Digimat MF, we compared the mechanical properties of CNT embedded in PP and UP, with GNP embedded in PP and UP as seen in Figure 5a,b.
As seen in Figure 4a, the two approaches show an acceptable agreement between the Mori–Tanaka scheme and Digimat MF. The computational tool offers accurate results with an error in the range of 1% for small volume fraction (≤10%), and as the volume fraction goes up, the error for the effective Young’s modulus reaches 36%, and for the Poisson’s ratio, 7%.
It is also apparent from the figures that increasing the volume fraction of the inclusions increases the effective Young’s modulus and decreases the Poisson’s ratio. The best properties were obtained from the GNP-UP mixture, which reached 260 GPa for the elastic modulus, and the lowest properties were obtained from the CNT-PP. The combination of any matrix with GNP offered better elastic properties because of their excellent mechanical properties, contrary to previous works where we usually find that the CNT inclusions offers better enhancement. These results can be explained by the non-validity of the isotropy assumptions of CNTs that can lead to an overestimation of the effective properties of the reinforced matrix [8].

3. Second Homogenization

3.1. Mathematical Model

3.1.1. Isotropic Fiber

The elastic properties of alfa and glass fibers are considered as isotropic, as described in Table 5.
a. 
Chamis approach
The method of Chamis [28] represents the most used homogenization technique, with five independent constants used to describe the mechanical behavior of the composite. The equations defining the elastic properties of a unidirectional lamina made of anisotropic fibers in an isotropic matrix are formulated by Equations (25)–(30). Alfa and e-glass fibers are considered as isotropic; the axial and in-plane Young’s and shear modulus are the same E 11 f = E 22 f ) and ( G 12 f = G 23 f ).
The relations shown below define the elastic properties of a unidirectional lamina made of anisotropic fibers in an isotropic matrix.
E 11 = E 1 f V f + E m * V m *
E 22 = E 33 = E m * 1 V f   1 E m * / E 2 f
G 23 = G m * 1 V f   1 G m * / G 23 f
G 12 = G 13 = G m * 1 V f   1 G m * / G 12 f
ν 23 = E 22 2 G 23 1
ν 12 = ν 13 = ν 12 f V f + ν m * V m *
It should be noted that the properties along the third direction coincide with the ones in the second direction due to the assumption of a transversely isotropic medium. Therefore, five independent constants are required to describe the mechanical behavior of the composite. Due to its simplicity, it is one of the most exploited homogenization techniques. It is easy to find many recent works in the literature where the term “rule of mixture” is introduced to define the current approach.
b. 
Hashin–Rosen model
The homogenization technique based on a variational method illustrated in the work by Hashin and Rosen [29] represents a simple approach to compute the mechanical properties of a unidirectional fiber-reinforced composite in which both the fibers and the matrix have isotropic features. As explained in the previous sections, this assumption is valid if the fibers are made of e-glass. On the contrary, this approach cannot be employed for carbon or Kevlar fibers since these kinds of reinforcing phases are transversely isotropic. The engineering constants for the current method assume the following aspect.
E 11 = E 1 f V f + E m * V m * + 4 V f V m *   ν f ν m * 2   V m * / k ¯ f + V f / k ¯ m * + 1 / G m *
E 22 = E 33 = 4   k ¯ t G t k ¯ t + G t   1 + 4 k ¯ t ν 12 2 / E 11
ν 23 = E 22 2 G t 1
ν 12 = ν 13 = ν f V f + ν m * V m * + V f V m * ν f ν m * 1 / k ¯ m * + 1 / k ¯ f V m * / k ¯ f + V f / k ¯ m * + 1 / G m *
G 23 = E 22 2 1 + ν 23
G 12 = G 13 = G m * V m * G m * + 1 + V f G f 1 V f G m * + V m * G f
where the following quantities are required
k ¯ f = E f 2 ( 1 ν f ν f 2
k ¯ m * = E m * 2 ( 1 ν m *   ν m * 2
k ¯ t = k ¯ m * k ¯ f + V f k ¯ f + V m * k ¯ m * G m * V m * k ¯ f + V f k ¯ m * + G m *
G t = G m * α + β m * V f   1 + ξ V f 3 3 V f V m * β m * 2 α V f 1 + ξ V f 3 3 V f V m * β m * 2
α = G t / G m * + β m * G t / G m * 1
β m * = 1 3 4 ν m *
β f = 1 3 ν f
ξ = β m * β f G f / G m * 1 + β f G f / G m *
For the sake of completeness, it should be noted that k ¯ f and k ¯ m * denote the plane strain bulk moduli for the fibers and the hybrid matrix, respectively.
c. 
Halpin–Tsai model
The Halpin–Tsai model equations have been used for a long time to predict the properties of composites reinforced with short fibers. These equations were originally developed for long-fiber composites [30]. For composites with aligned short fibers, the Halpin–Tsai model describes the modulus of elasticity as
P P m = 1 + ζ η V f 1 η V f
η = P f / P m 1 P f / P m + ζ
where P represents the property of the composite while P f   and P m are the corresponding fibers and matrix properties, which can be Young’s modulus E, Shear modulus G or Poisson’s ratio ν. Where V f denotes the fiber volume fraction and ζ is geometry parameter that depends on the geometry of the filler as follows:
  • ζ = 2 L/d for calculation of the longitudinal modulus.
  • ζ = 2 for calculation of the transversal modulus.

3.1.2. Transversely Isotropic Fiber

a. 
Hahn model
The homogenization technique proposed by Hahn in his work is used to obtain the mechanical properties of a fibrous composite made of fibers with a circular cross-section randomly distributed in a plane normal to the direction of the oriented fibers. As a consequence, the composite turns out to be macroscopically transversely isotropic and five independent elastic constants are needed to characterize it. The following quantities below are required
Δ 1 = 1 + G m * / G 12 f 2
Δ 2 = 3 4 ν m * + G m * / G 23 f 4 1 ν m *
Δ K = 1 + G m * / K f 2 1 ν m *
where K f is the bulk modulus of the reinforcing fibers defined as follows
K f = E 2 f 3   1 2 ν 23 f
The plane strain bulk modulus of the composite   K T can be now evaluated
K T = V f + Δ K V m * V f / K f + Δ K V m * / K m *
where K m *   is the bulk modulus of the hybrid matrix that assumes the following aspect
K m * = E m * 3   1 2 ν m *
First, the following elastic parameters are obtained
E 1 = E 1 f V f + E m * V m *
ν 12 = ν 13 = ν 12 f V f + ν m * V m *
G 12 = G 13 = V f + Δ 1 V m * V f / G 12 f + Δ 1 V m * / G m *
G 23 = V f + Δ 2 V m * V f / G 23 f + Δ 2 V m * / G m *
Once the five independent constants K T , E 1 , ν 12 = ν 13 , G 12 = G 13 , G 23 are evaluated, the remaining quantities can be computed as follows
E 2 = E 3 = 4 E 1 K T G 23 E 1 K T + G 23   E 1 + 4 K T ν 12 2
ν 23 = ν 12 f V f + ν m * V m * 1 + ν m * ν 12 E m * / E 1 1 + ν m * 2 + ν m * ν 12 E m * / E 1
It should be noted that relations (57) and (58) are equal to the corresponding formulas of the previous approach. The methodology proposed by Hahn belongs to the mechanics of material methods as well.
b. 
Halpin-Tsai model
The homogenization method, which takes its name from the works by Halpin and by Tsai [30], evaluates the mechanical properties of the three-phase multiscale composite by using the Hill’s elastic moduli and a semi-empirical approach. As far as the reinforcing fibers are concerned, the Hills’s elastic moduli takes the following form:
k f = E 2 f 2   1 ν 23 f 2 ν 21 f ν 12 f
l f = ν 12 f E 2 f 2   1 ν 23 f 2 ν 21 f ν 12 f = 2 ν 12 f k f
m f = E 2 f 2   1 + ν 23 f = 1 ν 23 f 2 ν 21 f ν 12 f 1 + ν 23 f k f
n f = E 1 f 1 ν 23 f 1 ν 23 f 2 ν 21 f ν 12 f = 2   1 ν 23 f E 1 f E 2 f k f
p r = G 12 f
where k f , l f , m f , n f , p f denote the properties of the fibers in terms of Hill’s moduli. On the other hand, if the isotropic hybrid matrix is considered, one obtains
In which k m * , l m * , m m * , n m * , p m *   are the Hill’s moduli of the hybrid matrix. The overall mechanical properties of the composite in terms of the Hill’s moduli can be now evaluated
k = k m * k f + m m * V m * + k f k m * + m m * V f k f + m m * V m * + k m * + m m * V f
l = V f l f + V m * l m * + l f l m * k f k m *   k V f k f V m * k m *
m = m m * 2 V f m f k m * + m m * + 2 V m * m f m m * + V m * k m * m f + m m * 2 V f m m * k m * + m m * + 2 V m * m f m m * + V m * k m * m f + m m *
n = V f n f + V m * n m * + l f l m * k f k m * 2   k V f k f V m * k m *
p = p f + p m * p m * V m * + 2 p f p m * V f p f + p m * V m * + 2 p m * V f
Finally, the engineering constants of the composite are found
E 1 = n l 2 k
E 2 = E 3 = 4 m   k n l 2 k n l 2 + m n
ν 12 = ν 13 = l 2 k
ν 23 = n   k m l 2 n   k + m l 2
G 12 = G 13 = p
G 23 = m
It should be noticed that expressions (69)–(74) coincide with the definitions shown in Equations (18)–(23) for the CNT-equivalent continuum model.

3.2. Numerical Model

The second homogenization of reinforced matrix and fiber was performed by using Digimat FE (see Figure 6). The RVE size was automatically defined, and by applying a uniaxial loading, the transversely isotropic properties were computed. The diameter of the alfa fiber is 95 µm. At this point, this reinforced matrix can be combined with the reinforcing fibers to obtain the desired three-phase multiscale composite.

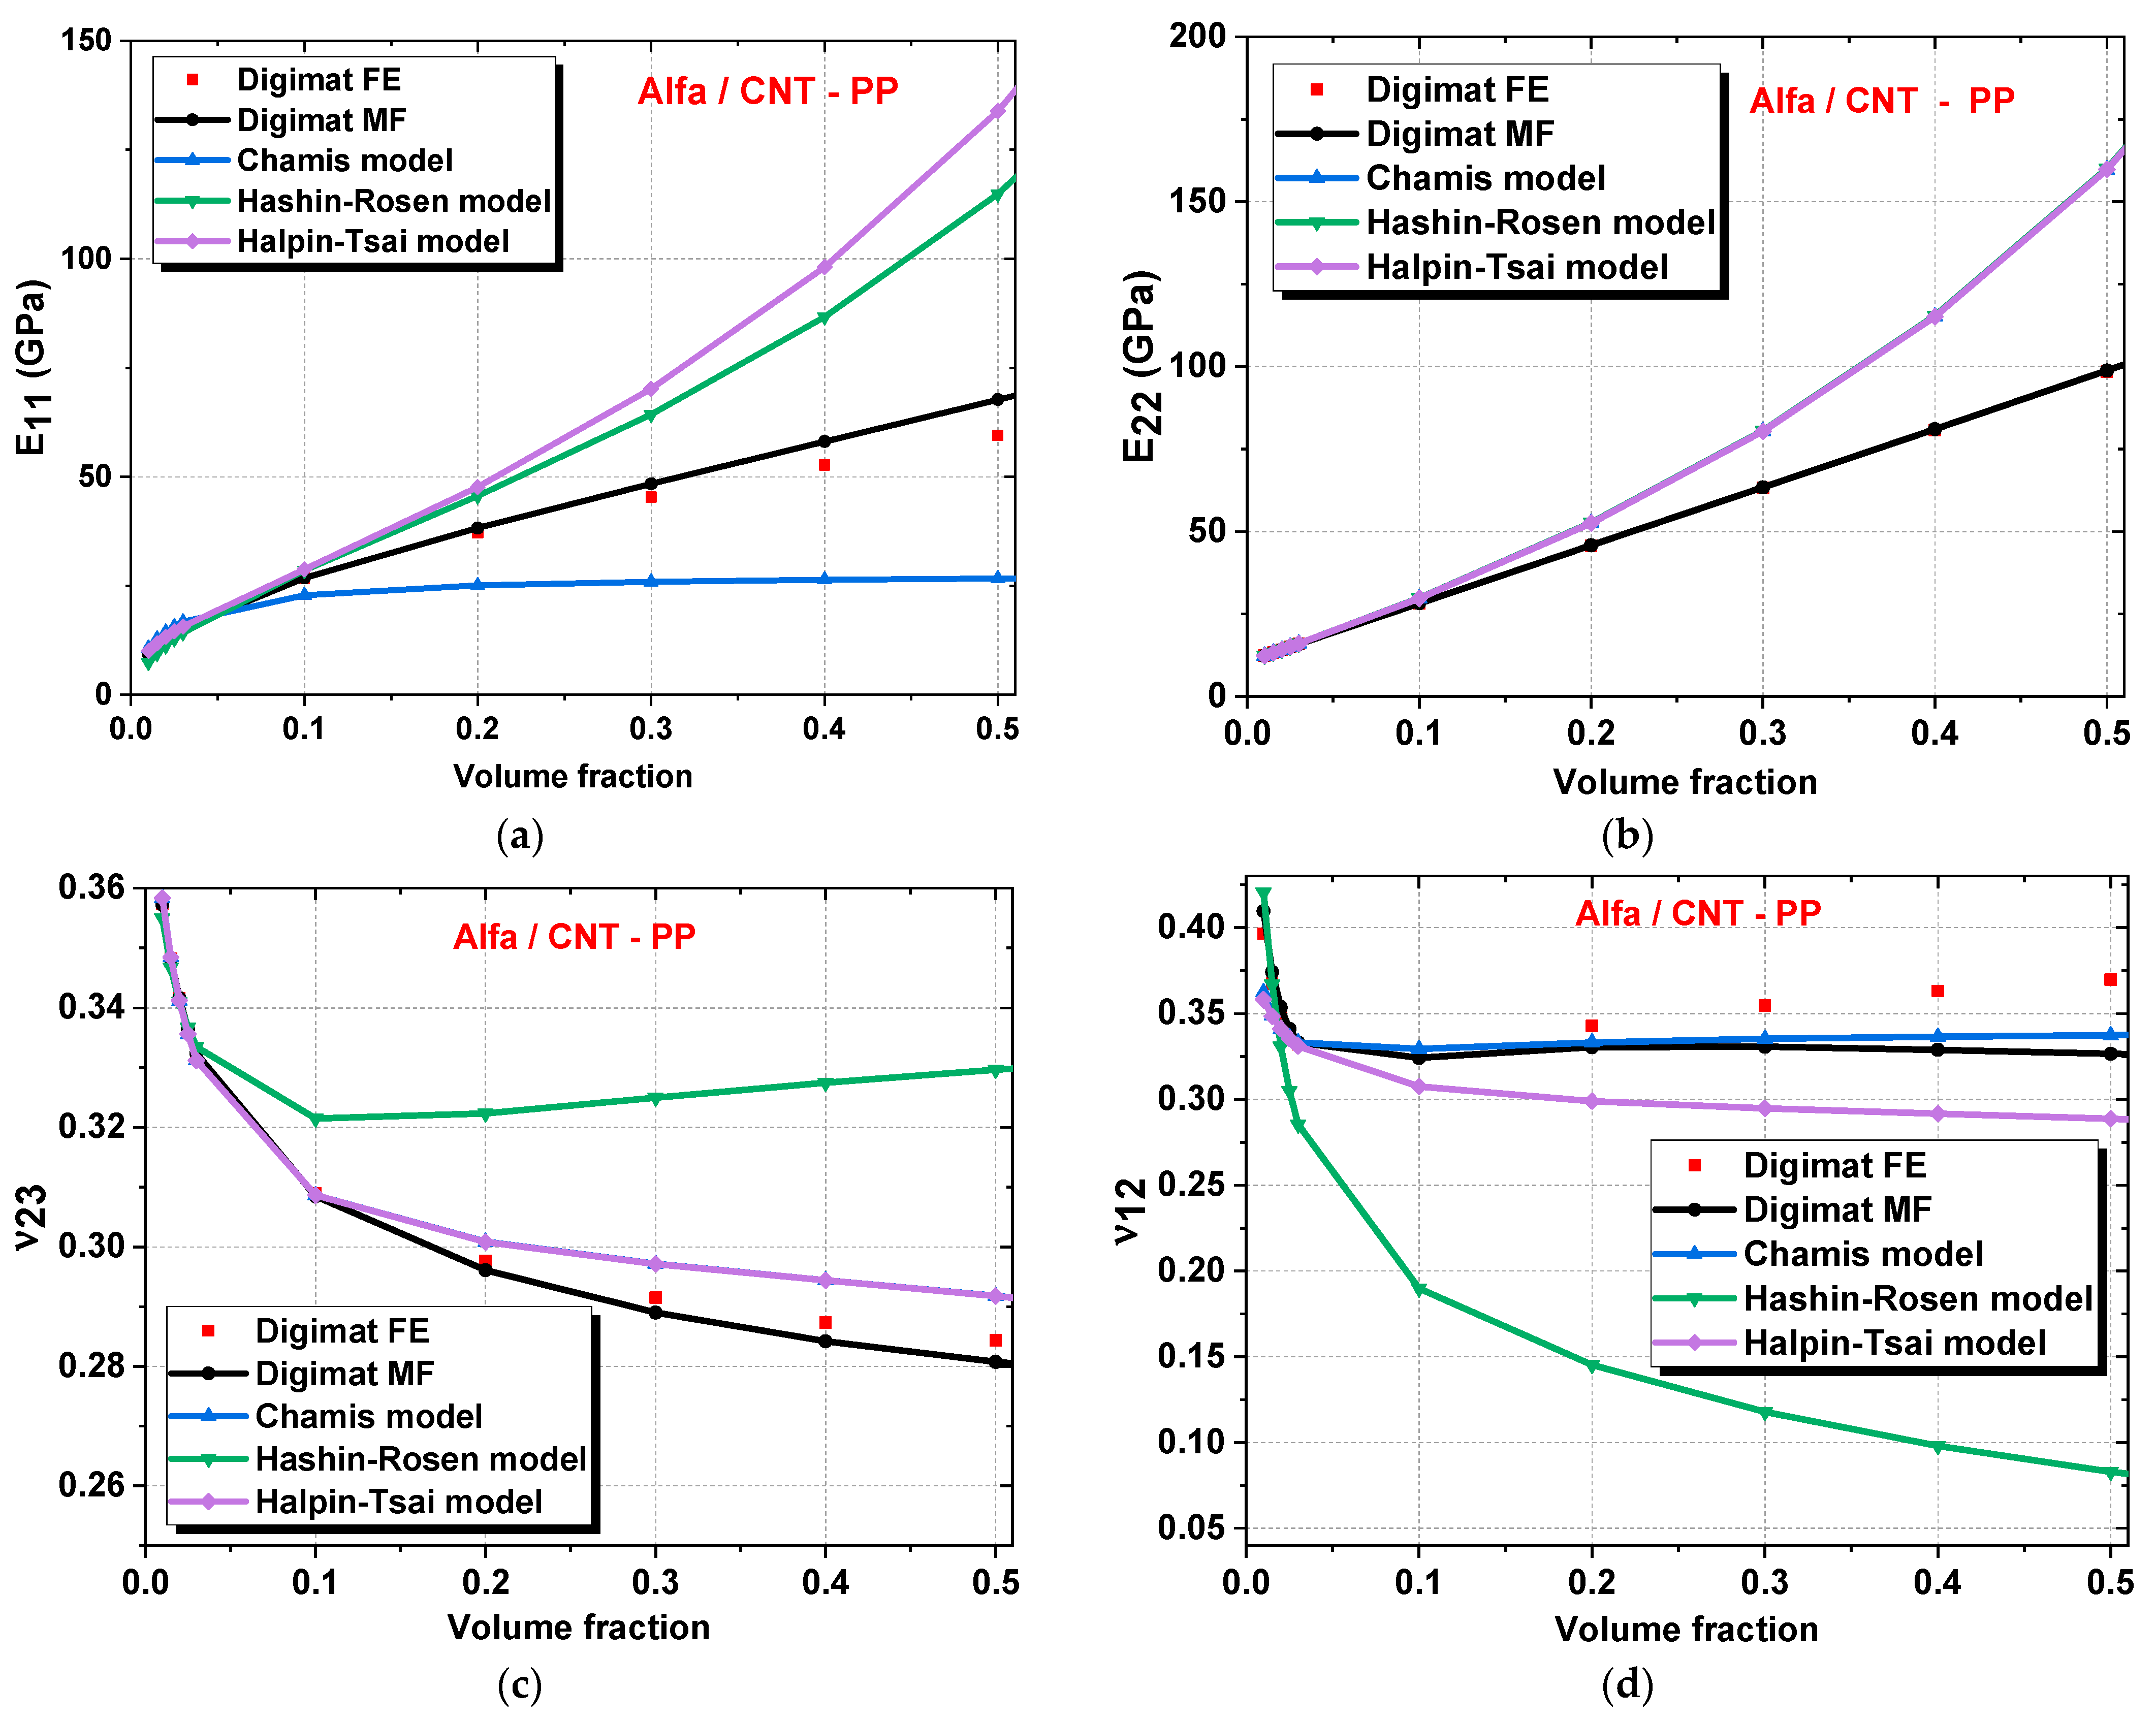
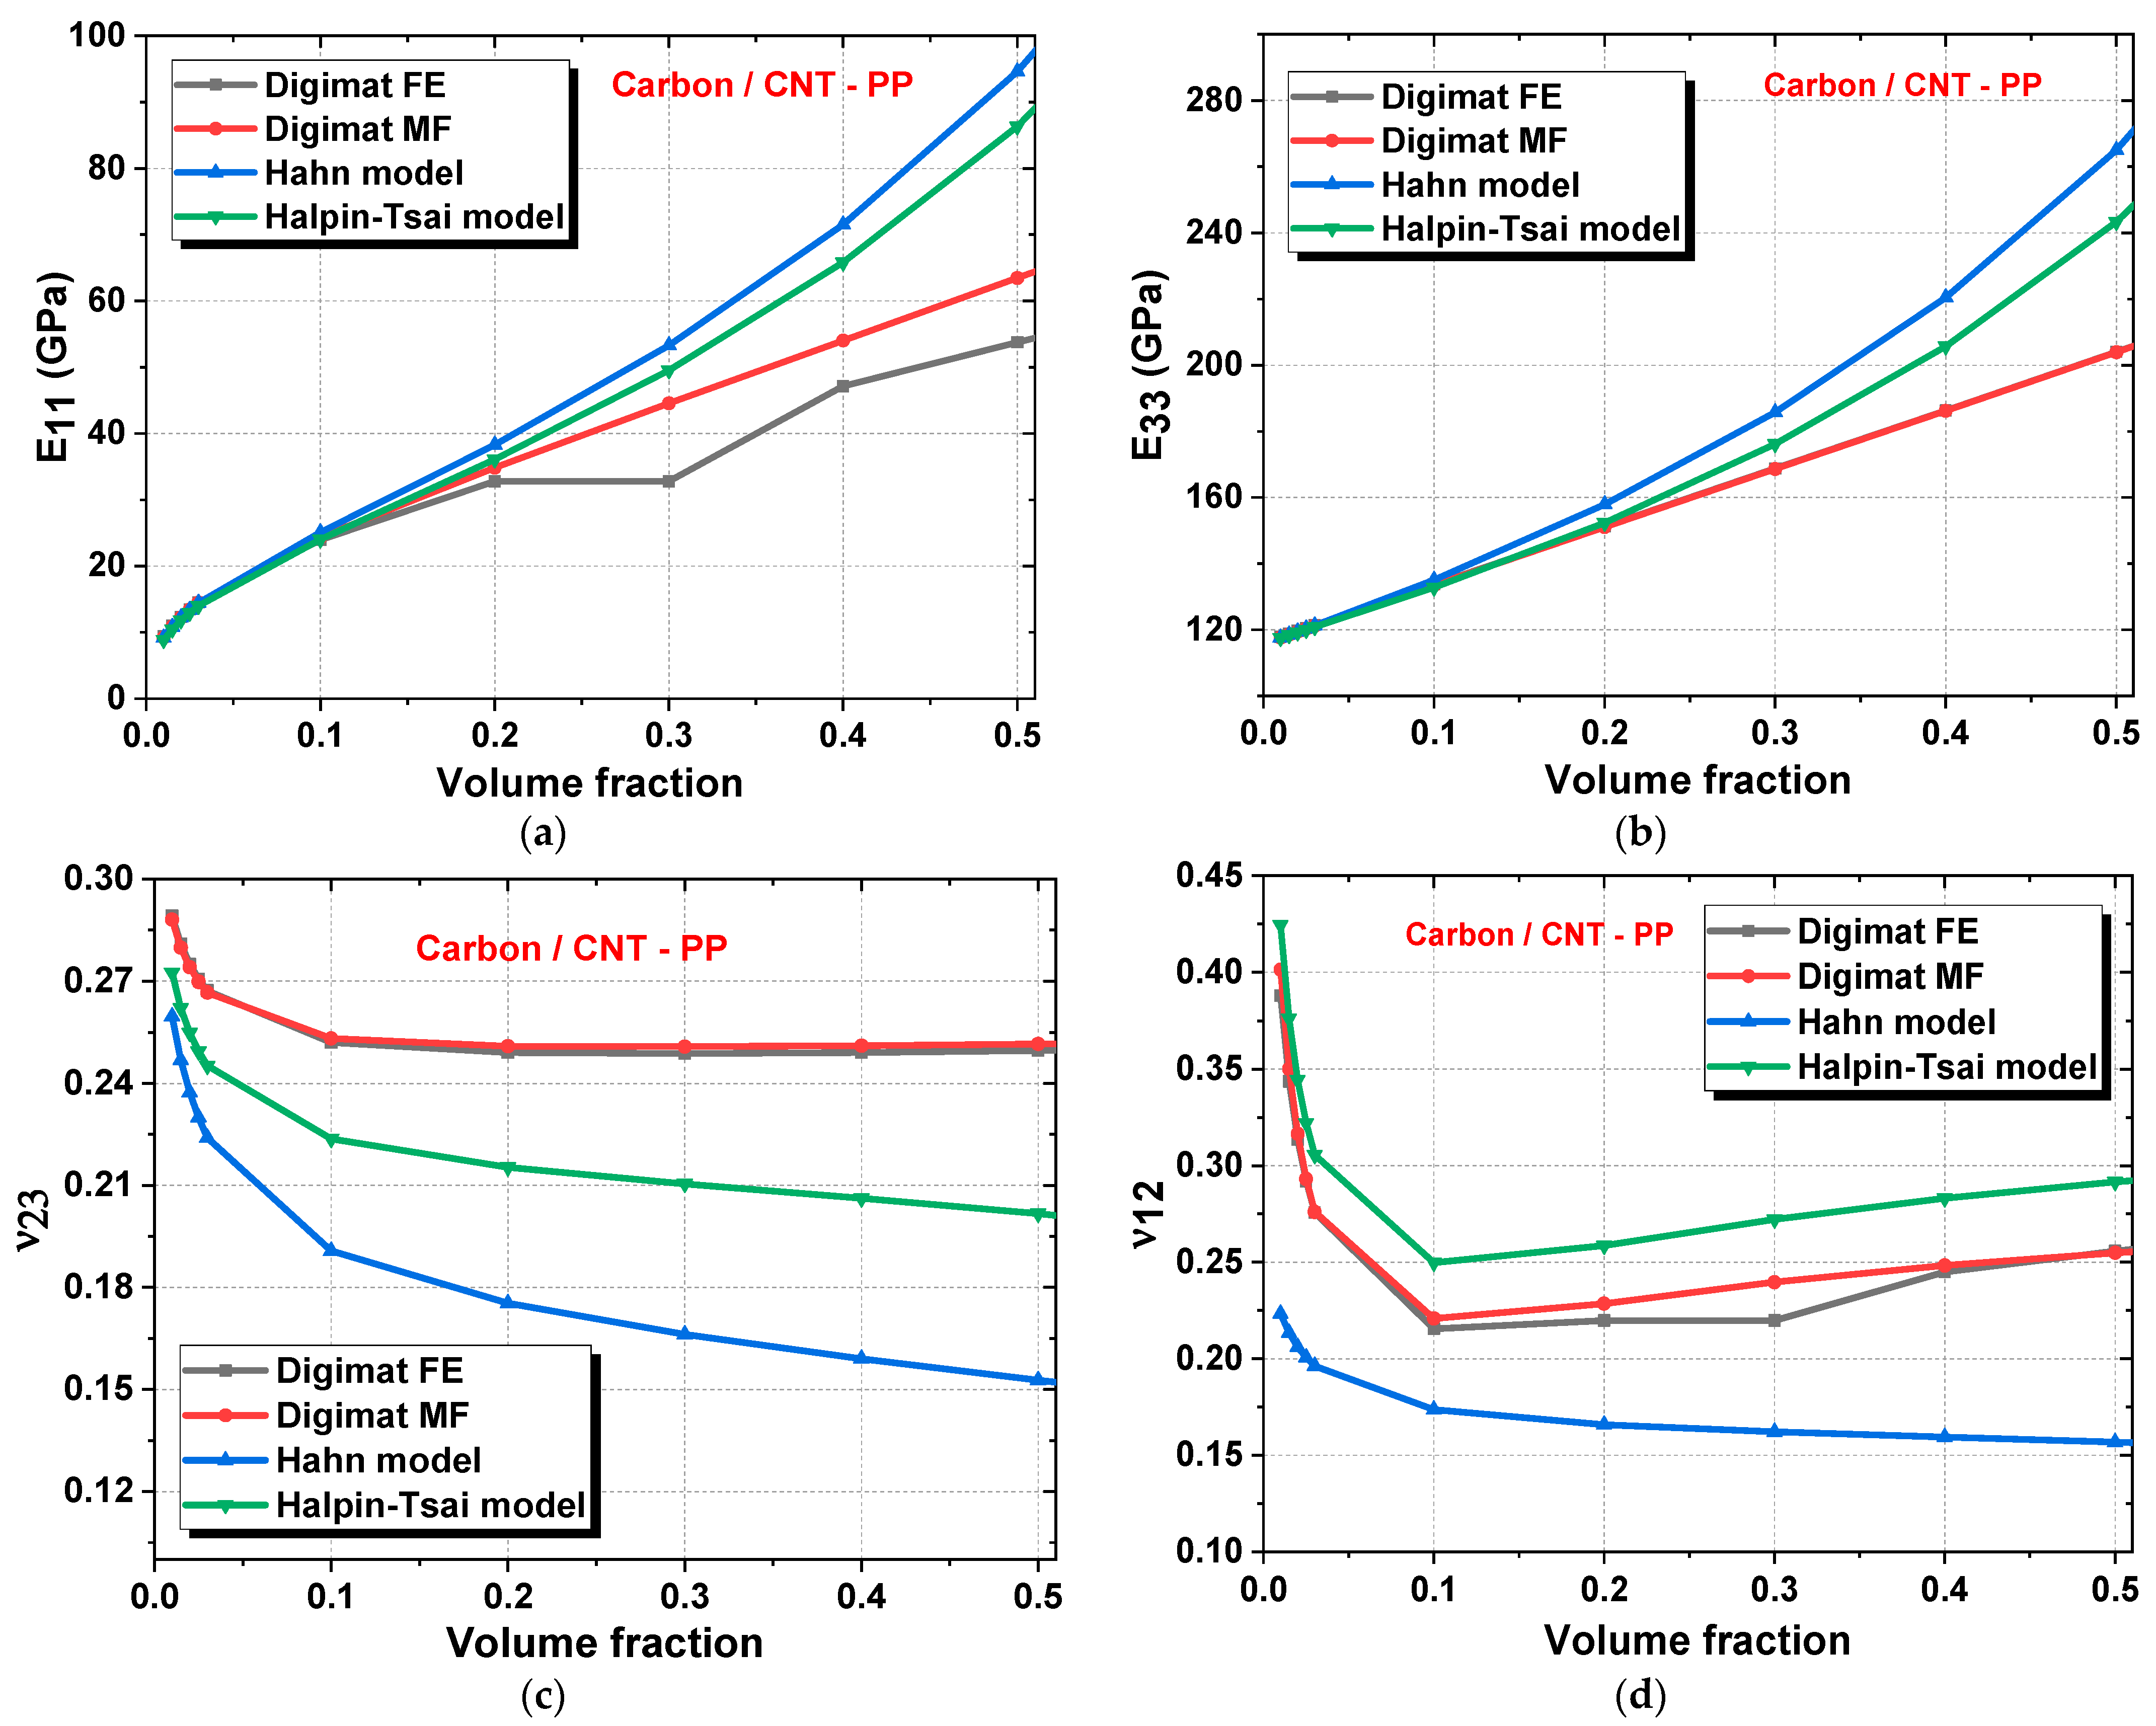
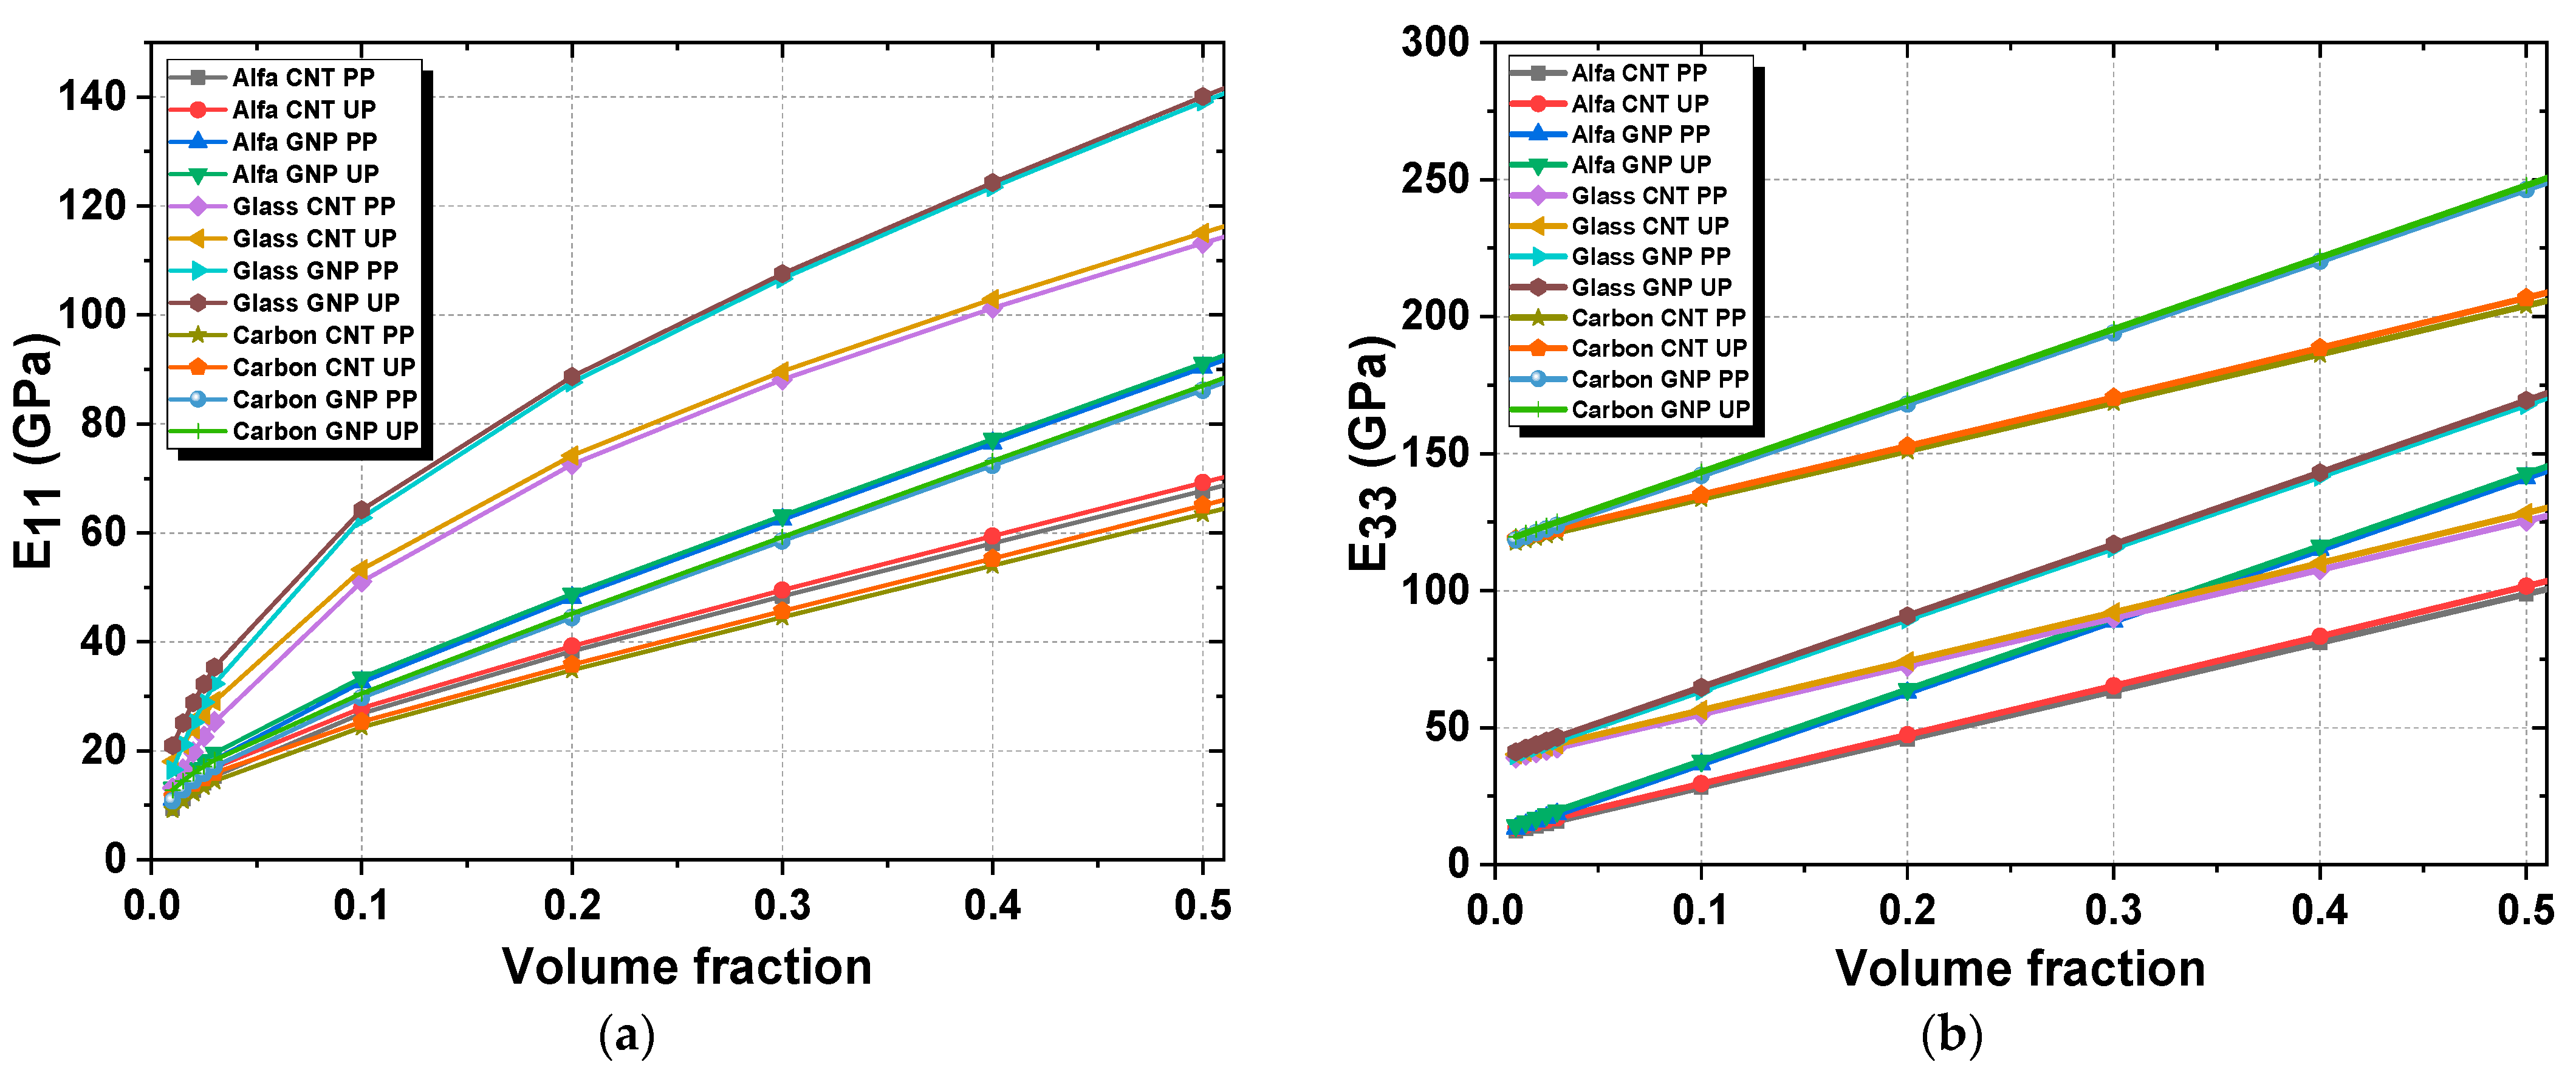
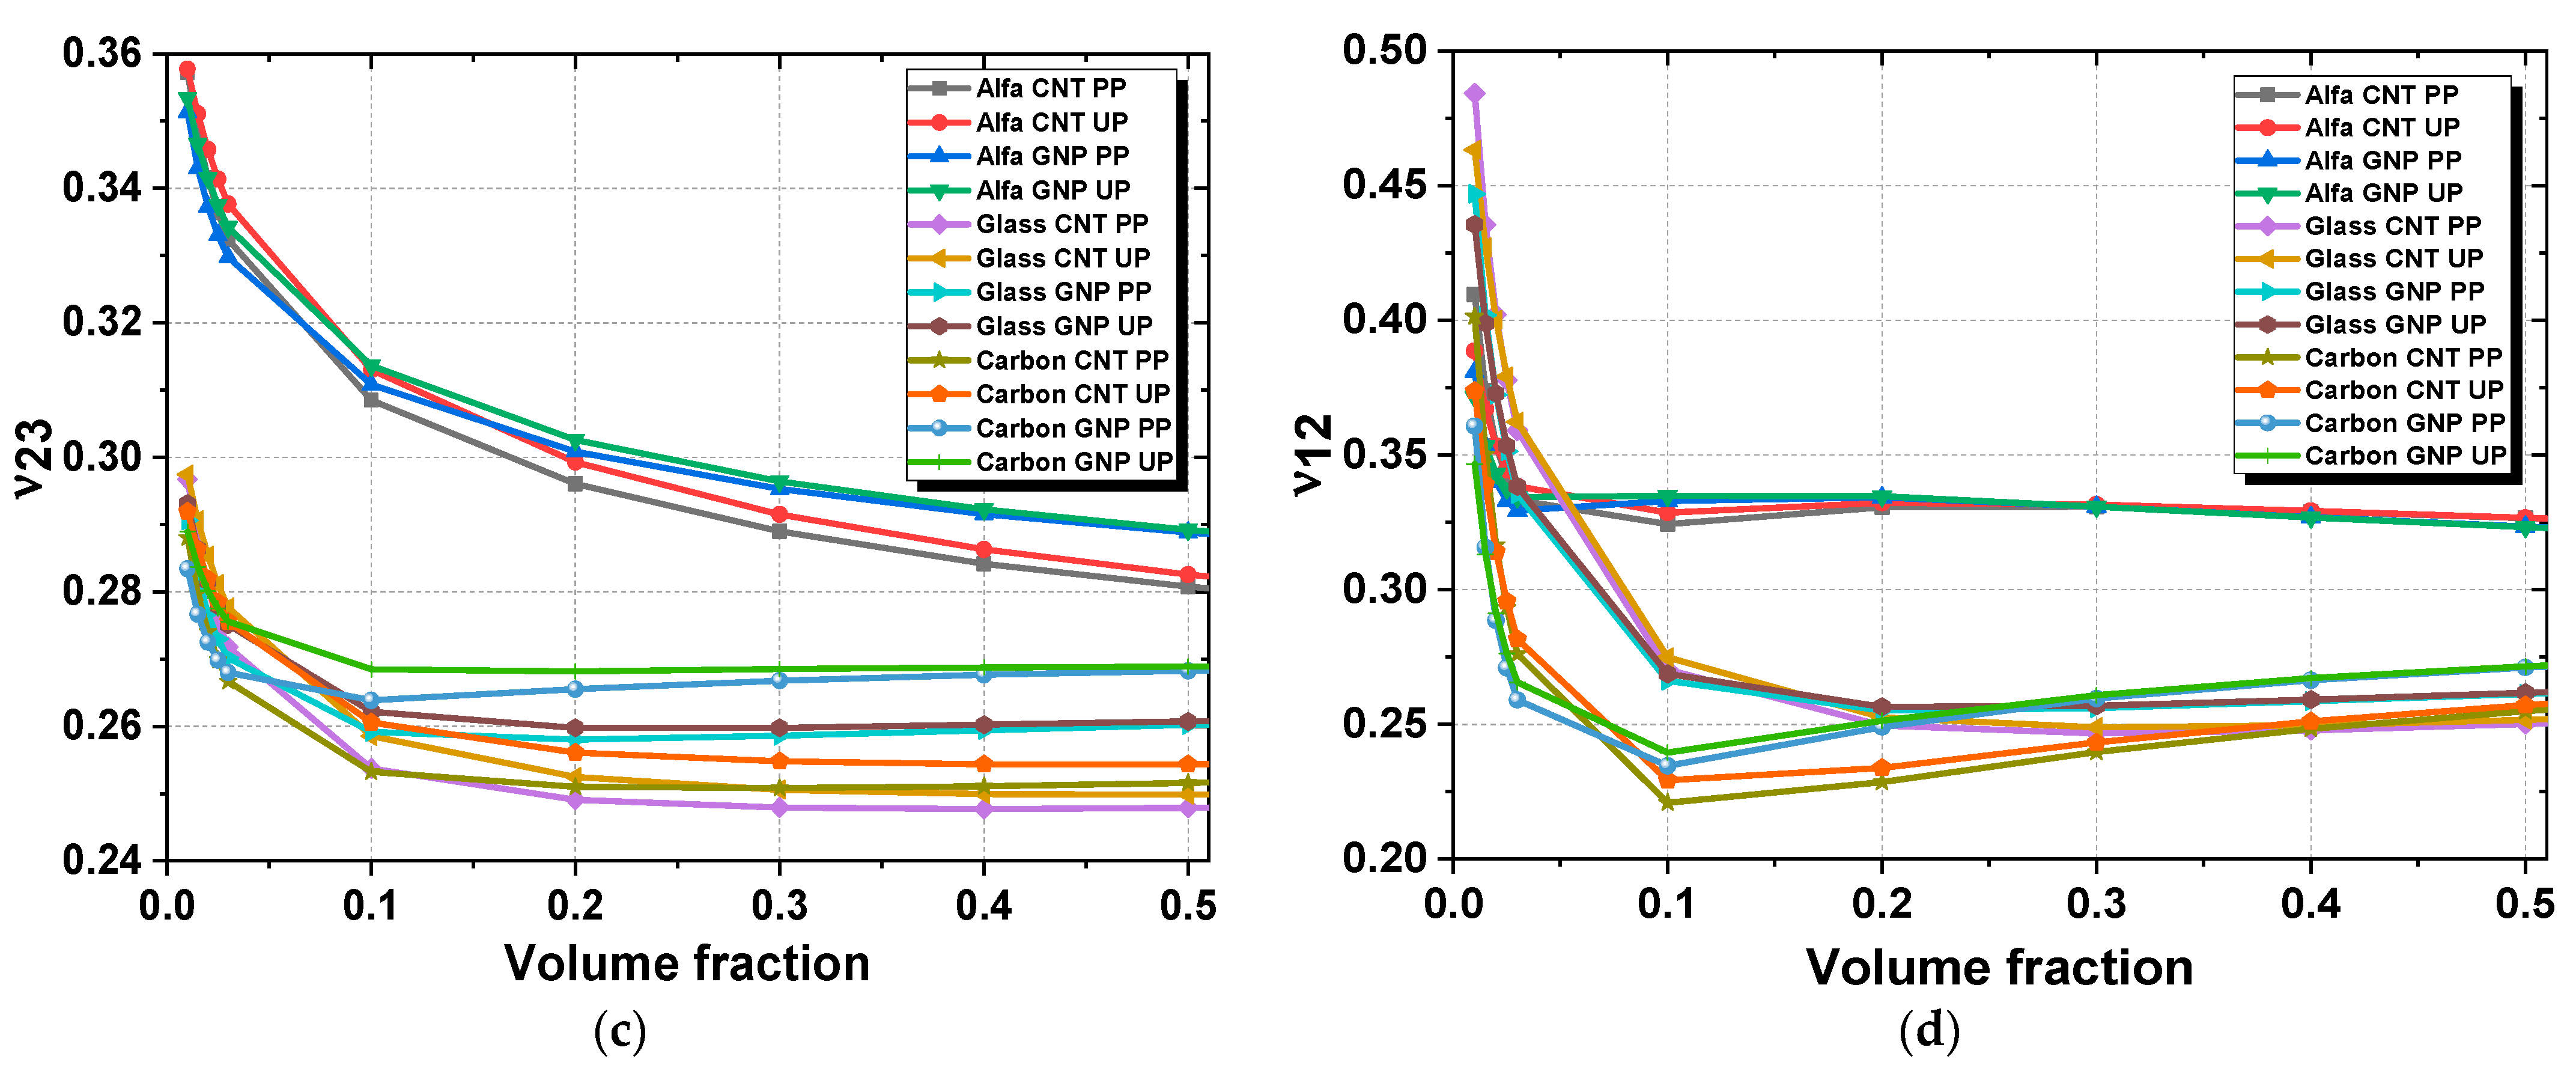
3.3. Second Homogenization Results

To evaluate the validity of the approaches used in this study, we tried to compare results from the analytical methods (Chamis, Hashin–Rosen, Halpin–Tsai for isotropic alfa and e-glass fibers and Hahn and Halpin–Tsai for transversely isotropic carbon fibers) and the numerical methods using Digimat MF and FE. In Figure 7 and Figure 8, a comparison between the approaches was illustrated. The use of different micromechanics approaches provides in some cases different results, so it is important to discuss these variations. It can be observed for all the elastic parameters that all the approaches show an excellent agreement for small volume fractions. However, the more the amount of the nanofillers is increased, the more differences are observed. In particular, the axial Young’s modulus is underestimated when the Chamis approach is employed. Contrarywise, when evaluating the transverse Young’s modulus, it is observed that this property is underestimated by the numerical methods and the various analytical approaches give similar and higher values, thus two curve groups can be noticed, the first group curve is composed of analytical approaches and is above the second group by 30%.
The longitudinal Young’s modulus increases as a function of CNT and GNP volume fraction-reinforced alfa and glass fibers with PP and UP polymers. The glass-reinforced matrix has a longitudinal Young’s modulus greater than the alfa-reinforced matrix, especially for UP polymer (Figure 9a). Alfa fiber-reinforced polymer has maximum values of longitudinal Young’s modulus in the order of 70 GPa, 68 GPa, 64 GPa and 62 GPa for CNT-UP, GNP-UP, CNT-PP and GNP-PP, respectively. Concerning the glass fiber-reinforced polymer, the longitudinal Young’s modulus has maximum values in the order of 140 GPa, 138 GPa, 112 GPa and 110 GPa for CNT-UP, GNP-UP, CNT-PP and GNP-PP, respectively. Enhanced elastic properties were observed for the CNT-UP effective matrix and the worst were observed for GNP-PP. In addition, the transversal Young’s modulus was lower than the longitudinal Young’s modulus (Figure 9b). The alfa-reinforced composite has a higher transverse Poisson’s ratio ν12 than the glass-reinforced composite (Figure 9c). The in-plane Poisson’s ratio ν23 of the glass-reinforced composite decreased for all volume fractions, while that of the alfa-reinforced composite decreased until 30% and then remained constant for the UP matrix (Figure 9d). It was concluded that CNT inclusion and glass fibers have a greater effect than GNP inclusion and alfa fibers on the mechanical performance of the biocomposite. When the volume fraction of CNT and GNP inclusions is large, their mechanical properties dominate over those of the alfa and glass fibers. Due to their high elastic properties, UP polymer, CNT inclusion and glass fiber can improve the composite properties more than PP polymer, GNP inclusion and alfa fibers. GNPs have a higher Young’s modulus than CNTs, but because of their plate shape, the composite does not have increased mechanical stiffness. Focusing on the alfa fiber, for the polymer, E11 of alfa CNT-UP has a higher value than alfa CNT-PP by 23%. For inclusion, alfa CNT-UP has an E11 value greater than alfa GNP-UP by 17.01%. In the same way, the longitudinal Young’s modulus of glass CNT-UP is 45% greater than alfa CNT-UP. The same observations were found for the other elastic properties of transversal Young’s modulus, out-of-plane Poisson’s ratio, and in-plane Poisson’s ratio. It was observed that in the three phases of the biocomposite, CNT and GNP inclusions dominated the mechanical properties at high volume fractions.

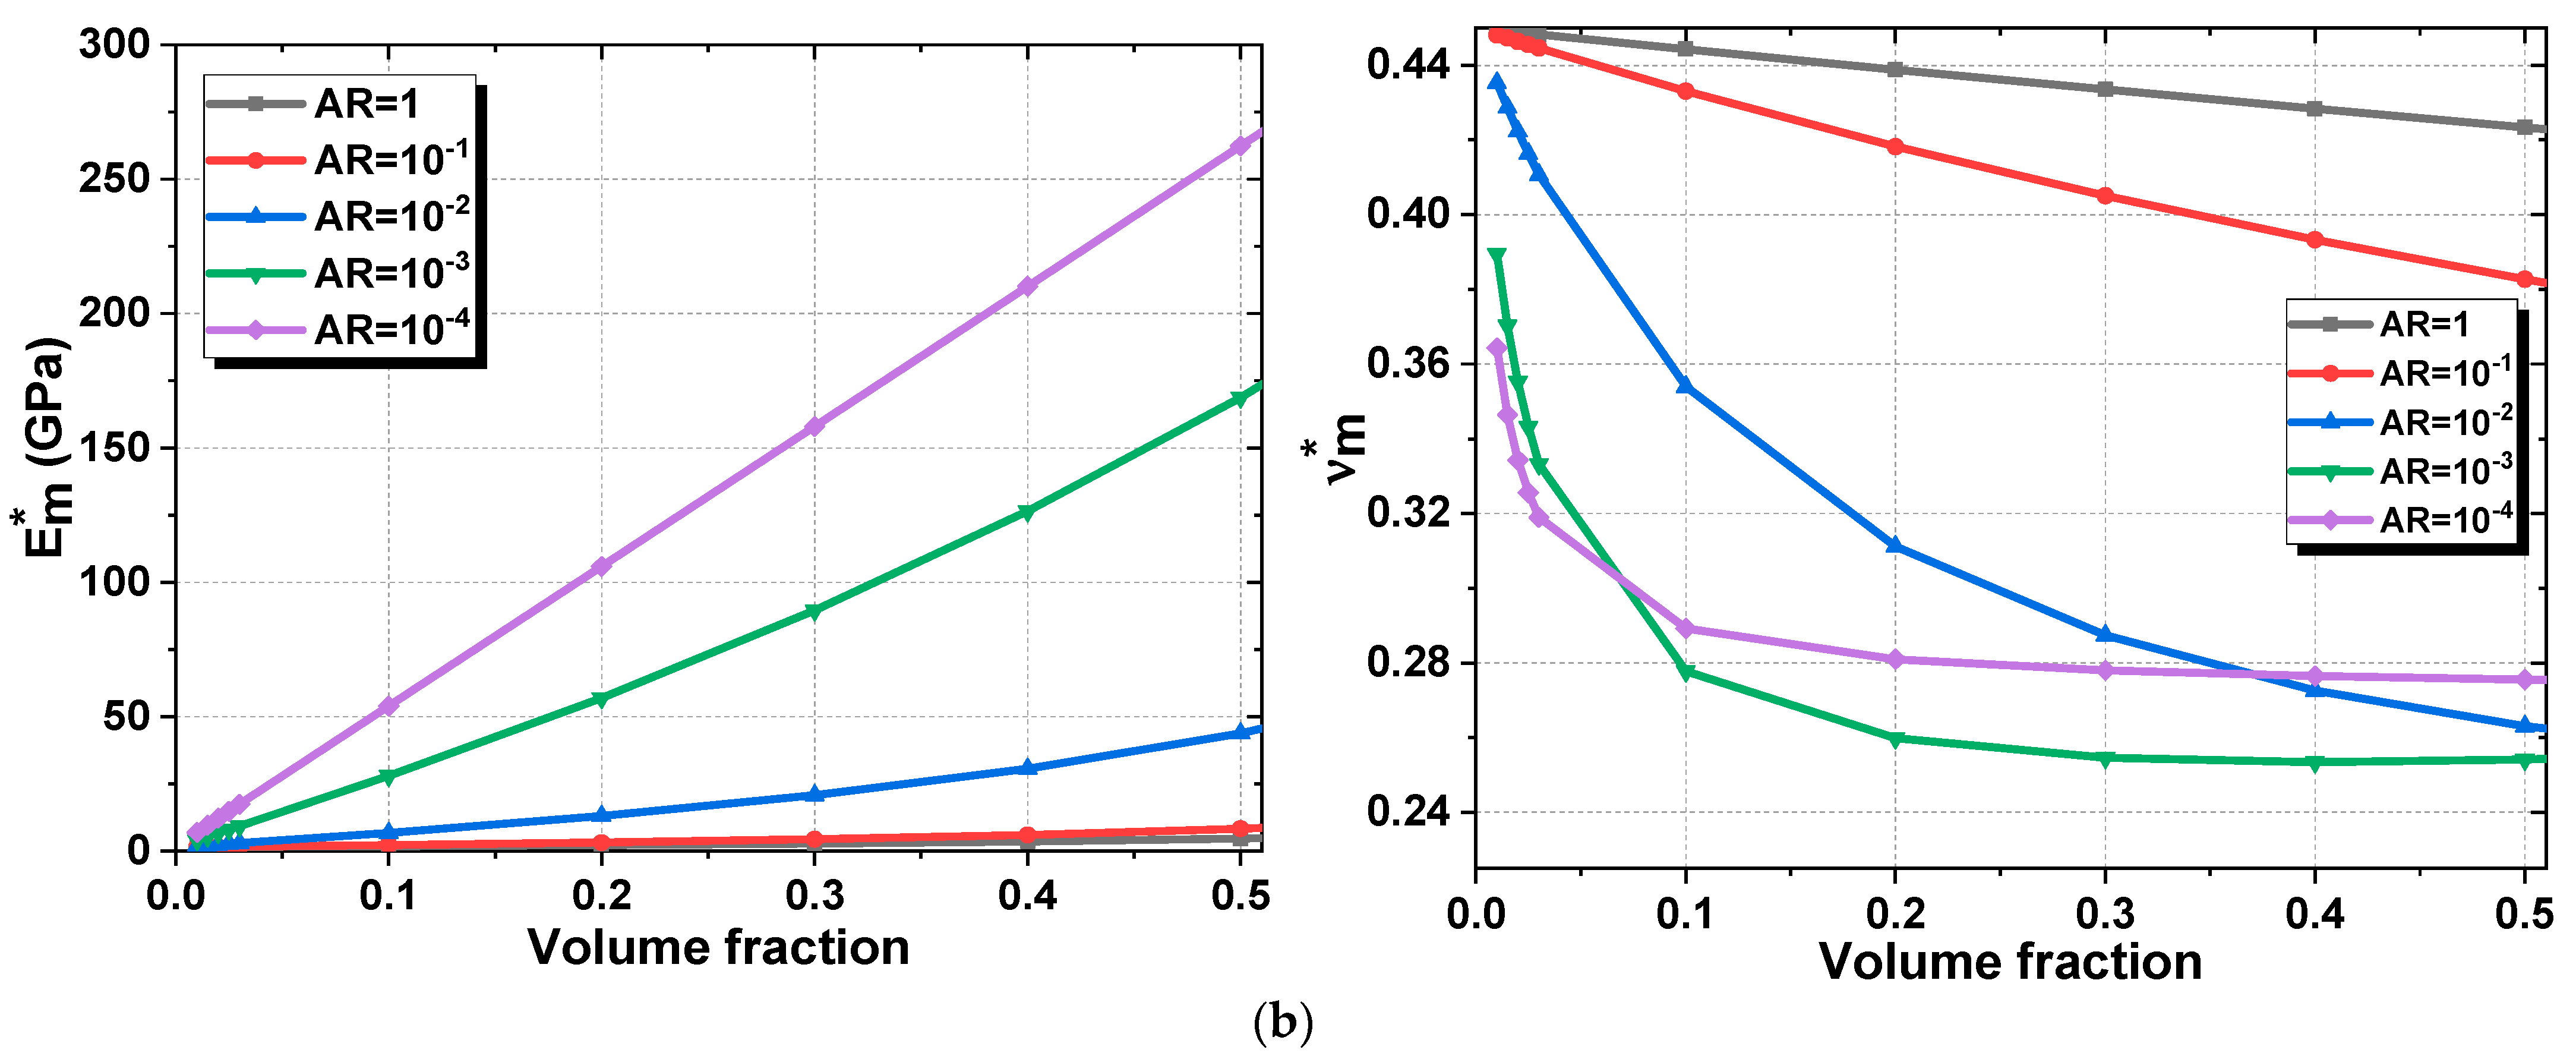
4. Effect of Aspect Ratio on the Mechanical Properties

To investigate the geometry effect of the inclusions, we studied the effect of the aspect ratio on the elastic properties of the reinforced matrix. These results were calculated using the Digimat MF tool, considering the aspect ratio of CNTs to vary between 50 and 1000, and of GNP to vary between 1 and 10−4.
For CNT inclusions (Figure 10a), increasing the aspect ratio means increasing the effective stiffness of the reinforced matrix and decreasing Poisson’s ratio. Increasing the aspect ratio by 100 from 100 to 200 doubles the effective Young’s modulus. However, the more we increase the aspect ratio, the slower the increase rate, until reaching a Young’s modulus of 180 GPa, where increasing the aspect ratio has no effect. For GNP inclusions (Figure 10b), the effective Young’s modulus increases with increasing the volume fraction and the aspect ratio; however, for the Poisson’s ratio, increasing the aspect ratio decreases ν m * , and we can also notice that for low aspect ratios, Poisson’s ratio varies linearly.

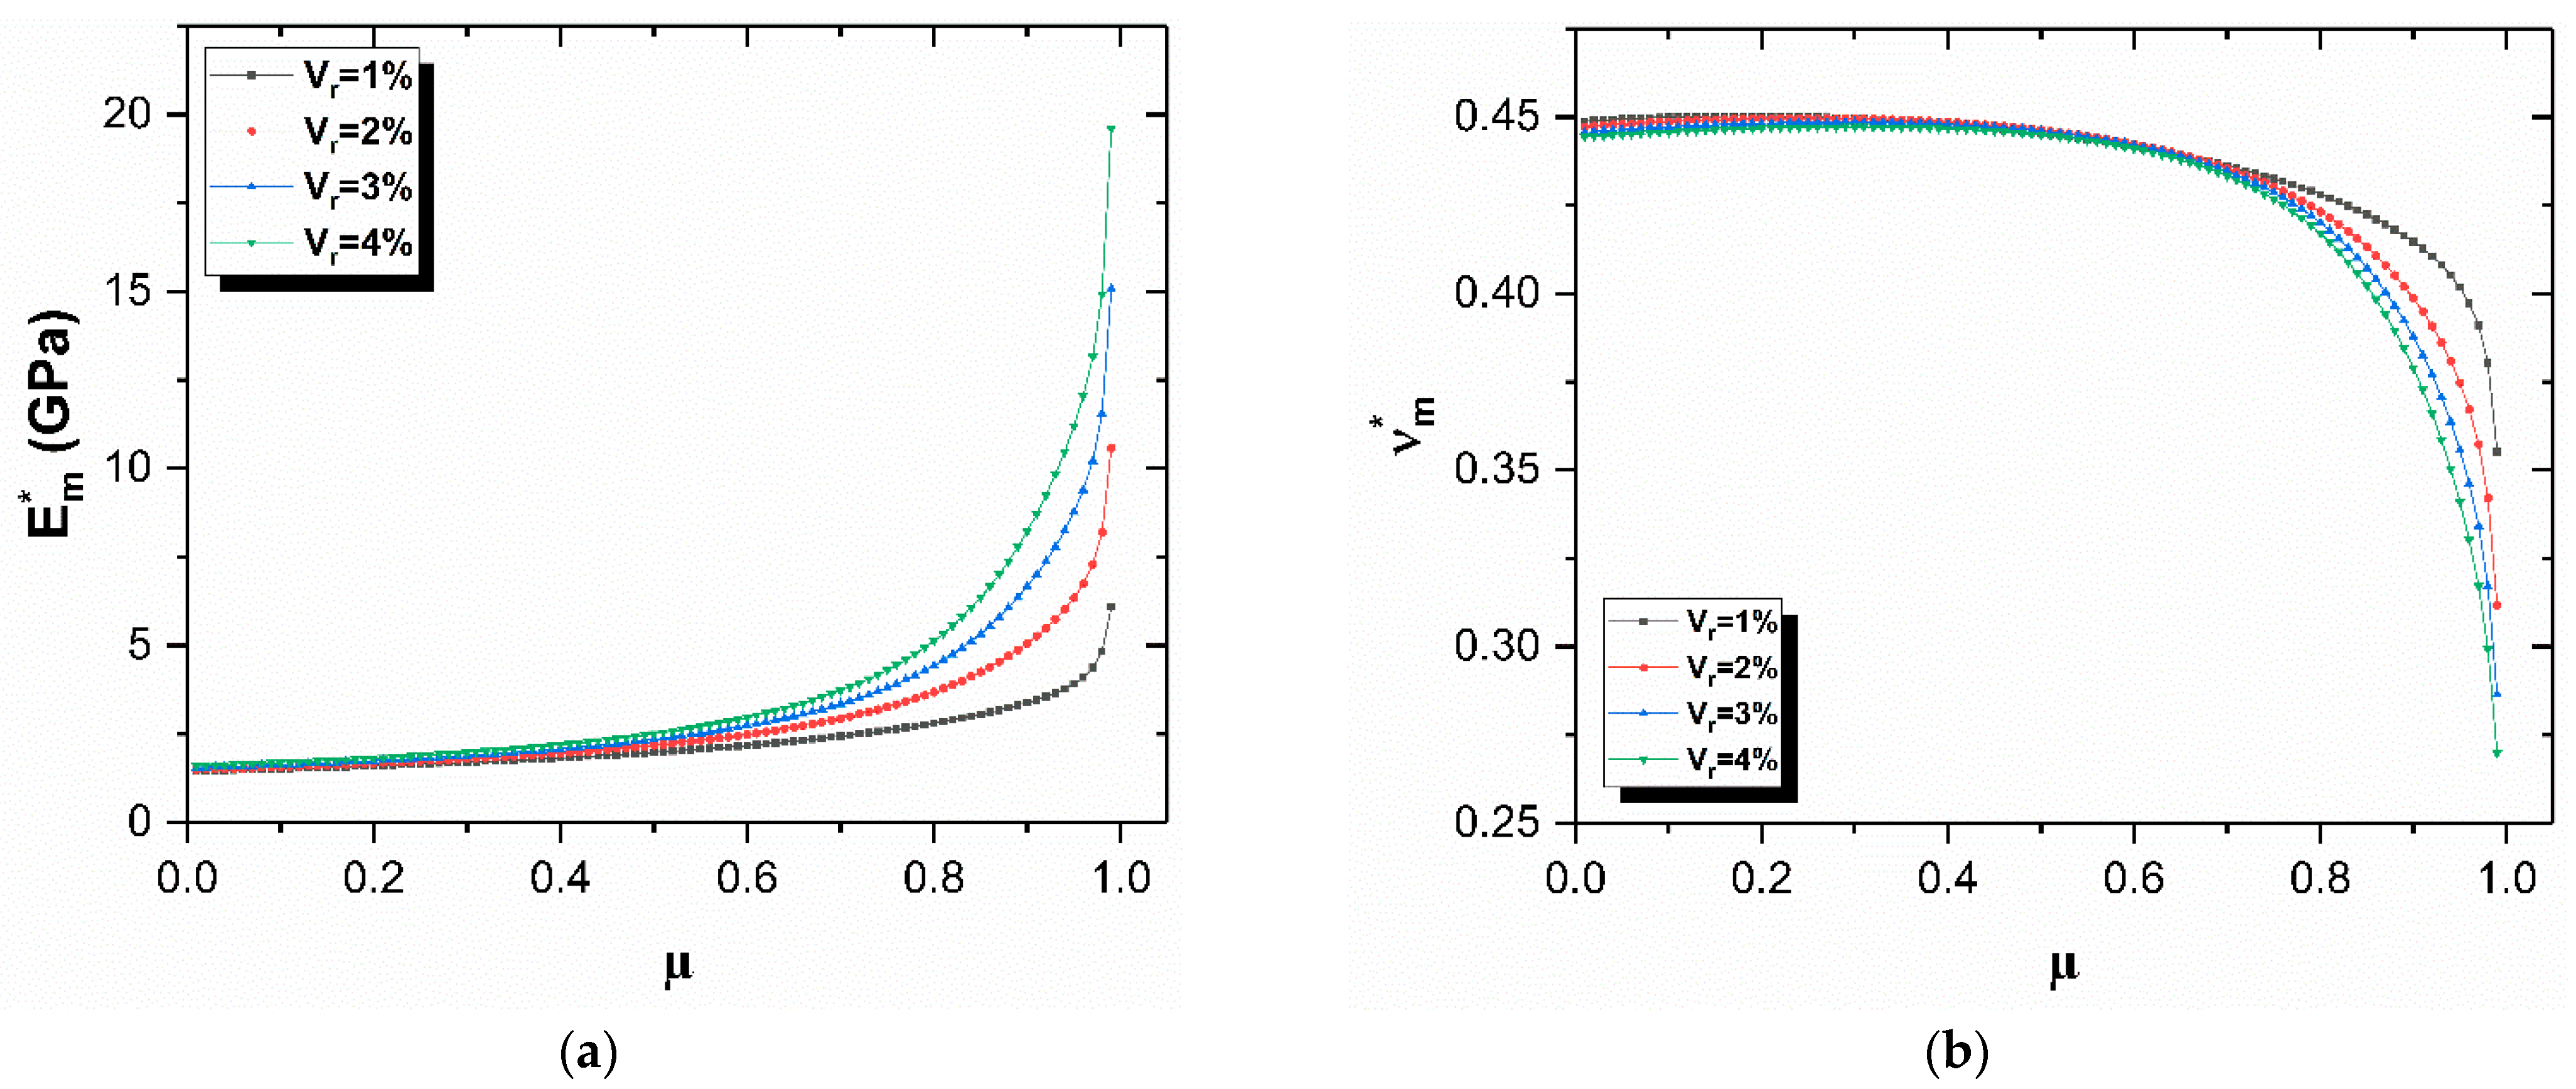
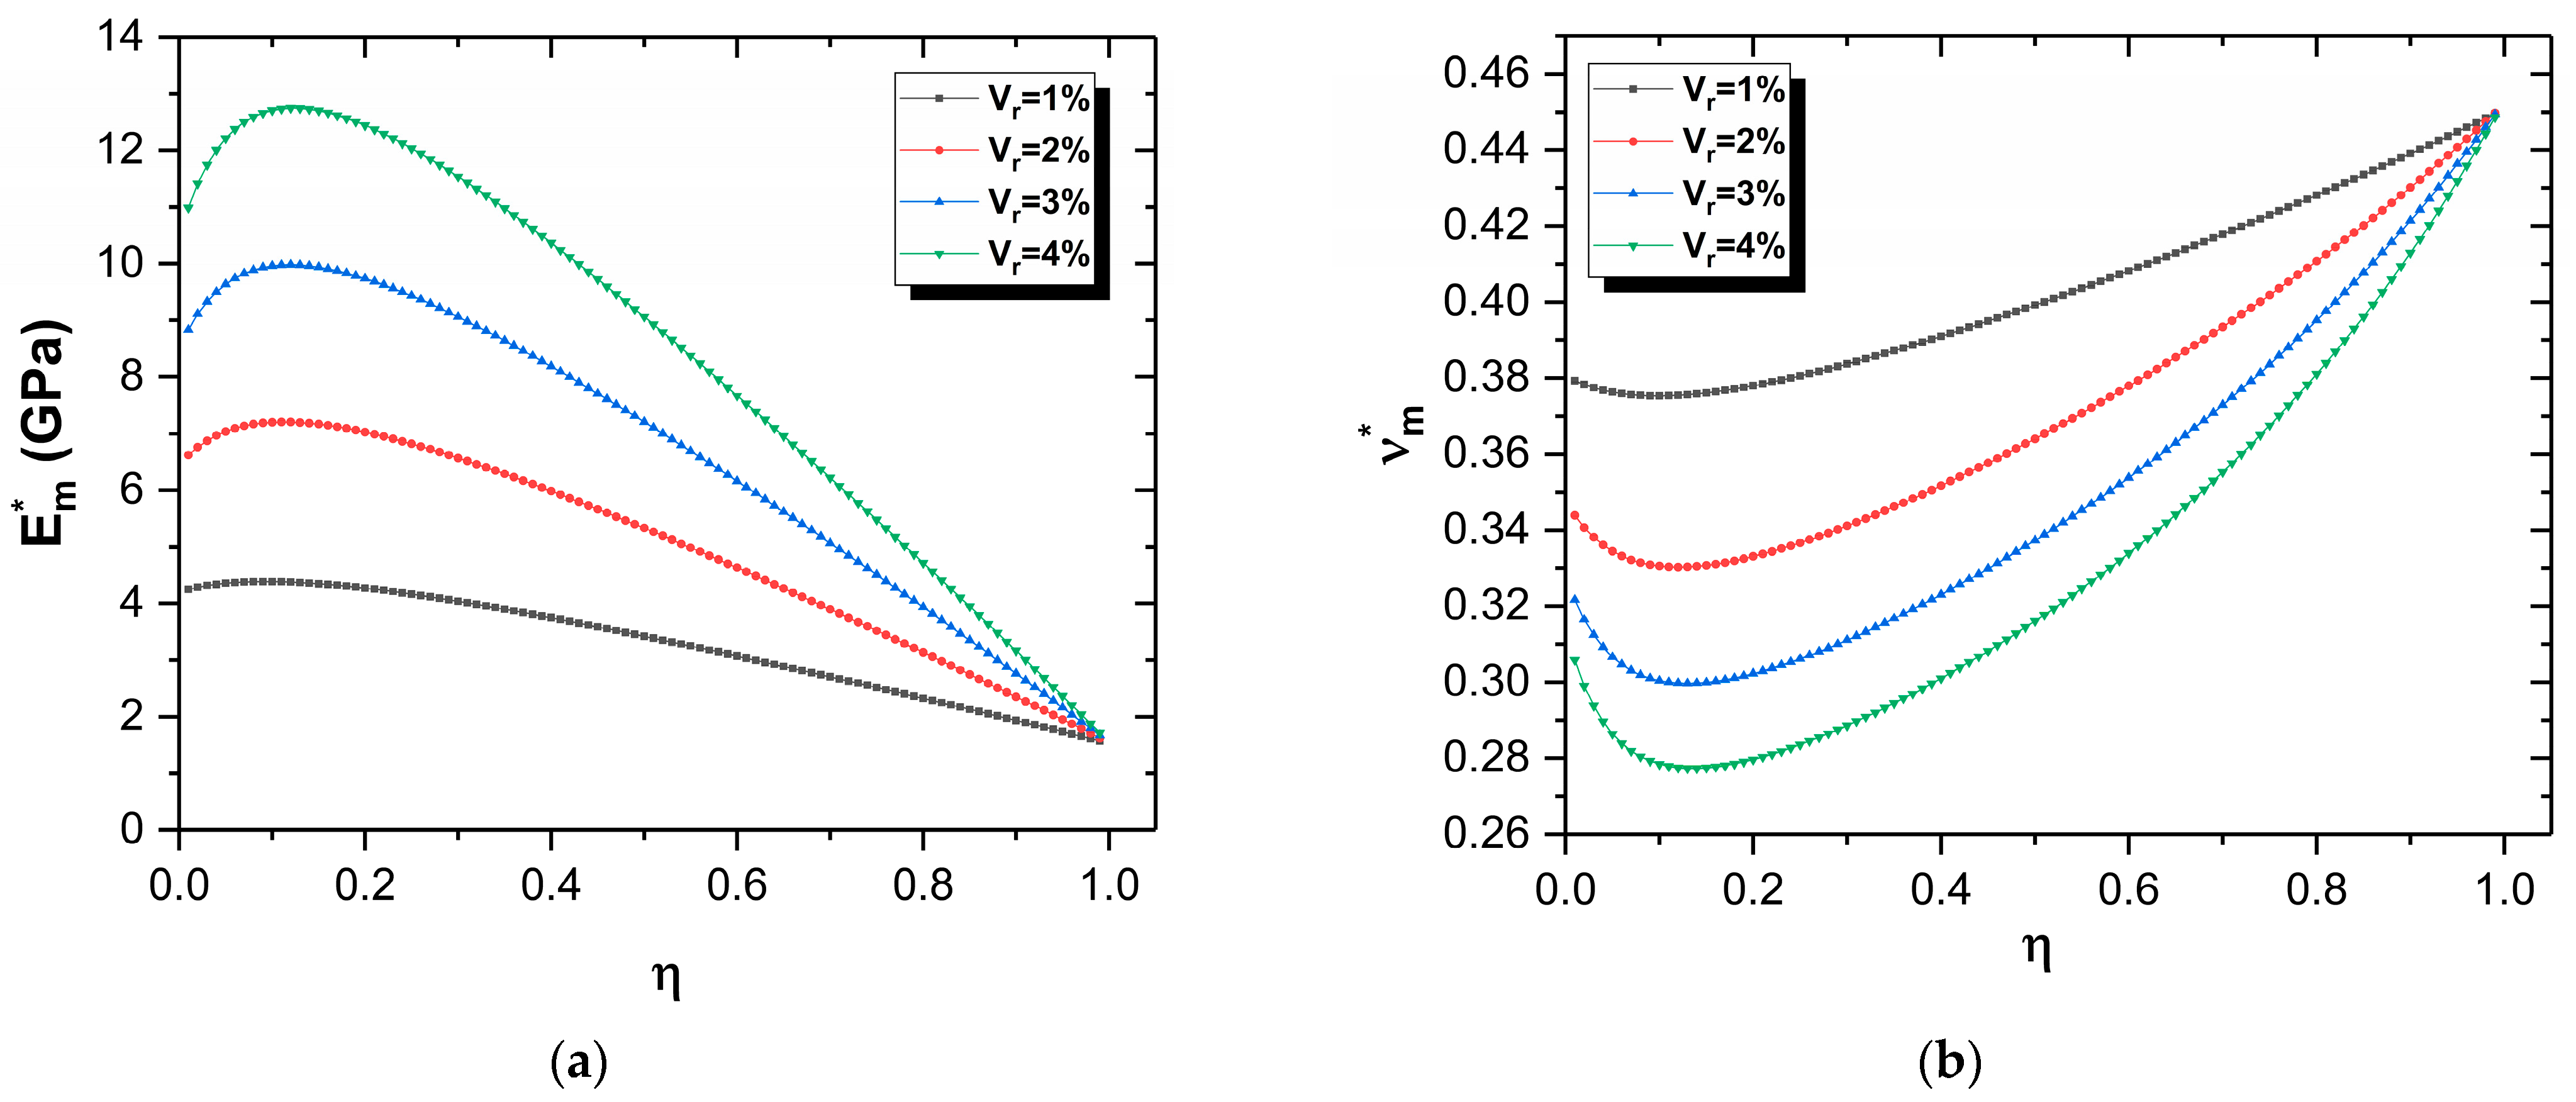
5. Effect of Agglomeration on the Mechanical Properties

5.1. Agglomeration of CNTs

First, the nanosized reinforcing phase is apt to agglomerate, causing a spatially non-uniform distribution of the fillers in composites. To theoretically examine the agglomeration effect, we assumed that some graphene sheets are concentrated in some spherical regions in the matrix, while the rest keep a desired uniform dispersion, as illustrated in Figure 11. Then, the composite was divided into two parts with different loadings of reinforcement which can be considered as two different phases in calculation. We gave the names agglomeration phase and effective matrix phase to the regions inside and outside the spheres, respectively, and further recommend that in both phases the graphene sheets are randomly oriented. In our model, a two-parameter description was employed to characterize such a special distribution [23], where the agglomeration parameters are written as
μ = W i n W   ;   η = W r i n W r
If W r denotes the total volume of CNTs inserted in the matrix, it can be defined as the sum of two contributes
W r = W r i n + W r m
In which W r i n   and W r m represent the volume of nanofillers within the inclusions and scattered in the matrix, respectively. Thus, the total volume W of a representative element is given by the following relation
W = W r + W m
where W m stands for the matrix volume.
The volume fraction of CNTs V r and of the matrix V m can be expressed as follows
V r = W r W   and   V m = W m W
In which the relation V r +   V m = 1 allows to relate these two quantities. The reinforcing phase V r can be seen as the sum of the volume fraction of CNT within the inclusions V r i n and the volume fraction of the nanoparticles scattered in the matrix V r m as shown below
V r = V r i n + V r m
Then the volume fraction of nanofillers in the agglomeration phase V r i n and that in the effective matrix phase V r m can be formulated as
V r i n = W r i n W i n = η V r μ
V r m = W r W r i n W W i n = 1 η V r 1 μ
A two-step procedure was applied to reckon the above model. First, the overall elastic properties of the agglomeration and the effective matrix phases are calculated from Equations (80) and (85) by replacing V r with V r i n and V r o u t   given in Equation (84), respectively. The bulk modulus of the spherical inclusions K i n * , and the effective matrix K o u t * are computed as
K i n * = K m + η V r   δ r 3 K m α r 3 μ + η V r 1 α r
K o u t * = K m + 1 η V r   δ r 3 K m α r 3 1 μ + V r 1 η α r 1
Whereas the corresponding shear modulus of the spherical inclusions G i n * , and the effective matrix G o u t * are computed as
G i n * = G m + η V r   η r 2 G m β r 2 μ + η V r   β r 1
G o u t * = G m + 1 η V r   η r 2 G m β r 2 1 μ + V r 1 η β r 1
It should be pointed out that K m and G m specify the bulk and the shear moduli of the sole isotropic matrix, can be formulated from Equation (90). For the elastic Hill’s moduli, CNT inclusions are computed from Equations (3)–(6).
G m = E m 2   1 + ν m               K m = E m 3   1 2 ν m
Secondly, the agglomeration phase is considered as spherical inclusions embedded in the effective matrix. The effective bulk moduli K m * and shear moduli G m * of this hybrid matrix, enriched by CNTs or GNP both included in the spherical inclusions and scattered in the matrix can be computed as
K m * = K o u t * 1 + μ K i n * K o u t * 1 1 + 1 μ K i n * K o u t * 1 1 + ν o u t * 3 3 ν o u t *
G m * = G o u t * 1 + μ G i n * G o u t * 1 1 + 1 μ G i n * G o u t * 1 8 10 ν o u t * 15 15 ν o u t *
In which ν o u t * stands for the Poisson’s ratio defined as follows
ν o u t * = 3 K o u t * 2 G o u t * 6 K o u t * + 2 G o u t *
The hybrid matrix is evidently isotropic. Therefore, the Young’s modulus E m * , the Poisson’s ratio ν m *   and the density ρ m * are required to define its properties. They can be computed from Equations (9)–(10), respectively
For η μ , with μ ,   η 0 , 1 . The first parameter μ defines the width of the spherical inclusion W i n   with respect to the total volume W. On the other hand, the second agglomeration parameter η quantifies the volume of CNTs inside the inclusions W r i n with respect to total volume of CNTs W r . In general, three limit cases of the agglomeration ratio can be defined depending on the values of μ ,   η .
For μ < η and μ < 1 th, the agglomeration is partial, and the nanofibers are both included in the inclusions and scattered in the matrix (Figure 11b). It should be noted that the heterogeneity of CNTs is amplified for μ < 1 , by increasing the value of the parameter η. In contrast, if μ = η = 1 is set, the volume of CNTs is completely concentrated in the inclusions W r = W r i n , which coincide with the whole reference domain ( W i n = W ). This circumstance is depicted in Figure 11a and represents a null level of agglomeration. Finally, the complete agglomeration of CNTs is defined by μ < η and η = 1 (Figure 11c). In other words, all the CNTs are located within the spherical inclusions.

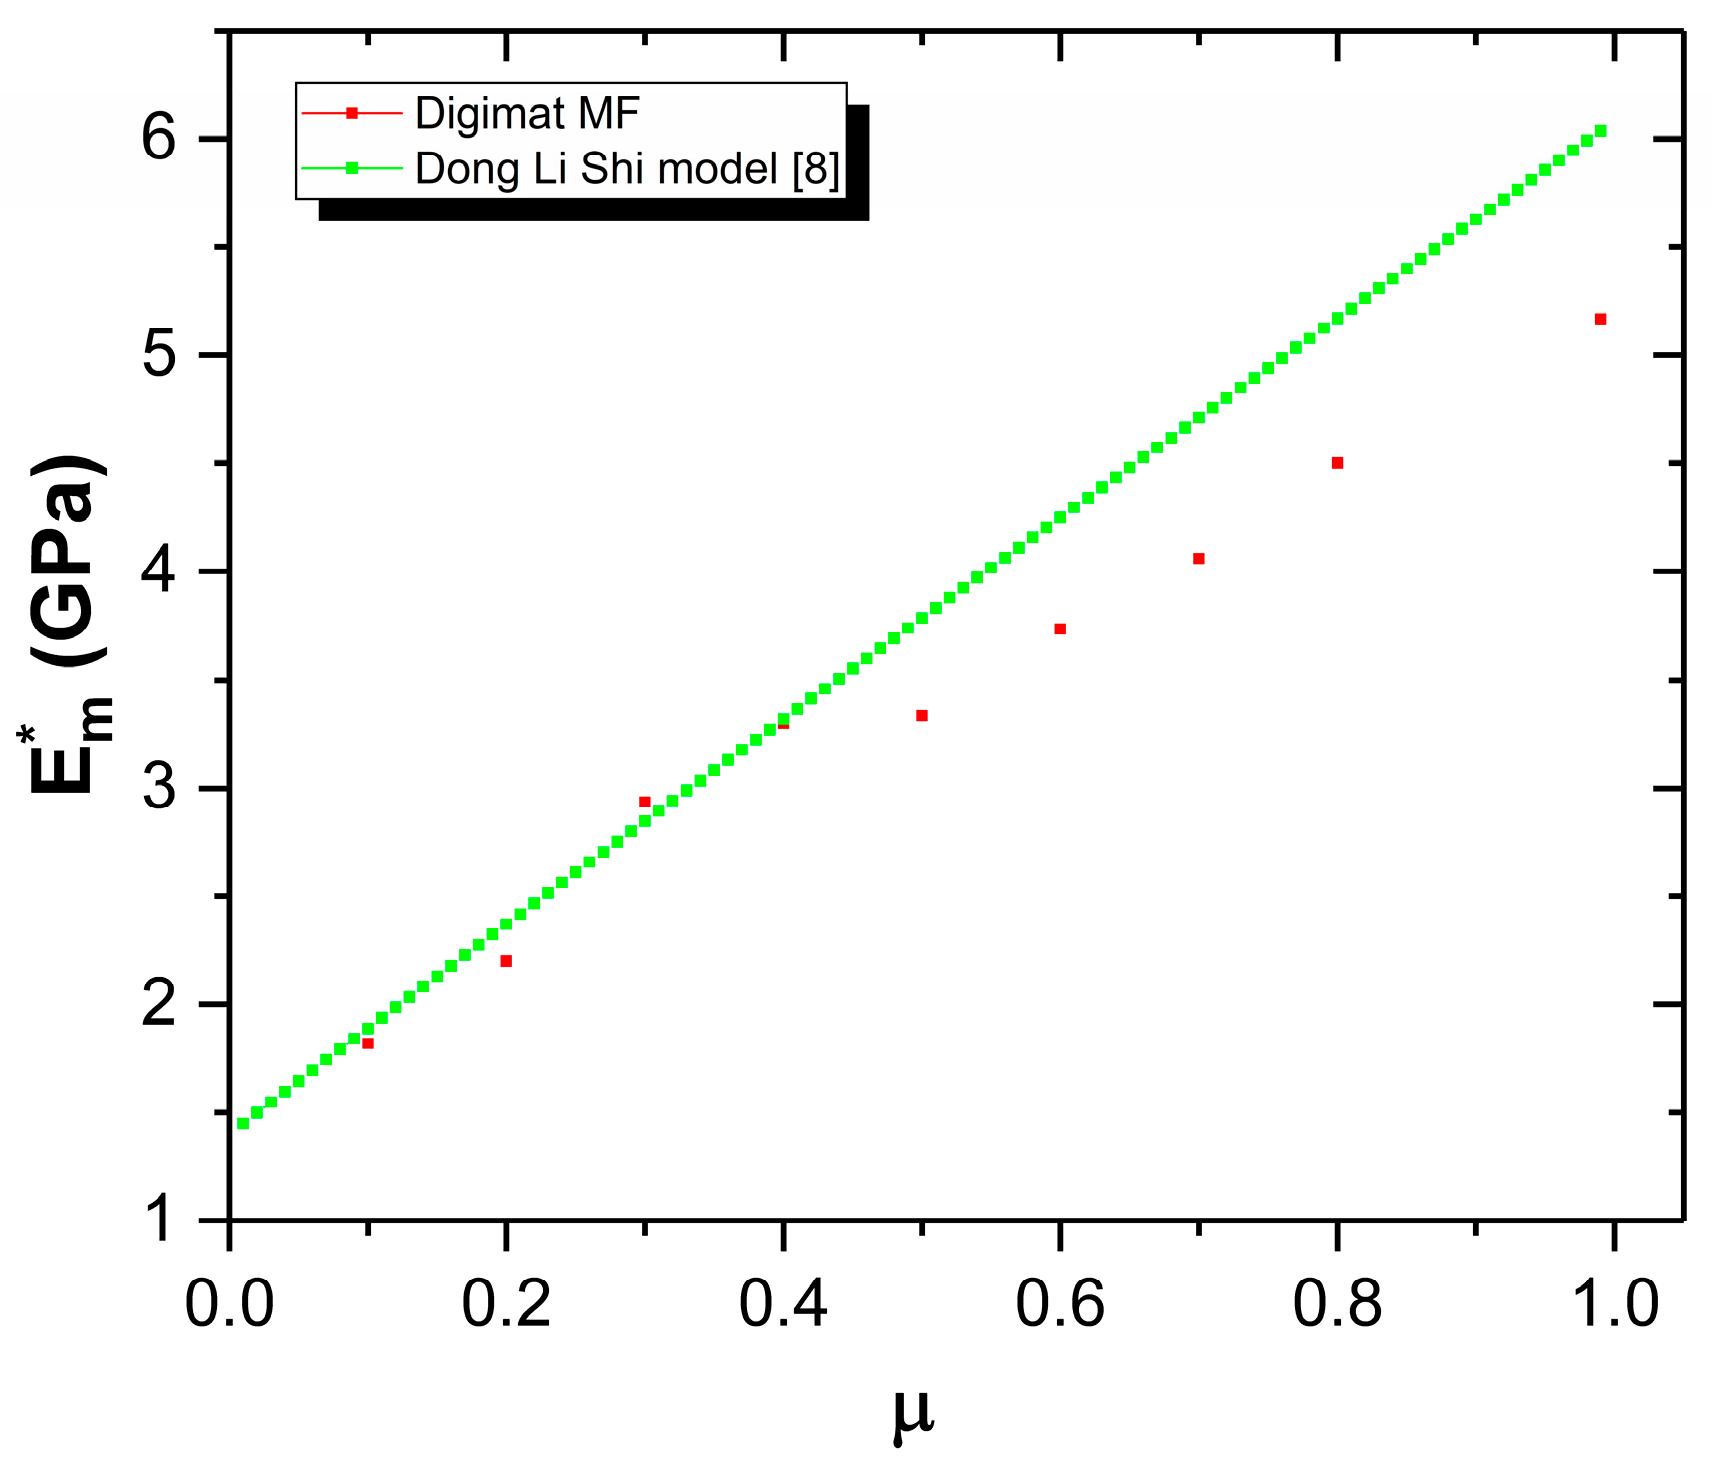
5.1.1. Method Comparison

Before studying the agglomeration effect using Shi’s model [22], we investigated the validity of the model by comparing results from the analytical model (Table 6) with semi-numerical results from Digimat MF.
It was supposed that the inclusions had a prolate ellipsoid with an aspect ratio of 104, and the agglomeration to have a spherical shape. The volume fraction of CNTs was assumed to be equal to 1%.
As seen in Figure 12, there is an acceptable agreement between the two approaches: until μ = 0.4 , the results from Digimat MF tend to be linear. The errors between the two approaches can be explained by several explanations: errors can come from the fact that inclusions in the analytical model are assumed to have an infinite aspect ratio, in addition the low value of η used in this study plays a role in the validity of this comparison as when we increased the latter parameter, agreement was no longer found.

5.1.2. Results and Discussions

The influences of the parameters μ and η on the effective modulus were investigated individually by fixing another for only a small volume fraction, as in reality the use of nanofillers is limited to low levels. First, we considered the most severe case of agglomeration where all the inclusions were concentrated in the same place which we can express mathematically by η = 1 . We plotted the effective Young’s modulus and Poisson’s ratio under different volume fractions in function of μ (Figure 13).
The effective elastic modulus has a maximum value when the CNTs are uniformly distributed in the composite. As the agglomeration parameter decreases, the effective stiffness also decreases rapidly. It is also noted that for μ ≤ 0.6, the addition of CNTs has no effect on the elastic properties of the reinforced polymer. Both agglomeration parameters are required to describe this phenomenon. The first η indicates the amount of inclusions located in the agglomeration and the other indicates the size of the agglomerations.
The effective properties are shown in Figure 14 for μ = 0.2, where it is seen that with the increase of the relative amount of CNTs in the concentrated regions, the effective Young’s modulus increases slightly to a maximum value of 20 GPa for a volume fraction of 4% and η = 0.15 before dropping sharply to reach its minimum value when η reaches the unity. For μ = 0.5 (Figure 15), we can observe that the curves keep the similar tendency but with greater magnitudes, so it can be concluded that increasing the volume of the concentrated regions leads to an increase in the effective properties.

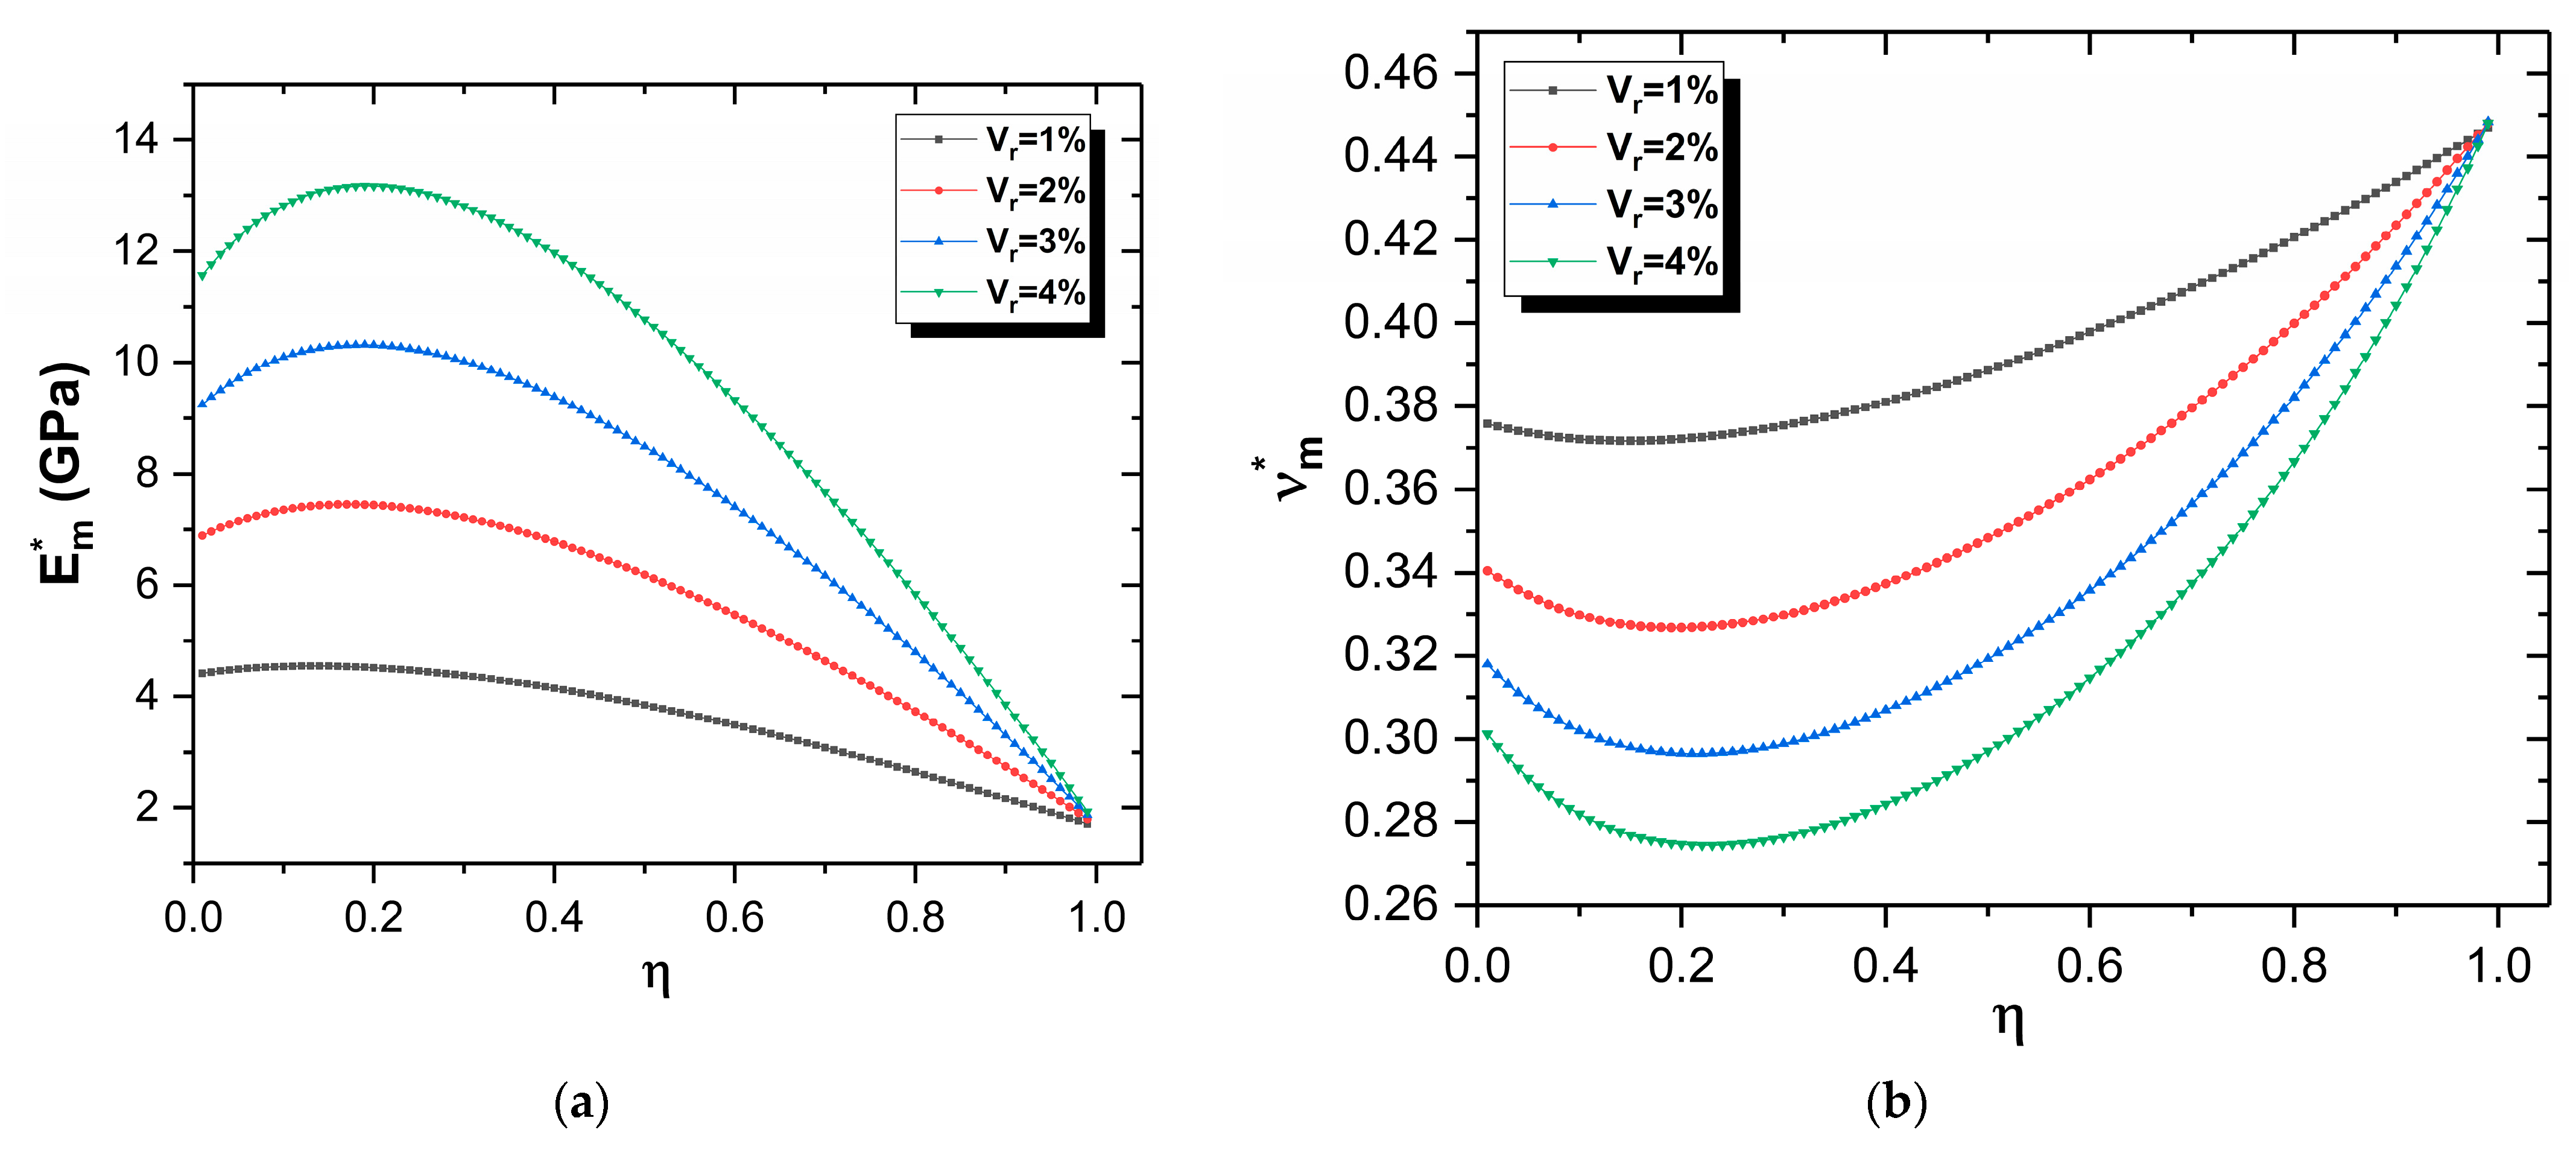
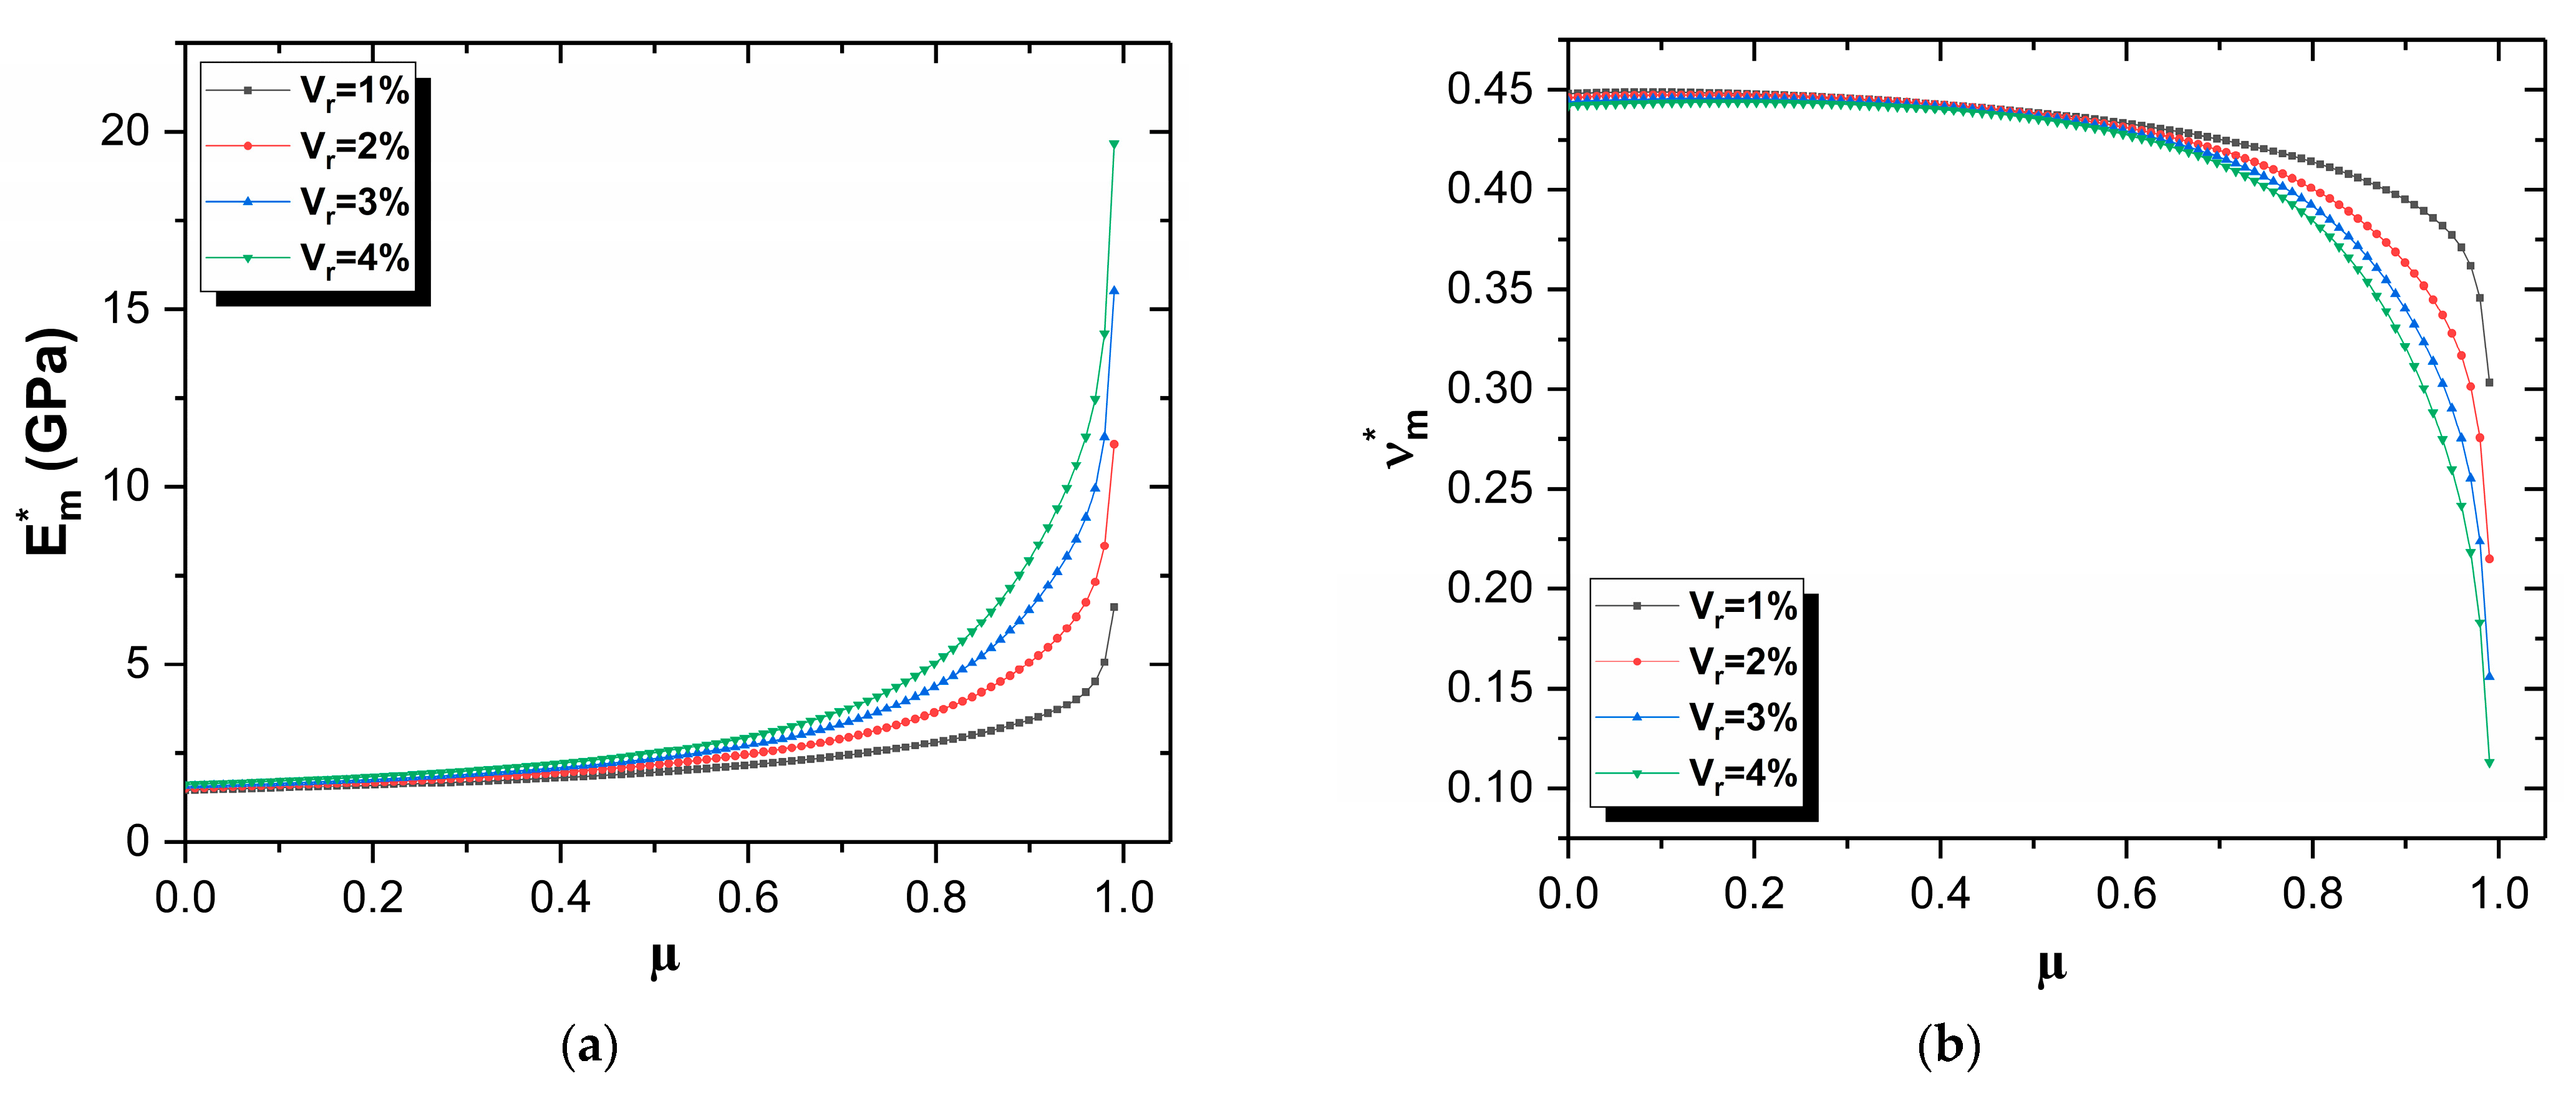
5.2. Agglomeration of GNPs

For the agglomeration of GNPs, a similar mathematical model was used for modelling the different agglomeration phases with a slight difference in the mathematical expression of the bulk and shear modulus where [23]
K m * = K o u t * 1 + μ K i n * K o u t * 1 1 + 1 μ K i n * K o u t * 1 3 K o u t * 3 K o u t * + 4 G o u t *
G m * = G o u t * 1 + μ G i n * G o u t * 1 1 + 1 μ G i n * G o u t * 1 6   K o u t * + 2 G o u t * 5   3 K o u t * + 4 G o u t *
Using the same technique for CNT agglomeration, we investigated the influence of the two agglomeration parameters by fixing one and varying the other. Figure 13 shows the variation of effective Young’s modulus and Poisson’s ratio in function of µ under η = 1 which indicated that all the nanofillers are agglomerated in some spherical areas. The variation of the same properties with η under μ = 0.2 and μ = 0.5 are presented in Figure 14 and Figure 15.

Results and Discussions

In the extreme case where η = 1 (Figure 16), we can observe that the graphene sheets have the same agglomeration behavior (the curves have similar shapes with a difference in the magnitudes) as the carbon nanotubes, where the elastic property of the reinforced matrix drops as the agglomeration parameter decreases. It is concluded from Figure 17 and Figure 18 that increasing μ indicates that the amount of the fillers located in the agglomeration areas reduce the effective Young’s modulus and Poisson’s ratio. However, increasing the second agglomeration parameter η enhances the elastic properties of the matrix, which can be explained by the fact that η signifies the size of the agglomeration sub-regions; consequently, the bigger the concentrated areas are, the more uniform the distribution.

6. Conclusions

In this paper, we studied the elastic behavior of a biocomposite based on Alfa fibers and CNT/GNP-reinforced polymer compared with synthetic fibers used in the wind energy field. As the elastic behavior is characterized by the Young’s modulus and Poisson’s ratio, we evaluated those two properties using analytical and numerical approaches, and also investigated the effect of the volume fraction, aspect ratio, and agglomeration of the inclusions.
The key conclusions of this work can be summarized as follows:
Computational and numerical approaches show a good agreement for small volume fraction up to 10%;
Due its shape, the CNT-reinforced composite has better overall properties in the axial direction and the GNP-reinforced composite has better properties in the transversal direction. The effect of the aspect ratio was also studied, and by increasing the aspect ratio from 1 t 0.0001, the elastic modulus increases for the GNP and reaches a maximum of 260 GPa. By increasing the aspect ratio from 50 to 1000, the elastic modulus increases for the CNT and reach a maximum of 180 GPa;
In the second homogenization, the axial and transverse Young’s modulus increases with increases in the volume fraction of CNT and GNP. The glass reinforcement shows the best mechanical behavior with a maximum axial Young’s modulus of 140 GPa; surprisingly, mixing alfa fibers with GNP inclusions gave us better elastic properties than that of the carbon fibers, with a maximum of axial Young’s modulus of 90 GPa.
Finally, as the agglomeration parameter decreases, the effective stiffness also decreases rapidly. It was also noted that for μ ≤ 0.6, the addition of CNTs has no effect on the elastic properties of the reinforced polymer. Results indicated that with the increase of the relative amount of CNTs in the concentrated regions, the effective Young’s modulus increases slightly to a maximum value of 20 GPa for a volume fraction of 4% and η = 0.15 before dropping sharply to reach its minimum value when η reaches the unity.

Author Contributions

Conceptualization, A.E.B. and M.R.; Methodology, M.R.; Software, M.T.; Validation, M.R., M.T., A.E.M., N.C. and L.E.H.O.; Formal analysis, A.E.B. and M.R.; Investigation, A.E.B. and M.R.; Resources, A.E.M.; Data curation, A.E.B. and M.R.; Writing—original draft, A.E.B.; Writing—review & editing, M.R., M.T., A.E.M., N.C. and L.E.H.O.; Visualization, A.E.B.; Supervision, O.C. and L.E.H.O.; Project administration, L.E.H.O. All authors have read and agreed to the published version of the manuscript.

Funding

This research received no external funding.

Institutional Review Board Statement

Not applicable.

Conflicts of Interest

The authors declare no conflict of interest.

References

  1. Rouway, M.; Nachtane, M.; Tarfaoui, M.; Chakhchaoui, N.; Omari, L.E.H.; Fraija, F.; Cherkaoui, O. Mechanical Properties of a Biocomposite Based on Carbon Nanotube and Graphene Nanoplatelet Reinforced Polymers: Analytical and Numerical Study. J. Compos. Sci. 2021, 5, 234. [Google Scholar] [CrossRef]
  2. Nachtane, M.; Tarfaoui, M.; Goda, I.; Rouway, M. A review on the technologies, design considerations and numerical models of tidal current turbines. Renew Energy 2020, 157, 1274–1288. [Google Scholar] [CrossRef]
  3. Lamhour, K.; Rouway, M.; Tizliouine, A.; El Hachemi Omari, L.; Salhi, H.; Cherkaoui, O. Experimental study on the properties of Alfa/wool woven fabrics reinforced epoxy composite as an application in wind turbine blades. J. Compos. Mater. 2022, 56, 3253–3268. [Google Scholar] [CrossRef]
  4. Mahmoud Zaghloul, M.Y.; Yousry Zaghloul, M.M.; Yousry Zaghloul, M.M. Developments in polyester composite materials—An in-depth review on natural fibres and nano fillers. Compos. Struct. 2021, 278, 114698. [Google Scholar] [CrossRef]
  5. Nachtane, M.; Meraghni, F.; Chatzigeorgiou, G.; Harper, L.T.; Pelascini, F. Multiscale viscoplastic modeling of recycled glass fiber-reinforced thermoplastic composites: Experimental and numerical investigations. Compos. Part B Eng. 2022, 242, 110087. [Google Scholar] [CrossRef]
  6. Nunna, S.; Blanchard, P.; Buckmaster, D.; Davis, S.; Naebe, M. Development of a cost model for the production of carbon fibres. Heliyon 2019, 5, e02698. [Google Scholar] [CrossRef] [Green Version]
  7. Zaghloul, M.M.Y.; Zaghloul, M.Y.M.; Zaghloul, M.M.Y. Experimental and modeling analysis of mechanical-electrical behaviors of polypropylene composites filled with graphite and MWCNT fillers. Polym. Test. 2017, 63, 467–474. [Google Scholar] [CrossRef]
  8. García-Macías, E.; Castro-Triguero, R. Coupled effect of CNT waviness and agglomeration: A case study of vibrational analysis of CNT/polymer skew plates. Compos. Struct. 2018, 193, 87–102. [Google Scholar] [CrossRef]
  9. Maghsoudlou, M.A.; Barbaz Isfahani, R.; Saber-Samandari, S.; Sadighi, M. Effect of interphase, curvature and agglomeration of SWCNTs on mechanical properties of polymer-based nanocomposites: Experimental and numerical investigations. Compos. Part B Eng. 2019, 175, 107119. [Google Scholar] [CrossRef]
  10. Pan, Z.-Z.; Chen, X.; Zhang, L.-W. Modeling large amplitude vibration of pretwisted hybrid composite blades containing CNTRC layers and matrix cracked FRC layers. Appl. Math. Model. 2020, 83, 640–659. [Google Scholar] [CrossRef]
  11. Iijima, S. Helical microtubules of graphitic carbon. Nature 1991, 354, 56–58. [Google Scholar] [CrossRef]
  12. Hassanzadeh-Aghdam, M.K.; Mahmoodi, M.J.; Ansari, R. Creep performance of CNT polymer nanocomposites -An emphasis on viscoelastic interphase and CNT agglomeration. Compos. Part B Eng. 2019, 168, 274–281. [Google Scholar] [CrossRef]
  13. Thostenson, E.T.; Chou, T.-W. On the elastic properties of carbon nanotube-based composites: Modelling and characterization. J. Phys. Appl. Phys. 2003, 36, 573–582. [Google Scholar] [CrossRef]
  14. Bonnet, P.; Sireude, D.; Garnier, B.; Chauvet, O. Thermal properties and percolation in carbon nanotube-polymer composites. Appl. Phys. Lett. 2007, 91, 201910. [Google Scholar] [CrossRef]
  15. Fidelus, J.D.; Wiesel, E.; Gojny, F.H.; Schulte, K.; Wagner, H.D. Thermo-mechanical properties of randomly oriented carbon/epoxy nanocomposites. Compos. Part Appl. Sci. Manuf. 2005, 36, 1555–1561. [Google Scholar] [CrossRef]
  16. Hassanzadeh-Aghdam, M.K. Evaluating the effective creep properties of graphene-reinforced polymer nanocomposites by a homogenization approach. Compos. Sci. Technol. 2021, 209, 108791. [Google Scholar] [CrossRef]
  17. Gao, C.; Zhan, B.; Chen, L.; Li, X. A micromechanical model of graphene-reinforced metal matrix nanocomposites with consideration of graphene orientations. Compos. Sci. Technol. 2017, 152, 120–128. [Google Scholar] [CrossRef]
  18. Rafiee, M.A.; Rafiee, J.; Wang, Z.; Song, H.; Yu, Z.-Z.; Koratkar, N. Enhanced Mechanical Properties of Nanocomposites at Low Graphene Content. ACS Nano 2009, 3, 3884–3890. [Google Scholar] [CrossRef]
  19. Narh, K.A.; Jallo, L.; Rhee, K.Y. The effect of carbon nanotube agglomeration on the thermal and mechanical properties of polyethylene oxide. Polym. Compos. 2008, 29, 809–817. [Google Scholar] [CrossRef]
  20. Alian, A.R.; El-Borgi, S.; Meguid, S.A. Multiscale modeling of the effect of waviness and agglomeration of CNTs on the elastic properties of nanocomposites. Comput. Mater. Sci. 2016, 117, 195–204. [Google Scholar] [CrossRef]
  21. Daghigh, H.; Daghigh, V.; Milani, A.; Tannant, D.; Lacy, T.E.; Reddy, J.N. Nonlocal bending and buckling of agglomerated CNT-Reinforced composite nanoplates. Compos. Part B Eng. 2020, 183, 107716. [Google Scholar] [CrossRef]
  22. Shi, D.-L.; Feng, X.-Q.; Huang, Y.Y.; Hwang, K.-C.; Gao, H. The Effect of Nanotube Waviness and Agglomeration on the Elastic Property of Carbon Nanotube-Reinforced Composites. J. Eng. Mater. Technol. 2004, 126, 250–257. [Google Scholar] [CrossRef]
  23. Ji, X.-Y.; Cao, Y.-P.; Feng, X.-Q. Micromechanics prediction of the effective elastic moduli of graphene sheet-reinforced polymer nanocomposites. Model. Simul. Mater. Sci. Eng. 2010, 18, 045005. [Google Scholar] [CrossRef]
  24. Yun, G.J.; Zhu, F.-Y.; Lim, H.J.; Choi, H. A damage plasticity constitutive model for wavy CNT nanocomposites by incremental Mori-Tanaka approach. Compos. Struct. 2021, 258, 113178. [Google Scholar] [CrossRef]
  25. Fazilati, J.; Khalafi, V.; Jalalvand, M. Free vibration analysis of three-phase CNT/polymer/fiber laminated tow-steered quadrilateral plates considering agglomeration effects. Thin-Walled Struct. 2022, 179, 109638. [Google Scholar] [CrossRef]
  26. Mori, T.; Tanaka, K. Average stress in matrix and average elastic energy of materials with misfitting inclusions. Acta Metall. 1973, 21, 571–574. [Google Scholar] [CrossRef]
  27. Tornabene, F.; Bacciocchi, M.; Fantuzzi, N.; Reddy, J.N. Multiscale approach for three-phase CNT/polymer/fiber laminated nanocomposite structures. Polym. Compos. 2019, 40, E102–E126. [Google Scholar] [CrossRef]
  28. Chamis, C.C. Simplified Composite Micromechanics Equations For Hygral, Thermal And Mechanical Properties. In Proceedings of the Ann. Conf. of the Society of the Plastics Industry (SPI) Reinforced Plastics/Composites Inst., Houston, TX, USA, 1 January 1983. [Google Scholar]
  29. Hashin, Z.; Rosen, B.W. The Elastic Moduli of Fiber-Reinforced Materials. J. Appl. Mech. 1964, 31, 223–232. [Google Scholar] [CrossRef]
  30. Halpin, J.C. Stiffness and Expansion Estimates for Oriented Short Fiber Composites. J. Compos. Mater. 1969, 3, 732–734. [Google Scholar] [CrossRef]
Figure 1. Multi-stage approach for mechanical homogenization of three-phased nanocomposite.
Jcs 07 00029 g001
Figure 2. Coordinate system carbon nanotubes CNT (a) and graphene nanoplatelets GNP (b).
Jcs 07 00029 g002
Figure 3. RVE of random CNT and GNP nanofillers: (a) CNT cylindrical inclusion; (b) CNT ellipsoidal inclusion; (c) GNP platelet inclusion; and (d) GNP ellipsoidal inclusion.
Jcs 07 00029 g003
Figure 4. Effective elastic moduli of a matrix reinforced by randomly oriented nanofillers, a comparison between Digimat MF and Mori–Tanaka scheme: (a) effective Young’s modulus   E m * ; and (b) effective Poisson’s ratio ν m * .
Jcs 07 00029 g004
Figure 5. Comparison of the effective elastic moduli of a matrix reinforced by randomly oriented nanofillers, by using numerical method with Digimat MF: (a) effective Young’s modulus   E m * ; and (b) effective Poisson’s ratio ν m * .
Jcs 07 00029 g005
Figure 6. RVE geometry for aligned oriented fiber (a), and their tetrahedral mesh (b).
Jcs 07 00029 g006
Figure 7. The transversely elastic moduli of CNT-PP matrix reinforced by alfa-aligned fiber, using numerical and analytical methods: (a) E 11 axial Young’s modulus; (b) E 22   in-plane Young’s modulus; (c) ν 23   in-plane Poisson’s ratio; and (d) ν 12   axial Poisson’s ratio.
Jcs 07 00029 g007
Figure 8. The transversely elastic moduli of CNT-PP matrix reinforced by carbon-(T-300) aligned fiber, using numerical and analytical methods: (a) E 11 axial Young’s modulus; (b) E 22   in-plane Young’s modulus; (c) ν 23   in-plane Poisson’s ratio; and (d) ν 12   axial Poisson’s ratio.
Jcs 07 00029 g008
Figure 9. Comparison of the transversely elastic moduli of an effective matrix reinforced by aligned fibers, by using the numerical method with Digimat MF: (a) E 11 axial Young’s modulus; (b) E 22   in-plane Young’s modulus; (c) ν 23   in-plane Poisson’s ratio; and (d) ν 12   axial Poisson’s ratio.
Jcs 07 00029 g009aJcs 07 00029 g009b
Figure 10. The effect of CNT/GNP aspect ratios on the effective elastic moduli of matrix using Digimat MF: (a) E m * Young’s modulus for CNT-PP and ν m * Poisson’s ratio for CNT-PP; (b) E m * Young’s modulus for GNP-PP, and ν m * Poisson’s ratio for GNP-PP.
Jcs 07 00029 g010aJcs 07 00029 g010b
Figure 11. Agglomeration model of CNTs for the hybrid matrix: (a) partial agglomeration; (b) null agglomeration; and (c) complete agglomeration.
Jcs 07 00029 g011
Figure 12. Effective elastic moduli E m * of a matrix reinforced by agglomerated randomly oriented nanofillers, a comparison between Digimat MF and Mori–Tanaka scheme.
Jcs 07 00029 g012
Figure 13. Effective elastic moduli of composite reinforced by randomly CNT inclusion in PP matrix, in function agglomeration parameter μ at small volume fraction (1–4%): (a) effective Young’s modulus   E m * ; and (b) effective Poisson’s ratio ν m * .
Jcs 07 00029 g013
Figure 14. Effective elastic moduli of composite reinforced by random CNT inclusion in PP matrix, in function of η for μ = 0.2 with a maximum of Young’s modulus E m *   and minimum of Poisson’s ratio ν m * : (a) effective Young’s modulus   E m * ; and (b) effective Poisson’s ratio ν m * .
Jcs 07 00029 g014
Figure 15. Effective elastic moduli of composite reinforced by randomly CNT inclusion in PP matrix, in function of η for μ = 0.35 with a maximum of Young’s modulus E m *   and minimum of Poisson’s ratio ν m * : (a) effective Young’s modulus   E m * ; and (b) effective Poisson’s ratio ν m * .
Jcs 07 00029 g015
Figure 16. Effective elastic moduli of composite reinforced by randomly GNP inclusion in PP matrix, in function agglomeration (parameter μ at small volume fraction (1–4%): (a) effective Young’s modulus   E m * ; and (b) effective Poisson’s ratio ν m * .
Jcs 07 00029 g016
Figure 17. Effective elastic moduli of composite reinforced by randomly GNP inclusion in PP matrix, in function of η for μ = 0.2 with a maximum of Young’s modulus E m *   and minimum of Poisson’s ratio ν m * : (a) effective Young’s modulus   E m * ; and (b) effective Poisson’s ratio ν m * .
Jcs 07 00029 g017
Figure 18. Effective elastic moduli of composite reinforced by randomly GNP inclusion in PP matrix, in function of η for μ = 0.35 with a maximum of Young’s modulus E m *   and minimum of Poisson ratio ν m * : (a) effective Young’s modulus   E m * ; and (b) effective Poisson’s ratio ν m * .
Jcs 07 00029 g018
Table 1. Mechanical properties of nanofillers in form of Hill’s elastic moduli.
k r   GPa l r   GPa m r   GPa n r   GPa p r   GPa
CNT5361841322143791
GNP8506.8369102,000102,000
Table 2. Mechanical properties of CNT and GNP in terms of engineering constants.
E 11 r
GPa
E 22 r = E 33 r
GPa
ν 23 r ν 12 r = ν 13 r G 23 r
GPa
G 12 r = G 13 r
GPa
CNT421.142079.80.171640.59522132791
GNP1029.204102,0000.0040.4369102,000
Table 3. Mechanical properties of polymers.
MaterialsPPUP
ModelElasticElastic
SymmetryIsotropicIsotropic
Density ρ (g/cm3) 0.91.3
Young’s modulus E (GPa)1.43.8
Poisson’s ratio v0.450.42
Table 4. Mechanical properties of CNT and GNP as inputs in Digimat MF.
Elastic PropertiesCNTGNP
Axial Young’s modulus (GPa) 2079.8102,000
In plane Young’s modulus (GPa) 421.141029.204
In plane Poisson’s ratio0.595220.4
Transverse Poisson’s ratio0.171640.004
Transverse shear modulus (GPa)791102,000
In plane shear modulus (GPa)132369
Density (g/cm3)1.22.2
Table 5. Mechanical properties of isotropic fibers.
MaterialsAlfaE-Glass
ModelElasticElastic
SymmetryIsotropicIsotropic
Density ρ (g/cm3) 1.522.54
Young’s modulus E (GPa) 19.473
Poisson’s ratio v0.340.23
Table 6. Mechanical properties used in the Matlab code and Digimat MF for CNT and GNP.
CNTGNP
Axial Young’s modulus (GPa)2079.8102,000
In plane Young’s modulus (GPa) 421.141029.204
In plane Poisson’s ratio0.595220.4
Transverse Poisson’s ratio0.171640.004
Transverse shear modulus (GPa)791102,000
In plane shear modulus (GPa)132369
Density (g/cm3) 1.22.2
Disclaimer/Publisher’s Note: The statements, opinions and data contained in all publications are solely those of the individual author(s) and contributor(s) and not of MDPI and/or the editor(s). MDPI and/or the editor(s) disclaim responsibility for any injury to people or property resulting from any ideas, methods, instructions or products referred to in the content.

