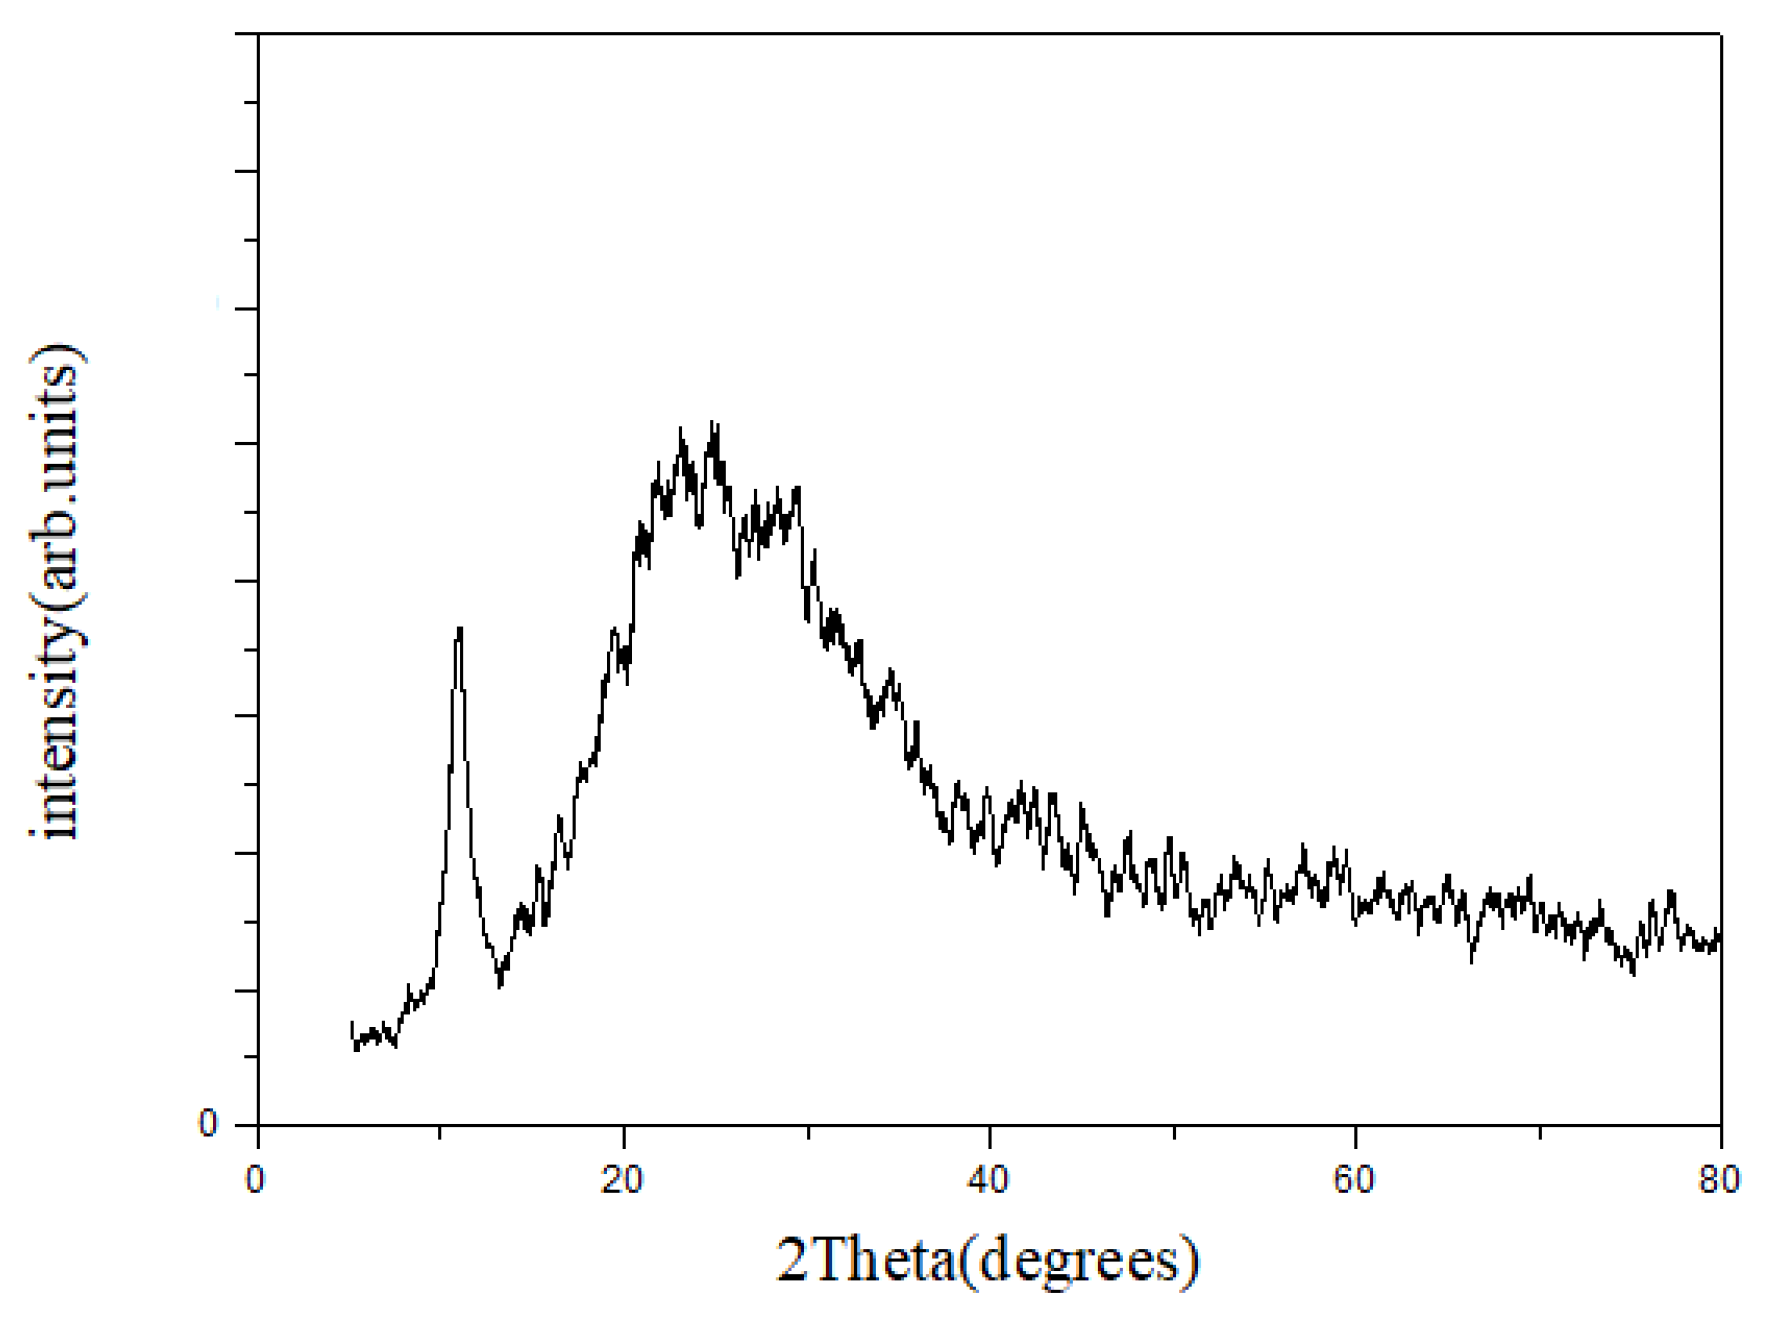
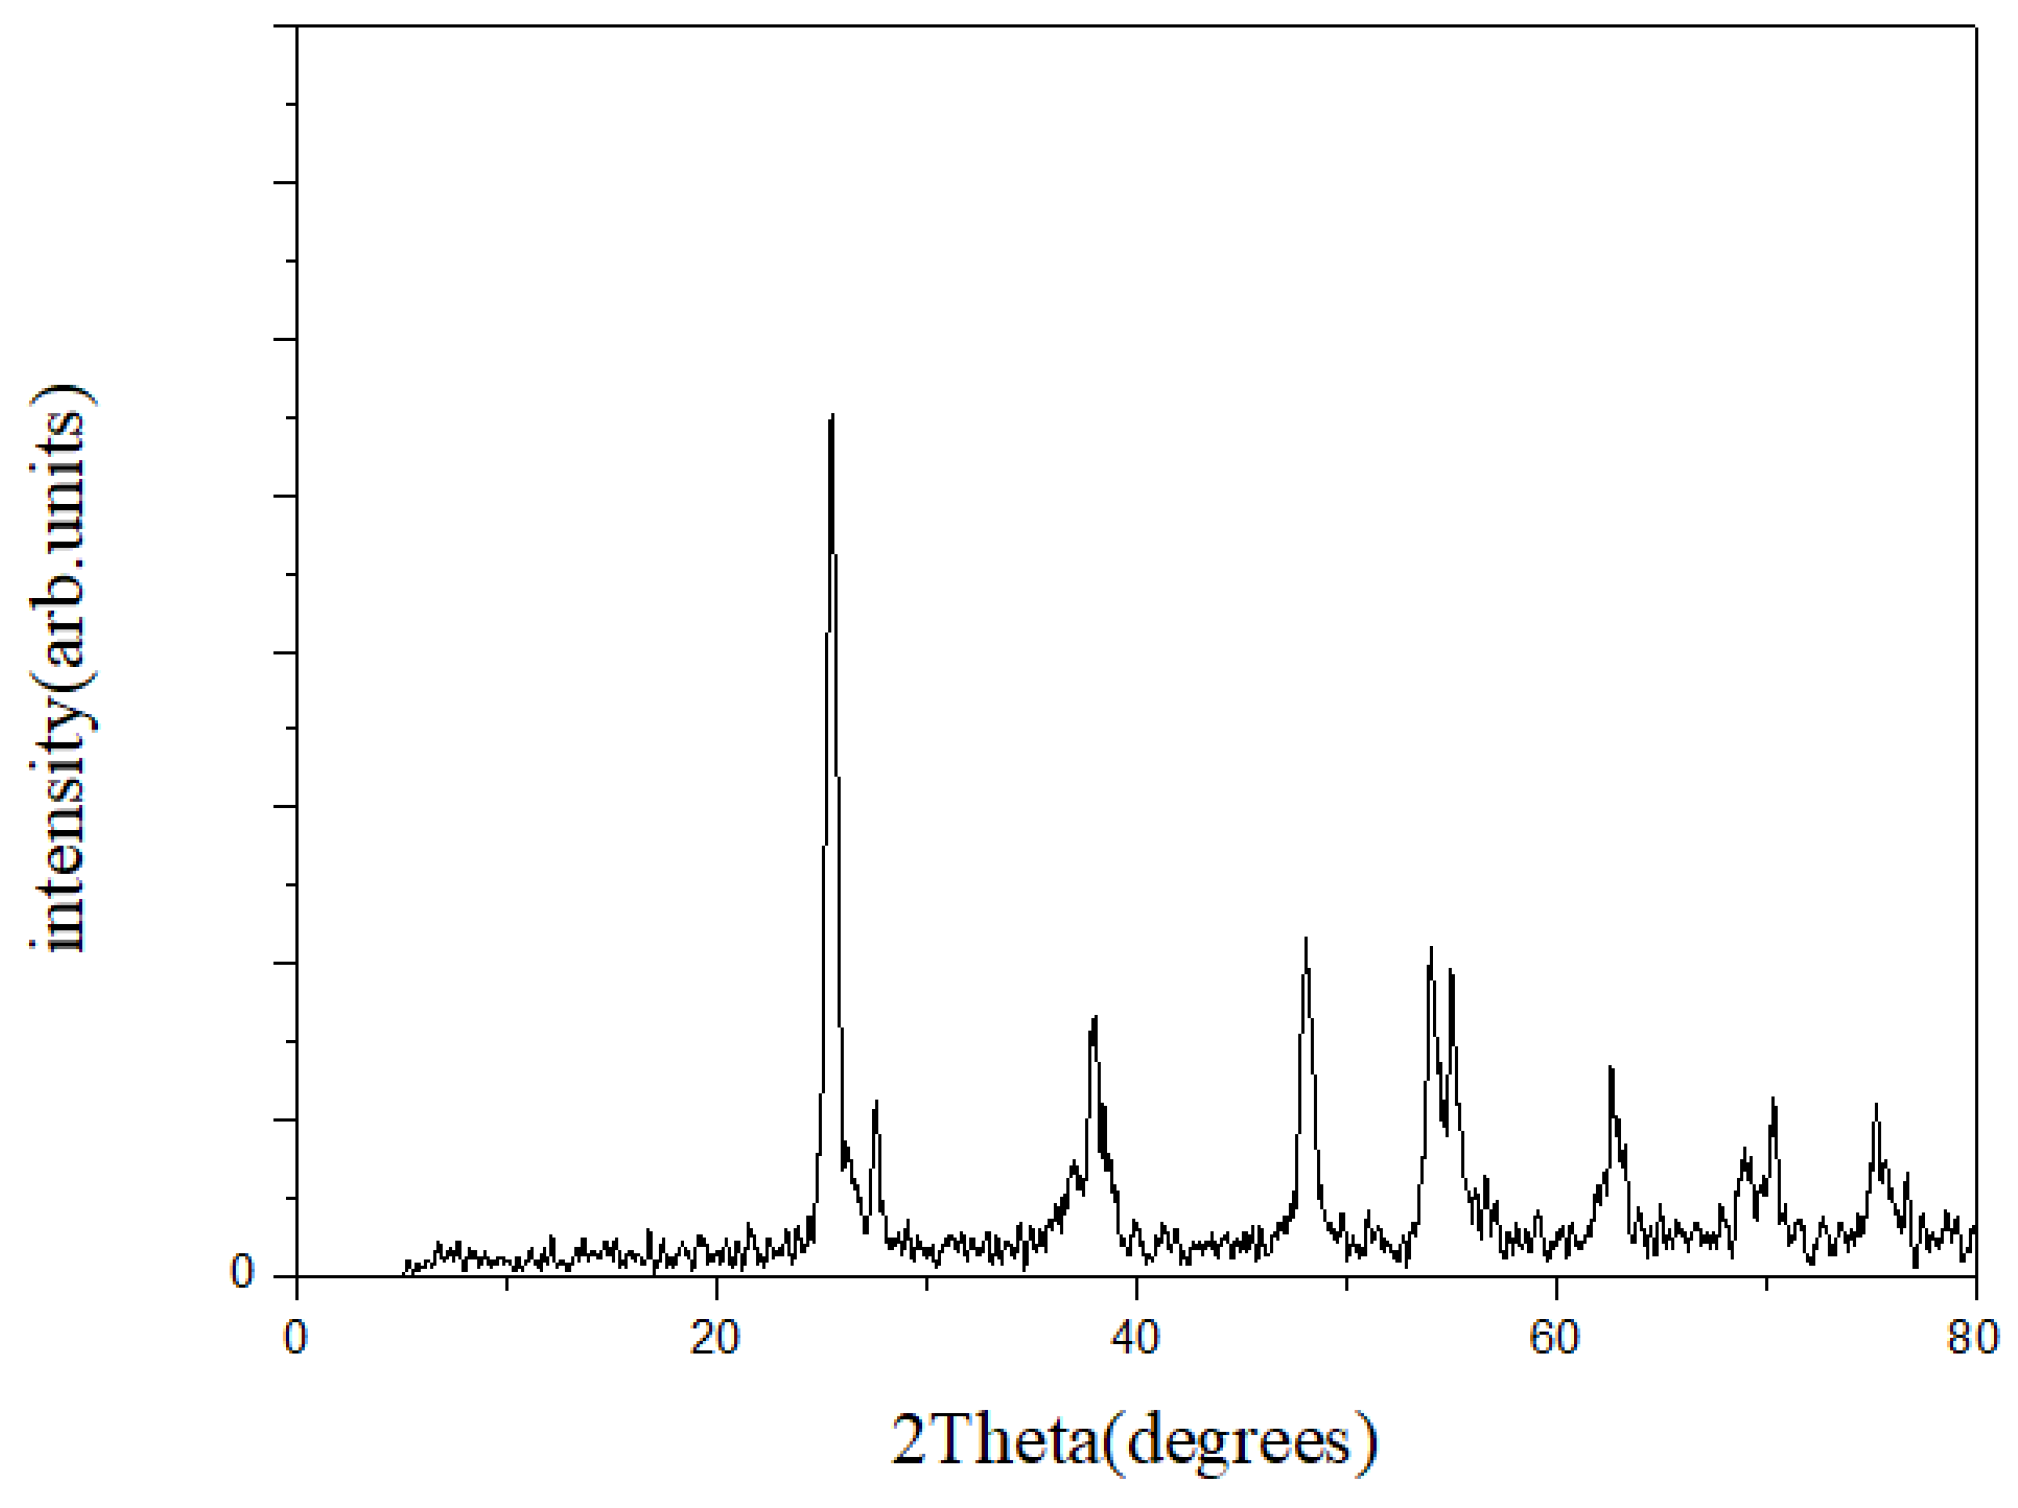
Figure 1.
X-ray diffractometer (XRD) of graphene oxide.
Figure 1.
X-ray diffractometer (XRD) of graphene oxide.
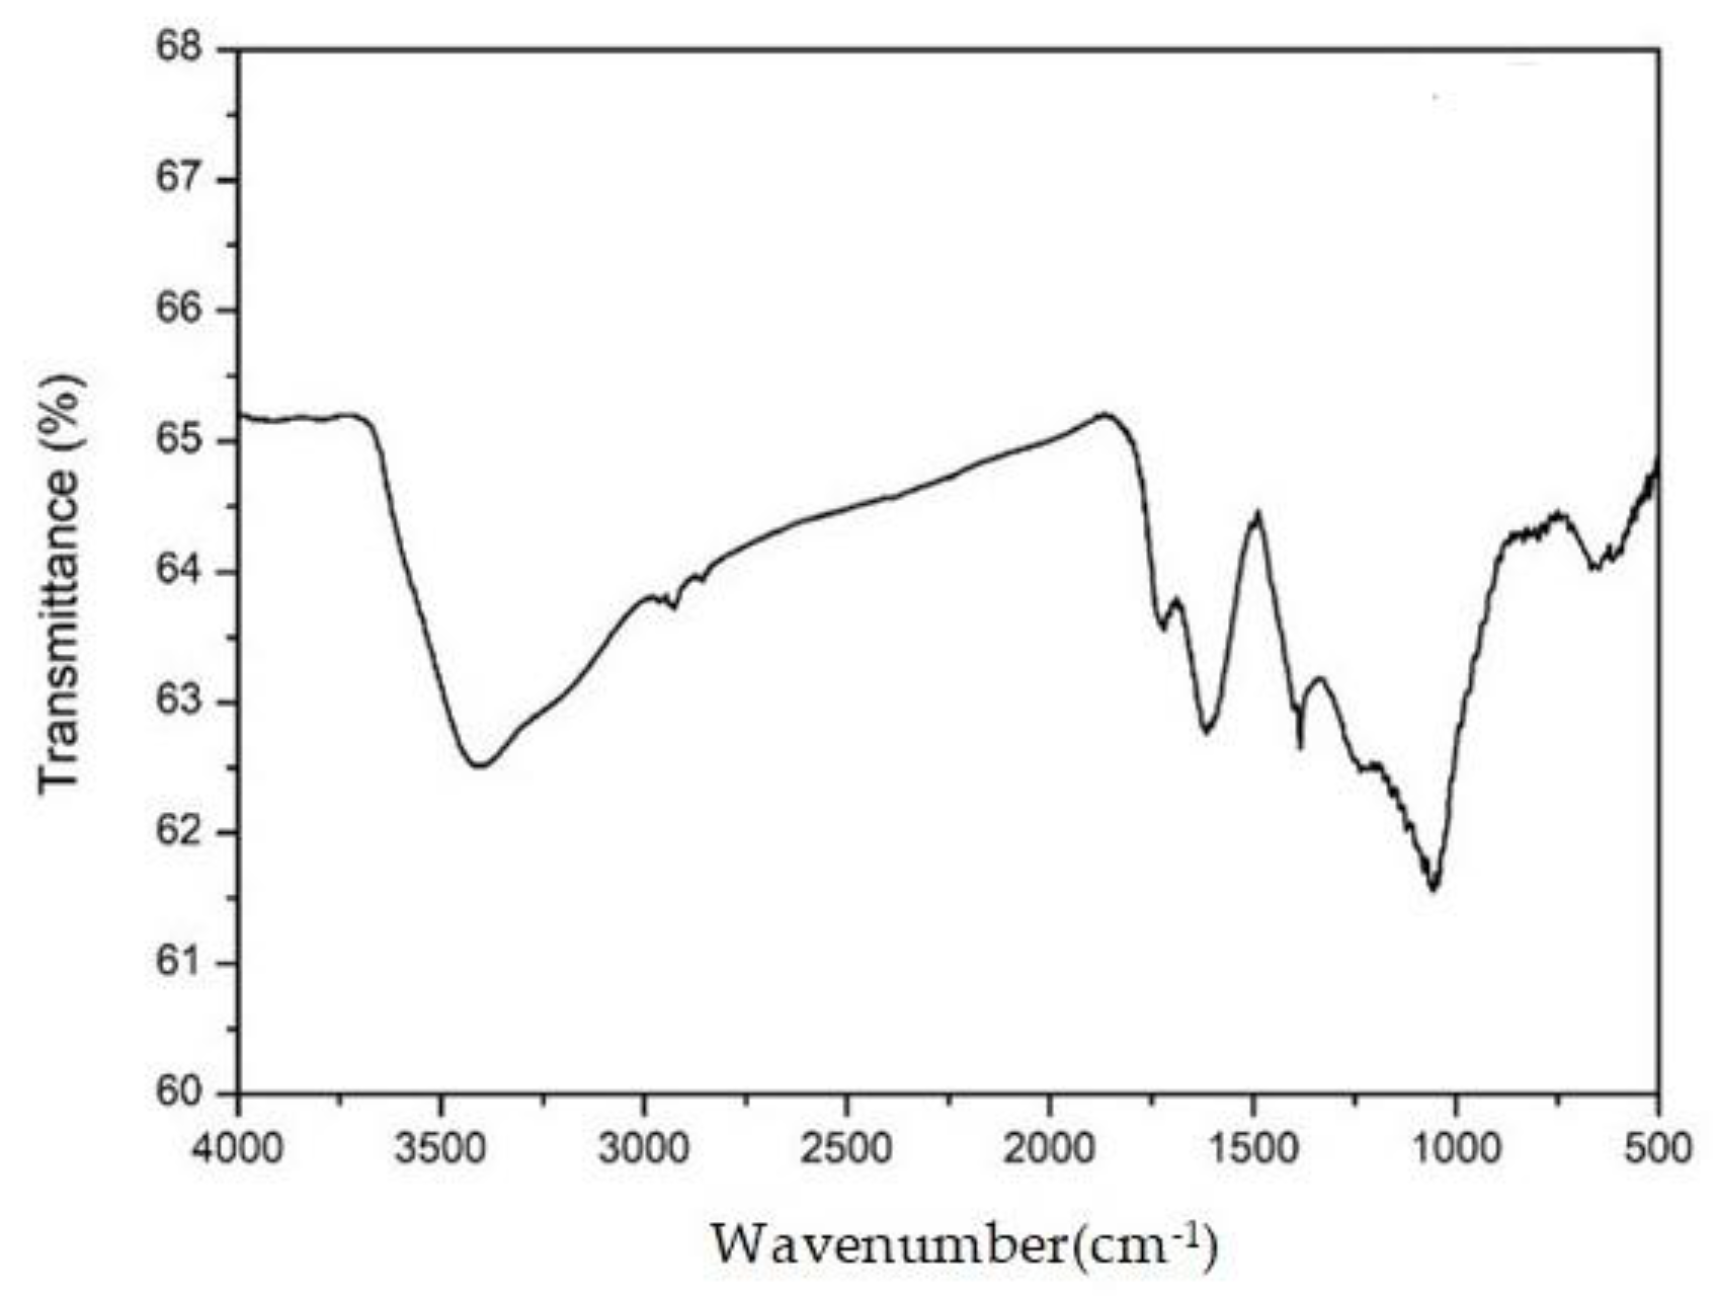
Figure 2.
Fourier-transform infrared spectroscopy (FT-IR) of graphene oxide.
Figure 2.
Fourier-transform infrared spectroscopy (FT-IR) of graphene oxide.
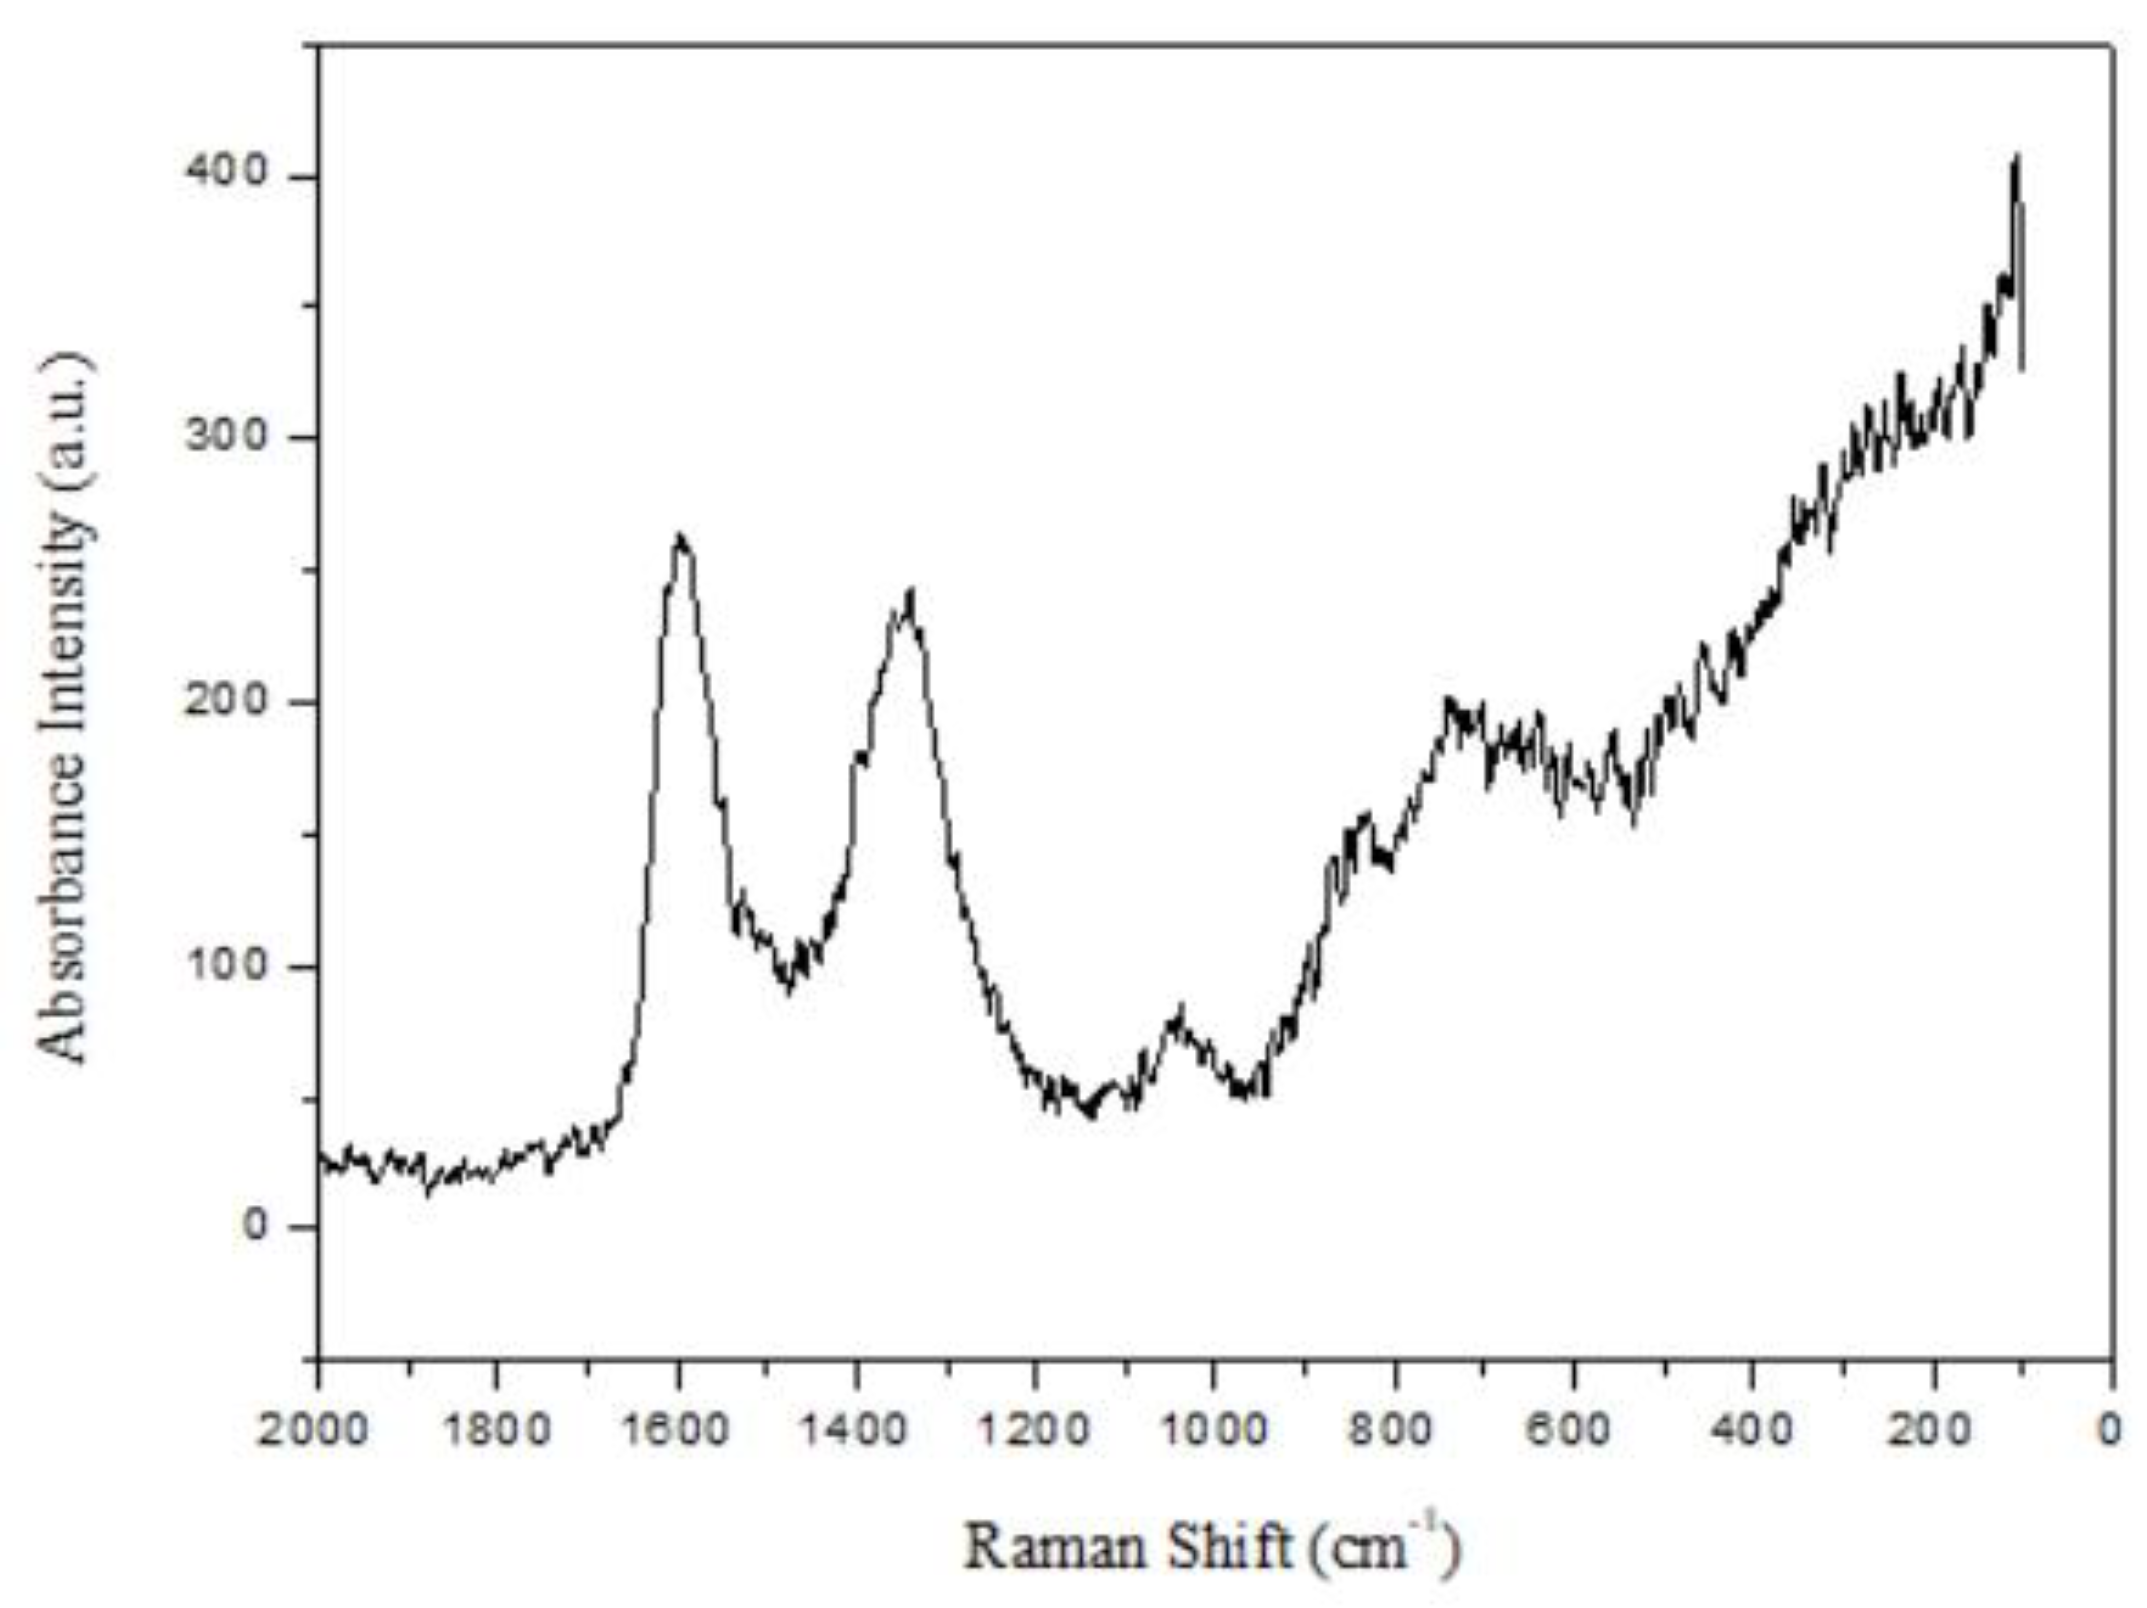
Figure 3.
Raman spectroscopy (Raman) of graphene oxide.
Figure 3.
Raman spectroscopy (Raman) of graphene oxide.
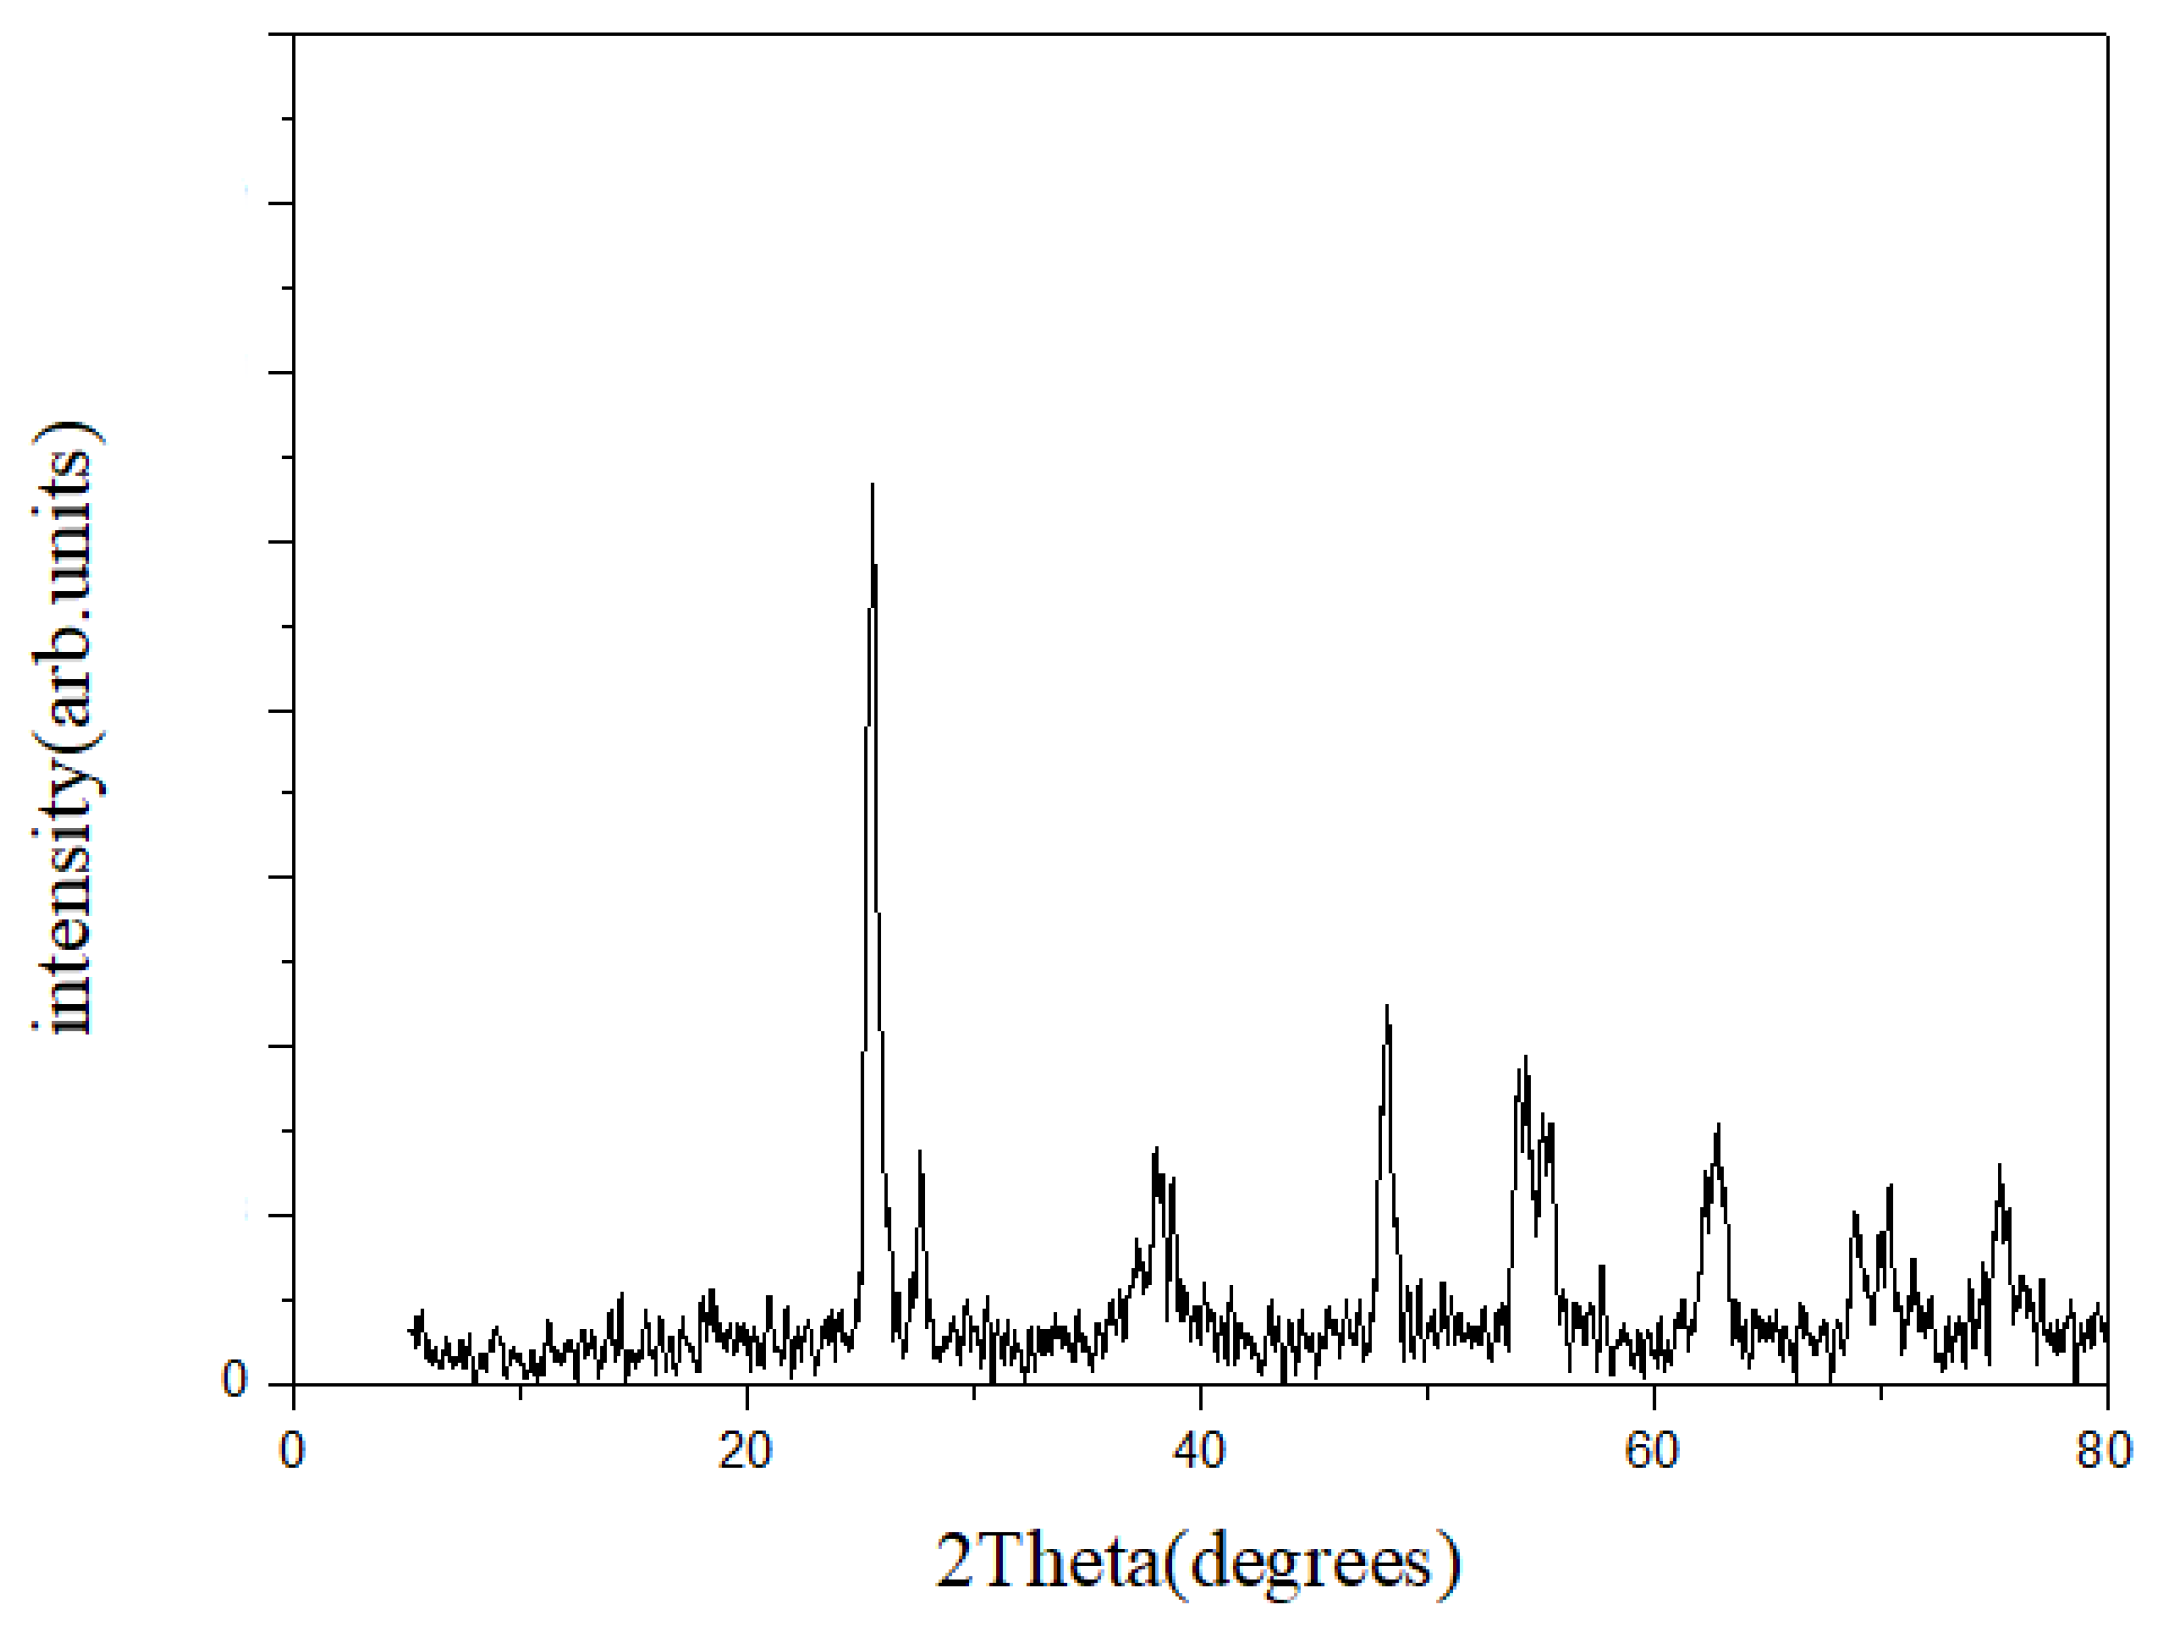
Figure 4.
XRD of P25/ZrO2.
Figure 4.
XRD of P25/ZrO2.
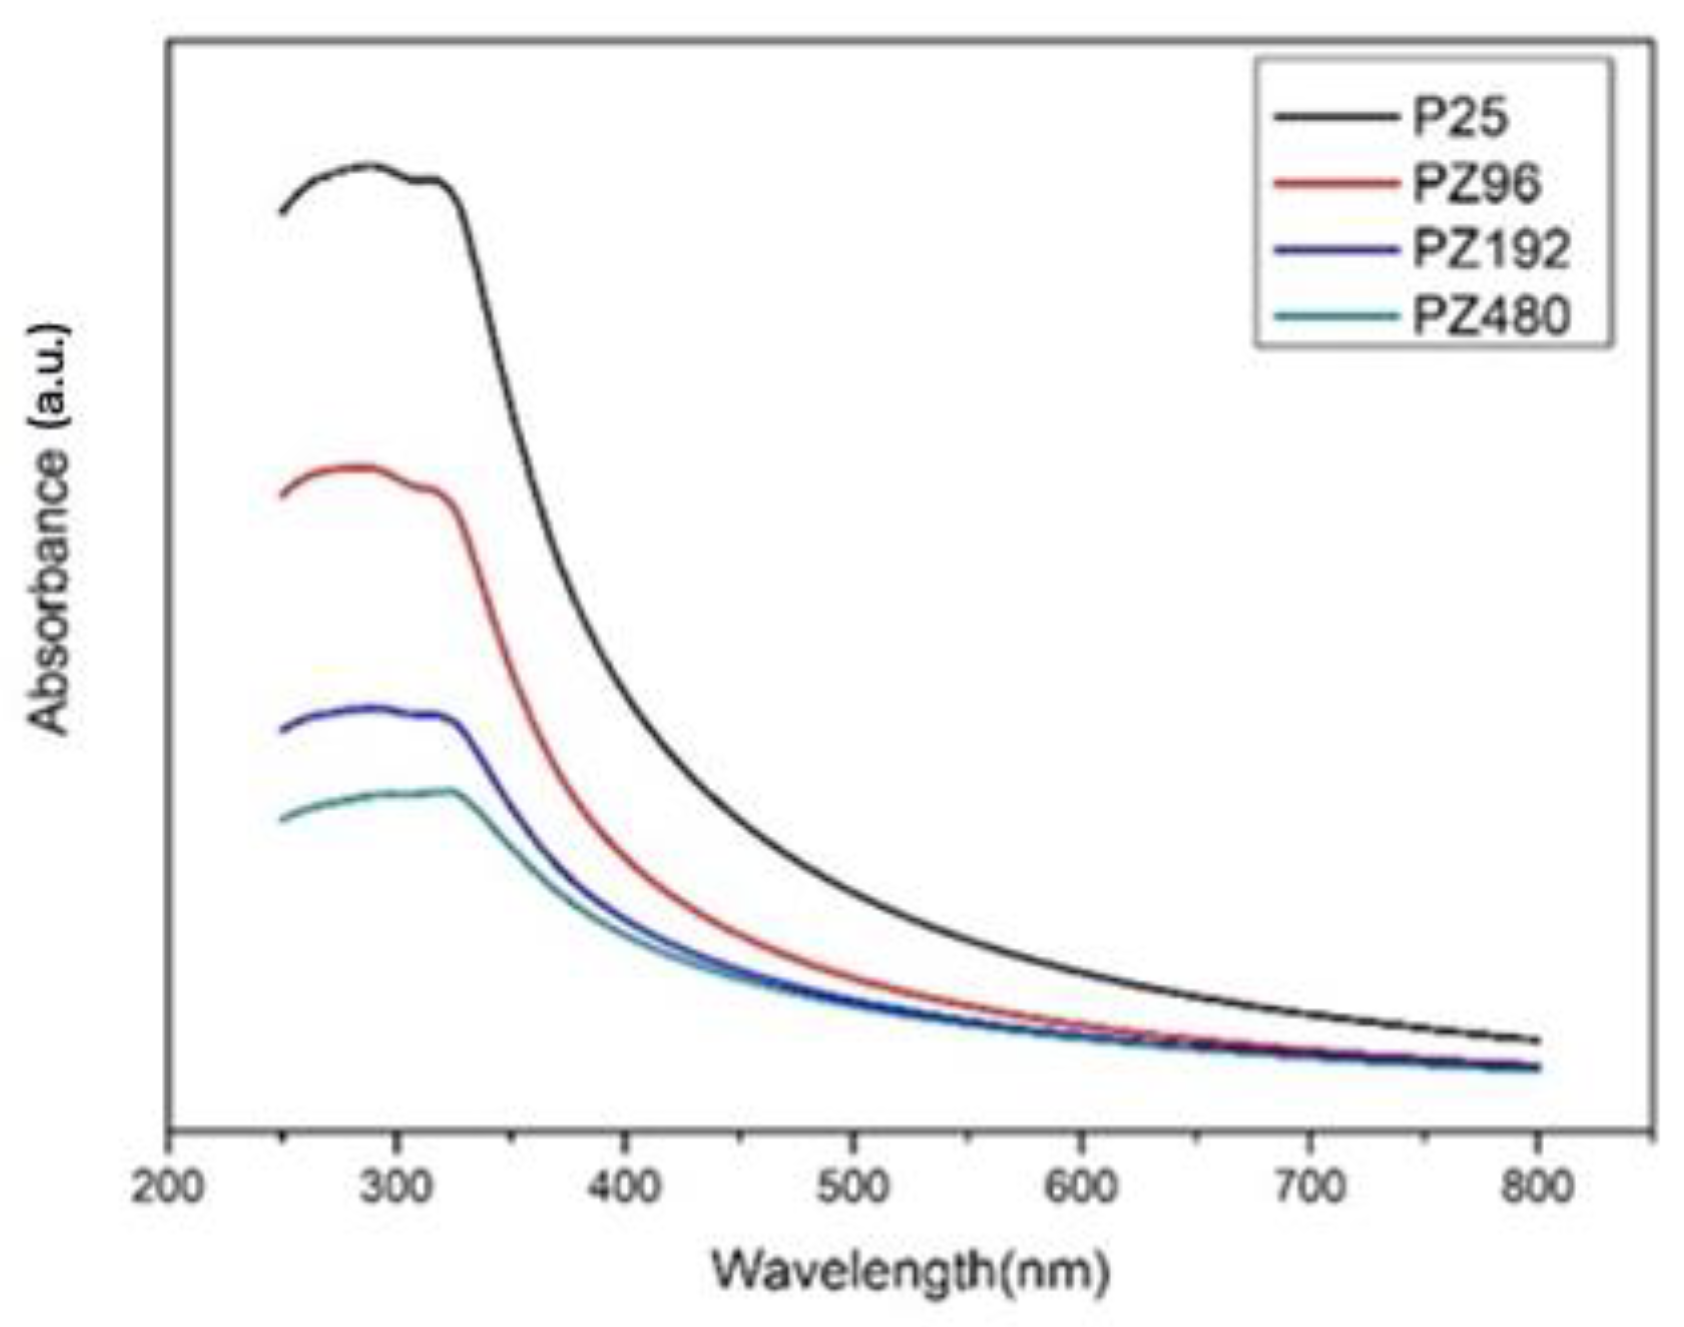
Figure 5.
UV-Vis of various ratios of P25/ZrO2.
Figure 5.
UV-Vis of various ratios of P25/ZrO2.
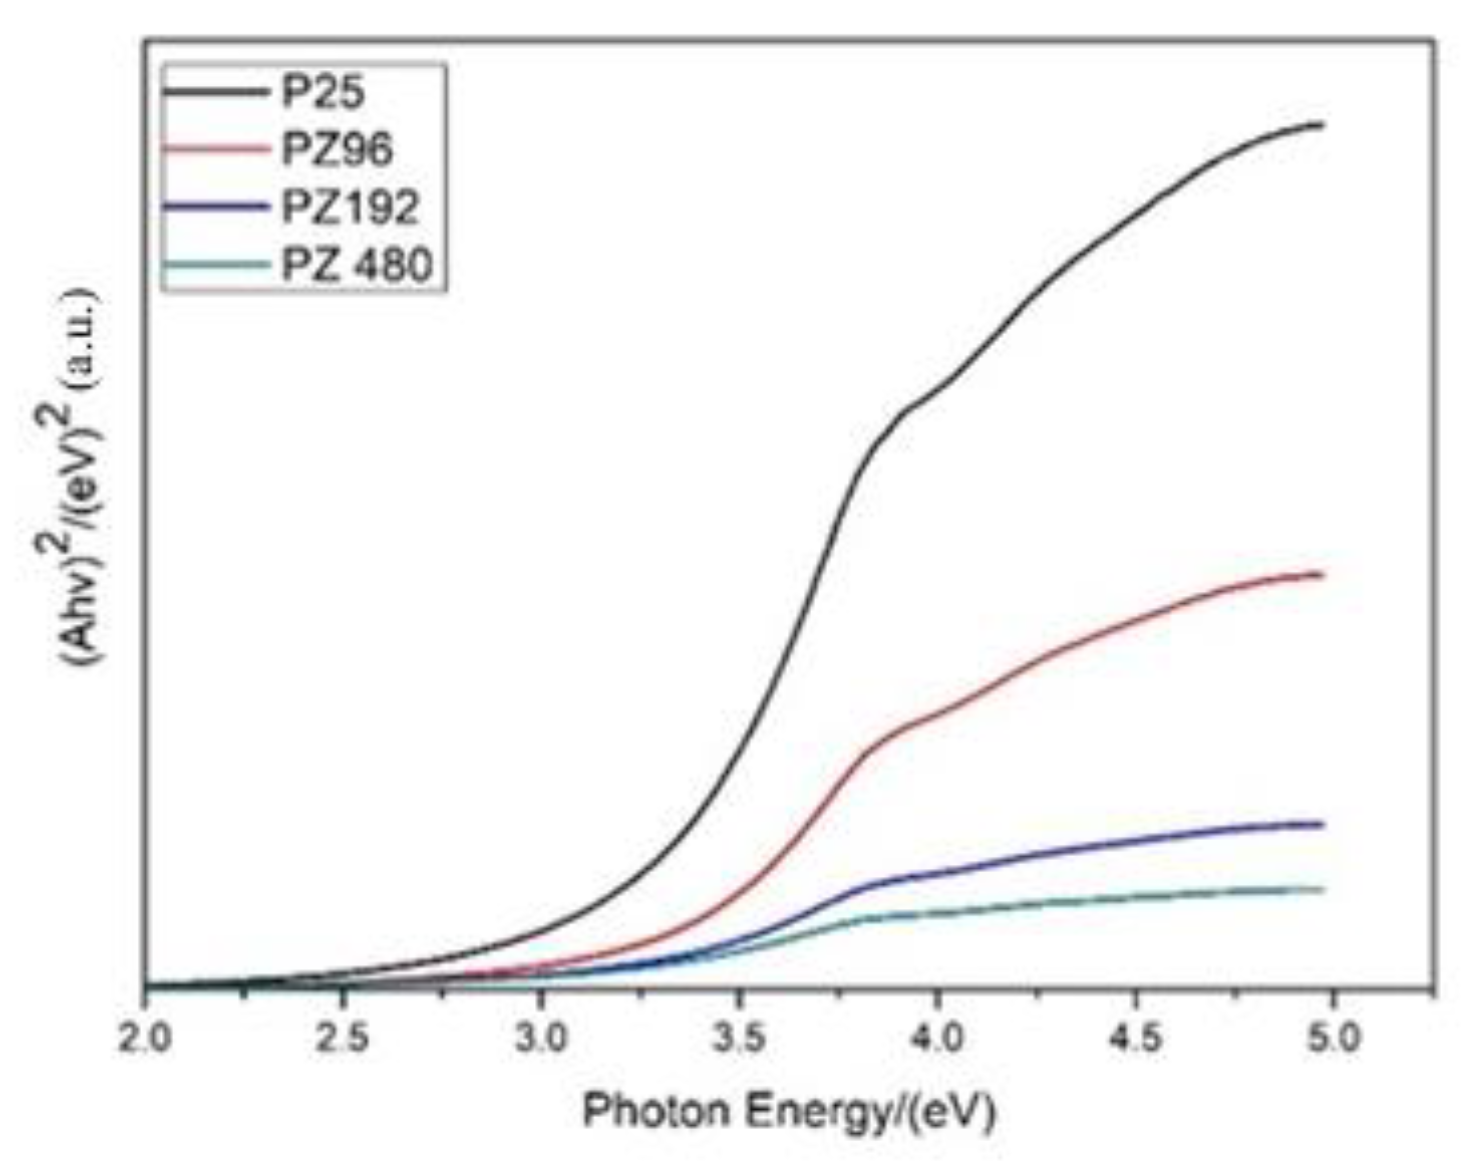
Figure 6.
Energy gap analysis of various ratios of P25/ZrO2.
Figure 6.
Energy gap analysis of various ratios of P25/ZrO2.
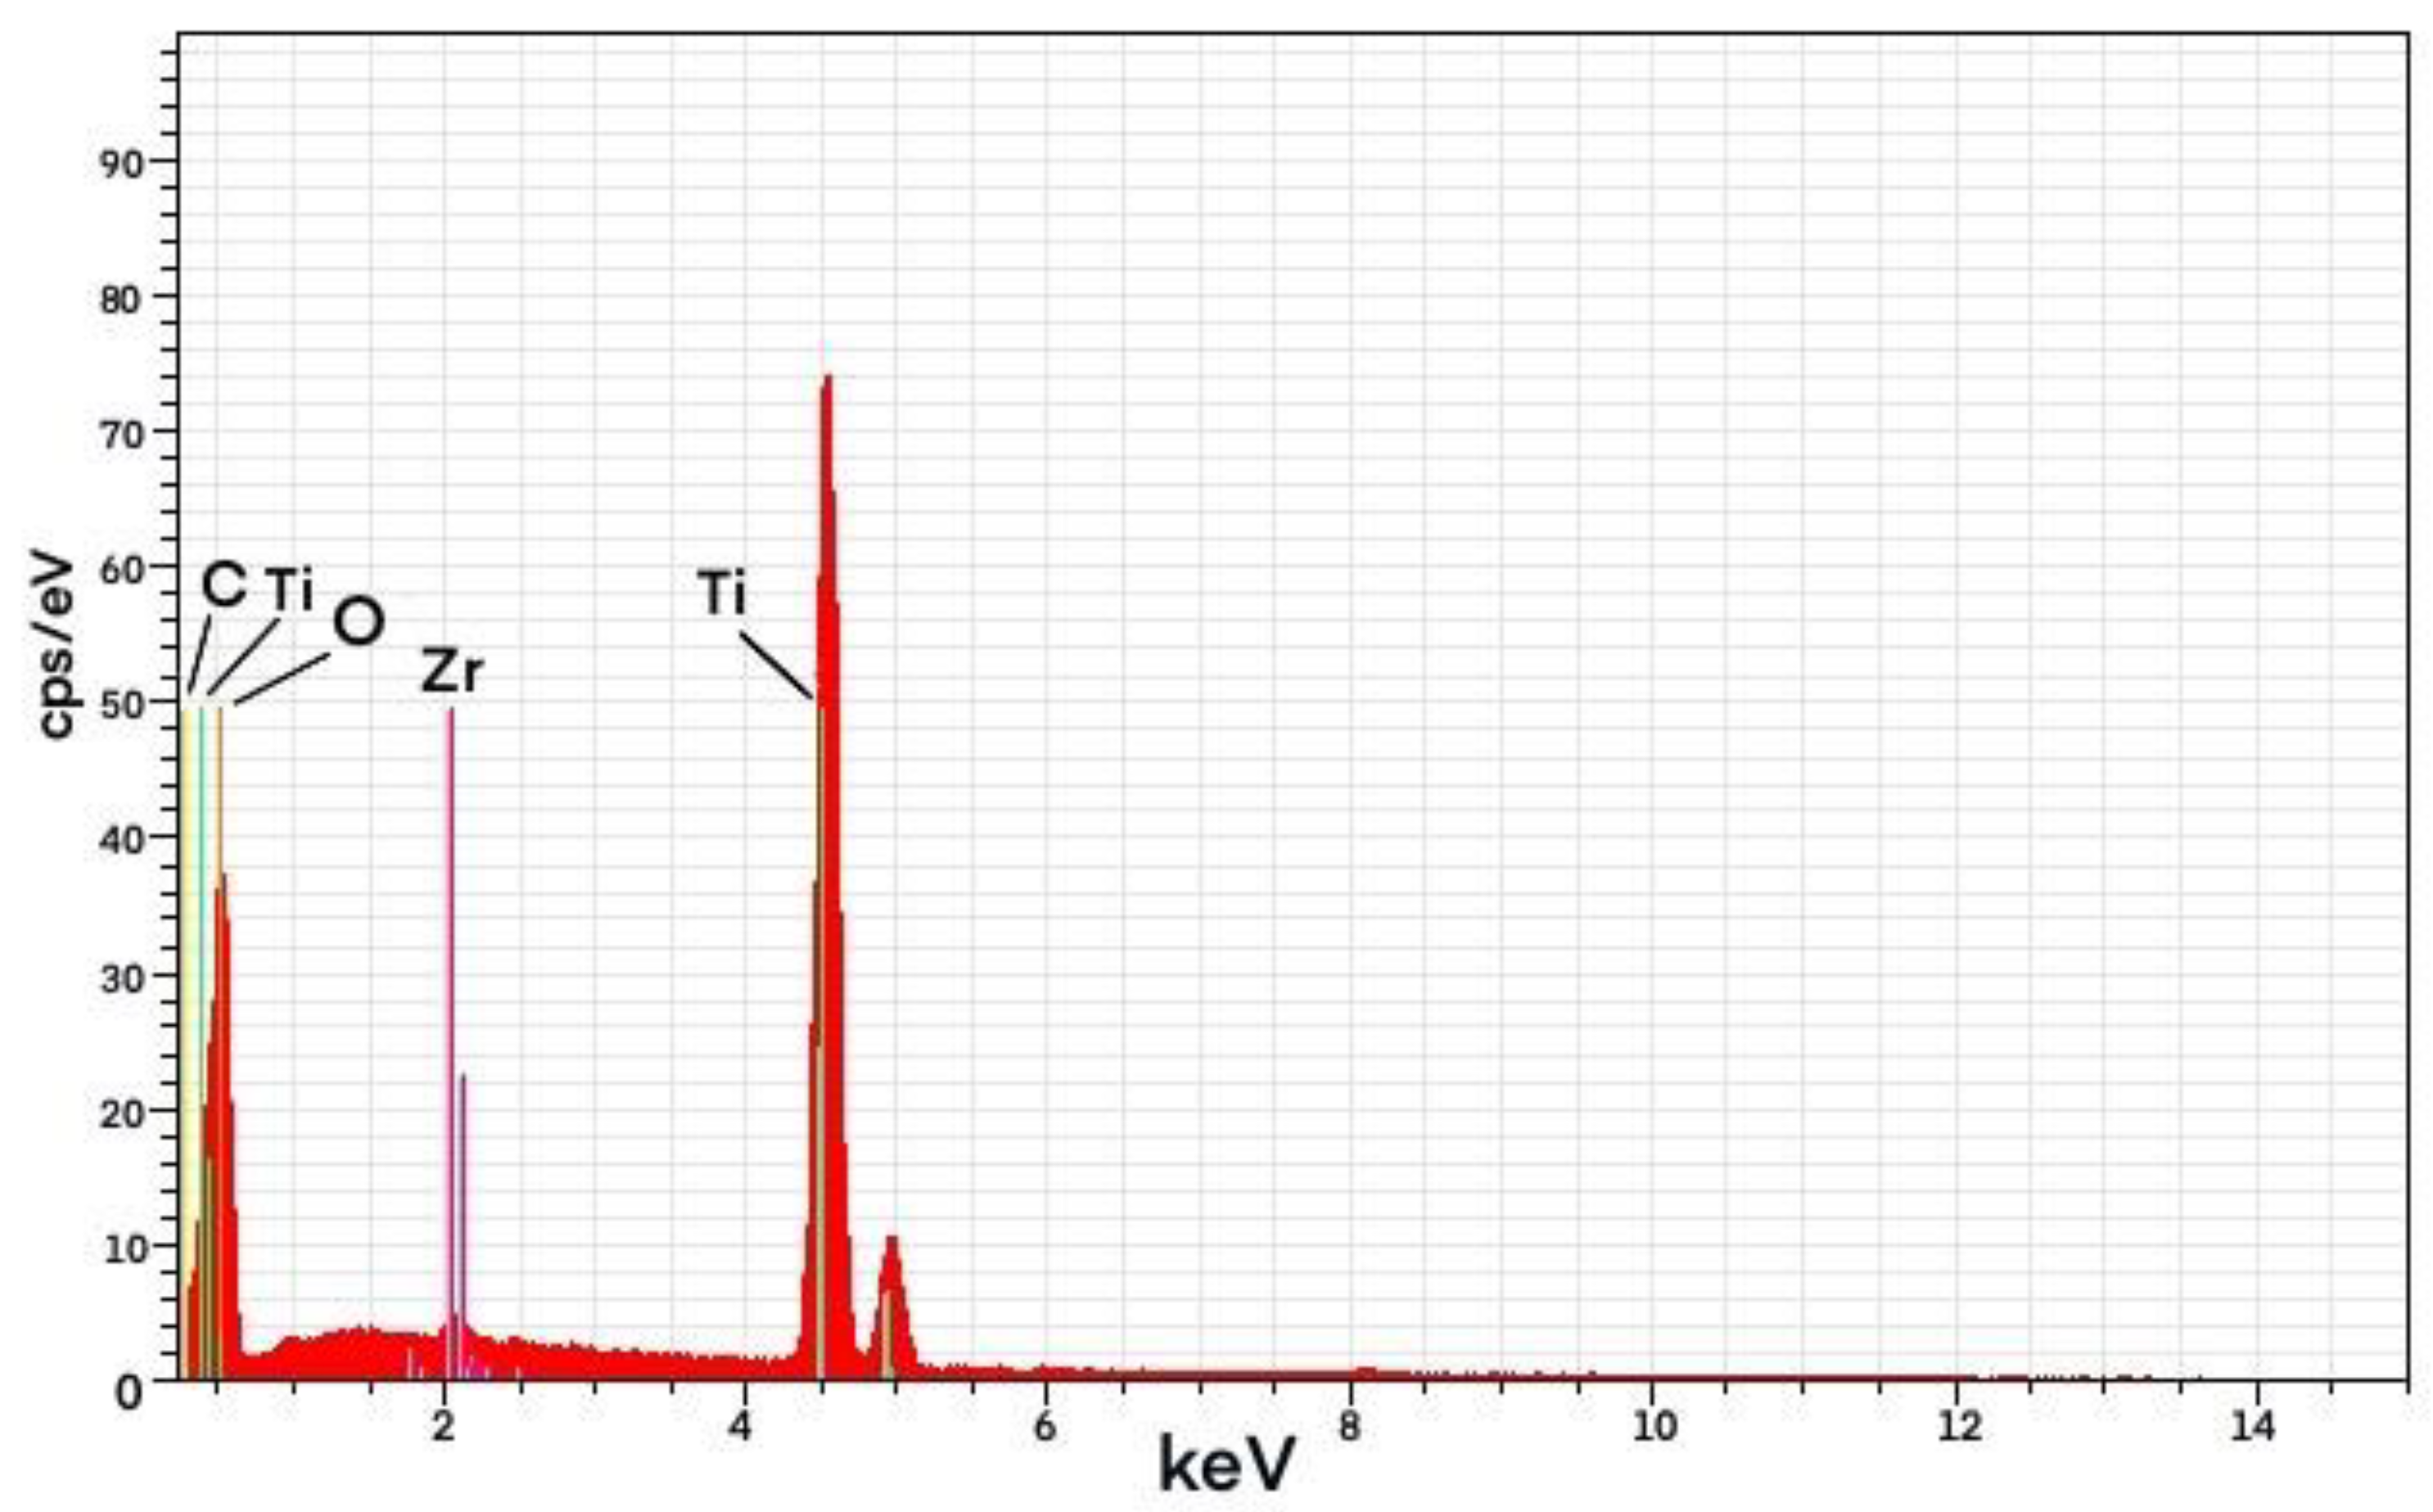
Figure 7.
Energy-dispersive X-ray spectroscopy (EDS) spectrum of PZ96 Photocatalyst.
Figure 7.
Energy-dispersive X-ray spectroscopy (EDS) spectrum of PZ96 Photocatalyst.
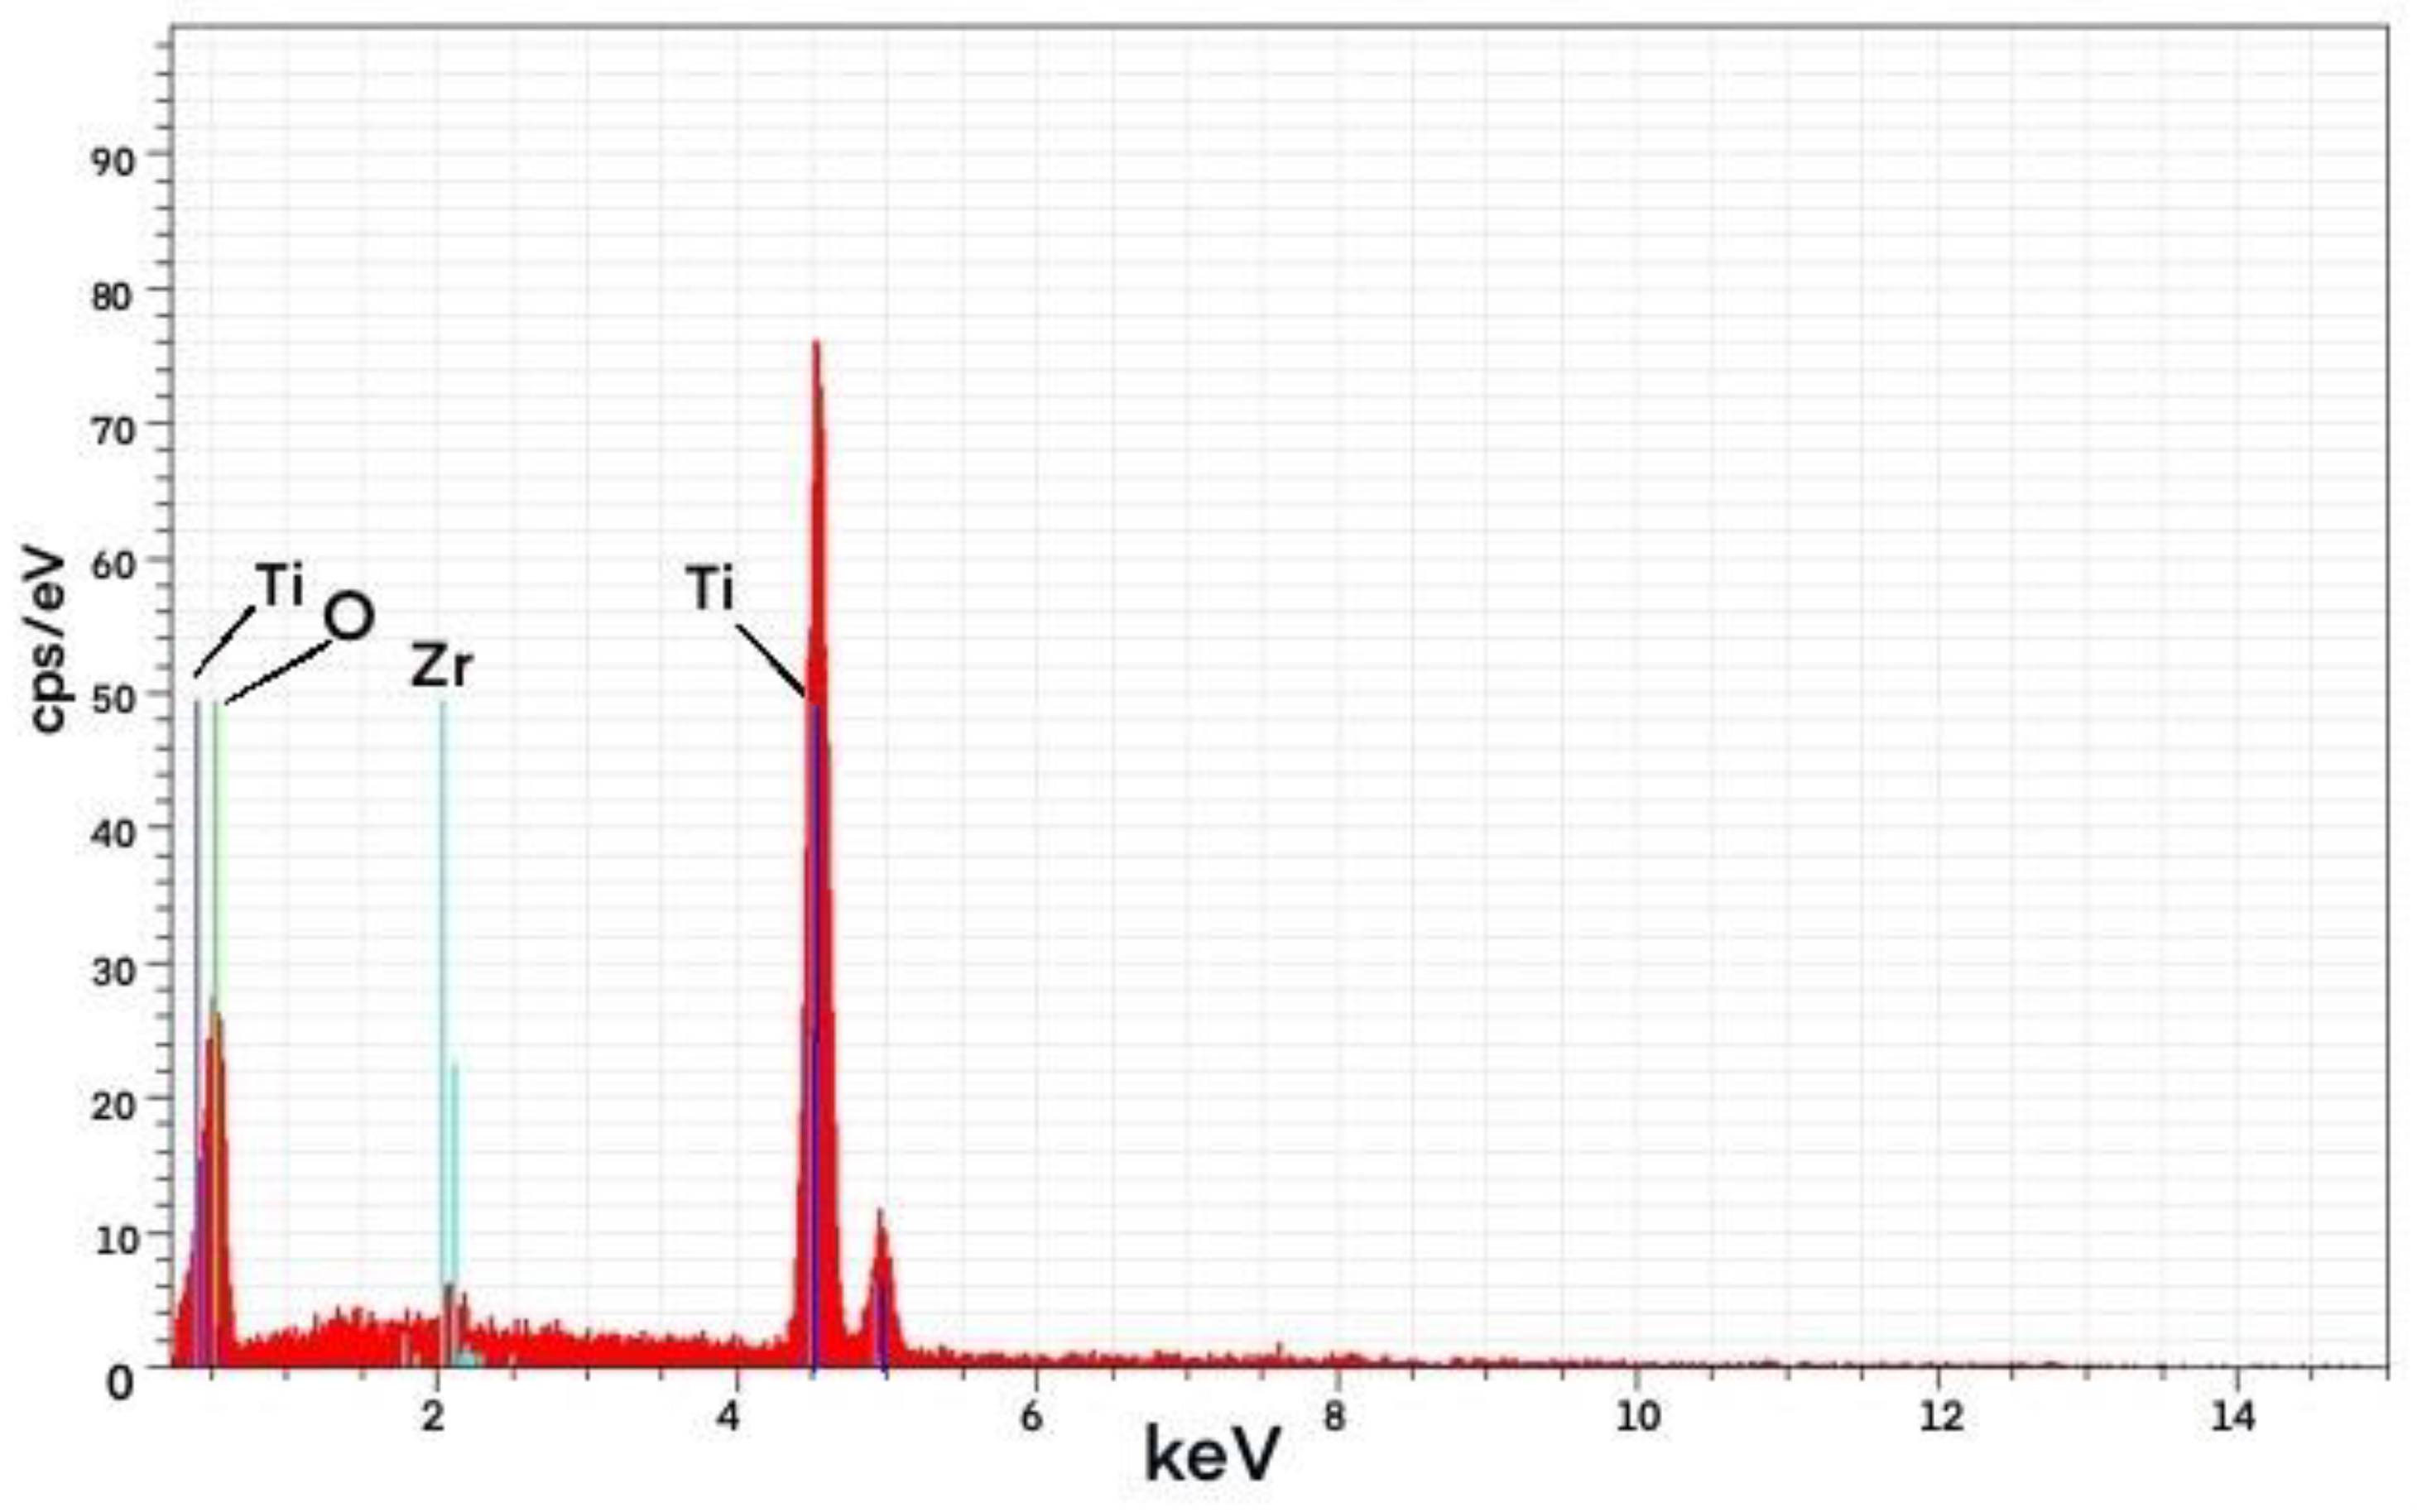
Figure 8.
EDS spectrum of PZ192 Photocatalyst.
Figure 8.
EDS spectrum of PZ192 Photocatalyst.
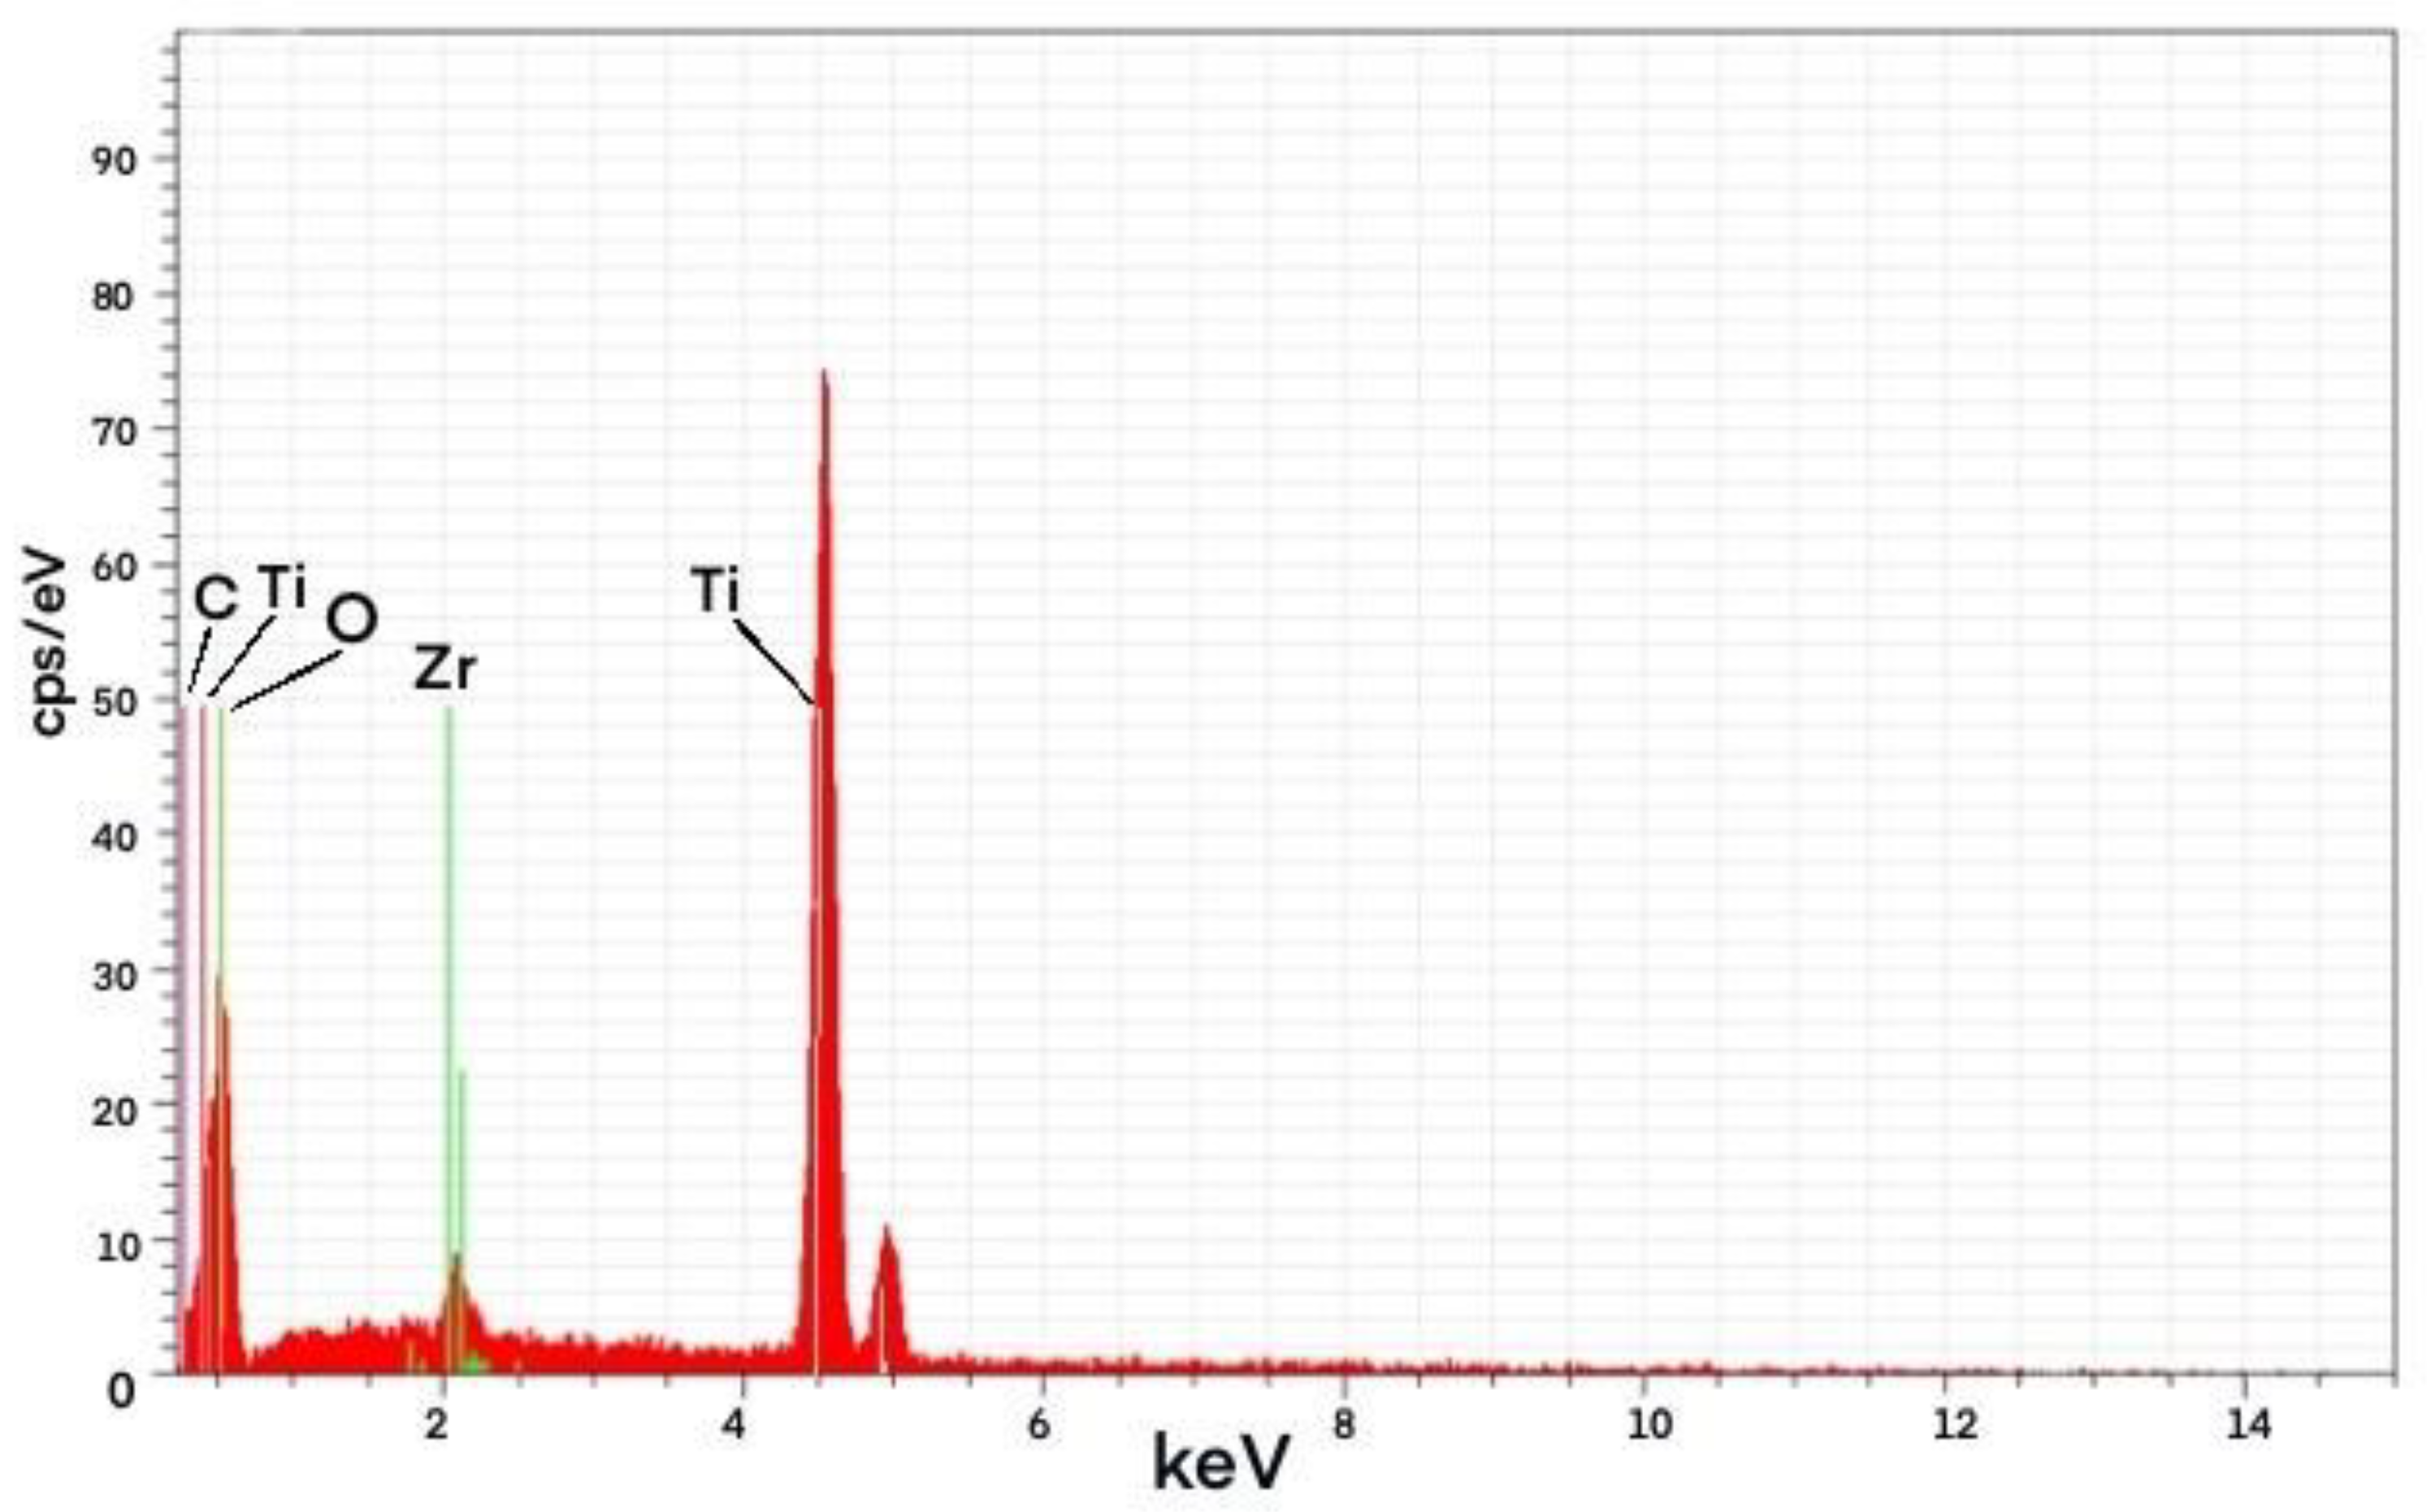
Figure 9.
EDS spectrum of PZ480 Photocatalyst.
Figure 9.
EDS spectrum of PZ480 Photocatalyst.
Figure 10.
XRD analysis of P25/ZrO2/GO.
Figure 10.
XRD analysis of P25/ZrO2/GO.
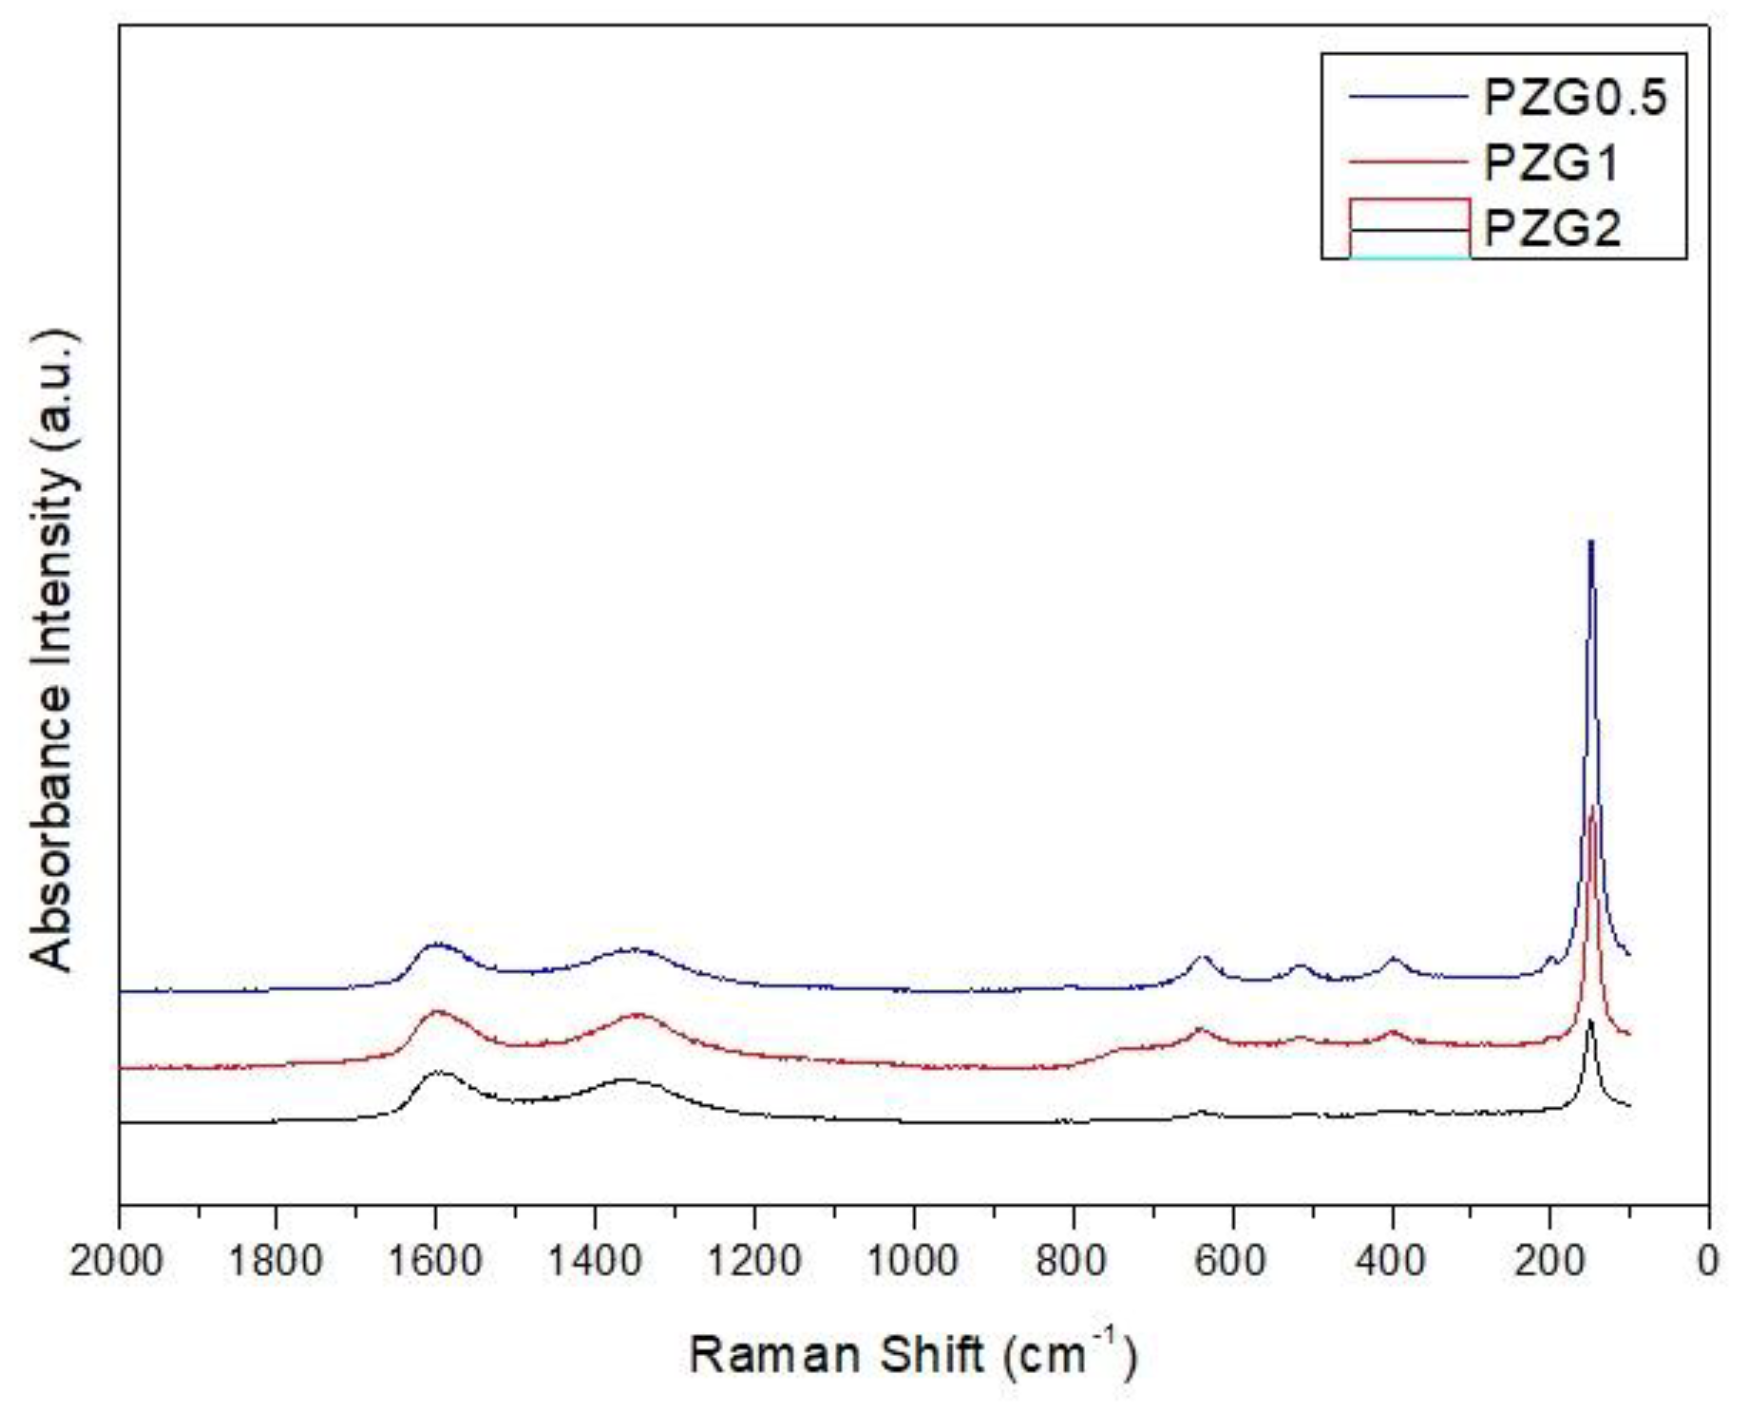
Figure 11.
Raman analysis of PZG0.5, PZG1 and PZG2.
Figure 11.
Raman analysis of PZG0.5, PZG1 and PZG2.
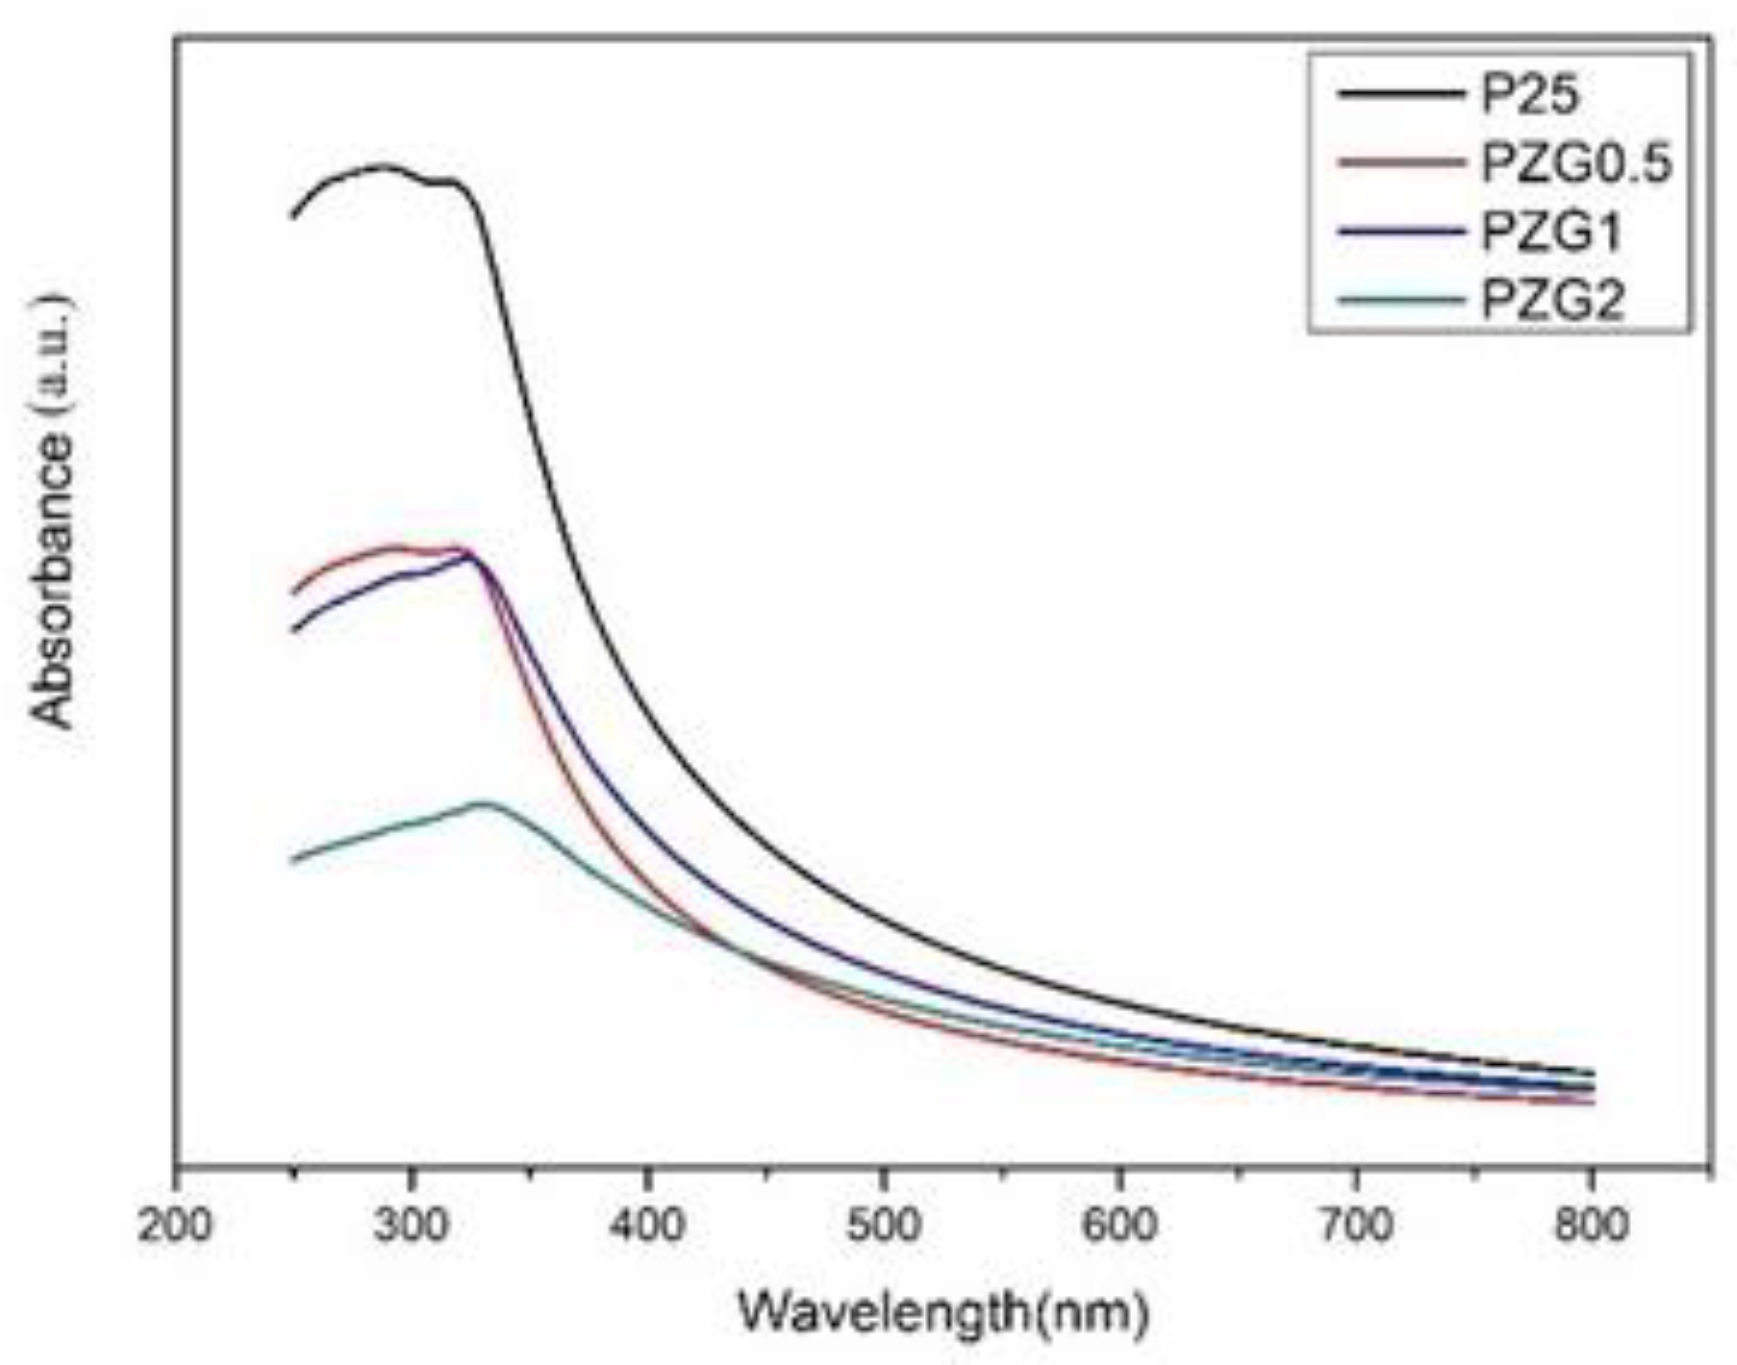
Figure 12.
UV-Vis analysis of P25/ZrO2/GO.
Figure 12.
UV-Vis analysis of P25/ZrO2/GO.
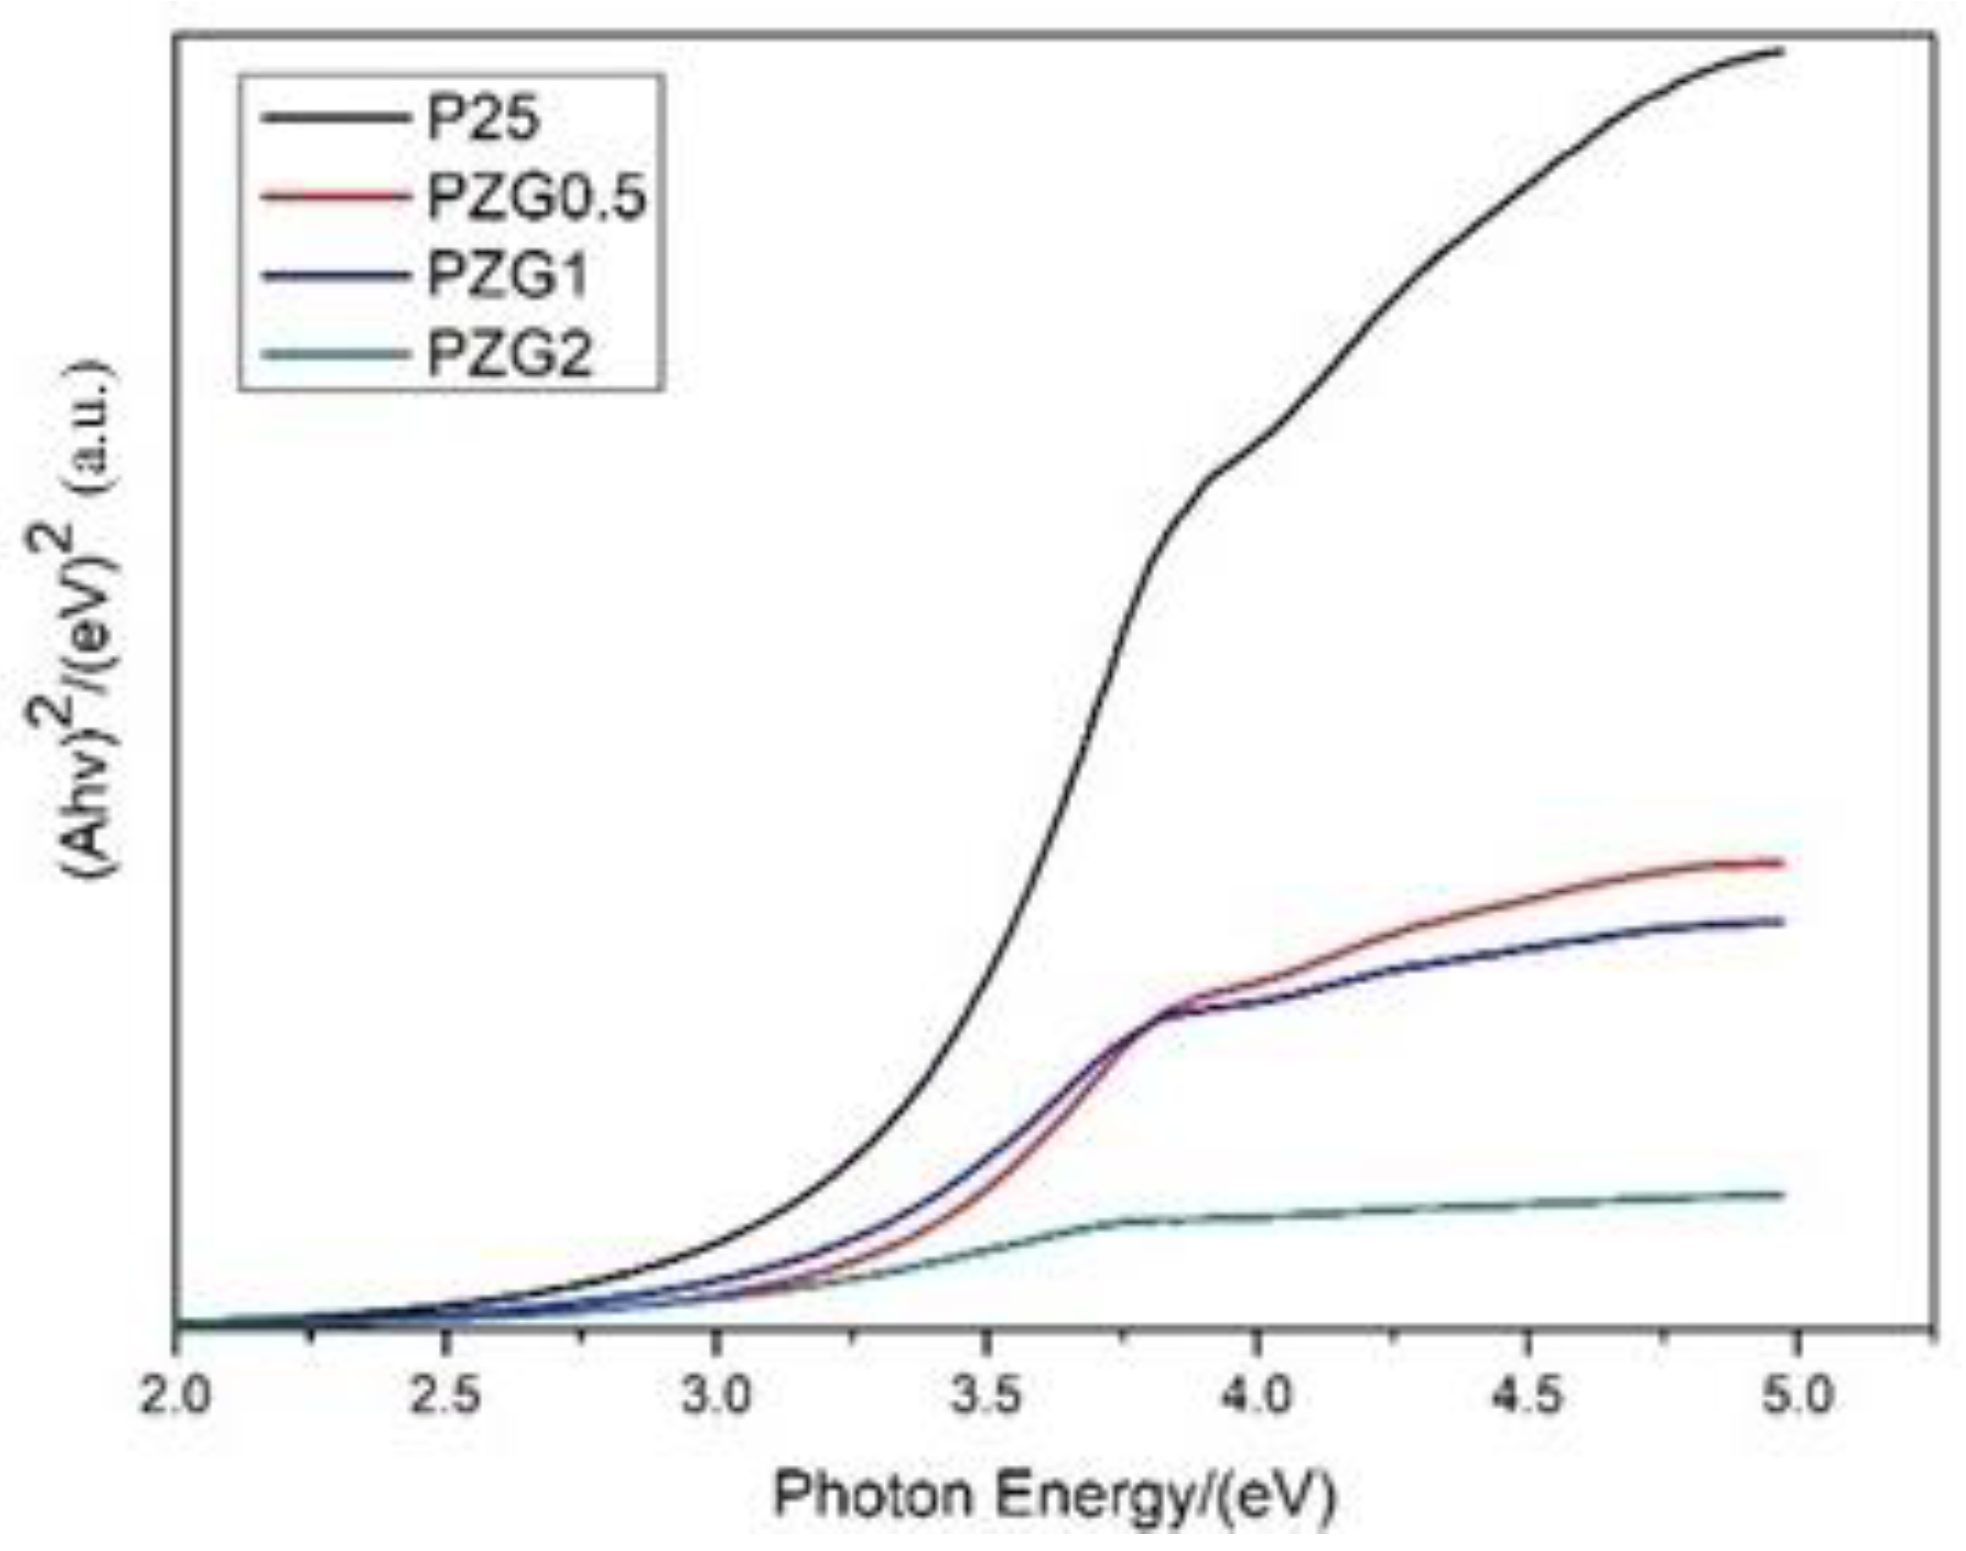
Figure 13.
Energy gap analysis of P25/ZrO2/GO.
Figure 13.
Energy gap analysis of P25/ZrO2/GO.
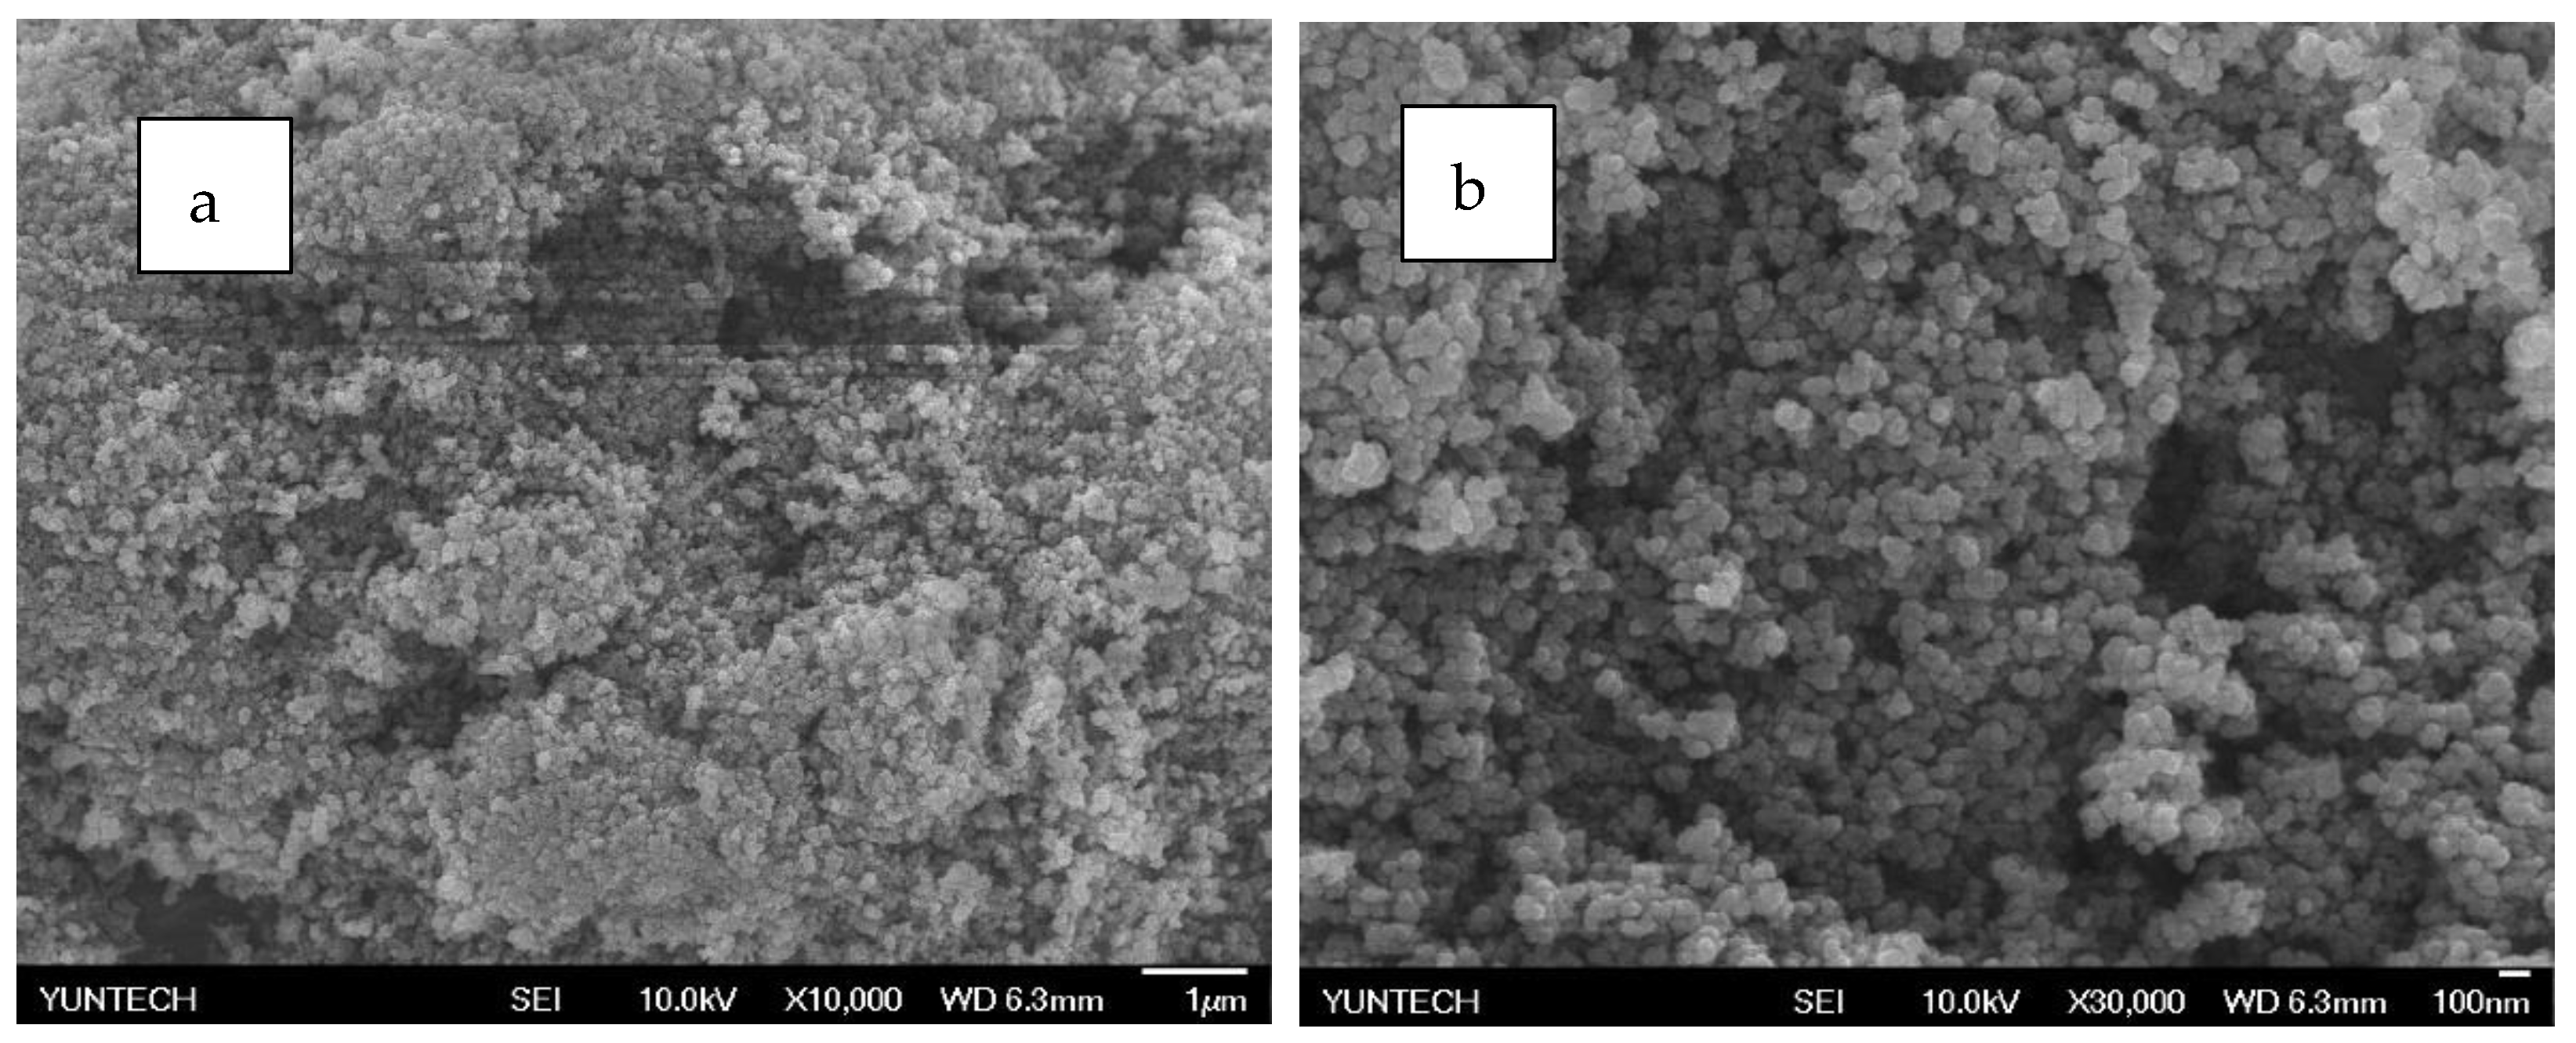
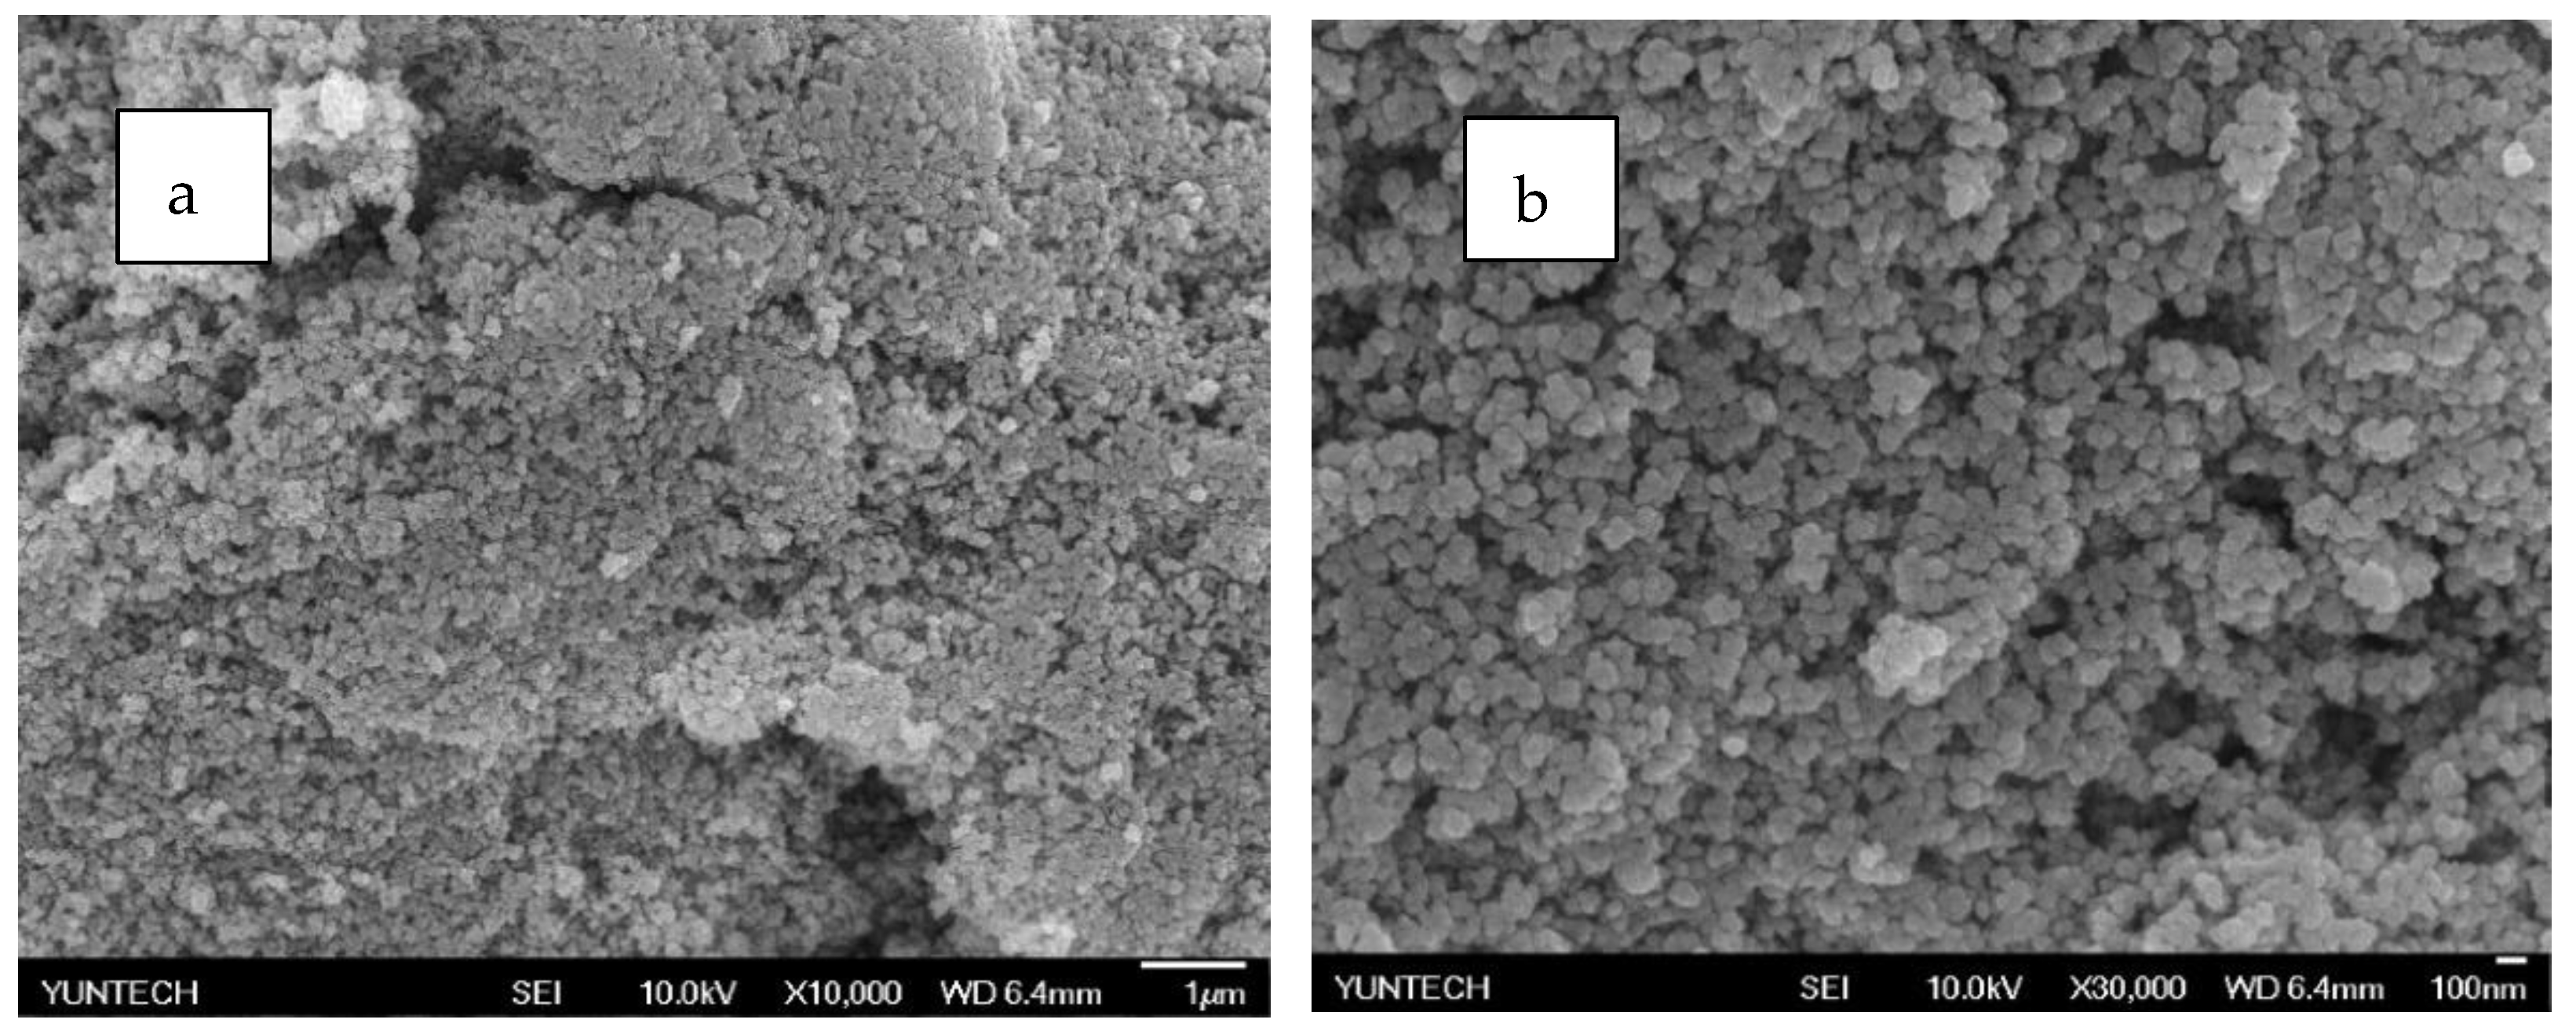
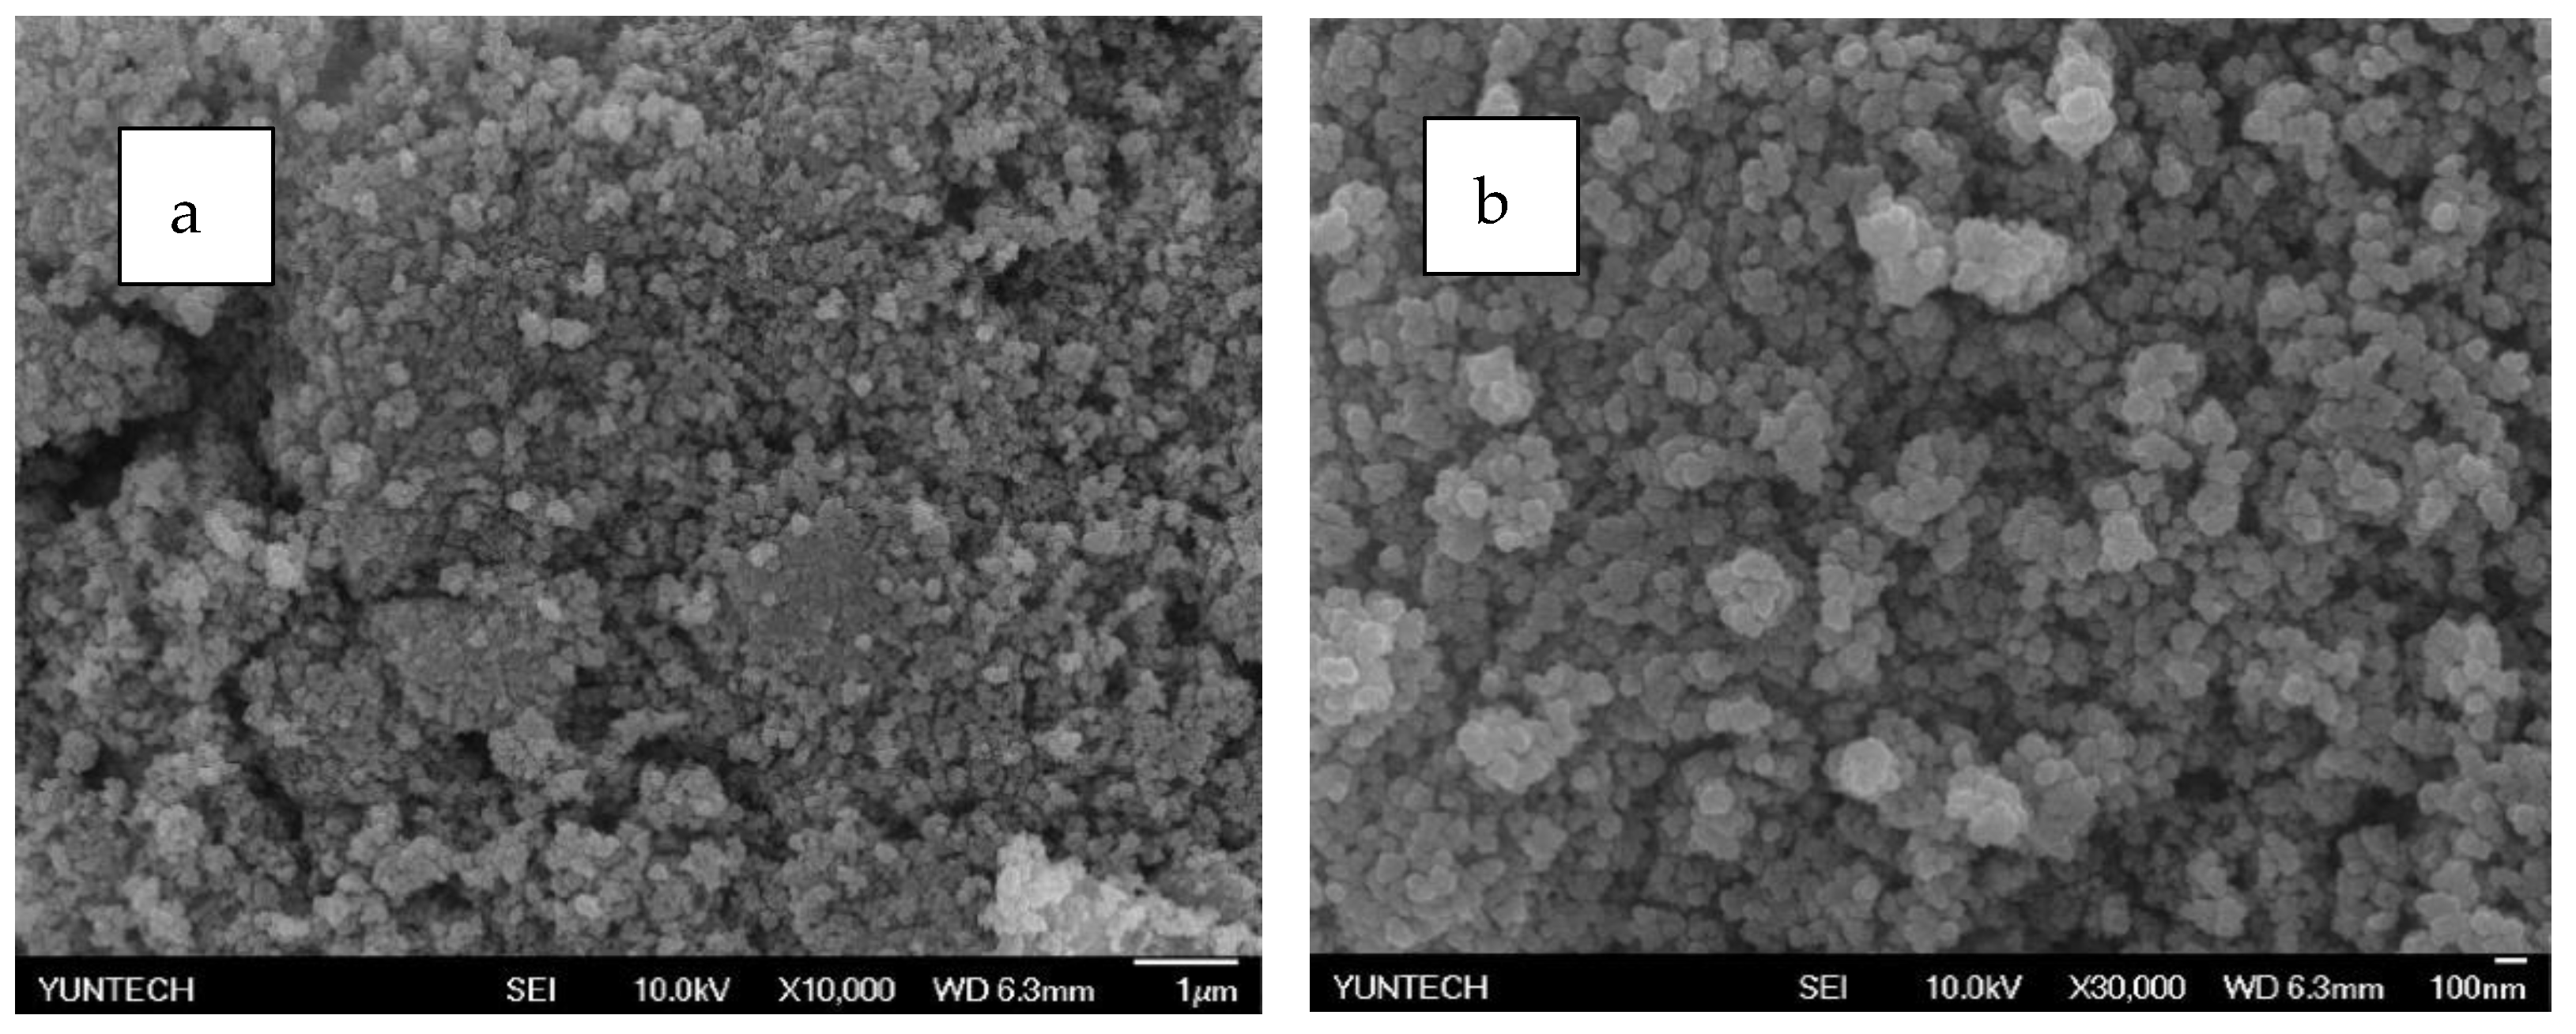
Figure 14.
Scanning electron microscope (SEM) analysis of PZG0.5 (a) 10,000 times (b) 30,000 times.
Figure 14.
Scanning electron microscope (SEM) analysis of PZG0.5 (a) 10,000 times (b) 30,000 times.
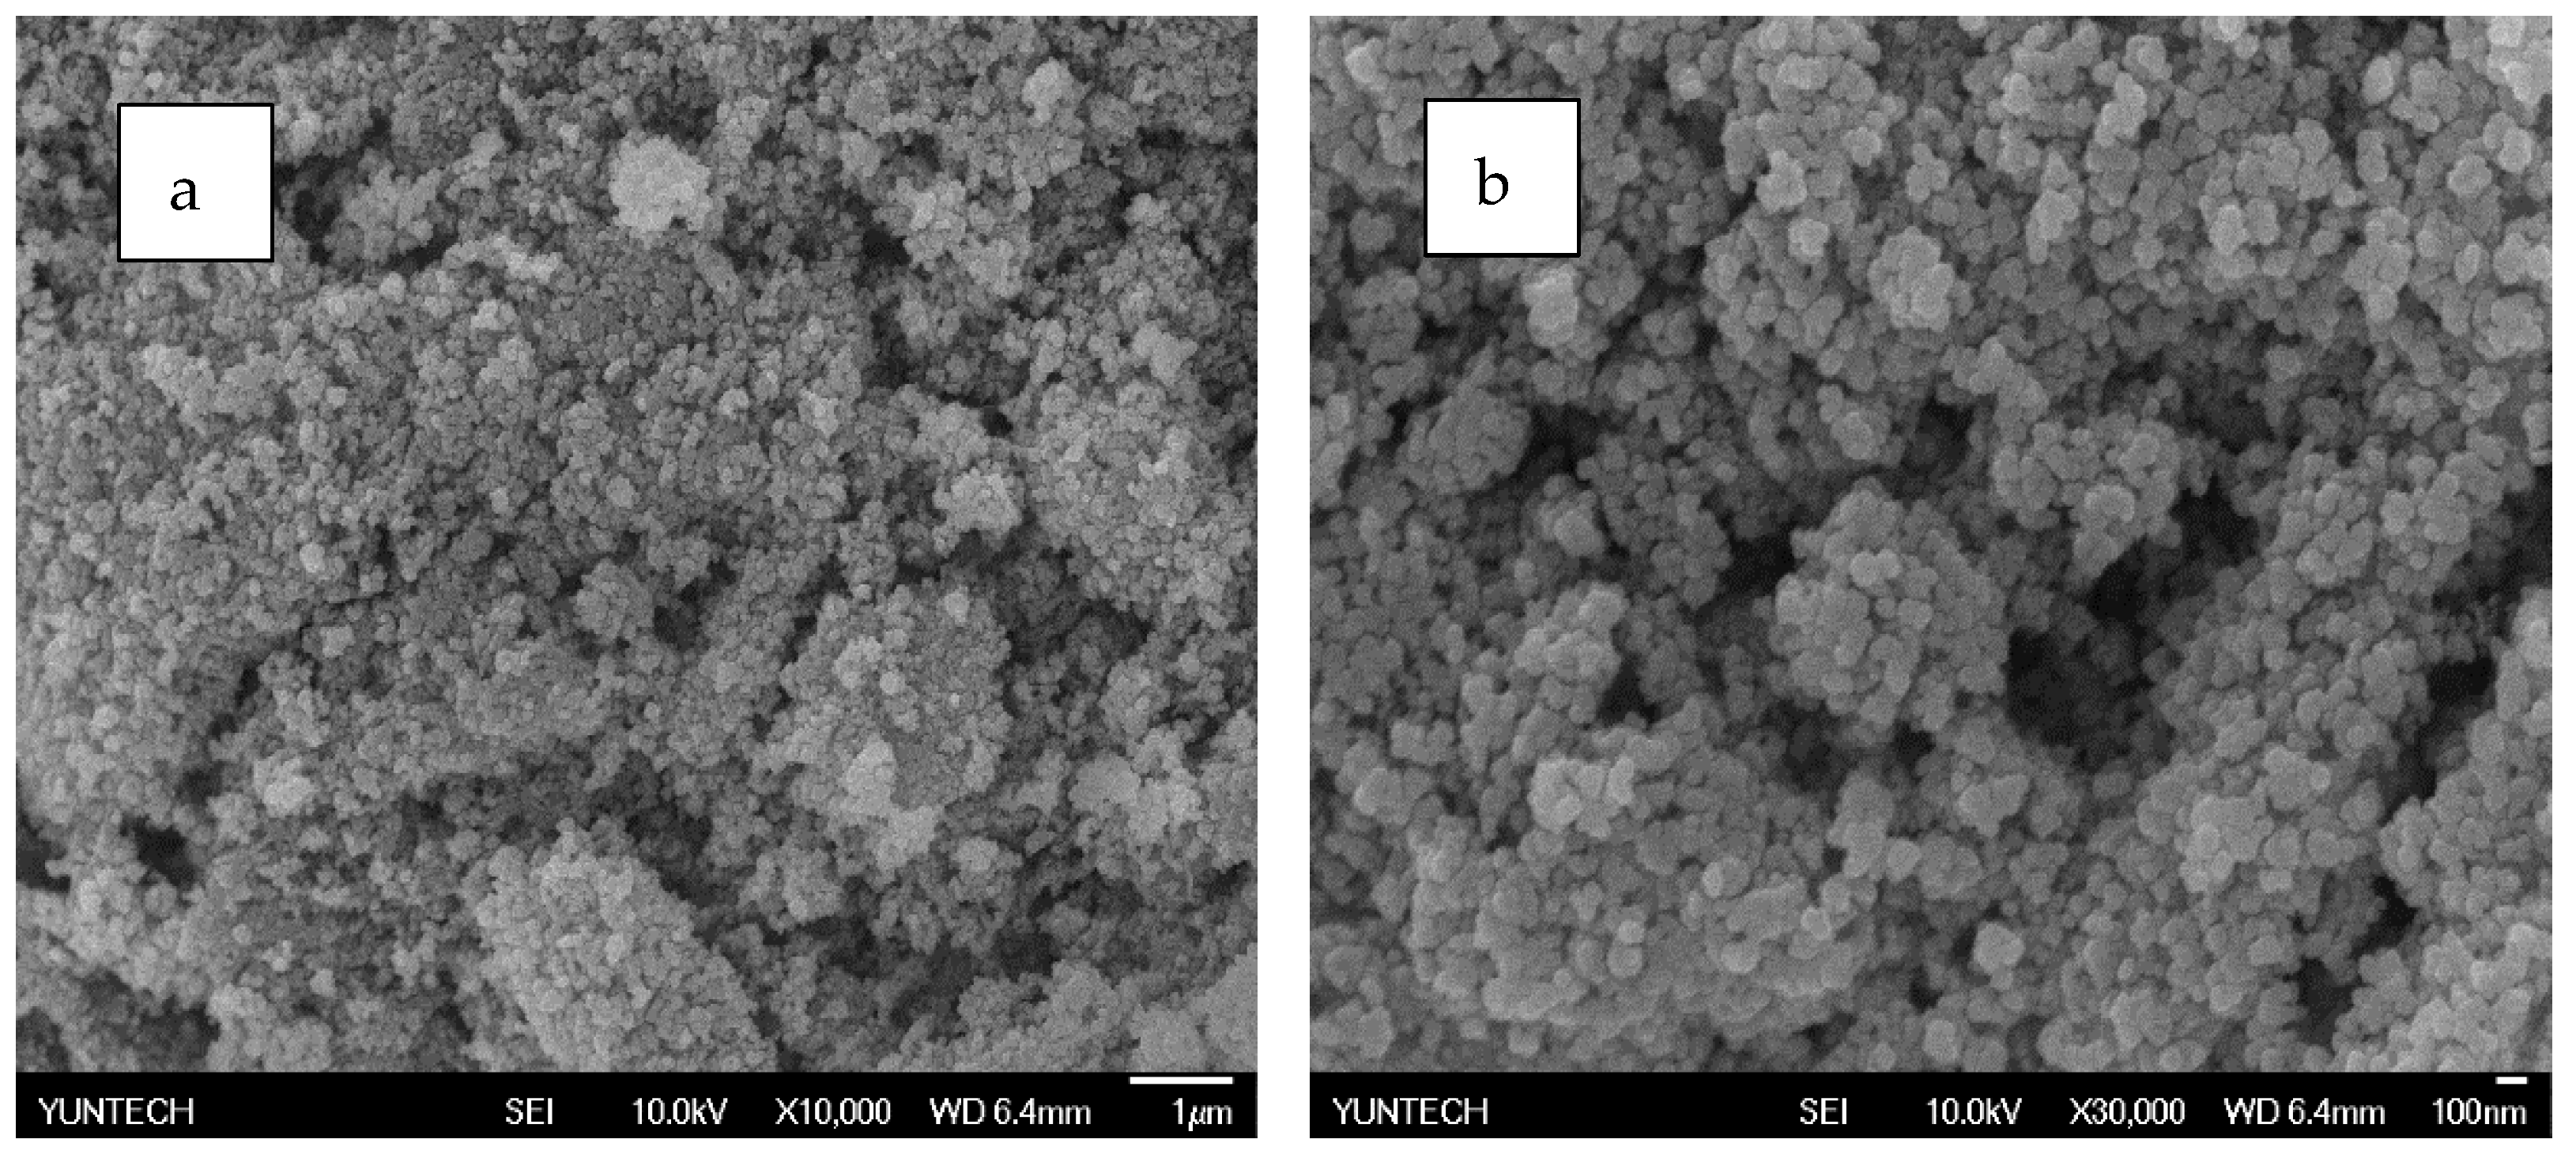
Figure 15.
SEM analysis of PZG1 (a) 10,000 times (b) 30,000 times.
Figure 15.
SEM analysis of PZG1 (a) 10,000 times (b) 30,000 times.
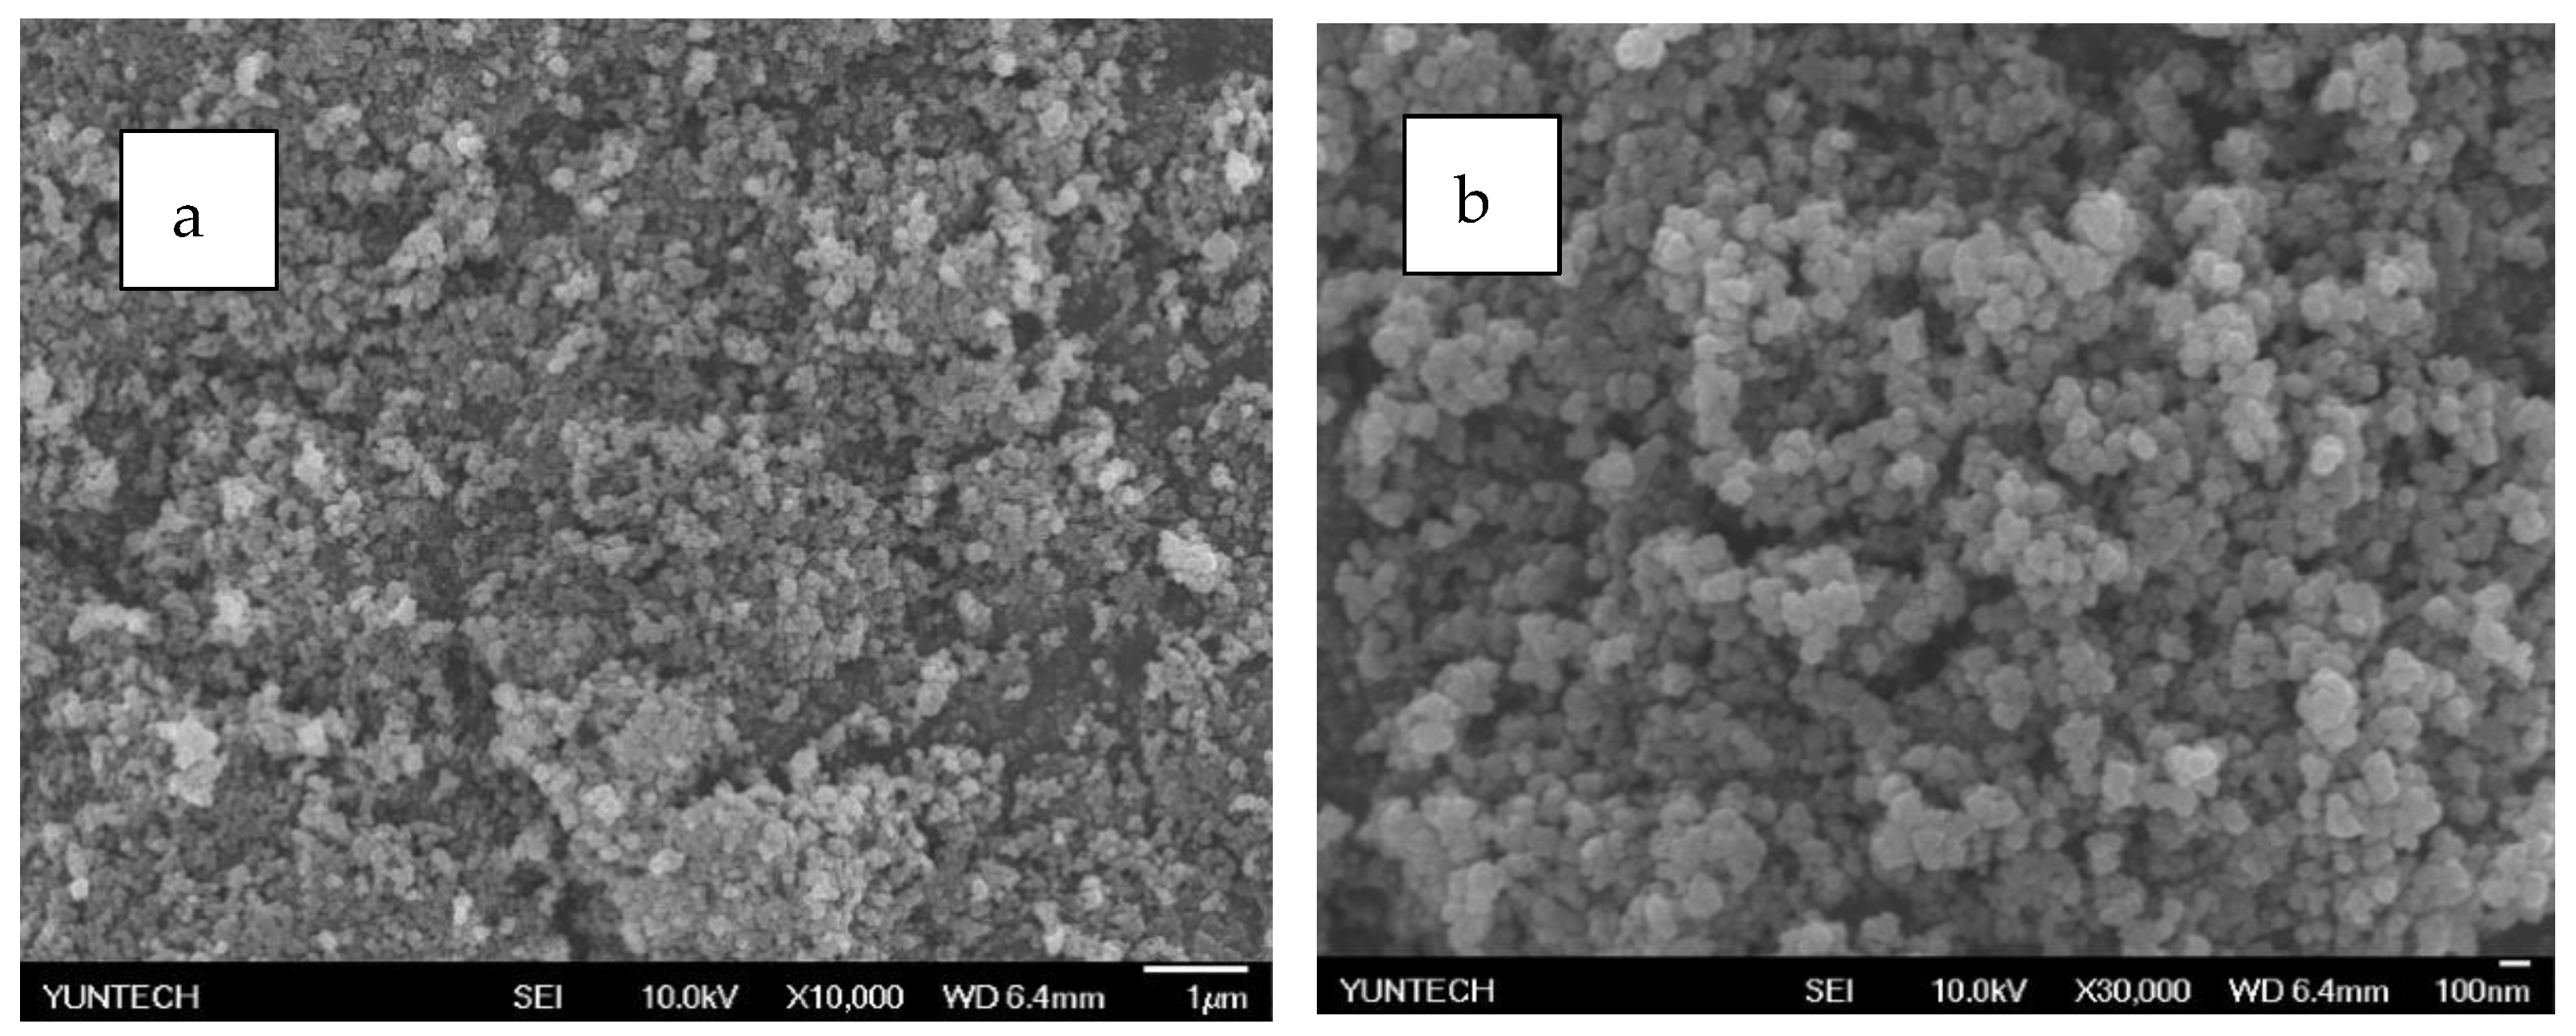
Figure 16.
SEM analysis of PZG2 (a) 10,000 times (b) 30,000 times.
Figure 16.
SEM analysis of PZG2 (a) 10,000 times (b) 30,000 times.
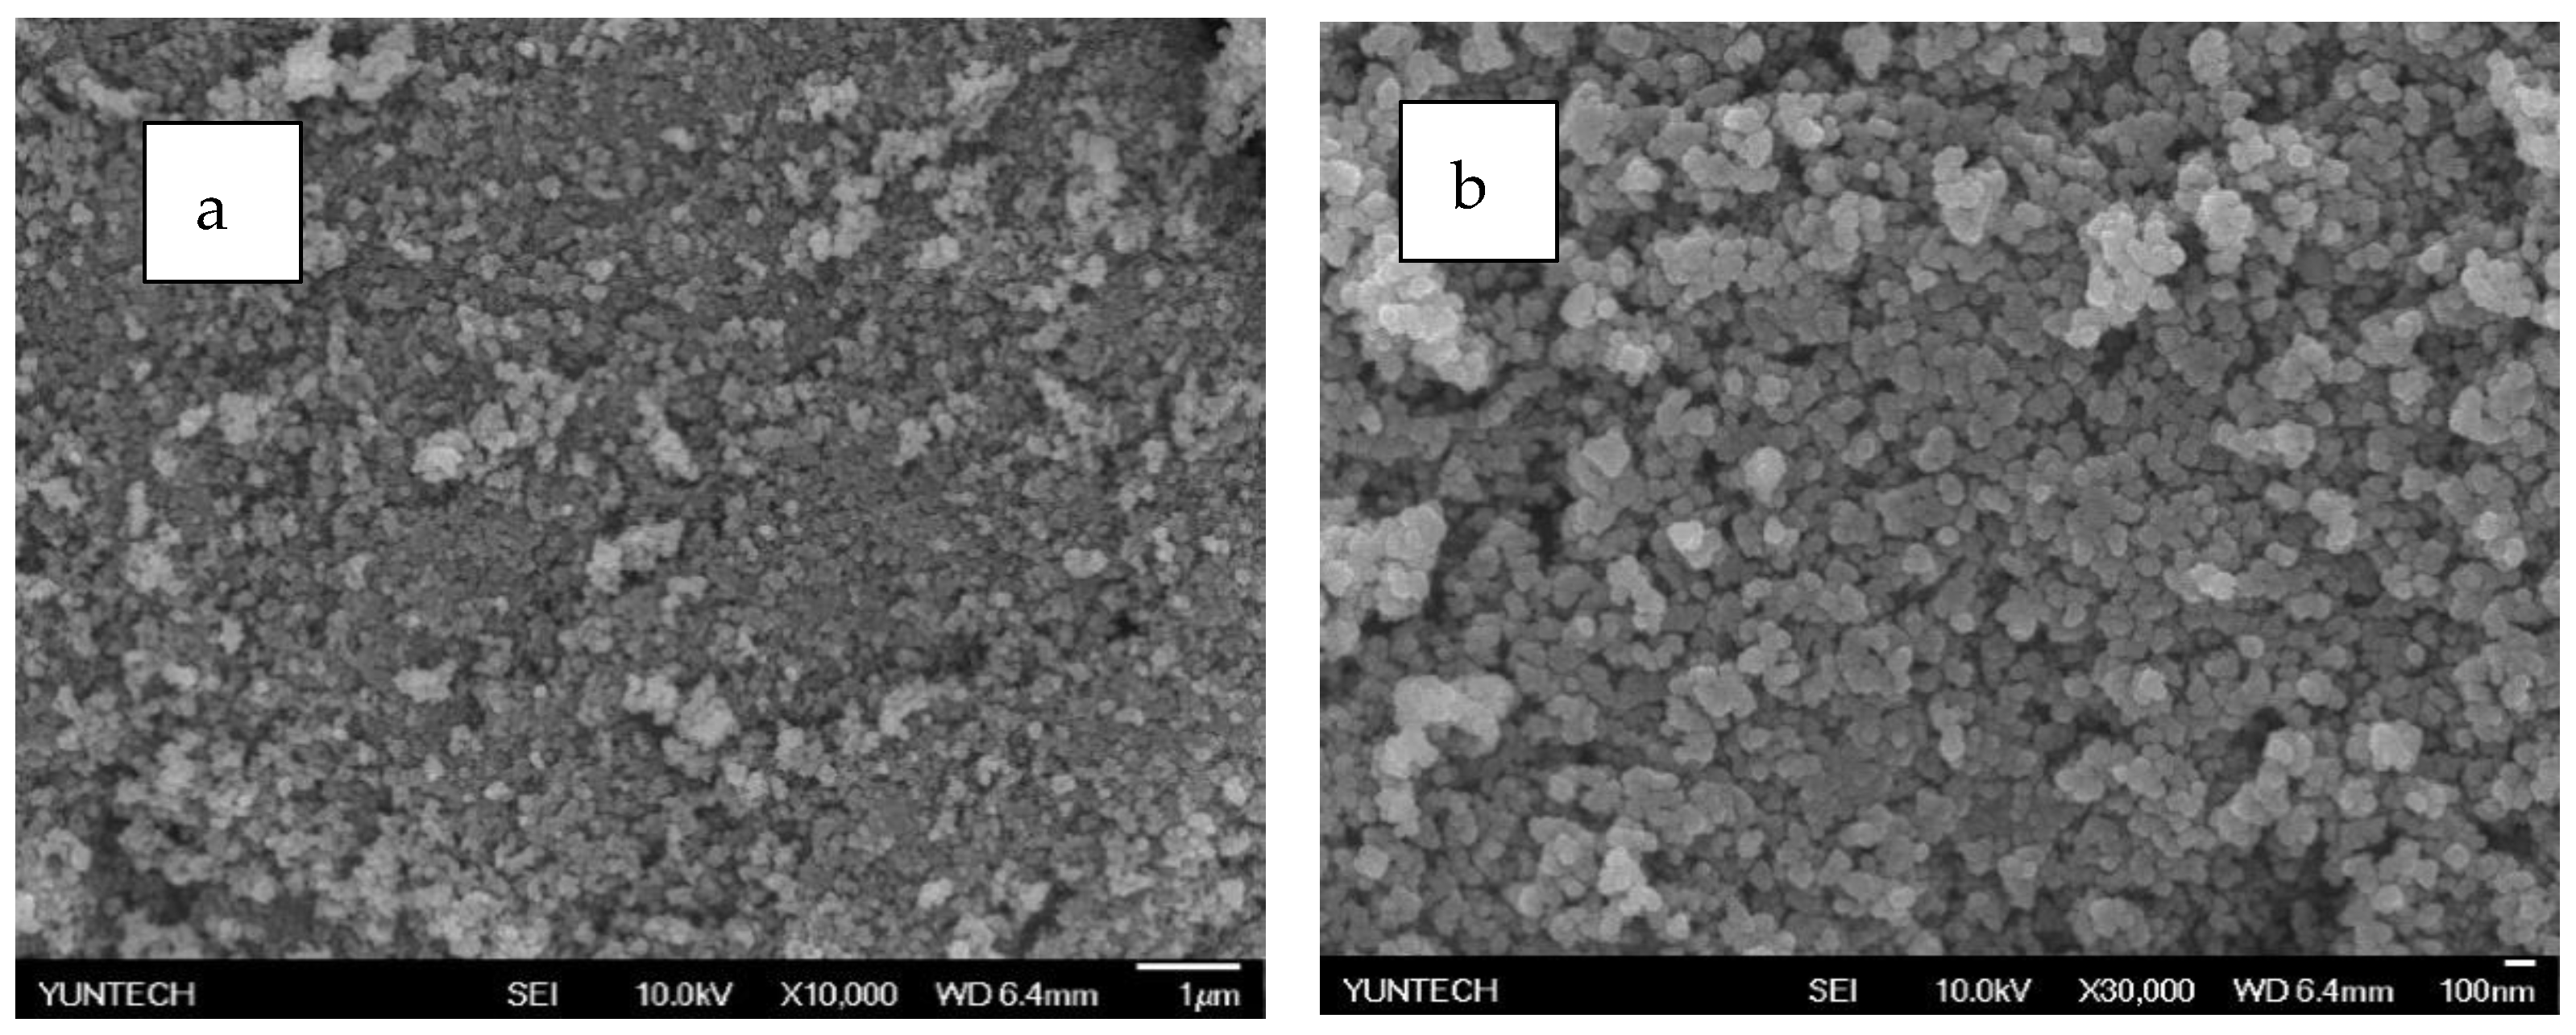
Figure 17.
SEM analysis of PZG0.5 by electrospray method: (a) 10,000 times and (b) 30,000 times.
Figure 17.
SEM analysis of PZG0.5 by electrospray method: (a) 10,000 times and (b) 30,000 times.
Figure 18.
SEM analysis of PZG1 by electrospray method: (a) 10,000 times and (b) 30,000 times.
Figure 18.
SEM analysis of PZG1 by electrospray method: (a) 10,000 times and (b) 30,000 times.
Figure 19.
SEM analysis of PZG2 by electrospray method: (a) 10,000 times and (b) 30,000 times picture.
Figure 19.
SEM analysis of PZG2 by electrospray method: (a) 10,000 times and (b) 30,000 times picture.
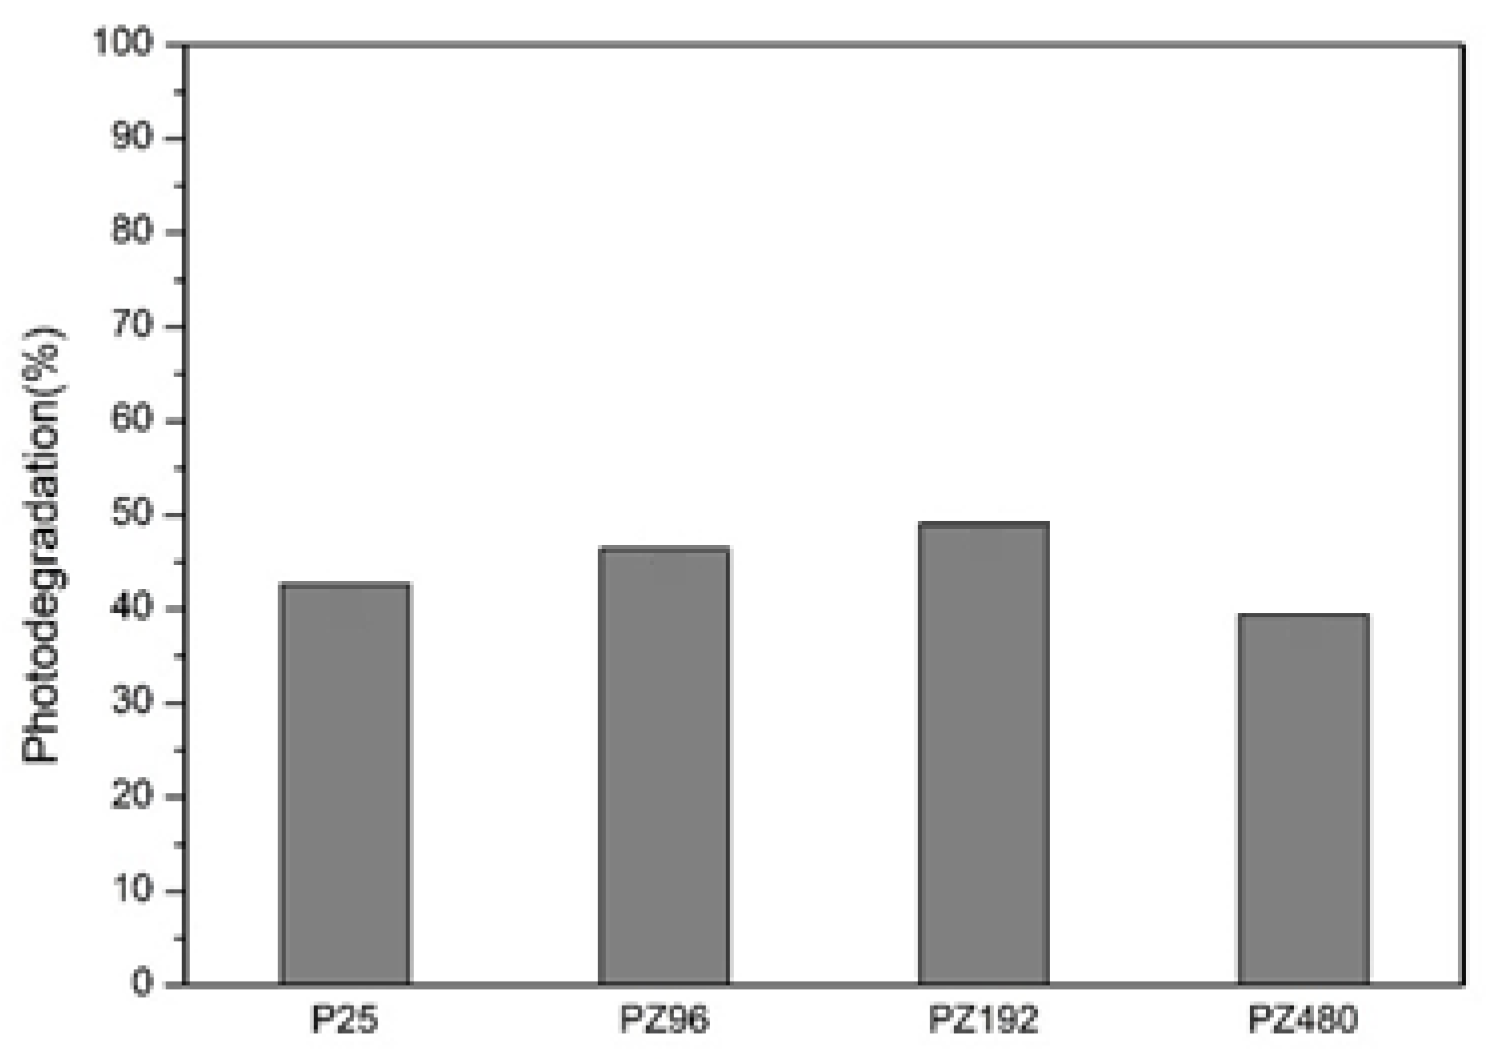
Figure 20.
Photodegradation of different ratios of P25/ZrO2.
Figure 20.
Photodegradation of different ratios of P25/ZrO2.
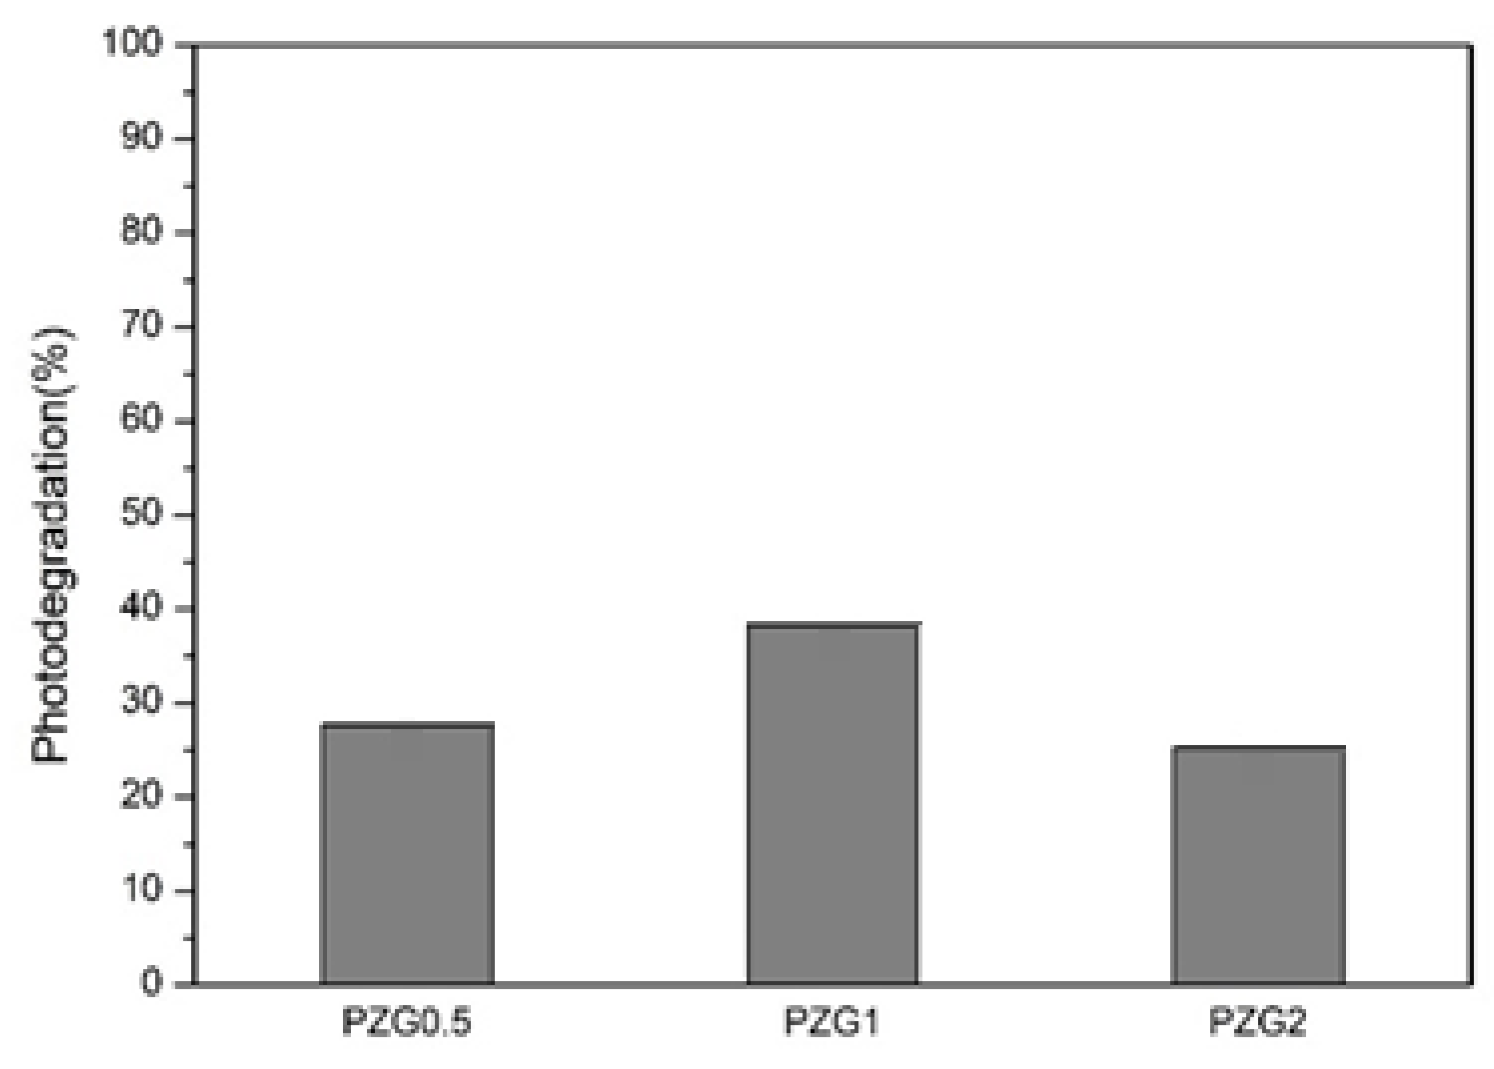
Figure 21.
Photodegradation of different ratios of P25/ZrO2/GO.
Figure 21.
Photodegradation of different ratios of P25/ZrO2/GO.
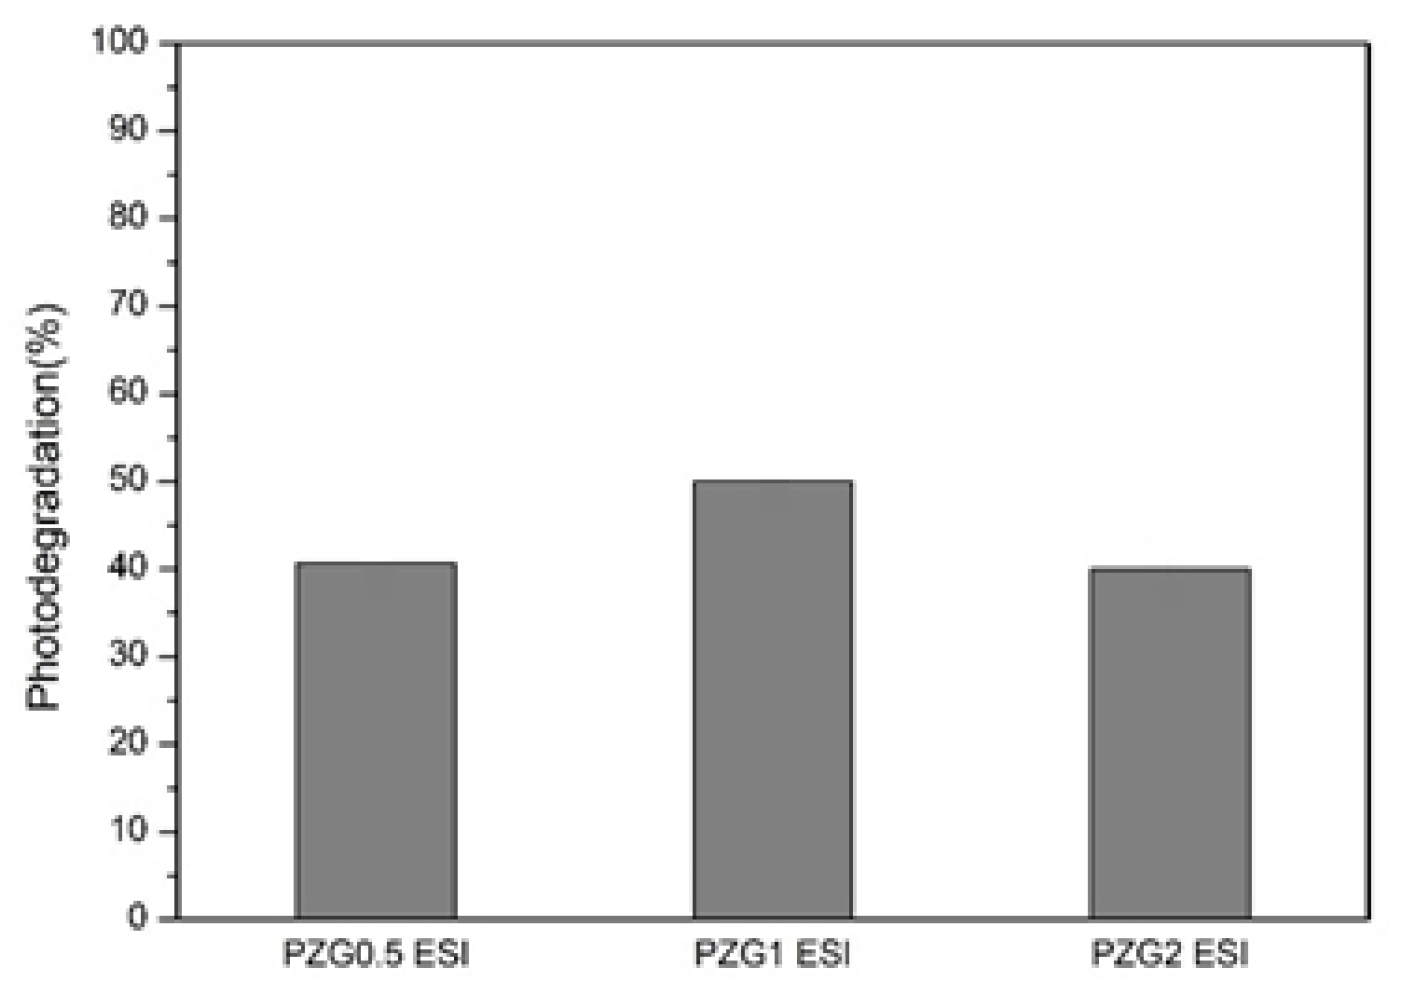
Figure 22.
Photodegradation of different ratios of P25/ZrO2/GO made by the electrospray method.
Figure 22.
Photodegradation of different ratios of P25/ZrO2/GO made by the electrospray method.
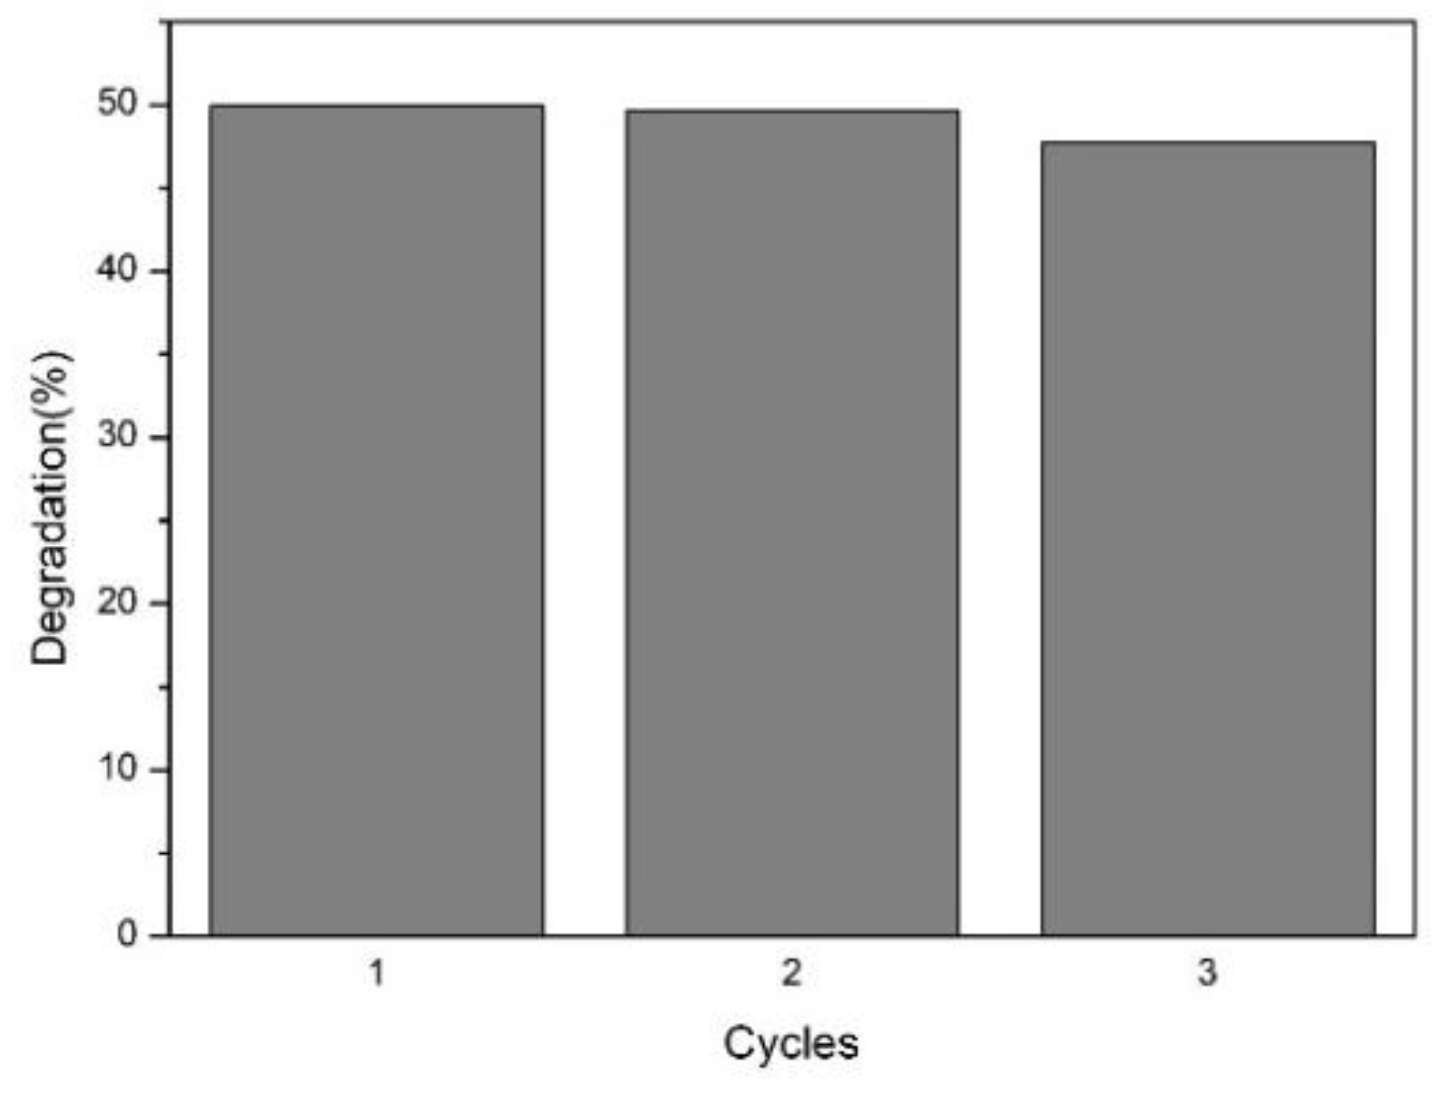
Figure 23.
Cyclic photodegradation test of P25/ZrO2/GO1% (PZG1) made by the electrospray method.
Figure 23.
Cyclic photodegradation test of P25/ZrO2/GO1% (PZG1) made by the electrospray method.
Table 1.
Materials needed for preparation.
Table 1.
Materials needed for preparation.
| Photocatalyst | Symbol |
|---|
| Commercial photochatalyst P25 | P25 |
| P25 with 96 mg ZrOCl2. 8H2O | PZ96 |
| P25 with 192 mg ZrOCl2. 8H2O | PZ192 |
| P25 with 480 mg ZrOCl2. 8H2O | PZ480 |
| P25 with 192 mg ZrOCl2. 8H2O and 0.5% GO | PZG0.5 |
| P25 with 192 mg ZrOCl2. 8H2O and 1% GO | PZG1 |
| P25 with 192 mg ZrOCl2. 8H2O and 2% GO | PZG2 |
| P25 with 192 mg ZrOCl2. 8H2O and 0.5% GO by electrospray | PZG0.5 ESI |
| P25 with 192 mg ZrOCl2. 8H2O and 1% GO by electrospray | PZG1 ESI |
| P25 with 192 mg ZrOCl2. 8H2O and 2% GO by electrspray | PZG2 ESI |
Table 2.
PZ96 Photocatalyst element analysis.
Table 2.
PZ96 Photocatalyst element analysis.
| Element | Weight (%) | Atom. (%) | Error (%) |
|---|
| Oxygen(O) | 50.53 | 73.57 | 16.0 |
| Titanium(Ti) | 47.10 | 22.91 | 3.4 |
| Zirconium(Zr) | 0.63 | 0.16 | 0.1 |
Table 3.
PZ192 Photocatalyst element analysis.
Table 3.
PZ192 Photocatalyst element analysis.
| Element | Weight (%) | Atom. (%) | Error (%) |
|---|
| Oxygen(O) | 46.19 | 72.20 | 17.7 |
| Titanium(Ti) | 52.58 | 27.46 | 3.5 |
| Zirconium(Zr) | 1.22 | 0.34 | 0.2 |
Table 4.
PZ480 Photocatalyst element analysis.
Table 4.
PZ480 Photocatalyst element analysis.
| Element | Weight (%) | Atom. (%) | Error (%) |
|---|
| Oxygen(O) | 45.92 | 71.10 | 18.4 |
| Titanium(Ti) | 50.20 | 25.97 | 3.4 |
| Zirconium(Zr) | 2.83 | 0.77 | 0.4 |
Table 5.
ID/IG ratio of different ratios of P25/ZrO2/GO.
Table 5.
ID/IG ratio of different ratios of P25/ZrO2/GO.
| | GO | PZG0.5 | PZG1 | PZG2 |
|---|
| ID/IG | 0.83 | 0.88 | 0.90 | 0.90 |
Table 6.
Energy gap of P25/ZrO2/GO.
Table 6.
Energy gap of P25/ZrO2/GO.
| | P25 | PZG0.5 | PZG1 | PZG2 |
|---|
| Energy gap | 3.29 | 3.21 | 3.18 | 2.85 |
Table 7.
Photodegradation of different ratios of P25/ZrO2.
Table 7.
Photodegradation of different ratios of P25/ZrO2.
| | Original Absorbance | Dark Absorption | Light Absorption | Photodegradation Rate | Solution Concentration |
|---|
| P25 | 3.58 | 3.24 | 1.72 | 42.63% | 9.55 |
| PZ96 | 3.58 | 3.27 | 1.55 | 46.38% | 8.66 |
| PZ192 | 3.58 | 3.19 | 1.39 | 49.23% | 7.77 |
| PZ480 | 3.58 | 3.19 | 1.74 | 39.45% | 9.71 |
Table 8.
Photodegradation of different ratios of P25/ZrO2/GO.
Table 8.
Photodegradation of different ratios of P25/ZrO2/GO.
| | Original Absorbance | Dark Absorption | Light Absorption | Photodegradation Rate | Solution Concentration |
|---|
| PZG0.5 | 3.58 | 2.68 | 1.66 | 26.61% | 9.34 |
| PZG1 | 3.58 | 2.60 | 1.19 | 38.35% | 6.81 |
| PZG2 | 3.58 | 1.56 | 0.99 | 17.47% | 5.73 |
Table 9.
Photodegradation of different ratios of P25/ZrO2/GO made by the electrospray method.
Table 9.
Photodegradation of different ratios of P25/ZrO2/GO made by the electrospray method.
| | Original Absorbance | Dark Absorption | Light Absorption | Photodegradation Rate | Solution Concentration |
|---|
| PZG0.5 ESI | 3.58 | 3.00 | 1.46 | 40.62% | 8.28 |
| PZG1 ESI | 3.58 | 2.74 | 0.86 | 49.92% | 5.02 |
| PZG2 ESI | 3.58 | 2.08 | 0.64 | 39.92% | 3.84 |


