1. Introduction
Composite materials are widely used in different industrial sectors owing to their excellent mechanical properties, such as high strength-to-weight ratios, and lightness. Among many different types of composite reinforcements, warp interlocks are attracting great attention by virtue of their improved delamination resistance [
1].
Due to their complex microstructure, however, the understanding of the mechanical behavior of this kind of 3D composite structure is a complex task. In particular, the analysis of fatigue behavior is of great importance for many researchers. Moreover, the effect of the manufacturing-induced defects is an important factor to analyze the fatigue behavior of the composite materials. One of the major defects induced during the resin transfer molding (RTM) process is the porosity or voids [
2,
3].
Numerous works were dedicated to studying the influence of the porosity on the fatigue behavior of unidirectional (UD) composites whereas only several research papers about woven composites [
4,
5] have been published. Voids cause local heating, which leads to the possible initiation of cracks in composites under fatigue loading [
6]. The effect of voids on the mechanical behavior is more detrimental under cyclic loading than under static loading [
7]. Schmidt et al. [
8] observed the influence of voids on the decrease in the fatigue life by means of several non-destructive techniques. The authors could not find a clear quantitative relation between the fatigue life and the void volume fraction. Dill et al. [
9] observed cracking around the edges of voids. Maragoni et al. [
10] pointed out that crack initiation and propagation were greatly influenced by voids and the fatigue life reduction for [0/90] specimens was greater than for [0/45/0/−45] specimens. It appears that fatigue loading amplifies the influence of voids on the UD composite strength, especially for low cycle fatigue loadings, which can be demonstrated by the presence of transverse cracks [
10,
11].
One of the widely used techniques to analyze the internal micro- or meso-structure of composite materials nowadays is micro-computed tomography (µCT). This technique can be applied to a virgin material to reconstruct a digital image of its architecture [
12]. Otherwise, it can be used as an ex-situ technique to extract the information about the final state of a material after loading [
13,
14,
15]. Moreover, the evolution of the internal microstructure and damage mechanisms under loading can also be evaluated by in-situ µCT measurements [
16].
The in-situ techniques would be the best method to investigate the damage accumulated during fatigue loading. The sample undergoes a fatigue test in a scanner, for a measurement at a given number of loading cycles, while a pause is introduced in the test or a non-stop measurement is conducted during the test [
17]. This requires a power source for the µCT, however, and is generally performed with a synchrotron [
18,
19]. The main difficulty lies in carrying out long tests because the cost of occupying such a device can be high.
The other approach is to carry out a block of the fatigue loading followed by µCT scans, namely the interrupted fatigue test. Garcea et al. [
20] studied one specimen for each duration of loading. One of the disadvantages of such a methodology is that the initial variation of mechanical properties of specimens can influence the interpretation of the final results. One of the ways to overcome this problem is the use of the time-lapse protocol that consists of a sequence of microtomography observations and fatigue loading of the specimen [
21,
22]. One of the drawbacks of such methodologies is the difficulty in detecting a region of interest (ROI) for the very first µCT measurement. One possible solution was proposed in the literature [
23,
24], where the authors used thermal measurement to detect a hot spot during the fatigue test and identified them as ROI.
When it comes to 3D interlock composites, Gigliotti et al. [
25] showed that for a specimen undergoing thermal fatigue, the presence of voids had little influence on the initiation and propagation of cracks.
This paper focuses on the observation of the evolution of cracks in 3D interlock composite specimens by µCT in time-lapse. In particular, composite specimens, with different types of voids, were prepared to investigate the influence of the intrayarn voids and the interyarn voids on the fatigue behavior separately. The regions of interest were determined using the temperature field measured by infrared thermography.
2. Materials and Methods
2.1. Specimen Fabrication
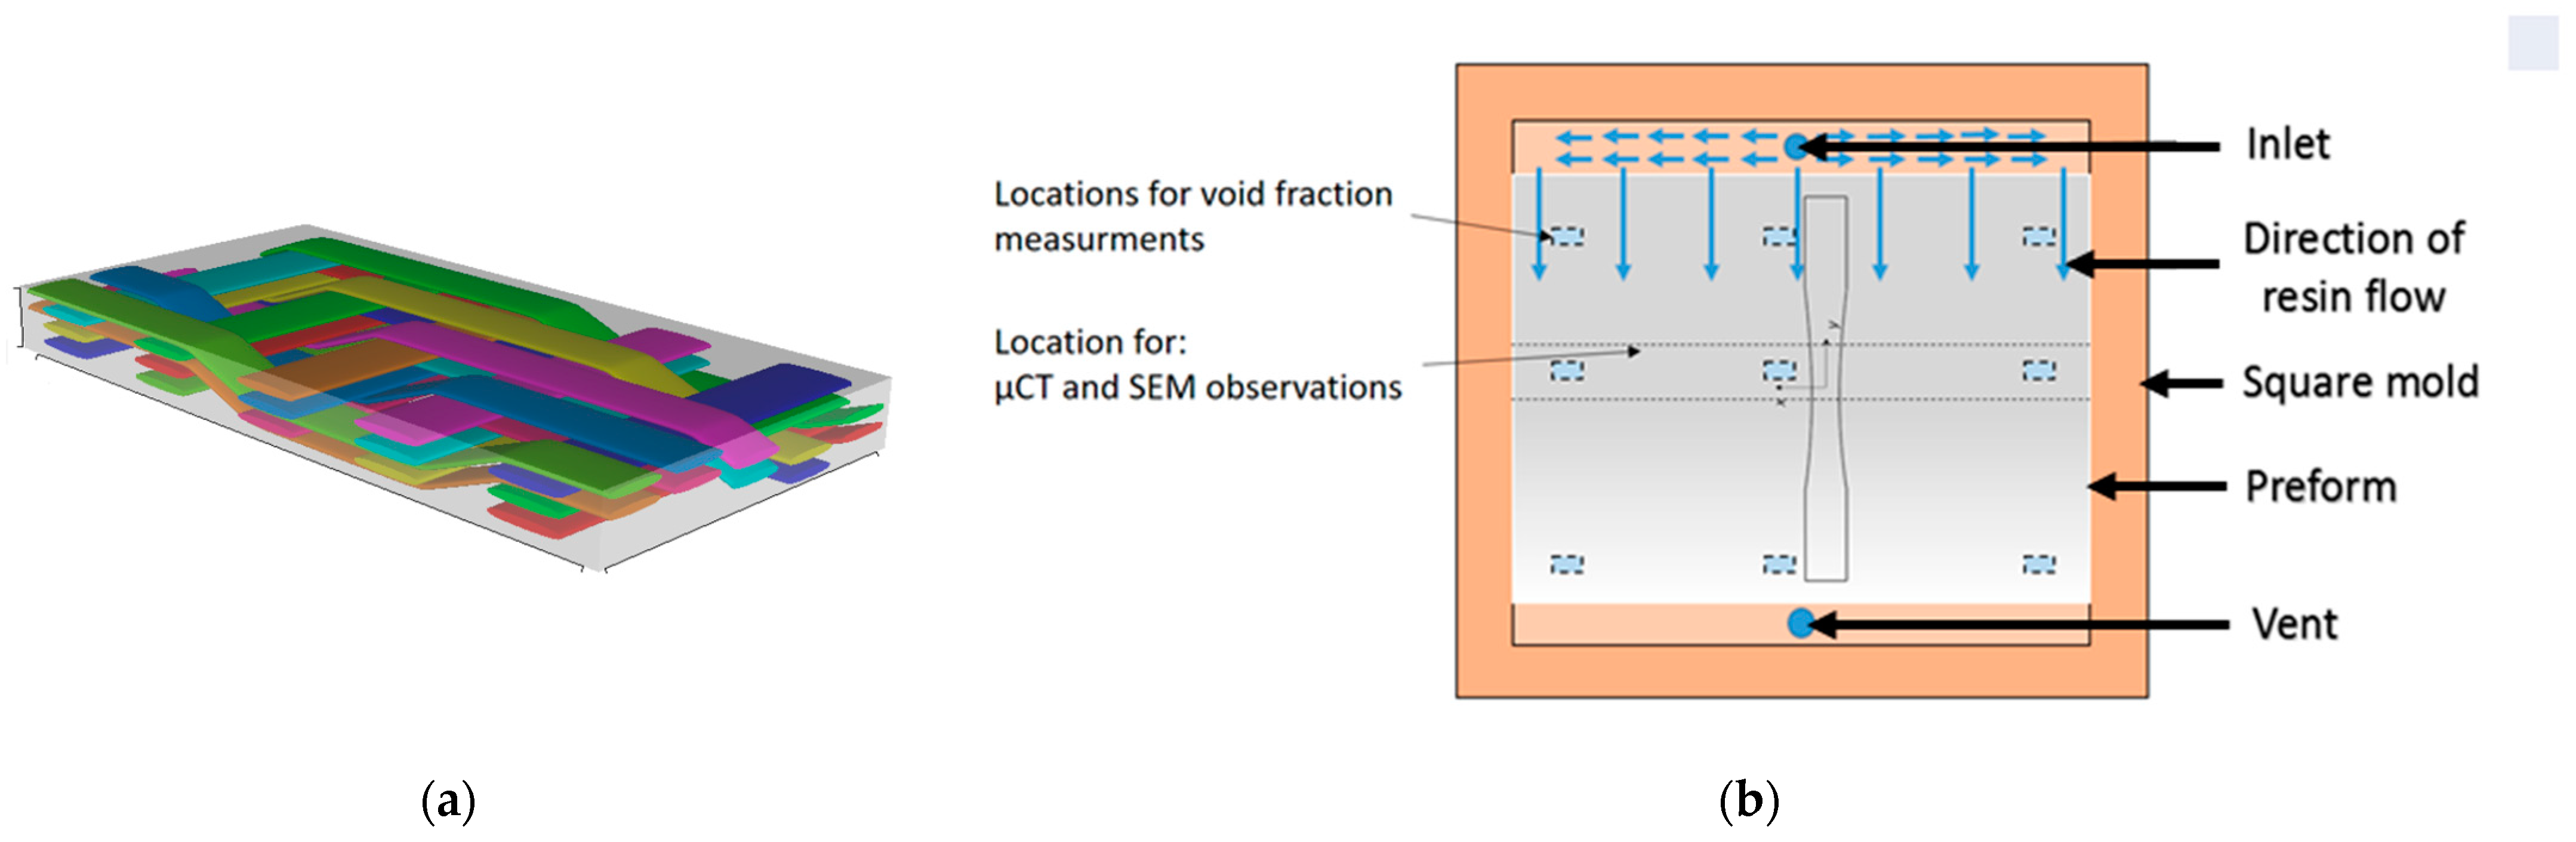
The composite reinforcement used in this work was a sub-classification of 3D textile called 2.5D layer-to-layer twill interlock. The textiles were manufactured at ENSAIT (Roubaix, France). The ideal 3D weave architecture of the textile is presented in
Figure 1a. The areal weight of the textile is (A
w) 2610 g⁄m
2 and the density of glass fiber is 2.52 g⁄cm
3. Since it is 3D textile, only a single layer was used to make a preform. The epoxy resin was prepared by mixing a GRUIT prime 27 resin with Prime 20, a slow hardener, with a mixing ratio of 100:28 parts by mass. At room temperature (i.e., 21 °C), this mixture has a gel time of 7 h and a curing time of 18 h. Composite plates were manufactured by resin transfer molding process (RTM). During this process, the resin was injected under constant pressure. The mold and injection strategy were adopted such that the rectangular preform could be filled from an edge, resulting in a rectilinear flow front. The schematic of the manufacturing strategy is shown in
Figure 1b.
A rectangular preform was placed in the mold. The resin injected through the resin inlet rapidly filled the empty cavity between the preform and the mold wall. Then, the resin impregnated the preform progressively from the empty cavity, while maintaining a rectilinear flow. In
Figure 1b, the nine locations of the extraction of specimens for void volume fraction measurement are illustrated. Mechanical test specimens were extracted as shown in
Figure 1b so that the direction of resin flow corresponded with the resin flow direction.
This methodology resulted in better control of the void volume fraction in the final composite parts [
1,
2]. It is widely known that the void formation during the RTM process is related to the resin flow velocity. At low resin velocity, interyarn voids are generated, whereas intrayarn voids are formed at high resin velocity [
3,
26,
27]. The resin velocity can be adjusted by controlling the resin injection pressure. Two injection pressures, viz. one and three bar, were used to produce composite plates with different void volume fractions and different positions of voids (i.e., intrayarn voids and interyarn voids). The fiber volume fraction (V
f) in each plate was controlled by changing the mold thickness. The dimensions of the mold and fiber volume fraction are presented in
Table 1.
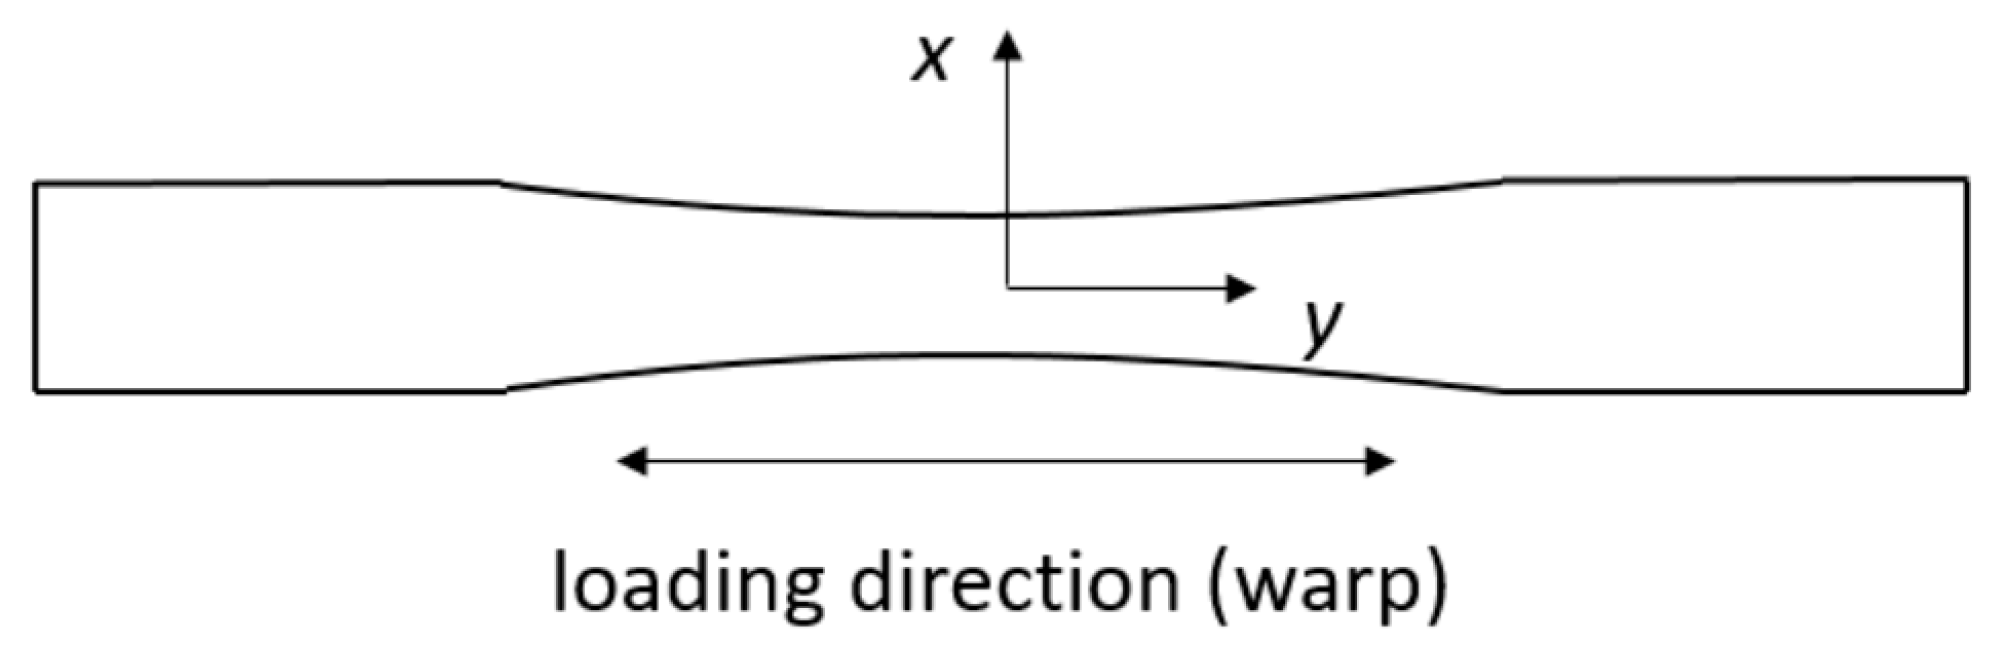
After the injection of resin into preform, the composite plates were submitted to curing at room temperature for 18 h and de-molded at room temperature. Then, to achieve sufficiently high green strength of the resin, the composite plates were placed in an oven with a constant temperature of 50 °C for 16 h. Subsequently, the specimens with a dumbbell shape were cut off from the composite plates as shown in
Figure 2. The specimens had a varying cross-section whose width was decreased from 28 mm at the tips to 18 mm at the mid-length, to minimize the stress concentration effects near the grips and increase the probability of the damage localization in the middle zone of the specimen. Therefore, the region of interest would be limited at the central zone of the specimen.
Following the standards specified by ASTM D 3171-99, a burn-off test was conducted in nine locations (
Figure 1b) to measure the fiber volume fraction and the total void volume fraction, which is the sum of intrayarn and interyarn void volume fractions. The intrayarn void volume fraction was estimated by optical observation after post-processing of SEM images.
2.2. Infrared Camera Measurements
The thermal measurements were conducted with an infrared camera (CEDIP Jade III MWIR, InSb) at an acquisition frequency of 50 Hz. The focal plane array was a 320 × 240 array of detectors digitized on 14 bits and sensitive in the 3.6–5.1 μm spectral band wavelengths. Before each measurement, a calibration was realized to check the conversion of the signal into temperature (in °C). After calibration, an accuracy of 25 mK was obtained. To minimize the influence of the external environment on the measurement, a black sheet was placed around the fatigue test equipment.
2.3. Fatigue Tests
The uniaxial force-controlled tests with a sinusoidal signal at a frequency of 5 Hz and a load ratio (R) of 0.1 were carried out on a servo-hydraulic fatigue testing machine (INSTRON 8500) with a hydraulic clamp system. Three different types of test were performed: (1) the low and high cycle fatigue limit tests (LCF/HCF limit tests); (2) constant amplitude tests; (3) time-lapse tests.
As for LCF/HCF limit tests, infrared camera measurements were performed to identify the limit. A specimen was submitted to a succession of fatigue blocks applying loads that increased from a block to another. The evolution of the self-heating showed a significant change of the behavior whether the loading was in the low cycle fatigue or high cycle fatigue area of the Wöhler curve. The load at which the change of behavior occurred was set to be the limit.
Once the LCF/HCF limit was obtained, constant amplitude tests were performed while the load was kept as the same value until the end of the test when the specimen was broken or the number of cycles reached 106 cycles, to measure the fatigue life for a few load cycles above and below this limit.
Time-lapse tests were conducted at maximum global stress of 100 MPa, for which the fatigue life was around 5 × 10⁵ cycles. Each test was divided into blocks of 105 cycles. Between each block, the specimen was taken out of the fatigue test equipment and was submitted to a micro-tomographic scan. This procedure was repeated until the failure of the specimen was reached. The self-heating was also monitored with an infrared camera to detect and follow the evolution of hot spots. The volume investigated during each microtomography was then centered on the localization of the same hot spot.
2.4. Micro-Computed Tomography and Scanning Electron Microscopy Observations
The micro-computed tomography (µCT) tests were carried out using RX solutions microtomography protected with an enclosure in lead at the ISIS4D platform. Each measurement took around 30 min while the specimen was submitted to 1440 acquisitions of four images during a full rotation. A high-resolution source was used to obtain a voxel resolution of 5 and 10 µm (
Table 2).
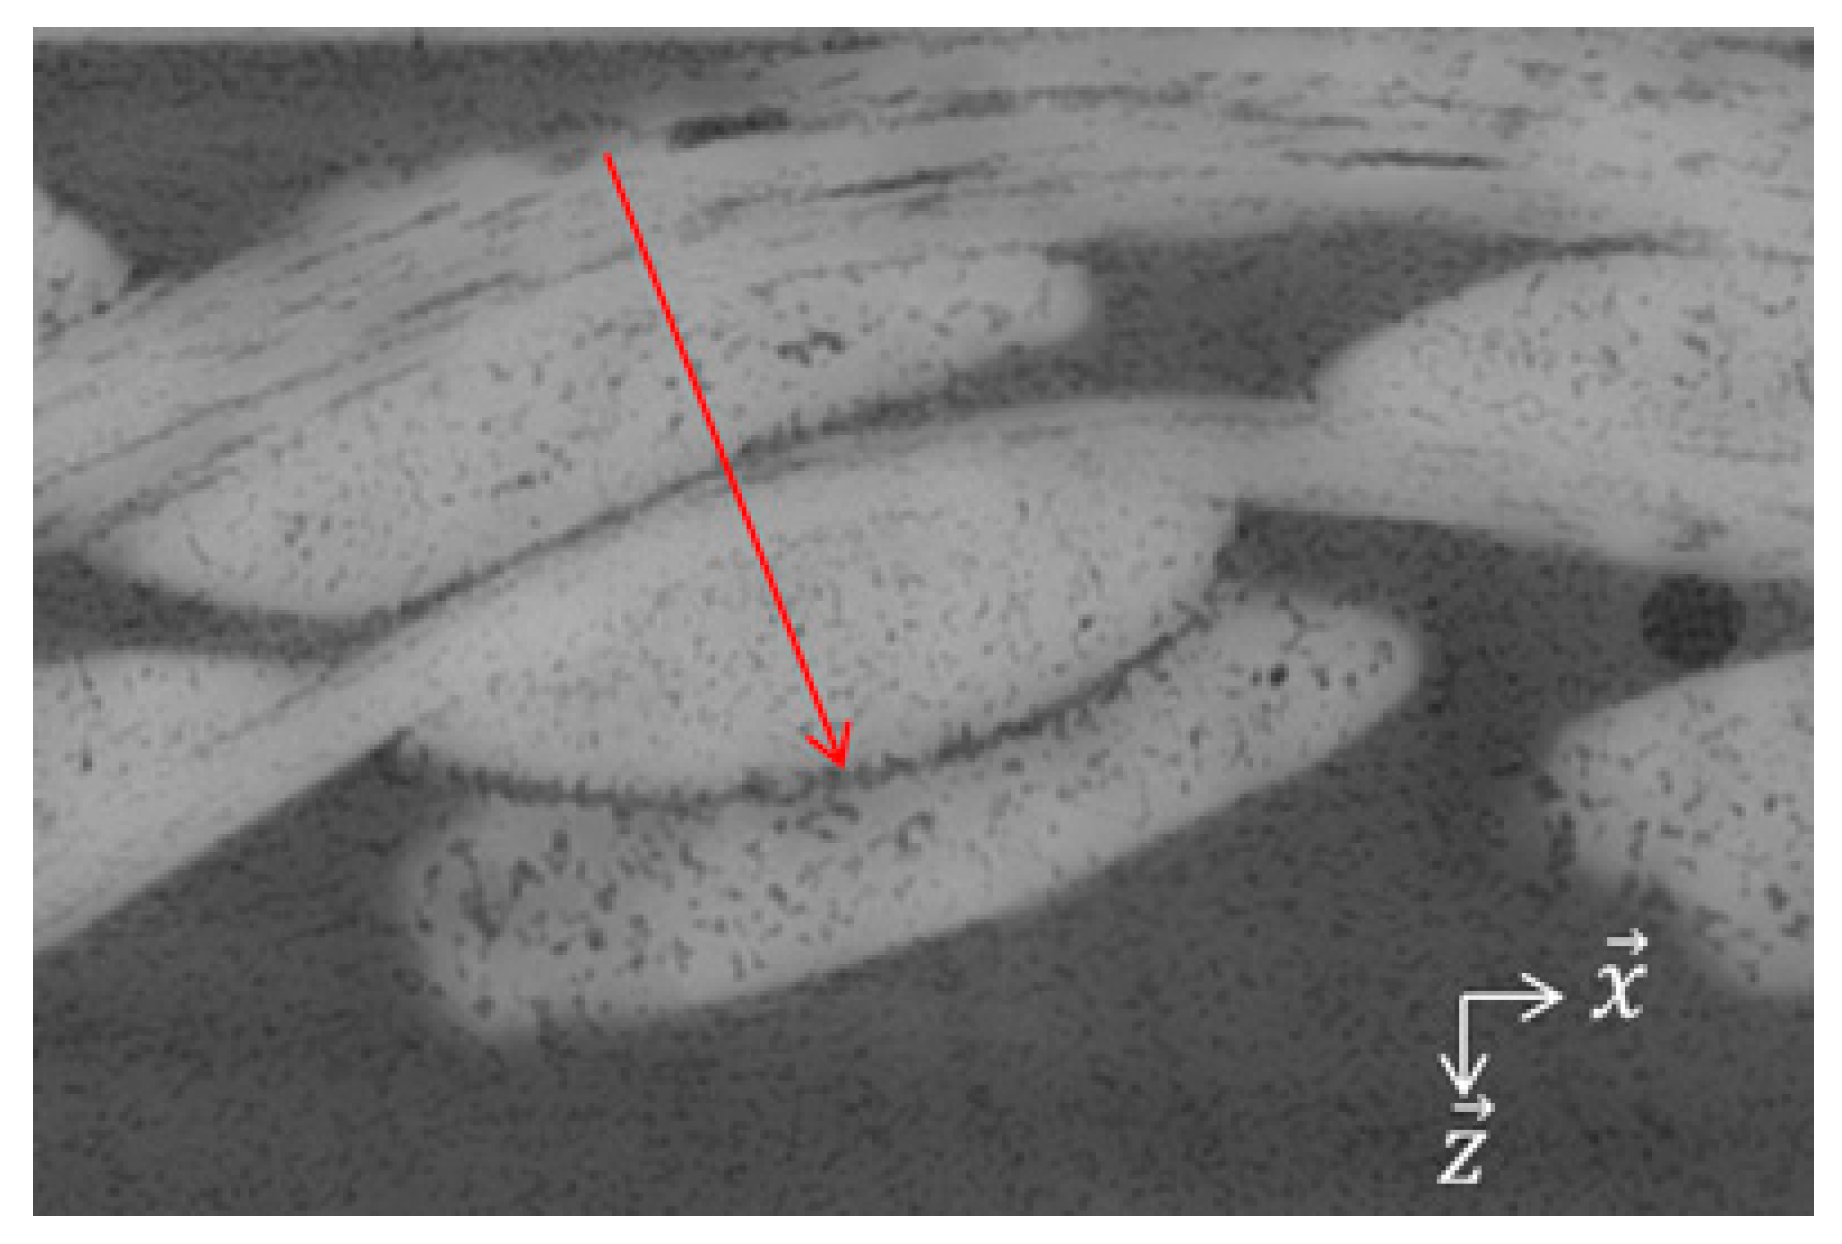
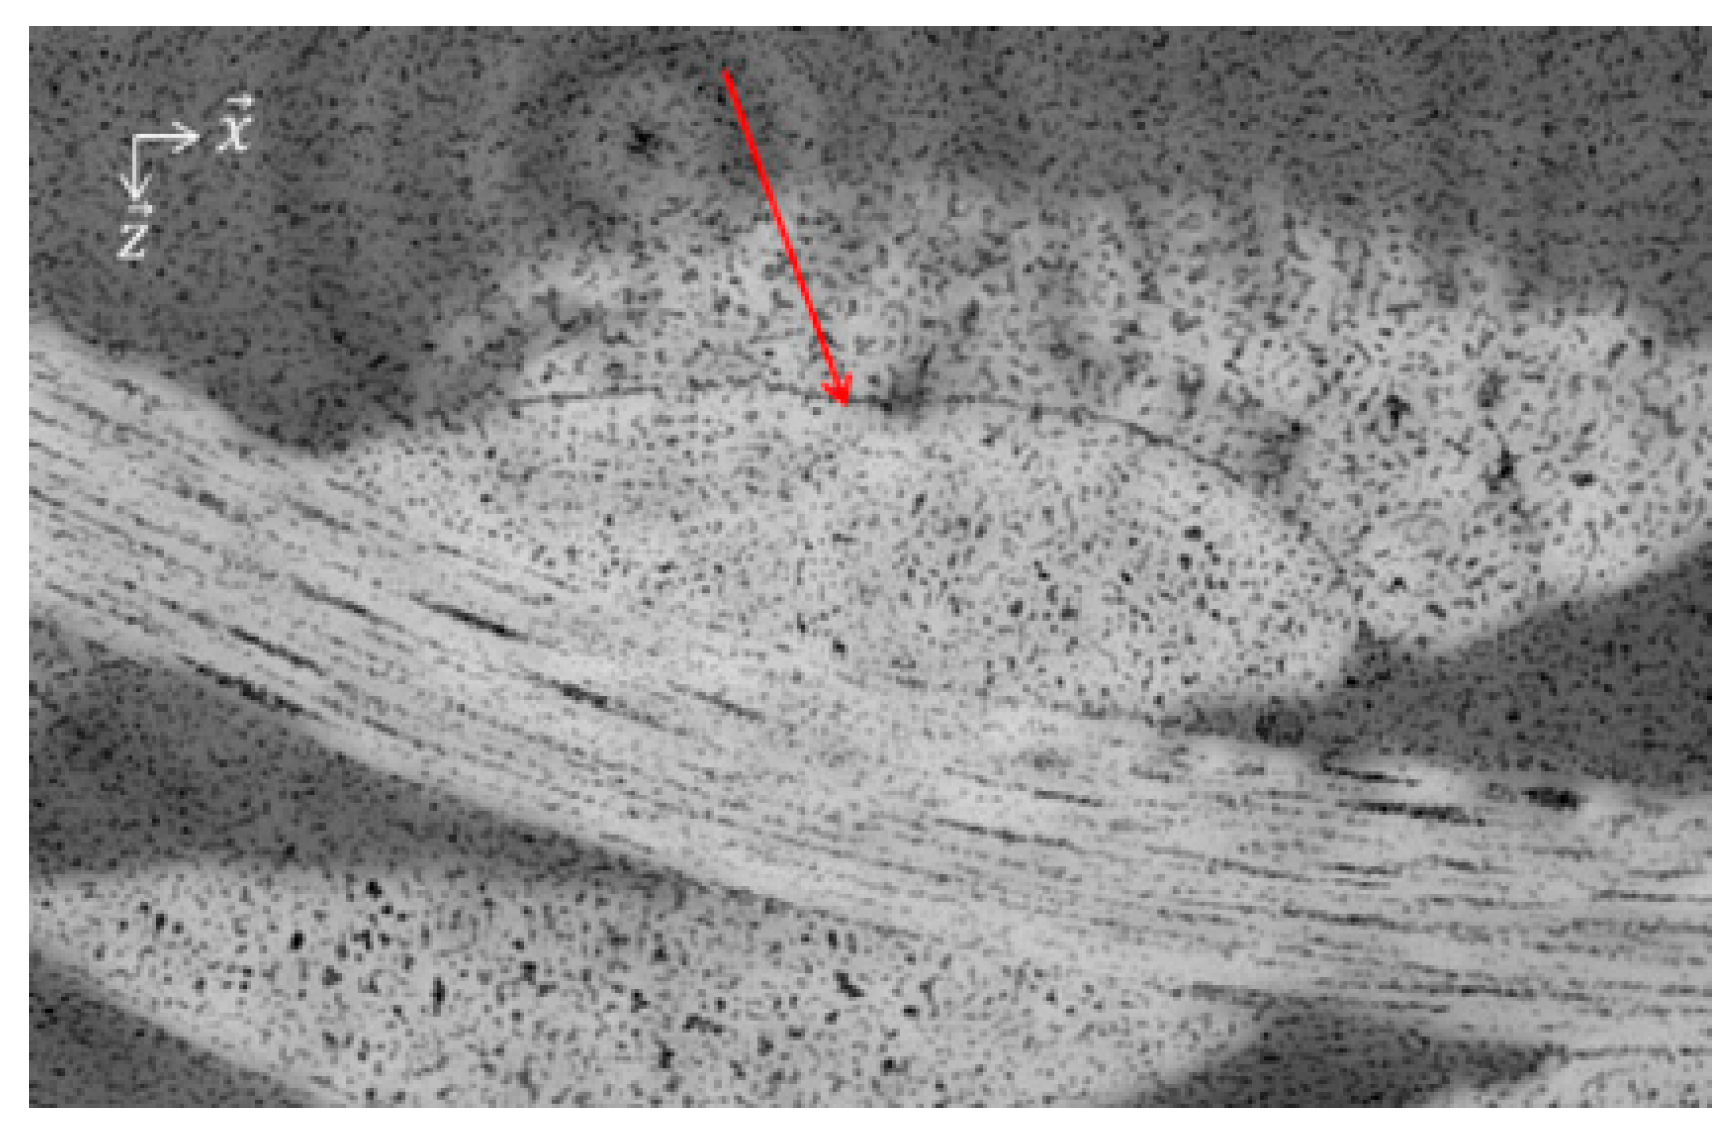
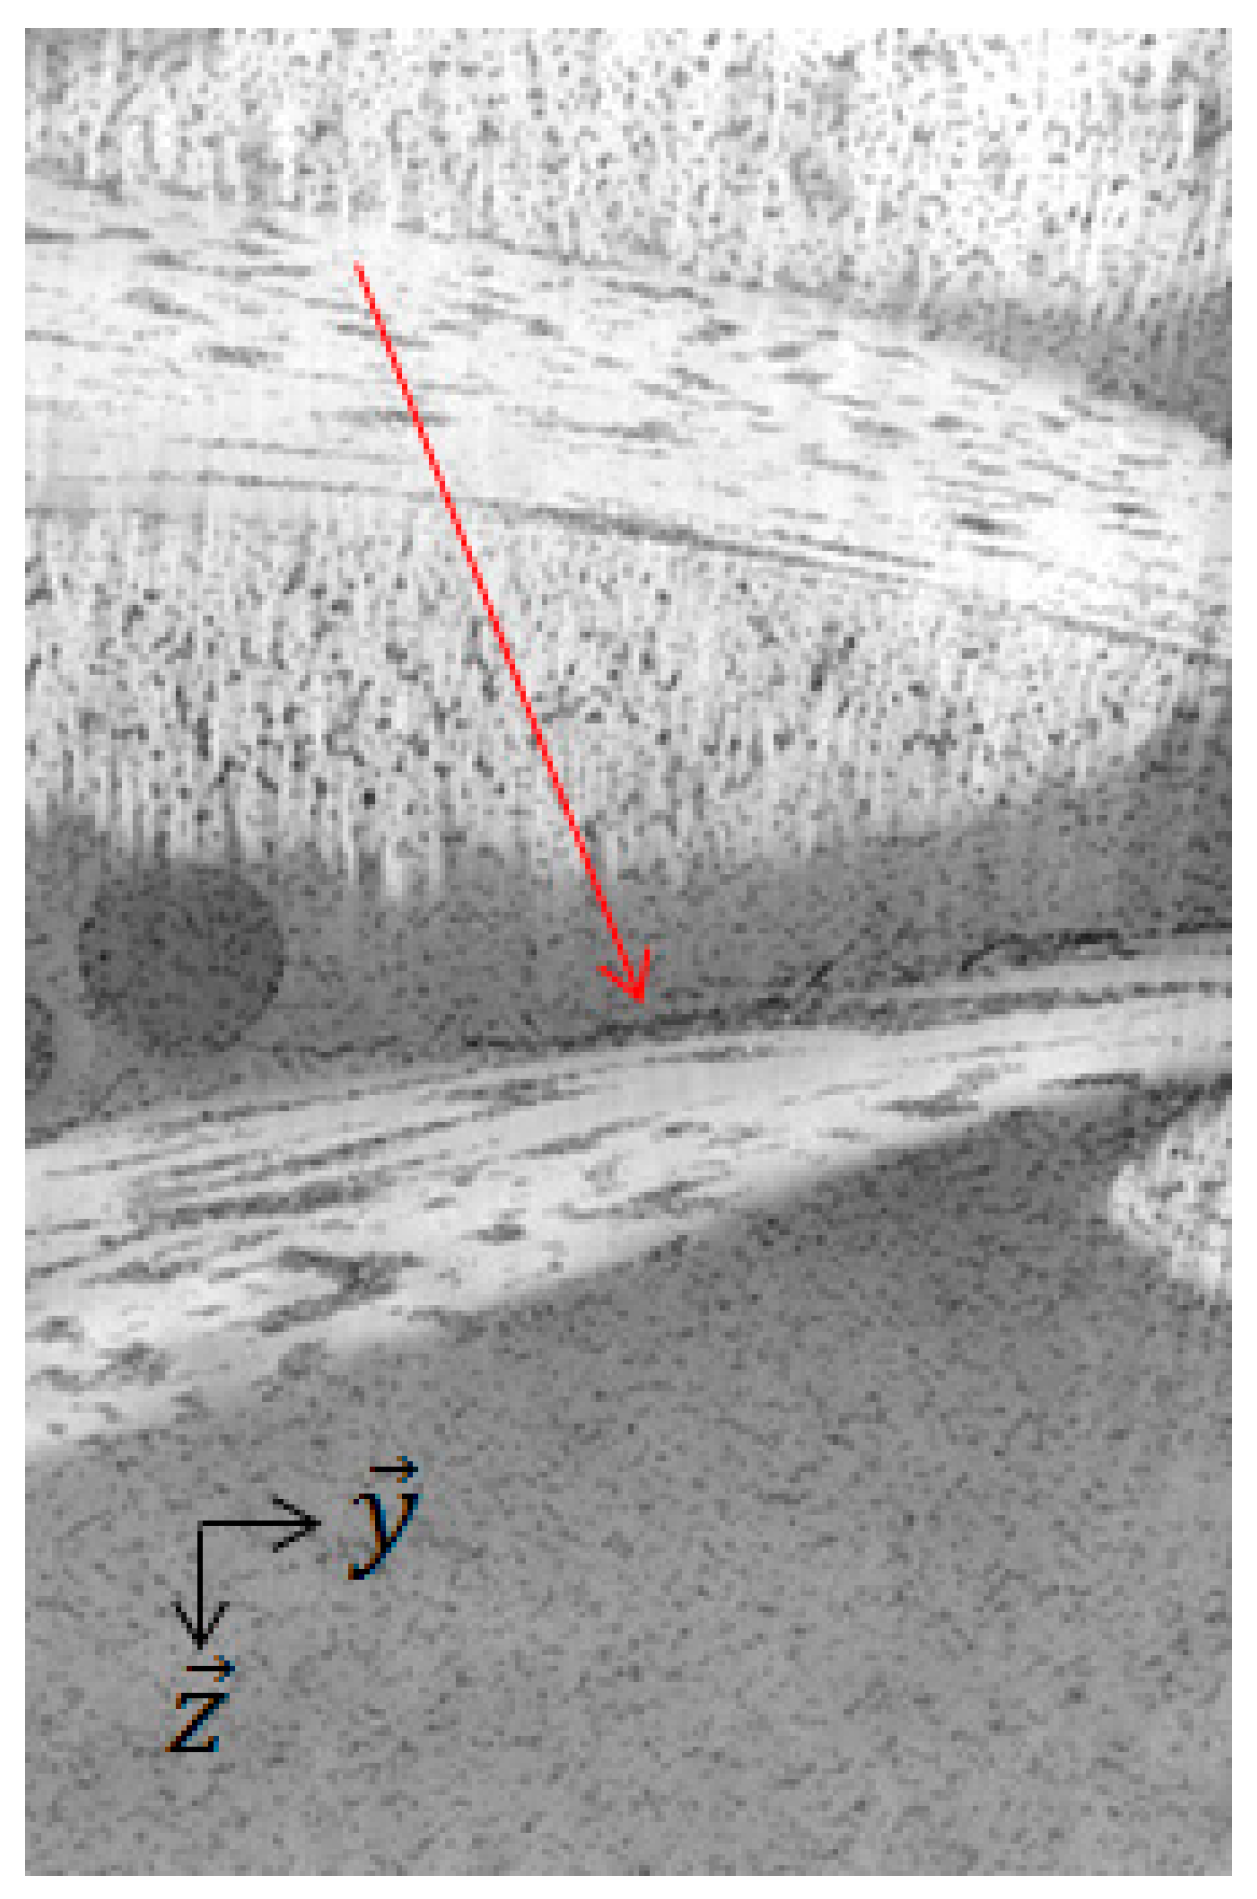
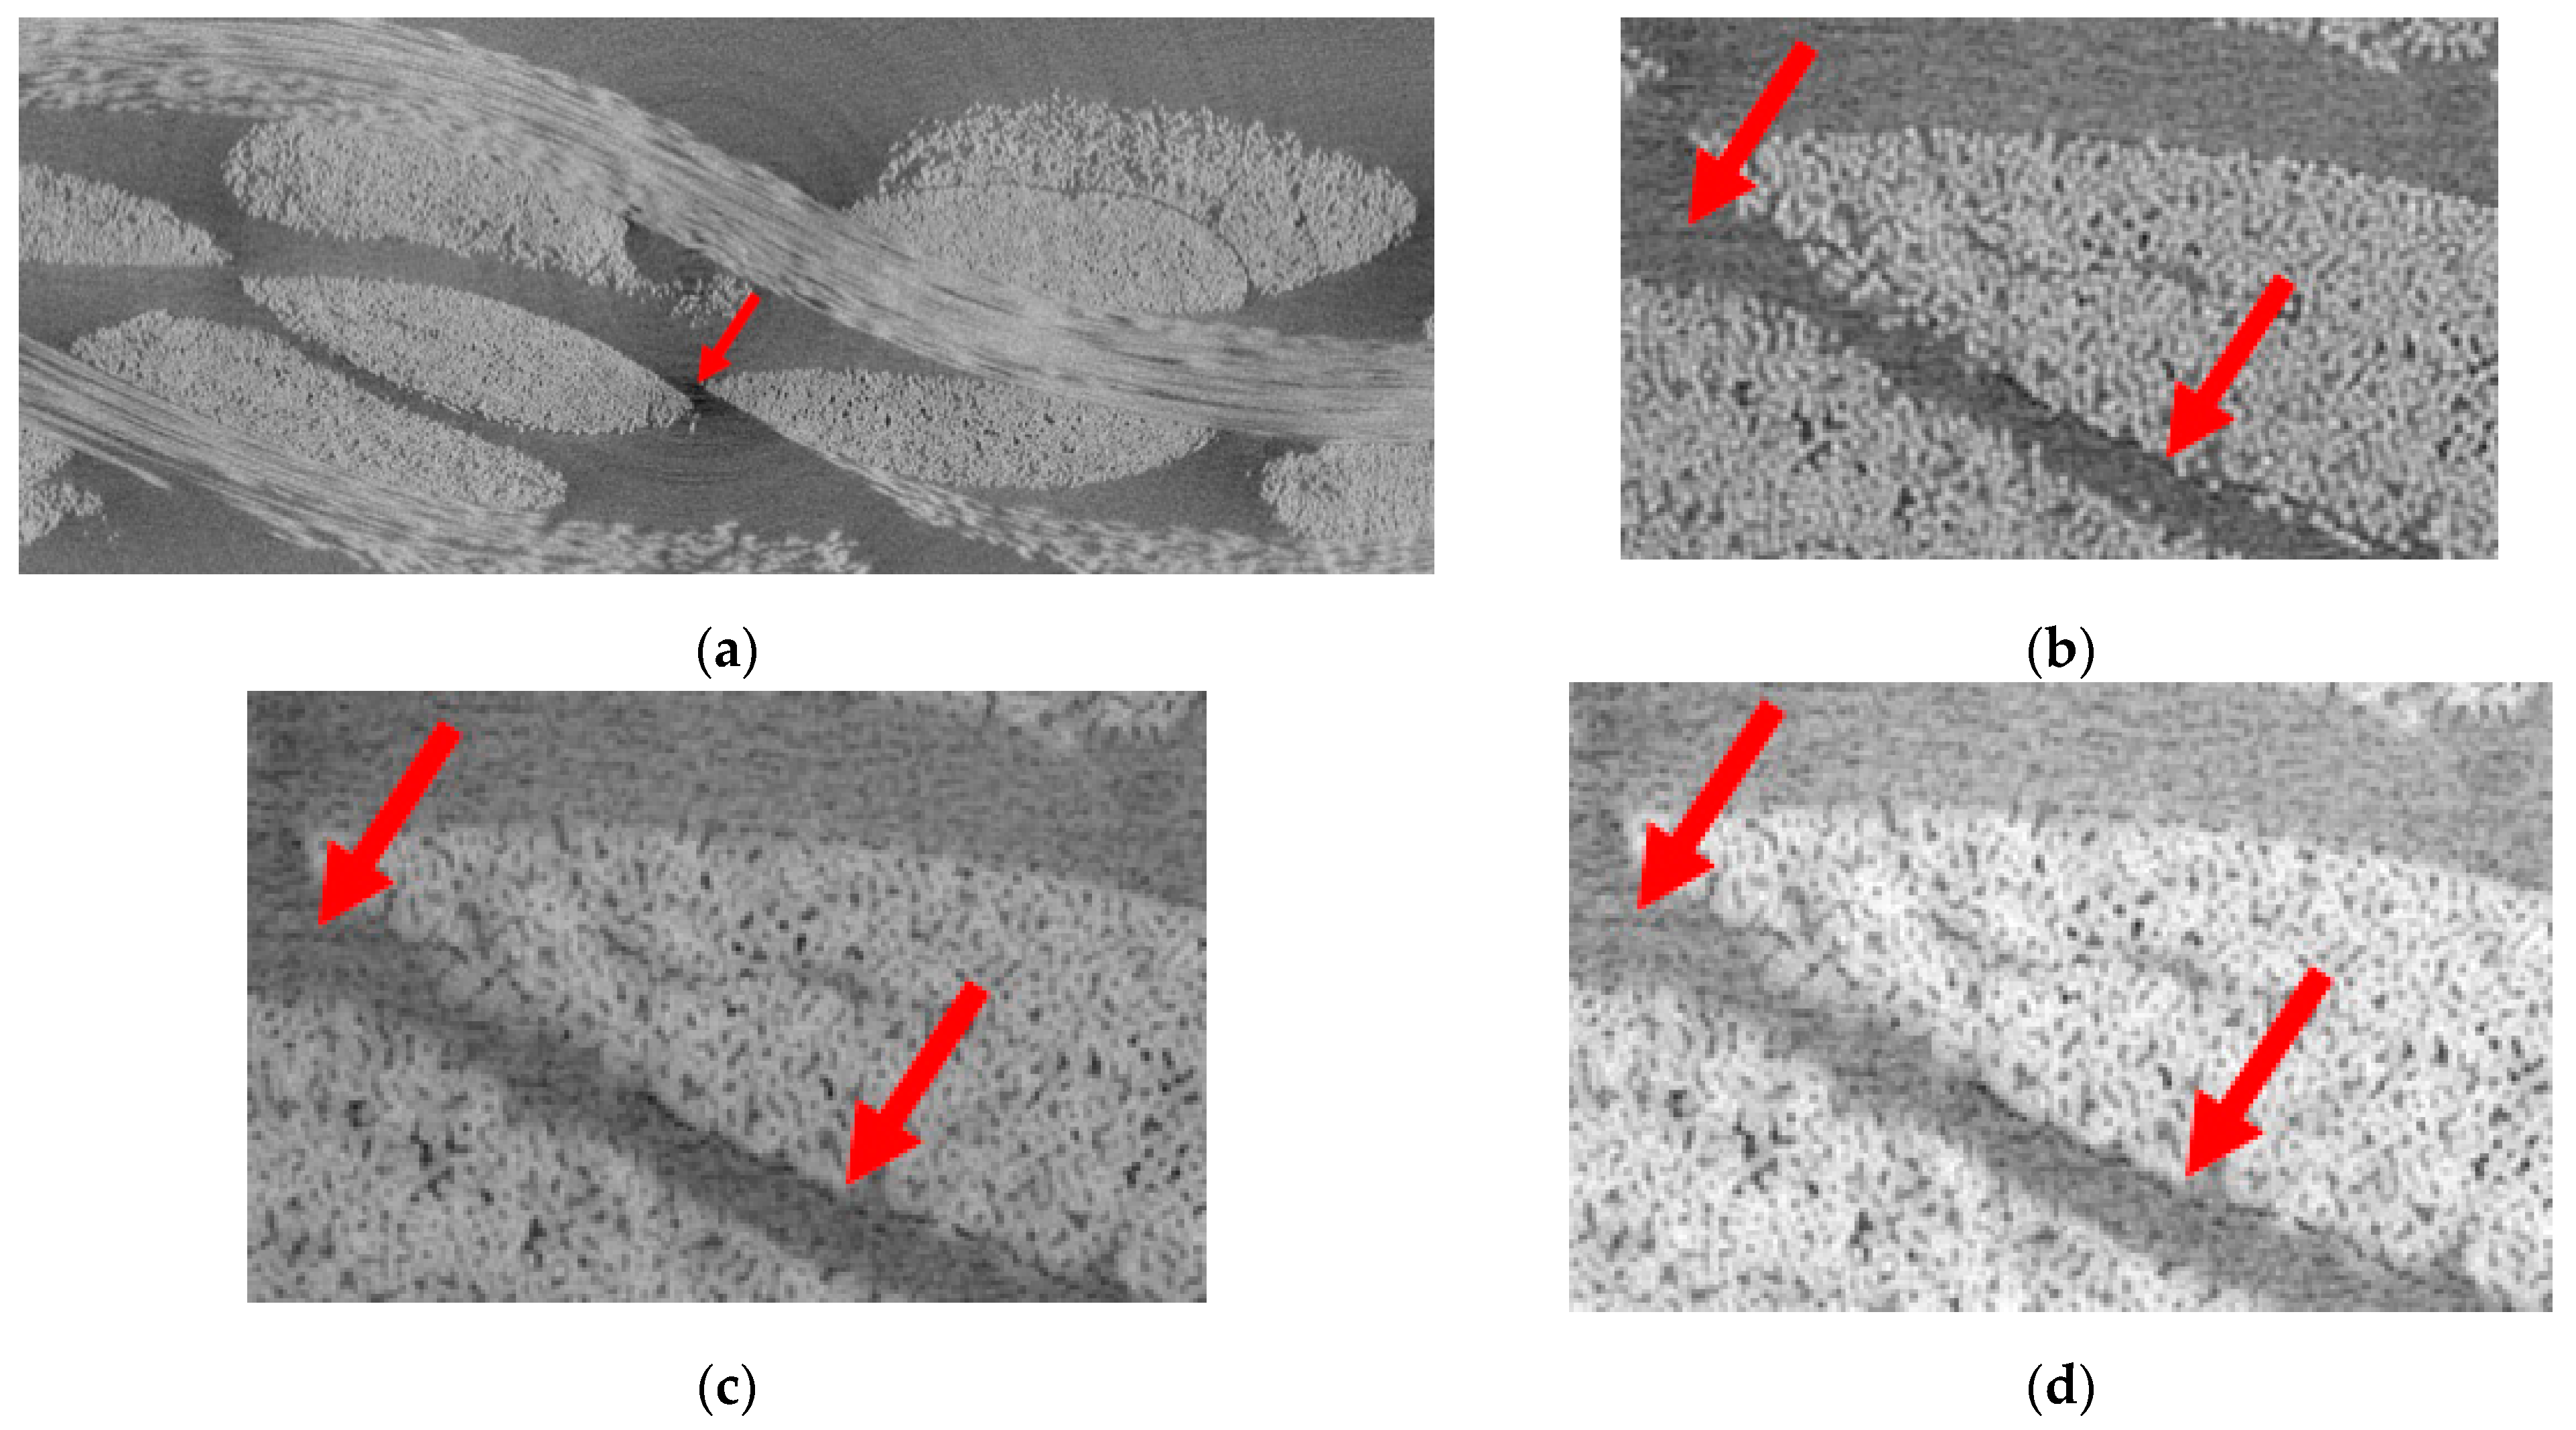
In the images obtained from the µCT measurements, the matrix was in a dark color and the grey level was the same for both the cracks and for the voids (see the red arrow in
Figure 3a). This can be explained by the low number of images taken for each acquisition and the significant contrast between the matrix and the fibers. Consequently, in the absence of a contrast liquid, it was difficult to observe the cracks in the early stages of crack propagation. The solution adopted in this study was to work on the digital images using FiJi software to enhance the contrast in the images and to make the cracks more visible. Therefore, two operations were carried out (
Figure 3b–d). Firstly, it was possible to limit the noise caused by the brightest pixels that were associated with the glass fibers by using the “Remove outliers” function. Secondly, the contrast was adjusted to better detect the cracks (see the red arrows in
Figure 3d).
The local void area fraction inside the yarns was measured from the images acquired by Scanning Electron Microscopy (SEM) using JOEL (NEO-SPACE). The power was set to 10 Kv, and images were acquired with a resolution of 0.96 microns per pixel.
3. Results
The behavior of the crack evolution for two sets of composite specimens is presented. The average fiber volume fraction of composite specimens was 38% and the mean value of total void volume fraction was 3.25%, which was equivalent to that in the work of Gigiliotti et al. [
25]. The void volume fractions were obtained by burn-off tests for nine specimens per composite plate and confirmed with an optical measurement in the tomography files.
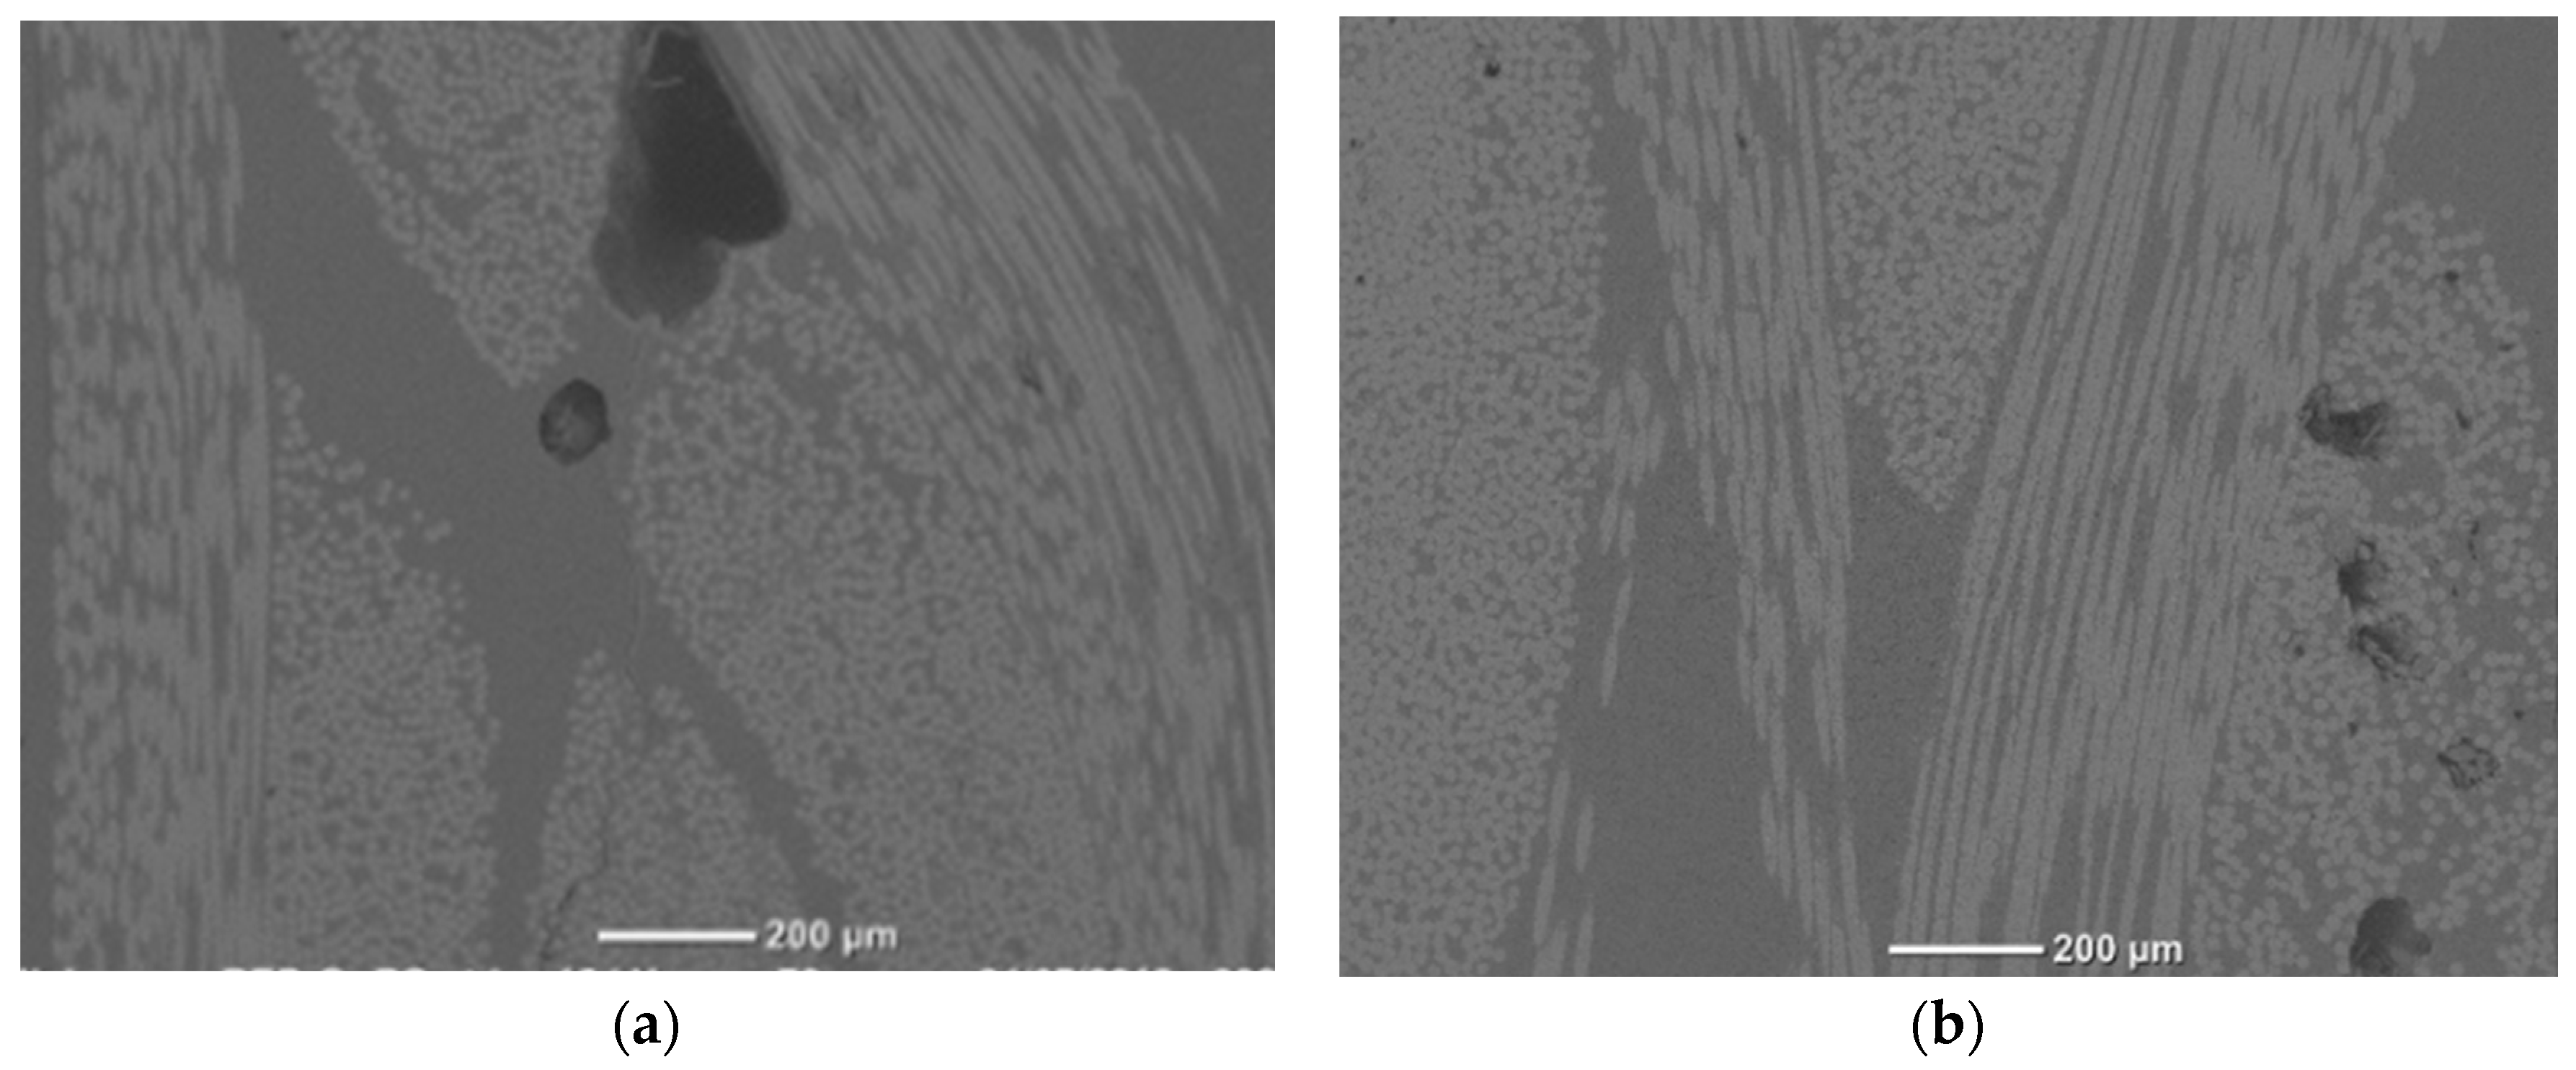
From the SEM image analysis, it was found that for Case A, where the injection pressure was low, most of voids were located in the matrix zone between the yarns (i.e., interyarn voids) even if there were some voids inside the fiber yarns (
Figure 4a). Conversely, for Case B, where the high injection pressure was adopted, many voids were located inside the fiber yarns (i.e., intrayarn voids), as shown in
Figure 4b. This trend was observed for most of specimens of each case even if it was difficult to precisely measure the intrayarn void volume fraction and the interyarn void volume fraction separately. It should also be mentioned that the interyarn voids were generally spherical whereas the intrayarn voids were mostly cylindrical.
3.1. Case A: Interyarn Voids
In this work, the time-lapse approach was used by alternating blocks of fatigue and µCT measurements. The fatigue blocks were conducted at the same load, whose corresponding fatigue life was around 5 × 10⁵ cycles. The duration of each block was 105 cycles or 20% of the fatigue life, which was adopted to observe the initiation and propagation of cracks.
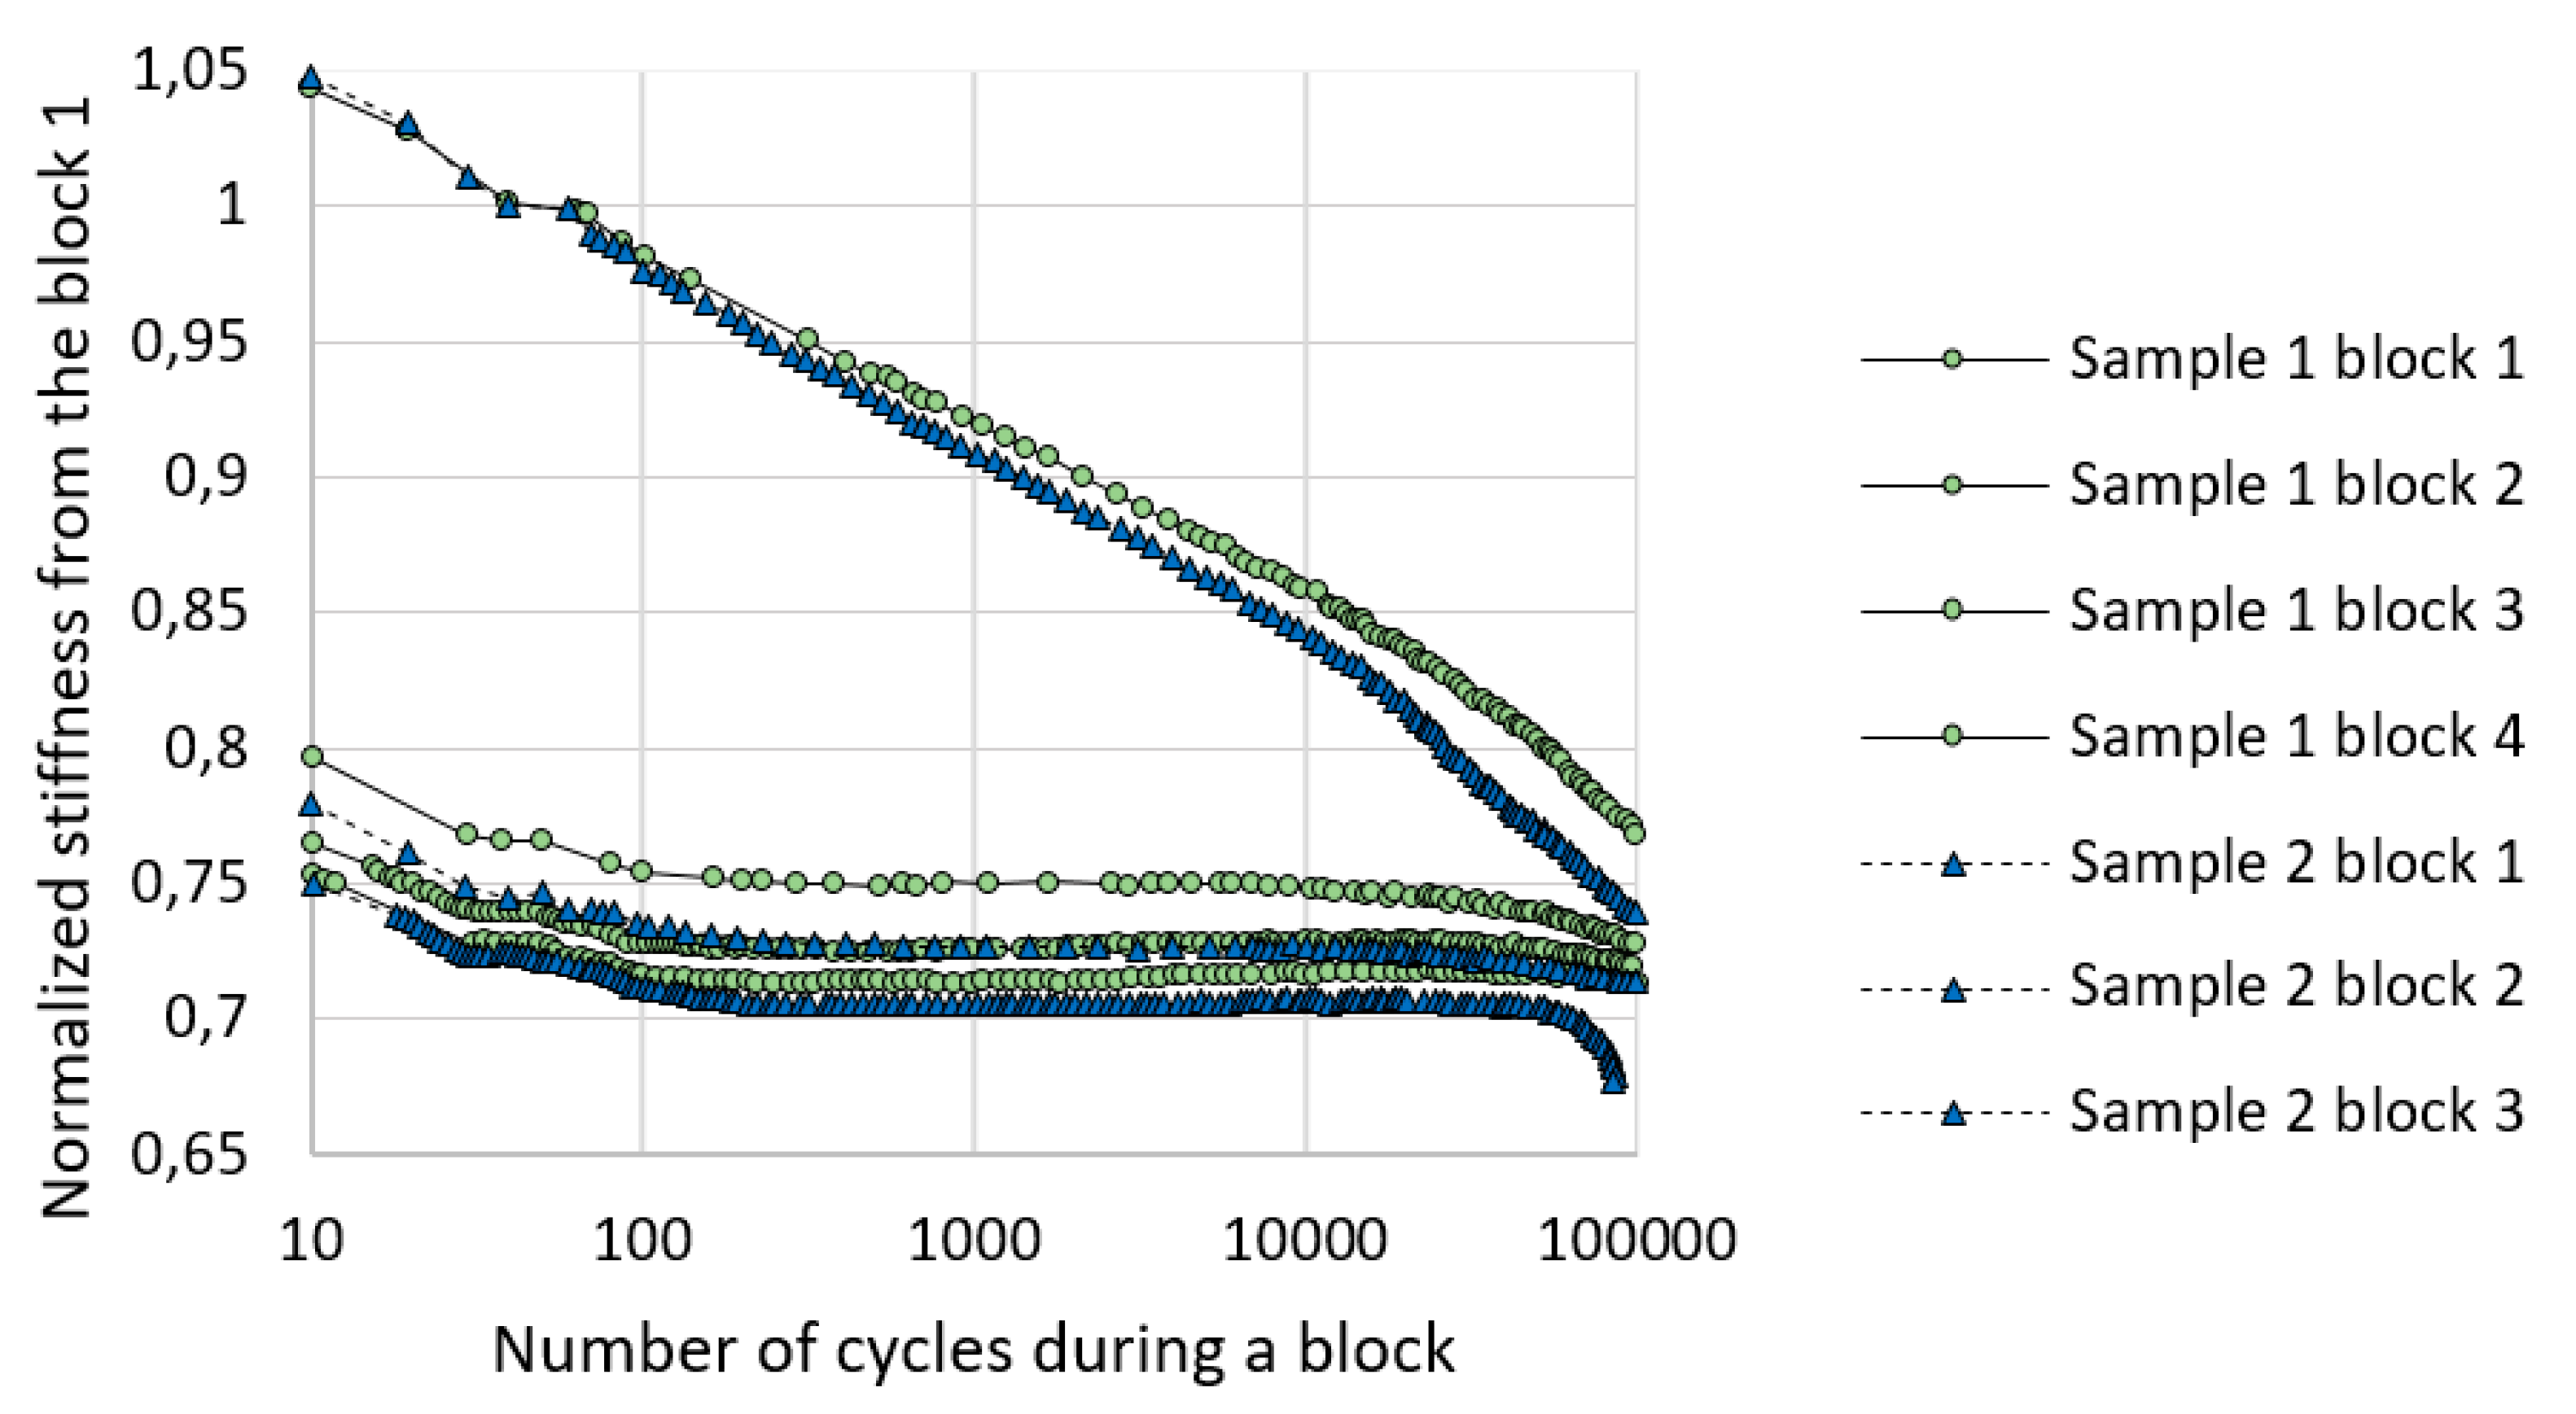
Figure 5 shows the evolution of the normalized stiffness (normalized with the value of the stiffness at 50 cycles in the first block). We can observe that as the number of blocks undergone by the specimen increased, the curve started at a lower value, indicating that each block accumulated more damage in the specimen. It can also be observed that the behavior changed between the first block and the others as the slope decreased significantly.
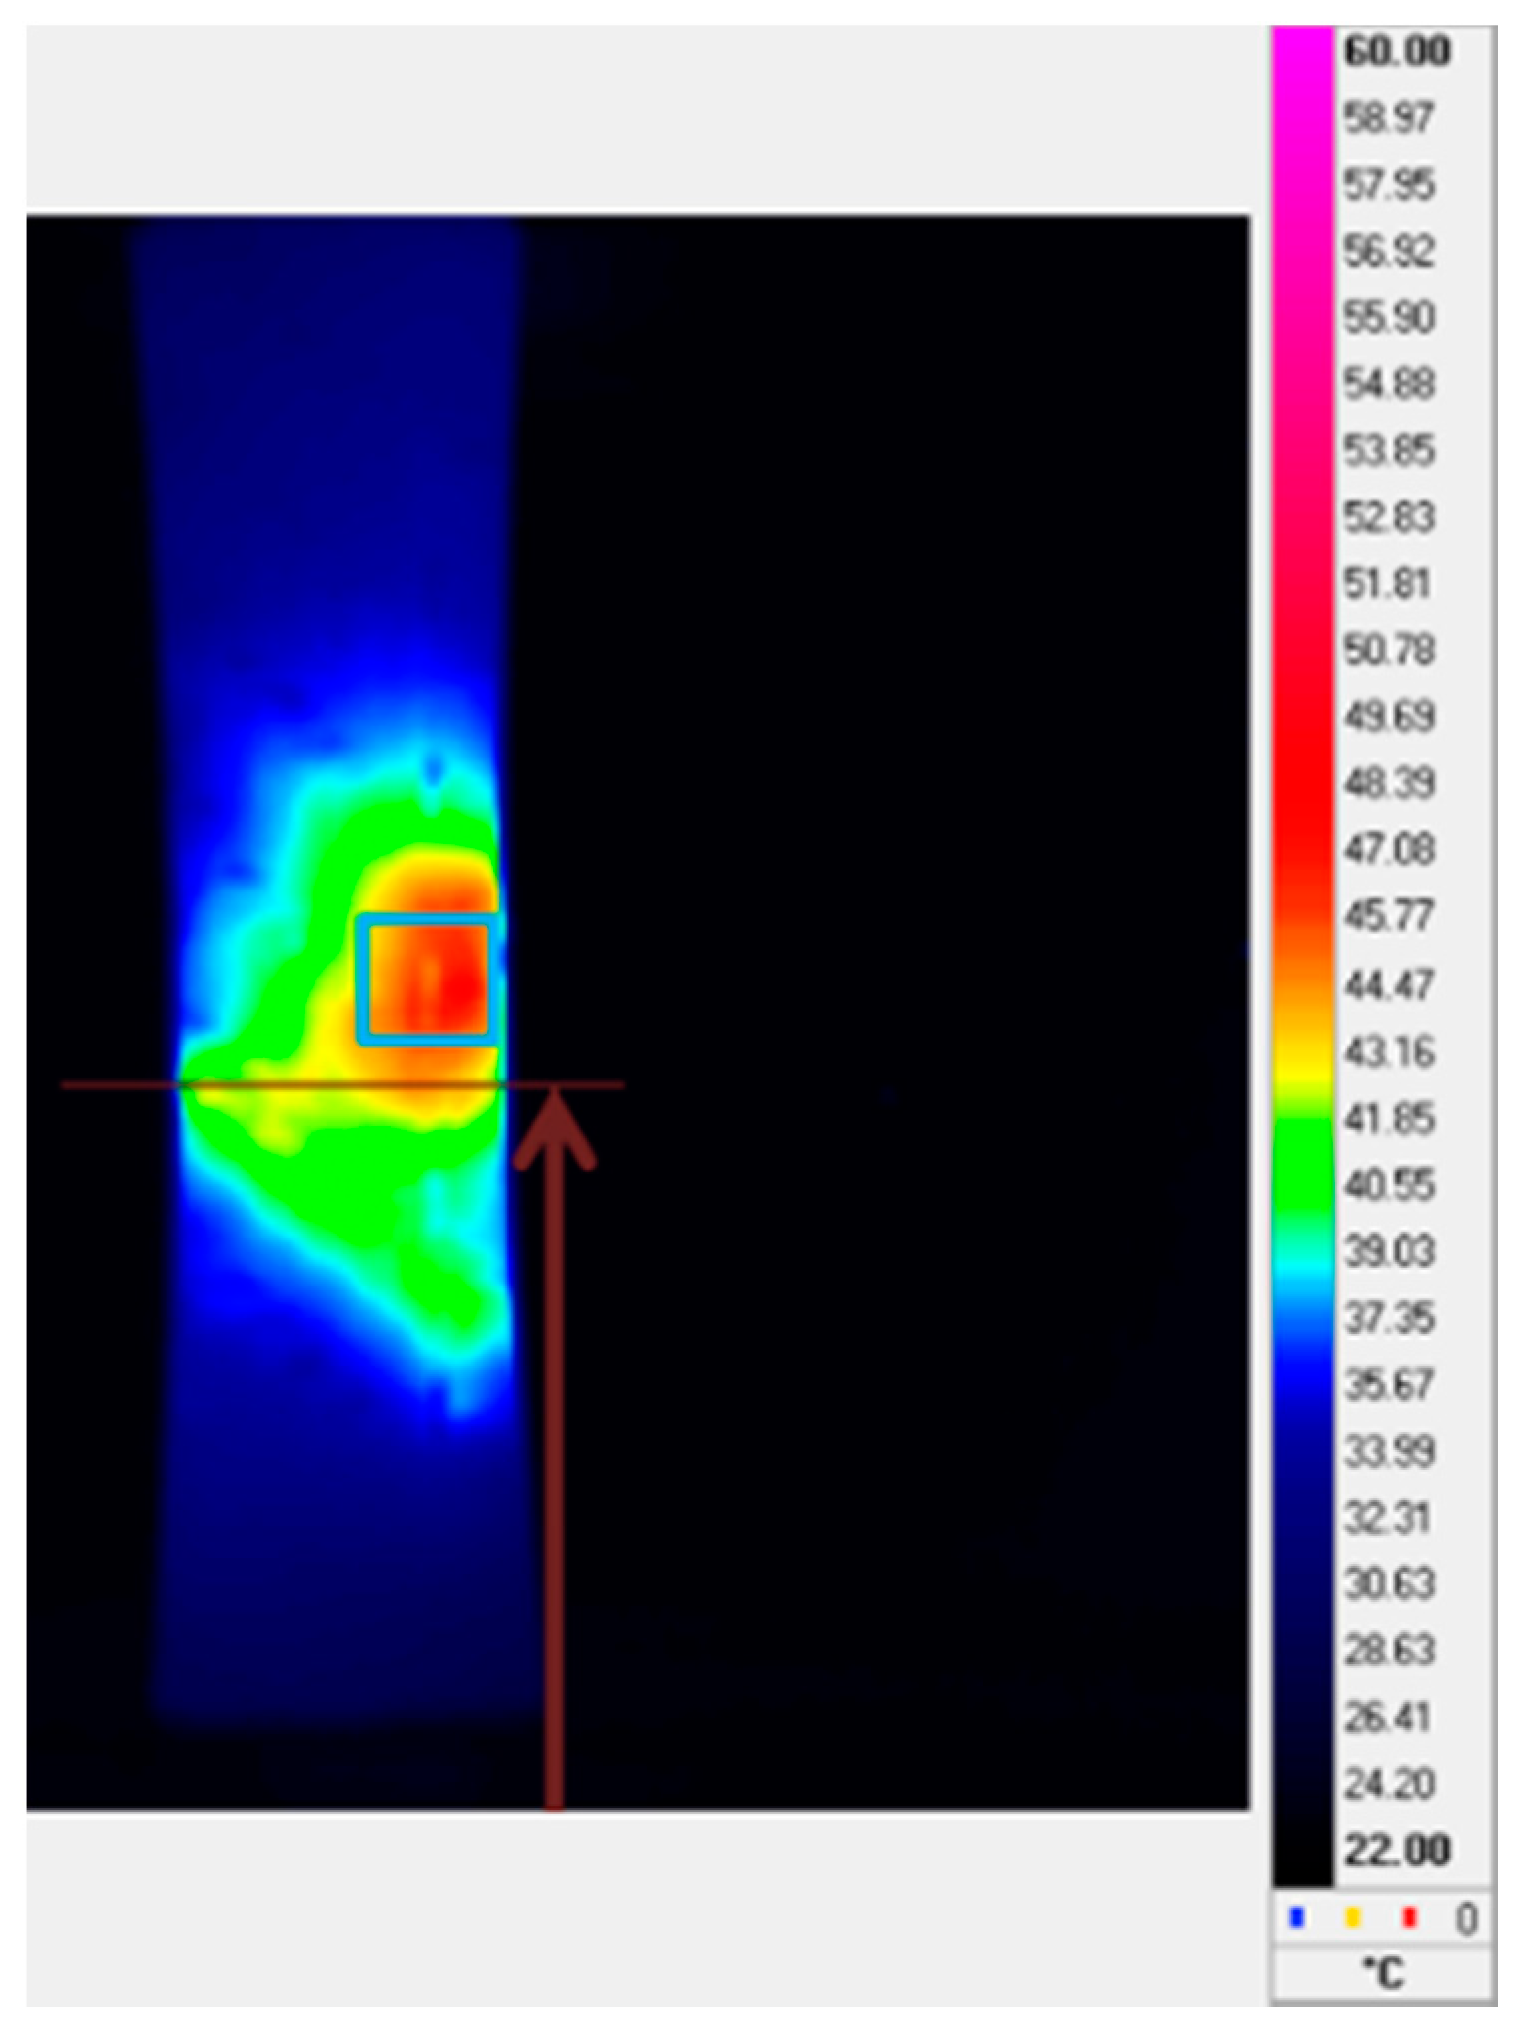
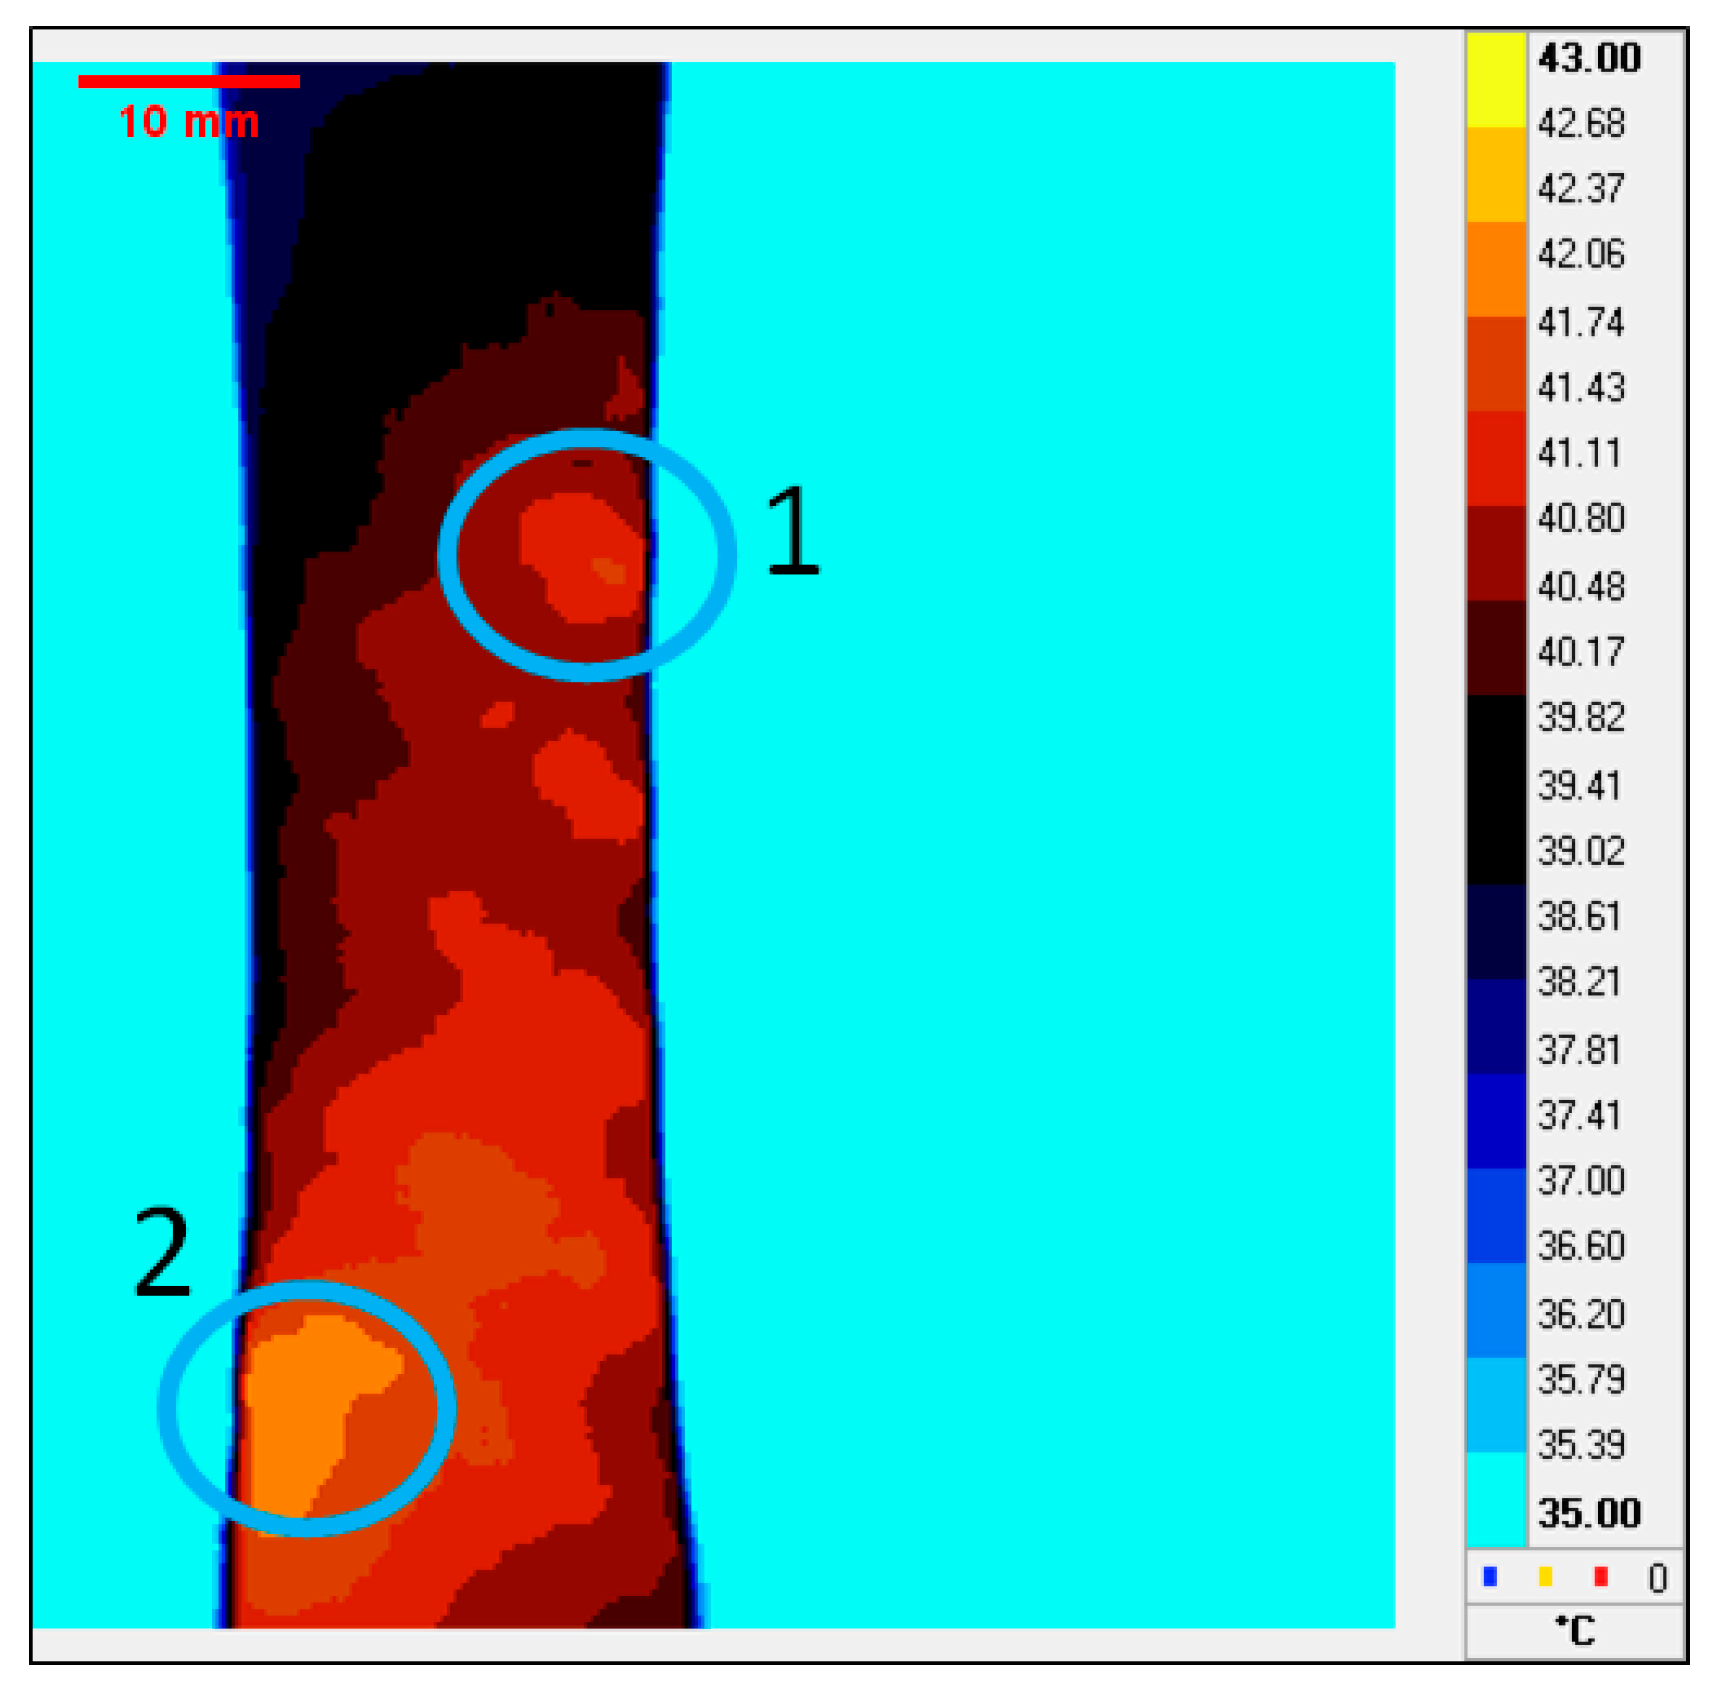
Figure 6 shows the localization of hot spots during the blocks. It appears that there were two hot spots, i.e., the first one in the upper part of the sample and the second one symmetrically placed in the lower part. Their positions were chosen as the regions of interest (ROI) for the µCT measurements.
3.1.1. µCT Measurements
After the First Loading Block
During the first block of fatigue, the specimen exhibited a hot spot located around 10 mm below its center. The volume investigated during the µCT measurement was centered on this location.
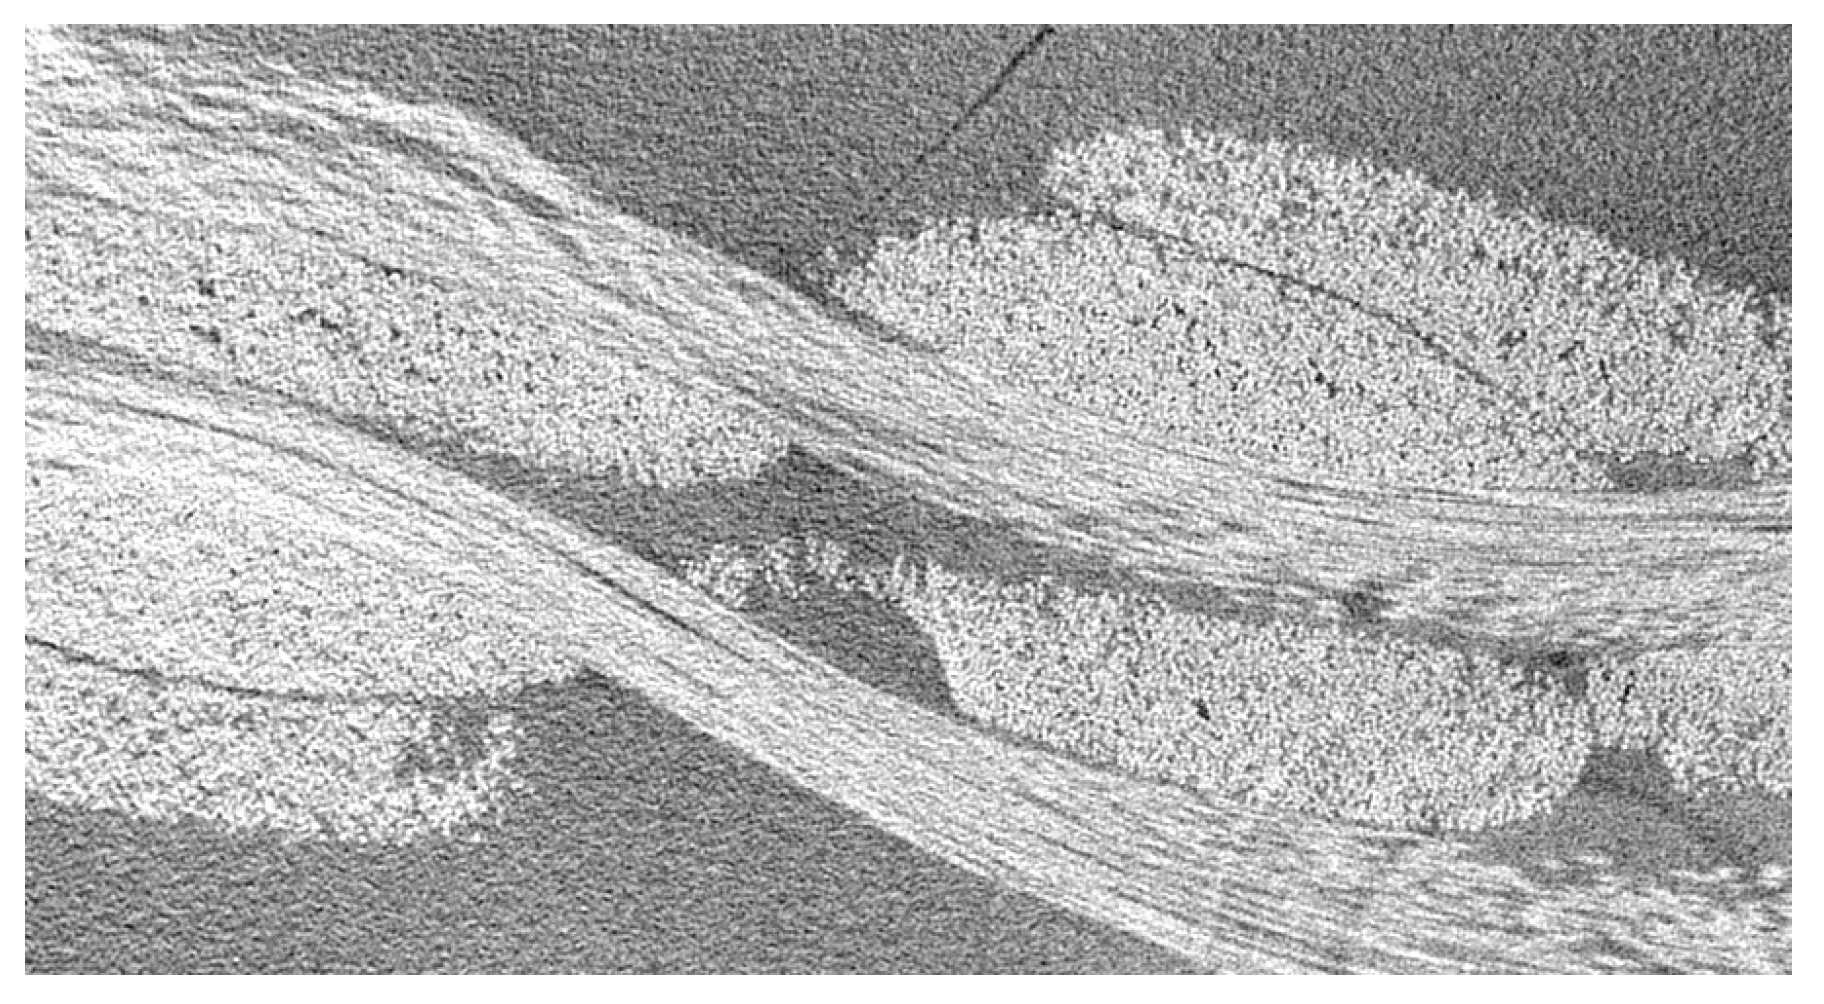
Figure 7 shows two adjacent warp yarns compacted by the weft yarns. It should be noted that the quantity of matrix at the contact surface between these two adjacent warp yarns was very low (even if not completely zero) and the crack was initiated at this zone by inducing the debonding between the warp yarns.
After the Second Loading Block
During the second block of fatigue, the specimen exhibited two temperature hot spots located symmetrically at around 10 mm with respect to the center. The measurement of µCT was performed around each spot. Those two spots were fixed until the end of the fatigue tests.
We can see several locations of crack initiation at the contact surface between the two warp yarns, where the amount of matrix was the lowest (
Figure 8).
After the Third Loading Block
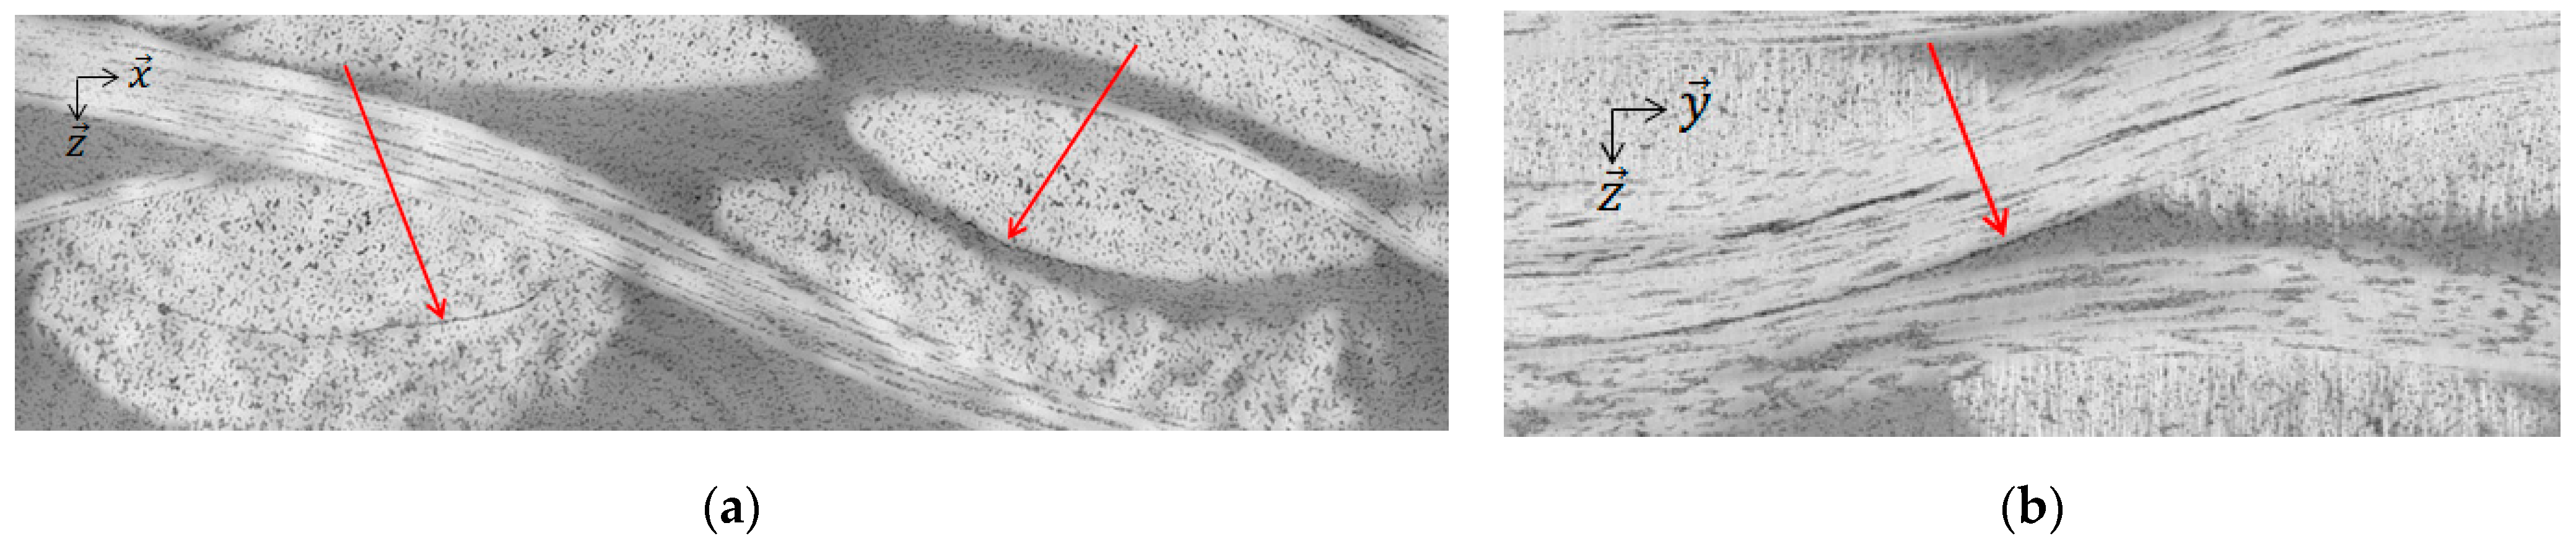
Figure 9a shows that the cracks propagated along the contact surface between the warp yarns at a high angle with respect to the loading direction (i.e., transverse to the loading direction). Then, it appears that the cracks propagated through the matrix to join the weft yarn (
Figure 9b) and went around it. The multiple cracks tended to join one another as they were following the same path of propagation. The propagation path was located at the center of the specimen in the thickness direction.
After the Fourth Loading Block
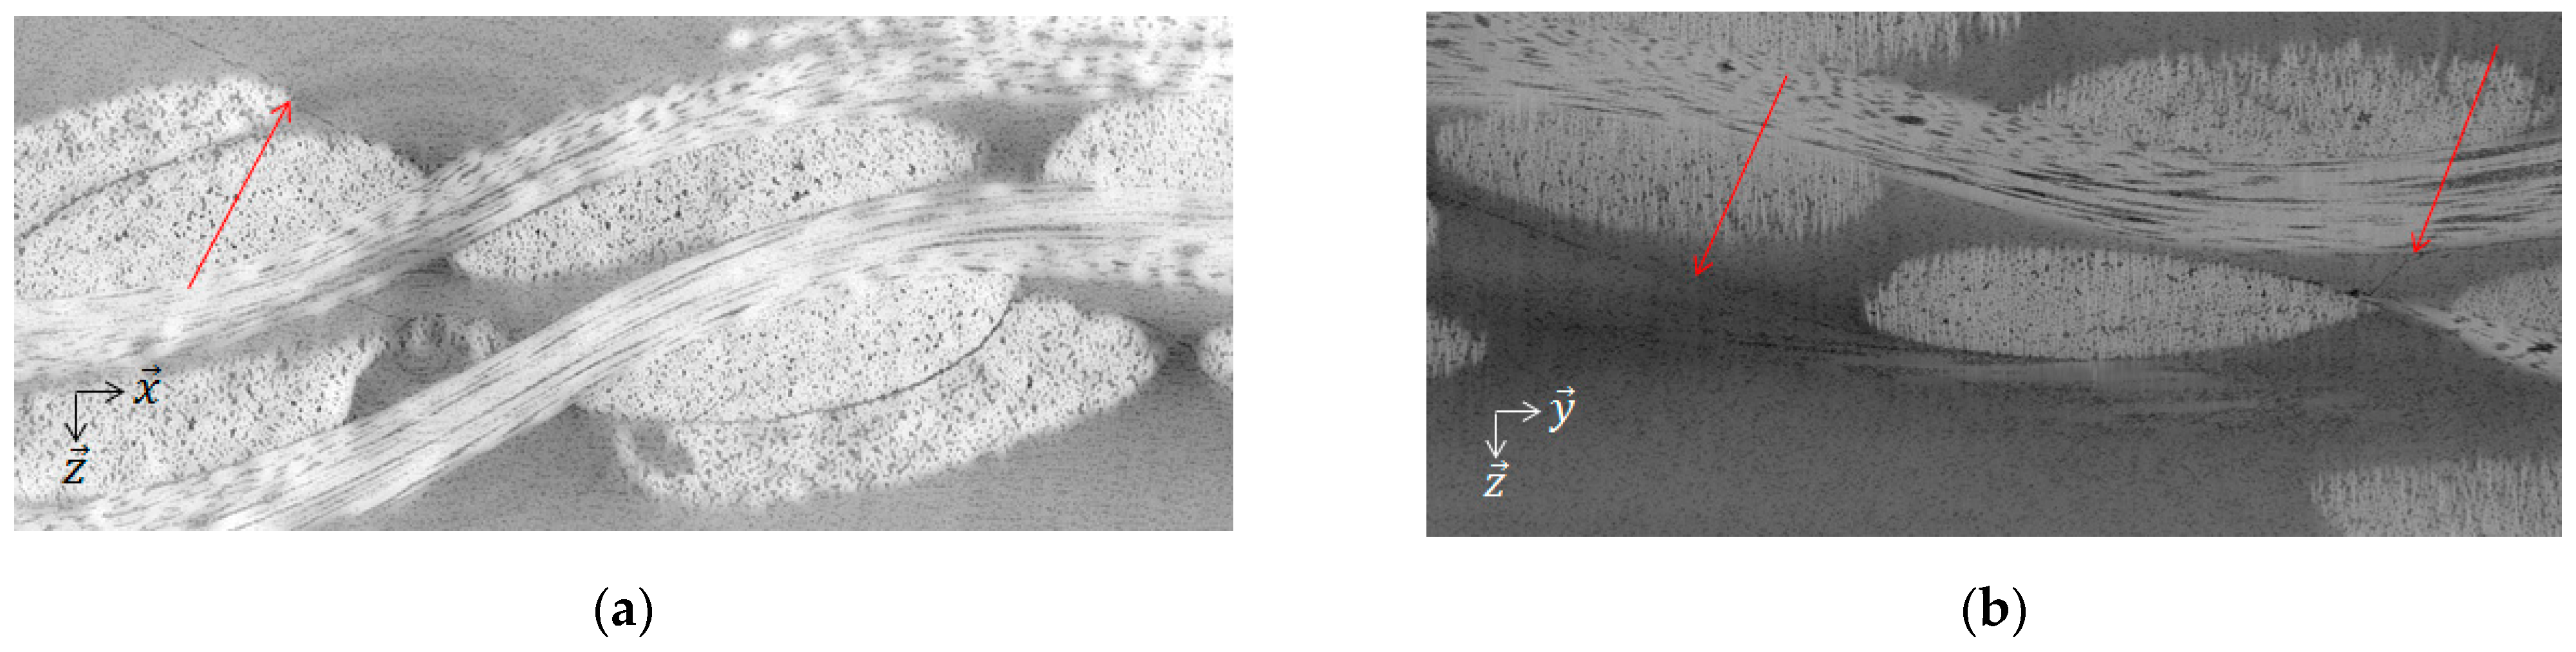
Figure 10 shows that many cracks joined while the propagation path was around the specimen center in the thickness direction. It is also observable that when the crack came closer to the surface, it sometimes branched towards it (
Figure 11). This can be observed on the infrared measurements as the cracks increased the self-heating in this region.
3.1.2. Influence of Voids
Voids were observed in the different regions of interest either in the matrix or inside the yarns. Anyhow, the interyarn voids were dominant whereas the intrayarn void volume fraction was relatively small.
Globally, voids had negligible effect on the initiation and the propagation of the cracks. The only case of a significant influence from the interyarn voids on the cracks was observed when a void in the matrix was very close to the path of crack propagation, which took a small detour to reach it. No influence of the intrayarn voids on the crack propagation nor initiation was observed. This negligible influence from the intrayarn voids can be associated with the low intrayarn void volume fraction.
3.2. Case B: Intrayarn Voids
µCT observation was not performed on those samples because the crack observation was very difficult due to the high glass-fiber volume fraction, which resulted in the high difference of contrast between the fibers and the matrix.
On the other hand, it was possible to perform scanning electron microscope (SEM) observations after the end of constant amplitude tests. The area observed was located approximately 1 cm away from the zone of the specimen rupture (
Figure 12). It should be kept in mind that it would be inappropriate to be closer than 1 cm because the zone at the very vicinity of a rupture is usually significantly damaged, mainly by a catastrophic crack propagation, which is not representative of the damage mechanism occurring during the fatigue tests.
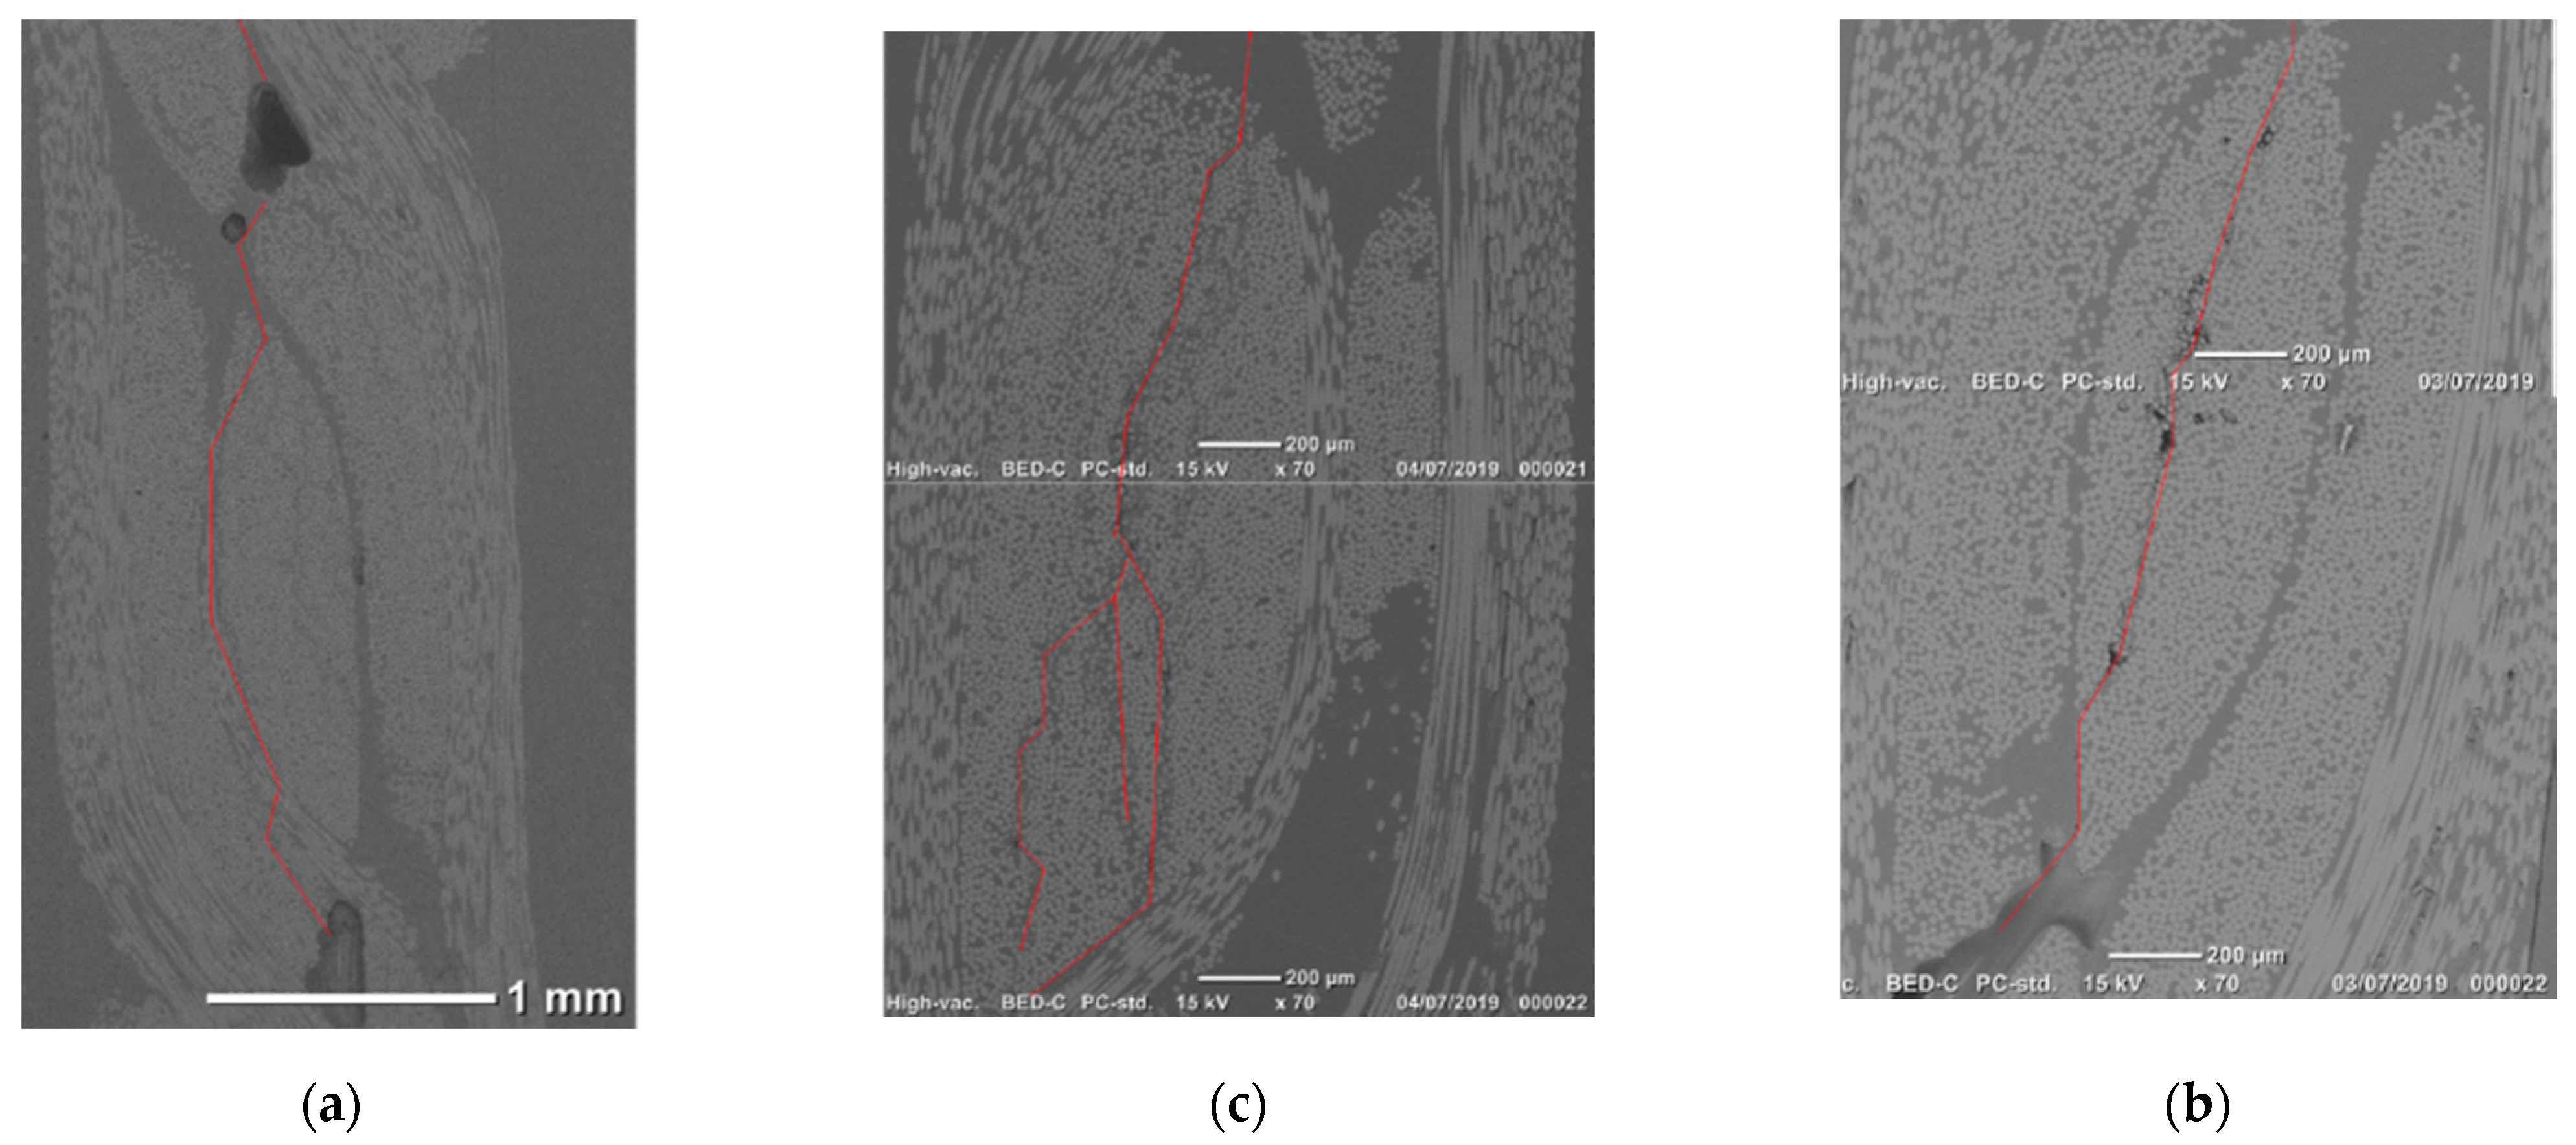
Figure 13 shows SEM views in the
plane for samples with different fatigue cycles (from 0.3 × 10
5 cycles to 8.9 × 10
5 cycles). In every case, the cracks show a similar behavior as that of Case A specimen. In addition, a new feature can be observed for the Case B specimen. When the crack was located at the contact surface of two warp yarns, its propagation went through one of the yarns.
SEM observation is limited to being from a two-dimensional perspective, while µCT observation can be three-dimensional. Nevertheless, we can draw two hypotheses.
4. Discussion
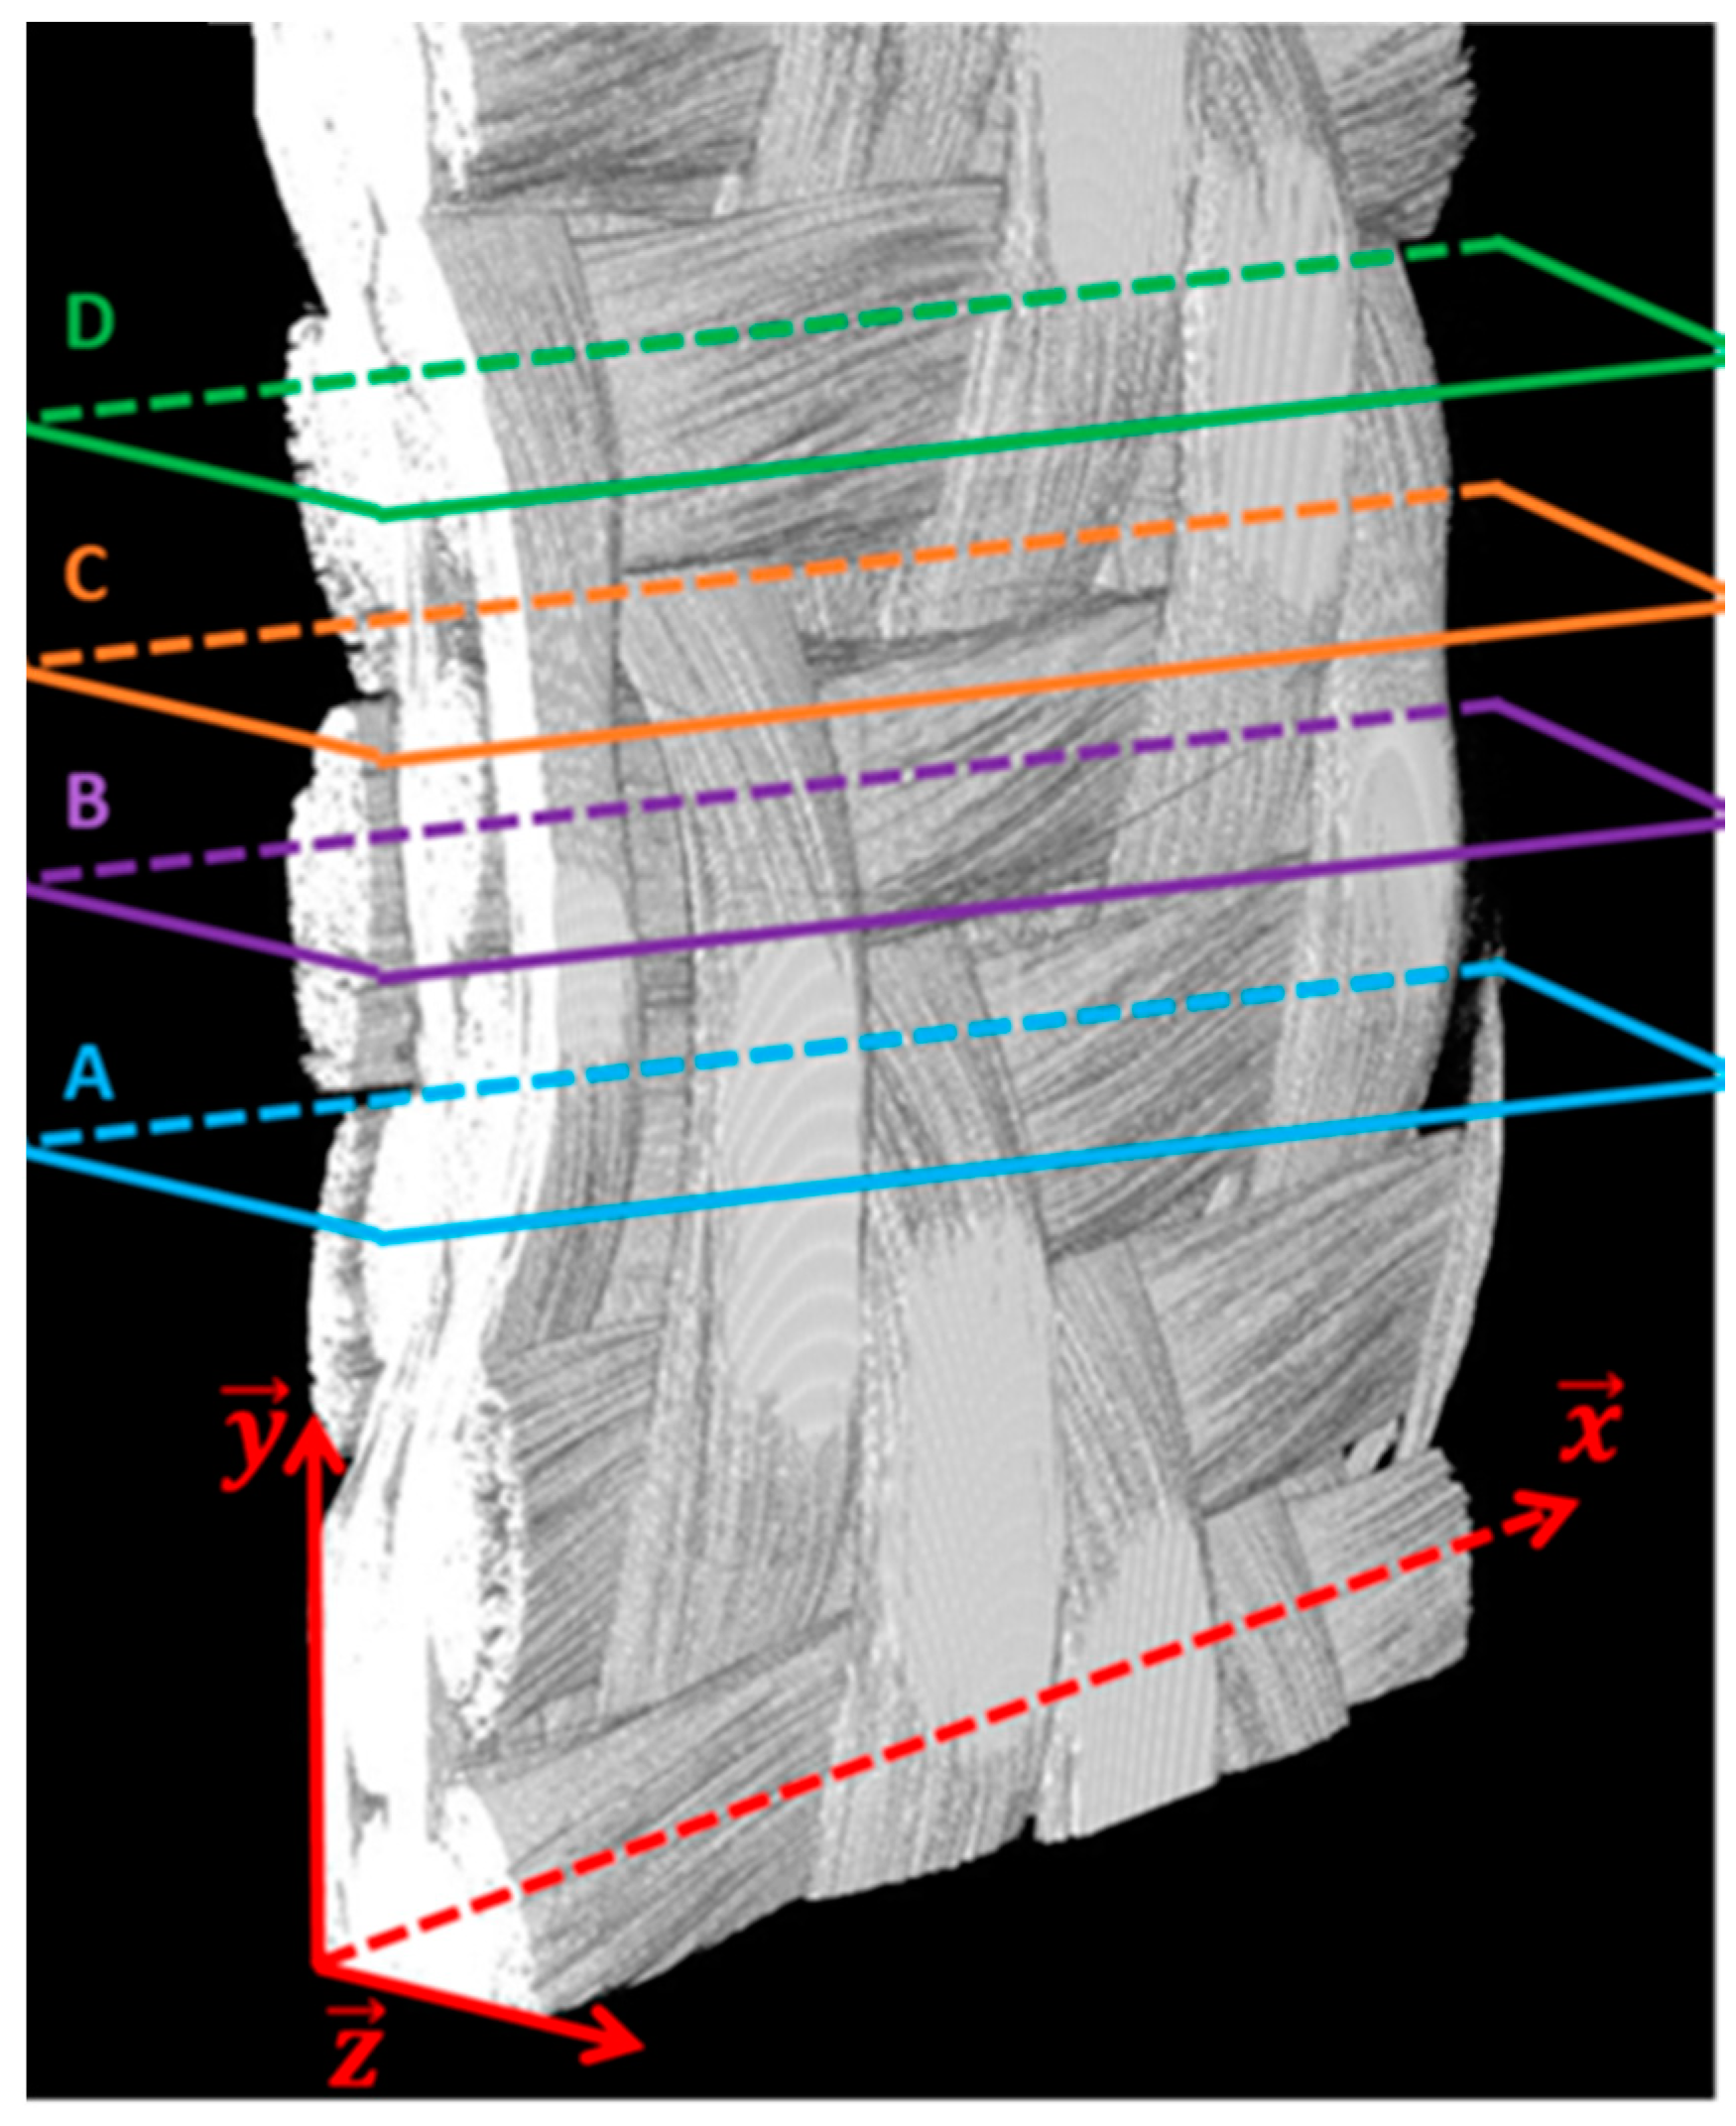
From the µCT images, different cross-sections (
Figure 14) were extracted after each block (as defined in
Section 2.2) to obtain 2D images (
Figure 15). In
Figure 15, the yarns are denoted according to their orientation in the fabric, i.e., “Y + number” for warp yarns and “Y + letter” for weft yarns.
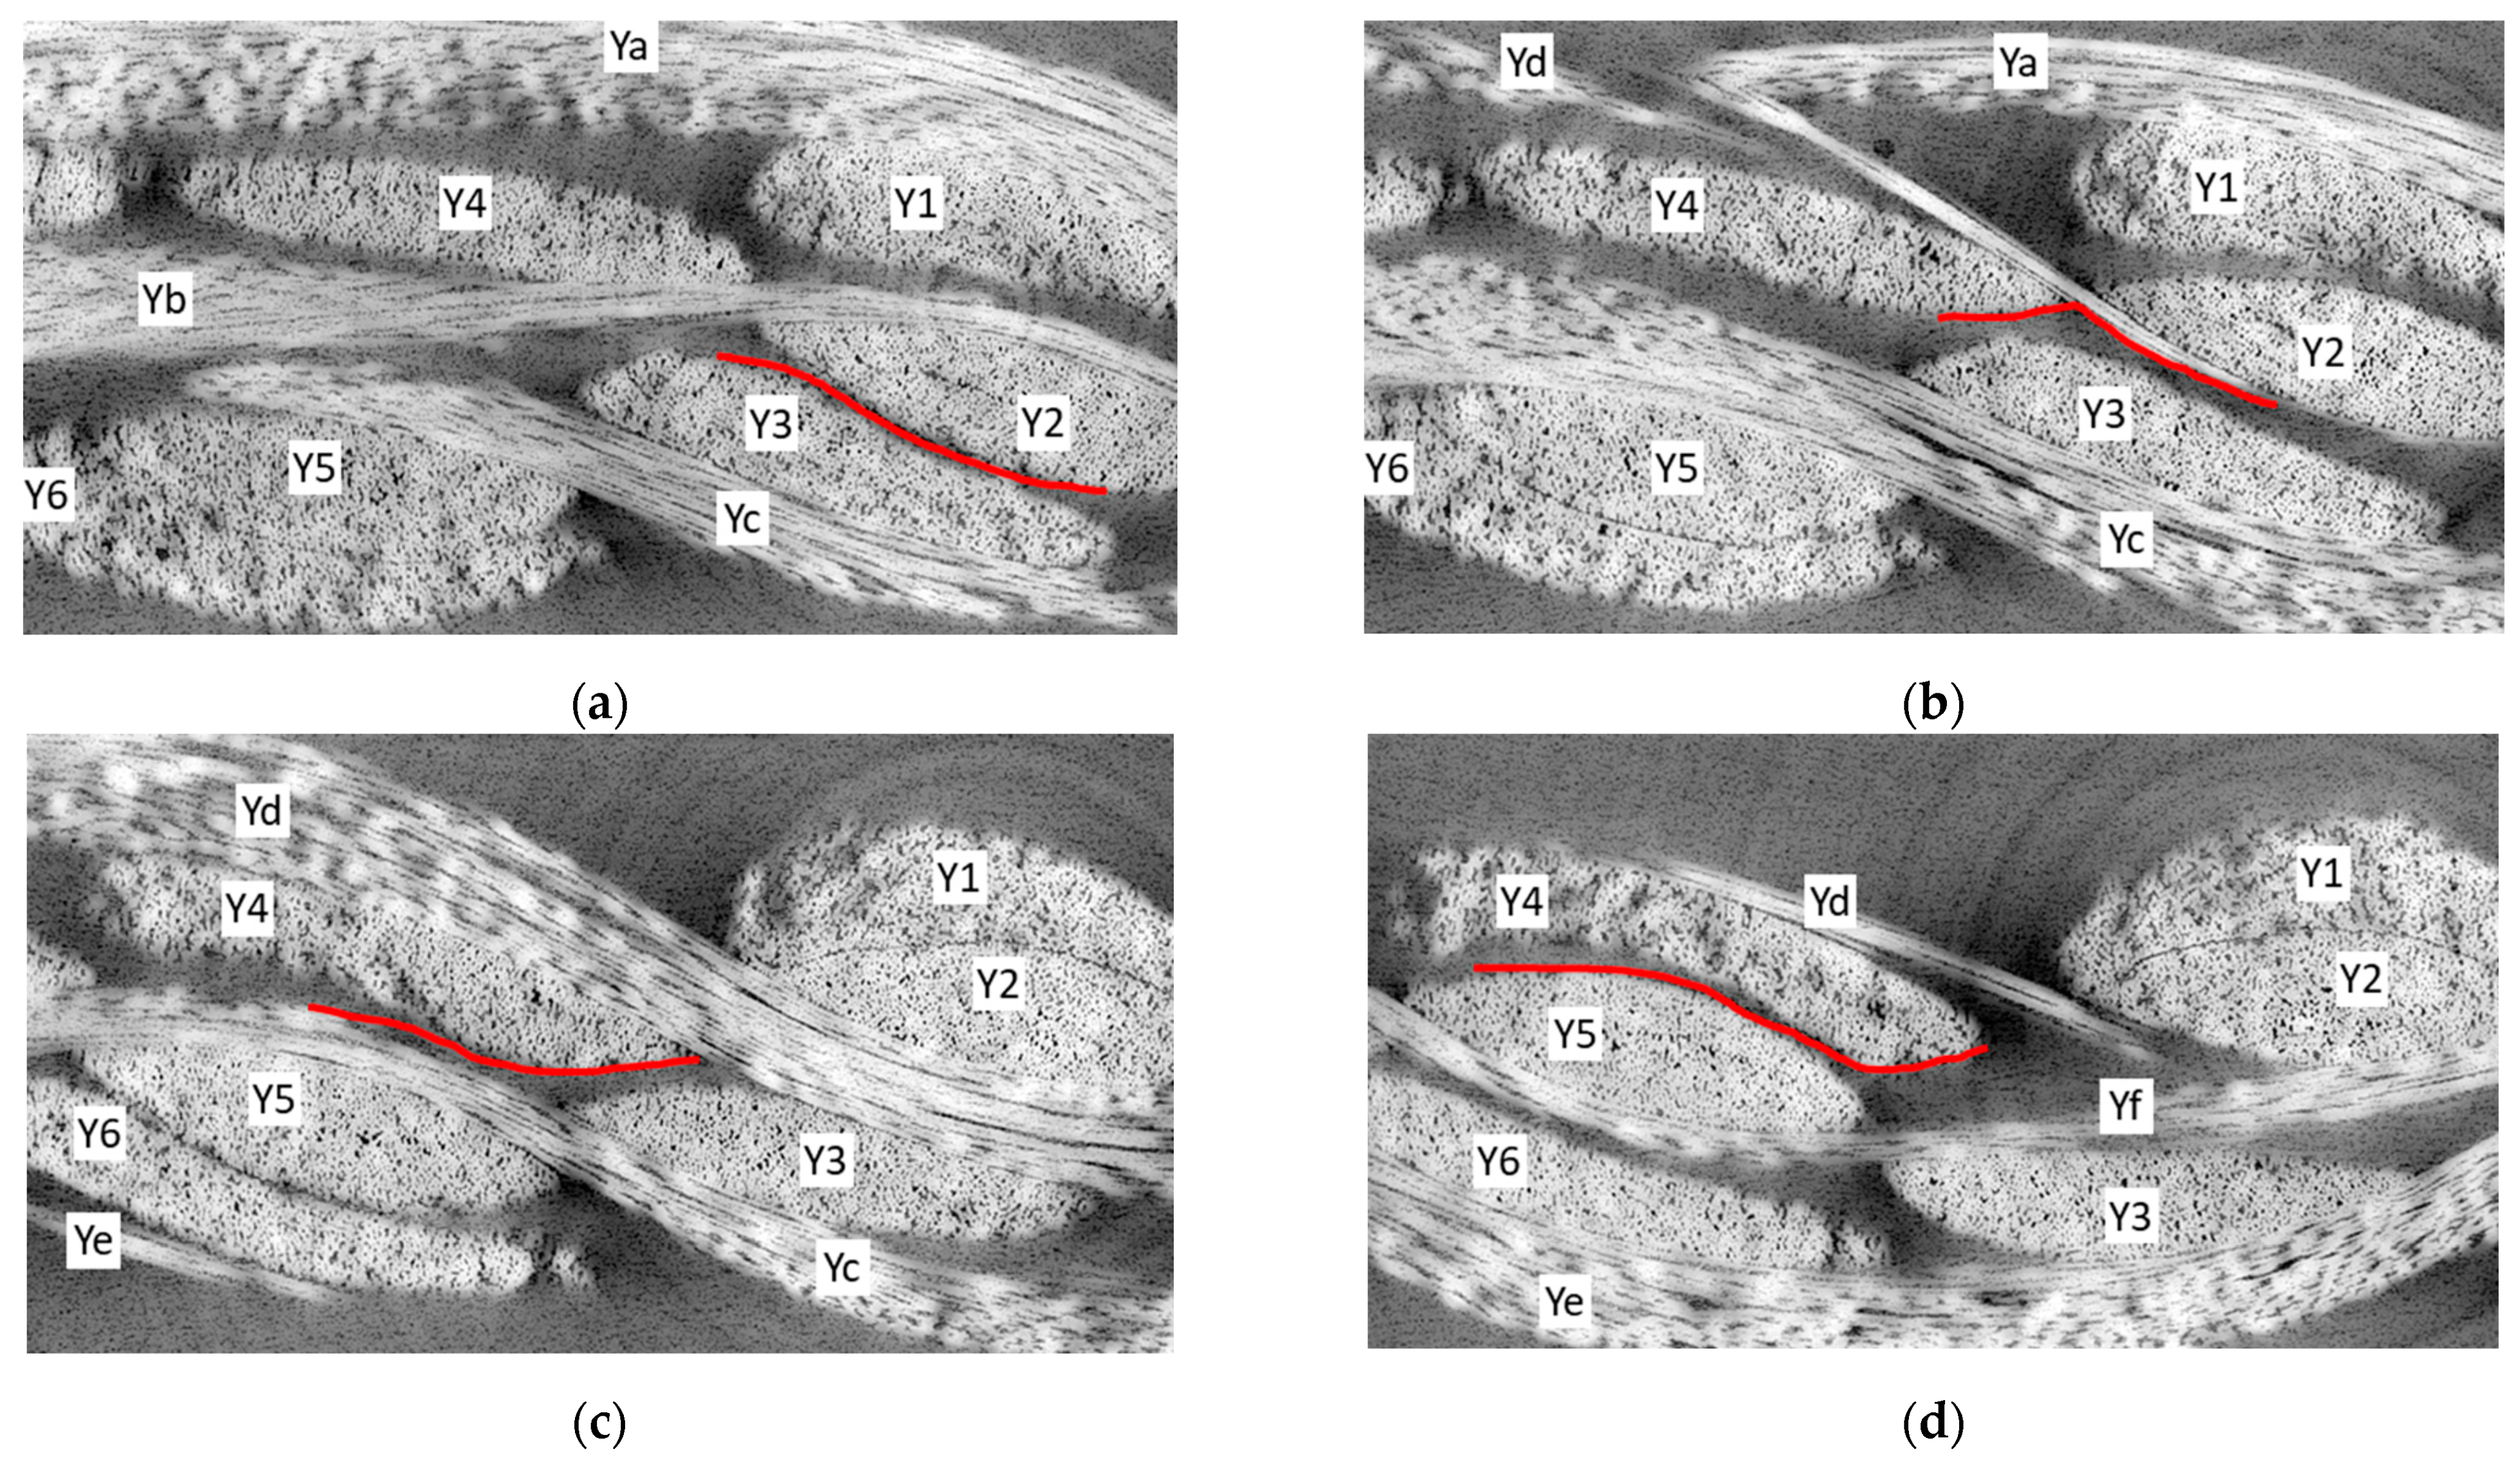
Below are the steps in the propagation of a crack in a 3D interlock glass epoxy composites as observed in this study:
Step A (
Figure 15a): A crack is initiated at the contact surface of the yarns Y2 and Y3, where the volume of the matrix is very small or almost zero. Because of the high shear stress in the matrix located at the contact surface between the adjacent yarns, debonding occurs, leading to the creation of a crack. The crack then propagates along the warp yarn Y2 that exhibits a higher angle with respect to the loading direction or in the transverse direction to the loading.
Step B (
Figure 15b): While approaching the weft yarn Yd, the crack starts to propagate into the matrix and reaches the surface of the weft yarn, which is closer to the center of the specimen (i.e., Yd in this case). Subsequently, it propagates around Yd, then in the matrix, and reaches another warp yarn (Y4) symmetrically, as aforementioned.
Step C (
Figure 15c): The crack propagates alongside the yarns Y4 and Yc.
Step D (
Figure 15d): The crack reaches the contact area between the yarns Y4 and Y5. It is also possible that another crack is initiated from this zone as the area in step A and the two cracks tend to coalesce.
It can be observed that if the path of crack propagation is close to the specimen surface, the crack can propagate toward the surface. This happens, however, only if the crack has seen at least one cycle of propagation on the steps, as mentioned previously.
The influence of interyarn voids was limited, whereas a slight change in the direction of the crack propagation could sometimes be observed (
Figure 16). In general, however, their presence did not have any effect on the propagation of cracks. Gigliotti et al. [
25] made the same observations during thermal fatigue tests on 3D interlock composite samples with voids whose volume fraction was equal to that of the specimens investigated in this paper.
It should be reiterated that the cracks hardly propagated through a yarn if the intrayarn void volume fraction was relatively low. Conversely, cracks could have propagated through the yarns if the intrayarn void volume fraction became significant.
5. Conclusions
We investigated the mechanism of crack evolution in the 3D glass-fiber interlock composites. It was found that a crack is initiated when debonding occurs as a result of the shear stress between two neighboring warp yarns, and propagates at the interface of these two yarns when the tensile load is applied in the warp direction. Then, it propagates along one of the two adjacent warp yarns, which exhibit higher stress concentrations (because of the local orientation or the presence of a weft yarn). Subsequently, it propagates through the matrix to join the surface of the weft yarn. Eventually, the crack either joins another crack or goes through the matrix again to reach a warp yarn. A crack propagation path that is close to the yarn surface can lead to a branching toward it, but only after the crack has grown to a significant size. Given the void volume fraction (i.e., a total void volume fraction of 3.5%) and the reinforcement architecture (i.e., 3D warp interlock), there is negligible influence from the interyarn voids on the initiation and propagation of cracks. The intrayarn voids can have little influence on the crack initiation and propagation if their volume fraction is relatively small. As the intrayarn voids become significant, however, cracks can propagate through the fiber yarns.
In future work, the influence of the interyarn and intrayarn voids on the fatigue behavior will be quantitatively analyzed. For example, the fatigue behavior can be investigated for different volume fractions of interyarn voids and intrayarn voids. Moreover, the same methodology may be applied for bending fatigue tests.


